1. Introduction
Developing renewable energy resources and electric vehicles (EVs) has been seen as an effective way to reduce carbon emissions and ensure energy security [
1,
2,
3]. However, EVs need to be connected to the electric power grid for charging and there are still many barriers to be considered. Firstly, the indirect emissions of EVs are sensitive to the generation mix of a particular regional power system. If the power generation of the system is dominated by coal-fired power plants, the emission advantage of EVs is not obvious [
4]. Secondly, more investment is required in order to expand the capacities of generation, transmission, and distribution, due to the increasing charging requirements of EVs [
5,
6]. As a kind of renewable and clean energy, PV power can be produced in any part of an urban area. For example, the PV panels can be installed on the rooftops of office buildings, working places, and apartments, etc., which are also considered as suitable places for charging stations, supported by enough parking lots. Thus, the utilization of a PV-assisted charging station is deemed to be a promising way to effectively improve the emission reduction of EVs, to meet the daytime charging demand, and to reduce the dependence on the power grid [
7,
8,
9].
There have been several studies on PVCSs which mainly focus on capacity allocation and charging strategies. With respect to capacity allocation, a multi-objective capacity optimization method for the components of the PV-based battery switch station (BSS) is introduced in [
10]. For an actual design of PV-based BSS, there are many optimal solutions which can be chosen, which can be divided into economy and environment preferred solutions. In order to minimize the investment, maintenance, and electricity cost of BSSs, an optimal model is formulated in [
11], in which the extra waiting time (EWT) of EVs is taken as a constraint for the quality of service. For a PVCS configured with local energy storage, an optimal method for the battery-sizing of the energy storage is proposed in [
12]. The problem is formulated to minimize the cost function, based on the value of kWh price, solar irradiance, and the usage patterns of Plug-in Hybrid Electric Vehicles (PHEVs). Additionally, a model is presented in [
13] to perform the optimal sizing of a non-grid-connected renewable energy system, integrated with battery switch stations. In this model, the objective function is to minimize the total cost, including the investment, operation, and shortage of electricity. The capacity planning frameworks for EV charging stations with multiclass customers are proposed in [
14]. Different models are utilized to ensure grid reliability and lead to significant savings in the capacity planning of large and small networks, respectively.
With respect to charging strategies, an EV charging method for smart homes/buildings with a PV system is proposed in [
15]. This method consists of two steps: (1) a prediction of the PV output and electricity consumption; (2) the EV charging scheduling. In [
16], an optimal charging strategy is proposed in order to verify the economic and environmental impacts of a PVCS. The method determines the total charging power of EVs in the parking garage, in order to optimize the power taken from the grid. The charging strategies of multiple PHEVs in PV-equipped apartment buildings and office buildings are discussed in [
17,
18]. Different charging strategies and charging power ratings are examined, which are assessed in terms of their influence on the grid, the self-consumption of local PV generation, and the driving range. A real-time energy management algorithm for a grid-connected charging park in an industrial or commercial workplace is developed in [
19]. Statistical and forecasting models are used to model the various uncertainties, including the PV power, PHEVs’ arrival, departure time, and the available energy of the batteries. A heuristic operation strategy for the commercial building of a PVCS is proposed in [
20]. The model of an EV feasible charging region, the mechanism of dynamical event triggering, and the algorithm of real-time power allocation for EVs, are all established to improve the self-consumption of PV energy and to reduce the impact on the power grid. In [
21], an intelligent energy management approach for a PVCS with energy storage is proposed. The approach introduces PV energy forecasting and EV charging demand projection, in order to optimize the energy management of the charging station. A centralized EV charging strategy based on bi-level optimization is proposed in [
22], with the objectives of simultaneously deriving benefits for the grid and EV users. The proposed strategy involves distributing the EV charging load more beneficially, across both spatial and temporal levels. A new type of EV charging facility that integrates the SST (solid-state transformer) into the PVCS, is introduced in [
23]. Furthermore, a rule-based decision-making EMS is proposed, so that the SST-based PVCS can dynamically participate in the ancillary service of the smart grid, guaranteeing the quality of the charging service for EV users. Considering the uncertainty of an EV’s charging demand and the PV power output, an online energy management method leveraging both offline optimization and online learning is proposed in [
24], to maximize the self-consumption of PV energy and to decide on the power supplied from the grid.
In summary, the aforementioned research has mainly focused on the optimization of capacity allocation and charging strategies. The numerical simulations in these studies are only conducted during typical days, to verify the validity of their proposed methods. However, as a potential charging facility for EVs, the long-term effectiveness of the PVCS is an important issue to consider in relation to its commercialization process. However, few research has focused on a long-term effectiveness evaluation of PVCSs. The long-term evaluation of a PVCS with simple energy management is presented in [
25], but this research only paid attention to the energy utilization, and this is obviously not broad enough for commercialized PVCSs. Therefore, the main contributions of this paper are as follows:
- (1)
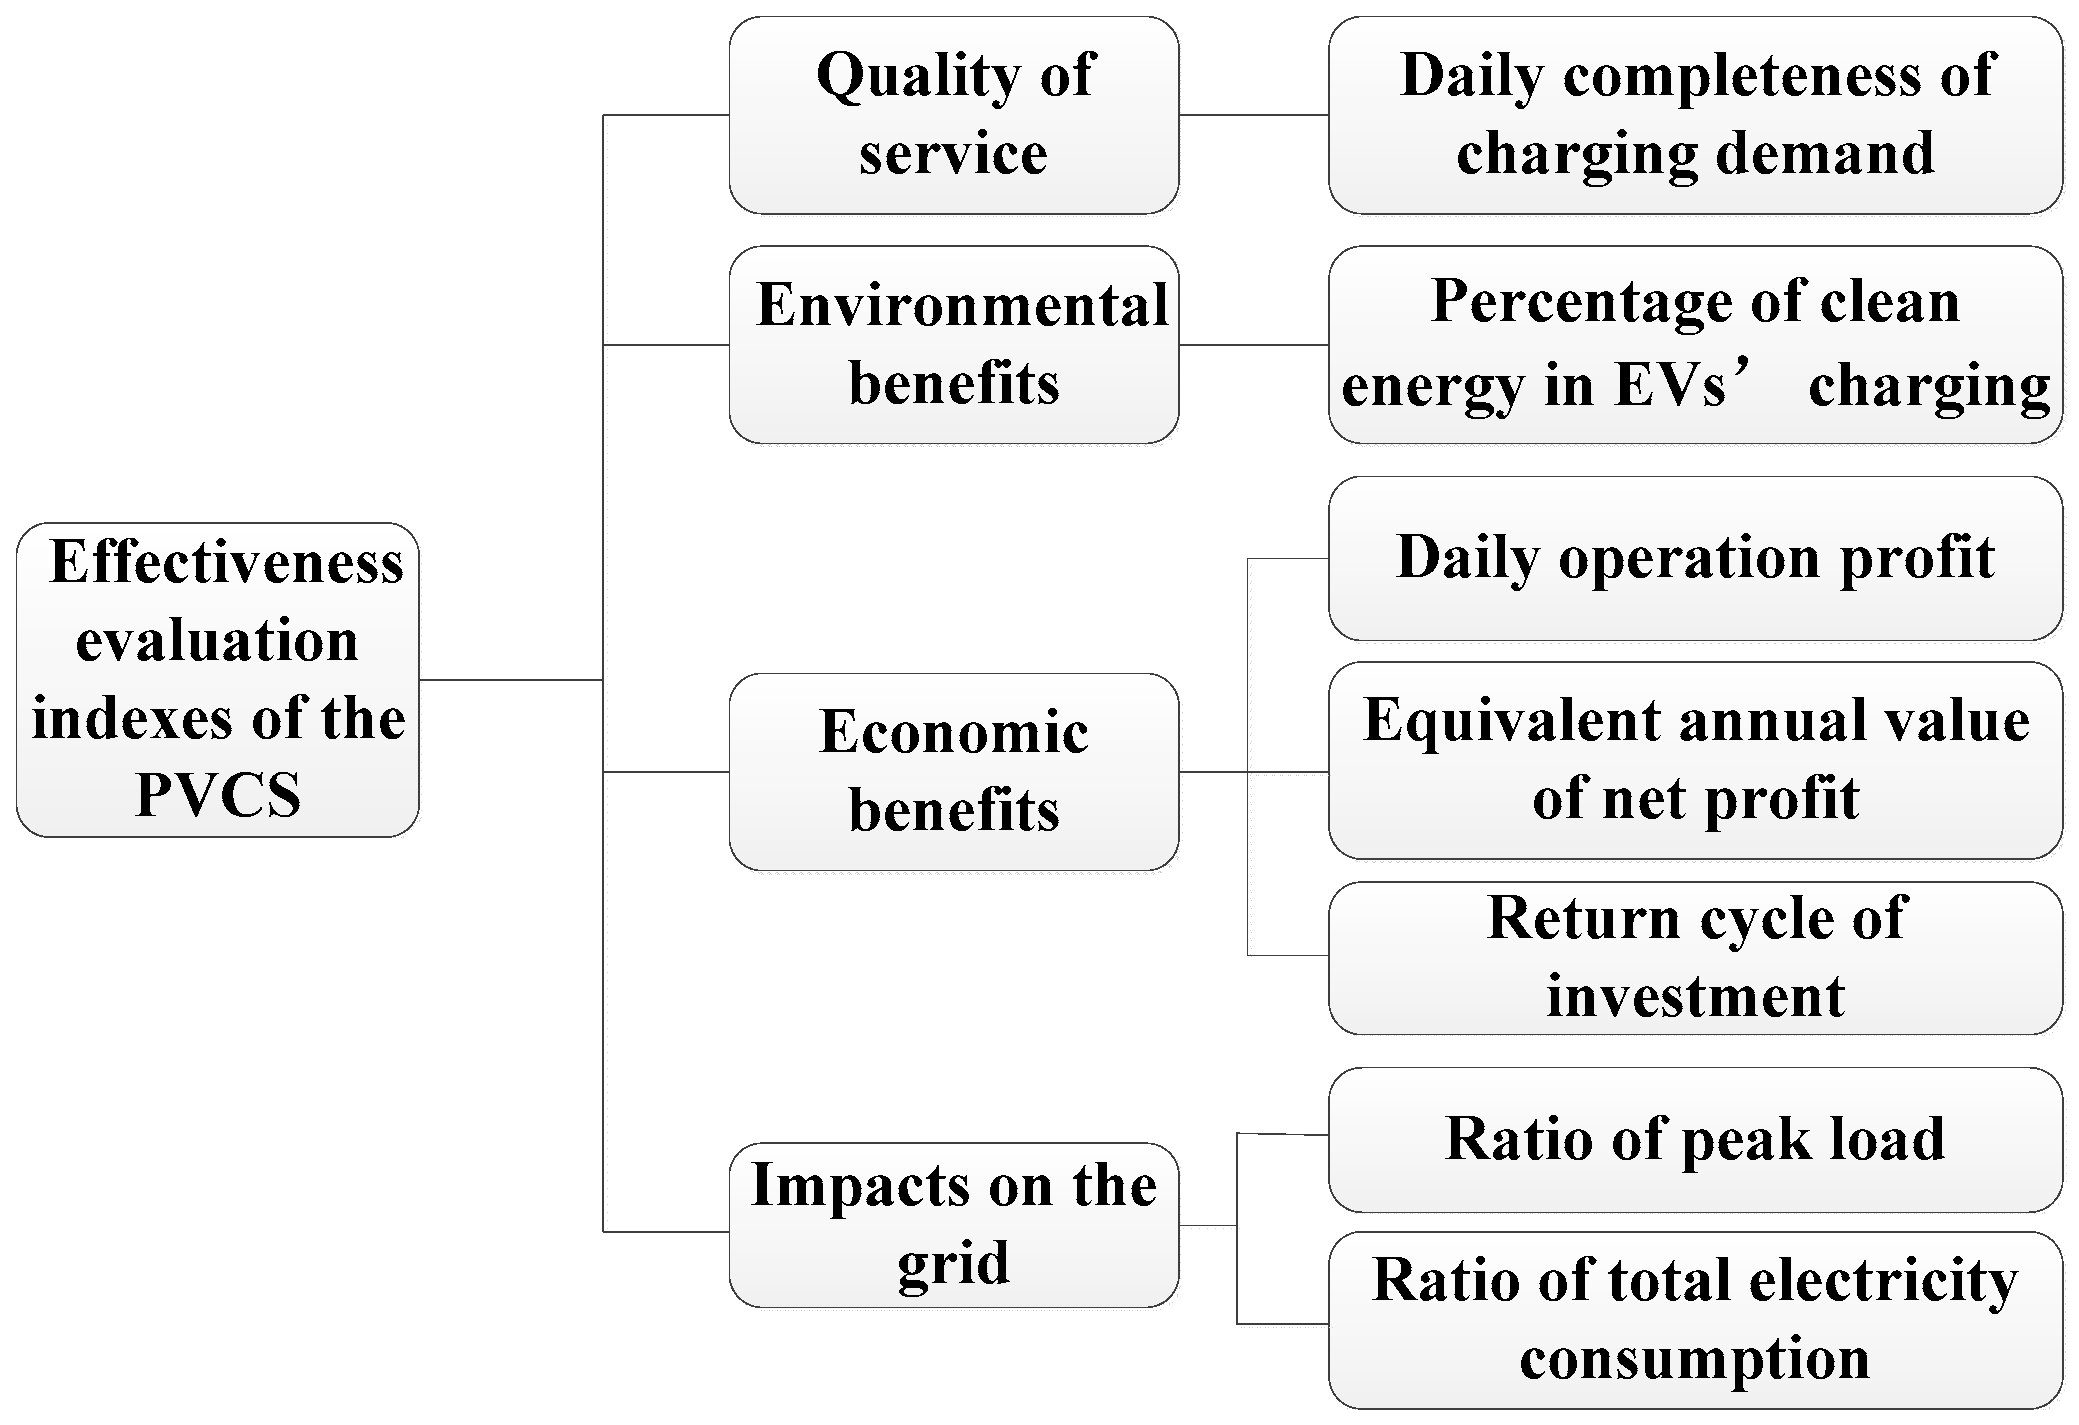
In order to evaluate the long-term effectiveness of the commercialized PVCS, a set of evaluation indexes are introduced, including the quality of service, economic benefits, environmental benefits, and impacts on the power grid.
- (2)
Taking the self-consumption of PV energy and the quality of service into consideration, a charging strategy for an office building PVCS is proposed, which is easy to achieve and popularize.
- (3)
Considering the potential development of EVs, the long-term effectiveness of the PVCS is evaluated based on actual statistics data and scenario analysis, presenting the potential to provide the investors of the PVCSs with more valuable guidance.
The paper is organized as follows.
Section 2 introduces the structure and operation mode of the commercialized PVCS located at an office building. In
Section 3, the indexes of an effectiveness evaluation are proposed.
Section 4 provides the basic models for EVs and a PV system.
Section 5 proposes the charging strategy, considering the PV self-consumption and quality of service. In
Section 6, simulation and effectiveness evaluations are provided for the PVCS. Finally, the conclusion is given in
Section 7.
2. Typical Structure and Operation Mode of the PVCS
It is possible to integrate the charging stations located at office buildings, workplaces, public parking lots, and residential apartments, with a PV system. The typical structures of a PVCS are shown in
Figure 1. The structure mainly consists of PV arrays, a DC/DC converter, a bidirectional AC/DC converter, load of building, chargers, and a central controller. The PV arrays are connected to the DC/DC converter, which is able to control the maximum power point tracking. The AC/DC converter is responsible for realizing bidirectional power conversion between DC and AC power. The central controller is set to control and communicate with all of the components. Based on this structure, the information associated with EVs (such as state of charge, voltage, etc.) can be transmitted to the chargers and central controller, ensuring reasonable energy distribution.
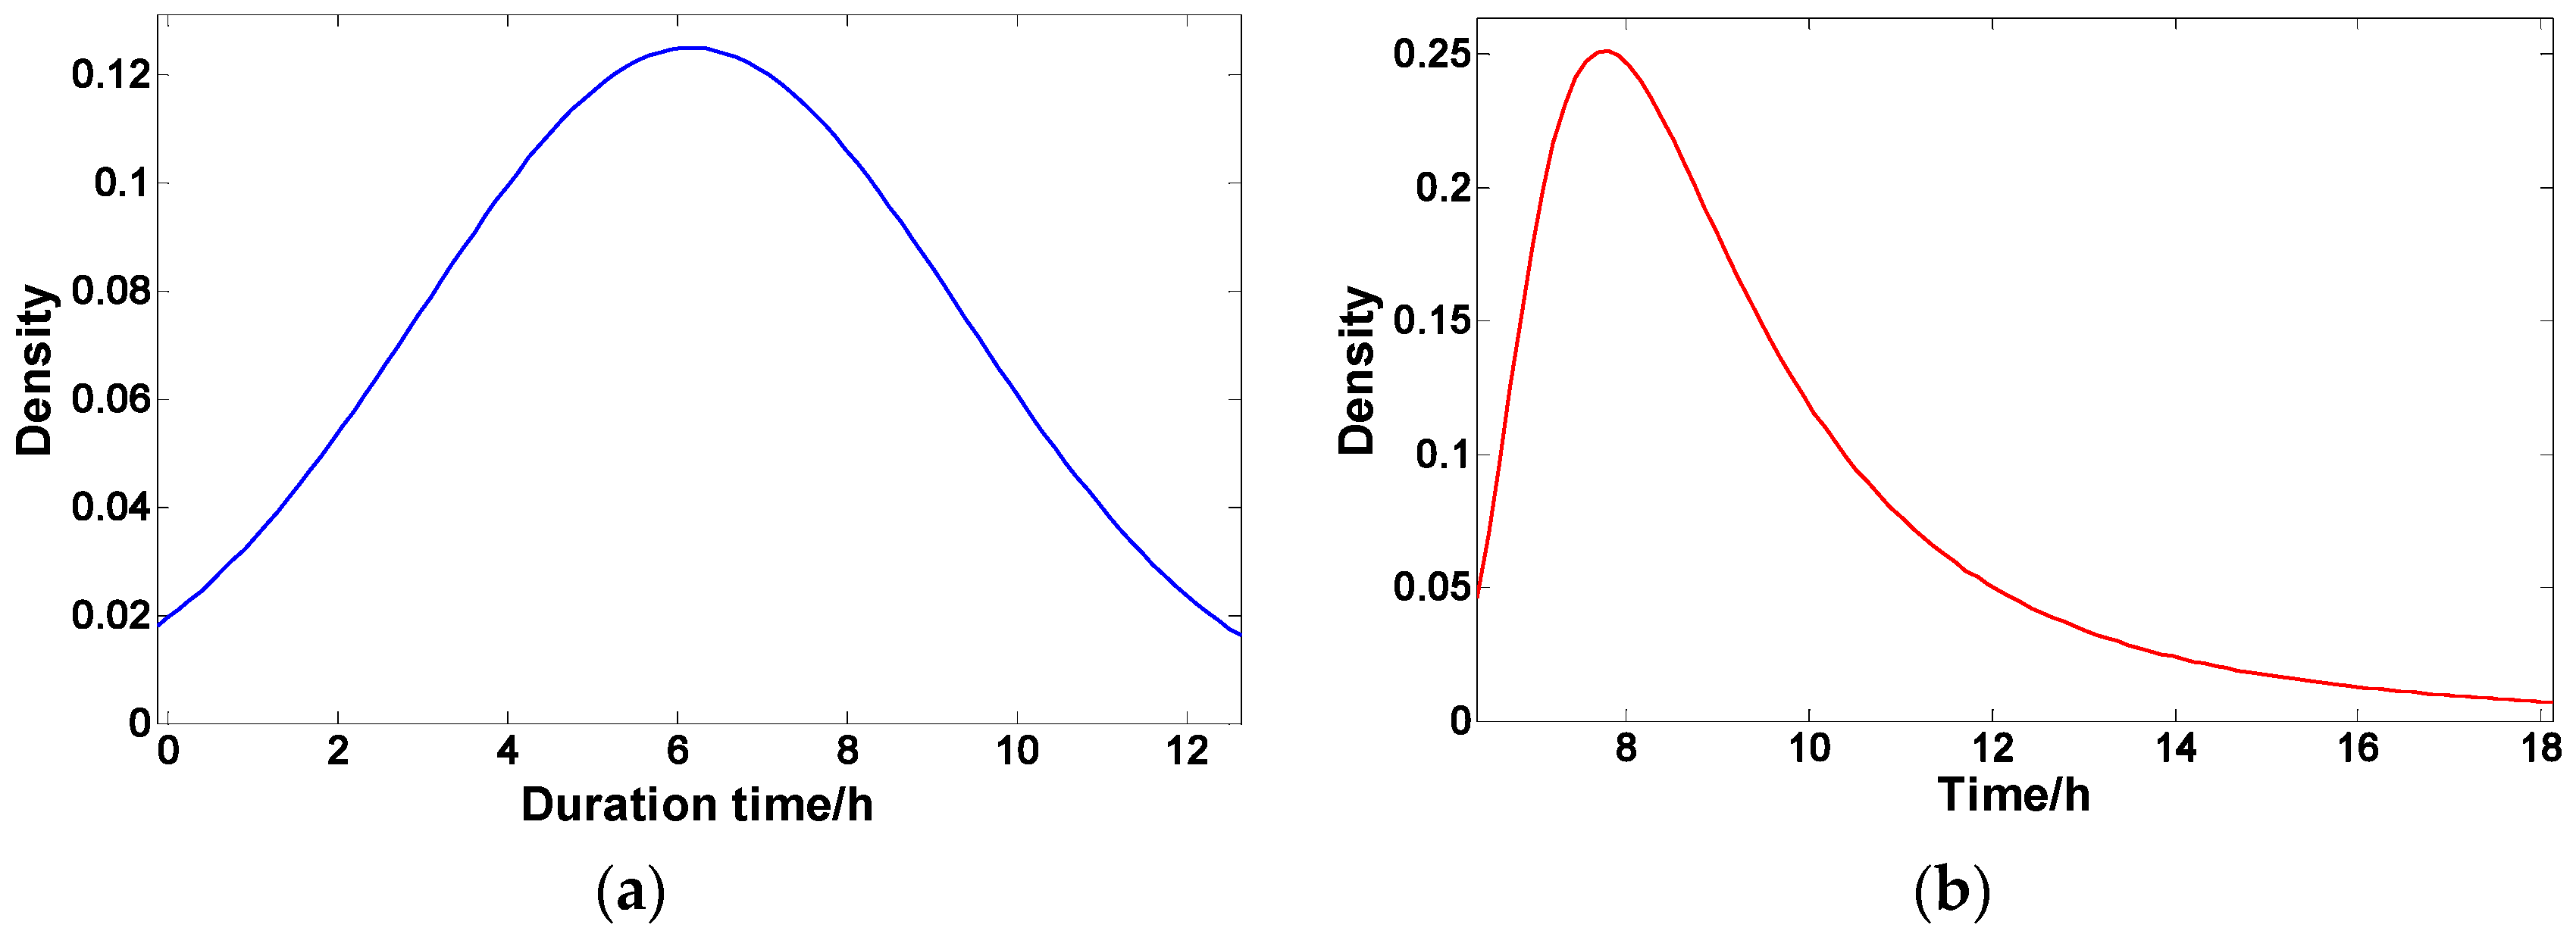
According to the statistics, the parking duration time of vehicles around office buildings is usually much longer than the charging time they need, which means that they do not need to be charged as soon as they arrive. Considering this fact, it is obvious that the combination of the parking and charging demands will produce a more effective mechanism. Hence, a typical operation mode for a commercialized PVCS is shown in
Figure 2.
Two types of energy policies in China are considered in the operation of the PVCS. The first of these relates to the development of EVs, and the other is associated with the development of distributed PV resources. The cost of using an EV may be composed of different elements, supported by the development of energy policies on EVs. In a commercialized PVCS, EV users need to pay the corresponding electricity fees for the power which they obtain from the grid or the PV system. In addition, they need to pay extra service fees to the PVCS, for the charging service. On the other hand, to promote the development of distributed PV resources, the PVCS receives subsidies for PV energy from the government. The self-consumption of PV energy is strongly encouraged and the surplus PV energy will be sold back to the grid at a relatively lower price, compared with the electricity sale price of the grid.
According to the above policies, the economic benefits of the commercialized PVCS mainly consist of the charging service fees, the parking service fees, the profit of the sold PV energy (sold to EVs users or the grid), and the subsidies of PV energy from the government. Therefore, it is possible that the investors of the PVCS will make a considerable profit, if the charging demand is well scheduled.
The price of the surplus PV which is sold back to the grid is usually lower than the electricity sale price of the grid. For this reason, increasing the utilization of PV energy for the charging load is more profitable than selling it to the grid. A charging demand with high controllability would contribute to improving the self-consumption of PV energy. Considering the necessity of charging, EVs are divided into two types, according to the controllable degrees of their charging activities. Type_1: the parking duration time of the EV is longer than their required charging time. The PVCS can choose when to satisfy their charging requirement, in order to maximize the utilization of PV energy. This type of EV is represented by Type_1 in the following, for brevity; Type_2: the parking duration time of the EV is shorter than or equal to their required charging time. They must be charged as soon as they arrive. This type of EV is represented by Type_2, for brevity. It is obvious that only Type_1 can help improve the economic effectiveness of the PVCS. Hence, the service fees of Type_1 are set at a lower rate than those of Type_2. The charging requirements of both types of EV can be satisfied with a proper charging strategy.
When considering EV users, it is clear that they need to set the information relating to their EVs at the charger panel as they arrive, which includes the objective State of Charge (SOC), the departure time, and so on. The parking demands of EVs can be satisfied, along with the charging demands, through the PVCS. EVs which have a relatively longer parking time (Type_1) can participate in the scheduling of the PVCS. Therefore, it is possible to pay lower service fees for this type of EV.
5. Charging Strategy Considering PV Self-Consumption and Quality of Service
5.1. Basic Principle
In general, the PVCS is supposed to produce satisfactory economic and environmental benefits, while minimizing the impacts on the grid and providing a guarantee on the quality of service. According to the aforementioned analysis, it’s obvious that the main scheduling objects are Type_1, which have a relatively longer parking duration time and for which the decision variables are their charging time. Two main principles are followed in the charging strategy. The first is to maximize the self-consumption of PV power, and the other is to maximize the completeness of the charging demand. When considering the first principle, reasonable utilization of PV energy would help to lower the operation cost of the PVCS, increase the economic and environmental benefits, and indirectly reduce both the dependence and the impacts of EVs on the grid. For the second principle, the PVCS should meet the charging requirement of EVs as much as possible, to guarantee the quality of service.
Besides, the charging strategy of commercial PVCSs is considered to be easy to achieve. Most of the proposed strategies in other articles are relatively complicated and difficult to achieve for existing charging facilities and technologies.
According to the above principles, an easily-achieved charging strategy is designed as follows.
5.2. Charging Strategy
The procedure of the strategy is performed at every time slot, to adapt to the variability of information about PV energy, charging demand, and so on. The steps of the charging strategy are shown as follows.
(1) The central controller collects information about the PV energy and other relevant parameters;
(2) The proper number of EVs that are supposed to be charged is carefully designed to increase the self-consumption of PV power and reduce the grid impacts. The calculation process is shown as follows:
where
is the charging power of the
i-th EV, which can be calculated by (15) and which is constant in this paper;
is the PV output power at time
; and
is a parameter which is designed to balance the relation between the PV energy and charging demand. It is determined by the historical data. During the operational process, the PVCS can choose a selection of days whose meteorological data is close to the current day. These days are defined as “similar days” of the current day. Thus, the value of
is calculated, based on the similar days, as follows:
where
is the number of similar days;
is the total charging energy of the
j-th day; and
is the PV energy of the
j-th day.
The “similar days” of the current day must meet the following requirements.
represents the current day and
represents the similar day.
- a)
, which means that and are consistent on the type of weekdays or weekends.
- b)
, which means that the solar intensity difference ratio of and is less than .
- c)
, which means that the temperature difference ratio of and is less than .
where
and
are empirically set parameters, according to the actual operation.
(3) Decide the priority of the EVs which are supposed to be charged at this moment. The EVs are divided into three levels, based on the urgency degree of the charging demand. The three levels are represented by EV_1, EV_2, and EV_3, respectively.
- a)
Type_2 need to be charged as they arrive. So, they are classified as EV_1;
- b)
Taking the
i-th EV as an example, the time it needs to reach
is calculated by:
where
is the SOC of the
i-th EV at time
.
Denote
as the departure time set by the
i-th EV user. If
, this EV would be classified as EV_1.
- c)
Those EVs which do not satisfy the above conditions would fall into EV_2 or EV_3. Taking the
i-th EV as an example, the remaining time before it leaves is calculated as:
If , the i-th EV would be classified as EV_2. Otherwise, it would fall into EV_3.
As for the EVs in the same layer, the EV which needs more energy to reach the objective SOC has a higher priority.
(4) Charge the EVs in the order of levels and priorities.
The numbers of EVs at three levels are represented as
,
, and
, respectively.
- a)
if , only the EVs at the first level are charged;
- b)
if , the EVs at the first level and the first EVs at the second level can be charged;
- c)
if , the EVs at the first/second level and the first EVs at the third level can be charged;
- d)
if , all the EVs can be charged.
6. Case Study
6.1. Scenarios and Basic Data
An office building is selected for a case study to evaluate the effectiveness of the operation mode and the validity of the charging strategy. The modeling and simulations are performed by MATLAB. Considering that the EV users may have more than one place for charging, two scenarios are taken into consideration. Scenario 1: the entire charging requirements of all of the EVs are satisfied at the PVCS; Scenario 2: only half of the charging requirements are accomplished at the PVCS, whilst the other half are met at home or somewhere else.
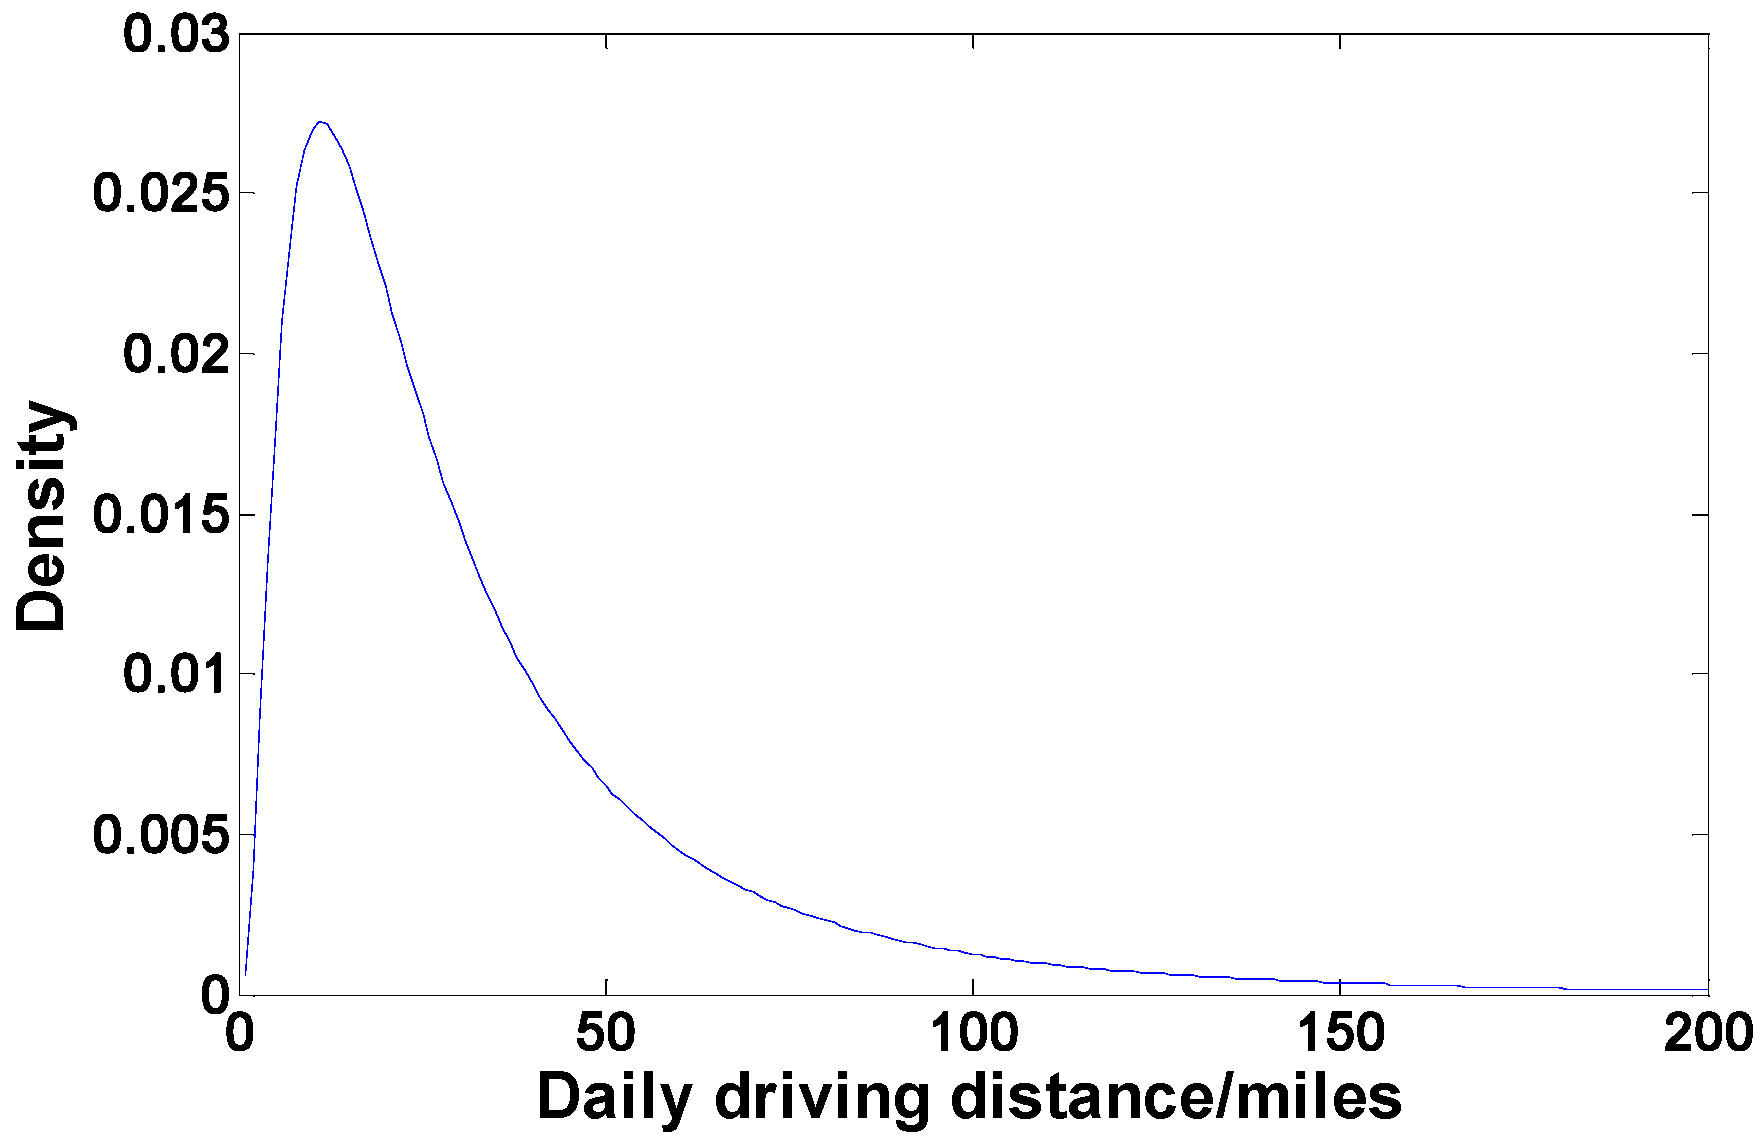
The arrival time, departure time, and the daily driving distance of EVs is randomly generated, based on the probability distribution introduced in Section IV. Additionally, the initial SOC of the EVs is calculated, based on the daily driving distance. The number of served EVs is set to 115, based on the statistical data. The parameters of the EV battery are shown in
Table 1.
The load data is collected according to the one-year statistical data of the office building. The capacity of the PV system is set to 150 kW, based on the size of the available area on the rooftop of the building and outdoor parking lots.
According to the energy policies of China, the following relevant parameters in
Table 2 are set to evaluate the economic benefits of the PVCS.
6.2. Analysis of the Energy Management in Typical Days
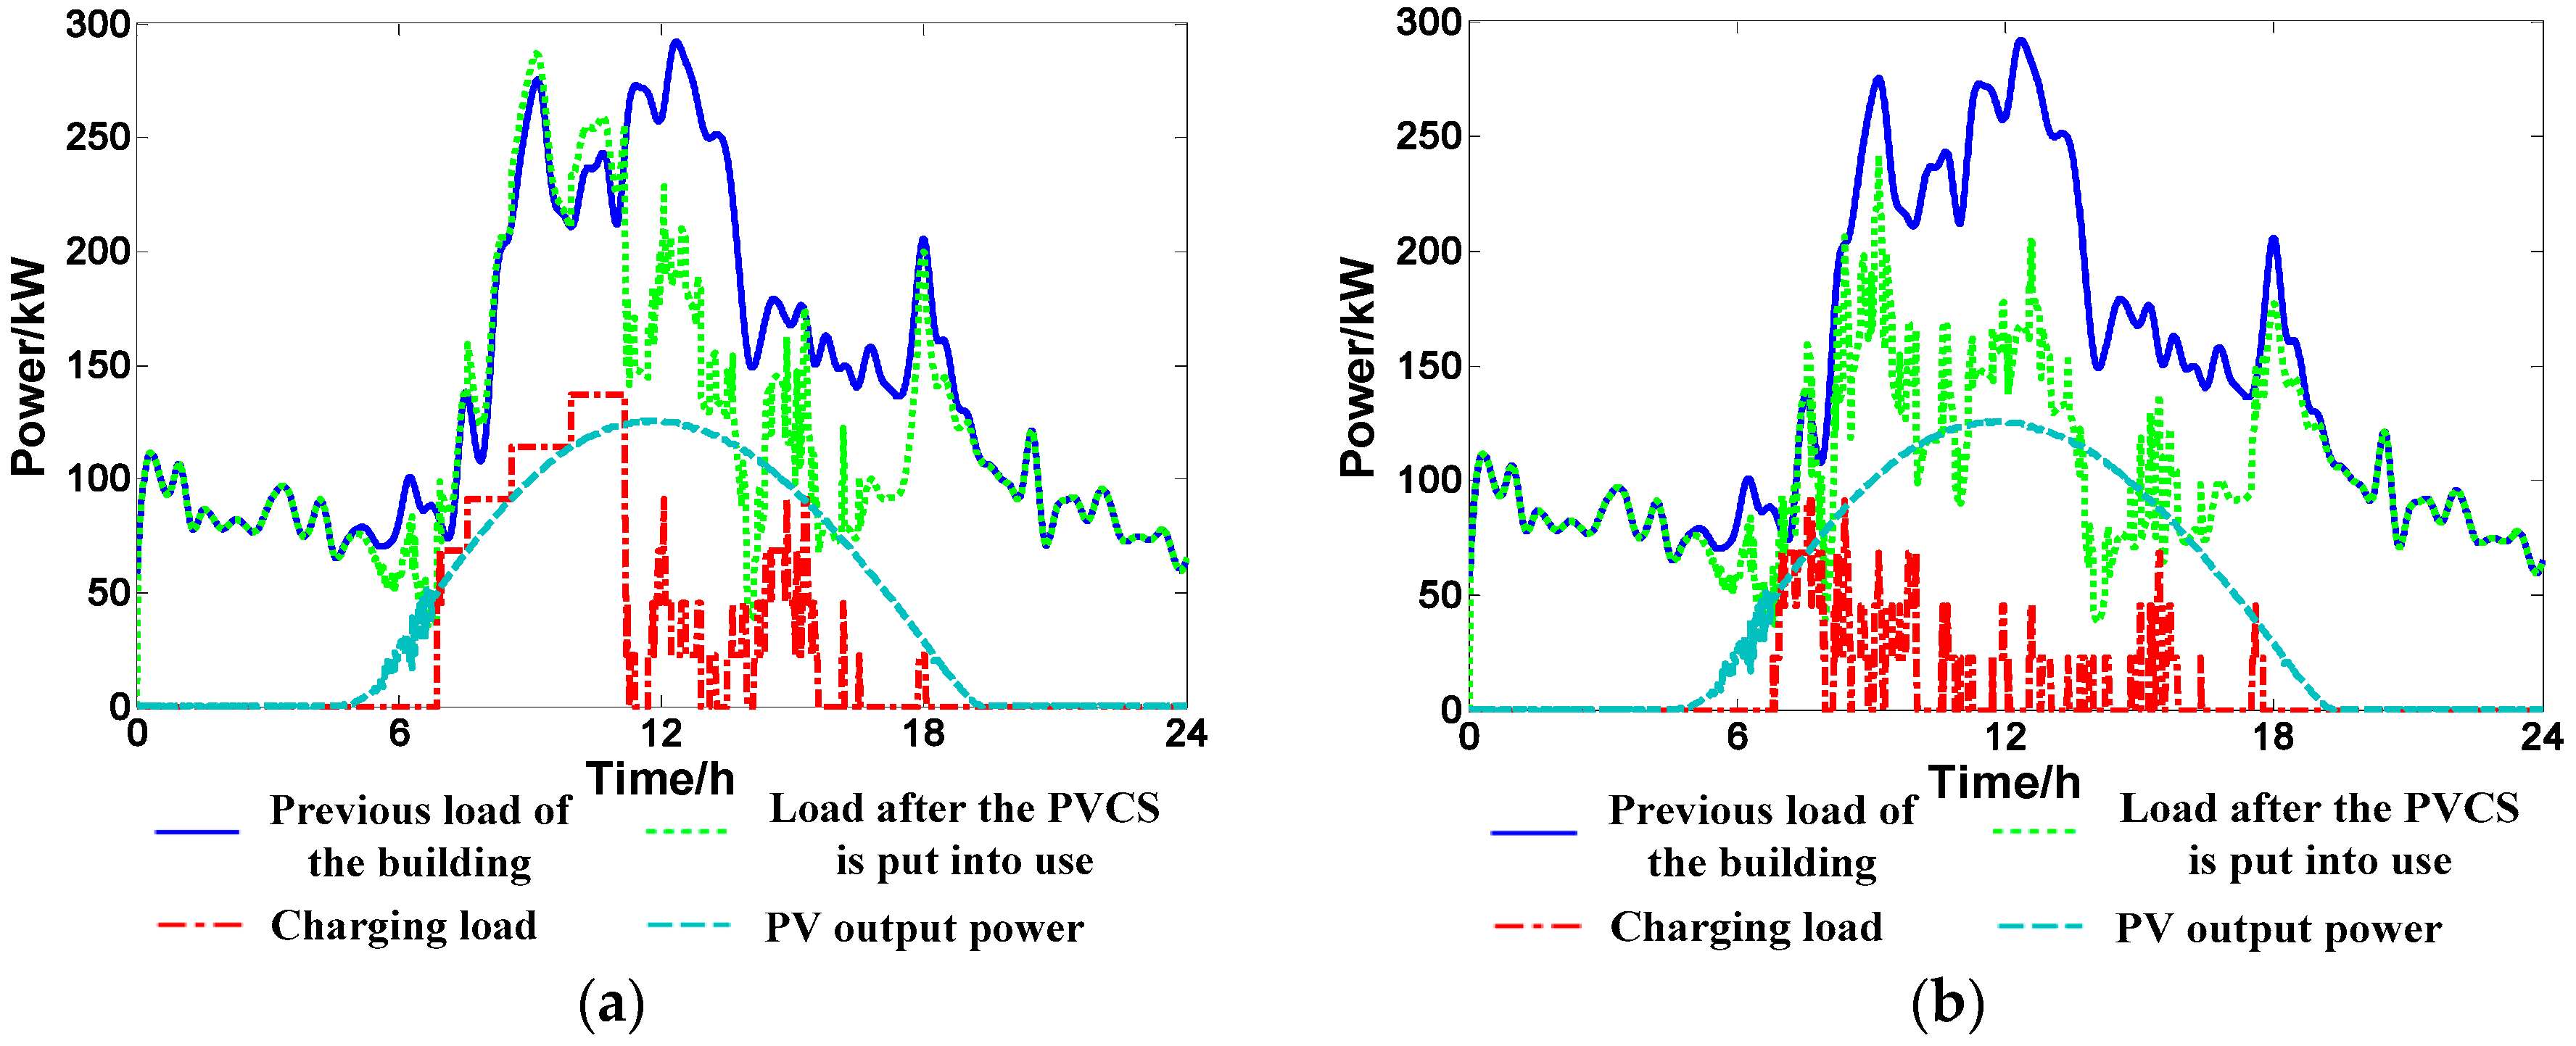
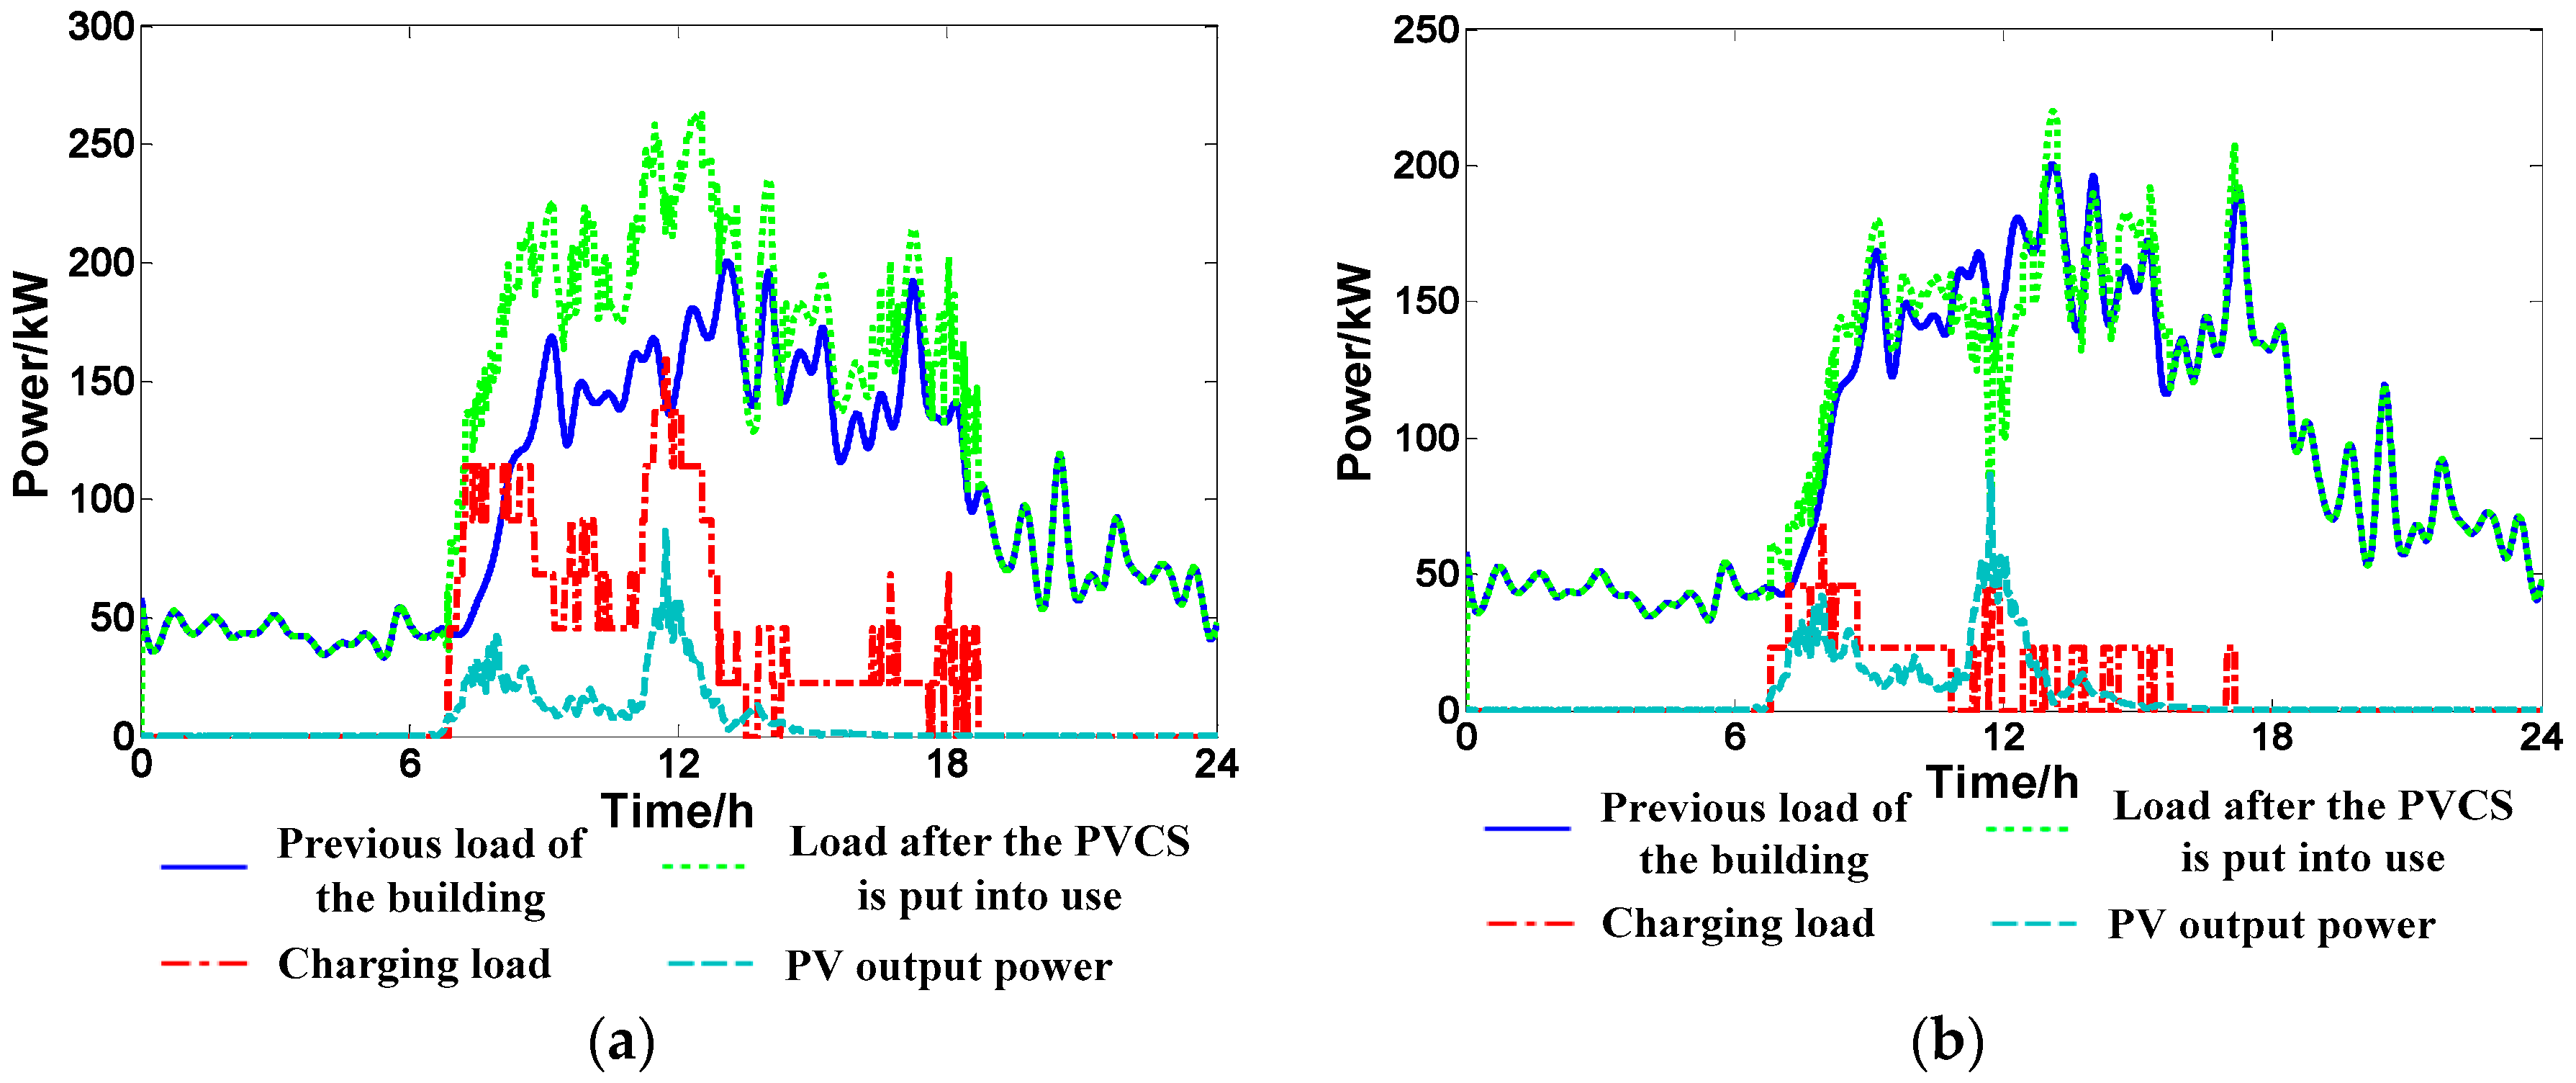
In order to verify the applicability of the charging strategy, two typical days of different PV outputs are selected as simulation objects. One day is a sunny day, and the other day is a cloudy day. The energy management results of the sunny day under two scenarios are shown in
Figure 6.
It can be seen from the results that the PVCS can satisfy most of the charging requirement with PV energy. Compared to the original load of the building, the charging activities of EVs do not have negative impacts on the grid. Furthermore, if the original peak load of the building appears at noon, when the PV output power is large, the peak load is reduced by the PVCS.
The energy management results of the cloudy day under two scenarios are shown in
Figure 7.
The curves in
Figure 7 show that, on cloudy days, the increase of load is relatively larger under scenario 1. Furthermore, the load is nearly the same as the original load under scenario 2, i.e., the charging activities have almost no impacts on the grid. This means that, even on cloudy days, the PVCS has no severe negative impacts, while satisfying the charging requirement.
As the PV energy on cloudy days is not abundant, the results are not as good as the ones on sunny days. In order to guarantee the quality of service, the correct amount of energy would need to be purchased from the grid, according to the charging strategy.
6.3. Comprehensive Effectiveness of Long-Term Operation
Compared to the short-term operation analysis of the PVCS, an analysis of long-term operation is of much more significance in practice. In this paper, a one-year simulation is performed to evaluate the long-term operation effectiveness. The average values of the evaluation indexes in every month are illustrated in the following figures.
(1) Quality of service
The index DCCD, which is designed to evaluate the quality of service, is close to 1.0 in every day, which means that the charging strategy of the PVCS can guarantee the daily completeness of the charging demand.
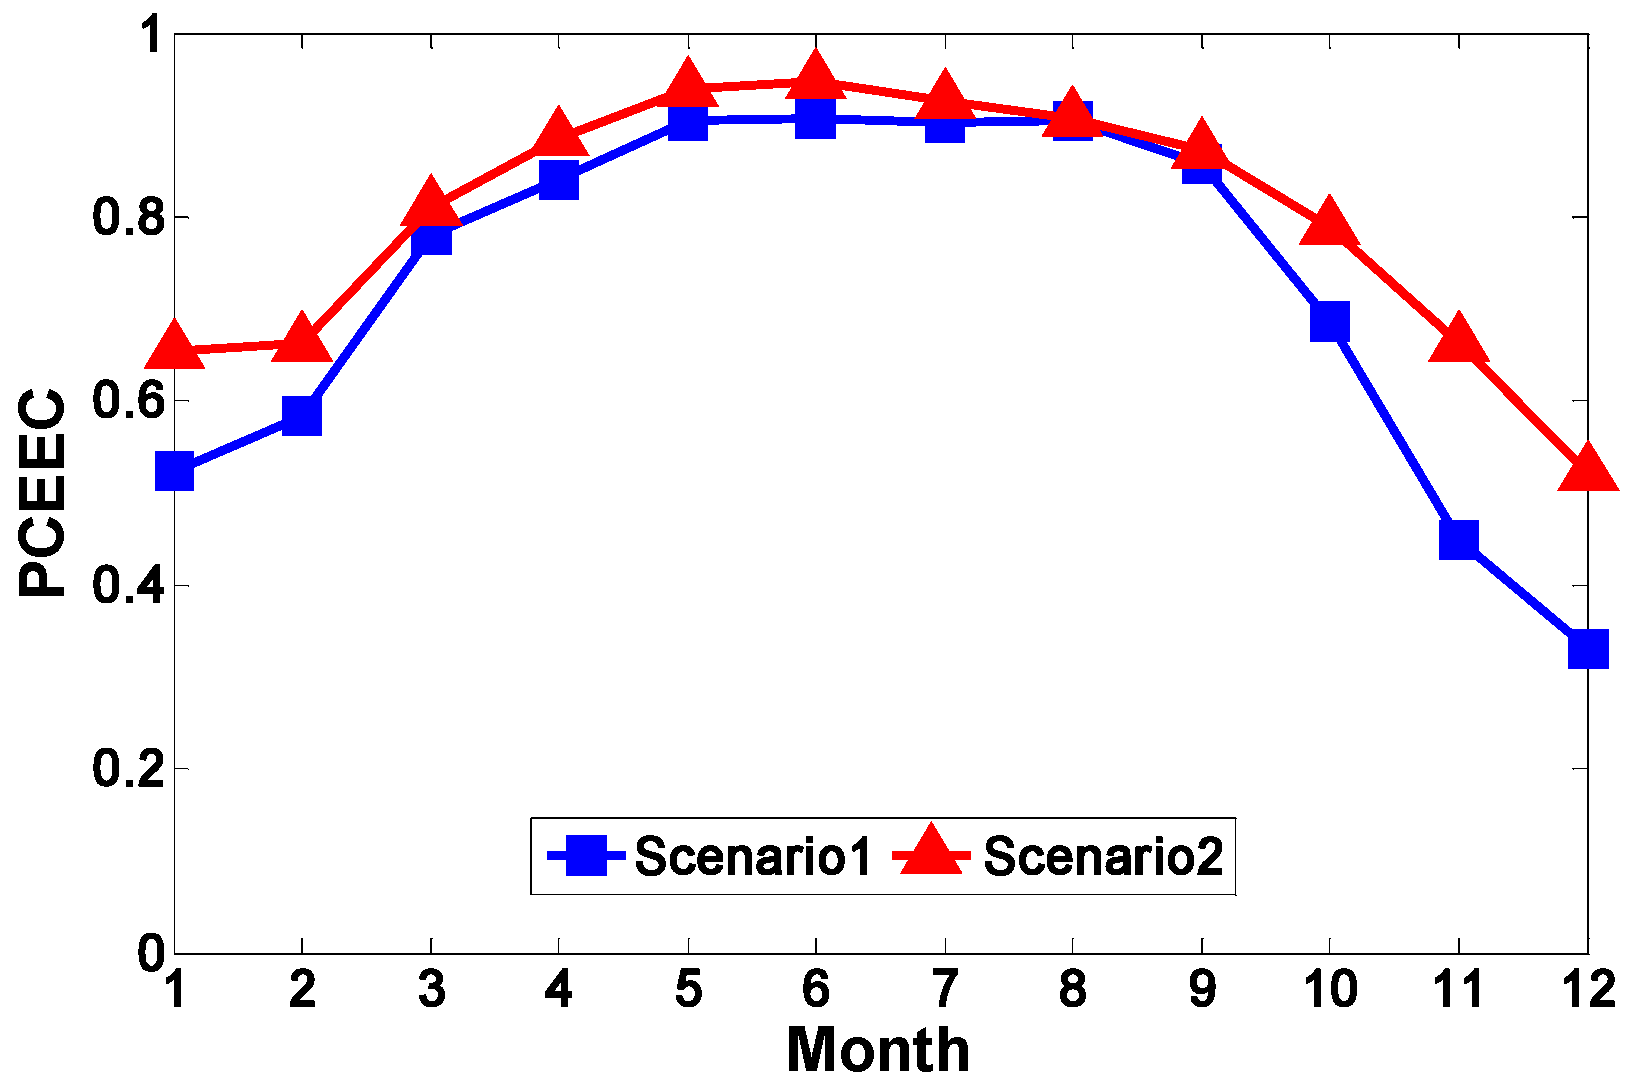
(2) Environmental benefits
The index PCEEC of twelve months is shown in
Figure 8.
In scenario 1, the PCEEC is over 50% in ten months, and five of them are over 80%. The worst value still reaches 33%. In scenario 2, the PCEEC is over 50% all year. With the rapidly growing charging demand, the above proportions indicate that the PVCS will have a significant effect on environmental benefits.
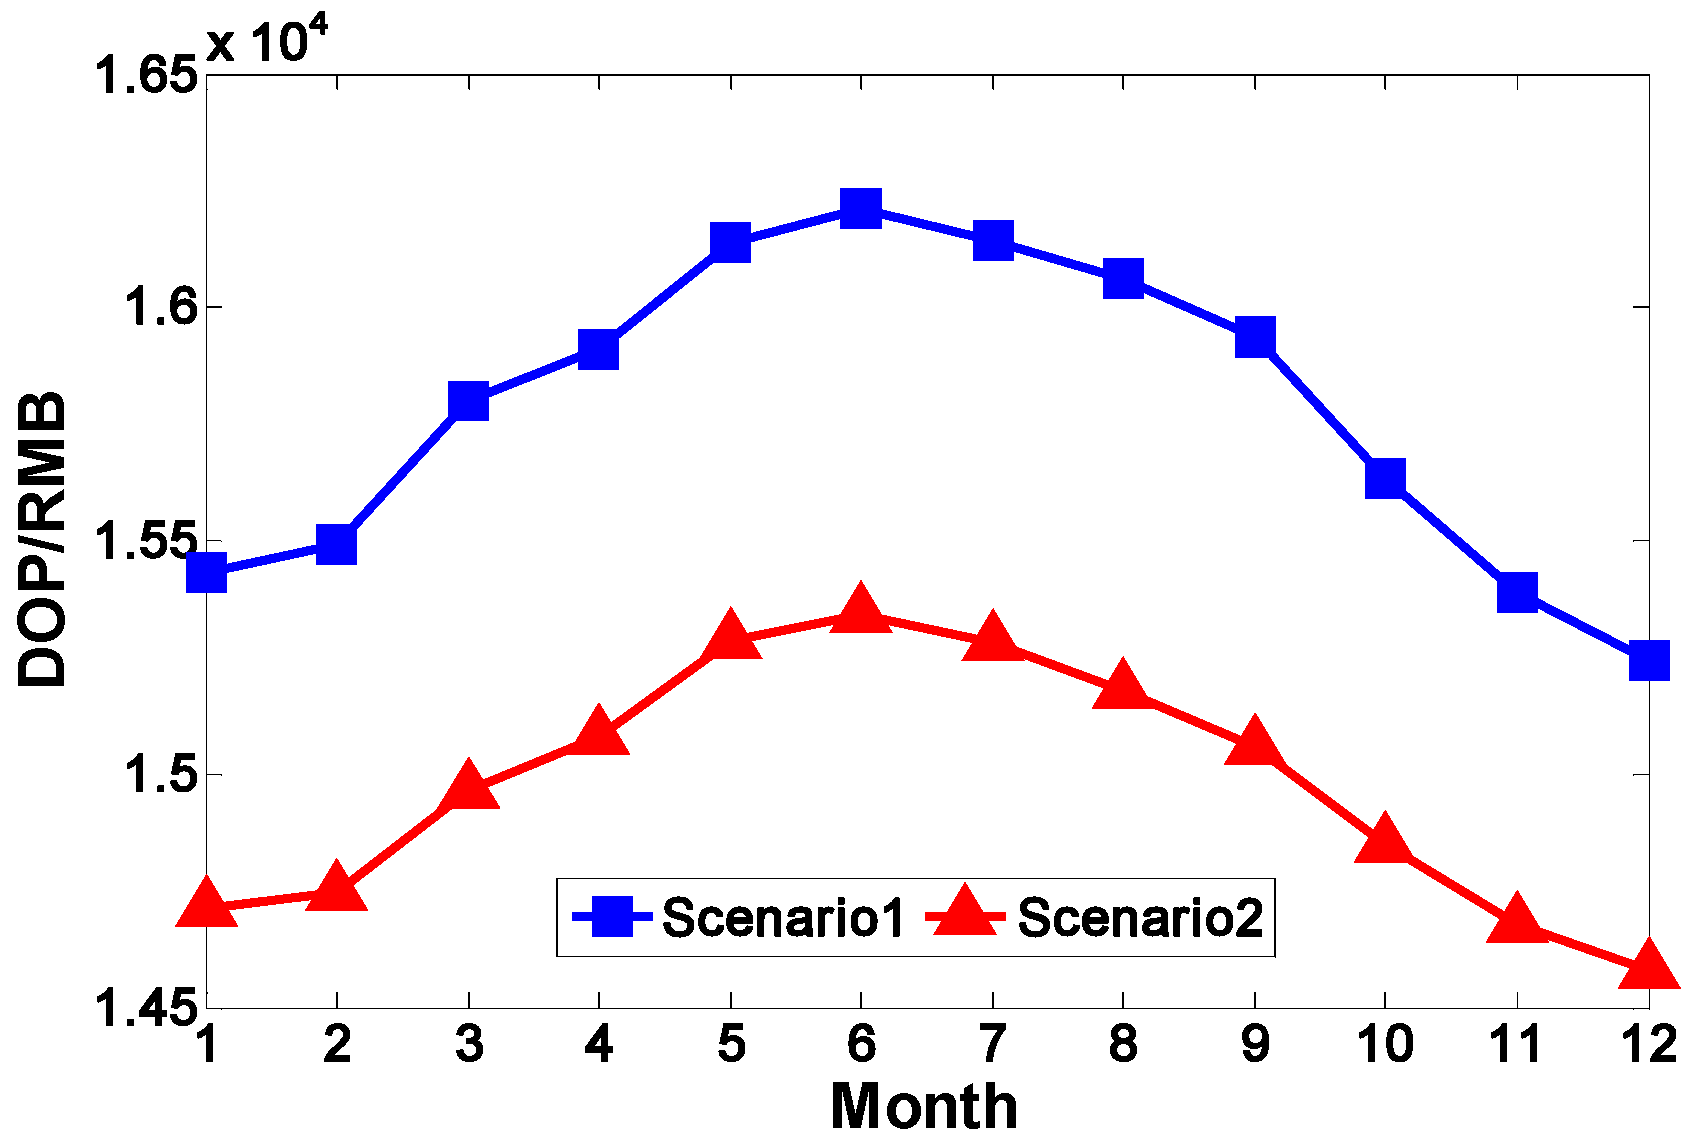
(3) Economic benefits
The index DOP of twelve months is shown in
Figure 9. The indexes
and
are listed in
Table 3.
Unlike other indexes, the economic indexes differ greatly under the two scenarios. The economic benefits are much better in scenario 1, than those in scenario 2. This indicates that the preferences of EV users on the charging locations play an important role in the economic benefits of the PVCS. The investors of the PVCS are supposed to figure out how to encourage EV users to charge their vehicales using a PVCS, so that they will receive better economic benefits.
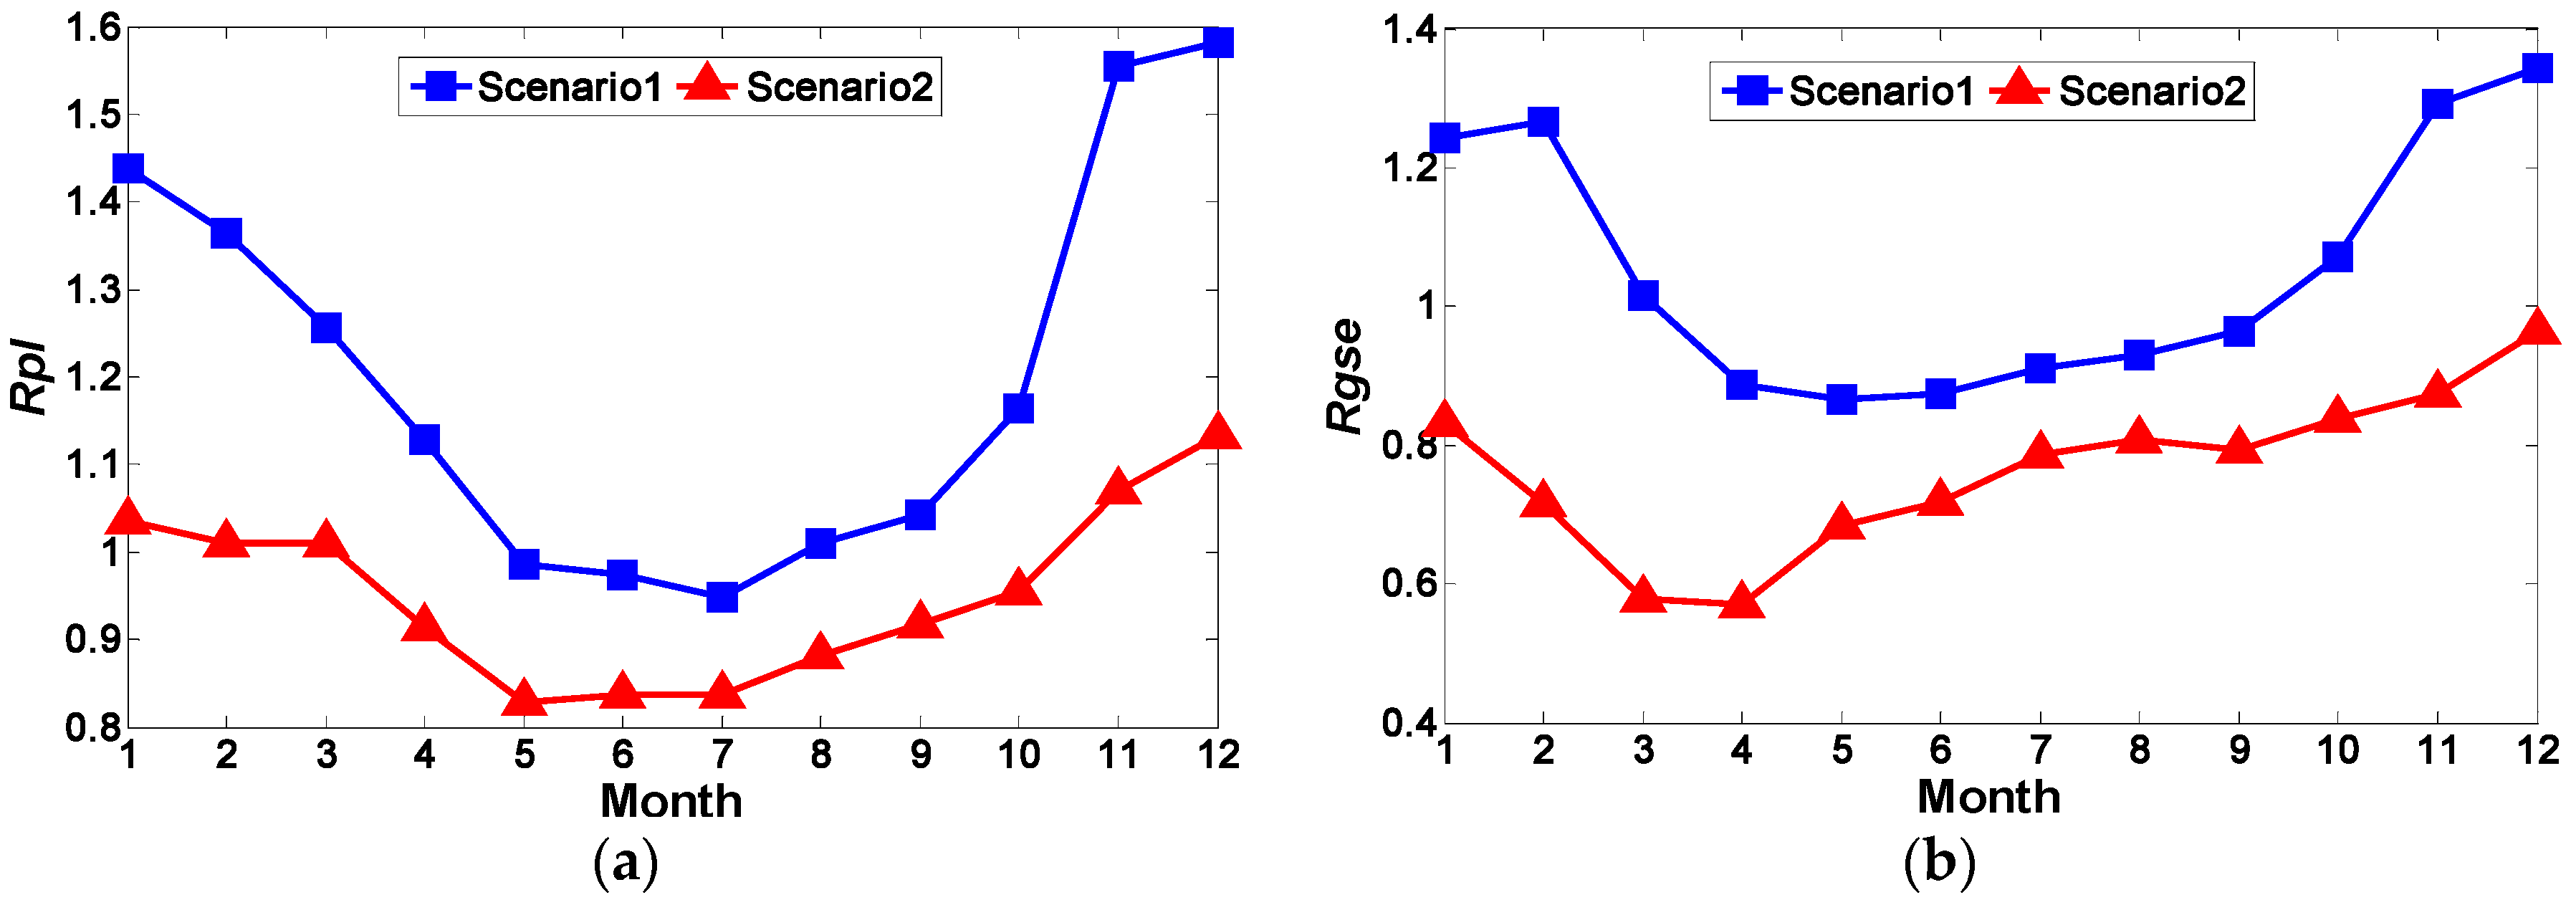
(4) Impacts on the grid
The indexes
and
of twelve months are shown in
Figure 10.
For scenario 1, during the months with abundant PV energy, the daily peak load is very close to the original load of building, as shown in
Figure 10. Meanwhile, it can be seen from
Figure 10 that most of the time during the year, the amount of energy supplied by the grid decreases because of the PVCS. This means that the charging activities have no severe impacts on the grid. For scenario 2, the peak load is close to the original load of building all year round, and the amount of energy supplied by the grid is also lower in every month. Both of the simulation results under the two scenarios indicate that the utilization of the PVCS can greatly reduce the negative impacts and dependence of EVs on the grid.
7. Discussion and Conclusions
In this paper, the operation mode and profitability of commercialized PVCSs are analyzed, based on the energy policies of China. In order to evaluate the effectiveness of the PVCS, an evaluation system is established, including a set of indexes, such as the quality of service, environmental/ economic benefits, and impacts on the grid. Furthermore, an easily-achieved charging strategy is proposed, with the purpose of improving the quality of service and the self-consumption of PV energy. With scenario analyses, an effectiveness evaluation for the PVCS is conducted, based on the actual statistical data. The results of typical days and long-term operation are illustrated by numerical simulations, which show that the PVCS has great potential for producing satisfactory environmental/economic benefits and for reducing the impacts and dependence of EVs on the grid.
Much related work still needs to be done to improve the evaluation of PVCSs. For instance, in practice, the electricity prices vary in different time periods, instead of remaining constant. Therefore, the actual time of use (TOU) prices or real-time prices should be taken into consideration in future work, to obtain a better estimate of the PVCS.


