Impact of Land Use Intensity on Ecosystem Services: An Example from the Agro-Pastoral Ecotone of Central Inner Mongolia

 ,
,
Abstract
:1. Introduction
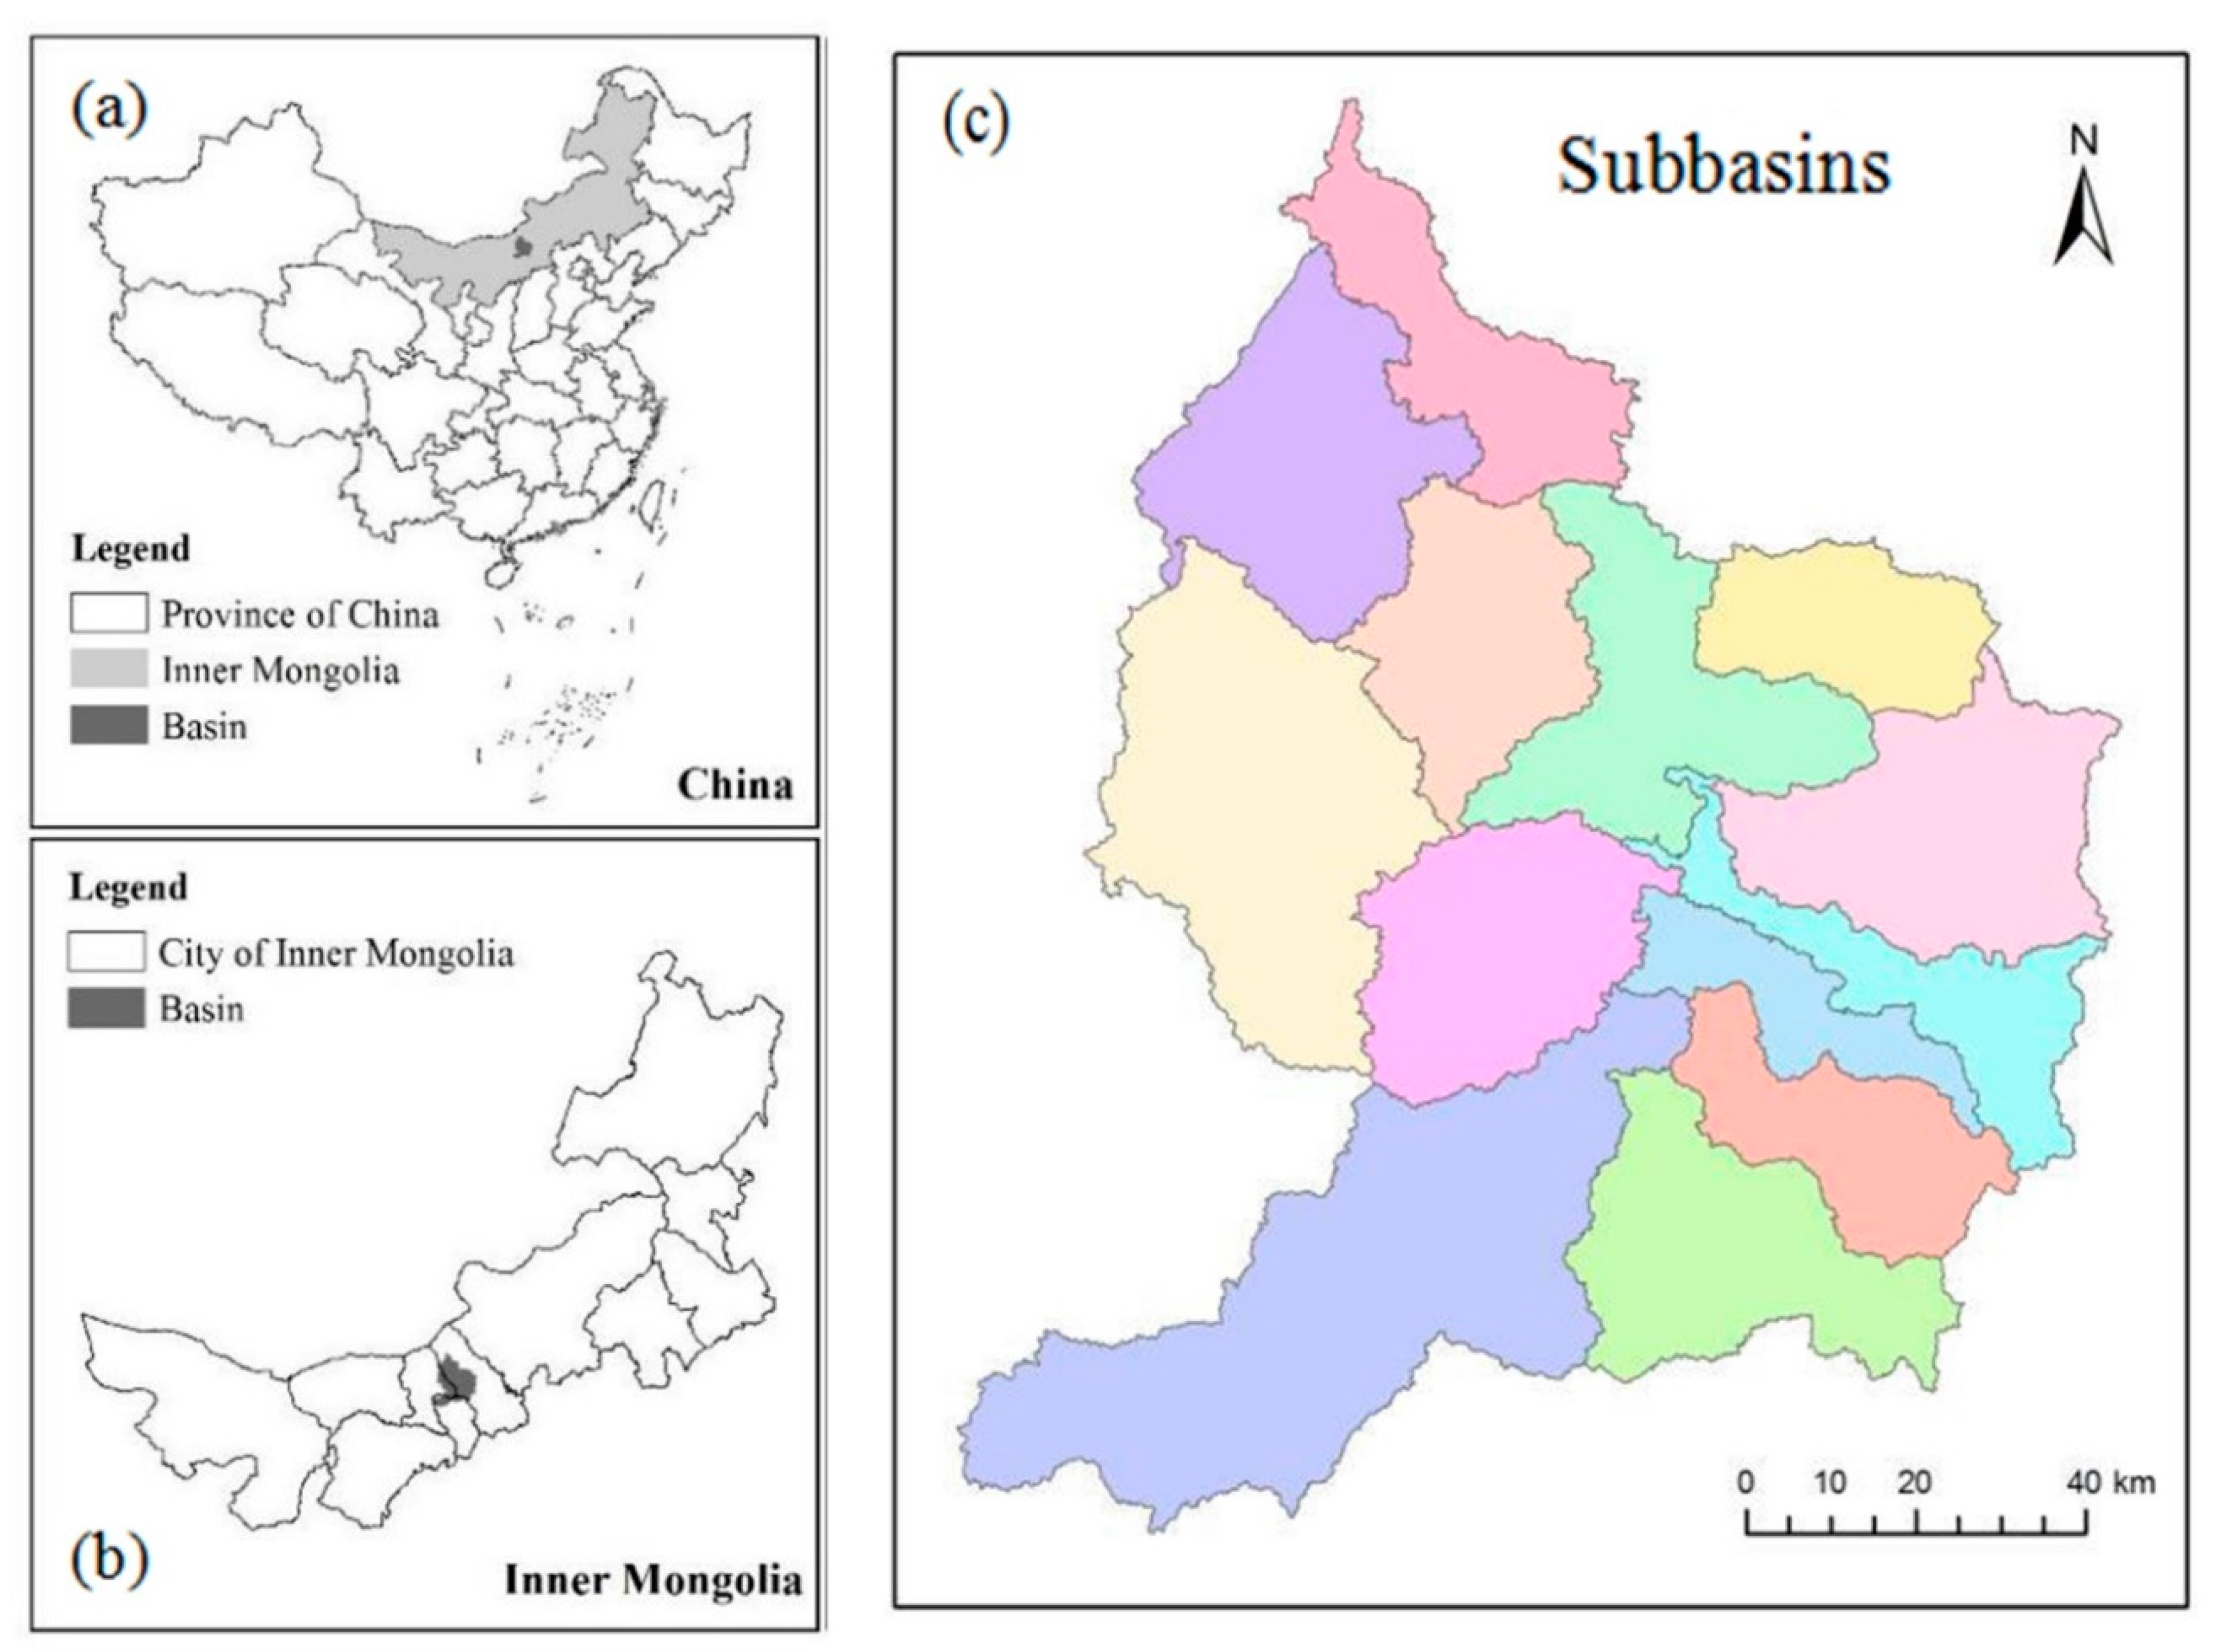
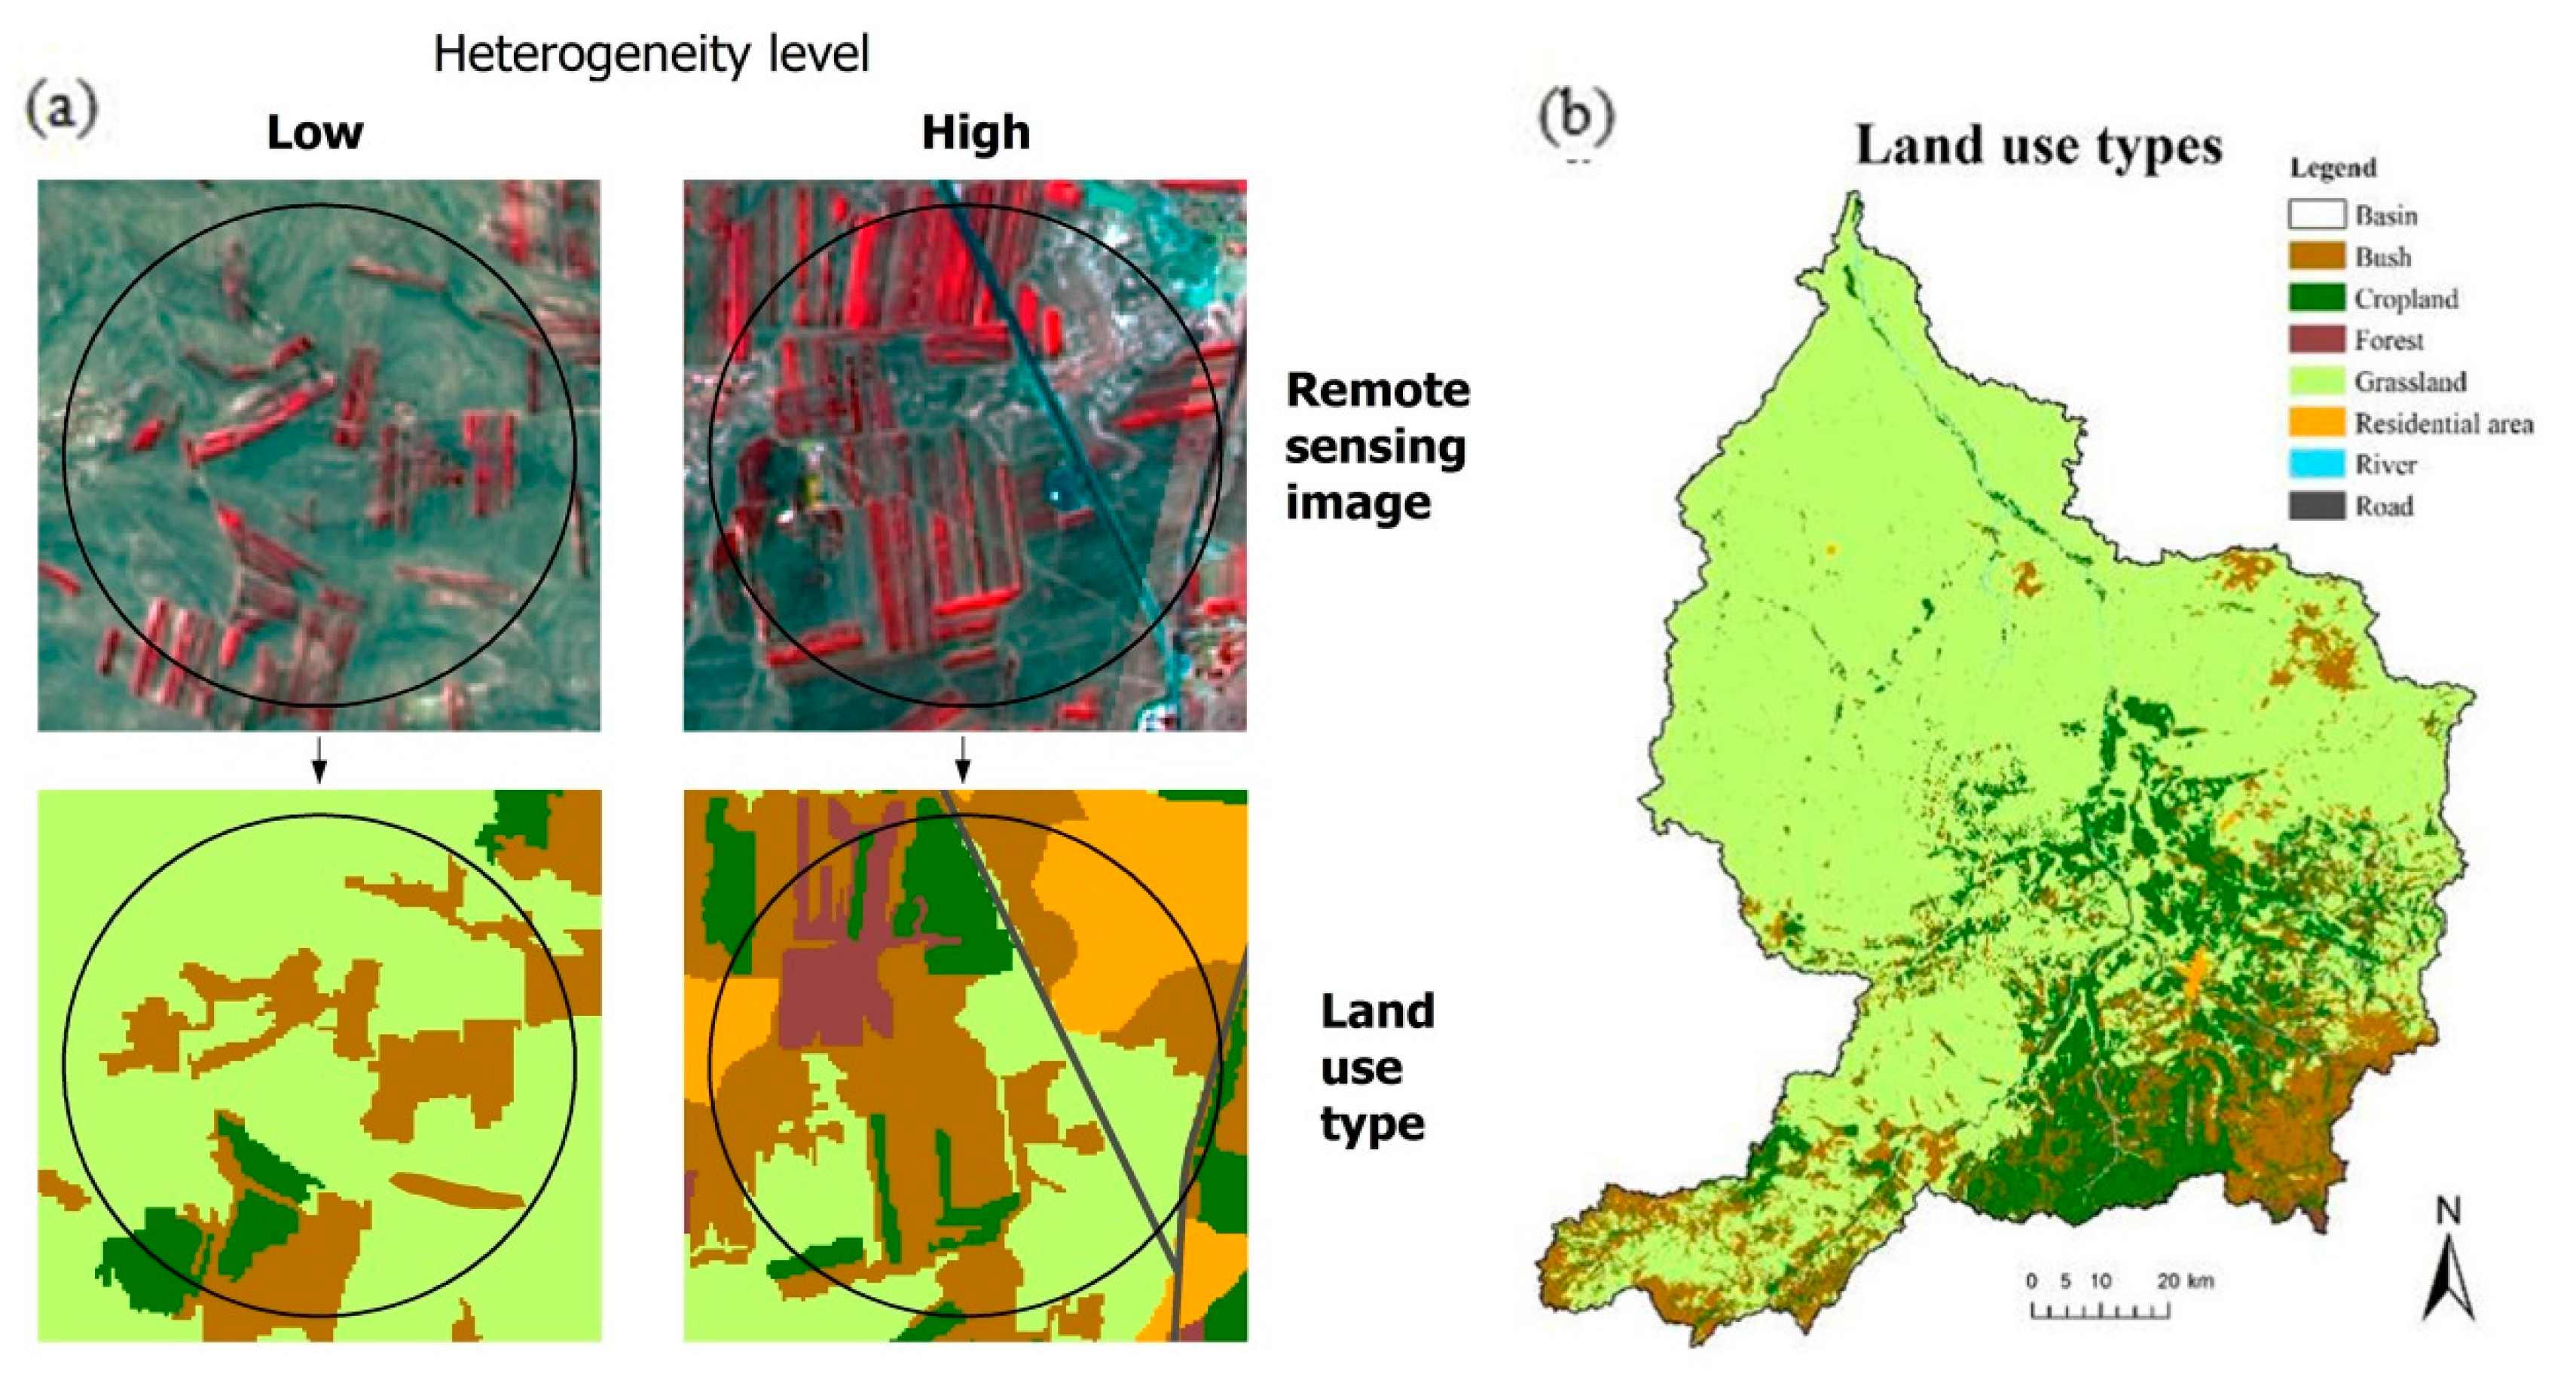
2. Study Area
3. Methods
4. Results
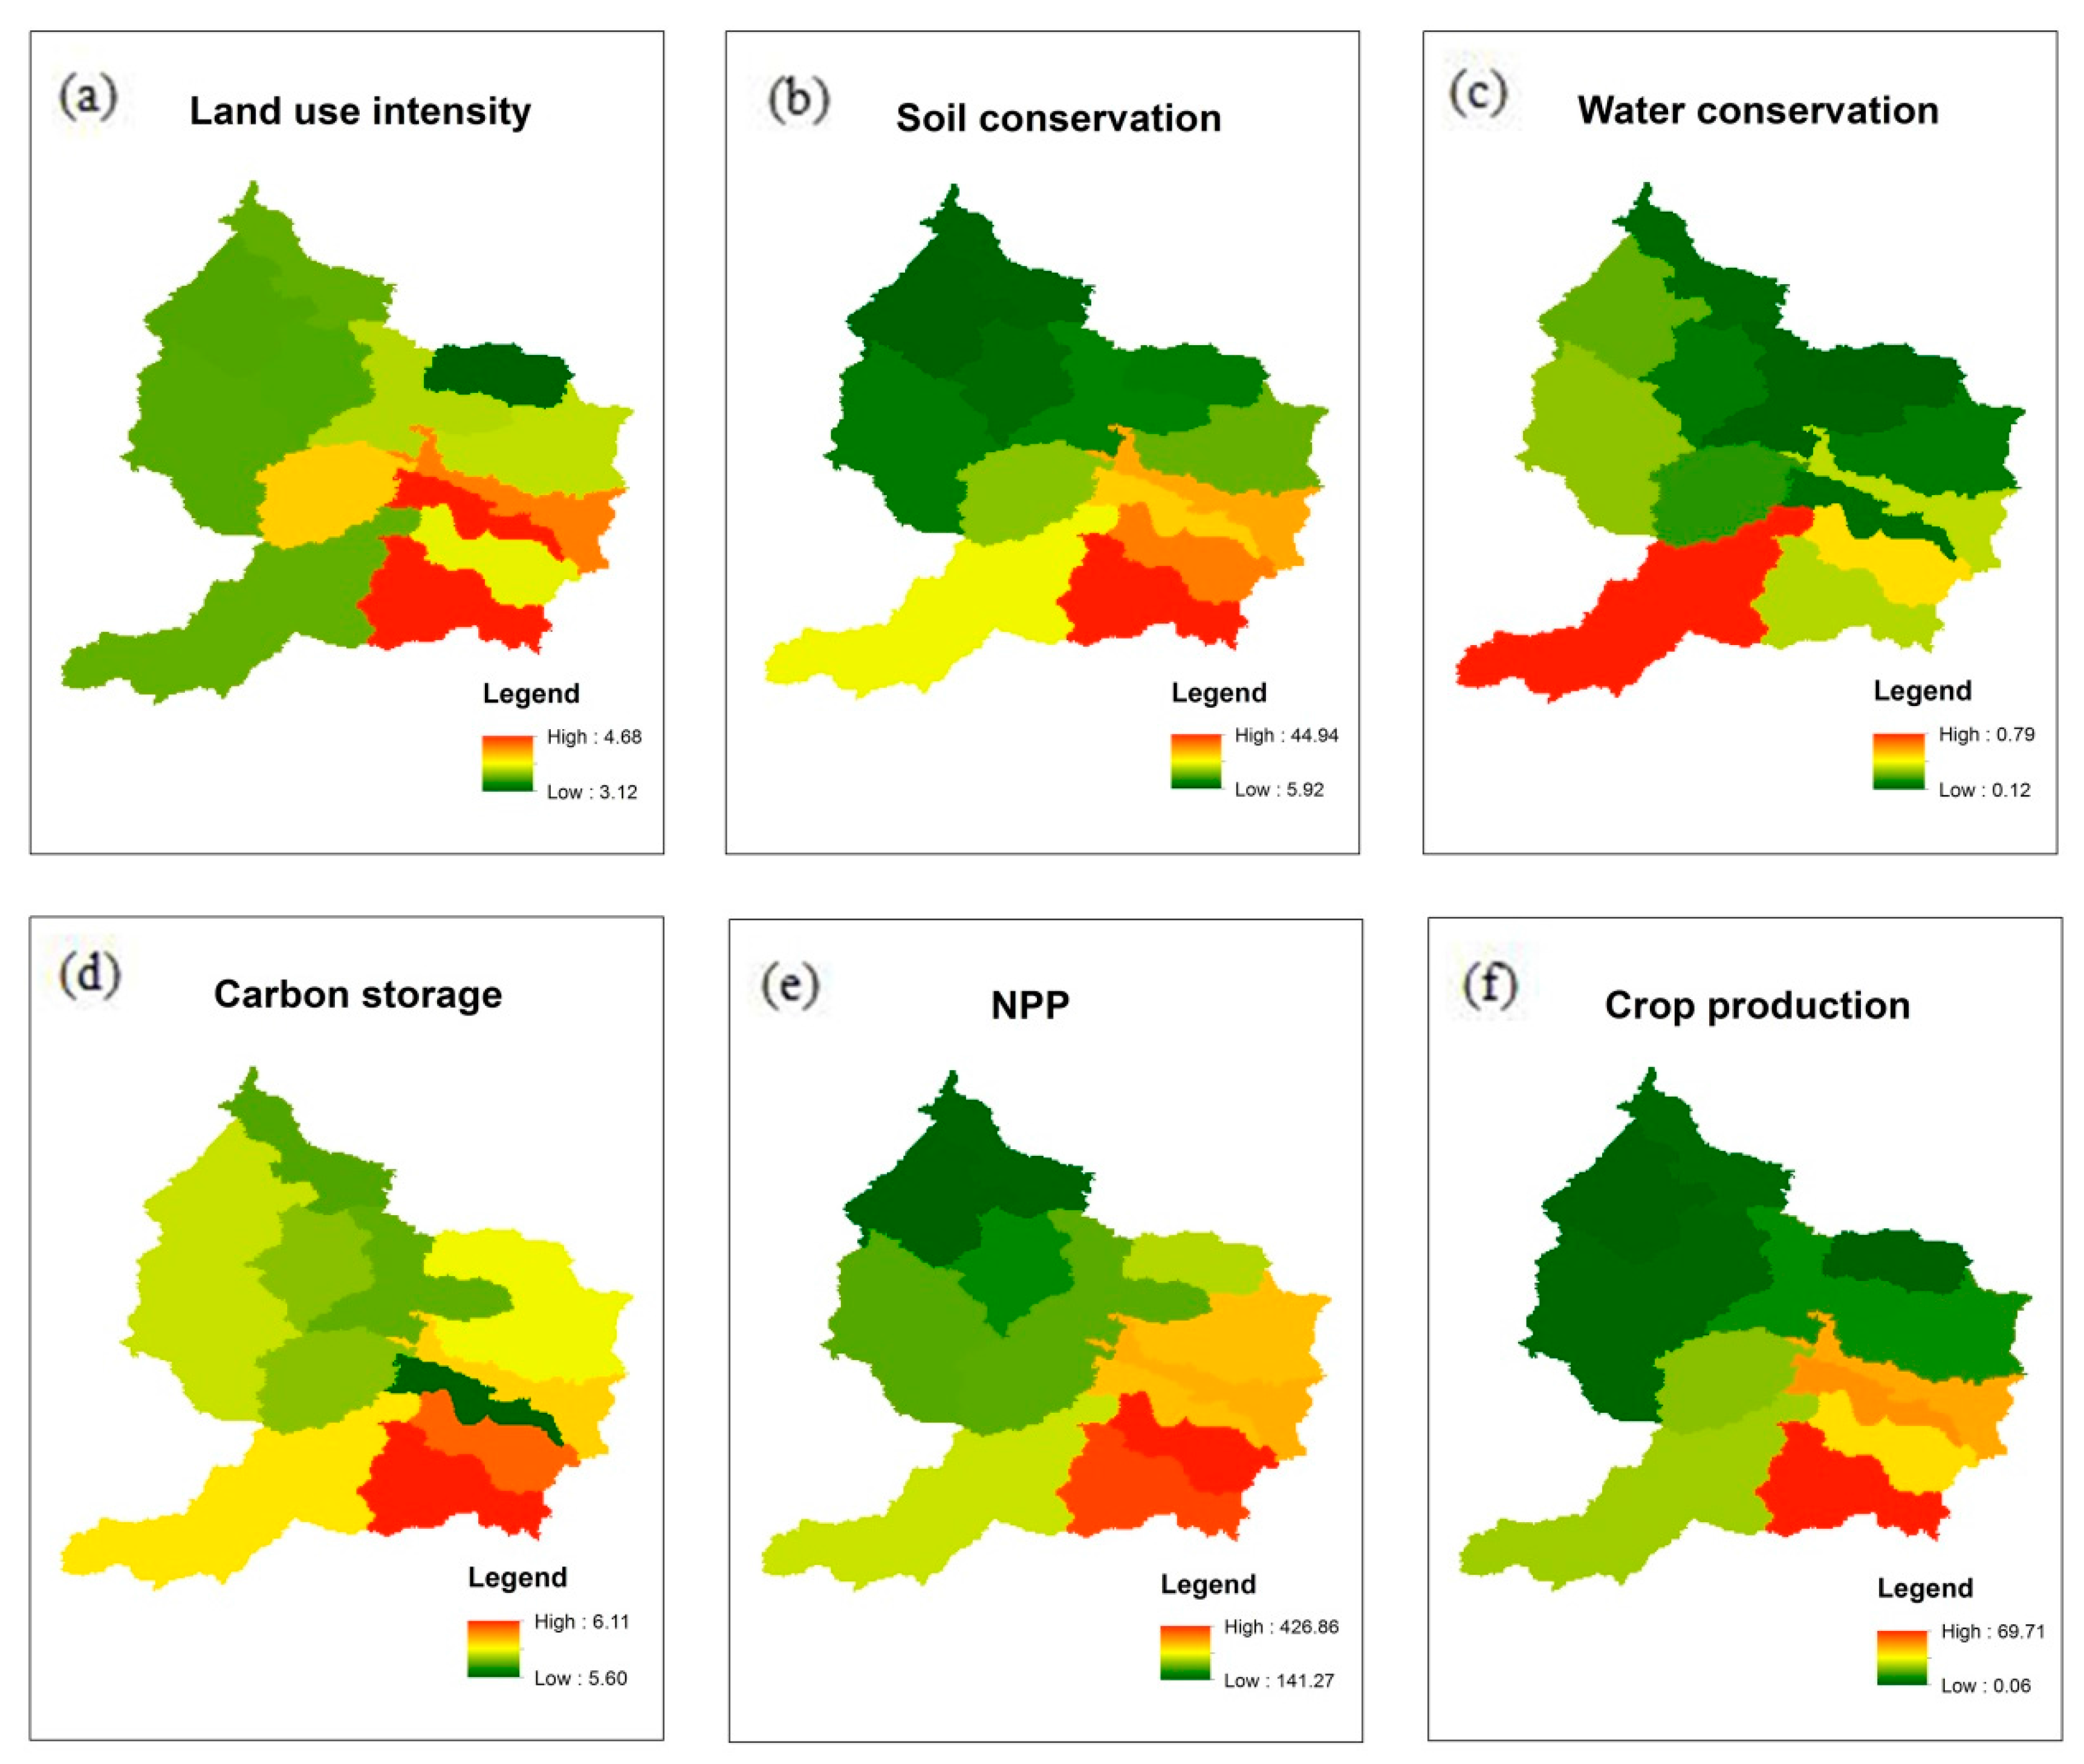
4.1. Spatial Pattern of Ecosystem Services
4.2. Relationships between Ecosystem Services
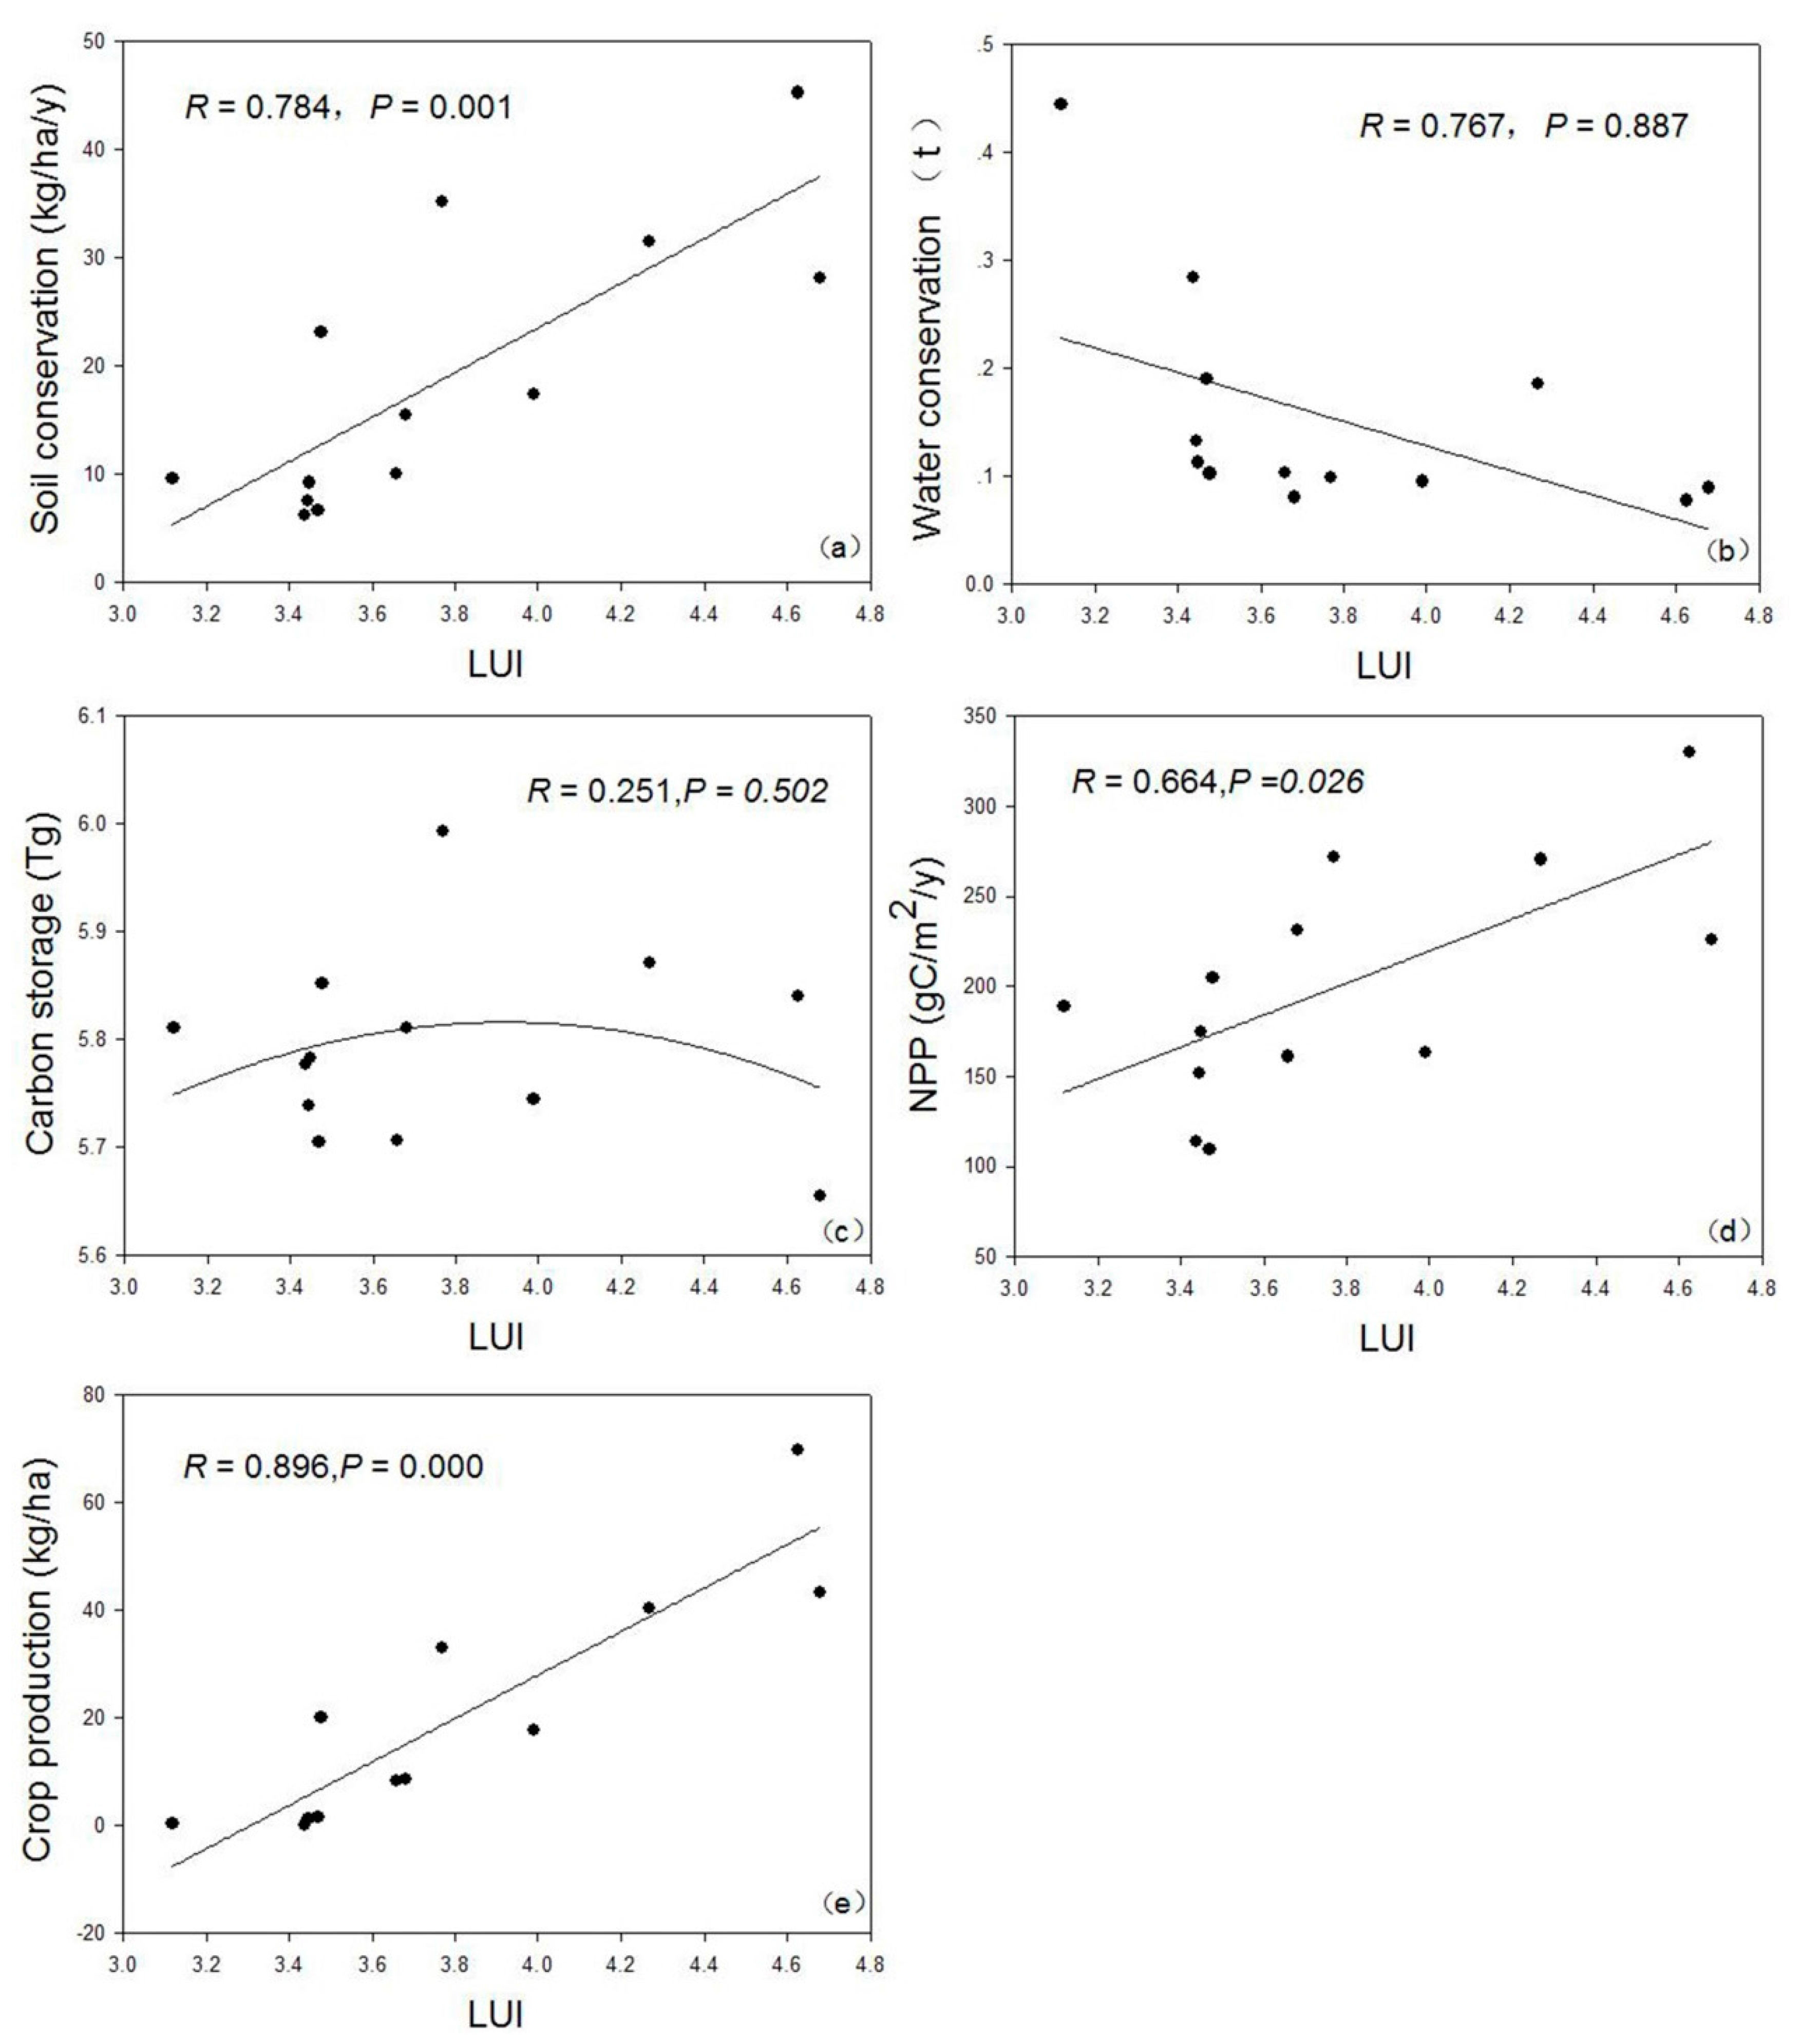
4.3. Impact of Land Use Intensity on Ecosystem Services
5. Discussion and Conclusions
5.1. The Relationships between Ecosystem Services Primarily Include Trade-Offs and Synergies
5.2. The Impact of Human Activities on Ecosystem Services Is Not Simply Linear
5.3. Recommendations for Regional Land Use
Acknowledgments
Author Contributions
Conflicts of Interest
References
- Hooper, D.U.; Chapin, F.S.; Ewel, J.J.; Hector, A.; Inchausti, P.; Lavorel, S.; Lawton, J.H.; Lodge, D.M.; Loreau, M.; Naeem, S.; et al. Effects of biodiversity on ecosystem functioning: A consensus of current knowledge. Ecol. Monogr. 2005, 75, 3–35. [Google Scholar] [CrossRef]
- Millennium Ecosystem Assessment. Ecosystems and Human Well-Being; Island Press: Washington, DC, USA, 2005. [Google Scholar]
- Raudsepp-Hearne, C.; Peterson, G.D.; Bennett, E.M. Ecosystem service bundles for analyzing tradeoffs in diverse landscapes. Proc. Natl. Acad. Sci. USA 2010, 107, 5242–5247. [Google Scholar] [CrossRef] [PubMed]
- Lavorel, S.; Grigulis, K.; Lamarque, P.; Colace, M.-P.; Garden, D.; Girel, J.; Pellet, G.; Douzet, R. Using plant functional traits to understand the landscape distribution of multiple ecosystem services. J. Ecol. 2011, 99, 135–147. [Google Scholar] [CrossRef]
- Pergams, O.R.W.; Zaradic, P.A. Evidence for a fundamental and pervasive shift away from nature-based recreation. Proc. Natl. Acad. Sci. USA 2008, 105, 2295–2300. [Google Scholar] [CrossRef] [PubMed]
- Van Jaarsveld, A.S.; Biggs, R.; Scholes, R.J.; Bohensky, E.; Reyers, B.; Lynam, T.; Musvoto, C.; Fabricius, C. Measuring conditions and trends in ecosystem services at multiple scales: The southern African millennium ecosystem assessment (safma) experience. Philos. Trans. R. Soc. B Biol. Sci. 2005, 360, 425–441. [Google Scholar] [CrossRef] [PubMed]
- Lester, S.E.; Costello, C.; Halpern, B.S.; Gaines, S.D.; White, C.; Barth, J.A. Evaluating tradeoffs among ecosystem services to inform marine spatial planning. Mar. Policy 2013, 38, 80–89. [Google Scholar] [CrossRef]
- Ma, F.; Eneji, A.E.; Liu, J. Understanding relationships among agro-ecosystem services based on emergy analysis in Luancheng county, north China. Sustainability 2014, 6, 8700–8719. [Google Scholar] [CrossRef]
- Rodriguez, J.P.; Beard, T.D., Jr.; Bennett, E.M.; Cumming, G.S.; Cork, S.J.; Agard, J.; Dobson, A.P.; Peterson, G.D. Trade-offs across space, time, and ecosystem services. Ecol. Soc. 2006, 11, 709–723. [Google Scholar] [CrossRef]
- Bennett, E.M.; Peterson, G.D.; Gordon, L.J. Understanding relationships among multiple ecosystem services. Ecol. Lett. 2009, 12, 1394–1404. [Google Scholar] [CrossRef] [PubMed]
- Mace, G.M.; Norris, K.; Fitter, A.H. Biodiversity and ecosystem services: A multilayered relationship. Trends Ecol. Evol. 2012, 27, 19–26. [Google Scholar] [CrossRef] [PubMed]
- Grasso, M. Ecological-economic model for optimal mangrove trade off between forestry and fishery production: Comparing a dynamic optimization and a simulation model. Ecol. Model. 1998, 112, 131–150. [Google Scholar] [CrossRef]
- Aillery, M.; Shoemaker, R.; Caswell, M. Agriculture and ecosystem restoration in south florida: Assessing trade-offs from water-retention development in the everglades agricultural area. Am. J. Agric. Econ. 2001, 83, 183–195. [Google Scholar] [CrossRef]
- Egoh, B.; Reyers, B.; Rouget, M.; Bode, M.; Richardson, D.M. Spatial congruence between biodiversity and ecosystem services in south Africa. Biol. Conserv. 2009, 142, 553–562. [Google Scholar] [CrossRef]
- Bennett, E.M.; Balvanera, P. The future of production systems in a globalized world. Front. Ecol. Environ. 2007, 5, 191–198. [Google Scholar] [CrossRef]
- Carpenter, S.R.; Mooney, H.A.; Agard, J.; Capistrano, D.; DeFries, R.S.; Diaz, S.; Dietz, T.; Duraiappah, A.K.; Oteng-Yeboah, A.; Pereira, H.M.; et al. Science for managing ecosystem services: Beyond the millennium ecosystem assessment. Proc. Natl. Acad. Sci. USA 2009, 106, 1305–1312. [Google Scholar] [CrossRef] [PubMed]
- Mooney, H.A.; Duraiappah, A.; Larigauderie, A. Evolution of natural and social science interactions in global change research programs. Proc. Natl. Acad. Sci. USA 2013, 110, 3665–3672. [Google Scholar] [CrossRef] [PubMed]
- Haberl, H.; Wackernagel, M.; Wrbka, T. Land use and sustainability indicators. An introduction. Land Use Policy 2004, 21, 193–198. [Google Scholar] [CrossRef]
- Allan, E.; Manning, P.; Alt, F.; Binkenstein, J.; Blaser, S.; Bluethgen, N.; Boehm, S.; Grassein, F.; Hoelzel, N.; Klaus, V.H.; et al. Land use intensification alters ecosystem multifunctionality via loss of biodiversity and changes to functional composition. Ecol. Lett. 2015, 18, 834–843. [Google Scholar] [CrossRef] [PubMed]
- Rivieccio, R.; Sallustio, L.; Paolanti, M.; Vizzarri, M.; Marchetti, M. Where land use changes occur: Using soil features to understand the economic trends in agricultural lands. Sustainability 2017, 9, 78. [Google Scholar] [CrossRef]
- Felipe-Lucia, M.R.; Comin, F.A.; Bennett, E.M. Interactions among ecosystem services across land uses in a floodplain agroecosystem. Ecol. Soc. 2014, 19, 360–375. [Google Scholar] [CrossRef]
- Kindu, M.; Schneider, T.; Teketay, D.; Knoke, T. Changes of ecosystem service values in response to land use/land cover dynamics in munessa-shashemene landscape of the Ethiopian highlands. Sci. Total Environ. 2016, 547, 137–147. [Google Scholar] [CrossRef] [PubMed]
- Liiri, M.; Häsä, M.; E Haimi, J.; Setälä, H. History of land-use intensity can modify the relationship between functional complexity of the soil fauna and soil ecosystem services—A microcosm study. Appl. Soil Ecol. 2012, 55, 53–61. [Google Scholar] [CrossRef]
- Niemela, J.; Saarela, S.-R.; Soderman, T.; Kopperoinen, L.; Yli-Pelkonen, V.; Vare, S.; Kotze, D.J. Using the ecosystem services approach for better planning and conservation of urban green spaces: A finland case study. Biodivers. Conserv. 2010, 19, 3225–3243. [Google Scholar] [CrossRef]
- Xu, Y.; Tang, H.; Wang, B.; Chen, J. Effects of land-use intensity on ecosystem services and human well-being: A case study in Huailai county, China. Environ. Earth Sci. 2016, 75, 1–11. [Google Scholar] [CrossRef]
- Chang, X.-H.; Zhao, G.-C.; Yang, Y.-S.; Feng, M.; Ma, S.-K.; Wang, D.-M.; Bi, Y.-Q.; Yang, S.-R. Effects of tillage mode and nitrogen application rate on nitrogen use efficiency of wheat in a farming-pasture zone of north China. Yingyong Shengtai Xuebao 2013, 24, 995–1000. (In Chinese) [Google Scholar] [PubMed]
- Zhang, J.-P.; Chang, X.-L.; Li, J.-Y.; Cai, M.-Y. Regional difference of land use/cover change in farming-pasturing zone of naiman banner in Inner Mongolia. Yingyong Shengtai Xuebao 2008, 19, 613–620. (In Chinese) [Google Scholar] [PubMed]
- Ren, Y.; Lu, Y.; Fu, B. Quantifying the impacts of grassland restoration on biodiversity and ecosystem services in China: A meta-analysis. Ecol. Eng. 2016, 95, 542–550. [Google Scholar] [CrossRef]
- Wang, H.; Zhou, S.; Li, X.; Liu, H.; Chi, D.; Xu, K. The influence of climate change and human activities on ecosystem service value. Ecol. Eng. 2016, 87, 224–239. [Google Scholar] [CrossRef]
- Zhang, X.; Niu, J.; Buyantuev, A.; Zhang, Q.; Dong, J.; Kang, S.; Zhang, J. Understanding grassland degradation and restoration from the perspective of ecosystem services: A case study of the Xilin river basin in Inner Mongolia, china. Sustainability 2016, 8, 594. [Google Scholar] [CrossRef]
- Brown, M.T.; Vivas, M.B. Landscape development intensity index. Environ. Monit. Assess. 2005, 101, 289–309. [Google Scholar] [CrossRef] [PubMed]
- Cohen, M.J.; Carstenn, S.; Lane, C.R. Floristic quality indices for biotic assessment of depressional marsh condition in Florida. Ecol. Appl. 2004, 14, 784–794. [Google Scholar] [CrossRef]
- Mack, J.J. Landscape as a predictor of wetland condition: An evaluation of the landscape development index (ldi) with a large reference wetland dataset from Ohio. Environ. Monit. Assess. 2006, 120, 221–241. [Google Scholar] [CrossRef] [PubMed]
- Margriter, S.C.; Bruland, G.L.; Kudray, G.M.; Lepczyk, C.A. Using indicators of land-use development intensity to assess the condition of coastal wetlands in Hawaii. Landsc. Ecol. 2014, 29, 517–528. [Google Scholar] [CrossRef]
- Odum, H.T. Environmental Accounting: Emergy and Environmental Decision Making; Wiley: Maitland, FL, USA, 1996. [Google Scholar]
- Potter, C.S.; Randerson, J.T.; Field, C.B.; Matson, P.A.; Vitousek, P.M.; Mooney, H.A.; Klooster, S.A. Terrestrial ecosystem production: A process model based on global satellite and surface data. Glob. Biogeochem. Cycles 1993, 7, 811–841. [Google Scholar] [CrossRef]
- Wischmeier, W.H.; Smith, D.D. Predicting Rainfall-Erosion Losses from Cropland East of the Rocky Mountains; U.S. Government Printing Office: Washington, DC, USA, 1965.
- Kareiva, P.; Tallis, H.; Ricketts, T.H.; Daily, G.C.; Polasky, S. Natural Capital: Theory and Practice of Mapping Ecosystem Services; Oxford University Press: London, UK, 2011. [Google Scholar]
- Leslie, H. M. Natural capital theory and practice of mapping ecosystem services. Science 2011, 332, 1264–1265. [Google Scholar] [CrossRef]
- Tao, Y.; Li, F.; Liu, X.; Zhao, D.; Sun, X.; Xu, L. Variation in ecosystem services across an urbanization gradient: A study of terrestrial carbon stocks from Changzhou, China. Ecol. Model. 2015, 318, 210–216. [Google Scholar] [CrossRef]
- Chisholm, R.A. Trade-offs between ecosystem services: Water and carbon in a biodiversity hotspot. Ecol. Econ. 2010, 69, 1973–1987. [Google Scholar] [CrossRef]
- Ponsioen, T.C.; Blonk, T.J. Calculating land use change in carbon footprints of agricultural products as an impact of current land use. J. Clean. Prod. 2012, 28, 120–126. [Google Scholar] [CrossRef]
- Nelson, E.; Mendoza, G.; Regetz, J.; Polasky, S.; Tallis, H.; Cameron, D.R.; Chan, K.M.A.; Daily, G.C.; Goldstein, J.; Kareiva, P.M.; et al. Modeling multiple ecosystem services, biodiversity conservation, commodity production, and tradeoffs at landscape scales. Front. Ecol. Environ. 2009, 7, 4–11. [Google Scholar] [CrossRef]
- Borjesson, P.; Tufvesson, L.M. Agricultural crop-based biofuels—Resource efficiency and environmental performance including direct land use changes. J. Clean. Prod. 2011, 19, 108–120. [Google Scholar] [CrossRef]
- Farber, S.C.; Costanza, R.; Wilson, M.A. Economic and ecological concepts for valuing ecosystem services. Ecol. Econ. 2002, 41, 375–392. [Google Scholar] [CrossRef]
- Sitas, N.; Prozesky, H.E.; Esler, K.J.; Reyers, B. Exploring the gap between ecosystem service research and management in development planning. Sustainability 2014, 6, 3802–3824. [Google Scholar] [CrossRef]


| Land-Use Category | Cropland | Forestry | Bush | Grassland | River | Residential Area | Road |
|---|---|---|---|---|---|---|---|
| LDI coefficient | 7.00 | 1.00 | 2.20 | 3.41 | 1.00 | 6.90 | 7.81 |
| Soil Conservation | Water Conservation | Carbon Storage | NPP | Crop Production | |
|---|---|---|---|---|---|
| Soil conservation | 1 | ||||
| Water conservation | −0.416 | 1 | |||
| Carbon storage | 0.529 | 0.010 | 1 | ||
| NPP | 0.926 ** | −0.335 | 0.593 * | 1 | |
| Crop production | 0.964 ** | −0.423 | 0.306 | 0.864 ** | 1 |
© 2017 by the authors. Licensee MDPI, Basel, Switzerland. This article is an open access article distributed under the terms and conditions of the Creative Commons Attribution (CC BY) license (http://creativecommons.org/licenses/by/4.0/).
Share and Cite
Li, Q.; Zhang, X.; Liu, Q.; Liu, Y.; Ding, Y.; Zhang, Q. Impact of Land Use Intensity on Ecosystem Services: An Example from the Agro-Pastoral Ecotone of Central Inner Mongolia. Sustainability 2017, 9, 1030. https://0-doi-org.brum.beds.ac.uk/10.3390/su9061030
Li Q, Zhang X, Liu Q, Liu Y, Ding Y, Zhang Q. Impact of Land Use Intensity on Ecosystem Services: An Example from the Agro-Pastoral Ecotone of Central Inner Mongolia. Sustainability. 2017; 9(6):1030. https://0-doi-org.brum.beds.ac.uk/10.3390/su9061030
Chicago/Turabian StyleLi, Qian, Xuefeng Zhang, Qingfu Liu, Yang Liu, Yong Ding, and Qing Zhang. 2017. "Impact of Land Use Intensity on Ecosystem Services: An Example from the Agro-Pastoral Ecotone of Central Inner Mongolia" Sustainability 9, no. 6: 1030. https://0-doi-org.brum.beds.ac.uk/10.3390/su9061030