Article

Reducing Global Warming Potential through Sustainable Intensification of Basmati Rice-Wheat Systems in India

1
International Maize and Wheat Improvement Centre (CIMMYT), NASC Complex, New Delhi 110012, India
2
Department of soil science, Chaudhary Charan Singh Haryana Agricultural University, Hisar 125004, India
3
International Maize and Wheat Improvement Centre (CIMMYT), Texoco 56237, Mexico
4
International Maize and Wheat Improvement Centre (CIMMYT), Central Soil Salinity Research Institute, Karnal 132001, India
*
Author to whom correspondence should be addressed.
Sustainability 2017, 9(6), 1044; https://0-doi-org.brum.beds.ac.uk/10.3390/su9061044
Submission received: 13 May 2017 / Revised: 12 June 2017 / Accepted: 12 June 2017 / Published: 21 June 2017
(This article belongs to the Special Issue Soil Science in Conservation Agricultural Systems)

Abstract

:
This study examines the effects of tillage, residue management and cropping system intensification through the inclusion of green gram on the performance of the rice-wheat (RW) system in NW India. We hypothesized that zero tillage (ZT) with residue retention provides a means of sustainably intensifying the RW system through lower production costs and higher economic profitability, whilst at the same time minimizing soil and environmental trade-offs. To test this hypothesis, we evaluated six combinations of tillage, residue management and green gram integration in RW rotation in northwest Indo-Gangetic Plains (IGP) of India. Treatments included in the study were: rice and wheat under conventional tillage (CT) with and without green gram (CTR-CTW, CTR-CTW+GG), both crops under zero-tillage (ZT) with and without green gram (ZTR-ZTW-R, ZTR-ZTW-R+GG) and both crops under ZT plus residues with and without green gram (ZTR-ZTW+R, ZTR-ZTW+R+GG). Based on two consecutive years of data, the net return from the RW system was significantly higher in the ZT than CT systems. Methane emissions were only observed under flooded conditions in CT rice plots; otherwise, emissions were negligible in all other treatment combinations. N2O emissions were dictated by N fertilizer application with no other treatment effects. Overall, ZT with residue retention resulted in the lowest global warming potential (GWP) ranging from −3301 to −823 kg CO2-eq ha−1 year−1 compared to 4113 to 7917 kg CO2-eq ha−1 year−1 in other treatments. Operational inputs (tillage, planting, and irrigation) and soil C sequestration had significant effects on total GWP. The water footprint of RW production system was about 29% less in CA-based system compared to CT-based systems. Our study concludes that ZTR-ZTW+R and ZTR-ZTW+R+GG in RW systems of northwestern IGP have the potential to be agronomically productive, economically viable with benefits also for the environment in terms of soil health and GHG emissions.

1. Introduction

In India, scented rice (Oryza sativa L.) locally known as Basmati enjoys privileged treatment both in domestic and international markets, fetching two to three times higher price than regular coarse grain varieties. Basmati rice is an important source of foreign exchange in India as it is exported to other countries. In 2013–2014, India exported 3.75 million tonne of Basmati rice equivalent to about 5000 million USD [1]. About 60% of total Basmati produced in India is grown in the state of Haryana [2]. In northwest Indo-Gangetic Plains (IGP) including Haryana, Basmati rice is grown in rotation with wheat (Triticum aestivum L.). In rice-wheat (RW) system, rice is grown during summer season from July to November followed by wheat during winter season from November to April keeping the land fallow between wheat harvest and rice planting.
Conventionally, farmers transplant rice seedlings after puddling the soil (intensive wet tillage) and keep the field continuously flooded for 30–40 days after transplanting. Although puddling is good for initial crop establishment, weed control and reducing percolation loss of water; it requires large amount of water, energy and labor, which are gradually becoming scarce and more expensive. Further, puddling for rice in RW system adversely affects the productivity of succeeding wheat because of poor rooting due to sub-soil compaction and poor aggregation and differential edaphic requirement for wheat compared to rice [3,4]. Basmati is a long duration rice and matures late in November. Under the conventional system, repeated tillage requirement to prepare the land after the harvest of rice substantially delays planting of the wheat crop. Late planted wheat matures late in April often coinciding with high temperatures. High temperature during wheat maturity shortens the duration of grain filling [5] and also slows photosynthesis and the rate of grain-filling [6], all leading to smaller grain size and lower yields, commonly known as the “terminal heat effect”. Yield loss of 15–60 kg ha−1 day−1 was reported if wheat planting is delayed beyond mid-November [7]. Further, repeated tillage operation under conventional systems increases cost of cultivation leading to decreased profitability [8] and also emits huge amounts of greenhouse gases (GHGs) into the atmosphere.
Recently, sustainable intensification based on the principle of conservation agriculture (CA), i.e., minimum soil disturbance and permanent soil cover combined with appropriate crop rotation, has emerged as an important management strategy to address many of the above-mentioned challenges confronting intensive RW system in NW India. Zero-tillage (ZT) has been widely adopted by farmers in wheat production, primarily to facilitate early planting and to lower the production cost [9,10,11]. Efforts are under way to bring both rice and wheat under ZT and to retain appropriate amounts of the previous crop residues in order to realize the full benefits of CA. Introduction of short duration legumes like green gram which are advocated to break the monotony of continuous cereal-cereal system could intensify and also contribute to the sustainability of RW system in IGP. However, moving from conventional tilled transplanted rice to direct seeding of rice will have reduced the window for green gram (between harvest of wheat and seeding of rice) by 20 days and hence discouraged the intensification process. Therefore, possibility of relay planting of green gram in standing wheat could provide an opportunity for sustainable intensification under scented RW system under CA.
Transitioning to CA-based RW production influences various soil process affecting greenhouse gas (GHG) fluxes, namely emissions of methane (CH4) and nitrous oxide (N2O) as well as possible net fixation of carbon dioxide (CO2). Such changes in management practices may influence more than one gas at the same time by different mechanisms or sometimes their effects may be antagonistic. For example, Direct seeded rice (DSR) has the potential to decrease CH4 emission by up to 50% [12,13] but transition from puddled transplanted rice (PTR) to DSR influences the soil processes such as nitrification-denitrification affecting N2O emission. Further, the ensuing wheat crop in RW system requires well-drained soil conditions during which N2O is the major GHGs that is emitted in short-term pulses after fertilization, heavy rainfall and irrigation. Reduced CH4 emissions in CA-based RW system may be counterbalanced by increased emissions of N2O. A combination of ZT and residue retention in CA, on the other hand, can sequester atmospheric carbon into the soil and potentially contribute to reducing agriculture’s contribution to climate forcing through GHG emissions. Given the dynamics and inter-dependence of the three GHGs under different management systems, it is important that all three GHGs are measured at a system level in order to determine the overall global warming potential of the production system so as to quantify the mitigation co-benefits of CA based sustainable intensification in scented RW system.
Although many studies have published the effects of ZT and crop residue management on agronomic productivity and economic profitability, a holistic evaluation of CA-based RW system in general and scented RW system in particular in terms of area- and yield-scaled global warming potential (GWP) is still lacking. This information is essential given the increasing trend in adoption of CA in the region together with the promotion of CA as a climate smart agricultural practice [14]. Further, inclusion of green gram in CA-based RW system is a means of achieving sustainable intensification. The objective of this study was to determine the effects of tillage, residue management and cropping system intensification (through inclusion of green gram) on area- and yield-scaled global warming potential (GWP) together with system productivity and economic profitability. We hypothesized that ZT with residue retention lowers production costs, increases economic profitability and also minimizes environmental trade-offs and inclusion of green gram further provides a means of sustainably intensifying RW system in NW IGP.

2. Materials and Methods

2.1. Experimental Site

The experiment was conducted in Taraori village (N 29°48′35′′; E 76°55′16′′) in Karnal district of Haryana, India which is known as the heartland of Basmati rice. The experimental field was under continuous RW rotation for more than 15 years. The soil of the experimental site is clay loam in texture with medium organic carbon content (0.50% in upper 15 cm soil layer). Basic soil properties of the experimental site were determined at the start of the experimentation using standard protocols and are given in Table S1. The climate of the site is semi-arid subtropical, characterized by very hot summers and cold winters. Average annual rainfall in the area is about 700 mm, 75% of which is received during June to September.

2.2. Experimental Design and Treatments

Six cropping system treatments were completely randomized with three replications resulting into 18 experimental plots of 100 m2 each. The six treatments comprised of combinations of tillage and crop establishment (ZT vs. conventional tillage (CT)), residue management (retention vs. removal) and green gram (with and without). The treatments were: rice and wheat under conventional tillage (CT) with and without green gram (Vigna radiata L.) (i.e., CTR-CTW and CTR-CTW+GG); rice and wheat under ZT with and without green gram (i.e., ZTR-ZTW-R and ZTR-ZTW-R+GG); and rice and wheat under ZT plus residues with and without green gram (i.e., ZTR-ZTW+R and ZTR-ZTW+R+GG). The treatment combinations were designed to evaluate the effect of tillage and crop establishment, residue retention and legume integration in RW rotation. Details of tillage and crop establishment as well as residue management of the six treatments included in the study are presented in Table S2. The experiment was conducted for two consecutive crop years in 2011–2012 and 2012–2013.

2.3. Agronomic Management

2.3.1. Crop Establishment

In the case of CTR-CTW and CTR-CTW+GG, rice seedlings (var Pusa-1121) were raised using a seed rate of 10 kg ha−1 and 25-days old seedlings were transplanted manually in random geometry with about 30 seedlings m−2. In the wheat season, wheat seeds (var DPW 621-50) were broadcasted at the rate of 125 kg seed ha−1 in the field after land preparation (Table S2). In the ZTR-ZTW-R and ZTR-ZTW-R+GG, both rice and wheat were seeded using zero-till seed-cum fertilizer planter without any preparatory tillage, keeping row spacing of 20 cm. The seed rate was kept at 20 and 100 kg ha−1 for rice and wheat, respectively. In the cases of ZTR-ZTW+R and ZTR-ZTW+R+GG, both rice and wheat crops were seeded at 20 cm row spacing using “turbo-happy seeder” which is capable of directly drilling seed and fertilizer with previous crop residues on the surface [15]. Irrespective of the crops, the seeding depth in direct seeded systems was maintained at ~2 cm using depth control wheel of the planter. In the rotations involving green gram (i.e., CTR-CTW+GG, ZTR-ZTW-R+GG and ZTR-ZTW+R+GG), green gram seeds were broadcasted (seed rate 30 kg ha−1) under the standing wheat at its last irrigation (nearly 20 days before harvesting of wheat). Green gram was relay-sown with wheat so as to allow enough time for it to mature before establishment of next rice crop. In other treatments, the fields were left fallow between harvesting of the wheat and establishment of next rice in the system.

2.3.2. Weed Management

In ZT plots (ZTR-ZTW-R, ZTR-ZTW-R+GG, ZTR-ZTW+R, and ZTR-ZTW+R+GG), weeds prior to seeding of rice and wheat were killed by pre-plant application of glyphosate @1.25 kg a.i. ha−1 but no herbicides were applied in CT plots (CTR-CTW and CTR-CTW+GG) before seeding. To control the grassy weeds in rice, CT plots were sprayed with butoachlor (@1300 g a.i. ha−1) 2 days after transplanting, whereas ZT plots were sprayed with Topstar (@112 g a.i. ha−1) 2 days after sowing followed by spray application of nominee gold (Bispayriback sodium) @ 250 mL a.i. ha−1 at 22–25 days after sowing. Post emergence weeds in wheat were controlled by spray application of Total (metsulfuran methyl 75% + Sulfosulfuran) @ 1250 mL a.i. ha−1.

2.3.3. Water Management

Study plots received water by means of flood irrigation from an irrigation channel running through the middle of the experimental field. Water movement between plots was controlled by permanent bunds. During rice cycle, CT plots were kept continuously flooded (about 5 cm standing water) for the initial two weeks and thereafter irrigation was scheduled at the appearance of hairline (small) cracks on the surface. The farmers in the study area commonly use the appearance of hairline cracks at the soil surface as an indicator to initiate irrigation. In ZT plots, first irrigation (5–7 cm) was applied immediately after seeding. The second irrigation was given a week after seeding and subsequent irrigation was applied at the appearance of hairline cracks on the soil surface. In rice season, all CT plots received 24 and 26 irrigations, whereas all ZT plots received 12 and 14 irrigations, respectively, in 2011 and 2012. This was because appearance of hairline cracks is less frequent in undisturbed field. Puddling of the field creates an impermeable layer and standing water is prone to evaporative loss and therefore appearance of hairline cracks is more frequent in CT plots. During the wheat cycle, all ZT plots were seeded utilizing residual moisture after rice harvest, whereas pre-sowing irrigation was given in CT plots. After seeding, wheat received four irrigations (6–7 cm each) at 20–25, 40–50, 75–80 and 95–100 days after sowing irrespective of the treatment in both the years.

2.3.4. Nutrient Management

Crops were fertilized according to the nutrient prescription of Haryana Agricultural University, i.e., 90:60:60 and 150:60:60 kg N: P2O5: K2O ha−1 for Basmati rice and wheat, respectively. Total amount P2O5 and K2O and small portion of N (26% in rice and 15% in wheat) was applied as basal dose using di-ammonium phosphate and muriate of potash at the time of seeding/transplanting. Irrespective of the crops, basal fertilizer was broadcasted in all CT plots and drilled at the time of seeding in all ZT plots. The remaining amount of N was applied by broadcasting urea in two equal splits at 20–25 and 40–45 days after seeding/transplanting in rice and crown root initiation and maximum tillering stage in wheat. During the rice season, ZnSO4 @ 25 kg ha−1 and Sulfur as granular bentonite sulfur was also applied @ 20 kg ha−1 as basal application in all the plots irrespective of the treatments.

2.4. Data Recording

The data on crop management inputs such as number of tillage operations, fuel consumption, number of irrigations, herbicide, fertilizer, seed rate, pesticide application and their costs under each treatment were recorded for each crop using a standard data recording format. At maturity, crops were harvested manually from 20 m2 area in the center of the plot at least 0.5 m from the border. The harvested crops were sun-dried and threshed to determine grain and straw yield. Grain and straw yield of rice, wheat and green gram were reported at 14% moisture content.

2.5. CH4 and N2O Emission Measurement

CH4 and N2O emissions from the field were measured using manual closed chambers [16,17] consisting of a detachable base and upper part. The chamber bases were semi-permanently positioned in the field and only removed during field operations i.e., tillage, seeding or harvesting. In order to bring the system into equilibrium and eliminate the effects of soil disturbance on fluxes, chamber bases were placed back in the field soon after completion of the field operation or at least 24 h before gas sampling. The bases of the chambers were made of aluminum with an inner diameter of 43 cm. The top of the base had a circular channel to hold the upper part of the chamber which consisted of a locally fabricated plastic bucket. At the time of chamber deployment, the circular channel was filled with water to provide air-tight conditions. Chamber units were painted white with a reflective coating to minimize internal heating by solar radiation. Each chamber had a digital thermometer installed on the top for recording chamber temperature during GHG sampling which was taken into account during GHG flux calculation. The chamber was equipped with a battery-powered fan to ensure uniform mixing of air in the chamber headspace. The chamber had one sampling port fitted with a non-reactive rubber septum. At the time of sampling, all the vents and openings were sealed with adhesive to make the assembly airtight. The effective volume of the chamber headspace was corrected for plants present inside the chamber by estimating the volume biweekly. During the rice season, the water level inside the chamber was also measured to correct the effective volume of the chamber headspace.
Gas sampling commenced just before rice seeding in 2011 and continued for two years at one-week intervals. Besides this regular schedule, gas samples were also taken for five consecutive days after each event that is known to induce emissions such as fertilizer application, irrigation/rainfall and tillage operation. Gas samples from the chamber headspace were collected through a sampling port using a 50 mL polypropylene syringe with three-way leur lock and transferred immediately into pre-evacuated and labeled 30 mL vial. At each sampling, gas samples were collected 0, 10, 20 and 30 min after deployment of chambers. Gas samples were collected between 10:00 a.m. and 12:00 p.m. to reflect the daily average of the flux based on our diurnal variation study.
Collected samples were analyzed for N2O and CH4 using Gas Chromatograph (model: Bruker 450) equipped with flame ionization detector (FID, for CH4) and electron capture detector (ECD, for N2O) with temperature settings of 200 °C and 300 °C, respectively. The carrier gases used were Helium for FID, and Argon +5% methane for ECD both with a flow rate of 60 mL min−1. Concentrations of gases were calculated by comparing relative peak areas against the curves prepared from known concentration of standard gases (0.5, 1 and 10 ppm for N2O and 2, 5 and 10 ppm for CH4) obtained from Linde Specialty Gases, North America. To address the issue of GC drift, the GC was calibrated using these standards before running each batch of samples. Fluxes of CH4 and N2O were calculated by linear regression of gas concentration against time of sampling. All data were checked for linearity by visual inspection during data analysis. The N2O and CH4 fluxes of a given sampling day for each treatment were the averages of the three fluxes from the three replicated plots. The fluxes in between two sampling dates were estimated by linear interpolation assuming that emissions followed a linear trend during the period when no sample was taken. The gas fluxes of all days in the crop season were summed to calculate cumulative season fluxes. The fraction of applied N emitted as N2O-N was considered as N2O emission factor (EF) for fertilizer application as we did not have non-fertilized treatment to account for background emission.
To obtain the global warming potential (GWP) from emission, N2O and CH4 were converted into CO2 equivalents (CO2-eq) using 100-year time horizon factors of 310 for N2O and 21 for CH4 [18]. The seasonal cumulative CO2-eq of emission was divided by grain yield to obtain emission intensity i.e., yield-scaled emission [19].

2.6. Soil Sampling and Laboratory Analysis

Initial soil sampling was done by taking six random cores over the experimental area just before the start of the experiment in 2011. Soil samples were taken from different soil layers i.e., 0–5, 5–15 and 15–30 cm, with a 3.8 cm i.d. core sampler (Eijkelkamp, Giesbeek, Netherlands) and analyzed for basic soil properties including SOC. Soil sampling was done in 2013 after wheat harvest to determine the effect of treatments after two years of experimentation. At this time, three soil sub-samples were taken from each plot. The soil bulk density was calculated as the ratio between the oven-dried (105 °C for 24 h) weight and bulk volume of the soil. For SOC determination, the sub-samples were mixed thoroughly to create a bulk sample. Upon arrival in the laboratory, the soil samples were air-dried, ground and sieved with 2 mm mesh for subsequent analysis. Concentration of organic carbon was determined according to Walkley Black (1934). The weight of SOC in each layer was calculated using SOC concentration, soil bulk density and depth of soil sampled using Equation (1).
SOC   ( Mg   ha 1 ) = SOC   ( % ) × bulk   density   ( g   cm 3 ) × depth   ( cm )

2.7. Calculation of Net Global Warming Potential (GWP)

Net GWP for treatments was calculated taking into account changes in soil C (∆soil C GWP), GHG emissions from soil (soil N2O flux + soil CH4 flux), emission due to fuel use for farm operations (operation GHG flux) and emissions due to input use such as fertilizer and seeds (Input GHG flux) (Equation (2)) [20,21]. Yield-scaled GWP was calculated by dividing total emission with the grain yield.
Net GWP = ∆soil C GWP + soil N2O flux + soil CH4 flux + operation GHG flux + Input GHG flux
Changes in SOC in 0–30 cm soil layer were determined by subtracting SOC content in 2013 from initial SOC content for the same layer measured just before the start of experiment. The difference was then divided by number of years after the experiment was started to determine the carbon accumulated in the soil on a yearly basis. This reflects the difference between net C uptake by plants and losses of C from crop harvest and from the microbial oxidation or crop residues and soil organic matter. The emissions associated with agronomic inputs and farm operations were calculated by using the emission factors reported in West and Marland [22], and Lal [23] (see Table S3 for details).

2.8. Economic Analysis

The net returns from the production system were calculated over variable cost of production which includes human labor, tractor use, and the cost of production inputs such as tillage, planting, seed, fertilizer, and pesticide, irrigation, harvesting and threshing. The cost of human labor used was based on person-days per hectare for tillage, seeding, irrigation, fertilizer and pesticide application, weeding, harvesting and threshing of crops. The time (h) required to complete each field operation in each treatment was recorded and expressed as person-days per hectare, considering 8 h to be equivalent to 1 person-day. The cost of labor was calculated using the minimum wage rate as per the Indian Labour Law. Similarly, the time (h) required by a tractor-drawn machine/implement to complete a field operation such as tillage, seeding, and harvesting was recorded, and expressed as hours per hectare. The cost of field operations was calculated by using time required by the operation, diesel consumed per unit time and market price of diesel. The cost of irrigation was calculated by multiplying time required to irrigate a particular plot, electricity consumed by the pump per unit of time and the unit price of the electricity plus the cost of labor used for irrigation application. All these costs were summed up to calculate total variable cost (TVC) of production. The gross returns (GR) were calculated by multiplying the grain and straw yield of each crop with their respective market prices. The net returns (NR) were calculated as the difference between GR and total variable cost (TVC) (NR = GR − TVC). The system net returns were calculated by adding the net returns from rice, wheat and green gram (if present) grown within a year. All the economic data were converted into US$ using exchange rate at the time of selling of produce in respective seasons in both the years.

2.9. Data Analysis

Emission of CH4 and N2O was regressed on elapsed time i.e., 0, 10, 20, 30 min, using a linear model forced to pass through the origin. The cumulative emissions of CH4 and N2O over the cropping season were determined by linear interpolation of data points between each successive sampling events [24]. Yield, net return, GWP from various sources, net GWP and GWP per dollar net return were subjected to one-way Analysis of variance (ANOVA) for randomized block design using the CoStat Software [25]. Before conducting ANOVA, data were subjected to a test of normality and homogeneity of variance. The differences between treatment means were compared using a LSD test at p < 0.05. All figures were prepared by using SigmaPlot 11.0 (Systat Software, Inc., San Jose, CA, USA).
The effects of zero tillage on yield, economic profitability and GWP were obtained by deducting CTR-CTW values from that of ZTR-ZTW-R and CTR-CTW+GG values from that of ZTR-ZTW-R+GG. Residue effect on the variables in ZT systems was obtained by deducing the values of the treatments without residues from those with residues. Similarly, effect of legume in rotation was obtained as the difference between the treatments with and without green gram.

3. Results and Discussion

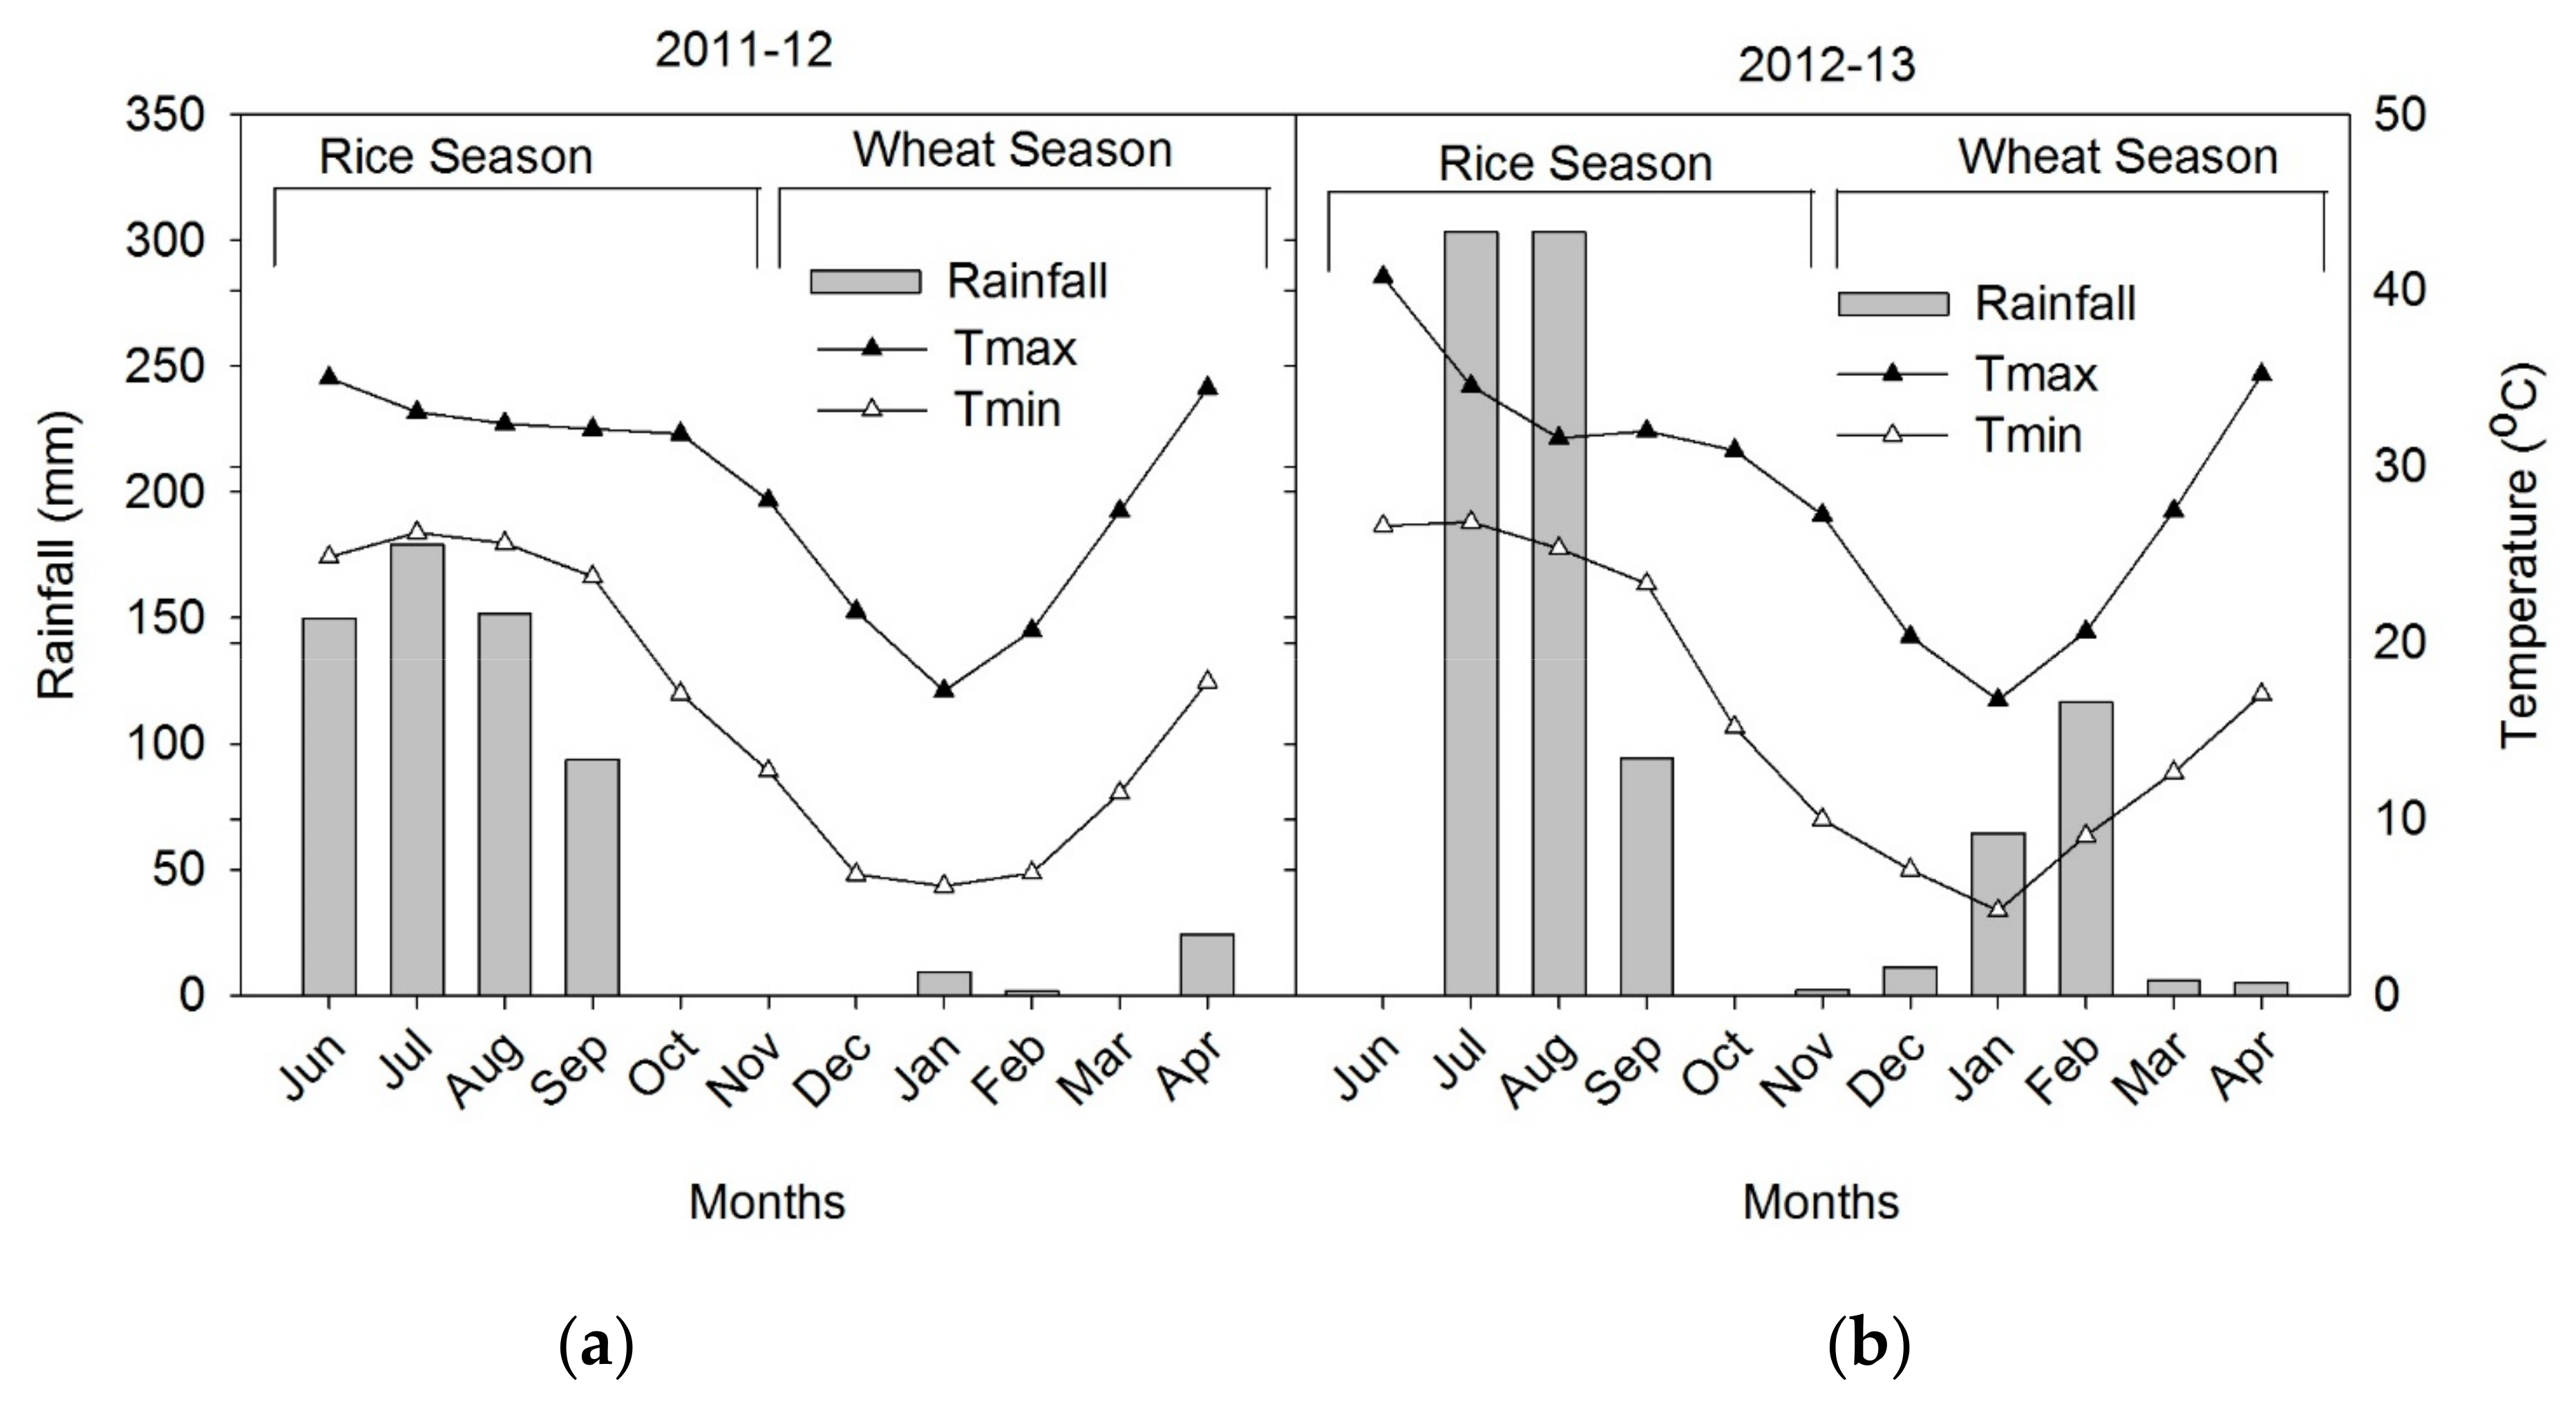
3.1. Weather during Experimental Period

Hot and humid weather is a typical characteristic of the rice growing season and prevailed throughout the cropping seasons during both years. During 2011 rice cycle, there was no rain after 19 September and the difference between the maximum and minimum temperature also increased thereafter (Figure 1). There was minimum to no rainfall during (a) 2011–2012 wheat season. During 2012 rice cycle, the weather was abnormal with delayed on-set of monsoon and torrential mid-season rains with long dry spells. The (b) 2012–2013 wheat season received several rain showers ensuring enough moisture availability during vegetative growth stage.

3.2. Rice, Wheat and System Productivity

Averaged over two years, treatment effects were significant on grain yield of rice but not wheat and on whole system grain yield (Table 1). In the rice cycle, CT-based treatments both with and without green gram (i.e., CTR-CTW and CTR-CTW+GG) yielded significantly higher than other treatments. Wheat yield was higher (though non-significant) in all ZT-based than CT-based treatments. Higher rice yields under puddled transplanted than direct-seeded systems during the initial year of establishment have also been reported by others [4,9,26]. Reasons for the higher rice yield in CT than ZT system might be better weed control, reduced percolation loss of water and nutrients, quick establishment of seedlings and improved nutrient availability [27,28]. However, puddling in the rice season causes compaction and poor aggregation of soil [3,9] resulting in poor rooting and establishment of the wheat crop in the system. Eliminating puddling in rice ensures better germination and root development in the subsequent wheat crop due to improved soil physical condition thereby increasing wheat yield. In ZT systems, residue retention increased both rice and wheat yield by about 0.15 Mg ha−1 season−1 thus giving about 0.29 Mg ha−1 year−1 more yield at the system level than without residues. Increased yield due to retention of crop residues can be attributed to: (a) conservation of soil moisture and nutrients; (b) improved soil water infiltration; (c) improved soil biological activities and nutrient cycling; (d) better weed control; (e) improved soil quality through increased soil organic matter concentration; and (f) regulation of soil temperature thereby minimizing high temperature effects during wheat maturity. The residue effect in this study was slightly smaller than the one (0.68 Mg ha−1 year−1) reported by [26] after seven years of CA-based RW system in eastern IGP, probably because the plots in this study were still under transition to CA. Addition of a GG in the rotation had no effect on rice and wheat yield but nominally increased overall system productivity (Table 1). If GG yield is converted into rice or wheat equivalent, then the gain on system yield with GG would be much higher.

3.3. Economic Profitability

Treatment effects on net return were significant at the system but not individual crop levels (Table 1). Although grain yield was significantly higher in CT- than in ZT-based rice, net profit from rice production was not significantly different between the treatments because higher yields in CTR were offset by lower costs of production in ZTR (data not shown). Although cost of herbicides and seeds were more in ZTR than in CTR, the latter incurred extra costs associated with tillage, raising seedlings and transplanting and the greater number of irrigations required. In the wheat season also, although ZT significantly lowered the cost of production compared with CT (data not shown), the net return was not different among the treatments. At the system level, all treatments with GG yielded significantly higher net returns than other treatments mainly because of the extra income derived from GG.

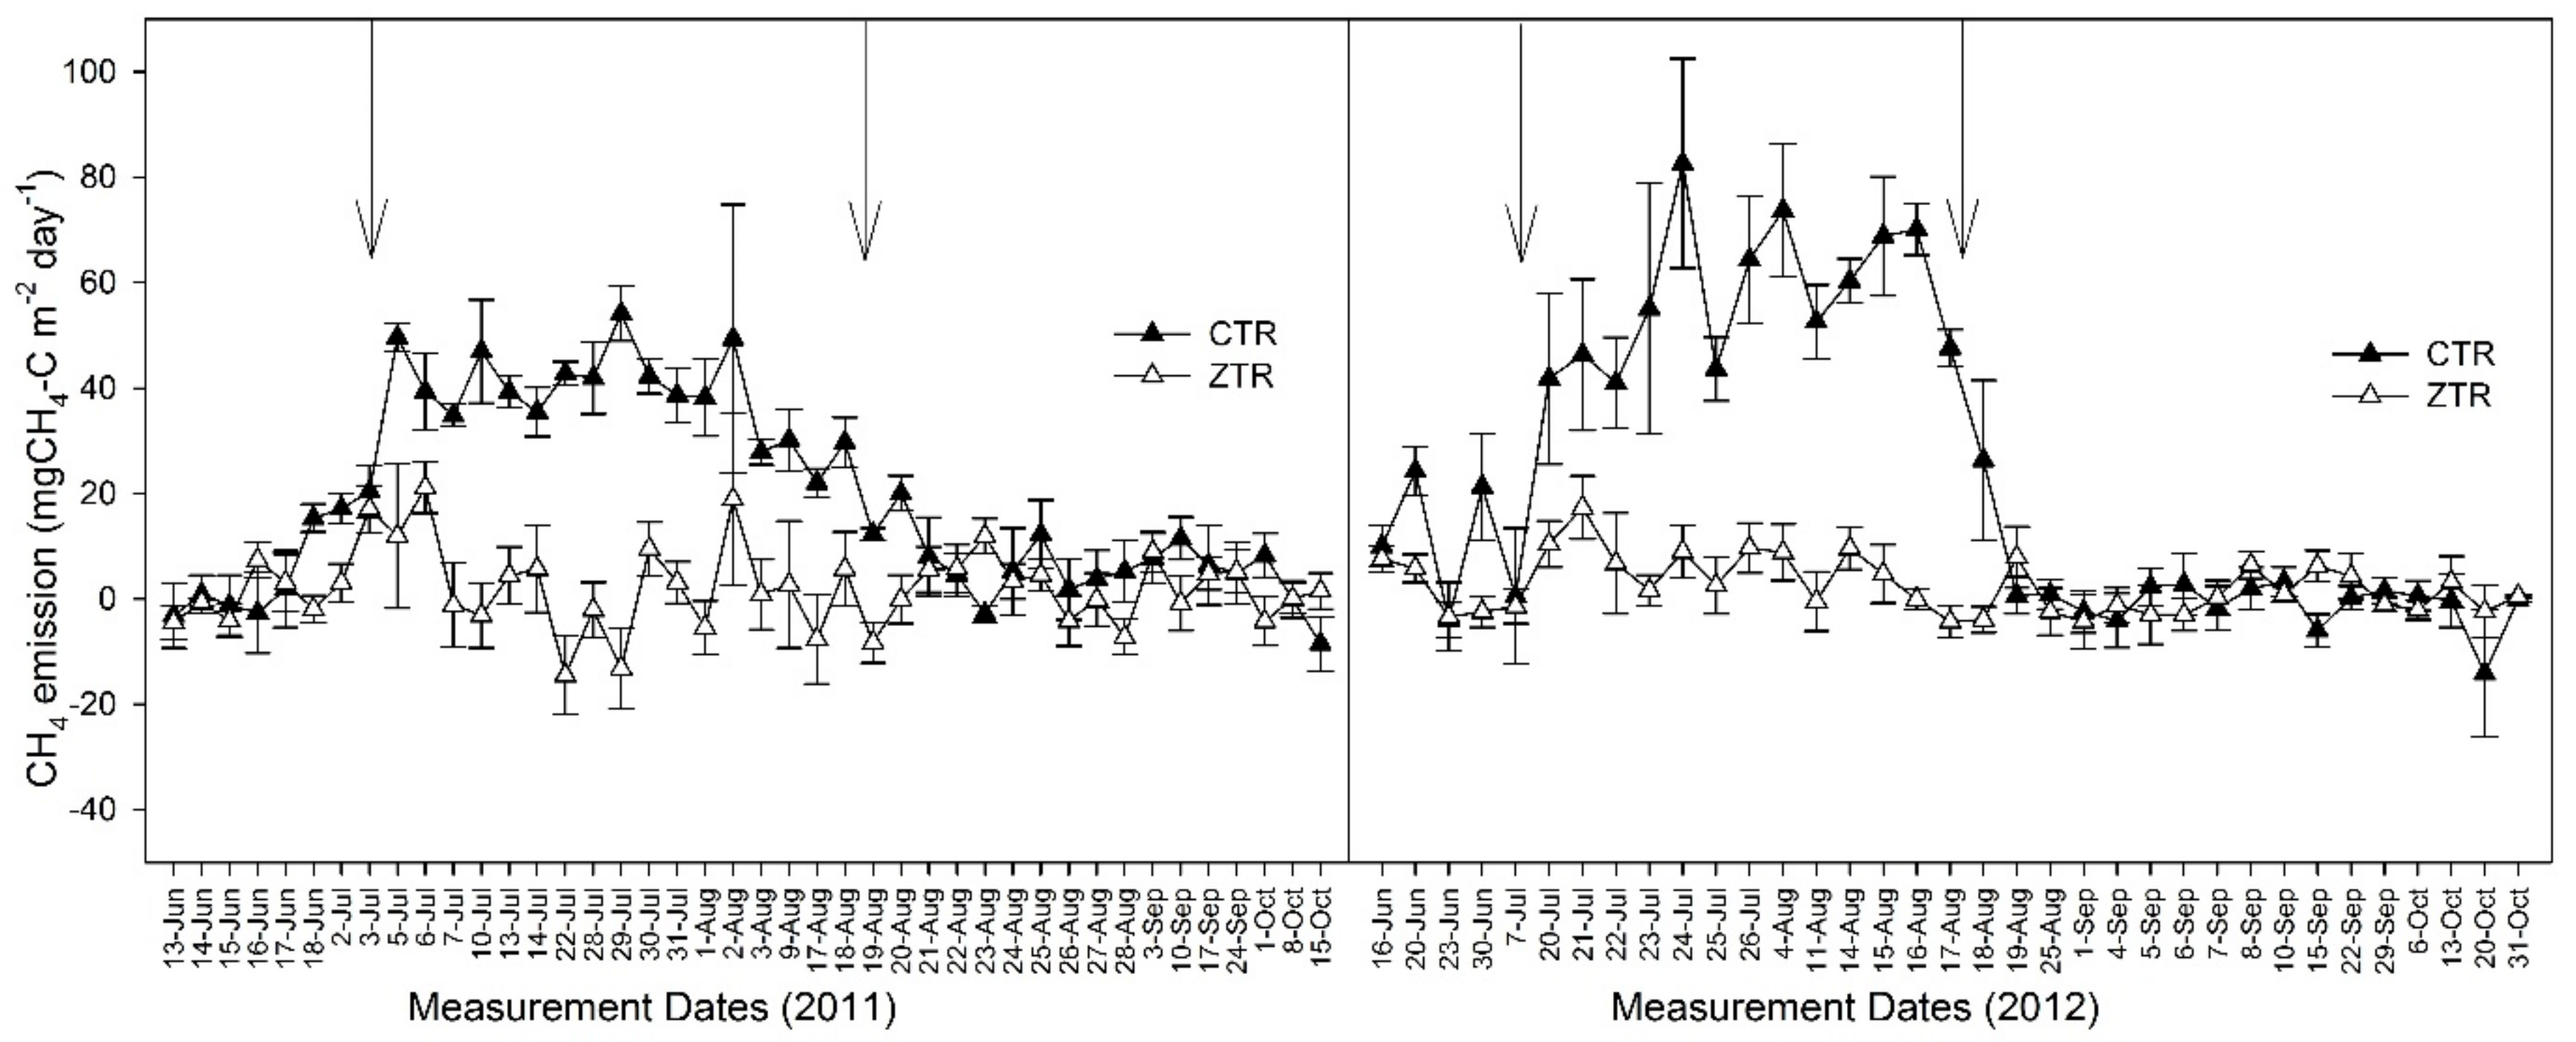
3.4. Methane Emissions

Methane emissions were only detected during the rice season in CTR treatments but not in wheat nor in any ZT treatments (Figure 2). For the sake of clarity, emissions of all CT plots were averaged and compared with the average of all ZT plots irrespective of residue and GG. In CTR treatments, CH4 emission peaks were dictated by irrigation water management with the peak CH4 emissions coinciding with continuous flooding of the field after transplanting in the CTR treatments (Figure 2). The rice field under puddled transplanted systems in our study were continuously flooded for the initial one month of transplanting (until 5 August in 2011 and 18 August in 2012) after which irrigation was scheduled with the appearance of small cracks (known as hairline cracks) in the field (see materials and method). There was a rapid decrease in CH4 flux after the cessation of flooding and CH4 emissions were not observed for the remainder of the rice season in both years, in agreement with previous studies [29,30]. With the cessation of flooding, the resulting aerobic conditions in the soil may have oxidized the CH4 which further dissolved in the soil solution [31].
Seasonal cumulative CH4 flux was significantly different among the treatments in both the years as emissions were only observed in the CT plots (Table 2). The magnitude of seasonal cumulative flux of CH4 from rice fields in our study was similar to that reported from north India [32,33] but four-fold smaller than those reported from Bangladesh [34] and China [19]. A number of factors such as duration of flooding, flood water depth, soil type, soil temperature, type and amount of fertilizer may be responsible for such differences. Although effects of these factors were not evaluated in this study, we believe that duration of flooding might have contributed mostly to these differences. In our study, the rice field was continuously flooded only for an initial one month (common practice in the region), whereas Ali et al. [34] and Zhou et al. [19] kept their rice field continuously flooded for most of the growing season and for initial 45 days, respectively. Retention of previous crop residues or inclusion of GG in the rotation had no effect on seasonal CH4 fluxes under ZT probably because the anaerobic conditions required for formation of CH4 did not exist under ZT. Methane is usually formed only after the soil redox potential (Eh) has been lowered to sufficiently negative values, typically less than −100 mV [35].

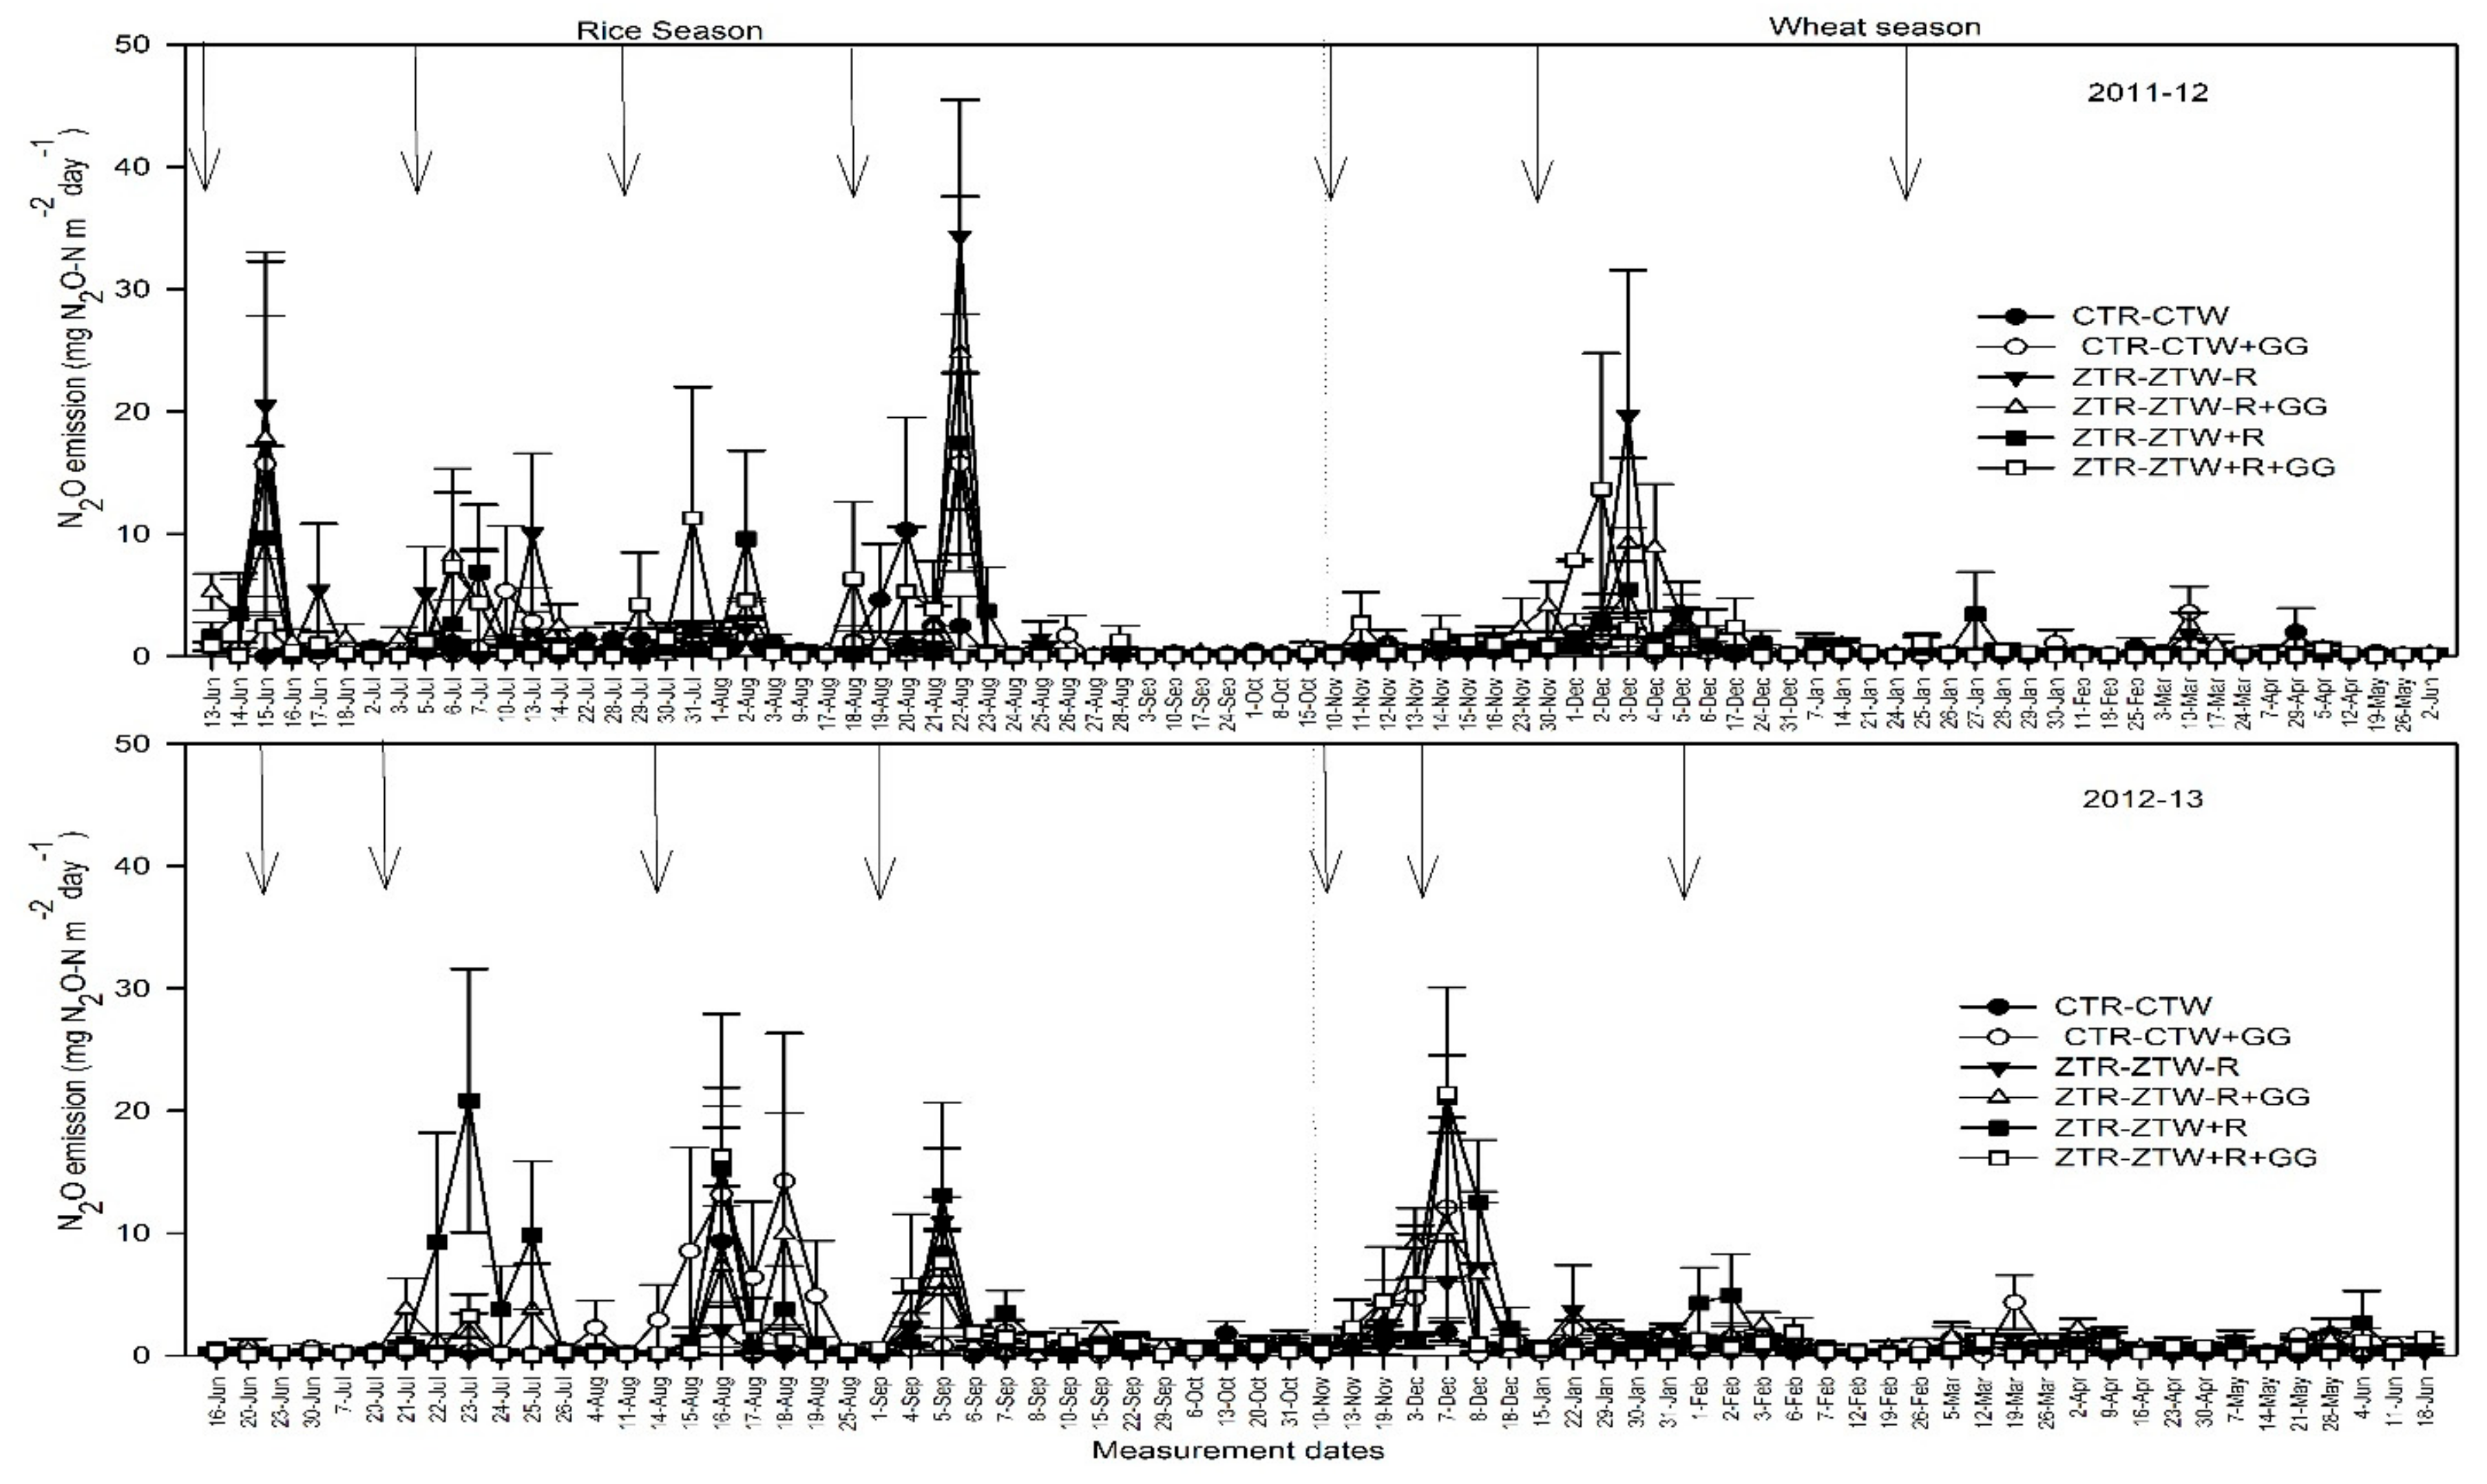
3.5. Nitrous Oxide Emissions

The seasonal trend in N2O emissions from both rice and wheat production were similar in all treatments for both the years irrespective of tillage, residue management and legume integration. In all treatments, N fertilizer application induced N2O emission in both crops in both years (Figure 3) consistent with Malla et al. [32] from loamy soil of northwest India. The trade-off relationship between CH4 and N2O emission as a result of water regime has been well documented [29,32] and as in previous findings, no N2O emissions were observed when the fields were continuously flooded in CT plots (Figure 3).
In ZT systems, N2O emissions were observed immediately after seeding probably induced by nitrification of ammonium formed by urea hydrolysis. The rice plots in these treatments were moist but no standing water was present except on the day of irrigation. Therefore, N2O emissions during the rice seasons depended strongly on whether or not the field was continuously waterlogged.
The treatment effect on seasonal flux of N2O was non-significant for both rice and wheat in both the years (Table 2). The magnitude of seasonal cumulative N2O emissions in our study were comparable to those reported from China [19] and Bangladesh [34] but it was higher than that reported from northern India [32]. As different factors (i.e., soil temperature, sources and amount of nitrogenous fertilizer, soil moisture and carbon sources) influence the N2O emissions in agroecosystems, it is difficult to speculate which factor(s) contributed most. It is, however, worth mentioning that Malla et al. [32] applied all N fertilizer through surface broadcast of urea which may have resulted in volatilization loss of NH3 thus lowering the substrate for nitrification and denitrification. Higher cumulative N2O emission during 2012–2013 than in 2011–2012 wheat season was probably due to the greater number of drying-wetting cycles induced by frequent rain showers in this year (Figure 1) thus favoring N2O emission although the amount of N fertilizer was the same in both the years.
Crop residues provide a source of readily available C and N in the soil and subsequently enhance N2O emission by influencing denitrification under anaerobic conditions. However, we did not find any significant effect of residue retention on N2O emission in this study. This was probably because increased microbial immobilization of fertilizer N in the first year resulted in less N being available for nitrification and denitrification. High C-to-N ratio of crop residues left in the field stimulates N immobilization resulting in reduced N cycling [36]. In the second year, N2O emissions were slightly higher in residue retention treatments than other treatments (Table 2).

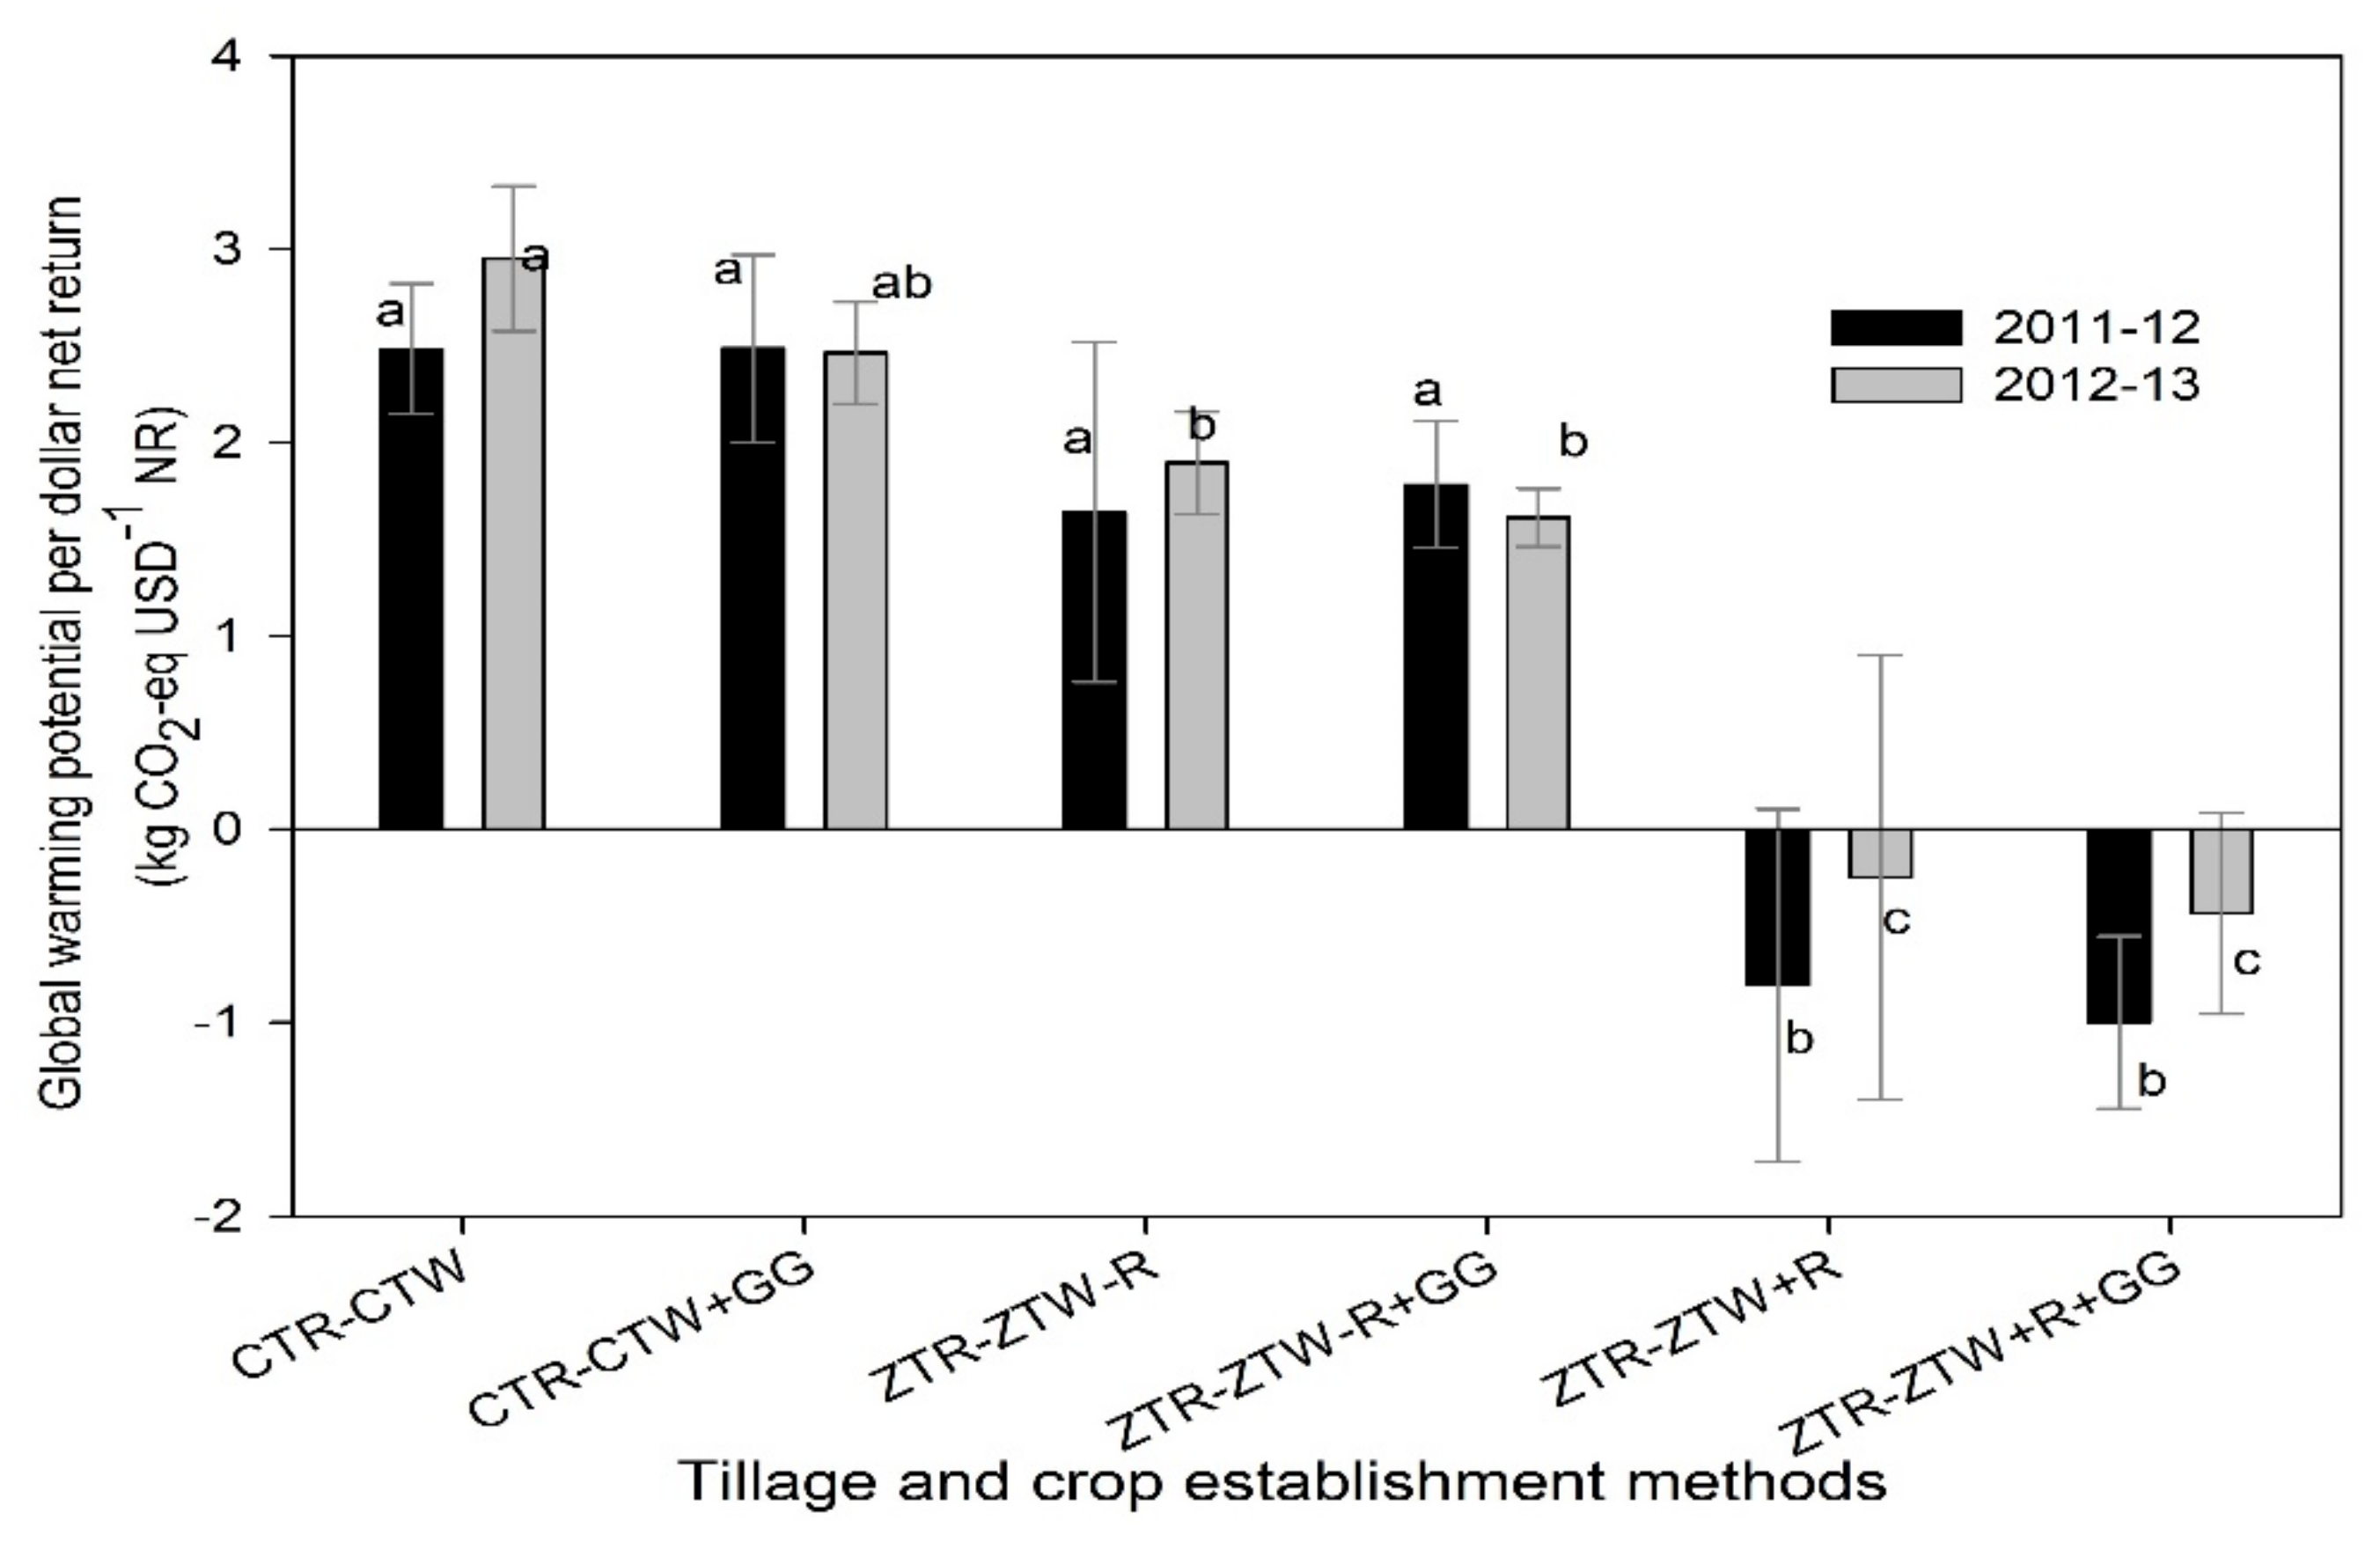
3.6. Total Global Warming Potential

Total global warming potential of RW production system were computed considering all sources and sinks of GHGs i.e., emissions due to field operations (tillage, planting, irrigation), production inputs (seed and fertilizer use), soil flux of GHGs and change in soil C (0–30 cm soil layer). Significant treatment effects were observed in both years for GWP associated with operations in rice, and system level changes in SOC as well as area- and yield-scaled GWP (Table 3). In the two years of experiment, ZTR-ZTW+R+GG sequestered the highest SOC followed by ZTR-ZTW+R and ZTR-ZTW-R, whereas other treatments lost SOC from the system (Table 3). GWP due to field operation (tillage and irrigation) was much higher under CT systems than in ZT systems due to the higher number of tillage and irrigation events. The difference in the GWP due to operations between CT and ZT systems was much higher in the case of rice (572 kg CO2-eq ha−1 season−1) than in wheat (143 kg CO2-eq ha−1 season−1) due mainly to differences in irrigation events. On average, CT rice received 25 irrigations compared with 13 for ZT rice, whereas CTW received only one extra pre-sowing irrigation than ZTW. This is reflected also in the water footprint of production i.e., consumption of water per kg of grain produced which was significantly higher in the CT- than ZT-based systems (Table 4) with values comparable to those reported from NW IGP [37].
On average, GWP due to inputs was higher in wheat than in rice season mainly because of the higher N fertilizer application rate (see materials and methods). Although CH4 emission from rice was significantly higher in CT than in ZT systems (Table 2), total GWP expressed in kg CO2-eq ha−1 were not statistically significant among the treatments mainly because emission of N2O contributed most to the total GHG emission and N2O emissions were not significantly different between treatments.
Considering all sources of emission, the net GWP of ZT systems with residue retention was negative in both years, while it was positive for CT systems and ZT systems without residue retention, irrespective of GG integration. Accordingly, ZT with residue retention in RW system has the potential to reduce global warming while other systems contribute to it. Irrespective of GG integration, yield-scaled GWP of RW system was negative under ZT with residue while it was positive under CT and ZT without residue. In addition, yield-scaled GWP was similar under CT and ZT system without residue retention irrespective of GG integration. Therefore, reside retention played major role in reducing both area- and yield-scaled GWP in RW system. In economic terms, GWP per dollar net return was significantly different among the treatments (Figure 4). On average, GWP of ZT-based RW systems (ZTR-ZTW+R and ZTR-ZTW+R+GG) was −0.79 kg CO2-eq (0.74 to −1.82 CO2-eq) per dollar net income. All other treatments had positive GWP which ranged from 0.90 to 3.611 kg CO2-eq per dollar net income.
Our study suggests that fewer farm operations (tillage and irrigation) in ZT and higher C sequestration through residue retention are the two major areas contributing to reduced GWP of RW production systems. As the grain yield and economic returns in these production systems (i.e., ZTR-ZTW+R and ZTR-ZTW+R+GG) were similar to other systems (Table 4), there are good grounds for targeted promotion of these systems for sustainable intensification as they are agronomically productive, economically viable and environmentally beneficial.

3.7. Wider Economic and Environmental Impacts of CA in RW Systems in the NW IGP, India

The life-cycle analysis of the entire production cycle of Basmati RW system resulted in emission of 6.4 Mg CO2-eq ha−1 year−1 in conventional (CTR-CTW) management but the CA system (ZTR-ZTW+R+GG) sequestered 2.3 Mg CO2-eq ha−1 year−1 (average of two years) (Table 3). In 2014–2015, area under Basmati rice in NW IGP in India was 2.03 million ha [38] which almost translate into Basmati RW system area as most Basmati rice are followed by wheat in the winter season. In medium term, nearly one million ha Basmati RW area can be converted into CA-based system keeping in view the increasing adoption of DSR during past few years which has reached 0.2 million ha in NW IGP (personal communication, department of Agriculture in Haryana and Punjab). If this is realized, the climate change mitigation benefit from NW IGP will be about 2.36 million Mg CO2-eq year−1. However, our result on soil C sequestration should be interpreted with caution for two reasons. Firstly, only a fraction of estimated C may be stabilized and contribute to long-term sequestration as the values reported here are only after two years of experimentation. Secondly, there are trade-offs of the residue with alternative uses [39], which need to be rationalized through further research.
Our results indicate that the water footprint of RW production system is about 29% less in CA-based system compared to CT-based systems (Table 4). On average, irrigation water consumption of Basmati RW system in our study was 20,700 m3 ha−1 in CT-based system whereas it was only about 15,100 m3 ha−1 in CA-based systems. Above figure on irrigation water implies that CA-based production of Basmati RW system saves 5600 m3 or 5,600,000 L of water ha−1 year−1 compared CT-based production. Accordingly, if a target of converting one million ha Basmati RW area into CA is realized, NW IGP can save 5.6 trillion L of ground water. Shifting Basmati RW system from CT- to CA-based management not only saves ground water but also saves energy required for pumping ground water. The majority of farmers in this region use 15 hp pump to lift groundwater for irrigation. The average energy consumption per m3 of water using this pump is 0.0035 KW. This means CA-based RW system results in an energy saving of about 20 KW ha−1 year−1. Accordingly, if one million Basmati RW area of NW IGP is converted to CA, this results in an irrigation energy saving of 21045 MW year−1.
Depletion of ground water is major problem faced by RW system in NW IGP after green revolution [40]. State governments in this region are now putting major emphasis on resource conserving agricultural practices including those which increase water productivity or minimize the water footprint. Promotion of CA-based sustainable intensification could be one of the viable strategies to meet this goal. This would require governments in these states to revise the electricity subsidy on farm operations and introduce targeted economic incentives, for example by providing an electricity subsidy to only those farmers who adopt sustainable intensification practices that contribute to ground-water savings.
In economic terms, shifting Basmati RW system from CT- to CA-based management can enhance farmers’ income by nearly 40% with USD 942 more net revenue per ha in CA- than in CT-based system (Table 4). Thus, if one million ha of Basmati RW area in NW IGP is converted into CA-based sustainable intensification, farmers in this region will generate USD 940 million more net revenue year−1.

4. Conclusions

Here, we evaluated the effect of tillage, residue management and green gram integration in Basmati RW system of western IGP. The objective was to identify cropping systems in which greater yields could be achieved at lower production costs and therefore higher economic profitability whilst at the same time minimizing soil and environmental trade-offs.
Our results from two consecutive years of experiment demonstrate that planting both rice and wheat under ZT without residue retention increased the economic benefits in the short term but with a higher environmental cost in terms of GWP than ZT with residues. Considering all sources of emissions from the whole production cycle, ZTR-ZTW+R with and without GG had a consistently and significantly lower (negative) GWP than all other systems without compromising grain yield and net return, indicating that these production systems actually contribute to mitigate climate change. These results indicate that ZTR-ZTW+R and ZTR-ZTW+R+GG present the best options for delivering benefits in terms of agronomic yield, economic returns and GHG mitigation in Basmati rice-wheat systems in the region.

Supplementary Materials

The following are available online at www.mdpi.com/2071-1050/9/6/1044/s1, Table S1: Initial soil properties of the experimental field at 0–15 cm soil layer; Table S2: Summary of the tillage, crop establishment, residue management and legume integration under various treatments in the study; Table S3: Estimates of carbon emissions for a range of farm operations and agricultural inputs and energy use.

Acknowledgments

This work was implemented by CIMMYT as part of CGIAR Research Program on Climate Change, Agriculture and Food Security (CCAFS), made possible by the generous funding of CGIAR Fund donors and through bilateral funding of Bayer CropSciences. The details of CCAFS donors can be found at https://ccafs.cgiar.org/donors. The opinions, findings, conclusion or recommendation expressed in this publication are those of the author(s) and do not necessarily reflect the views of CCAFS, CGIAR Fund donors or Bayer CropSciences. Authors would like to thank Anil Bana from Department of Agriculture, Govt of Punjab and Dalip K Bishnoi, CCS Haryana Agriculture University, Hisar and all the field staff of CIMMYT in Karnal for their support in managing trial and data collection.

Author Contributions

Mangi L Jat and Mohinder S. Grewal conceived and designed field experiment. Tek. B. Sapkota, V. Shankar, Munmun Rai and Love K. Singh performed research and measurements. Tek B. Sapkota and Munmun Rai analyzed the data and wrote the paper. All co-authors contributed to the writing of the paper.

Conflicts of Interest

The authors declare no conflict of interest.

References

  1. Wani, S.A.; Manhas, S.K.; Kumar, P. Basmati Rice in India-Its Prodution and Export. Available online: http://www.fnbnews.com/article/detnews.asp?articleid=36925&sectionid=1 (accessed on 24 September 2015).
  2. Dutta, R. India’s to Export Record Basmati Rice in 2012/13. Available online: http://in.reuters.com/article/2012/07/06/india-Basmati-idINL3E8I62QO20120706 (accessed on 24 September 2015).
  3. Gathala, M.K.; Ladha, J.K.; Saharawat, Y.S.; Kumar, V.; Kumar, V.; Sharma, P.K. Effect of Tillage and Crop Establishment Methods on Physical Properties of a Medium-Textured Soil under a Seven-Year Rice–Wheat Rotation. Soil Sci. Soc. Am. J. 2011, 75, 1851–1862. [Google Scholar] [CrossRef]
  4. Kumar, V.; Ladha, J.K. Direct Seeding of Rice: Recent Developments and Future Research Needs. Adv. Agron. 2011, 111, 297–413. [Google Scholar]
  5. Tashiro, T.; Wardlaw, I. A comparison of the effect of high temperature on grain development in wheat and rice. Ann. Bot. 1989, 64, 59–65. [Google Scholar] [CrossRef]
  6. Lobell, D.B.; Sibley, A.; Ivan Ortiz-Monasterio, J. Extreme heat effects on wheat senescence in India. Nat. Clim. Chang. 2012, 2, 186–189. [Google Scholar] [CrossRef]
  7. Pathak, H.; Ladha, J.; Aggarwal, P.; Peng, S.; Das, S.; Singh, Y.; Singh, B.; Kamra, S.; Mishra, B.; Sastri, A.S.R.A.; et al. Trends of climatic potential and on-farm yields of rice and wheat in the Indo-Gangetic Plains. Field Crops Res. 2003, 80, 223–234. [Google Scholar] [CrossRef]
  8. Ladha, J.K.; Kumar, V.; Alam, M.M.; Sharma, S.; Gathala, M.K.; Chandna, P.; Saharawat, Y.S.; Balasubramanian, V. Integrating crop and resource management technologies for enhanced productivity, profitability, and sustainability of the rice-wheat system in South Asia. In Integrated Crop and Resource Management in the Rice-Wheat System of South Asia; Ladha, J.K., Yadvinder-Singh, Erenstein, O., Hardy, B., Eds.; IRRI: Los Baños, Philippines, 2009; pp. 69–108. [Google Scholar]
  9. Jat, M.L.; Gathala, M.K.; Ladha, J.K.; Saharawat, Y.S.; Jat, A.S.; Kumar, V.; Sharma, S.K.; Kumar, V.; Gupta, R. Evaluation of precision land leveling and double zero-till systems in the rice–wheat rotation: Water use, productivity, profitability and soil physical properties. Soil Tillage Res. 2009, 105, 112–121. [Google Scholar] [CrossRef]
  10. Saharawat, Y.S.; Singh, B.; Malik, R.K.; Ladha, J.K.; Gathala, M.; Jat, M.L.; Kumar, V. Evaluation of alternative tillage and crop establishment methods in a rice–wheat rotation in North Western IGP. Field Crops Res. 2010, 116, 260–267. [Google Scholar] [CrossRef]
  11. Sapkota, T.B.; Majumdar, K.; Jat, M.L.; Kumar, A.; Bishnoi, D.K.; Mcdonald, A.J.; Pampolino, M. Precision nutrient management in conservation agriculture based wheat production of Northwest India: Profitability, nutrient use efficiency and environmental footprint. Field Crops Res. 2014, 155, 233–244. [Google Scholar] [CrossRef]
  12. Ko, J.; Kang, H. The effects of cultural practices on methane emission from rice fields. Nutr. Cycl. Agroecosyst. 2000, 58, 311–314. [Google Scholar] [CrossRef]
  13. Wassmann, R.; Neue, H.U.; Ladha, J.K.; Aulakh, M.S. Mitigating greenhouse gas emissions from rice-wheat cropping systems in Asia. Environ. Dev. Sustain. 2004, 6, 65–90. [Google Scholar] [CrossRef]
  14. Sapkota, T.B.; Jat, M.L.; Aryal, J.P.; Jat, R.K.; Khatri-Chhetri, A. Climate change adaptation, greenhouse gas mitigation and economic profitability of conservation agriculture: Some examples from cereal systems of Indo-Gangetic Plains. J. Integr. Agric. 2015, 14, 1524–1533. [Google Scholar] [CrossRef]
  15. Sidhu, H.S.; Singh, M.; Singh, Y.; Blackwell, J.; Lohan, S.K.; Humphreys, E.; Jat, M.L.; Singh, V.; Singh, S. Development and evaluation of the Turbo Happy Seeder for sowing wheat into heavy rice residues in NW India. Field Crops Res. 2015, 184, 201–212. [Google Scholar] [CrossRef]
  16. Clough, T.J.; Rochette, P.; Thomas, S.M.; Pihlatie, M.; Christiansen, J.R.; Thorman, R.E. Chamber Design. In Nitrous Oxide Chamber Methodology Guidelines; de Klein, C.A.M., Harvey, M.J., Eds.; Ministry for Primary Industries: Wellington, New Zealand, 2012. [Google Scholar]
  17. Sapkota, T.B.; Rai, M.; Singh, L.K.; Gathala, M.K.; Jat, M.L.; Sutaliya, J.M.; Bijarniya, D.; Jat, M.K.; Jat, R.K.; Parihar, C.M.; et al. Greenhouse Gas Measurement from Smallholder Production Systems: Guidelines for Static Chamber Method; International Maize and Wheat Improvement Center (CIMMYT): New Delhi, India, 2014. [Google Scholar]
  18. Intergovernmental Panel on Climate Change. IPCC Climate Change: Mitigation. Contribution of Working Group III to the Fourth Assessment Report of the Intergovernmental Panel on Climate Change; Cambridge University Press: Cambridge, UK; New York, NY, USA, 2007. [Google Scholar]
  19. Zhou, M.; Zhu, B.; Brüggemann, N.; Wang, X.; Zheng, X.; Butterbach-bahl, K. Nitrous oxide and methane emissions from a subtropical rice–rapeseed rotation system in China: A 3-year field case study. Agric. Ecosyst. Environ. 2015, 212, 297–309. [Google Scholar] [CrossRef]
  20. Dendooven, L.; Patiño-Zúñiga, L.; Verhulst, N.; Luna-Guido, M.; Marsch, R.; Govaerts, B. Global warming potential of agricultural systems with contrasting tillage and residue management in the central highlands of Mexico. Agric. Ecosyst. Environ. 2012, 152, 50–58. [Google Scholar] [CrossRef]
  21. Thelen, K.D.; Fronning, B.E.; Kravchenko, A.; Min, D.H.; Robertson, G.P. Integrating livestock manure with a corn-soybean bioenergy cropping system improves short-term carbon sequestration rates and net global warming potential. Biomass Bioenergy 2010, 34, 960–966. [Google Scholar] [CrossRef]
  22. West, T.O.; Marland, G. A synthesis of carbon sequestration, carbon emissions, and net carbon flux in agriculture: Comparing tillage practices in the United States. Agric. Ecosyst. Environ. 2002, 91, 217–232. [Google Scholar] [CrossRef]
  23. Lal, R. Carbon emission from farm operations. Environ. Int. 2004, 30, 981–990. [Google Scholar] [CrossRef] [PubMed]
  24. Ussiri, D.A.N.; Lal, R.; Jarecki, M.K. Nitrous oxide and methane emissions from long-term tillage under a continuous corn cropping system in Ohio. Soil Tillage Res. 2009, 104, 247–255. [Google Scholar] [CrossRef]
  25. CoHort, S. CoHort Software. Available online: www.cohort.com (accessed on 25 March 2014).
  26. Jat, R.K.; Sapkota, T.B.; Singh, R.G.; Jat, M.L.L.; Kumar, M.; Gupta, R.K. Seven years of conservation agriculture in a rice-wheat rotation of Eastern Gangetic Plains of South Asia: Yield trends and economic profitability. Field Crops Res. 2014, 164, 199–210. [Google Scholar] [CrossRef]
  27. Sharma, P.K.; Ladha, J.K.; Bhushan, L. Soil physical effects of puddling in rice-wheat cropping systems. In Improving the Productivity and Sustainability of Rice–Wheat Systems: Issues and Impacts; American Society of Agronomy, Crop Science Society of America, and Soil Science Society of America: Madison, WI, USA, 2003; pp. 97–113. [Google Scholar]
  28. Gathala, M.K.; Ladha, J.K.; Kumar, V.V.; Saharawat, Y.S.; Kumar, V.V.; Sharma, P.K.; Sharma, S.; Pathak, H. Tillage and Crop Establishment Affects Sustainability of South Asian Rice–Wheat System. Agron. J. 2011, 103, 961–971. [Google Scholar] [CrossRef]
  29. Zou, J.; Huang, Y.; Jiang, J.; Zheng, X.; Sass, R.L. A 3-year field measurement of methane and nitrous oxide emissions from rice paddies in China: Effects of water regime, crop residue, and fertilizer application. Glob. Biogeochem. Cycles 2005, 19, 1–9. [Google Scholar] [CrossRef]
  30. Yagi, K.; Tsuruta, H.; Kanda, K.; Minami, K. Effect of water management on methane emission from a Japanese rice paddy field: Automated methane monitoring. Glob. Biogeochem. Cycles 1996, 10, 255–267. [Google Scholar] [CrossRef]
  31. Wassmann, R.; Buendia, L.V.; Lantin, R.S.; Bueno, C.S.; Lubigan, L.A.; Umali, A.; Nocon, N.N.; Javellana, A.M.; Neue, H.U. Mechanisms of crop management impact on methane emissions from rice fields in Los Banos, Philippines. Nutr. Cycl. Agroecosyst. 2000, 58, 107–119. [Google Scholar] [CrossRef]
  32. Malla, G.; Bhatia, A.; Pathak, H.; Prasad, S.; Jain, N.; Singh, J. Mitigating nitrous oxide and methane emissions from soil in rice–wheat system of the Indo-Gangetic plain with nitrification and urease inhibitors. Chemosphere 2005, 58, 141–147. [Google Scholar] [CrossRef] [PubMed]
  33. Ghosh, S.; Majumdar, D.; Jain, M.C. Methane and nitrous oxide emissions from an irrigated rice of North India. Chemosphere 2003, 51, 181–195. [Google Scholar] [CrossRef]
  34. Ali, M.A.; Hoque, M.A.; Kim, P.J. Mitigating global warming potentials of methane and nitrous oxide gases from rice paddies under different irrigation regimes. Ambio 2013, 42, 357–368. [Google Scholar] [CrossRef] [PubMed]
  35. Masscheleyn, P.H.; Delaune, R.D.; Patrick, W.H. Methane and nitrous oxide emissions from laboratory measurements of rice soil suspension: Effect of soil oxidation-reduction status. Chemosphere 1993, 26, 251–260. [Google Scholar] [CrossRef]
  36. Dendooven, L.; Gutiérrez-Oliva, V.F.; Patiño-Zúñiga, L.; Ramírez-Villanueva, D.A.; Verhulst, N.; Luna-Guido, M.; Marsch, R.; Montes-Molina, J.; Gutiérrez-Miceli, F.A.; Vásquez-Murrieta, S.; et al. Greenhouse gas emissions under conservation agriculture compared to traditional cultivation of maize in the central highlands of Mexico. Sci. Total Environ. 2012, 431, 237–244. [Google Scholar] [CrossRef] [PubMed]
  37. Gathala, M.K.; Kumar, V.; Sharma, P.C.C.; Saharawat, Y.S.; Jat, H.S.S.; Singh, M.; Kumar, A.; Jat, M.L.L.; Humphreys, E.; Sharma, D.K.K.; et al. Optimizing intensive cereal-based cropping systems addressing current and future drivers of agricultural change in the northwestern Indo-Gangetic Plains of India. Agric. Ecosyst. Environ. 2013, 177, 85–97. [Google Scholar] [CrossRef]
  38. AgriNet Solutions. Basmati Acreage & Yield Estimation in Punjab, Haryana, Delhi, Uttarakhand, Himachal Pradesh, Western Uttar Pradesh and Parts of Jammu & Kashmir; AgriNet Solutions: Mumbai, India, 2014; pp. 1–29. [Google Scholar]
  39. Erenstein, O.; Gérard, B.; Tittonell, P. Biomass use trade-offs in cereal cropping systems in the developing world: Overview. Agric. Syst. 2015, 134, 1–5. [Google Scholar] [CrossRef]
  40. Famiglietti, J.S. The global groundwater crisis. Nat. Clim. Chang. 2014, 4, 945–948. [Google Scholar] [CrossRef]
Figure 1. (a) Monthly minimum temperature (mean), maximum temperature (mean) and rainfall (total) of the experimental site during (a) 2011–2012; (b) 2012–2013 rice-wheat green gram season.
Sustainability 09 01044 g001
Figure 2. Daily CH4 emission during 2011 and 2012 rice growing season as affected by different treatments. Values are means of three spatial replications and two treatments (CTR-CTW and CTR-CTW+GG) in CTR (n = 6) and three spatial replications and four treatments (ZTR-ZTW-R, ZTR-ZTW-R+GG, ZTR-ZTW+R and ZTR-ZTW+R+GG) in ZTR (n = 12). The vertical bars show the standard errors of the mean. In each year, two down arrows show the window of continuous flooding in rice.
Sustainability 09 01044 g002
Figure 3. Trend of N2O emission during 2011–2012 (top) and 2012–2013 (bottom) rice-wheat seasons under different treatments. The vertical bars show the standard error of the mean. Down arrows indicate the date of fertilizer application.
Sustainability 09 01044 g003
Figure 4. Global warming potential per dollar net returns from rice-wheat system during 2011–2012 and 2012–2013 under various treatments. The vertical bars show the standard error of the mean. Bars bearing different lowercase letters are significantly different from each other based on LSD test (p = 0.05).
Sustainability 09 01044 g004
Table 1. Grain yield and net return from rice-wheat systems averaged over 2011–2012 and 2012–2013 crop seasons. Means in the same column followed by different lowercase letters differ significantly from each other based on LSD (p = 0.05).
Treatments Grain Yield (Mg ha−1)Net Return (USD ha−1)
RiceWheatGreen GramSystemRiceWheatGreen GramSystem
CTR-CTW5.01ab5.79-10.8112831127-2411c
CTR-CTW+GG5.04a5.950.8011.79140411586183180a
ZTR-ZTW-R4.70d6.18-10.8814561278-2734b
ZTR-ZTW-R+GG4.78cd6.090.8211.69149312357123440a
ZTR-ZTW+R4.91abc6.22-11.1315131113-2626bc
ZTR-ZTW+R+GG4.86bcd6.350.8312.04148711307223339a
Refer to Section 2.2 for treatment description.
Table 2. Seasonal cumulative CH4 and N2O flux (mean ± SE of the mean) under various treatments from the rice-wheat rotation in 2011–2012 and 2012–2013.
YearTreatments Rice SeasonWheat Season
CH4 (kg C ha−1)N2O (kg N ha−1)N2O (kg N ha−1)
2011–2012CTR-CTW22.54 ± 2.03a1.37 ± 0.102.48 ± 1.00
CTR-CTW+GG21.84 ± 1.19a2.04 ± 0.442.17 ± 0.84
ZTR-ZTW-R−0.98 ± 0.23ab2.68 ± 0.431.97 ± 0.51
ZTR-ZTW-R+GG5.48 ± 1.20b2.03 ± 0.212.41 ± 1.18
ZTR-ZTW+R0.53 ± 1.51b2.73 ± 0.771.69 ± 0.54
ZTR-ZTW+R+GG−0.37 ± 1.14b2.19 ± 0.391.43 ± 0.26
Treatment Effect***NSNS
2012–2013CTR-CTW23.08 ± 1.09a2.20 ± 0.232.64 ± 0.10
CTR-CTW+GG20.74 ± 3.73a2.20 ± 0.664.23 ± 0.79
ZTR-ZTW-R0.32 ± 1.37b2.45 ± 0.004.37 ± 0.78
ZTR-ZTW-R+GG2.05 ± 0.82b1.52 ± 0.273.26 ± 0.40
ZTR-ZTW+R5.44 ± 1.72b2.31 ± 1.064.53 ± 0.83
ZTR-ZTW+R+GG4.63 ± 1.33b3.67 ± 1.083.15 ± 0.56
Treatment Effect***NSNS
Refer to Section 2.2 for treatment description; Seasonal cumulative flux of wheat season also includes emission from green gram and fallow period as applicable in different treatments; Within given observation year, means in the same column followed by different lowercase letters are significantly different from each other based on LSD (p = 0.05); NS = non-significant; *** means significant at p < 0.001.
Table 3. Treatment effect on the Global warming potential (GWP) based on agronomic inputs, operations, soil C sequestration in 0–30 cm soil layer and greenhouse gas emission from soil (nitrous oxide (N2O) and methane (CH4)) (expressed as CO2-eq) for the year 2011–2012 and 2012–2013. Within a crop year, means in the same columns followed by different lowercase letters differ significantly from each other based on LSD (p = 0.05).
Treatments GWP from InputsGWP from OperationGWP from EmissionGWP from ∆SOCSystem Level GWP
RiceWheatRiceWheatRiceWheatRice–WheatArea-Scaled (kg CO2-eq ha−1)Yield-Scaled (kg CO2-eq Mg−1)
2011–2012 (kg CO2-eq ha−1)2011–2012
CTR-CTW56910081547a4651296120798a6190ab630a
CTR-CTW+GG56710081547a46516051057778a7144a595a
ZTR-ZTW-R663999980b3221275960−896a4304b450a
ZTR-ZTW-R+GG6531012980b3221143Z1173477a5871ab503a
ZTR-ZTW+R6461024980b3221345825−7084b−1942c−217b
ZTR-ZTW+R+GG6891034980b3221057695−7962b−3073c−264b
2012–2013 (kg CO2-eq ha−1)2012–2013
CTR-CTW6019011494a4651755128498a6598a867a
CTR-CTW+GG5749351494a46516092061778a8034a837a
ZTR-ZTW-R623935917b32212032127−896a5230a672a
ZTR-ZTW-R+GG575953917b3227961585477a5736a598a
ZTR-ZTW+R614930917b32212742204−7084b−823b−99b
ZTR-ZTW+R+GG634960917b32219171533−7962b−1568b−155b
Refer to Section 2.2 for treatment description.
Table 4. Water consumption per kg of grain production of rice, wheat and rice-wheat system under various treatments. Means are averaged over three spatial replications and two years of measurement. Means in the same columns followed by different lowercase letters differ significantly from each other based on LSD (p = 0.05).
Treatments Water Consumption per kg of Grain (m3 kg−1grain)
RiceWheatSystem
CTR-CTW3.17a0.70a1.85a
CTR-CTW+GG3.16a0.68a1.83a
ZTR-ZTW-R2.47b0.46b1.33b
ZTR-ZTW-R+GG2.43bc0.46b1.35b
ZTR-ZTW+R2.37bc0.45b1.30b
ZTR-ZTW+R+GG2.39c0.44b1.31b
Treatment effect*********
Refer to Section 2.2 for treatment description; *** means significant at p < 0.001.

