Evaluation of GHG Mitigation Measures in Rice Cropping and Effects of Farmer’s Characteristics: Evidence from Hubei, China

1
College of Economics and Management, Huazhong Agricultural University, Wuhan 430070, China
2
Hubei Rural Development Research Center, Huazhong Agricultural University, Wuhan 430070, China
*
Author to whom correspondence should be addressed.
Sustainability 2017, 9(6), 1066; https://0-doi-org.brum.beds.ac.uk/10.3390/su9061066
Submission received: 6 April 2017
/
Revised: 8 June 2017
/
Accepted: 15 June 2017
/
Published: 20 June 2017
(This article belongs to the Section Sustainable Agriculture)
Abstract
:Greenhouse Gas emissions from agricultural activities, such as rice cropping, have been proven to be an important cause of climate change, with constant barriers and constraints in the implementation and promotion of mitigation measures among farmers in China. However, there has been a lack of research focusing on specific mitigation measures and their characteristics. In this paper, we applied the expert assessment and best-worst scaling method to evaluate mitigation measures in rice cropping from the perspectives of effectiveness and applicability. The results showed that no mitigation measure in rice cropping was best from both an effectiveness and applicability viewpoint. However, the study found that “reducing the use of chemical fertilizers” was the most effective one, while “applying soil testing and formulated fertilization” was the most applicable one. Additionally, the older farmers spending more time on non-agricultural jobs and farming more plots of land were more likely to believe that mitigation measures related to the management of input elements would be more applicable compared to soil and water management or some types of new science and technology. Finally, we suggested that the agricultural extension agencies should popularize input elements management such as improvement of fertilizer or seeds among older farmers, and meanwhile promote soil cultivation management and new technologies for agriculture in areas where the land is more concentrated such as plains.
1. Introduction
As climate change has had a severe impact on society and economy worldwide, taking measures to reduce greenhouse gas (GHG) emissions, while maintaining a growing economy, has become a common goal for countries all around the world [1]. However, the agricultural sector has produced massive GHG emissions [2,3], especially in the process of rice cropping [4,5]. As for China, the mitigation issue has become much more urgent. GHG emissions from rice cropping in China account for 22% of the total emissions of the world [6]. As a result, the Chinese government has initiated a plan for rural environmental governance, which has a major objective that use of pesticides and fertilizers in agriculture should not be increased after 2020 [7].
Many recent studies have shown that adopting appropriate mitigation measures (MMs) would remarkably contribute to the abatement of GHG emissions in rice cropping [8,9,10]. They concluded that applying soil testing and formulated fertilization (STFF) could reduce the GHG emissions by minimizing the total amount of fertilizers used and improving fertilizer efficiency [11,12]. In addition, appropriate water management would mitigate the methane emissions from rice paddies [8], while conservation tillage would help to retain the organic carbon in soil and strengthen the capability of carbon sequestration [9]. All these studies suggested that it might be an achievable objective to reduce the carbon emissions from rice cropping.
Despite these rich studies focusing on the mitigation practices or measures, barriers to adoption also deserve attention, which include uncertainty, costs and other constraints of MMs. Some researchers discussed the prospects of applying these techniques [12,13]. Furthermore, the farmers’ awareness, willingness and actual behavior of adopting MMs have been previously examined [14,15]. As the research conclusions revealed, some socio-economic factors, such as the farmer’s age, total operated area and family income, are the influencing factors on farmers’ adoption of GHG mitigation technologies, including minimum tillage [15,16,17]. Zhu and Tian argued that for rice farmers in China, willingness to adopt low-carbon technology is higher when the expenses of required inputs increase less after application [18]. However, most researchers have focused mainly on the adoption of a specific mitigation measure and its socio-economic barrier. Therefore, this field requires a more comprehensive study examining a set of mitigation measures to determine which is best. Furthermore, among the factors affecting farmers’ choices, whether an MM “fits” in the current farming conditions is also worth considering. Generally, if an MM can meet these conditions and are beneficial, farmers are much more likely to adopt it [19,20]. Therefore, in order to promote MMs among farmers, the government or promotion agency must take both the effectiveness and applicability into consideration. It is the goal of this paper to contribute more to the field of evaluation of different MMs in rice cropping.
The rest of the article is divided into three main parts. Firstly, we made a brief introduction of the Best-Worst Scaling (BWS) method including its status of application. Following this, we explained details of the process of the research design. This part was mainly composed by the design of the B-W survey, Latent Class Model (LCM) construction and sampling. Finally, the results of BWS method and LCM were introduced, followed by the conclusions and implications.
2. The Best-Worst Scaling Method
In order to examine the factors that could lead to stronger inclinations towards applicability for various mitigation measures, a survey of rice farmers usually needs to be undertaken. A stated preference, namely the Best-Worst Scaling (BWS) experiment, is designed to explore the relative strength of a set of measures, which is used as the core component of the survey. Commonly, respondents in the BWS investigation are shown a predefined number of sets of candidate items and asked to choose only two items in each set that they consider the “best” and “worst” [21]. The choice task is repeated over a series of sets containing diverse combinations of mutually exclusive items, which thus provides a preference score. For example, in a set of four alternatives (A to D), one respondent chooses A as the best option and D as the worst, which allows us to be certain that A > {B, C, D}, B > D and C > D. Thus, the order of preference could be summarized. The standard BWS approach has several advantages over conventional rating scales and is less distorted by potential response bias [22,23]. Essentially, it is less cognitively sensitive and more accurate to select extremes on a scale instead of ranking all items simultaneously [21]. The Random Utility Theory constructs the basic premise and theoretical foundation of BWS. It is assumed that an individual’s relative preference for object A over object B is a function of the relative frequency with which object A is selected as a preferred choice to object B [24,25]. Marley and Louviere have given formal theoretical foundations of best-worst probabilistic models [26].
BWS was first designed to allow respondents to make trade-offs in their choices regarding food safety issues [21]. Although it has been mainly applied in business management and designing marketing strategies [27,28], it is gaining much popularity in some new subjects, such as health care [23,29]. In resource and environmental economics, it is gradually being employed to evaluate different environmental policies or mitigation measures [30,31]. There are three cases of BWS being used: Case 1 is often employed when the research mostly pays close attention to relative values of different objects. They can be vehicles, policy goals or any other set of objects that can be somehow meaningfully compared [32]. Generally, there will not be an attribute level structure, which always appears in profile and multi-profile cases.
3. Survey Design
3.1. Mitigation Measures in the Survey
First, we need to choose the objects included in the study. A total of 19 carbon mitigation measures related to rice cropping were taken into consideration. They were selected mainly in three ways: following the conclusions of existing literature [33,34], consulting from experts engaged in GHG mitigations of rice cropping and interviews with farmers. We attempted to make sure that these measures are more or less effective and are currently used by farmers. Following this, a preliminary expert survey was conducted to select the 11 most effective mitigation measures for the use of next step. In the expert survey, there were four classification options: “very effective”, “quite effective”, “ineffective” or “do not know”. Answers were marked with scores of “2”, “1”, “−1” and “0” respectively and then summed for each MM. In our research, the effectiveness means the effectiveness of perception in reducing GHG emissions from the experts’ perspective. Although it did not show the precise comparison by amount of GHG reduction among different MMs, it provided a judgement on the overall effect of reducing GHG. Thus, there is some relative significance of comparison here.
We chose the 11 most effective measures because it was more convenient for building the model matrix. Furthermore, effective scores of the remaining eight low-ranking MMs were not higher than the average, while the selected 11 measures were. Therefore, it was reasoned to exclude the other 8 MMs from our research scope. Finally, the mitigation measures included in the BWS choice sets are shown in Table 1. “Reducing the use of chemical fertilizers” ranked first in the effectiveness assessment, followed by “adopting no-till cropping” and “returning stubble and straw to field”. The three least effective mitigation measures from a professional point of view were “applying aquaculture in rice paddy”, “planting green manure” and “applying soil testing and formulated fertilization”.
Although there was limited research about evaluating the GHG mitigation measures of rice cropping simultaneously, several conclusions revealed that managing fertilizer and water are the two main controlling factors [35,36,37]. More specific research pointed that promoting midseason aeration by short-term drainage (intermittent irrigation) is one of the most promising strategies, while improving organic matter management is another candidate [38]. Wassmann et al. made a comparison among measures of reducing methane emissions from rice fields and concluded that the most effective measures included irrigation, use of compost and biogas residues [39]. From our results of the expert survey, although intermittent irrigation was not selected as the most effective mitigation measure, the measures ranking at the top were almost the same as the input management, especially fertilizer use. Thus, our evaluation of effectiveness is consistent with most studies. Furthermore, our results give a more detailed comparison of different fertilizer uses.
3.2. B-W Survey
This paper attempted to distinguish which mitigation measures could be applicable in rice cropping without considering different levels of each MM. Therefore, we employed the so-called Case 1 of BWS, which ranked the items as whole entities [24]. To obtain a survey in which all mitigation measures occurred equally often while all items were independent of each other, we used an orthogonal design method based on an orthogonal array obtained from Sloane’s website [40,41]. Table 2 shows the complete design.
At last, the survey contained six choice sets with four MMs, three sets with 6 measures and 3 choice sets with 8 measures. Thus, there were a final total of 12 choice sets. In Table 1, each MM is compared with others six times in one survey (12 choice sets), while each pair of the measures (such as MM1 and MM6) was compared three times in one survey (CS1, CS4 and CS9). Table 3 shows an example of the choice set.
All 12 choice sets were included in each questionnaire, with farmers told to choose only the most applicable MM and the least applicable one for reducing GHG during rice cropping in each choice set. As shown in Equation (1), a BWS score was computed from the difference between the number of times it was thought to be “best” (“most applicable”) and the number of times it was considered “worst” (“least applicable”), divided by the product of the number of respondents and the frequency each MM appears in the design [25].
where Number (Best) = total number of times an MM was most applicable; Number (Worst) = total number of times an MM was least applicable; n = the number of respondents; and r = the frequency each MM appeared in the design (six in our plan).
3.3. Latent Class Modeling
BWS analysis provided descriptive results in terms of the applicability of each MM among responsive farmers. Moreover, we conducted further research by proposing an application of Latent Class Modeling (LCM), which could measure the heterogeneity across the sample [42]. The reason LCM was chosen instead of the Multinomial Logit Model or Mixed Logit Model was that LCM is more suitable for BWS data and also could be used to capture underlying the latent dimension within the respondents [43]. Generally, it is assumed that individuals are sorted into a set of Q classes or clusters, although it is unknown as to which one is geared to a particular cluster beforehand [44]. Thus, in our study, the LCM results provided information on the degree of differences in awareness of applicability across the sample as well as how demographic and environmental variables (such as age and area) affected the classification of respondents.
As illustrated by Loureiro and Arcos [42], the selected model could be regarded as a logit model for a discrete choice among J alternatives, with each respondent (namely, the individual i) confronted with the choice of locations T (12 in our case). Therefore, that can be expressed as:
The choice sets can be different in particular applications. We use yit to depict a specific choice made as the best MM so that:
Following Greene and Hensher [44], we simplify Equation (3) to Pit|q, while the prior probability for class q for individual i is denoted as Hiq. For our application, considering the multinomial logit whose form is:
where q is the number of classes, q ∈ (1, …, Q); and zi indicates a set of observable characteristics [45].
Following Loureiro and Arcos [42], the likelihood of this classification and selection for the sample is calculated as:
The 11 MMs could be classified into one or more categories with regards to their characteristics. They may belong to the input elements management, which means that farmer particularly focus on their use of fertilizers, pesticides and seeds. They could potentially also belong to soil or water management, such as conservation tillage. Furthermore, the measures could also be related to new agricultural science or technology. Table 1 also displays the most relevant characteristics of all MMs. We borrowed the original attributes from the literature [46], before inviting farmers and other stakeholders to help with the professional judgment process. The characteristics were coded as dummy variables for each MM to fit the LCM [42]. For further and deeper analysis, we added some socio-demographic questions about the respondent’s farm conditions, personal information and others in the survey, as shown in Table 4.
3.4. Sample
Responses from 20 experts and 105 farmers were collected. The experts are botanists, biologists, and/or ecologists from top academic institutions in China. Table 4 shows the characteristics of the sample. The average age of respondents was 52 years old and the surveyed farmers are mainly male. The distribution of this gender structure may be due to the fact that the head of households who make production decisions are mainly men in the rural areas of China. We also considered the finances (family income) and the degree of land fragmentation, which is a special characteristic of agricultural production in China. These characteristics were transformed to variables and modeled as covariates in LCM to observe how these factors affected the probability of farmers falling into each particular class.
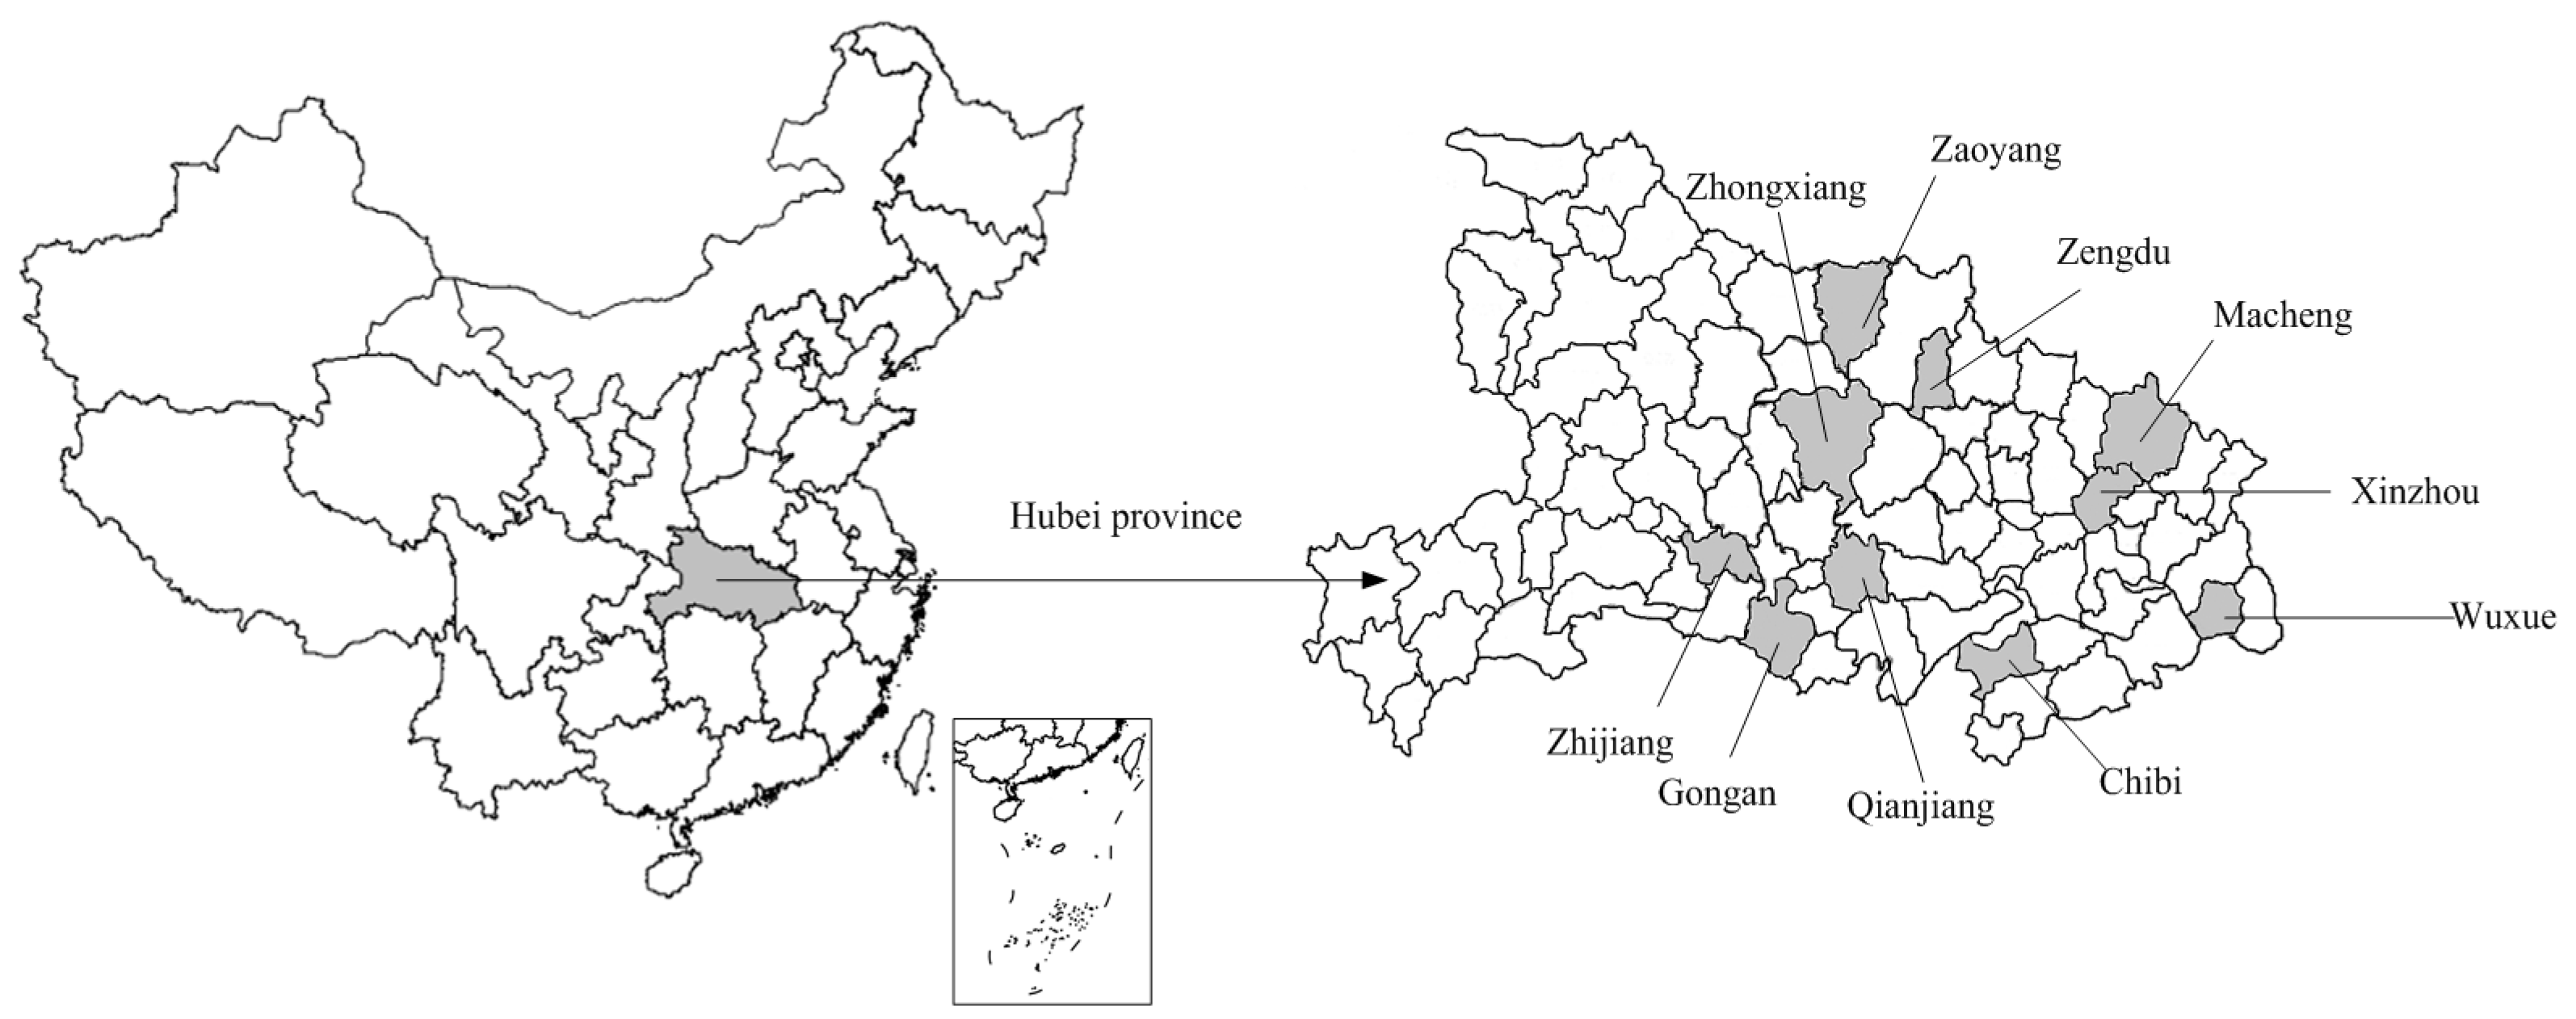
The personal interviews with farmers were conducted randomly in 10 counties in Hubei province, including Xinzhou, Macheng, Zhongxiang, etc. (Figure 1). Hubei province, which is the main crop farming area, is located in central China and is on the middle reaches of Yangtze River. Similar to Lagerkvist’s method of reducing the psychological bias of respondents [47], the respondents were not compensated for their participation. Each interview lasted for 30–45 min, while the survey responses were collected between 5 August and 11 September in 2016. The survey was pre-tested on 20 farmers from Wuxue County in Hubei province. We asked a series of questions about the survey structure, length and the carbon farming practices/MMs included in the choice sets. Based on the feedback, we revised some questions, making the questionnaire briefer and easier to interpret.
4. Results and Analysis
4.1. BWS Results
Table 5 reports the BWS results. The rankings of MMs based on the BWS Standard Score are shown in Column 5. The most applicable mitigation measures were “applying soil testing and formulated fertilization”, “returning stubble and straw to field” and “applying controlled-release fertilizers”, while “planting green manure” and “adopting no-till cropping” were the two most infeasible measures. Although Standard Score demonstrated a ranking of the most to least applicable MMs, there is a lack of knowledge with regards to the relative applicable information, i.e., how applicable the third ranked MM was relative to the top one. To investigate the correlativity, we adopted a new index, which was calculated from taking the square root for best/worst score Column 6. This value is then scaled by a factor such that the most applicable measure with the highest index was assigned an interval scale of 100 [48]. The resulting coefficients in Column 7 measured the choice probability compared to the most applicable MM [27].
Column 7 and Column 8 of Table 5 refined the ranking using the standardized scale. “Applying soil testing and formulated fertilization (STFF)” also emerged as the most applicable measure, after taking the interval scale of 100. All other standardized scales were computed relative to this value. For instance, “adopting no-till cropping” was only 0.18 times as applicable as “applying soil testing and formulated fertilization”. The ranking of MMs based on the standard scale painted a spectacular picture. The top three applicable MMs remained the same while the second and third places exchanged places compared to the ranking based on the standard score. In addition, the second highest ranked MM “applying controlled-release fertilizers” had a standardized square root interval score of 64.1 relative to the score of 100 for the top ranked measure. This essentially means that “applying STFF” is considerably more applicable than all other MMs. Similarly, “applying controlled-release fertilizers”, “returning stubble and straw to field” and “mixed use of organic and chemical fertilizers” all got scores above 60, which were far more than the 5th ranked MM, namely “applying aquaculture in rice paddy”. The first four highest ranked MMs were considered to be most suitable for application in rice cropping from the views of farmers joining the survey.
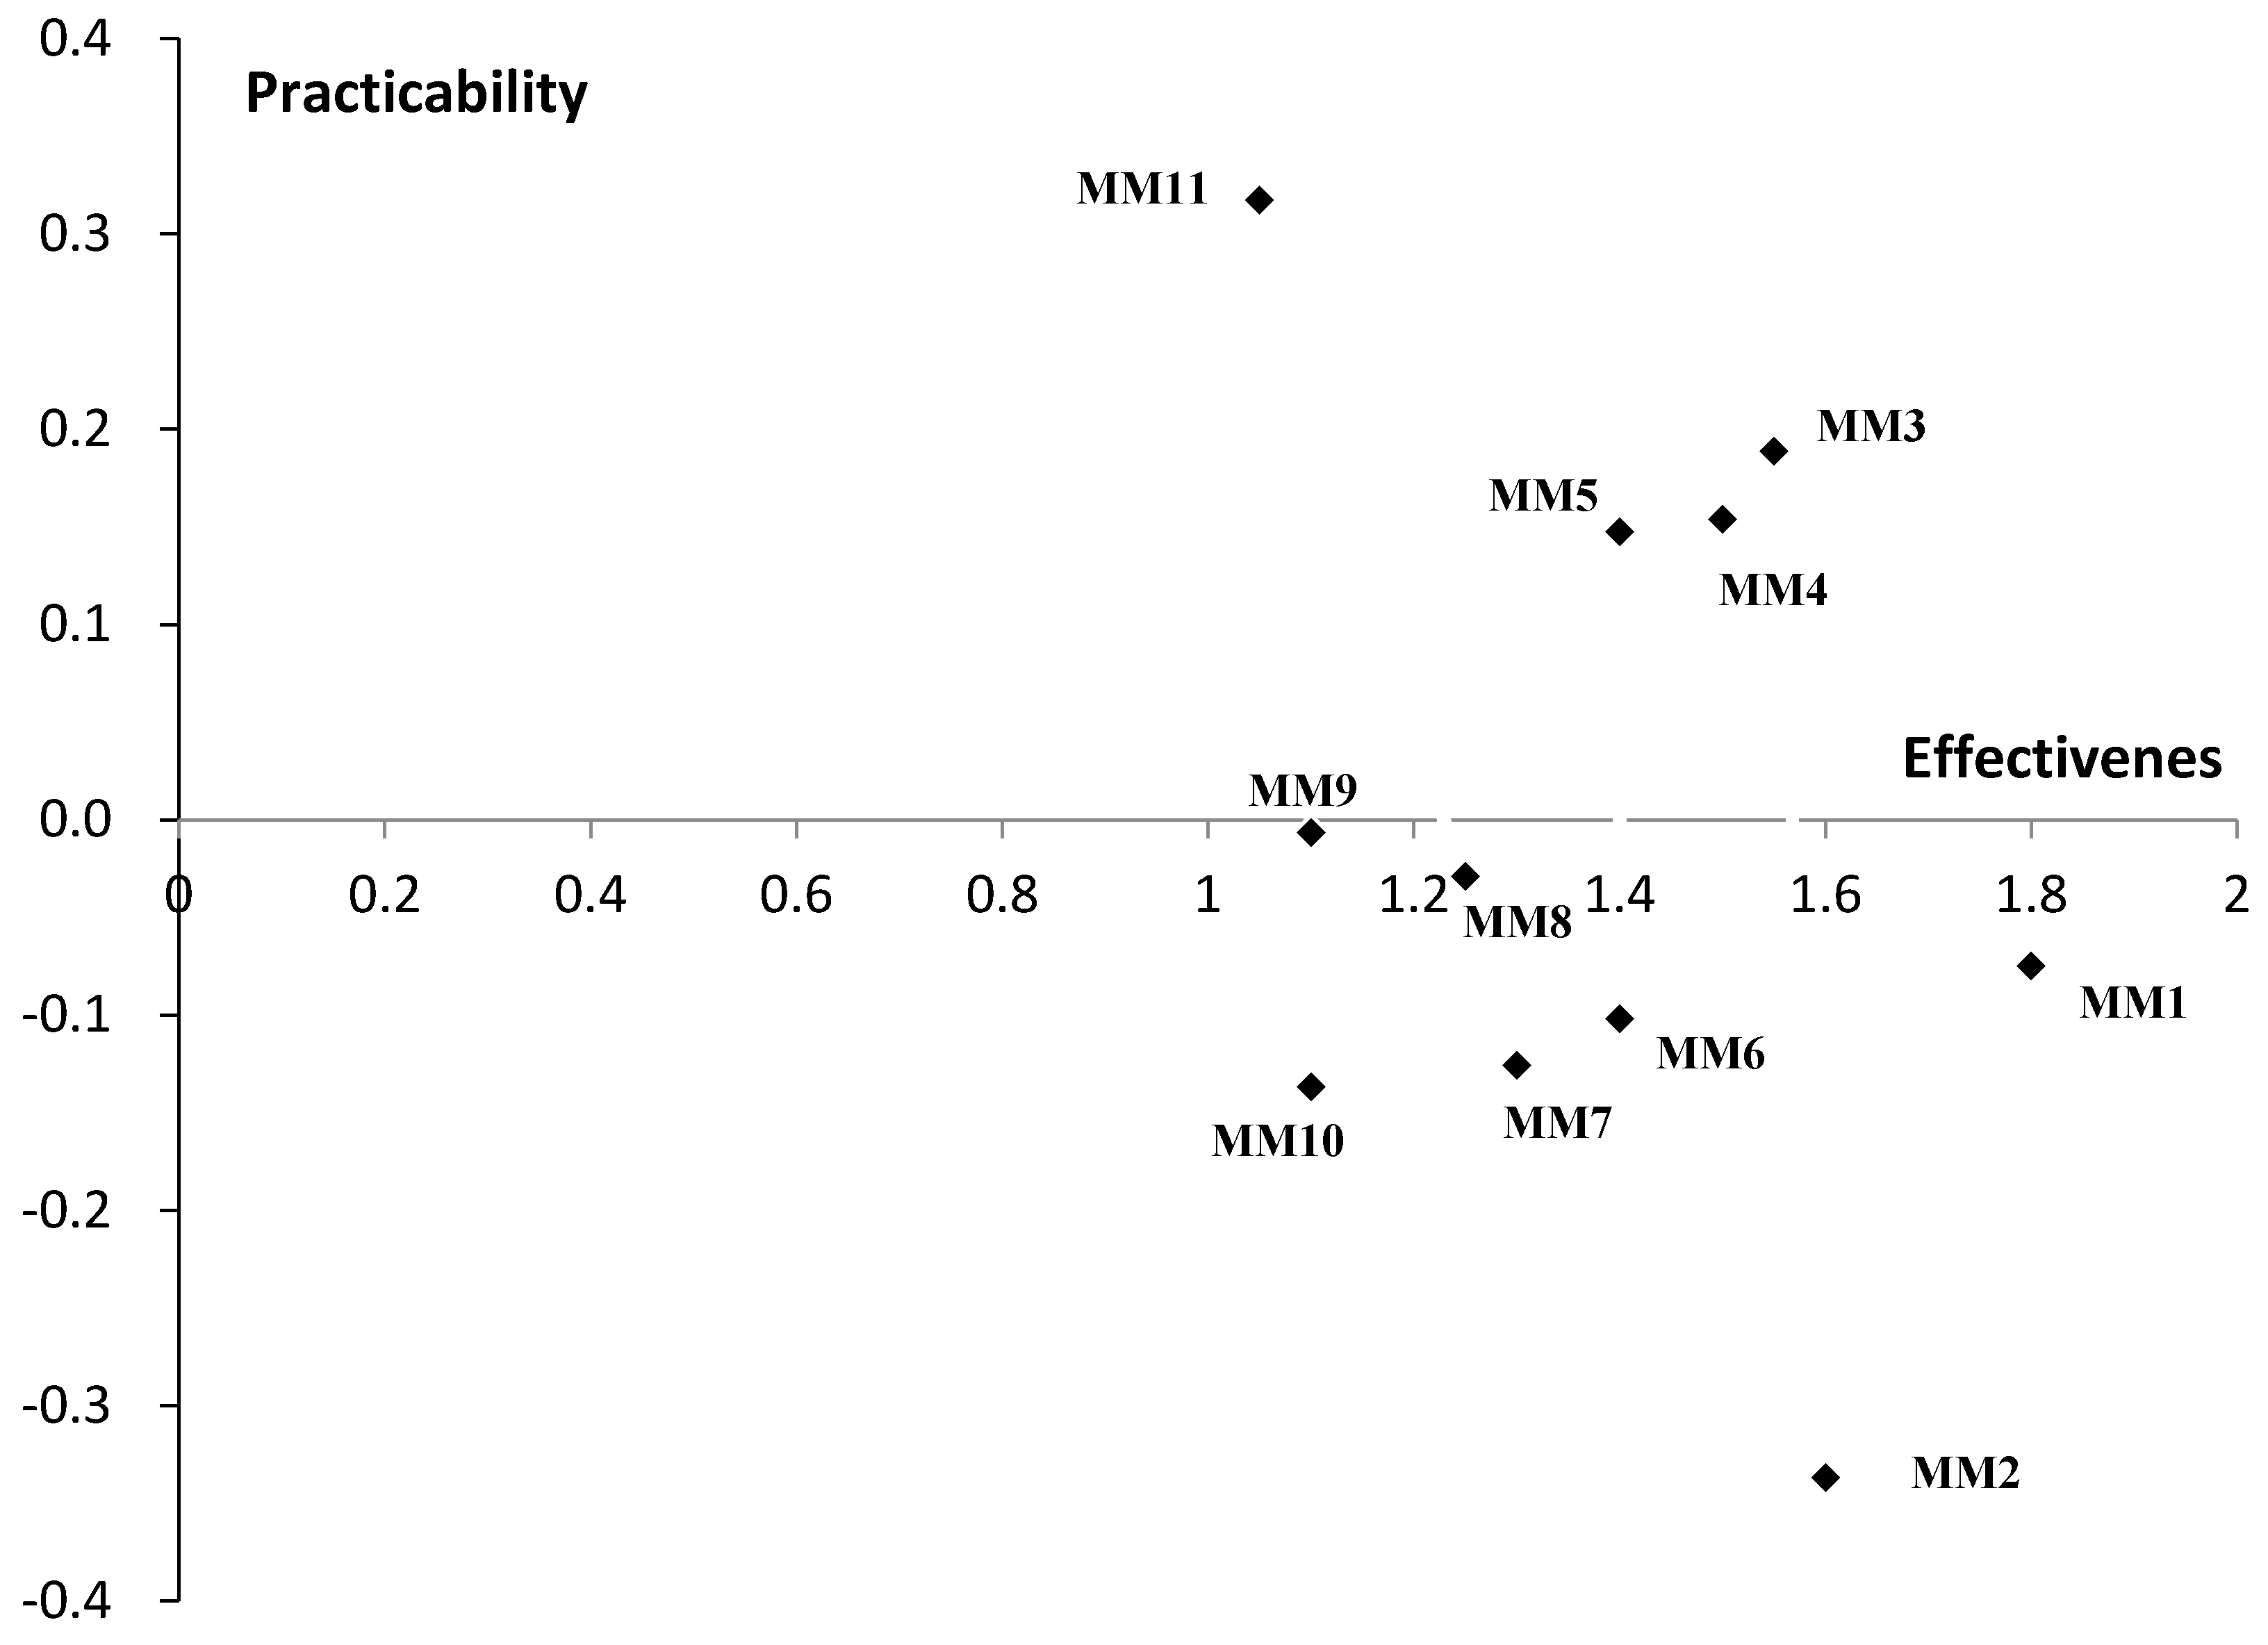
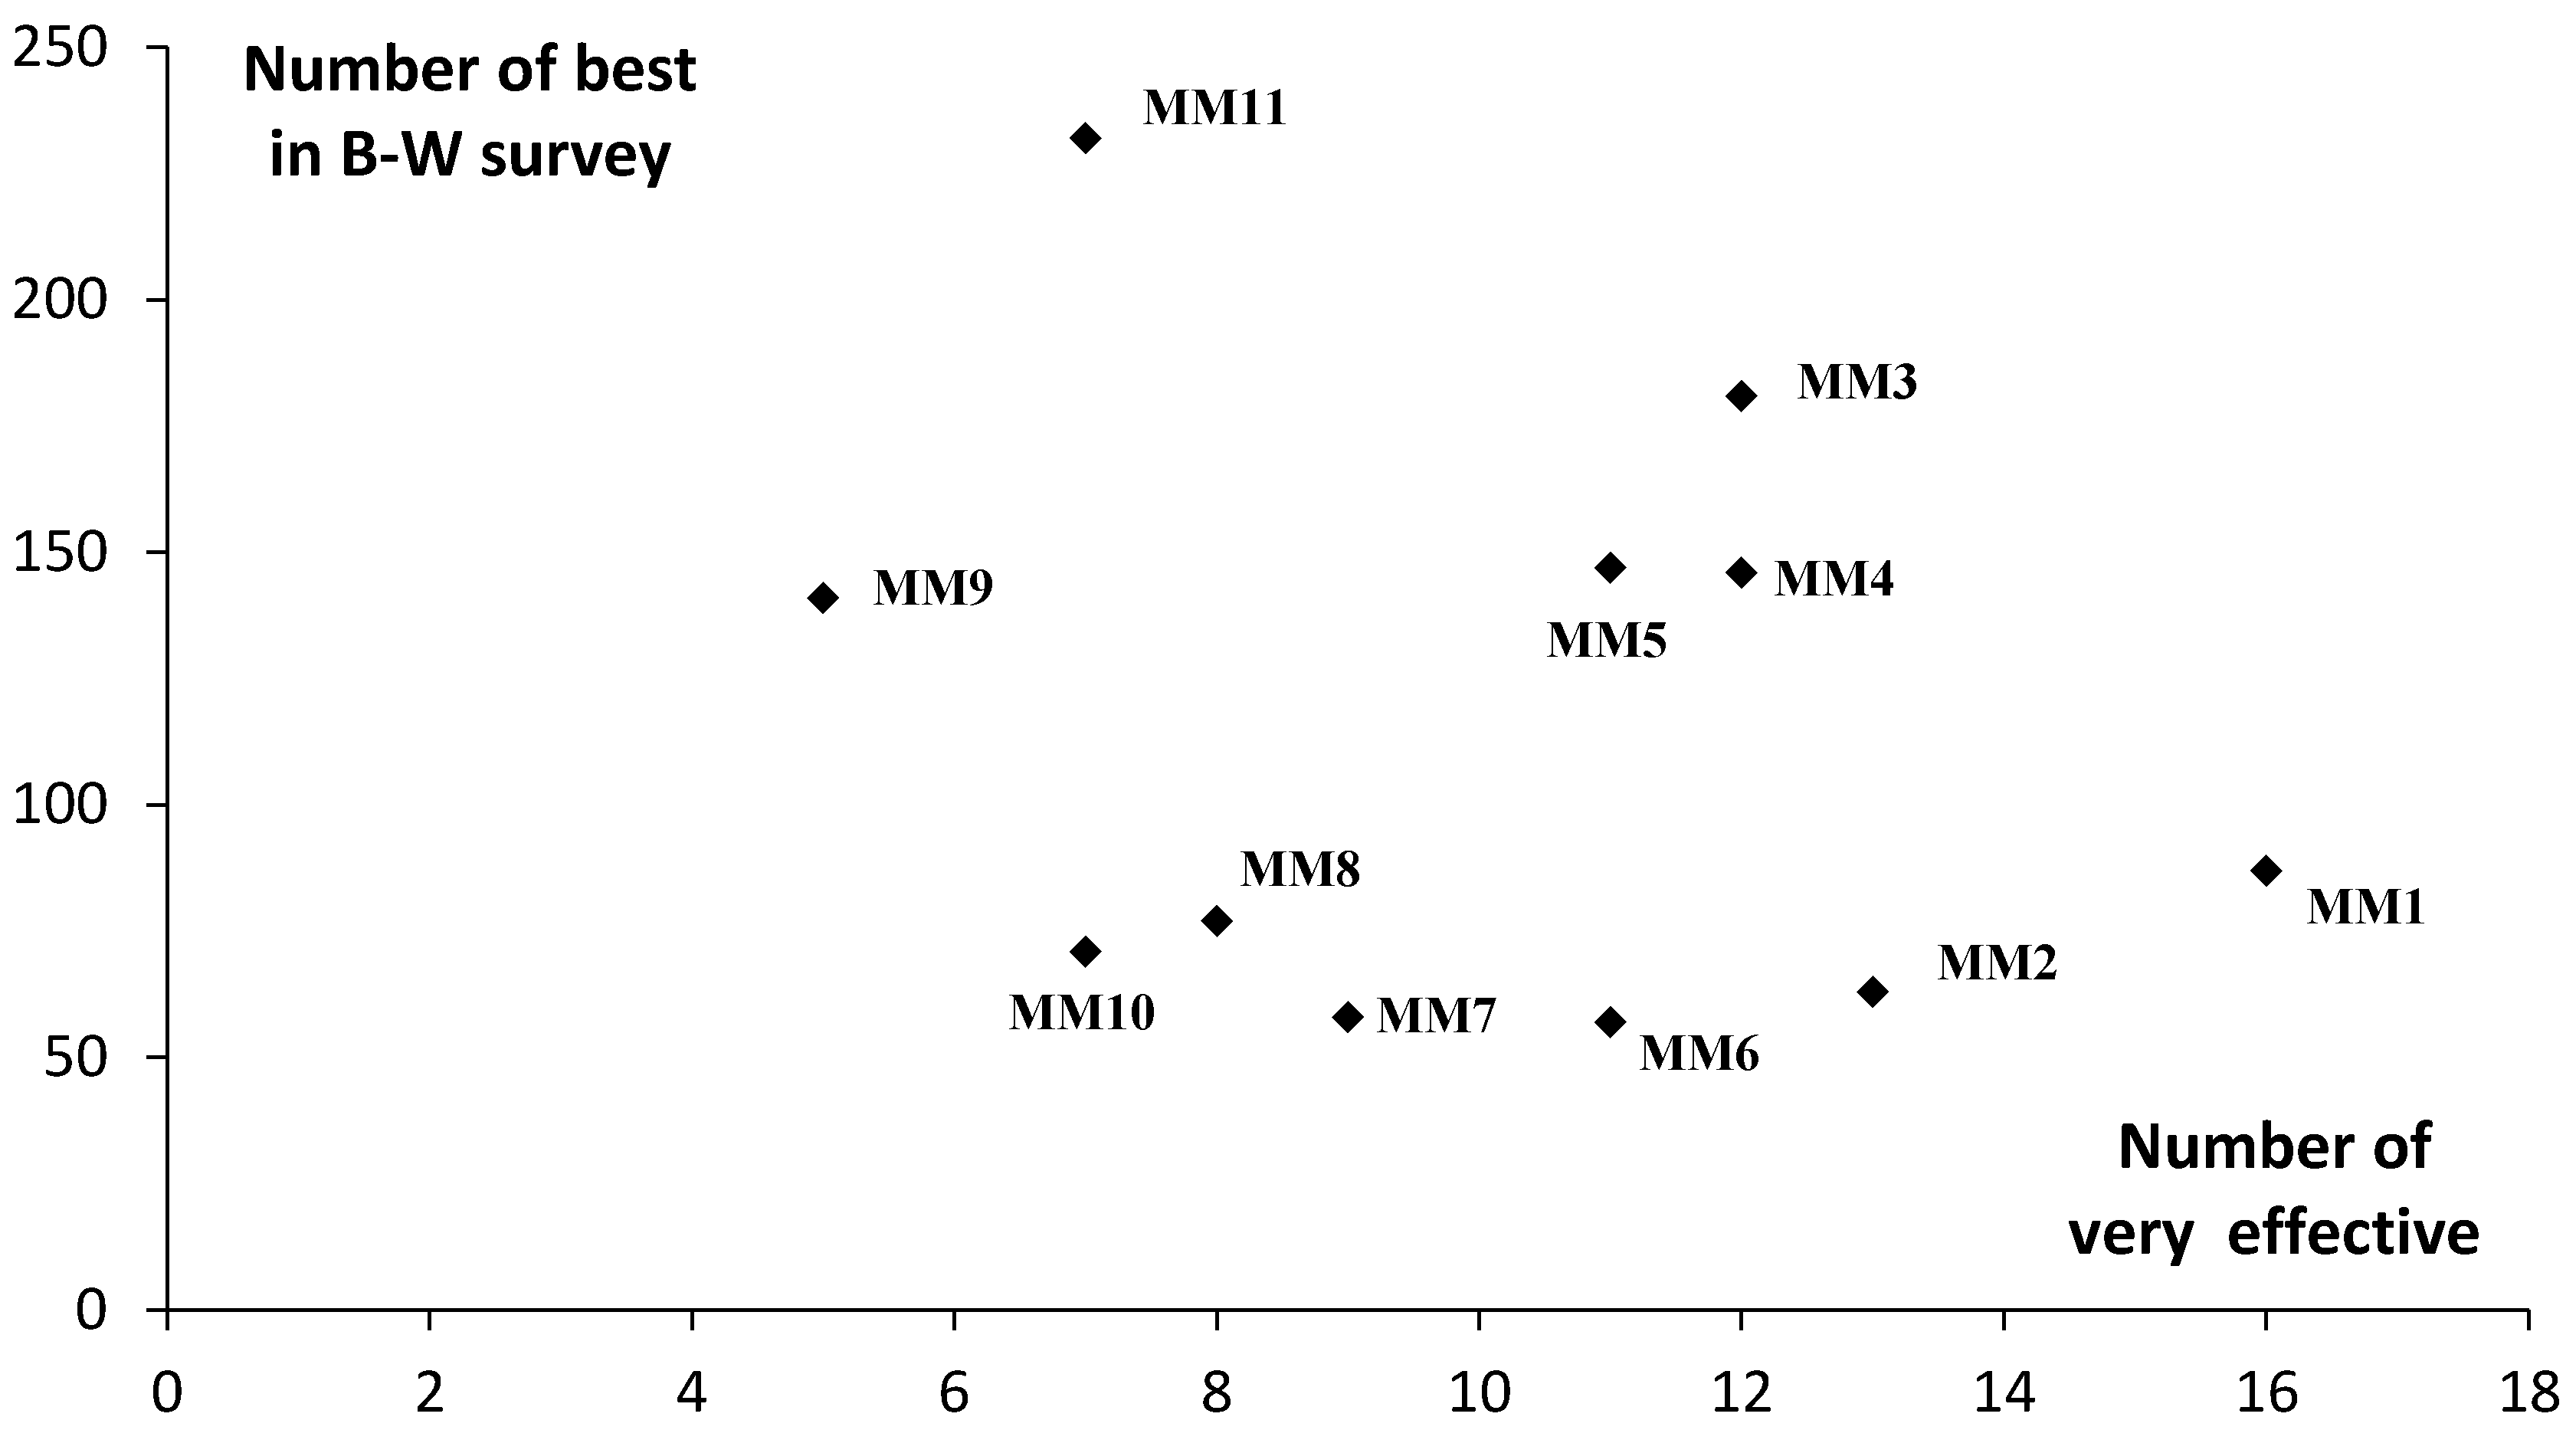
Both the expert effectiveness and farmer applicability scores are plotted in two 2 × 2 spaces (Figure 2 and Figure 3). The axes of Figure 2 represented the standard B-W score and the average effective score from experts, while the titles of “applicable” and “very effective” are displayed in Figure 3. It is noticeable that MMs in the upper right area scored highly for both effectiveness and applicability. Neither figure shown an MM, which could combine best effectiveness and applicability. However, some important conclusions could be made. MM11 (applying STFF) and MM1 (reducing the use of chemical fertilizers) always located at the top or in the right area in the coordinate system. MM2 (adopting no-till cropping) and MM6 (reducing the use of chemical pesticides) performed well in effectiveness, although they demonstrated limited applicability. In any case, MM3 (returning stubble and straw to field) and MM4 (applying controlled-release fertilizers) were considered to be both relatively applicable and effective carbon-mitigation practices during rice cropping.
4.2. LCM Results
With the employment of the latent model, we could conveniently use the empirical estimation to assess what types of MMs are applicable for different farmers and how the covariates in the model affect the choices. We tentatively estimated several models to determine the optimal number of classes for our analysis with the software, Latent Gold 4.5. Table 6 displays the estimates of four models, including the L2 and Log-Likelihood value as well as their Bayesian Information Criteria (BIC). As a smaller BIC implies a better estimation [42], it is easy to notice that the model of class 2 performed best. On the criteria of parsimony, a latent cluster model of two classes with several covariates was selected for further analysis. Furthermore, we estimated the robust standard errors and Wald statistics to validate our results [49].
Table 7 provides the empirical results of this latent class estimation. As observed, differences across classes were significant. Farmers in Class 1 viewed input elements management as more applicable. In contrast, Class 2 with two positive coefficients represented the group of respondents, who regarded soil and water management as most applicable followed by new science and technology. The size of the class or the probability of belonging to Class 1 was 59.44%, while this was 40.56% in Class 2. Thus, a relatively larger number of people were likely to take measures related to the application of fertilizers and pesticides instead of applying some tillage management practices or new science and technology. The application of this LCM highlighted the existence of the heterogeneous preferences (applicable) for mitigation measures.
Considering the socio-demographic profiles of the two classes, three main covariates were significant determinants of class membership and were in bold font in the table: age, part time and plots. Through the signs of coefficients, we drew the conclusion that those who were older and spending more time on non-agricultural jobs were willing to take the MMs related to arranging input, such as fertilizers and pesticides. Meanwhile, the fragmentation of farmland also led to the input management.
Despite the perceptions of applicability not actually guaranteeing the actual behavior of applying these mitigation measures, it could be inferred that those who were attributed to Class 1 would be more than willing to implement input management measures to reduce carbon emissions in the process of growing rice if possible. Correspondingly, respondents in Class 2 would choose soil and management as mitigation measures first, followed by some practices associated with new science and technology as sub-optimal choices. These conclusions could be very useful in practical applications and policy making, especially in the extension of agriculture technique, which will be mentioned in the next section.
5. Conclusions and Implications
This paper aims to explore which mitigation measure of reducing GHG in rice cropping is considered feasible with regards to effectiveness and applicability as well as what the influencing factors are. As found in previous research, fertilizer management and conservation tillage showed great potential in mitigating GHG in the rice system [50,51]. Our BWS survey revealed that for rice farmers in Hubei province, the top three applicable MMs are “applying soil testing and formulated fertilization (STFF)”, “applying controlled-release fertilizers” and “returning stubble and straw to field”. The Chinese government has launched a plan to subsidize the use of STFF every year [52], with all counties having been covered with the promotion. In general, soil testing can rarely be implemented by farmers alone in China because of high detection costs. The fertilizer companies produce fertilizer on the basis of chemical composition of local soil, which requires the participation of a large number of farmers. After this, farmers obtain access to STFF mainly through the extension of agricultural technology. Thus, with the help of government, applying STFF does not appear to be difficult for them, which could explain why this measure was most likely to be adopted even though it did not show much potential in carbon mitigation as known from experts in our survey. Unfortunately, the BWS results do not coincide with the most evaluation of effectiveness from the expert survey. Thus, none of the 11 MMs performed best in both effective and applicable respects. “Returning stubble and straw to field”, “applying controlled-release fertilizers”, and “mixed use of organic and chemical fertilizers”, are considered to be comparatively balanced in terms of potential to reduce carbon emissions and practical operability. This study implied that the usage of fertilizer showed a relative advantage in terms of mitigation implementation overall. Hence, the mitigation program should concentrate more on this field.
Some farmers’ personal characteristics and socio-economic conditions could explain how the farmers were classified. As to the factors that influence the classification of farmers, the policies are different. In the case of Hubei province, it would be much more effective to promote input elements management to farmers who are older and have more time on off-farm work. Because they tend to lack time and labor in the agricultural production and management, and they are not willing to learn new farming technology. However, the improvement of fertilizer or seeds would be the most possible for them to adopt. Moreover, in areas where the land is more concentrated, such as plains, soil cultivation management and new technologies for agriculture are more widely available, and the prospects of promotion are well demonstrated. Different from farmers in the foothills areas, farmers in plain regions tend to manage large scale and concentrated lands, it would be more conducive to test and development of new technology and easier for to mechanized farming on soil. Reconciling such views may be a pre-requirement in order to reduce conflicts and could promote green agricultural technologies among farmers by designing specific MMs suited to their farm type and locality in China, especially in Hubei province. Thus, our study suggested that the mitigation policy or program targeted at particular areas or farmers instead of “one size fits all” would achieve the goal of GHG reduction more effectively.
Acknowledgments
The authors gratefully acknowledge financial support from the Fundamental Research Funds for the Central Universities (2662017PY045; 2662015QC061), the Natural Sciences Foundation of China (41501213), China Postdoctoral Science Foundation (2015M570649), and chunlei project of science and technology innovation from College of Economics and Management of Huazhong Agricultural University.
Author Contributions
Qingmeng Tong, Lu Zhang and Junbiao Zhang designed the whole study; Qingmeng Tong and Lu Zhang conducted data collection; Qingmeng Tong and Junbiao Zhang wrote the paper; Qingmeng Tong conducted the analysis and Lu Zhang made some revision on the manuscript.
Conflicts of Interest
The authors declare no conflict of interest.
References
- Den Elzen, M.G.J.; Beltran, A.M.; Hof, A.F.; van Ruijven, B.; van Vliet, J. Reduction targets and abatement costs of developing countries resulting from global and developed countries’ reduction targets by 2050. Mitig. Adapt. Strateg. Glob. Chang. 2013, 18, 491–512. [Google Scholar] [CrossRef]
- West, T.O.; Marland, G. A synthesis of carbon sequestration, carbon emissions, and net carbon flux in agriculture: Comparing tillage practices in the United States. Agric. Ecosyst. Environ. 2002, 91, 217–232. [Google Scholar] [CrossRef]
- Vleeshouwers, L.M.; Verhagen, A. Carbon emission and sequestration by agricultural land use: A model study for Europe. Glob. Chang. Biol. 2002, 8, 519–530. [Google Scholar] [CrossRef]
- Meyer-Aurich, A.; Weersink, A.; Janovicek, K.; Deen, B. Cost efficient rotation and tillage options to sequester carbon and mitigate GHG emissions from agriculture in Eastern Canada. Agric. Ecosyst. Environ. 2006, 117, 119–127. [Google Scholar] [CrossRef]
- Katayanagi, N.; Fumoto, T.; Hayano, M.; Takata, Y.; Kuwagata, T.; Shirato, Y.; Sawano, S.; Kajiura, M.; Sudo, S.; Ishigooka, Y.; et al. Development of a method for estimating total CH4 emission from rice paddies in Japan using the DNDC-Rice model. Sci. Total Environ. 2016, 547, 429–440. [Google Scholar] [CrossRef] [PubMed]
- Food and Agriculture Organization. Statistical Yearbook 2013: World Food and Agriculture. Available online: http://www.fao.org/docrep/018/i3107e/i3107e00.htm (accessed on 3 December 2016).
- Ministry of Agriculture. Notification of the Preparation for the Work of Soil Testing and Formulated Fertilization in 2014 from General Offices of Ministry of Agriculture and Ministry of Finance. Available online: http://www.moa.gov.cn/govpublic/CWS/201405/t20140523_3915330.htm (accessed on 20 December 2016). (In Chinese)
- Minamikawa, K.; Fumoto, T.; Iizumi, T.; Cha-Un, N.; Pimple, U.; Nishimori, M.; Ishigooka, Y.; Kuwagata, T. Prediction of future methane emission from irrigated rice paddies in central Thailand under different water management practices. Sci. Total Environ. 2016, 566, 641–651. [Google Scholar] [CrossRef] [PubMed]
- Nunes, F.A.; Seferin, M.; Maciel, V.G.; Flôres, S.H.; Ayub, M.A.Z. Life cycle greenhouse gas emissions from rice production systems in Brazil: A comparison between minimal tillage and organic farming. J. Clean. Prod. 2016, 139, 799–809. [Google Scholar] [CrossRef]
- Zhang, G.; Wang, X.; Sun, B.; Zhao, H.; Lu, F.; Zhang, L. Status of mineral nitrogen fertilization and net mitigation potential of the state fertilization recommendation in Chinese cropland. Agric. Syst. 2016, 146, 1–10. [Google Scholar] [CrossRef]
- Ray, P.K.; Jana, A.K.; Maitra, D.N.; Saha, M.N.; Chaudhury, J.; Saha, S.; Saha, A.R. Fertilizer prescriptions on soil test basis for jute, rice and wheat in a Typic Ustochrept. J. Indian Soc. Soil. Sci. 2000, 43, 79–84. [Google Scholar]
- Arunrat, N.; Wang, C.; Pumijumnong, N. Alternative cropping systems for greenhouse gases mitigation in rice field: A case study in Phichit province of Thailand. J. Clean. Prod. 2016, 133, 657–671. [Google Scholar] [CrossRef]
- Wang, W.; Koslowski, F.; Nayak, D.R.; Smith, P.; Saetnan, E.; Ju, X.; Guo, L.; Han, G.; De Perthuis, C.; Lin, E.; et al. Greenhouse gas mitigation in Chinese agriculture: Distinguishing technical and economic potentials. Glob. Environ. Chang. 2014, 26, 53–62. [Google Scholar] [CrossRef]
- Rochecouste, J.F.; Dargusch, P.; Cameron, D.; Smith, C. An analysis of the socio-economic factors influencing the adoption of conservation agriculture as a climate change mitigation activity in Australian dryland grain production. Agric. Syst. 2014, 135, 20–30. [Google Scholar] [CrossRef]
- Grabowski, P.P.; Kerr, J.M.; Haggblade, S.; Kabwe, S. Determinants of adoption and disadoption of minimum tillage by cotton farmers in eastern Zambia. Agric. Ecosyst. Environ. 2016, 231, 54–67. [Google Scholar] [CrossRef]
- Stuart, D.; Schewe, R.L.; McDermott, M. Reducing nitrogen fertilizer application as a climate change mitigation strategy: Understanding farmer decision-making and potential barriers to change in the US. Land Use Policy 2014, 36, 210–218. [Google Scholar] [CrossRef]
- Vellinga, T.V.; De Haan, M.H.A.; Schils, R.L.M.; Evers, A.; Van den Pol–van Dasselaar, A. Implementation of GHG mitigation on intensive dairy farms: Farmers’ preferences and variation in cost effectiveness. Livest. Sci. 2011, 137, 185–195. [Google Scholar] [CrossRef]
- Zhu, H.J.; Tian, Z.H. Analysis on the rice farmer’s willingness to use low-carbon technologies measures: Based on the survey of the rice-producing areas in Southern China. J. Agrot. Econ. 2013, 215, 62–71. (In Chinese) [Google Scholar] [CrossRef]
- Morgan, M.I.; Hine, D.W.; Bhullar, N.; Loi, N.M. Landholder adoption of low emission agricultural practices: A profiling approach. J. Environ. Psychol. 2015, 41, 35–44. [Google Scholar] [CrossRef]
- Page, G.; Bellotti, B. Farmers value on-farm ecosystem services as important, but what are the impediments to participation in PES schemes? Sci. Total Environ. 2015, 515, 12–19. [Google Scholar] [CrossRef] [PubMed]
- Finn, A.; Louviere, J.J. Determining the appropriate response to evidence of public concern: The case of food safety. J. Public Policy Mark. 1992, 11, 12–25. [Google Scholar]
- Lusk, J.L.; Briggeman, B.C. Food values. Am. J. Agric. Econ. 2009, 91, 184–196. [Google Scholar] [CrossRef]
- Flynn, T.N.; Louviere, J.J.; Peters, T.J.; Coast, J. Best-worst scaling: What it can do for health care research and how to do it. J. Health Econ. 2007, 26, 171–189. [Google Scholar] [CrossRef] [PubMed]
- Louviere, J.J.; Lings, I.; Islam, T.; Gudergan, S.; Flynn, T. An introduction to the application of (case1) best–worst scaling in marketing research. Int. J. Res. Mark. 2013, 30, 292–303. [Google Scholar] [CrossRef]
- Ochieng, B.J.; Hobbs, J.E. Incentives for cattle producers to adopt an E. coli vaccine: An application of best–worst scaling. Food Policy 2016, 59, 78–87. [Google Scholar] [CrossRef]
- Marley, A.A.J.; Louviere, J.J. Some probabilistic models of best, worst, and best–worst choices. J. Math. Psychol. 2005, 49, 464–480. [Google Scholar] [CrossRef]
- Cohen, E. Applying best–worst scaling to wine marketing. Int. J. Wine Bus. Res. 2009, 21, 8–23. [Google Scholar] [CrossRef]
- Coltman, T.; Devinney, T.M.; Keating, B. Best-worst scaling approach to predict customer choice for 3PL services. J. Bus. Logist. 2011, 32, 139–152. [Google Scholar] [CrossRef]
- Louviere, J.J.; Flynn, T.N. Using best-worst scaling choice experiments to measure public perceptions and preferences for healthcare reform in Australia. Patient Cent. Outcomes Res. 2010, 3, 275–283. [Google Scholar] [CrossRef] [PubMed]
- Jones, A.K.; Jones, D.L.; Edwards-Jones, G.; Cross, P. Informing decision making in agricultural greenhouse gas mitigation policy: A Best–Worst Scaling survey of expert and farmer opinion in the sheep industry. Environ. Sci. Policy 2013, 29, 46–56. [Google Scholar] [CrossRef]
- Dumbrell, N.P.; Kragt, M.E.; Gibson, F.L. What carbon farming activities are farmers likely to adopt? A best–worst scaling survey. Land Use Policy 2016, 54, 29–37. [Google Scholar] [CrossRef]
- Flynn, T.N.; Marley, A.A.J. Best-worst scaling: Theory and methods. In Handbook of Choice Modelling; Hess, S., Daly, A., Eds.; Edward Elgar Publishing: Cheltenham, UK, 2014. [Google Scholar]
- Da, C.T.; Phuoc, L.H.; Duc, H.N.; Troell, M.; Berg, H. Use of wastewater from striped catfish (pangasianodon hypophthalmus) pond culture for integrated rice–fish–vegetable farming systems in the Mekong Delta, Vietnam. Agroecol. Sust. Food 2015, 39, 580–597. [Google Scholar] [CrossRef]
- Gnahoua, J.B.G.; Ettien, D.J.B.; N’zué, B.; De Neve, S.; Boeckx, P. Assessment of low-input technologies to improve productivity of early harvested cassava in Côte d’Ivoire. Agroecol. Sustain. Food 2016, 40, 941–964. [Google Scholar] [CrossRef]
- Cai, Z.C.; Xing, G.X.; Yan, X.Y.; Xu, H.; Tsuruta, H.; Yagi, K.; Minami, K. Methane and nitrous oxide emissions from rice paddy fields as affected by nitrogen fertilisers and water management. Plant Soil 1997, 196, 7–14. [Google Scholar] [CrossRef]
- Smith, K.A.; Conen, F. Impacts of land management on fluxes of trace greenhouse gases. Soil Use Manag. 2004, 20, 255–263. [Google Scholar] [CrossRef]
- Xu, H.; Cai, Z.C.; Jia, Z.J.; Tsuruta, H. Effect of land management in winter crop season on CH4 emission during the following flooded and rice-growing period. In Methane Emissions from Major Rice Ecosystems in Asia; Springer: Dordrecht, The Netherlands, 2000; pp. 327–332. Available online: https://0-link-springer-com.brum.beds.ac.uk/chapter/10.1007/978-94-010-0898-3_27 (accessed on 24 May 2017).
- Yagi, K.; Tsuruta, H.; Minami, K. Possible options for mitigating methane emission from rice cultivation. Nutr. Cycl. Agroecosyst. 1997, 49, 213–220. [Google Scholar] [CrossRef]
- Wassmann, R.; Lantin, R.S.; Neue, H.U.; Buendia, L.V.; Corton, T.M.; Lu, Y. Characterization of methane emissions from rice fields in Asia. III. Mitigation options and future research needs. Nutr. Cycl. Agroecosyst. 2000, 58, 23–36. [Google Scholar] [CrossRef]
- Sloane, N.J.A. A Library of Orthogonal Arrays. Available online: http://www2.research.att.com/~njas/oadir/ (accessed on 11 May 2016).
- Marti, J. A best–worst scaling survey of adolescents’ level of concern for health and non-health consequences of smoking. Soc. Sci. Med. 2012, 75, 87–97. [Google Scholar] [CrossRef] [PubMed]
- Loureiro, M.L.; Arcos, F.D. Applying best–worst scaling in a stated preference analysis of forest management programs. J. For. Econ. 2012, 18, 381–394. [Google Scholar] [CrossRef]
- Louviere, J.J. What you don’t know might hurt you: Some unresolved issues in the design and analysis of discrete choice experiments. Environ. Resour. Econ. 2006, 34, 173–188. [Google Scholar] [CrossRef]
- Greene, W.; Hensher, D.A. latent class model for discrete choice analysis: Contrasts with mixed logit. Transp. Res. Part B Methodol. 2003, 37, 681–698. [Google Scholar] [CrossRef]
- Roeder, K.; Lynch, K.G.; Nagin, D.S. Modeling uncertainty in latent class membership: A case study in criminology. J. Am. Stat. Assoc. 1999, 94, 766–776. [Google Scholar] [CrossRef]
- Poot-López, G.R.; Hernández, J.M.; Gasca-Leyva, E. Input management in integrated agriculture–aquaculture systems in Yucatan: Tree spinach leaves as a dietary supplement in tilapia culture. Agric. Syst. 2010, 103, 98–104. [Google Scholar] [CrossRef]
- Lagerkvist, C.J.; Okello, J.; Karanja, N. Anchored vs. relative best–worst scaling and latent class vs. hierarchical bayesian analysis of best–worst choice data: Investigating the importance of food quality attributes in a developing country. Food Qual. Preference 2012, 25, 29–40. [Google Scholar] [CrossRef]
- Adamsen, J.M.; Rundle-Thiele, S.; Whitty, J.A. Best-worst scaling. Reflections on presentation, analysis, and lessons learnt from case 3 BWS experiments. Mark. Soc. Res. 2013, 21, 9–27. [Google Scholar]
- Bartolucci, F.; Farcomeni, A. Information matrix for hidden Markov models with covariates. Stat. Comput. 2015, 25, 515–526. [Google Scholar] [CrossRef]
- Linquist, B.A.; Adviento-Borbe, M.A.; Pittelkow, C.M.; Van Kessel, C.; Van Groenigen, K.J. Fertilizer management practices and greenhouse gas emissions from rice systems: A quantitative review and analysis. Field Crops Res. 2012, 135, 10–21. [Google Scholar] [CrossRef]
- Ahmad, S.; Li, C.; Dai, G.; Zhan, M.; Wang, J.; Pan, S.; Cao, C. Greenhouse gas emission from direct seeding paddy field under different rice tillage systems in central China. Soil Tillage Res. 2009, 106, 54–61. [Google Scholar] [CrossRef]
- Ministry of Agriculture. The Implement Opinion Regarding Fighting against Agricultural Non-Point Pollution Issued from the Ministry of Agriculture. Available online: http://www.moa.gov.cn/zwllm/zcfg/qnhnzc/201504/t20150413_4524372.htm (accessed on 15 December 2016). (In Chinese)
Figure 1.
Areas surveyed.

Figure 2.
Plot of effectiveness and applicability (standard score); applicability is represented by the B-W score (standard score); and effectiveness is the average effective score from experts.
Figure 2.
Plot of effectiveness and applicability (standard score); applicability is represented by the B-W score (standard score); and effectiveness is the average effective score from experts.

Figure 3.
Plot of effectiveness and applicability (numbers).


Table 1.
Mitigation measures analyzed with farming characteristics.
| Mitigation Measures | Input Elements Management | Soil and Water Management | New Science and Technology |
|---|---|---|---|
| 1 = Reducing the use of chemical fertilizers | ✕ | ✕ | |
| 2 = Adopting no-till cropping | ✕ | ✕ | |
| 3 = Returning stubble and straw to field | ✕ | ✕ | ✕ |
| 4 = Applying controlled-release fertilizers | ✕ | ✕ | |
| 5 = Mixed use of organic and chemical fertilizers | ✕ | ✕ | |
| 6 = Reducing the use of chemical pesticides | ✕ | ||
| 7 = Applying intermittent irrigation | ✕ | ✕ | |
| 8 = Applying low-carbon rice seeds (high nitrogen efficiency and low permeability) | ✕ | ✕ | |
| 9 = Applying aquaculture in rice paddy | ✕ | ✕ | |
| 10 = Planting green manure | ✕ | ✕ | |
| 11 = Applying soil testing and formulated fertilization | ✕ | ✕ | ✕ |
Table 2.
The model matrix.
| Items | Choice Sets | Number of Appearance in the Survey | |||||||||||
|---|---|---|---|---|---|---|---|---|---|---|---|---|---|
| CS1 | CS2 | CS3 | CS4 | CS5 | CS6 | CS7 | CS8 | CS9 | CS10 | CS11 | CS12 | ||
| MM1 | 1 | 0 | 0 | 1 | 0 | 0 | 0 | 1 | 1 | 1 | 0 | 1 | 6 |
| MM2 | 0 | 0 | 1 | 1 | 0 | 1 | 1 | 1 | 0 | 0 | 0 | 1 | 6 |
| MM3 | 1 | 0 | 1 | 0 | 0 | 1 | 0 | 0 | 0 | 1 | 1 | 1 | 6 |
| MM4 | 0 | 0 | 1 | 0 | 1 | 1 | 0 | 1 | 1 | 1 | 0 | 0 | 6 |
| MM5 | 0 | 0 | 0 | 1 | 0 | 1 | 1 | 0 | 1 | 1 | 1 | 0 | 6 |
| MM6 | 1 | 1 | 1 | 1 | 0 | 1 | 0 | 0 | 1 | 0 | 0 | 0 | 6 |
| MM7 | 1 | 0 | 1 | 1 | 1 | 0 | 1 | 0 | 0 | 1 | 0 | 0 | 6 |
| MM8 | 0 | 1 | 1 | 0 | 0 | 0 | 1 | 0 | 1 | 1 | 0 | 1 | 6 |
| MM9 | 0 | 1 | 1 | 1 | 0 | 0 | 0 | 1 | 0 | 1 | 1 | 0 | 6 |
| MM10 | 0 | 0 | 1 | 1 | 1 | 0 | 0 | 0 | 1 | 0 | 1 | 1 | 6 |
| MM11 | 0 | 1 | 0 | 1 | 1 | 1 | 0 | 0 | 0 | 1 | 0 | 1 | 6 |
| Number of items in the choice set | 4 | 4 | 8 | 8 | 4 | 6 | 4 | 4 | 6 | 8 | 4 | 6 | |
Table 3.
Example of best-worst (B-W) questions used in the survey.
| Most Applicable | Least Applicable | |
|---|---|---|
| Adopting no-till cropping | ||
| Returning stubble and straw to field | ||
| Applying controlled-release fertilizers | ||
| Mixed use of organic and chemical fertilizers | ||
| Reducing the use of chemical pesticides | ||
| Planting green manure |
Table 4.
Description of socio-demographic characteristics.
| Variable | Description | Mean | Std. Dev. |
|---|---|---|---|
| Gender | 1 = Female; 2 = Male | 1.89 | 0.320 |
| Age | Years of age in 2016 | 52.11 | 9.221 |
| Education | Years of received education | 8.47 | 4.721 |
| Part time | The months on non-agricultural job in last year | 3.06 | 4.789 |
| Area (hectares) | Total rice farming areas | 2.71 | 6.240 |
| Plots | Number of rice planting plots | 10.75 | 13.963 |
| Soil quality | Self-evaluation of soil quality; 1 = very poor; 2 = relatively poor; 3 = general; 4 = relatively good; 5 = very good | 3.28 | 0.904 |
| Cooperative | 1 = Join an agricultural cooperative; 0 = otherwise | 0.15 | 0.361 |
| Family income (thousand yuan) | Total family income (including agricultural and non-agricultural) | 124.11 | 385.302 |
Soil quality is treated, as ordered in the SPSS data set.
Table 5.
Best-Worst Scaling results.
| Mitigation Measures | (1) Total Best | (2) Total Worst | (3) Aggregated B-W Score | (4) B/W Score (Standard Score) | (5) Ranking Based on Standard Score | (6) Sqrt B-W | (7) Standardized Sqrt Interval Scale (Relatively Important) | (8) Ranking Based on Standardized Scale |
|---|---|---|---|---|---|---|---|---|
| Applying soil testing and formulated fertilization | 232 | 32 | 200 | 0.3175 | 1 | 2.6926 | 100 | 1 |
| Applying controlled-release fertilizers | 146 | 49 | 97 | 0.1540 | 3 | 1.7261 | 64.1076 | 2 |
| Returning stubble and straw to field | 181 | 62 | 119 | 0.1889 | 2 | 1.7086 | 63.4563 | 3 |
| Mixed use of organic and chemical fertilizers | 147 | 54 | 93 | 0.1476 | 4 | 1.6499 | 61.2763 | 4 |
| Applying aquaculture in rice paddy | 141 | 145 | −4 | −0.0064 | 5 | 0.9861 | 36.6232 | 5 |
| Applying low-carbon rice seeds | 77 | 95 | −18 | −0.0286 | 6 | 0.9003 | 33.4360 | 6 |
| Reducing the use of chemical fertilizers | 87 | 134 | −47 | −0.0746 | 7 | 0.8058 | 29.9253 | 7 |
| Reducing the use of chemical pesticides | 57 | 121 | −64 | −0.1016 | 8 | 0.6863 | 25.4904 | 8 |
| Planting green manure | 71 | 157 | −86 | −0.1365 | 10 | 0.6725 | 24.9753 | 9 |
| Applying intermittent irrigation | 58 | 137 | −79 | −0.1254 | 9 | 0.6507 | 24.1649 | 10 |
| Adopting no-till cropping | 63 | 275 | −212 | −0.3365 | 11 | 0.4786 | 17.7760 | 11 |
Notes: Column (3) = Column (1) − Column (2), Column (4) = Column (3)/(105 × 6), Column (6) = Square root of Column (1)/Column (2), Column (7) = Standardized square root interval scale.
Table 6.
Statistics employed to define the optimal number of classes.
| L2 | BIC(L2) | LL | BIC(LL) | |
|---|---|---|---|---|
| Class 1 | 1674.9597 | 1432.9538 | −838.8662 | 1924.3922 |
| Class 2 | 1582.4707 | 1400.9663 | −792.6217 | 1892.4047 |
| Class 3 | 1541.4420 | 1420.4391 | −772.1073 | 1911.8775 |
| Class 4 | 1511.7904 | 1451.2889 | −757.2815 | 1942.7273 |
Table 7.
Empirical results for Latent Class Model (2 classes).
| Attributes | Class1 Coef. | Class2 Coef. | Wald | p-Value |
|---|---|---|---|---|
| Input elements management | 0.2946 | −0.2946 | 15.3710 | 8.8 × 10⁻⁵ |
| Soil and water management | −0.4962 | 0.4962 | 24.3703 | 8.0 × 10⁻⁷ |
| New science and technology | −0.1659 | 0.1659 | 9.1533 | 0.0025 |
| Model for classes | ||||
| Gender | 0.2328 | −0.2328 | 0.3201 | 0.57 |
| Age | 0.0502 ** | −0.0502 ** | 5.8974 | 0.015 |
| Education | 0.0827 | −0.0827 | 2.0697 | 0.15 |
| Part time | 0.1097 ** | −0.1097 ** | 6.8488 | 0.0089 |
| Area | −0.1334 | 0.1334 | 2.1673 | 0.14 |
| Plots | 0.0328 ** | −0.0328 ** | 4.2592 | 0.039 |
| Soil quality | 0.0100 | −0.0100 | 0.0040 | 0.95 |
| Cooperative | 0.1122 | −0.1122 | 0.0625 | 0.80 |
| Family income | 0.0003 | −0.0003 | 0.0565 | 0.81 |
| Intercept | −3.9034 | 3.9034 | 5.7765 | 0.016 |
| Prob. | 0.5944 | 0.4056 | - | - |
Notes: * p < 0.1; ** p < 0.05.
© 2017 by the authors. Licensee MDPI, Basel, Switzerland. This article is an open access article distributed under the terms and conditions of the Creative Commons Attribution (CC BY) license (http://creativecommons.org/licenses/by/4.0/).
Share and Cite
MDPI and ACS Style
Tong, Q.; Zhang, L.; Zhang, J. Evaluation of GHG Mitigation Measures in Rice Cropping and Effects of Farmer’s Characteristics: Evidence from Hubei, China. Sustainability 2017, 9, 1066. https://0-doi-org.brum.beds.ac.uk/10.3390/su9061066
AMA Style
Tong Q, Zhang L, Zhang J. Evaluation of GHG Mitigation Measures in Rice Cropping and Effects of Farmer’s Characteristics: Evidence from Hubei, China. Sustainability. 2017; 9(6):1066. https://0-doi-org.brum.beds.ac.uk/10.3390/su9061066
Chicago/Turabian StyleTong, Qingmeng, Lu Zhang, and Junbiao Zhang. 2017. "Evaluation of GHG Mitigation Measures in Rice Cropping and Effects of Farmer’s Characteristics: Evidence from Hubei, China" Sustainability 9, no. 6: 1066. https://0-doi-org.brum.beds.ac.uk/10.3390/su9061066
Note that from the first issue of 2016, this journal uses article numbers instead of page numbers. See further details here.