
The Role of Consumers in the Transition toward Low-Carbon Living

1
School of Energy Systems, Lappeenranta University of Technology, Saimaankatu 11, 15140 Lahti, Finland
2
School of Business and Management, Lappeenranta University of Technology, Saimaankatu 11, 15140 Lahti, Finland
*
Author to whom correspondence should be addressed.
Sustainability 2017, 9(6), 958; https://0-doi-org.brum.beds.ac.uk/10.3390/su9060958
Submission received: 28 April 2017
/
Revised: 29 May 2017
/
Accepted: 31 May 2017
/
Published: 5 June 2017
(This article belongs to the Special Issue 6th World Sustainability Forum - Selected Papers)
Abstract
:Improvements in energy efficiency and production of renewable energy hold significant potential for reducing greenhouse gas emissions of housing, which accounts for 14% of global greenhouse gas emissions. In our research, we focused on the willingness of owners of detached houses to adopt renewable energy production systems of their own, and we examined perceived barriers to adopting these systems. The research was conducted using a survey and a life cycle assessment model. The survey covered three residential areas in Lahti, Finland, and the potential reductions in greenhouse gas emissions were estimated using a life cycle assessment model based on the survey results. The barriers to transformation were identified as a lack of knowledge in the following three areas: (1) the possible annual savings attained; (2) the costs of implementing energy efficiency and renewable energy production solutions; and (3) the technologies used in renewable energy production. The greenhouse gas emission reductions in the residential areas surveyed would amount to approximately 15% if the consumers implemented the solutions they considered.
1. Introduction
To maintain the global temperature rise at or below the targeted 2 °C (from the pre-industrialized temperature level), urgent and fundamental actions must be taken [1]. The European Union (EU) is committed to reducing its greenhouse gas (GHG) emissions by 80–95% from the 1990 level by 2050 [2], and the buildings sector is a priority area for meeting the target [3]. Globally, residential buildings account for 24% of total final energy use, which equates to 14% of global GHG emissions [4]. Thus, reducing the use of energy in the housing sector plays an important role in mitigating climate change. The new building stock boasts better energy efficiency than the older (but current) stock; however, as the building renewal rate is slow, it is important to improve energy efficiency and to increase the use of renewable energy in current buildings. Of all buildings in the EU, 74% of the floor area comprises residential buildings, and in turn, 66% of that area comprises detached houses [5]. Also, in Finland, new detached houses are not built as actively as before [6], which increases the value of improving the state of current houses. Therefore, owners of detached houses constitute a significant group to be taken into consideration when one thinks of ways to reduce GHG emissions. This group could reduce their contribution to GHG emissions by changing their heating systems, by implementing renewable energy production technology, and by adjusting their daily habits of energy usage.
Thus far, existing research has mainly focused on technologies related to energy efficiency and renewable energy. The role of consumers—who actually make the decisions—has not been researched as much. Based on a survey of 1250 residents, Newton and Meyer [7] established three types of environmental lifestyle segments: ‘committed’ greens, ‘material’ greens, and ‘enviro-sceptics’. Only a few differences were found in the actual consumption of energy, housing space, etc. among the segments. The research suggests that certain factors, related, for instance, to information, finance, and organization, override attitudes, opinions, and intentions as indicators of consumer behaviour. Ek and Soderholm [8] sent out a postal survey to 1200 Swedish households to analyse their willingness to save electricity by changing daily habits. The results indicated that important factors of energy-saving activities are cost, environmental attitude, and social interaction. They found no statistically significant impact from socio-economic background factors.
Valkila and Saari [9] used consumer panels to gather data about consumer attitudes and potential for readiness to act in a more environmentally friendly manner. The themes of the study were urban structure, household energy consumption, mobility, and lifestyle. Based on the results, all research subjects were willing to reduce their consumption, but they were not ready to invest in more expensive, environmentally-friendly equipment.
Jakob [10] identified factors affecting the building envelope renovation decisions of detached-house owners. Based on the three approaches used, it was concluded that renovation decisions are affected by technical parameters and by general housing activities more than by socio-economic factors. The most oft-cited reasons for insulation were the building lifespan and environmental and energy considerations. Economic savings and fiscal incentives were mentioned only rarely. Also, Banfi et al. [11] evaluated consumers’ willingness to pay for the insulation of windows and facades and for ventilation systems. Their results demonstrated that consumers value energy savings, environmental benefits, and comfort benefits. However, in addition to legal, structural, and socio-economic hurdles, consumers felt that information is lacking concerning the benefits of energy efficiency measures, and that possibly the methods are insufficient for evaluating the benefits in economic terms.
Even though the role of consumers has been researched [12], the focus has been mainly directed at general attitudes and electricity saving [13,14,15,16]. What has not been researched as much is knowledge of and attitudes toward different technologies for using renewable energy, and the barriers encountered by consumers. Therefore, the research questions which this paper poses are as follows:
- What are the perceived barriers to adopting low-carbon housing solutions?
- What is the potential for greenhouse gas emission reductions if those barriers are overcome?
2. Materials and Methods
The approach of this study is quantitative. A survey was conducted to collect data about consumers’ attitudes and willingness concerning energy saving measures and renewable energy use. In addition, a life cycle assessment (LCA) model was created to estimate the potential reduction of annual GHG emissions in the studied regions if the consumers implemented the energy production systems they had already considered. The research was carried out in three residential areas featuring detached homes in Lahti, which is a city of 120,000 residents in southern Finland [17]. The areas selected mainly contain detached houses (93–94% of the buildings in the three areas) [17].
2.1. Survey
Data for the research were collected during the spring of 2016 via a postal survey distributed to 700 household mailboxes. It was possible to respond to the survey either online or on paper. Although 161 home owners replied, seven respondents lived in a row house or had not answered that question, and those replies were not considered since the research focused on owners of detached homes. There were thus 154 relevant replies, and the response rate was 22%. Eight of the replies were returned online, and the rest by mail.
The survey included 32 questions, some of which had a multiple-statement format. The questions were divided into four main categories: respondent’s background information, housing information, current household energy systems, and energy saving measures and transportation. The survey was broad, and not all the data were utilized for this paper. Most questions incorporated the Likert scale (a common rating format of surveys) [18]. The survey questions that were utilized in this research may be found in Appendix A.
Reliability
The reliability of the survey was analysed by comparing the sample (number of acceptable survey participants) and population of the studied areas (Table 1, Table 2, Table 3 and Table 4). The information about population was acquired from an online statistics database maintained by the City of Lahti [17]. In Table 1, the population is the number of detached houses in the studied areas. In Table 2, persons aged 18 or above are included in the population, as the survey was aimed for adult home-owners. In Table 3 and Table 4, the population number is higher because persons aged 15 or above were included in the statistics of the database, and it was not possible to acquire more detailed data.
The construction years of the houses correlate well. The biggest difference between the sample number and population number occurs in the decades of 1950–1959 and 1980–1989 (7%), but within the other time periods, the difference is 4% or less. There is more variation within the age groups. The sample best correlates with the population within the age groups of 45–54 and 75 or over, while within the other age groups, the range is 6–9%.
Household combined yearly income was asked about in the survey, whilst population income was listed per person in the database. Thus, to be able to compare the reported incomes, the incomes reported by the respondents were divided by two, as there are generally two adults per household. Persons over 14 years old are listed in the population, which increases the percentage of people in the lowest income group. The same phenomenon emerges within the education comparison in the percentage of the population having completed with comprehensive education.
2.2. Life Cycle Assessment Model
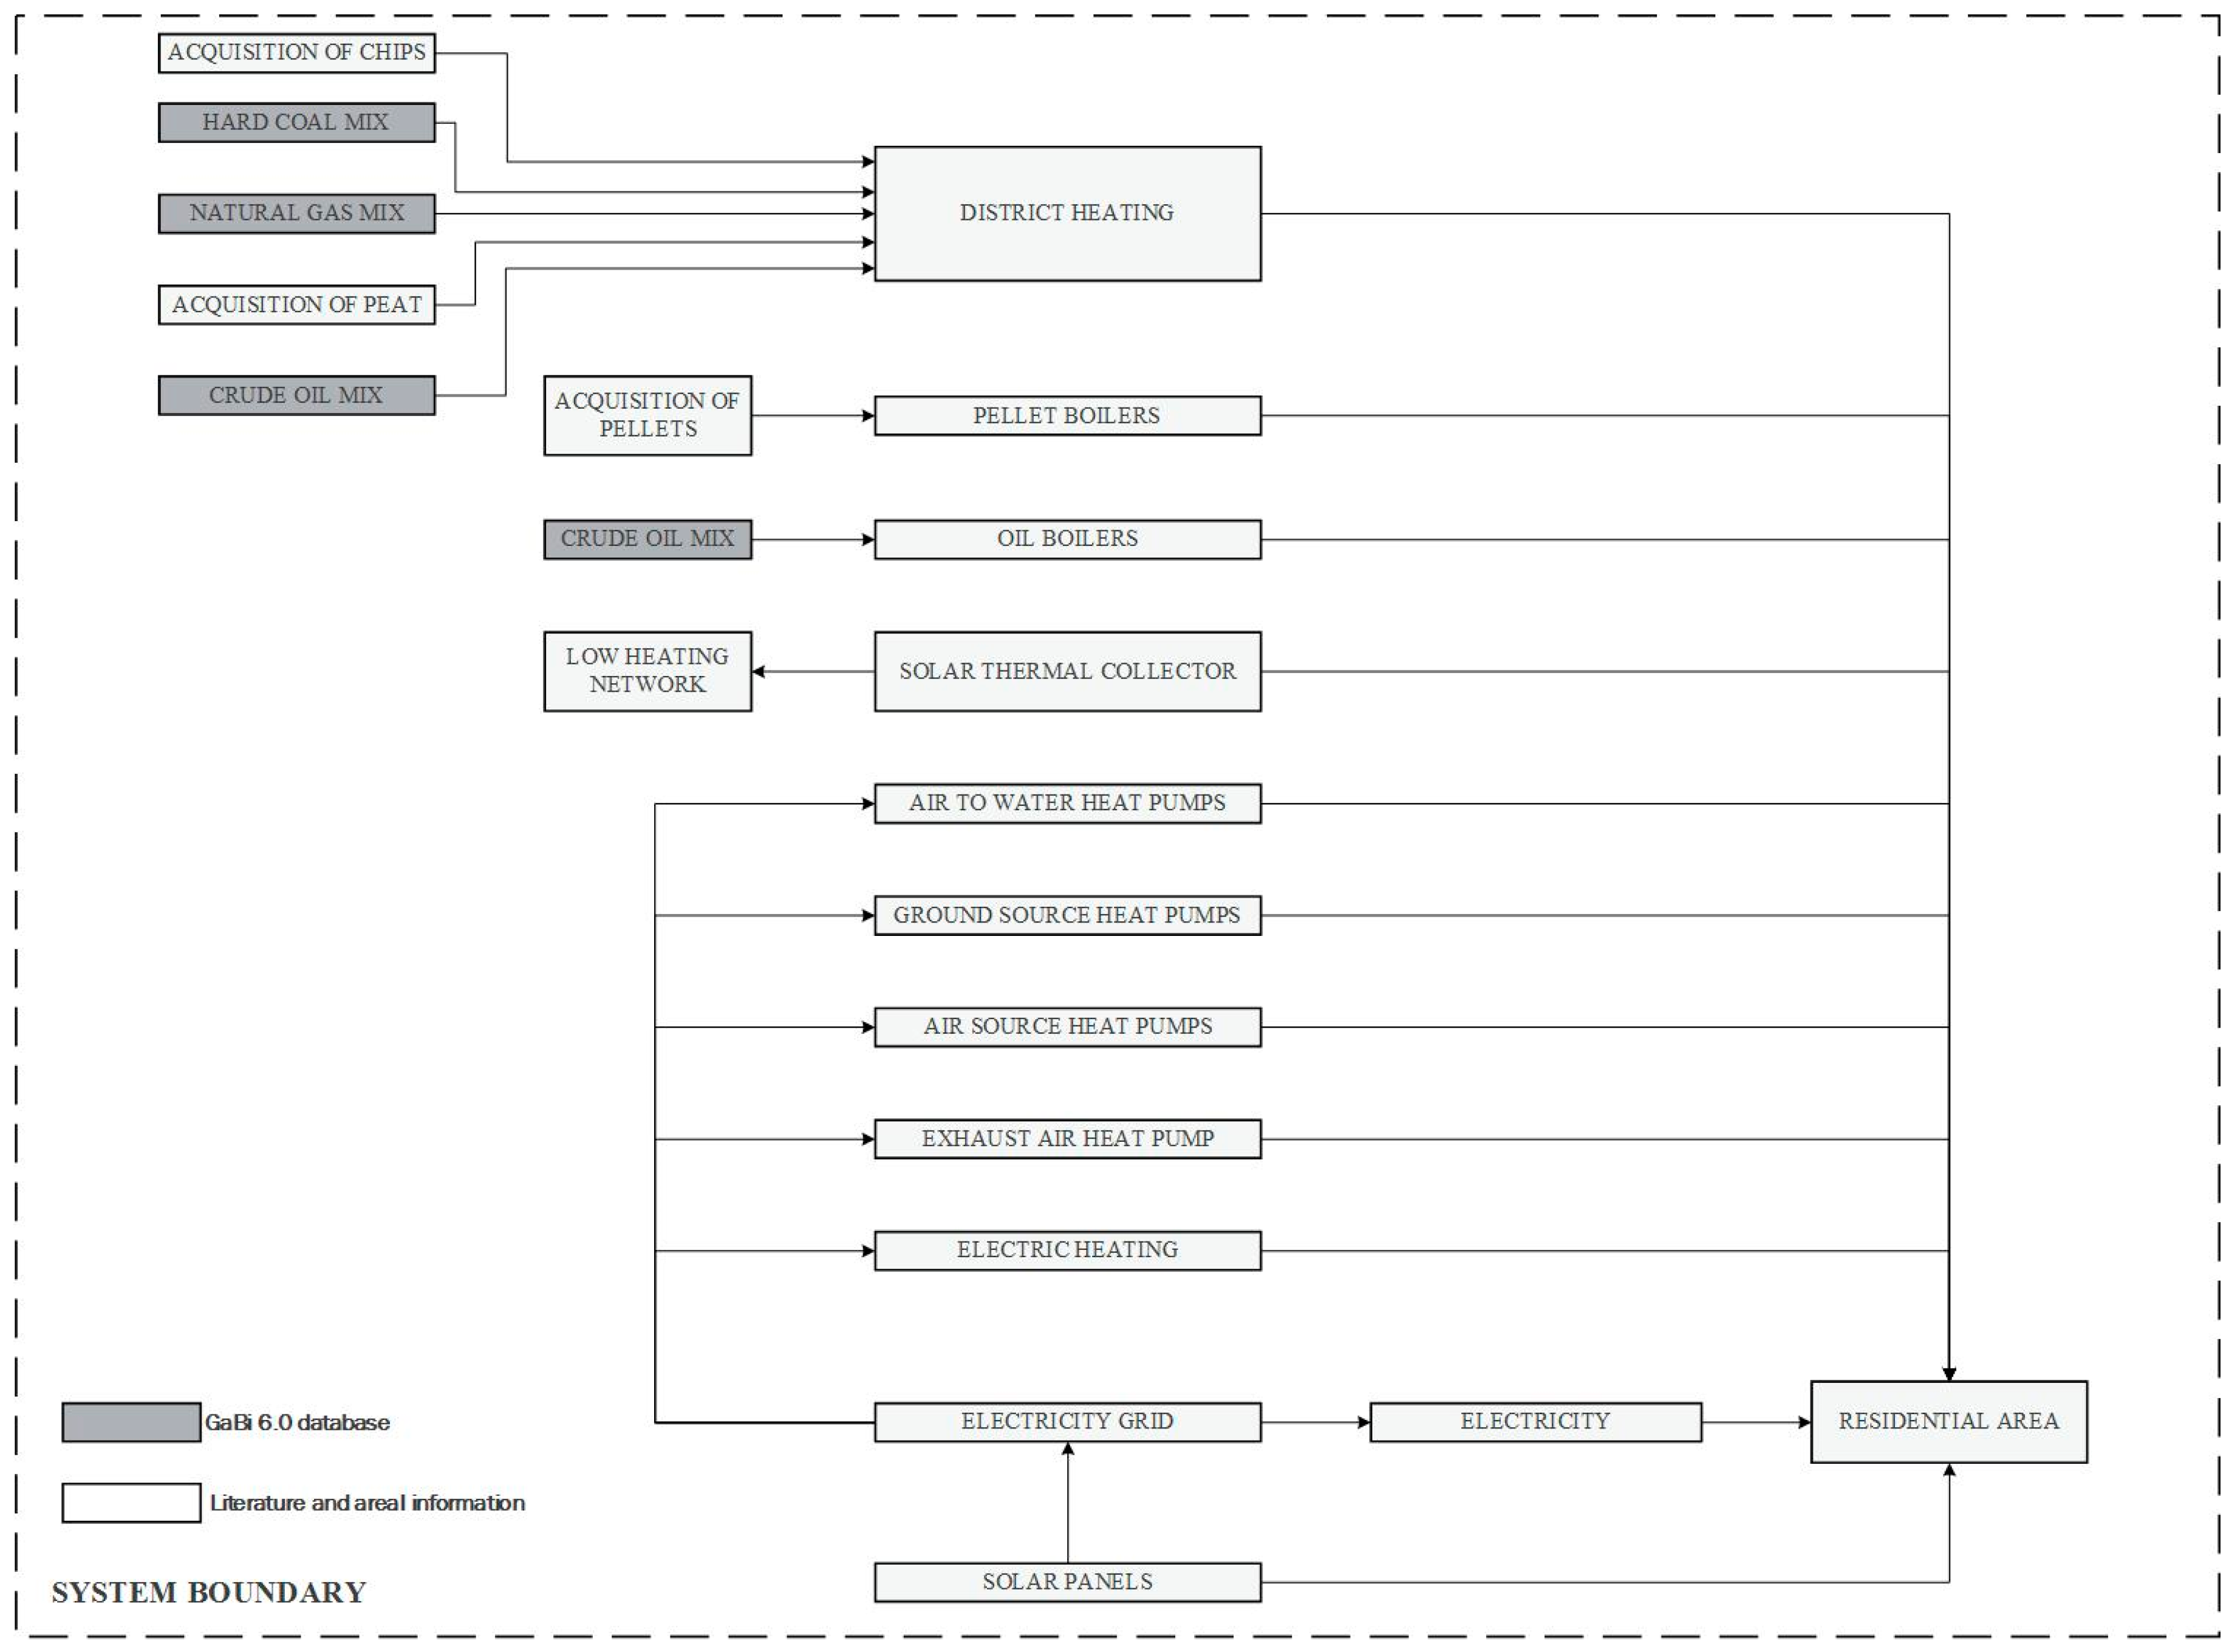
An LCA model was created to evaluate the GHG emission reduction potential for the three regions studied if households could be activated towards investing in decentralized renewable energy production. Two scenarios were created: the first presenting the current state of the household; and the second presenting a future state in which the respondents will have implemented the solutions considered. The LCA model is based on ISO 14040 [19] and ISO 14044 [20] standards. The functional unit of the model is annual energy (electricity and heat) consumption in the region. The impact category of climate change, and the characterization factor of global warming potential were selected for the study. The model was created using GaBi 6.0. LCA software (thinkstep: Leinfelden-Echterdingen, Germany). Primary data generated by the survey were applied for evaluating (1) the current energy consumption and energy production methods in the region; and (2) the possibility of a transition toward low-carbon living. Key parameters included both the willingness of households to invest in new solutions and technologies, as well as the technologies and solutions themselves that people considered most interesting. Secondary data such as specific GHG emissions related to energy production methods were mainly applied from the professional database GaBi 6.0. The values were chosen for the Finnish operational environment. The GHG factors used for electricity and district heating came from the local energy company, Lahti Energia. The model is described in Figure 1.
Based on the construction year categories and the main heating systems of the detached houses, the homes were classified into energy efficiency classes C–G (in Finland, classification is A–G) using information from the literature [21,22]. The energy efficiency numbers (kWh/m2a) used are the averages of the limits of each energy class (which are determined by the Ministry of the Environment of Finland [23]). The average area of the houses in each energy class was also incorporated into the calculation.
3. Results
3.1. Survey
Based on the survey results, most respondents (about 80%) were willing to save energy for environmental reasons, and they aim to act in an environmentally friendly manner as often as possible. The majority of respondents (88%) were interested in saving energy to achieve economic savings. However, virtually half of the respondents (47%) believed that they are not able to save enough energy to achieve real economic savings. In addition, nearly three-quarters of those surveyed (73%) were not willing to lower their standard of living to save energy.
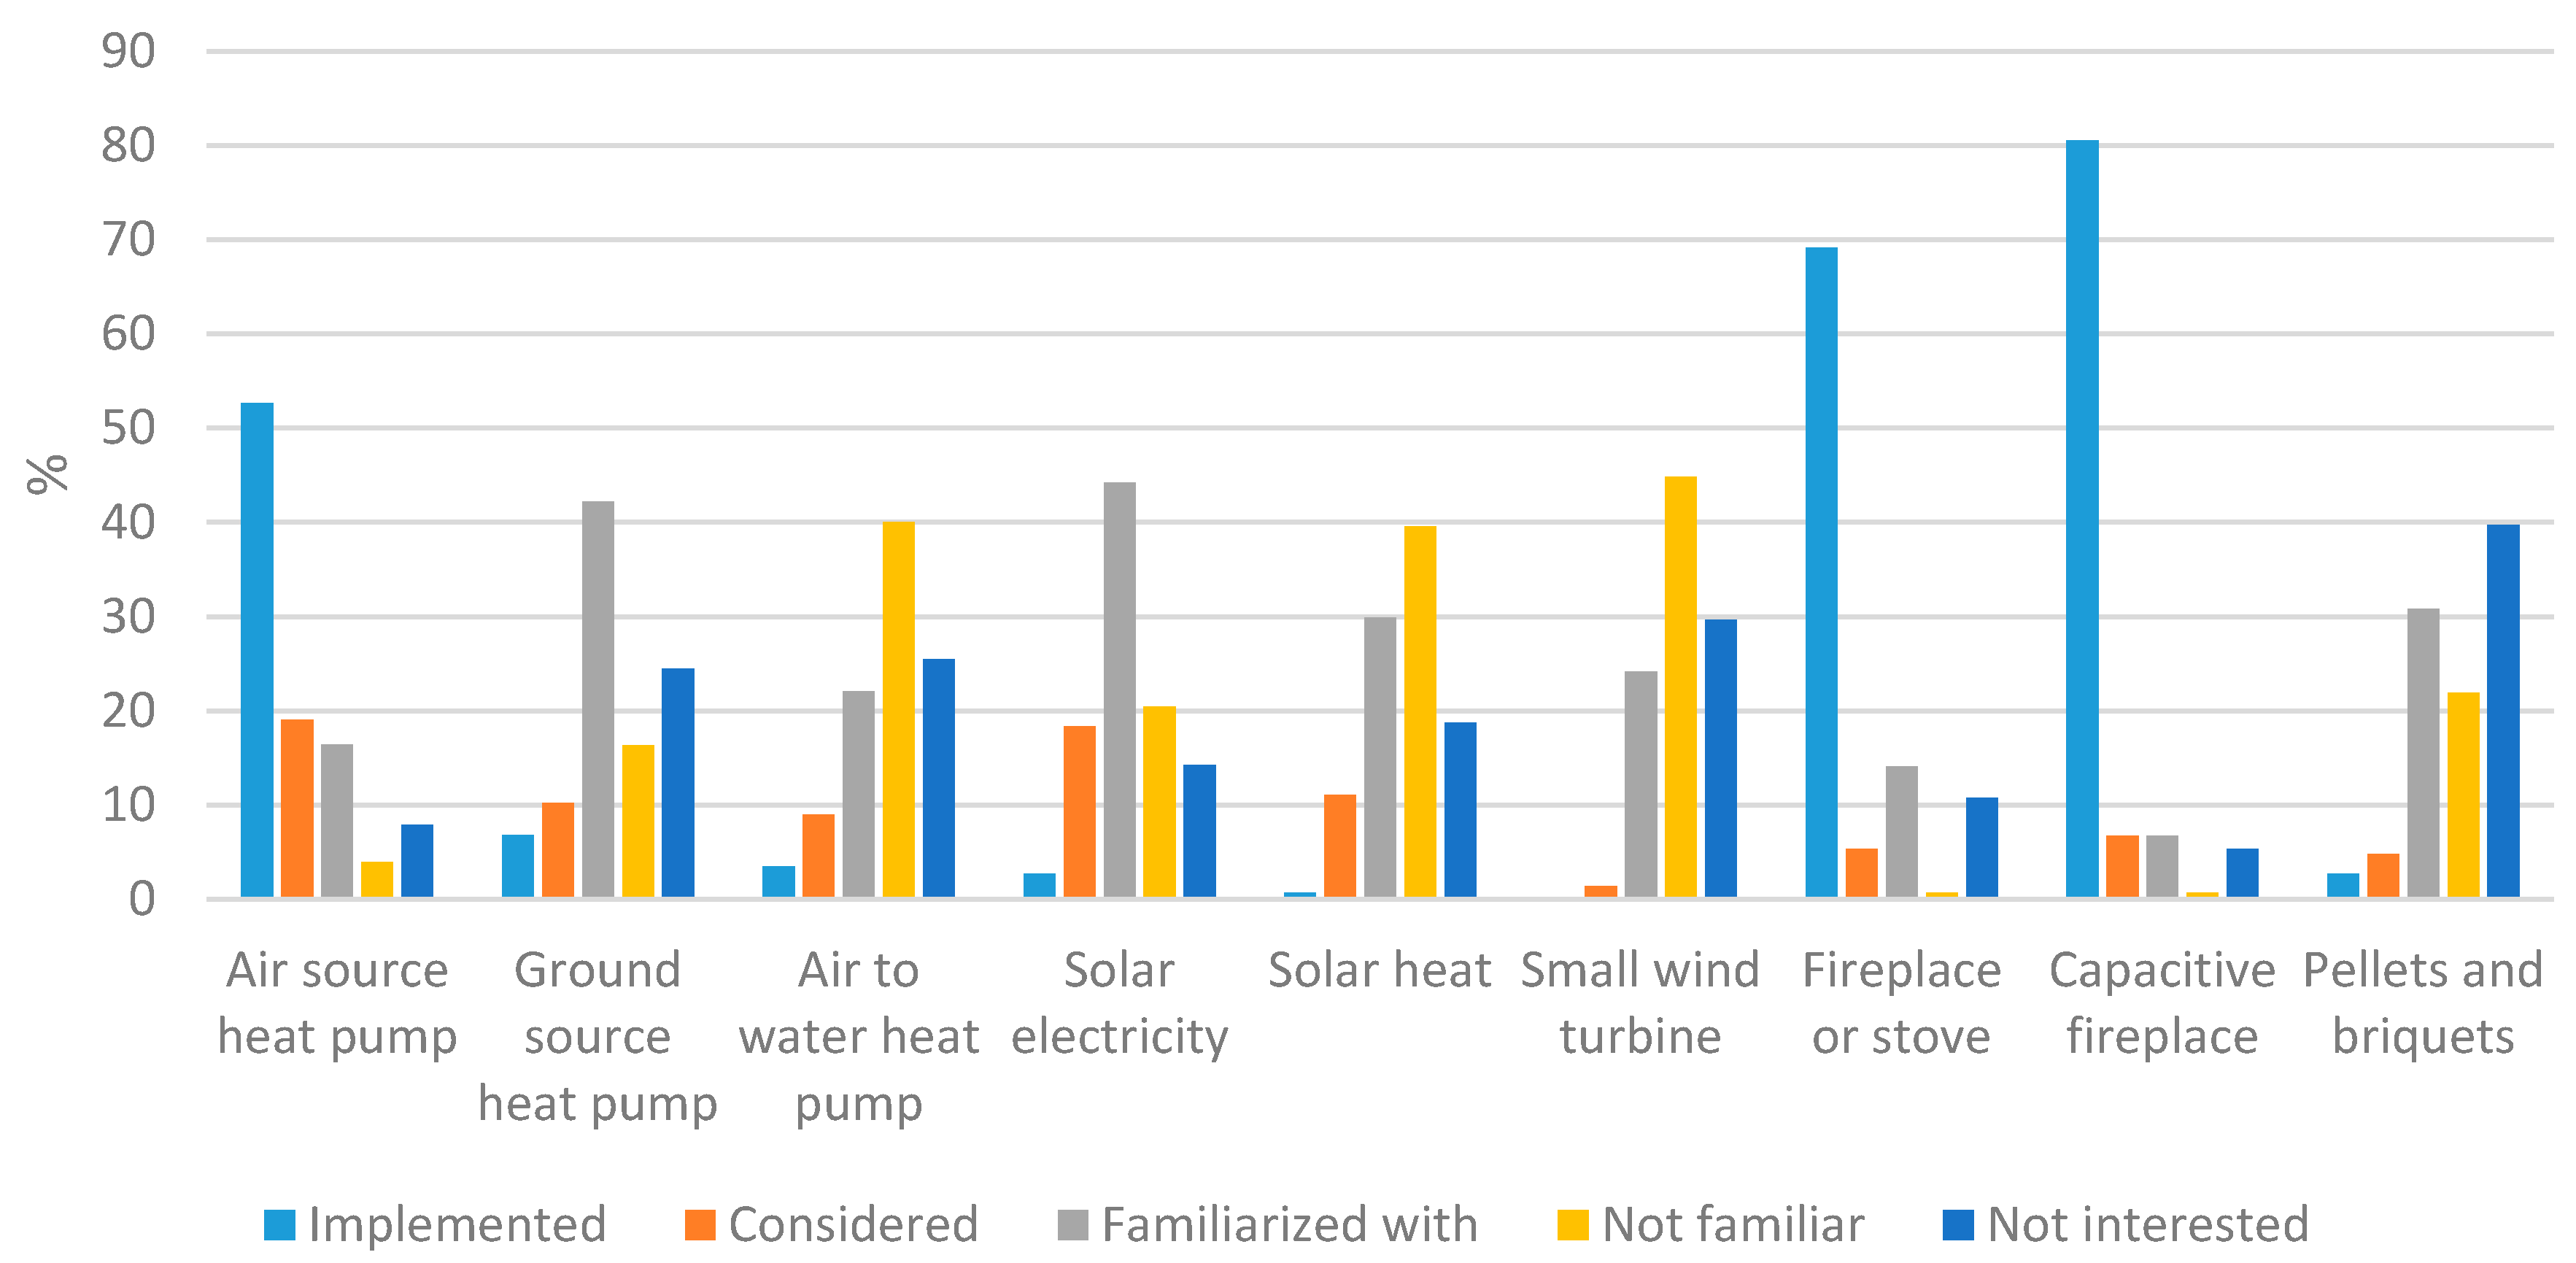
We had listed different renewable energy production solutions, and in relation to those, the respondents were requested to choose from five options: implemented, considered, familiarized with, not familiar, or not interested. The solutions and percentages of the answers are presented in Figure 2.
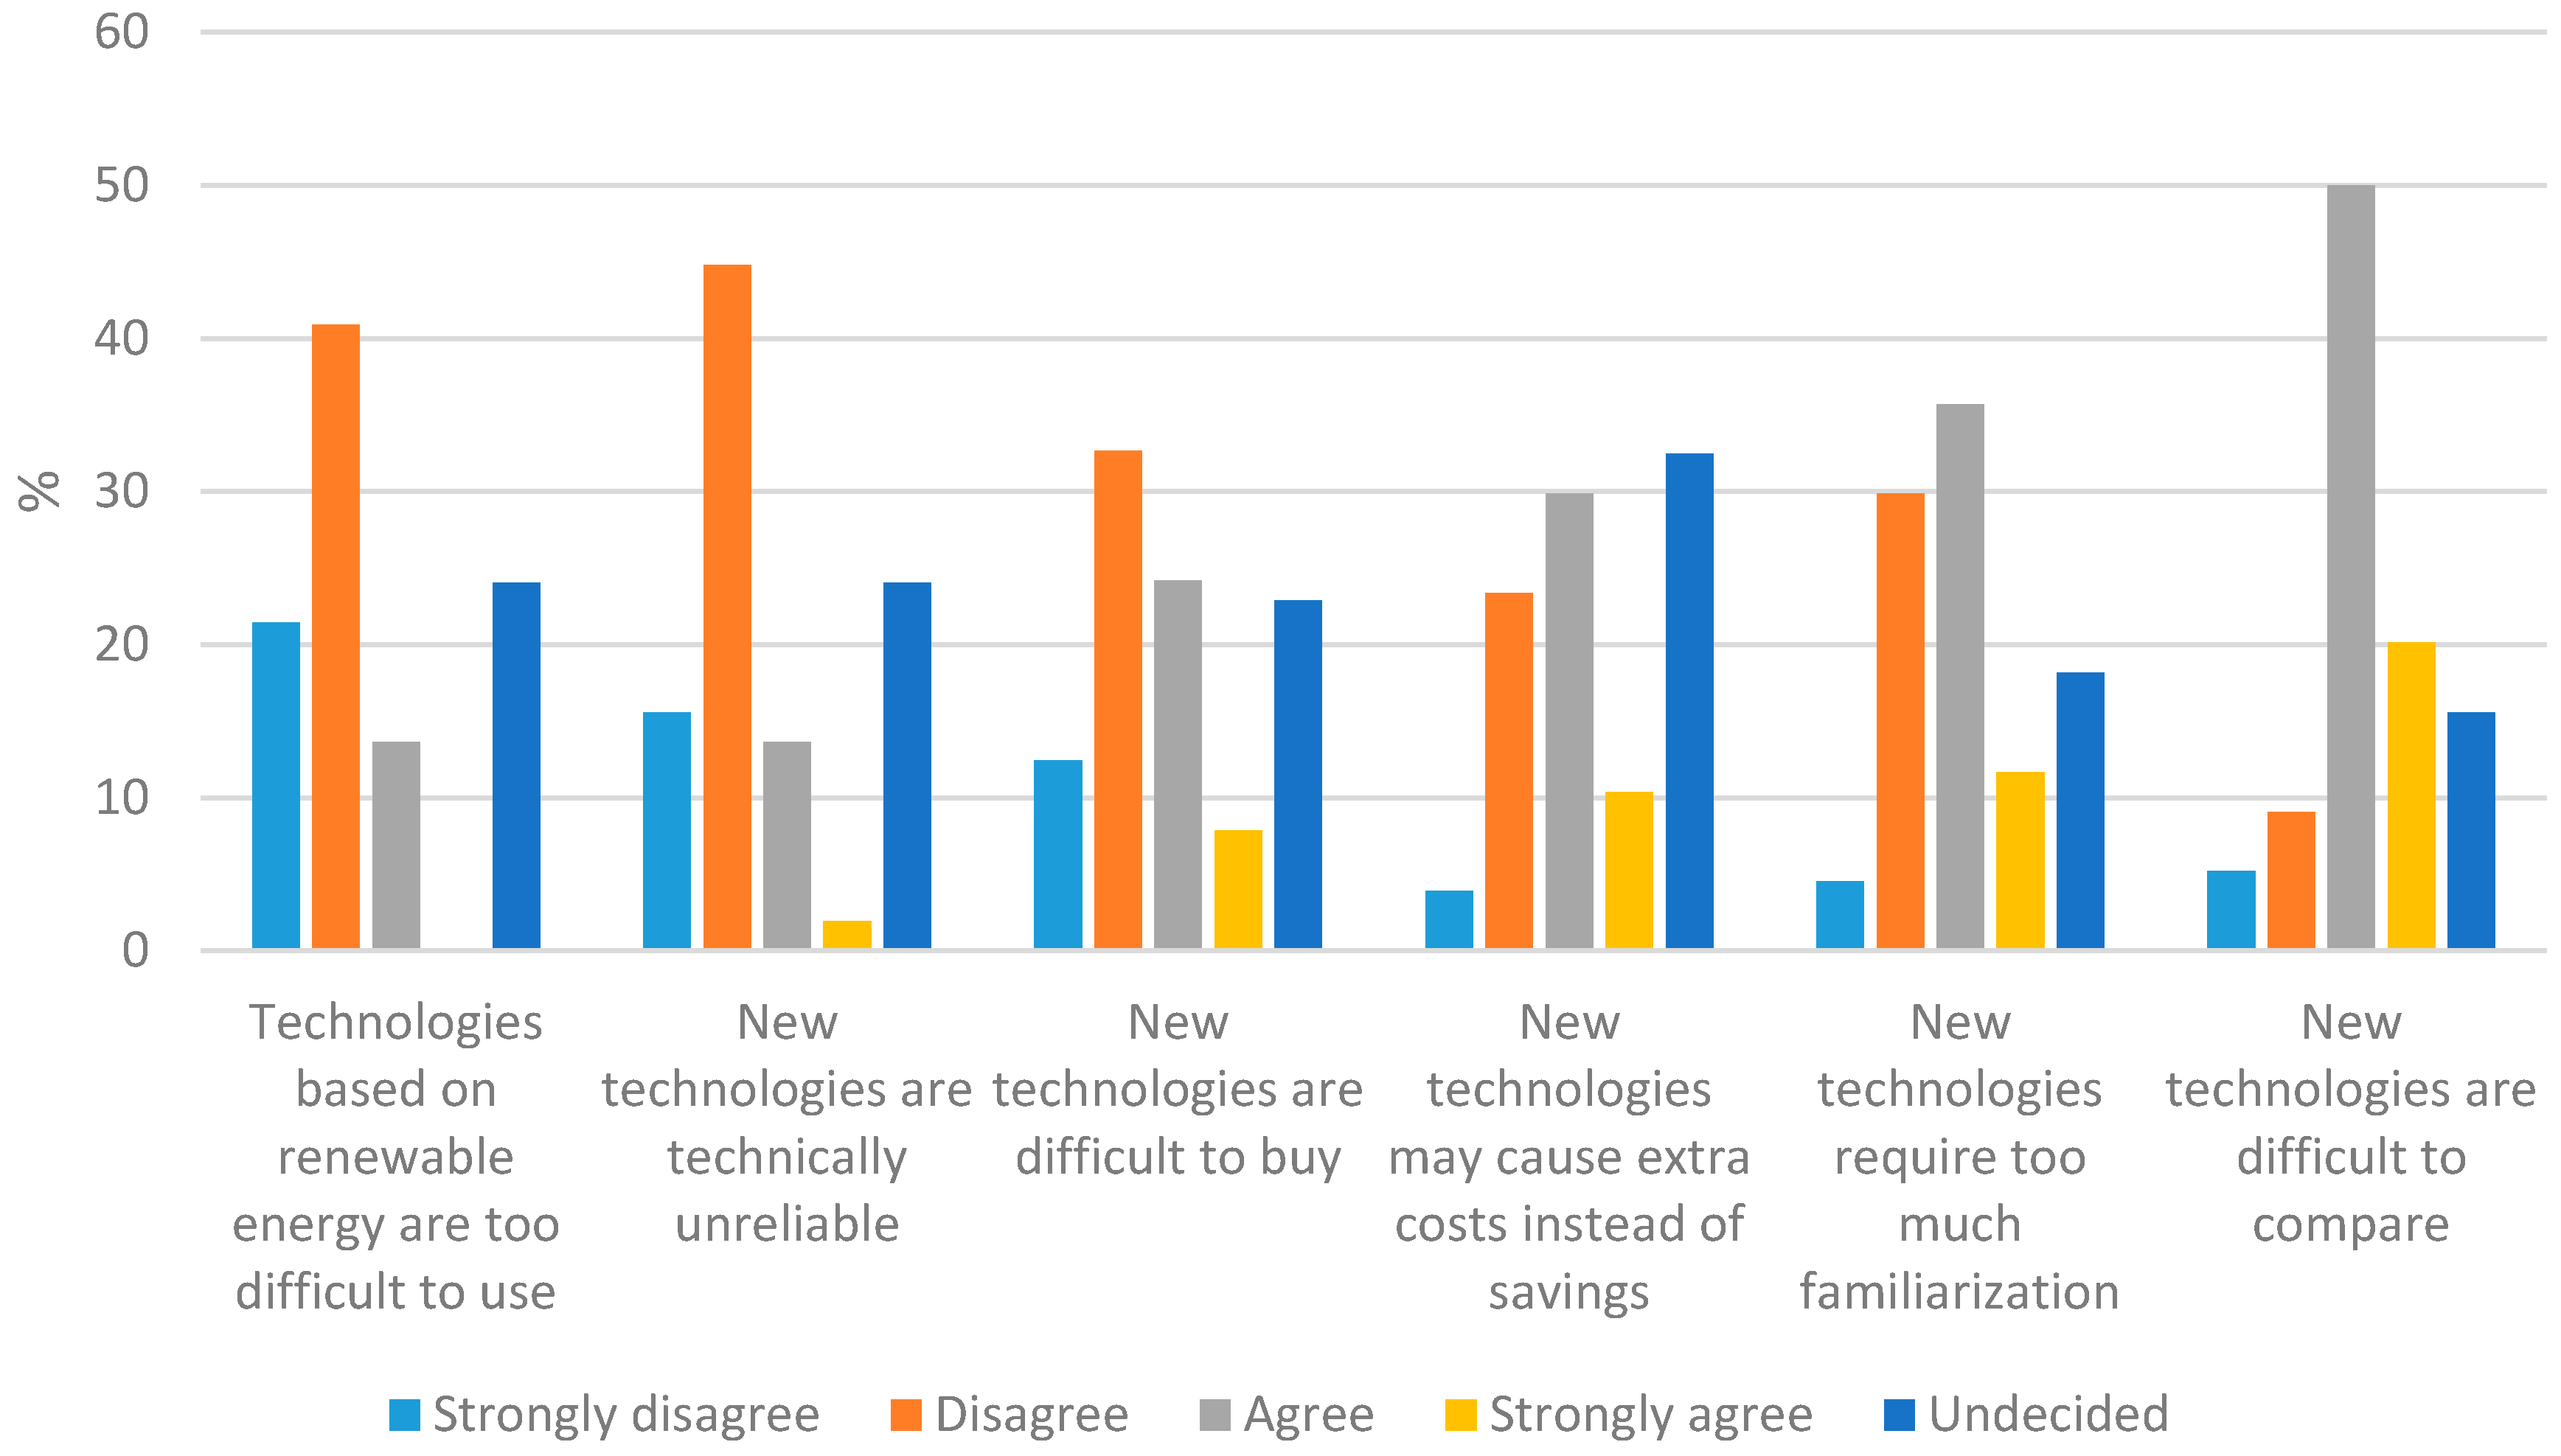
As can be seen from Figure 2, most respondents had already implemented fireplaces, especially conductive ones. Air source heat pumps had also been implemented by over half of the respondents. The remaining energy production solutions had not been widely implemented. The solutions which respondents had most considered include air source and ground source heat pumps, solar electricity, and solar heat. Some solutions, such as air to water heat pumps and solar heat, were still unfamiliar to approximately 40% of respondents. Even solar electricity, which has been widely discussed in Finland, was still unfamiliar to 20% of the respondents. We also presented multiple statements about new technologies to the respondents. The statements and responses are presented next in Figure 3.
The majority of respondents strongly disagreed or disagreed that technologies based on renewable energy are difficult to use (62%) and that they are technically unreliable (60%). However, 40% of those surveyed agreed or strongly agreed that new technologies may incur extra costs, and 47% feel that new technologies require too much familiarization. Additionally, 70% also thought that it was difficult to compare new technologies, and 33% found it difficult to buy new technologies.
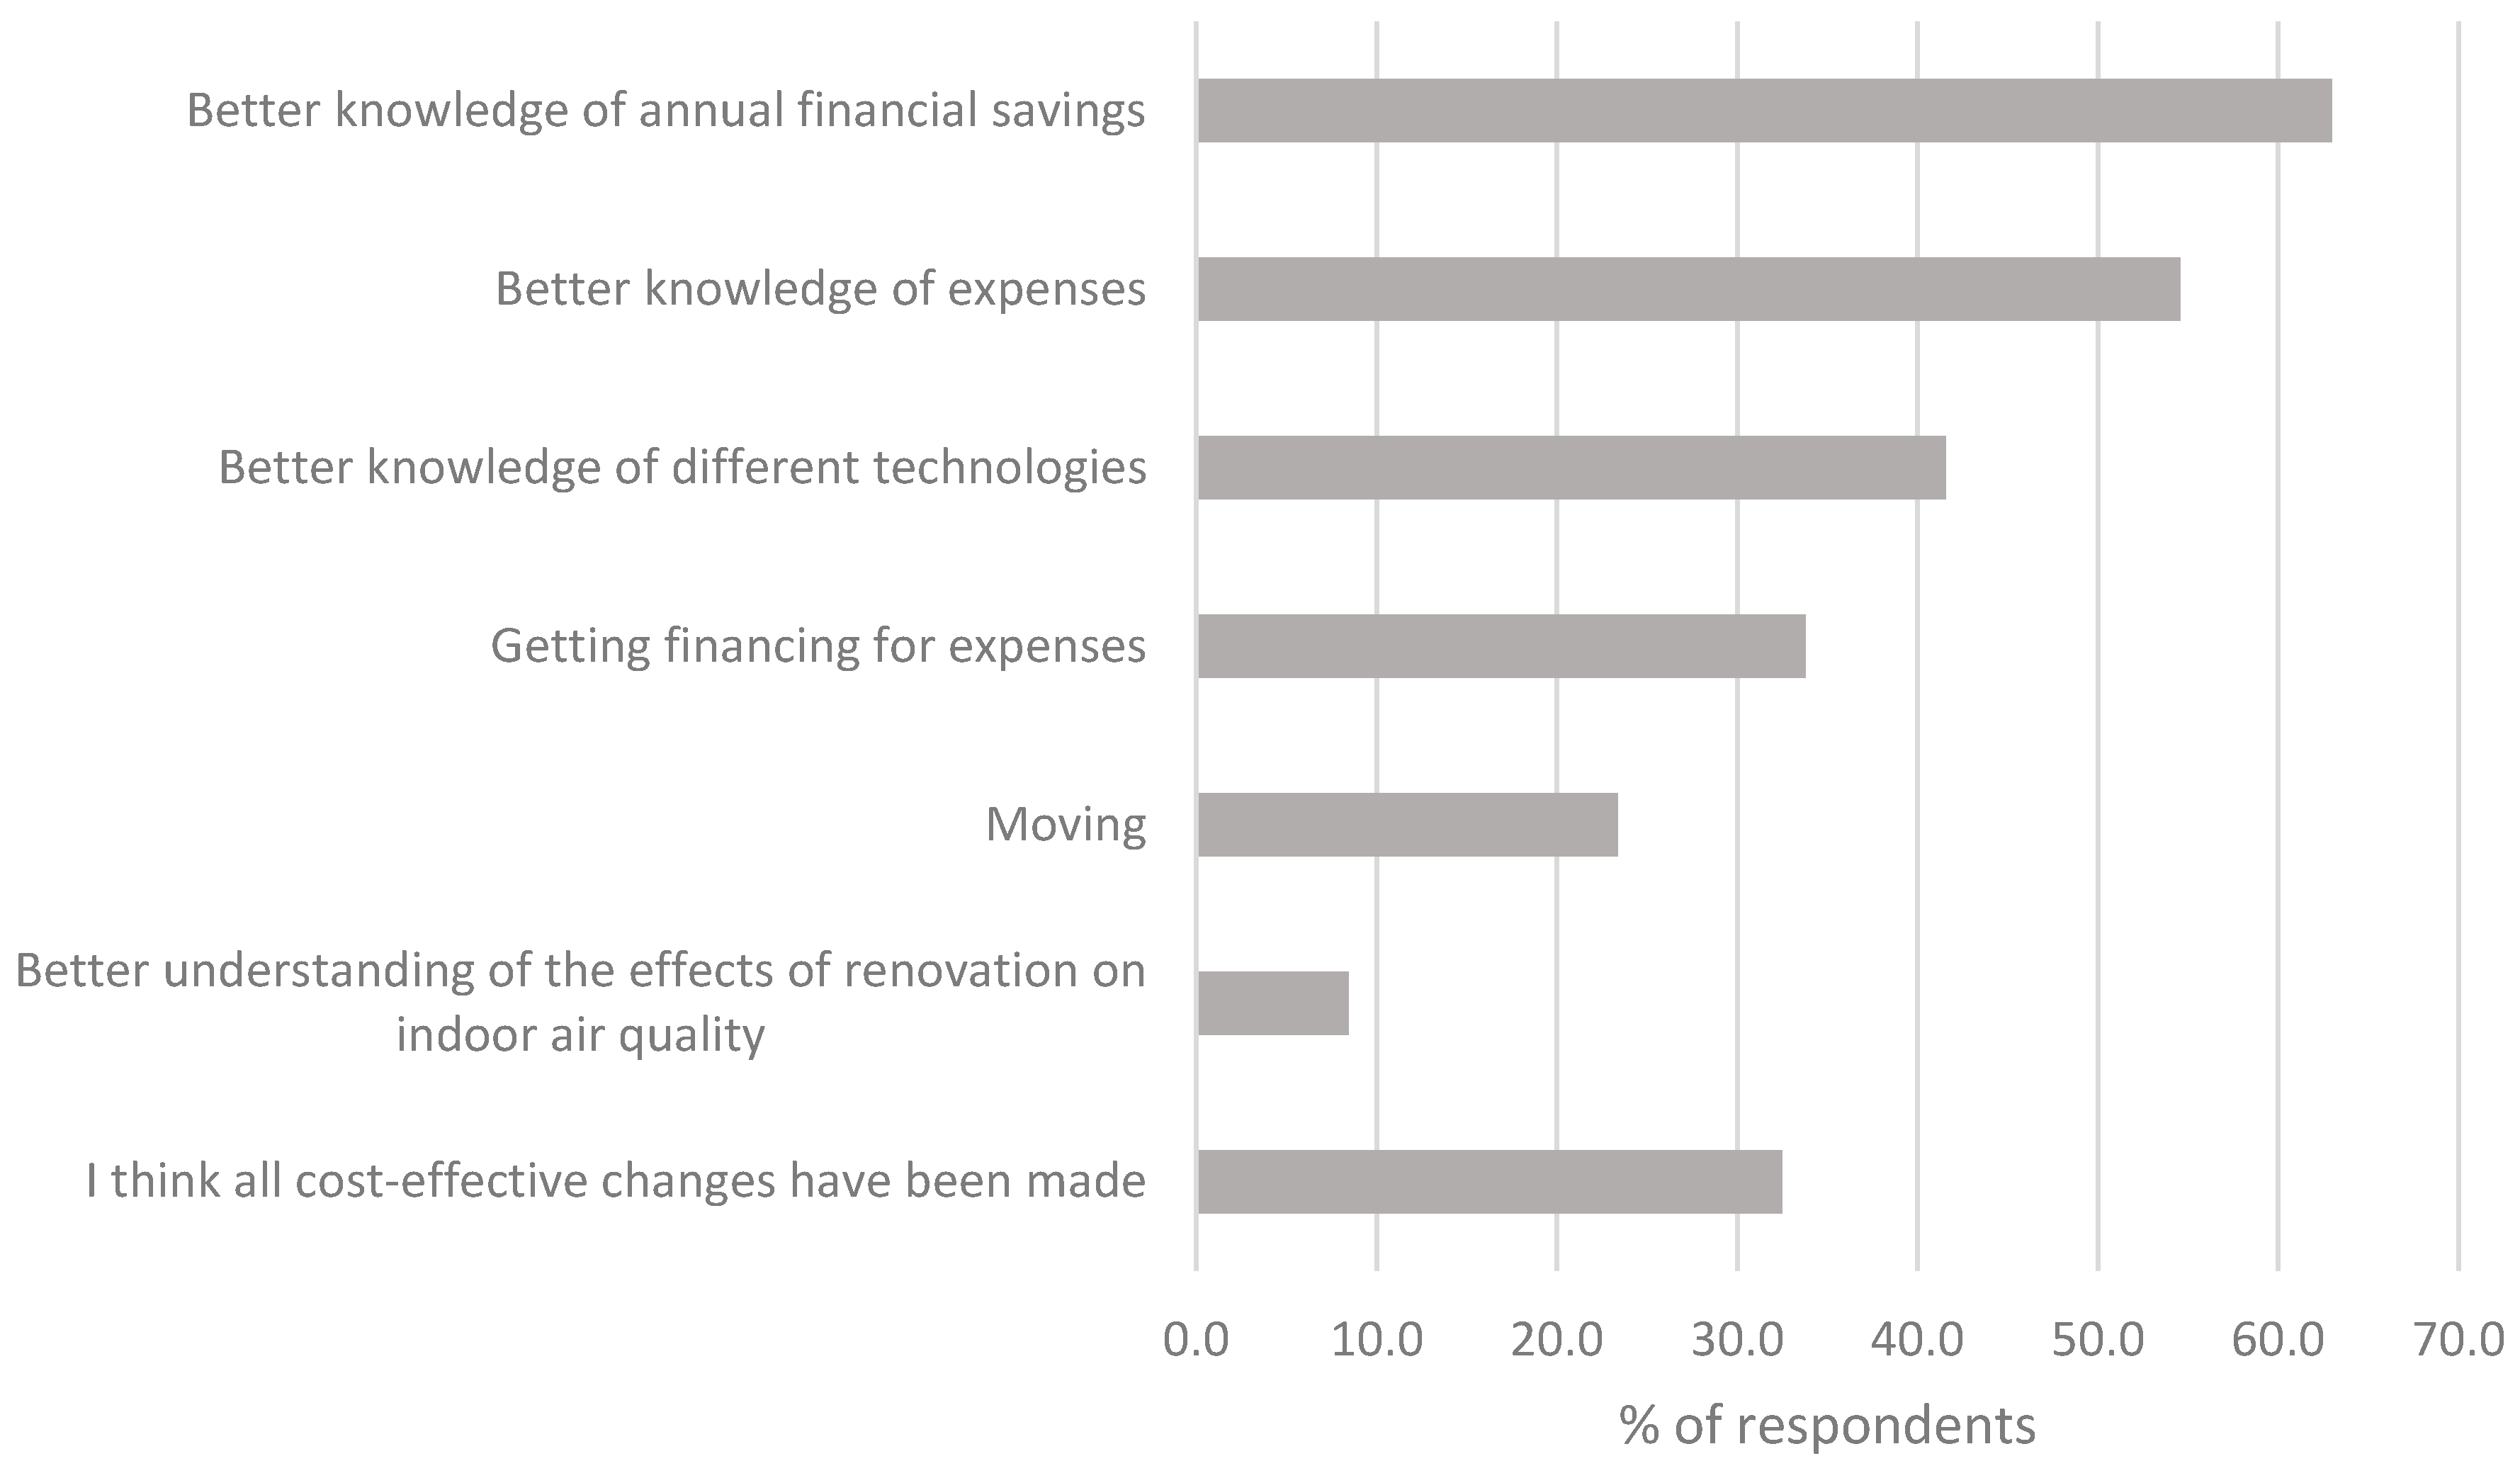
On the survey, we had also listed seven factors, of which the respondents were asked to choose three that would most assist them in making changes related to the energy technologies (Figure 4). The factors were all weighted equally, and respondents were not requested to rank them in any order.
What turned out to be the most important factor was better knowledge of annual financial savings, as 63% of the respondents chose this. Additionally, 55% of respondents chose better knowledge of resulting expenses, and 42% selected better knowledge of different technologies. A third named getting financing as an important factor. Notably, 10% (N = 16) of the respondents had chosen all three factors related to economics, and 62% (N = 95) of the respondents had chosen at least two of the factors related to economics.
3.2. LCA Model
The results of the survey showed that the respondents’ houses were mainly heated by electricity, while a few used ground source heat pumps, oil, wood, or district heating (Table 5). The percentages of supplemental heating systems are presented above in Figure 2.
Two scenarios were created for the assessment of the annual GHG emissions. The first one presented the current situation, and the second one presented a future situation in which the respondents would have implemented the solutions they had considered. Table 6 presents the percentages of respondents who had considered updating their energy production systems (based on answers presented in Figure 2). To simplify the calculation, we assumed that for the different energy efficiency classes, the percentage of the owners implementing changes would be the same. Also, we assumed that the energy efficiency classes of the houses would not change even if the yearly energy consumptions were reduced.
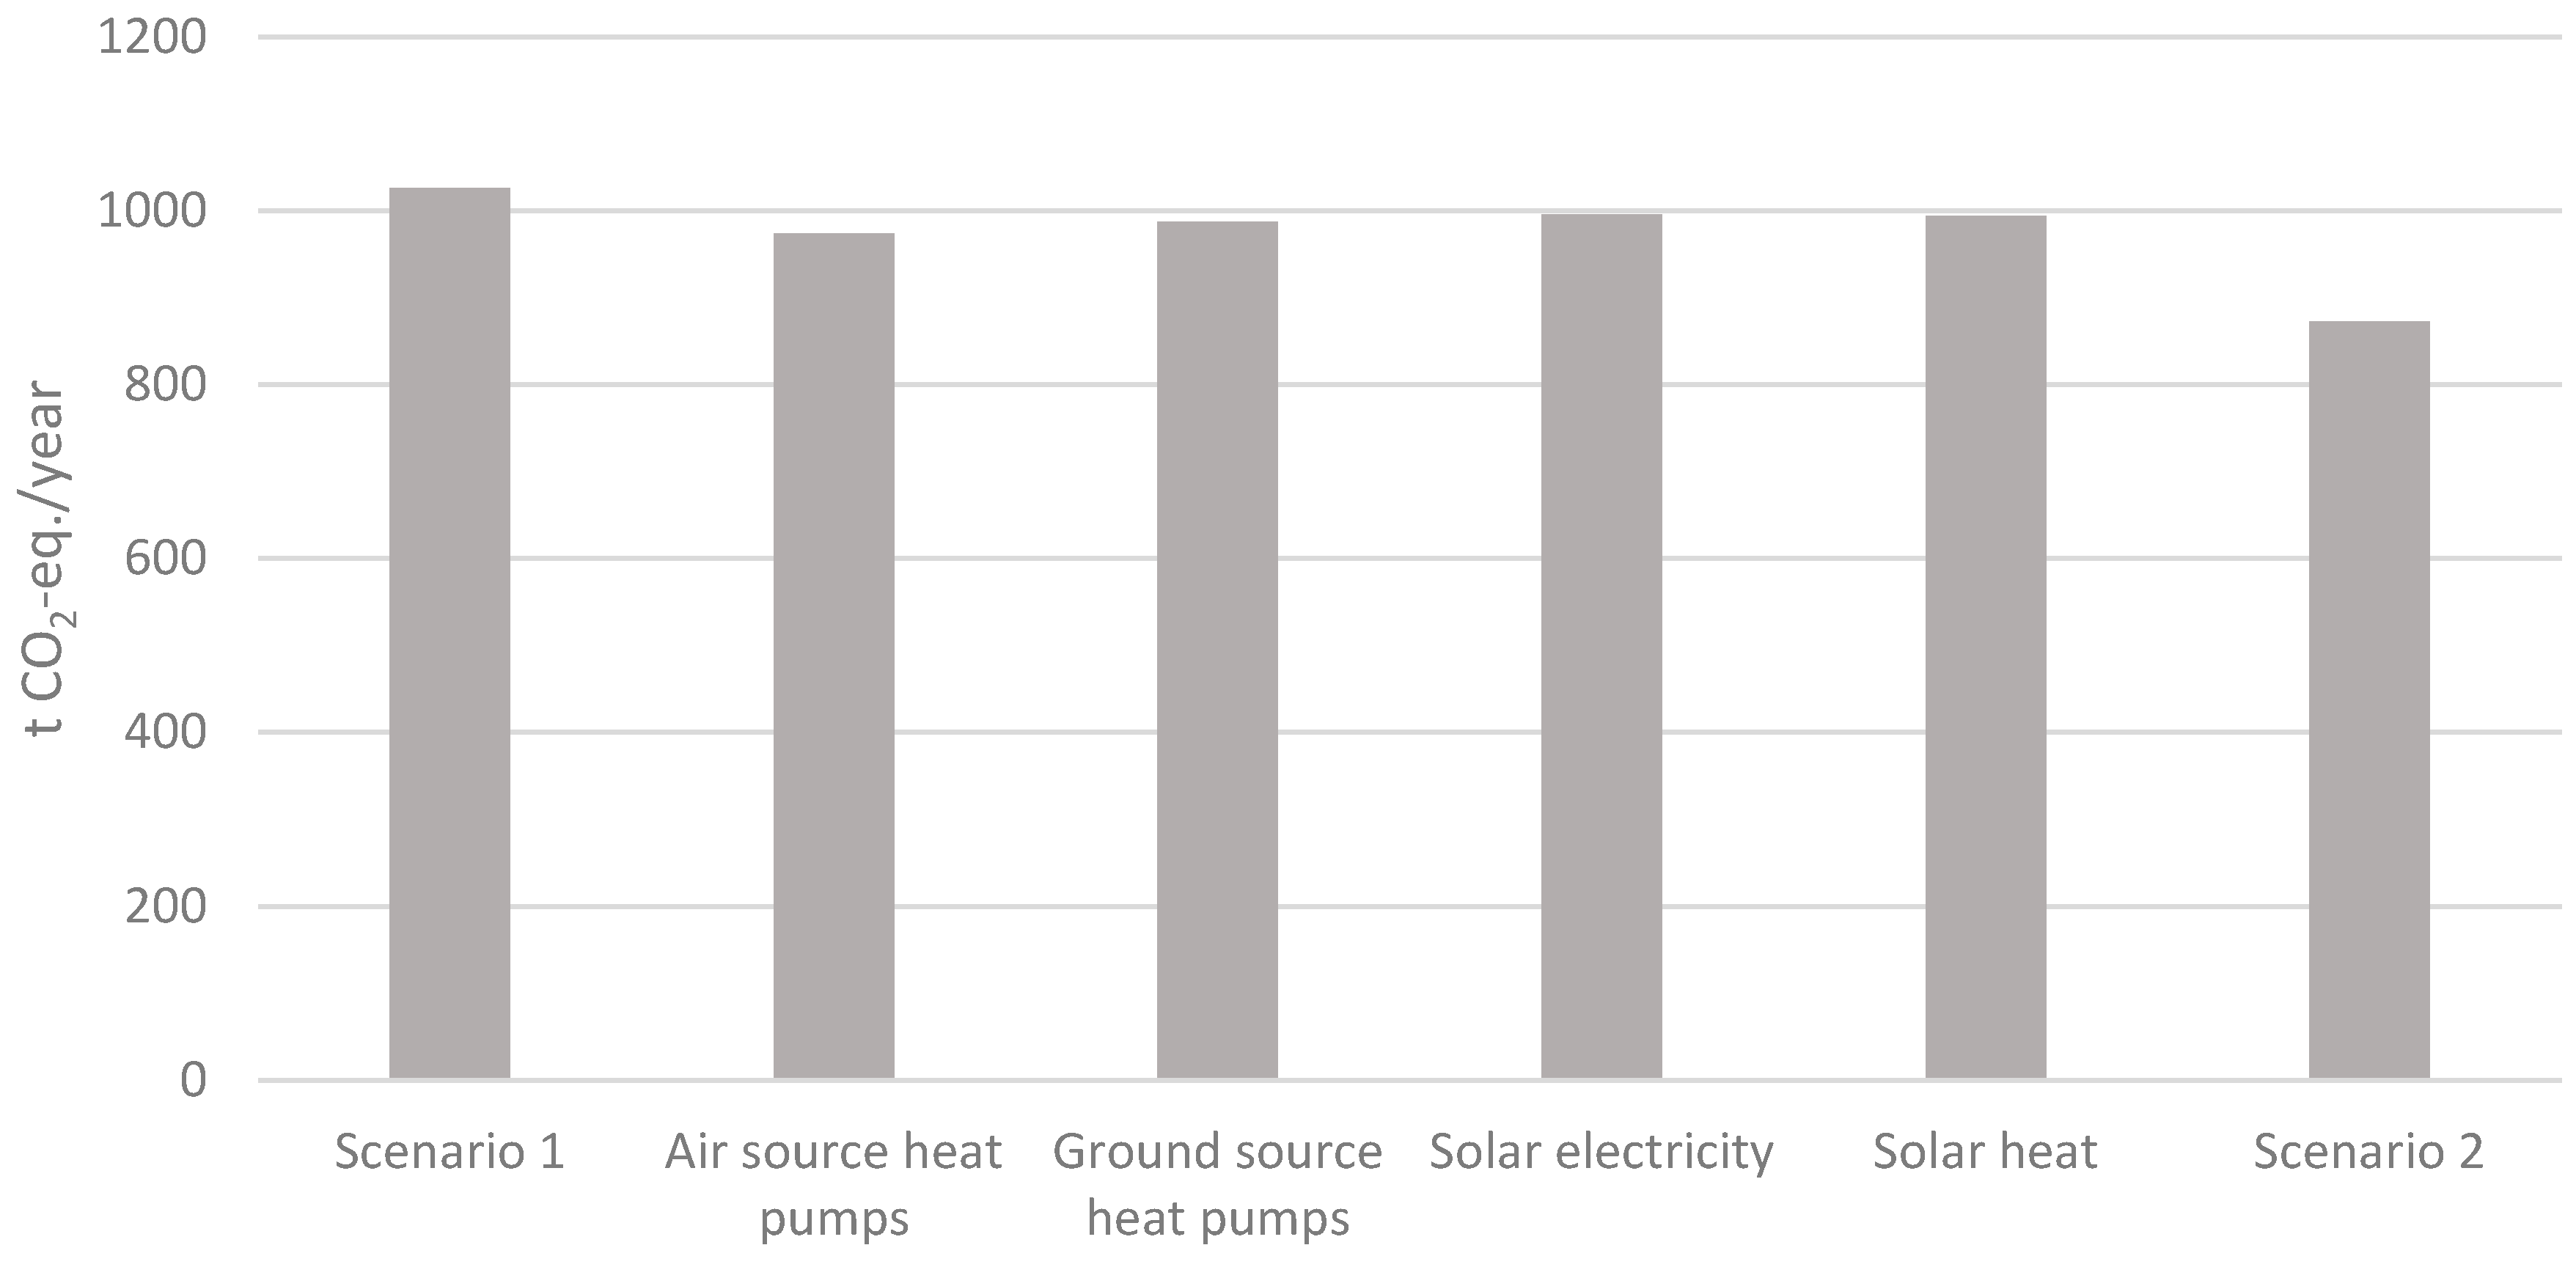
If the consumers implemented the solutions they had most considered, the studied households’ annual GHG emissions would be reduced from 1026 t CO2-eq to 873 t CO2-eq (Figure 5). This reduction equates to 15% of the annual GHG emissions. Air source heat pumps have the most effect on this reduction, as they account for 5% of it. Ground source heat pumps account for 4% of the reduction, and both solar electricity and solar heat account for 3%.
4. Discussion
The findings from our research are similar to those of Newton and Meyer [7], as they suggest that factors related to information and finance override other factors, such as attitudes, as indicators of consumer behaviour. Our results are also similar to those of Ek and Soderholm [8], as their findings indicate that important factors of energy saving include those of cost and environmental attitude. Valkila and Saari’s [9] research subjects were willing to reduce their consumption, but were not ready to invest in more expensive equipment. However, based on our findings, people are willing to invest in technologies when they have a sufficient level of information and amount of money. In Jakob’s [10] research, the reasons listed for adding insulation rarely pertained to savings and fiscal incentives, which is the opposite of our research findings.
As Figure 4 shows, most respondents perceived that economic factors have the most impact on implementing new technologies. Interest in cheaper technologies, such as air source heat pumps, may indicate the same. Also, the majority (88%) of respondents were interested in saving energy to achieve economic savings, although almost half (47%) thought they would not be able to save enough energy to obtain considerable economic savings. We did not ask in the survey what the respondents considered to be considerable savings; thus, there might be variation in the replies. This aspect could be a topic of further studies. A third of respondents replied that receiving financing would assist them in making improvements with energy production technologies. In Finland, until 2017, it was possible to get discretionary grants for materials for energy renovations of detached houses, but these grants are no longer available, as Law (22.12.2005/1184), which the grants were based on, was repealed [24]. Even though the expenses of the work performed may still partially be deducted from taxes as household expenses [25], there might be a need for new kinds of funding instruments, such as energy loans with low interest rates offered by the government.
Based on our findings, we conclude that the respondents desire more information on the resulting costs and possible savings of renewable energy technologies. As we did not specifically ask what kind of information the respondents would like and in what form, the matter could be researched further. There are already multiple free calculators available providing detailed information about annual savings and costs, using different repayment periods.
Based on our survey results, 42% of respondents named a better understanding of technologies as an important factor in the decision to implement new technologies. The same need for information is also manifested in Figure 2, which indicates some technologies were unfamiliar to over a third of respondents. The survey did not specify what sort of information the respondents were lacking; therefore, that too could be researched further. However, it should be noted that merely knowing more about the technologies does not necessarily increase the implementation rate, as respondents with educational background in technology had not implemented the solutions more than the other respondents had.
Based on the LCA model, implementing air source heat pumps has the biggest influence on reducing the residential areas’ GHG emissions. This is because the respondents had most considered implementing air source heat pumps (although half of the respondents had already implemented them). Ground source heat pumps and air to water heat pumps would have a greater effect on the GHG emission reductions, but since the investment costs are higher and they are more difficult to install, they appear to be not as popular. Also, if a house has direct electric heating, it most likely does have the necessary water-circulating heating system, and ground source heat pumps cannot be installed on every lot. Energy efficiency of housing could also be improved by installing new monitoring technologies which would lead to the reduction of GHG emissions.
We cannot be sure that respondents answered the survey questions truthfully, but we have no reason to believe they would have sent false replies. Also, the same problem is faced with all survey-based studies. Houses in the area researched are on average newer than in Finland in general [26], and the number of houses heated by electricity is approximately double that of Finland’s average [27]. These issues may somewhat influence the generalizability of the research. Also, in the calculation of GHG emissions, we assumed that the energy classes of the houses would not change despite the improvements made; thus, the yearly energy consumption would remain the same. The energy production systems that respondents had considered the least were not included in the LCA model. If these factors had been considered, the possible GHG emission reductions could have been greater than those calculated. However, some respondents had considered more than one energy production system, and in reality, they would most likely implement only one, which was not taken into account when we made the calculation. The calculation was based on the respondents’ interests and current knowledge, which are not necessarily the most rational. Therefore, it is possible that with the same energy-efficiency investments, the GHG reductions and economic savings achieved could be greater.
The research was carried out in a small area, so the impact pertaining to reducing GHGs from that area would be insignificant even on a regional level. However, the results can be generalized to a wider area, as detached houses account for 27% of the energy consumption of Finland’s total building stock [21]. A quarter of the housing building stock was built in the 1960s and 1970s, and buildings from those decades are currently mostly renovated [28]. Thus, consumers play an important role in reducing GHG emissions, and in turn, in mitigating climate change. The results can also be generalized to other countries and areas with somewhat similar climate and buildings. In a warmer climate, the achieved reductions would be smaller, as the percentage of energy used for space heating is not as great.
Based on the survey and the LCA model created, the reduction in GHG emissions would be 15% in the areas studied. This is still far from the EU’s reduction targets and carbon neutrality, and it indicates that consumers cannot be overburdened with too much responsibility. In the areas under study, the greatest GHG emissions originate from the production of electricity. Thus, the biggest reductions could be achieved by increasing the share of renewable energy in the production of electricity.
It worked well to combine the survey with LCA modelling. The survey yielded data from consumers for use in the LCA model, and the model provided numeric data supporting the survey.
5. Conclusions
A survey was distributed to owners of detached houses in order to obtain information about their attitudes towards renewable energy solutions and their willingness to implement them. Also, barriers to the implementation of these solutions were examined. A lack of knowledge of annual economic savings, of resulting expenses, and of different technologies were the three most cited barriers. Based on the results, the solutions that respondents were most interested in were air source and ground source heat pumps, solar electricity, and solar heat.
An LCA model was created to be able to estimate how much reduction in the households’ GHG emissions could be achieved if the respondents were to implement the solutions they had considered. The results indicated that the reduction could be 15% of the annual emissions. The reduction is not the most optimized, and a greater reduction could possibly be achieved in the areas if the respondents had had better knowledge of economic and technological issues. The use of a survey to acquire data for an LCA model worked well. Future research could focus on the kind and form of information consumers need to implement more technical solutions based on renewable energy, and on what people consider to be real economic savings achieved from saving energy. Finally, it would be a point of interest to observe how the results would differ if the survey was conducted in another country.
Acknowledgments
The authors wish to thank the European Regional Development Fund and the Regional Council of Päijät-Häme for the opportunity of presenting their research in Sustainability.
Author Contributions
Suvi Konsti-Laakso, Ville Uusitalo, Maija Leino, and Sanna Pekkola conceived and designed the survey. Suvi Konsti-Laakso, Ville Uusitalo, Maija Leino, and Anna Claudelin conducted the survey. Anna Claudelin, Suvi Konsti-Laakso, and Ville Uusitalo analysed the data. Anna Claudelin, Ville Uusitalo, Maija Leino, Suvi Konsti-Laakso, and Sanna Pekkola wrote the paper.
Conflicts of Interest
The authors declare no conflict of interest.
Appendix A
Questions from the survey used to gather the data for this paper.
Background questions
2. Educational background
- ○
- No basic education
- ○
- Lower level of comprehensive school
- ○
- Upper level of comprehensive school
- ○
- High school, matriculation, or vocational qualification
- ○
- Academic degree (e.g., bachelor’s or master’s degree)
- ○
- Licentiate or Doctor
- ○
- None of these
4. Age
- ○
- Under 25 years
- ○
- 25–34 years
- ○
- 35–44 years
- ○
- 45–54 years
- ○
- 55–64 years
- ○
- 65–74 years
- ○
- 75 years or over
5. Combined yearly income of household
- ○
- I cannot say
- ○
- Under 15,000 €/year
- ○
- 15,000–19,999 €/year
- ○
- 20,000–39,999 €/year
- ○
- 40,000–69,999 €/year
- ○
- 70,000–89,999 €/year
- ○
- 90,000–119,999 €/year
- ○
- 120,000–139,999 €/year
- ○
- 140,000 €/year or more
Questions related to living
8. Type of housing
- ○
- Block of flats
- ○
- Row house
- ○
- Semi-detached house
- ○
- Detached house
9. Construction year of the house
- ○
- –1949
- ○
- 1950–1959
- ○
- 1960–1969
- ○
- 1970–1979
- ○
- 1980–1989
- ○
- 1990–1999
- ○
- 2000–2009
- ○
- 2010–
12. Main heating system of the house
- ○
- Electric heating
- ○
- Oil
- ○
- Wood
- ○
- District heating
- ○
- Ground source heat
- ○
- Wood/pellets/chips
- ○
- Other, what? ____________________
17. How strongly do you agree or disagree with the following statements?
| Strongly Disagree | Somewhat Disagree | Somewhat Agree | Agree | I Cannot Say | |
| I aim to act in an environmentally friendly way whenever possible (i.e., saving energy, sorting waste, recycling, avoiding unnecessary use of car) |  | | | | |
| I aim to save energy actively, but I am not willing to lower my standard of living to do so | | | | | |
| I am interested in saving energy for environmental reasons | | | | | |
| I do not believe my household can save energy to the extent that it would have any real economic effect | | | | | |
| I am interested in saving energy because of economic savings | | | | | |
Current energy solutions of your household
21. Assess the following solutions related to your household energy
| I Have Implemented | I Have Considered | I Am Familiarized with | Not Familiar | Not Interested | |
| Air source heat pump | | | | | |
| Ground source heat pump | | | | | |
| Air to water heat pump | | | | | |
| Solar electricity | | | | | |
| Solar heat | | | | | |
| Small wind turbines | | | | | |
| Fireplace or stove | | | | | |
| Capacitive fireplace | | | | | |
| Water-circulating fireplace | | | | | |
| Pellets and briquettes | | | | | |
| Central heating boilers | | | | | |
23. How strongly do you agree or disagree with the following statements?
| Strongly Disagree | Disagree | Agree | Strongly Agree | Undecided | |
| Technologies based on renewable energy are difficult to use | | | | | |
| New technologies are technically unreliable | | | | | |
| New technologies are difficult to buy | | | | | |
| New technologies may result in extra costs instead of savings | | | | | |
| New technologies require too much familiarization | | | | | |
| New technologies are difficult to compare | | | | | |
24. Choose the three most significant factors that would assist your household in making changes related to energy
- ○
- I think all cost-efficient changes have been made
- ○
- Moving
- ○
- Better understanding of the effects of renovation on indoor air quality
- ○
- Getting financing for expenses
- ○
- Better knowledge of annual financial savings
- ○
- Better knowledge of expenses
- ○
- Better knowledge of different technologies
- ○
- Other, what? ___________________
References
- IPCC. Climate Change 2014: Synthesis Report. Contribution of Working Groups I, II and III to the Fifth Assessment Report of the Intergovernmental Panel on Climate Change, 1st ed.; Pachauri, R.K., Meyer, L.A., Eds.; IPCC: Geneva, Switzerland, 2014; p. 151. [Google Scholar]
- European Commission. Energy Roadmap 2050, 1st ed.; Publications Office of the European Union: Luxembourg, 2012; p. 20. [Google Scholar]
- Renovating the EU Building Stock. Available online: http://bpie.eu/focus-areas/renovating-the-eu-building-stock/ (accessed on 2 April 2017).
- Lucon, O.; Urge-Vorsatz, D.; Zain Ahmed, A.; Akbar, H.; Bertoldi, P.; Cabeza, L.F.; Eyre, N.; Gadgil, A.; Harvey, L.D.D.; Jiang, Y.; et al. Buildings. In Climate Change 2014: Mitigation of Climate Change. Contribution of Working Group III to the Fifth Assessment Report of the Intergovernmental Panel on Climate Change, 1st ed.; Edenhofer, O., Pichs-Madruga, R., Sokona, Y., Farahani, E., Kadner, S., Seyboth, K., Adler, A., Baum, I., Brunner, S., Eickemeier, P., et al., Eds.; Cambridge University Press: Cambridge, UK; New York, NY, USA, 2014; pp. 671–738. [Google Scholar]
- Lapillonne, B.; Pollier, K.; Samci, N. Energy Efficiency Trends in Buildings in the EU. Available online: http://www.odyssee-mure.eu/publications/efficiency-by-sector/buildings/buildings-eu.pdf (accessed on 25 April 2017).
- Statistics Finland. Rakennus- ja Asuntotuotanto Muuttujina Periodi, Käyttötarkoitus, Tieto ja Rakennusvaihe. Available online: http://pxnet2.stat.fi/PXWeb/sq/9d5ec5d7-eaaf-4c45–96ca-71ed182c1c0e (accessed on 25 April 2017).
- Newton, P.; Meyer, D. Exploring the Attitudes-Action Gap in Household Resource Consumption: Does “Environmental Lifestyle” Segmentation Align with Consumer Behaviour? Sustainability 2013, 5, 1211–1233. [Google Scholar] [CrossRef]
- Ek, K.; Söderholm, P. The devil is in the details: Household electricity saving behaviour and the role of information. Energy Policy 2010, 38, 1578–1587. [Google Scholar] [CrossRef]
- Valkila, N.; Saari, A. Consumer Panel on the readiness of Finns to Behave in a More Pro-Environmental Manner. Sustainability 2012, 4, 1561–1579. [Google Scholar] [CrossRef]
- Jakob, M. The Drivers and Barriers to Energy Efficiency in Renovation Decisions of Single-Family Home-Owners; CEPE Center for Energy Policy and Economics, ETH Zurich: Zürich, Switzerland, 2007; Available online: http://econpapers.repec.org/paper/ceewpcepe/07-56.htm (accessed on 25 April 2017).
- Banfi, S.; Farsi, M.; Filippini, M.; Jakob, M. Willingness to pay for energy-saving measures in residential buildings. Energy Econ. 2008, 30, 503–516. [Google Scholar] [CrossRef]
- Alberini, A.; Banfi, S.; Ramseier, C. Energy Efficiency Investments in the Home: Swiss Homeowners and Expectations about Future Energy Prices. Energy J. 2013, 34, 49–86. [Google Scholar] [CrossRef]
- Nakamura, E. Electricity saving behavior of households by making efforts, replacing appliances, and renovations: Empirical analysis using a multivariate ordered probit model. Int. J. Consum. Stud. 2016, 40, 675–684. [Google Scholar] [CrossRef]
- Khosrowpour, A.; Xie, Y.; Taylor, J.E.; Hong, Y. One size does not fit all: Establishing the need for targeted eco-feedback. Appl. Energy 2016, 184, 523–530. [Google Scholar] [CrossRef]
- Craig, C.A. Energy consumption, energy efficiency, and consumer perceptions: A case study for the Southeast United States. Appl. Energy 2016, 165, 660–669. [Google Scholar] [CrossRef]
- Ozava, A.; Furusato, R.; Yoshida, Y. Tailor-Made Feedback to Reduce Residential Electricity Consumption: The Effect of Information on Household Lifestyle in Japan. Sustainability 2017, 9, 528. [Google Scholar] [CrossRef]
- City of Lahti. TILDA—Tilastotietoa Lahdesta. Available online: http://www4.lahti.fi/verkkotilastointi/ (accessed on 15 January 2017).
- Allen, I.E.; Seaman, C.A. Likert Scales and data Analyses. Qual. Prog. 2007, 40, 64–65. Available online: http://0-search-proquest-com.brum.beds.ac.uk/docview/214764202?pq-origsite=gscholar (accessed on 25 April 2017).
- European Committee for Standardization. Environmental Management-Life Cycle Assessment-Requirements and Guidelines (ISO 14040:2006), 1st ed.; International Organization for Standardization: Geneva, Switzerland, 2006. [Google Scholar]
- European Committee for Standardization. Environmental Management-Life Cycle Assessment-Requirements and Guidelines (ISO 14044:2006), 1st ed.; International Organization for Standardization: Geneva, Switzerland, 2006. [Google Scholar]
- Haakana, M. Energiatodistus. Available online: http://www.omakotiliitto.fi/sites/default/files/Energiatodistus%20%20Oma%20koti%2012%2004%202013.pdf (accessed on 18 February 2017).
- Turunen, J. 1980-Luvun Talosta Hybriditaloksi. Ph.D. Thesis, Metropolia University of Applied Sciences, Helsinki, Finland, 10 October 2015. Available online: https://www.theseus.fi/bitstream/handle/10024/99941/1980-luvun talosta hybriditaloksi.pdf?sequence=1 (accessed on 20 June 2016).
- Finlex. Ympäristöministeriön Asetus Rakennuksen Energiatodistuksesta 176/2013. Available online: http://www.finlex.fi/data/sdliite/liite/6186.pdf (accessed on 25 April 2017).
- Finlex. Laki Asuntojen Korjaus- Energia- ja Terveyshaitta-Avustuksista. Available online: http://www.finlex.fi/fi/laki/ajantasa/2005/20051184 (accessed on 6 March 2017).
- Finnish Tax Administration. Deductions You Must Claim. Available online: https://www.vero.fi/en-US/Individuals/Deductions/Deductions_you_must_claim%2835230%29 (accessed on 28 March 2017).
- Statistics Finland. Rakennukset Muuttujina Alue, Rakennuksen Käyttötarkoitus, Yksikkö ja Rakennusvuosi. Available online: http://pxnet2.stat.fi/PXWeb/sq/43ff064e-bd93-43d8-9599-702c849b4a51 (accessed on 25 April 2017).
- Statistics Finland. Rakennukset Muuttujina Alue, Rakennuksen Käyttötarkoitus, Yksikkö ja Rakennuksen Polttoaine. Available online: http://pxnet2.stat.fi/PXWeb/sq/3aea5a43–884d-4a35-b117-87947741c7ab (accessed on 25 April 2017).
- Airaksinen, M.; Vainio, T. Rakennuskannan Korjaamisen ja Kunnossapidon Energiatehokkuustoimenpiteiden Vaikuttavuuden Arviointi Energiansäästön, CO2 Ekv-Päästöjen, Kustannuksien ja Kannattavuuden Näkökulmista; VTT-CR-00426–12; VTT: Espoo, Finland, 2012. [Google Scholar]
Figure 1.
The life cycle assessment (LCA) model created, and the system boundary.

Figure 2.
Renewable energy production solutions listed on the survey and corresponding percentages of the responses.
Figure 2.
Renewable energy production solutions listed on the survey and corresponding percentages of the responses.

Figure 3.
Statements about new technologies and respondents’ reactions to those.

Figure 4.
Factors that would assist consumers in making energy-system changes.

Figure 5.
Annual greenhouse gas (GHG) emissions of the households studied for the two different scenarios. In addition to Scenario 2, where all the energy production systems are considered, the influence of each heating system is presented one by one.
Figure 5.
Annual greenhouse gas (GHG) emissions of the households studied for the two different scenarios. In addition to Scenario 2, where all the energy production systems are considered, the influence of each heating system is presented one by one.


Table 1.
Comparison of home construction years in terms of sample versus population sizes.
| Sample | Population | |
|---|---|---|
| Number | 154 | 1101 |
| Construction year | [%] | [%] |
| –1949 | 9 | 13 |
| 1950–1959 | 6 | 13 |
| 1960–1969 | 4 | 6 |
| 1970–1979 | 4 | 4 |
| 1980–1989 | 22 | 15 |
| 1990–1999 | 18 | 18 |
| 2000–2010 | 20 | 17 |
| 2010– | 15 | 13 |
Table 2.
Comparison of age groups in terms of sample versus population sizes.
| Sample | Population | |
|---|---|---|
| Number | 154 | 2306 |
| Age Group | [%] | [%] |
| Under 25 | 0 | 9 |
| 25–34 | 8 | 14 |
| 35–44 | 29 | 26 |
| 45–54 | 23 | 23 |
| 55–64 | 21 | 14 |
| 65–74 | 16 | 10 |
| 75 or over | 3 | 4 |
Table 3.
Comparison of income classes in terms of sample versus population sizes.
| Sample | Population | |
|---|---|---|
| Number | 154 | 2399 |
| Income Class | [%] | [%] |
| Under €10,000 | 5 | 13 |
| €10,000–€20,000 | 15 | 16 |
| €20,001–€34,999 | 32 | 28 |
| €35,000–€44,999 | 25 | 16 |
| €45,000–€60,000 | 13 | 13 |
| Over €60,000 | 5 | 10 |
Table 4.
Comparison of educational background in terms of sample versus population sizes.
| Sample | Population | |
|---|---|---|
| Number | 154 | 2399 |
| Educational background | [%] | [%] |
| Comprehensive school education | 12 | 25 |
| Upper secondary education | 35 | 41 |
| Tertiary education | 51 | 34 |
Table 5.
Current main heating systems of the respondents’ houses.
| Electric Heating | Ground Source Heat Pumps | Oil Heating | Wood/Pellets/Chips | District Heating | Other | Total | |
|---|---|---|---|---|---|---|---|
| N | 117 | 10 | 12 | 8 | 3 | 3 | 153 1 |
| % | 76 | 7 | 8 | 5 | 2 | 2 | 100 |
1 One of the respondents had not marked the heating system.
Table 6.
Percentages of respondents who had considered updating their energy production systems.
| Energy Production Systems Respondents Had Considered Switching to | |||||
|---|---|---|---|---|---|
| Air Source Heat Pumps | Ground Source Heat Pumps | Solar Electricity | Solar Heat | ||
| Current Main Heating System | Percentage of Respondents Switching Energy Sources [%] (N in Brackets) | N Total | |||
| Electric heating | 17 (20) | 9 (10) | 16 (18) | 10 (11) | (117) |
| Oil | 33 (4) | 9 (1) | 10 (1) | 11 (1) | (12) |
| Wood | 20 (1) | 75 (3) | 100 (4) | 50 (2) | (4) |
| Ground source heat pumps | 0 | 0 | 20 (2) | 0 | (10) |
| District heating | 67 (2) | 0 | 0 | 0 | (3) |
| N total | (27) | (14) | (25) | (14) | |
© 2017 by the authors. Licensee MDPI, Basel, Switzerland. This article is an open access article distributed under the terms and conditions of the Creative Commons Attribution (CC BY) license (http://creativecommons.org/licenses/by/4.0/).
Share and Cite
MDPI and ACS Style
Claudelin, A.; Uusitalo, V.; Pekkola, S.; Leino, M.; Konsti-Laakso, S. The Role of Consumers in the Transition toward Low-Carbon Living. Sustainability 2017, 9, 958. https://0-doi-org.brum.beds.ac.uk/10.3390/su9060958
AMA Style
Claudelin A, Uusitalo V, Pekkola S, Leino M, Konsti-Laakso S. The Role of Consumers in the Transition toward Low-Carbon Living. Sustainability. 2017; 9(6):958. https://0-doi-org.brum.beds.ac.uk/10.3390/su9060958
Chicago/Turabian StyleClaudelin, Anna, Ville Uusitalo, Sanna Pekkola, Maija Leino, and Suvi Konsti-Laakso. 2017. "The Role of Consumers in the Transition toward Low-Carbon Living" Sustainability 9, no. 6: 958. https://0-doi-org.brum.beds.ac.uk/10.3390/su9060958
Note that from the first issue of 2016, this journal uses article numbers instead of page numbers. See further details here.