Article

Sustainable Effects of Small Hydropower Substituting Firewood Program in Majiang County, Guizhou Province, China

1
Soil and Water Conservation of Beijing Engineering Research Center, College of Soil and Water Conservation, Beijing Forestry University, Beijing 100083, China
2
Engineering Design & Research Center, China Institute of Water Resources & Hydropower Research, Beijing 100048, China
3
College of Forestry, Beijing Forestry University, Beijing 100083, China
4
Fraunhofer Institute for Systems and Innovation Research ISI, 76139 Karlsruhe, Germany
*
Author to whom correspondence should be addressed.
Sustainability 2017, 9(6), 988; https://0-doi-org.brum.beds.ac.uk/10.3390/su9060988
Submission received: 25 March 2017 / Revised: 2 June 2017 / Accepted: 3 June 2017 / Published: 9 June 2017
(This article belongs to the Special Issue Ecological Restoration for Sustainable Forest Management)

Abstract

:
Small hydropower substituting fuel (SHSF) is an ecological environment protection program to improve regional ecosystems and alleviate poverty. However, the sustainability of SHSF programs remains controversial due to lingering doubts about its potential for socioeconomic development and its environmental impacts. The sustainability of SHSF was examined based on field investigations and household questionnaire surveys. The results were as follows: (1) Biomass of SHSF protected masson pine (Pinus massoniana) and weeping cypress (Platycladus orientalis) plantations were 11.06 t·ha−1 and 7.15 t·ha−1 higher than unprotected plantations, respectively. Furthermore, the differences in ecosystem biomass were mainly derived from arbor biomass. While the energy conversion efficiency based on field investigations was merely 1.28 kg (kWh)−1, which was only 64% of the empirical value and 54% of the guideline for accounting for the ecological benefit of small hydropower substituting fuel. (2) Households’ total income in SHSF villages was higher than in households with access to a hydropower plant but no substituting fuel or households with no hydropower plant. (3) Most of the households had a positive attitude towards SHSF because of its cheaper electricity and associated ecological environmental improvements. Overall, our results suggest optimistic and sustainable prospects for the SHSF program; however, continued education and policy communications are needed to sustain program success.

Graphical Abstract

1. Introduction

In the past several decades, the implementation of China’s large-scale vegetation restoration programs, e.g., Natural Forest Protection Program (NFPP) and Sloping Land Conversion Program (SLCP), among others, have led to an increased rate of forest coverage, terrestrial ecosystem carbon fixation, and improvement of ecological environments [1,2,3,4]. However, the inhabitants historically depended on forests for fuel because there was no electric energy in most isolated remote areas [5]. According to the United Nations Development Program and World Bank, investigations in 15 less-developed countries revealed that direct energy consumption accounted for 30–95% of total energy use; this is much higher than in developed countries [6]. Neither policy-related subsidies nor executive orders have provided substitute fuels for local residents; firewood consumption was one of the primary causes for degraded forest quality, often resulting in deforestation [7,8,9].
The largest environmental benefit of SHSP is the lack of greenhouse gas carbon dioxide production during electricity generation compared with the burning of fossil fuels. The water is not polluted during the process and can be utilized for additional processes, such as crop production or water supplies [10]. In addition, as a clean, renewable, and predictable energy source, small hydropower can be connected to provide power to the grid, or it can be used for independent and stand-alone applications in isolated remote areas [11,12]. The Chinese government has realized the importance of water for the production of energy [13]. Small hydropower resources are mainly distributed in underdeveloped regions [14,15], thus providing an opportunity to address contradictions between firewood consumption and ecological protection in rural areas [16]. In 2002, the Chinese government proposed the construction of small hydropower stations and the supply of cheaper electric power to encourage inhabitants to use electricity instead of wood burning. The participants were requested to protect certain forest areas from firewood cutting. The program is often referred to as small hydropower substituting firewood (SHSF), which is aimed at protecting forests, improving local environments, and alleviating poverty [17]. In 2003, the Chinese ministry of water resources piloted 26 SHSF programs in 26 counties, renewed 80 SHSF programs in 81 counties in 2006, and planned to establish 1022 new SHSF programs in 541 counties between 2009 and 2015 [18] (Figure 1).
The sustainability of SHSF programs remained controversial because of socioeconomic and environmental impacts [5]. For example, the use of hydroelectricity generation systems adversely affects aquatic diversity, fish life reproduction, and has high construction costs, leading to higher payback time to achieve economic returns [19]. The presence of high silt contents in rivers, particularly during peak snowmelt and high flows, presents an engineering challenge during operation of SHP plants [20,21,22]. Correspondingly, many scholars evaluated its sustainability based on different factors or methods. Zhang et al. (2016) assessed and compared the environmental performance and sustainability of three different small hydro-power (SHP) schemes in Tibet via energy analysis [23]. Huang et al. (2008) studied its sustainable development based on eco-economic factors [24]. He et al. (2015) based their evaluation on poverty performance [25]. This study aimed to directly evaluate sustainability based on the premise that SHSF is not only an ecological engineering project, but also an anti-poverty project, which can therefore provide a scientific foundation to comprehensively assess the sustainability of the SHSF program. Given the limited research on SHSF’s forest protection efforts, data of forest area or biomass protected by the SHSF program have been calculated via electric energy production or amount of firewood per household; however, a more rigorous and well-defined measurement approach can improve evaluation efforts of the SHSF program in different regions. This study was conducted in Majiang County, Guizhou province based on data from forest inventories and questionnaire surveys. Our hypotheses were: (1) the implementation of the SHSF program will significantly protect the forest, while the biomass data calculated via field inventory would differ from the traditional indirect calculation method, (2) the income of households will improve, and (3) the attitude of residents will be diverse due to controversial socioeconomic and environmental impacts.

2. Materials and Methods
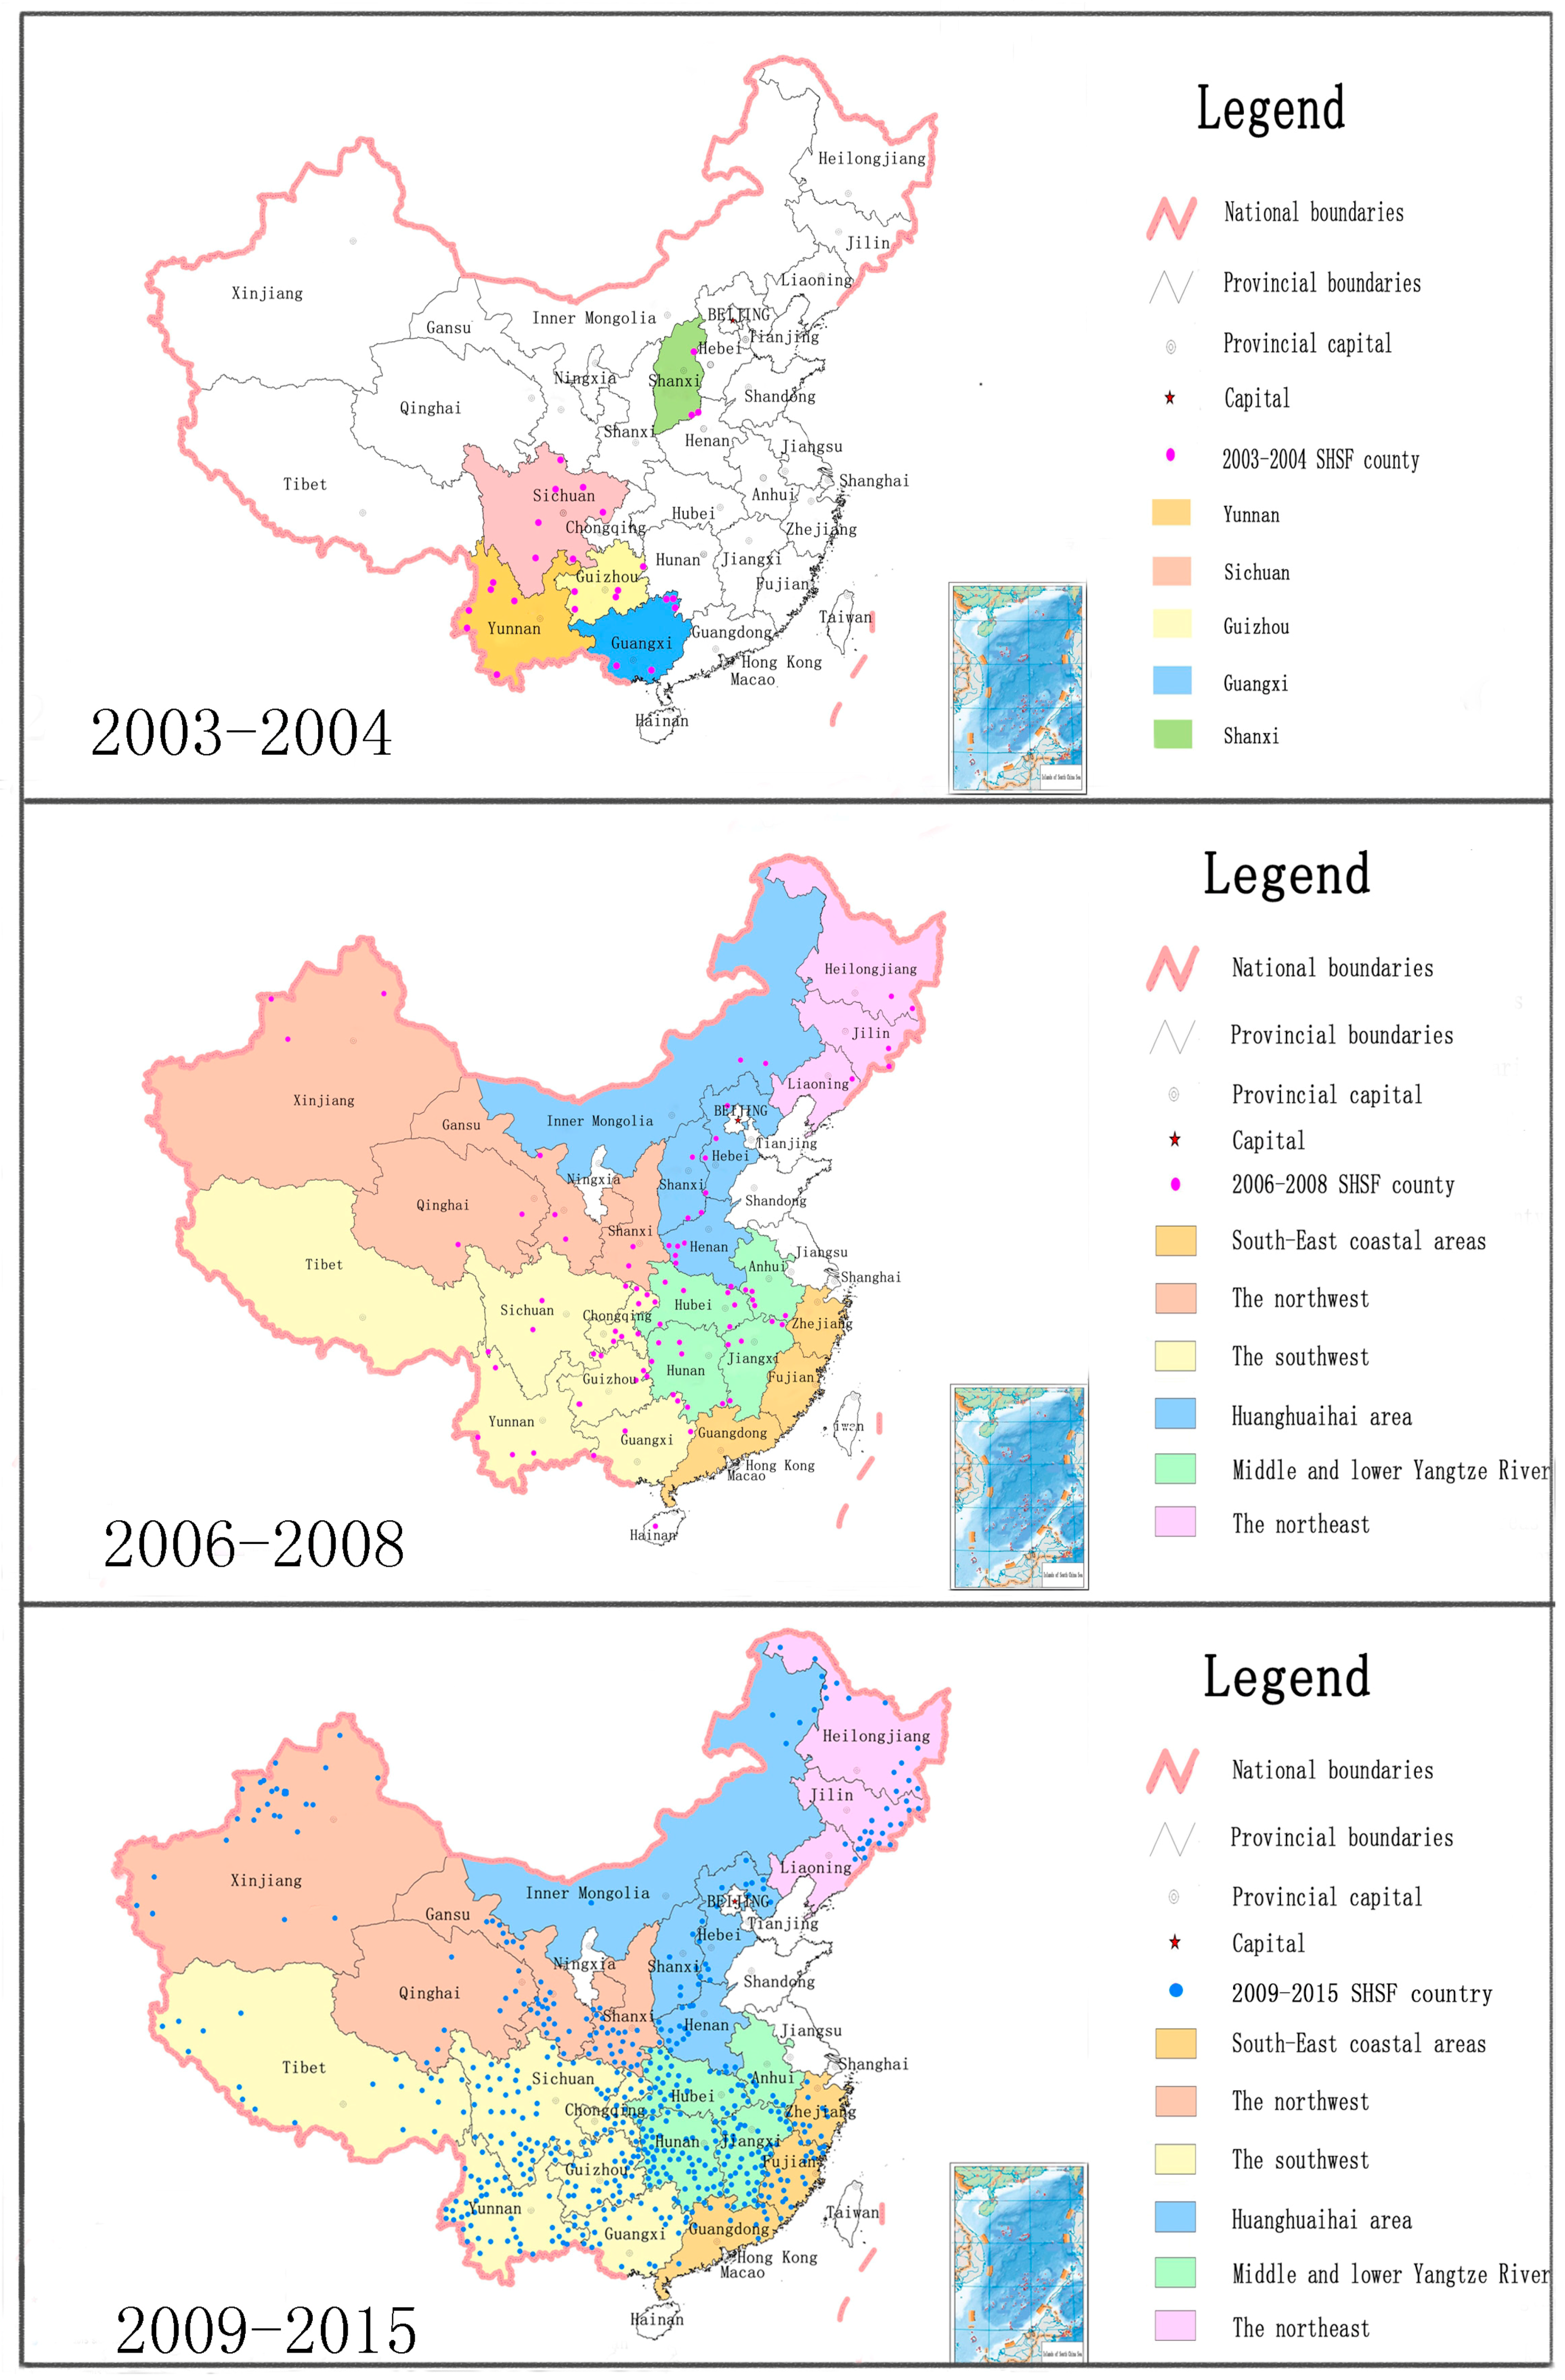
2.1. Study Sites

This study was conducted in Majiang County (latitude: 26°17′–26°37′, longitude: 107°18′–107°53′, elevation 576–1862 m) in the southeastern region of Guizhou province. Majiang County is located in the subtropical climate zone, with a long-term annual average precipitation of 1200–1500 mm and a mean annual temperature of 14–16 °C. Forest sampling and questionnaire surveys were conducted in the Fujiang village, which had an existing SHSF program with a small hydropower plant (YY); the Fujiang small hydropower plant was initiated as a SHSF pilot program in 2003. The total investment was RMB 16.39 million yuan, countries invested 6.7 million and the electric company of the county financed 9.69 million, providing 1765 households with 3760 MWh of electricity annually as a substitute for wood fuel. The masson pine (Pinus massoniana) plantation (PM) protected by the SHSF program had an initial stand density of 1600 trees ha−1 and was 358.85 ha in size; the protected weeping cypress (Platycladus orientalis) plantation (PW) had an initial stand density of 2000 trees ha−1 and was 121.15 ha in size. The plantations were established in 2005 by the Sloping Land Conversion Program (SLCP). Shrubs under the tree layer were mainly Ligustrum quihoui and Pyracantha fortuneana, and the most abundant herbs were Asteraceae and Gramineae. To better understand the attitudes of households towards the SHSF program, the questionnaire survey was also conducted in Wengbao village, which is close to a small hydropower plant that was not taking part in any SHSF program (YN), and in Dexing village, which did not have access to a small hydropower plant (NN) during the surveyed period. These two sites were selected because they have similar climates, land productivity, crop types, and economic conditions to Fujiang village.

2.2. Data Collection and Analysis

2.2.1. Biomass

Four study sites were selected based on their representation of geomorphology and typical vegetation, and whether they were involved in the SHSF program; this included protected plantations of masson pine (PM) and weeping cypress (PW), and unprotected plantations of masson pine (UM) and weeping cypress (UW). In mid-August 2014, three plots (20 m × 20 m) were established per site; plots were separated by at least 10 m. For each plot, we measured tree density, stem height, and stem diameter at breast height (DBH; 1.37 m height). Within each plot, five subplots were used to collect shrub (2 m × 2 m) and litter (20 cm × 20 cm) samples, respectively; samples were oven-dried at 80 °C to minimize the water content of samples.
The relative growth method combines prediction variables with biomass of trees and can be obtained simply and easily, thus enabling the establishment of a forest biomass model of allometric growth [26]. Allometric models based on tree morphological characteristics (DBH and height) provided adequate predictions of arbor biomass with good precision [27,28,29]. Regional-specific allometric equations [30,31,32] were used to calculate the biomass of different tree components of masson pine and weeping cypress, and the correlation coefficient was above 0.90 in all cases (Table 1). Arbor biomass is the sum of the trunk, branch, leaf, and root biomass values. One-way ANOVAs were used to evaluate differences between protected and unprotected plantations, and the Duncan approach was used for multiple comparisons.

2.2.2. Household Survey

Questionnaires are widely used in public policy evaluation. A socio-economic questionnaire was designed to collect information on household financial conditions and residents’ understanding of the SHSF program. For household financial conditions, we collected data regarding household composition and demographic behavior, land availability and agricultural land, income from farm and off-farm sources, as well as the total household expenditures, including electricity cost. The average education level of all family members was considered as an influence on these measures. Since YN and NN did not take part in the SHSF program, we modified the section of the questionnaire regarding attitudes towards the SHSF program. Based on their understanding of the program, we asked direct and indirect questions to evaluate whether the SHSF programs are likely to remain in the future. We collected data from 100 households at each of the three study sites in August 2014. Some households provided far too little information to be included in the analyses, thus we obtained 88, 70, and 77 questionnaire results from YY, YN, and NN, respectively.
Due to differences in the social and living costs between the three sites, it may be misleading to compare the impacts of SHSF programs in absolute terms. We thus developed a number of relative measures that can be compared across sites: Ratio of agricultural income to total household income (Ra), ratio of off-farm income to total household income (Ro), ratio of electricity cost to total household income (Re), ratio of electricity cost to agricultural income (R1), ratio of electricity cost to off-farm income (R2), and ratio of electricity cost to total expenditure (Rp) [3].
We first used ANOVA to test for differences in these factors regarding households sampled from each study site treated as a group. We then used an LSD approach for multiple comparisons of variables with equal variances of household survey data, and a Games–Howell approach was used for those with unequal variances.

2.2.3. Difference-in-Difference Method

Difference-in-Difference (DID) is an econometric method that can estimate the effects of function objects of the policy or program in question [33]. The great appeal of DID estimation stems from its simplicity as well as its potential to circumvent many of the endogeneity problems that typically arise when comparisons are being made between heterogeneous individuals [34]. Based on the data from household questionnaire surveys, we analyzed the effect of SHSF on the income of farmers. The advantage of this method is that it can better control for missing variables and system differences.
The model is as follows:
y it = α 0 + β 1 · t   +   δ · prog it   +   β 2 · Z it   +   β 3 · X it   +   a i   +   μ it
where subscript i denotes the household; t is a period dummy variable, which may equal 1 or 2, representing 2005 (period before SHSF) or 2013 (period after SHSF), respectively; yit is a dependent variable of the impact of SHSF; progit is a dummy variable that equals 1 if a household was participating in the SHSF program during the period t, or 0 if the household was not participating; Zit is observable and variable over time, Zit includes factors such as the number of family labor force, population, etc.; and Xit is observable and invariable over time, Xit includes the age, gender, education, duty of the householder, etc.; ai is unobservable and invariable over time; μit denotes idiosyncratic disturbances that are unobservable, invariable over time and households; δ is to measure the impact of the fuel program on the farmers income yit; α 0 is the coefficient of the intercept; β 1 is the coefficient of the time trend; β2 and β3 are parameter matrixes to be estimated, measuring the impact of Zit and Xit on yit. The first order difference model could be presented as follows:
y i 2   y i 1 = β 1   +   δ · prog i 2 +   β 2 ( Z i 2 Z i 1 )   +   ( μ i 2 μ i 1 )
SHSF is an official program driven top-down and administratively. Households lack options to some extent; therefore, the SHSF is a type of dependent choice problem and Equation (2) fits quite well.

3. Results

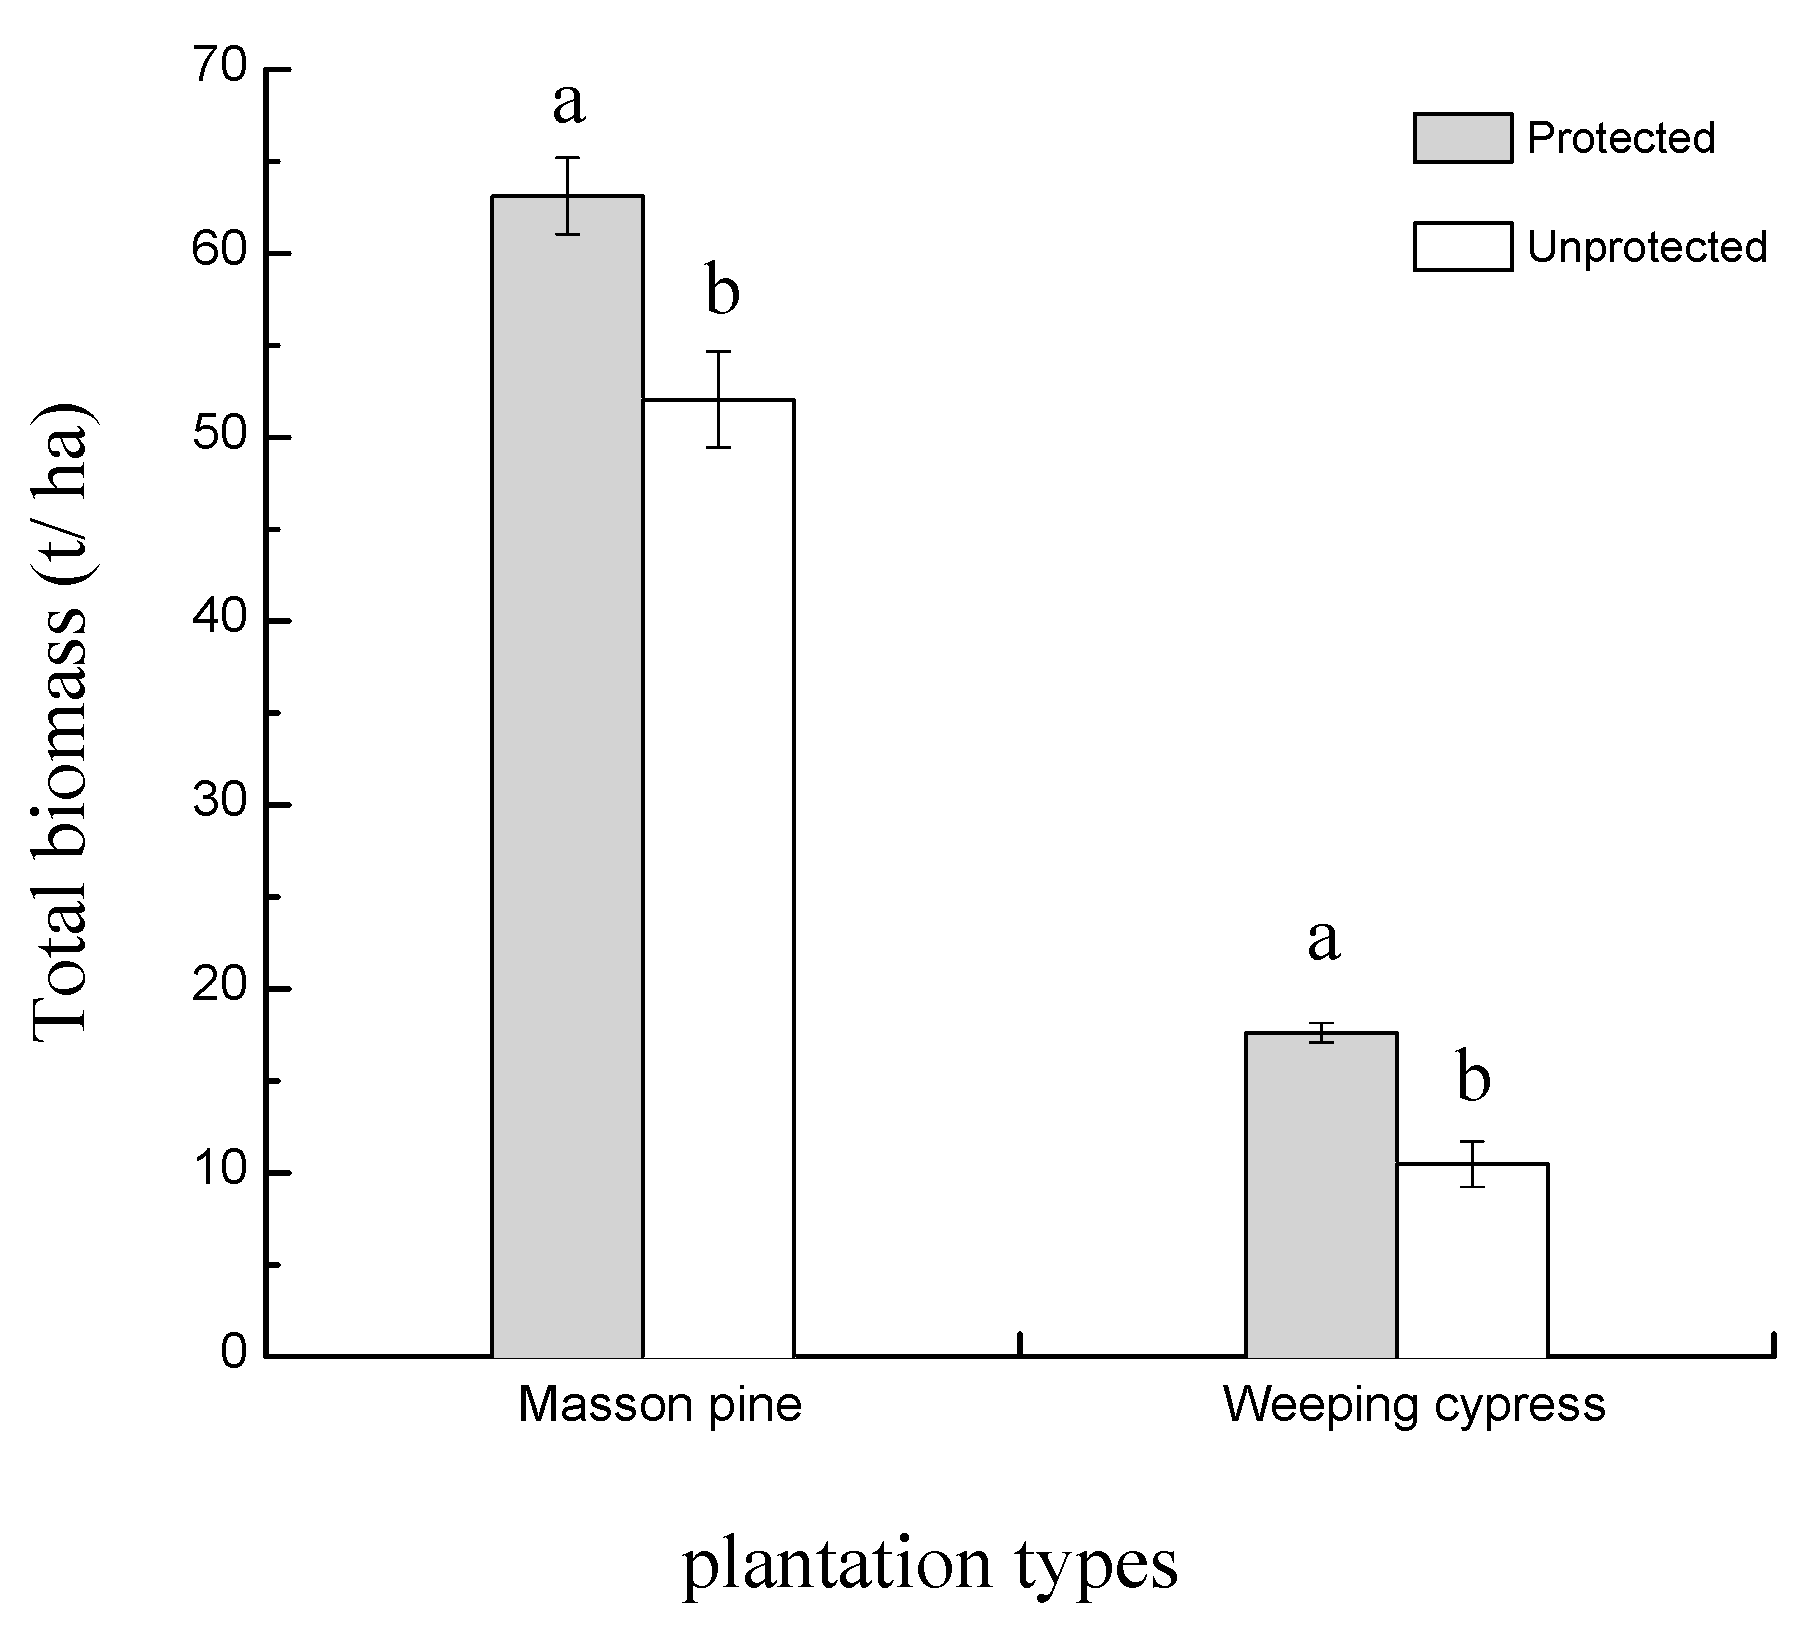
3.1. Forest Ecosystem Biomass Protection by SHSF

The ecosystem biomass in protected plantations was significantly higher (p < 0.05) than biomass of the unprotected plantations (Figure 2). PM biomass was 63.11 t·ha−1, which was 11.06 t·ha−1 higher than in the unprotected masson pine plantation. The ecosystem biomass in PW was 17.62 t·ha−1, 7.15 t·ha−1 higher than in UW. The SHSF program presented an apparent impact on local forest ecosystem biomass.
The differences in ecosystem biomass between the ecosystems of protected and unprotected plantations were mainly derived via arbor biomass (Table 2). The arbor biomass in PM was 10.92 t·ha−1 higher than the UM, which accounts for 98.73% of the difference in ecosystem biomass. The arbor biomass in PW is 6.41 t·ha−1 higher than the UW, which accounts for 89.65% of the difference in ecosystem biomass. Based on the sampling of SHSF masson pine and weeping cypress plantations protected from firewood cutting, the tree density was much higher compared to UP and UW, which likely contributes to the higher arbor biomass. There was no significant difference between PM and UM in shrub biomass and litter biomass; PW was only 0.2 t·ha−1 rub biomass higher than UW, and they had almost the same litter biomass. Nevertheless, shrub biomass of PW was significantly higher than that of UM. Litter was not found in PW and UW during our sampling in August, which may be due to the lower canopy density and luxuriant shrub layer, contributing to conditions that promoted rapid decomposition and limited litter biomass.

3.2. Impacts of SHSF on Household Livelihood

Table 3 provides descriptive statistics, including education, cropland area, off-farm income, agricultural income, total income, total expenditure, and electricity cost based on the household questionnaire in each study site. We found no obvious differences in average education level of households. Average off-farm income was higher than mean agricultural income among the three study sites. YN had the highest average agricultural income (12,815.57 yuan), which coincided with the largest average cropland area, which was more than four times larger than that in YY and twice that in NN. However, mean off-farm income in YY was higher by about 10,000 yuan than that in YN and NN, which might be because more labor force in YY were employed during the study period in large nearby cities, such as Guangdong City. Total income and total expenditure among these three sites were quite close with an average of 23,176.49 yuan. Surprisingly, as A-class poverty villages, the two indexes of YY were higher than others; even the average total expenditure exceeded that in the county (23,480 yuan, based on a common family of four). With 1274.44 yuan, NN had the highest mean electricity cost; in contrast, YY only expended 860.68 yuan on the electricity bill, as provided by the SHSF program.
Our analysis included the impacts of SHSF on household income, per capita net income of crop farming, stock farming, off-farm employment, and total in the questionnaire. Because the model was designed to fit the differential equations of each variable, model fit is generally low, however, the impact that accessment on the policy-effect based the model is not obvious [35,36]. The influence of SHSF on crop farming was negative, but the effect was not statistically significant (Table 4). The per capita net income of stock farming income, off-farm employment income, and total income increased by 228.97 yuan, 771.53 yuan, and 912.68 yuan, respectively, which means that SHSF had a positive influence. However, the crop faming decreased by 106.92 yuan. Moreover, the effect was significant for off-farm employment income and total income. After the households participated in the SHSF program, the number of laborers engaged in planting work decreased and they had more time to engage in animal husbandry production. SHSF also increased the chances of farmers to participate in off-farm employment to improve off-farm income. Off-farm employment accounted for 84.5% of total; consequently, total income also increased notably.
Other than the ratio of R1, statistically significant differences were found for all other ratios at the 99% confidence level (Table 5). Ra was highest in YN (41.0%), due to its largest cropland area, followed by NN (20.2%) and YY (9.3%), respectively. In the rural household income structure, income from the labor force was the most important. Ro was much higher than Ra for all sites, but it was highest in YY, intermediate in NN, and lowest in YN. YY had the least Re, which was about half of that in YN and NN. Due to the lowest average agricultural income rates in YY, and 33 households that reported no agricultural income because they kept all harvests from fields for domestic use, R1 was higher in YY (p < 0.05). In addition, R2 was similar to Re, the total income consisted largely of off-farm income. Electricity costs accounted for 3.6% of total annual expenditures in YY, but electricity accounted for 4.6% and 5.6% in YN and NN, respectively.
Table 6 presents multiple comparison results of the derived ratios between the three sites. Ra in YN was significantly higher than in the other two study sites, but YY and NN were not significantly different. Correspondingly, Ro in YN was significantly lower compared to the other sites, which indicates that income from agriculture occupied a more important position in total household income in YN compared to YY and NN. For Re, YY was significantly lower than the other two sites, while no significant difference was found between YN and NN. R1 in YN was significantly lower than that in NN. Differences in R2 were the same as Re. There was no significant difference in Rp between YN and NN, though Rp was significantly lower in YY than in the other two sites, likely due to much lower electricity costs in YY, but the average total expenditures among these three sites was similar.

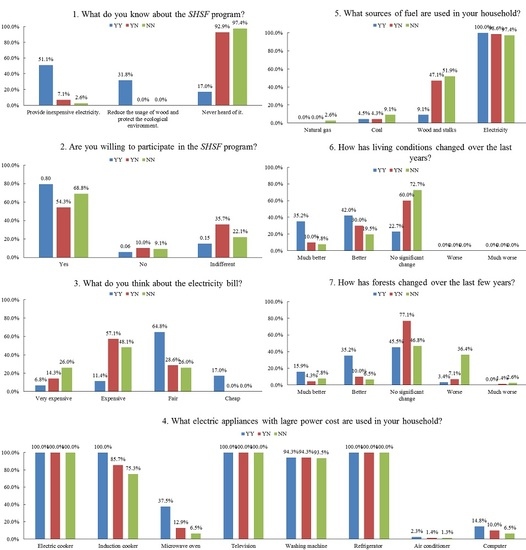
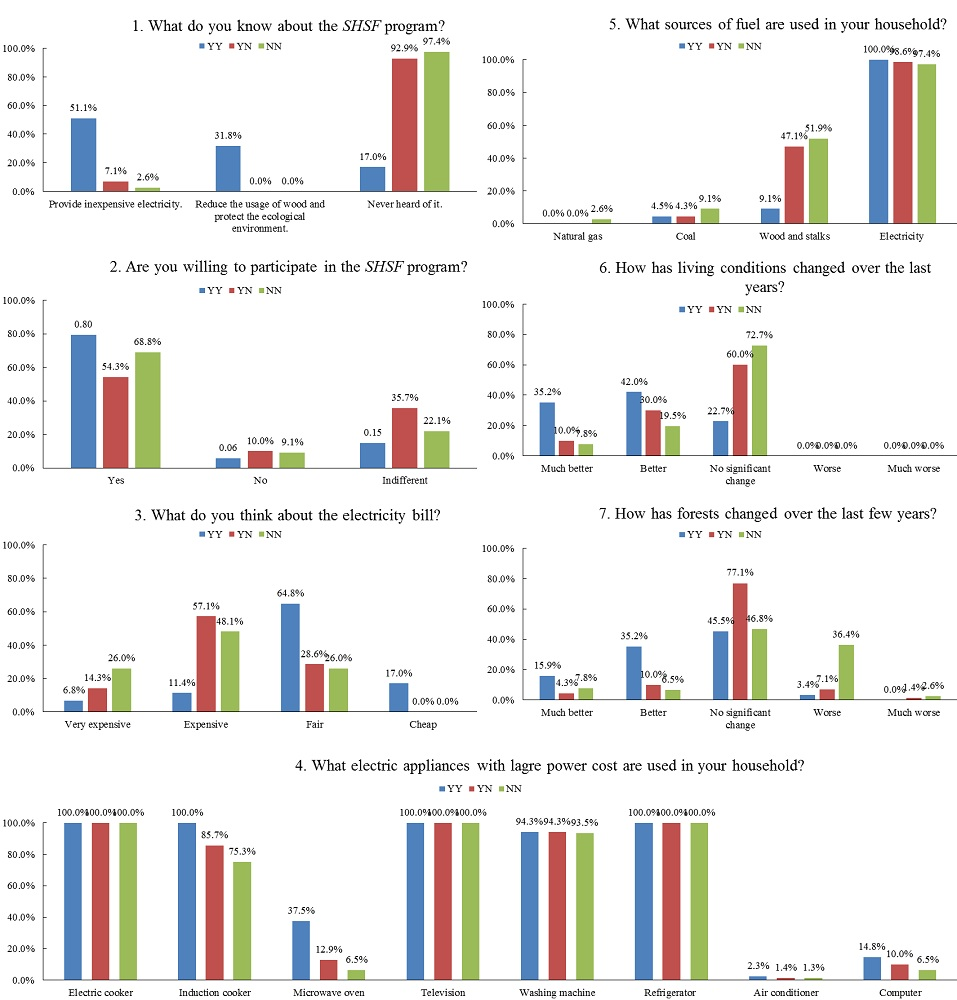
3.3. Households’ Attitudes towards SHSF

To understand the impact of SHSF on the daily life and attitudes of households towards the program, we asked a series of questions in a questionnaire regarding the program (1. What do you know about the SHSF program? 2. Are you willing to participate in the SHSF program? 3. What do you think about the electricity bill? 4. What electric appliances with large power cost are used in your household? 5. What sources of fuel are used in your household? 6. How has living conditions changed over the last years? 7. How has forest changed over the last years?) (Figure 3). Because there was no SHSF program operating in YN and NN, we firstly wanted to know how much information people had about the program. Not surprisingly, households in YY knew more about the purpose of the SHSF program than the other two study sites. In YY, 51.1% of households thought the purpose of SHSF was to provide inexpensive electricity, and 31.8% believed the program was aimed at reducing wood usage and protecting the ecological environment; 17.0% of households had never heard of the program. When asked whether they would be willing to participate in the SHSF program, about 80% said yes, only 5.7% said no. In YN and NN, 92.9% and 97.4% of households, respectively, claimed they had never heard of the SHSF program, and, correspondingly, almost no one knew its main purpose. After we explained the program to the households, 54.3% and 68.8% of households in YN and NN claimed they would be interested in participating in the program, respectively; however, 35.7% and 22.1% were indifferent to the program, respectively.
Households’ views on electricity bills are critical to whether they would use electricity to replace firewood. In YN and NN, 57.1% and 48.1% of households, respectively, thought their electricity costs were ‘expensive’, while 14.3% and 26.0%, respectively, thought they were ‘very expensive’. The electricity bill was a significant annual expenditure that could not be ignored in YN and NN. In contrast, 64.8% of YY households thought the electricity bill was fair, which we attributed to the benefits of the SHSF program; less than 20% of YY respondents thought the bill was ‘expensive’ or ‘very expensive’, which was a rather small proportion compared with YN and NN. As for electric appliances, almost all households had electric cookers, televisions, washing machines, and refrigerators at all three sites; however, in YY, the usage of induction cookers, microwave ovens, and computers, was higher than in YN and NN. Households that had computers were low among the three study sites, which may be due to the low average education of householders, and the favorable climate likely contributed to the very low occupancy of air conditioners.
The purpose of SHSF was to discourage the use of firewood as a fuel source, so it was important to understand the energy structure of the households [37]. It was obvious that almost every household used electricity in their daily life at all three sites, although there were a few households using coal or natural gas. The SHSF program was operative in YY, 9.1% of households still claimed that they used wood and stalks as energy sources. Almost half of the households in YN and NN claimed to use wood and stalks for energy.
Compared to YN and NN, more YY households thought that their ‘life has been better’ or ‘much better than in the past’. More than half of the households in YN and NN thought that their life had ‘no significant change’ over the past several years. More than one-third of the YY labor force had found jobs outside of their village and received more income than in the past, which dramatically improved their living standards. Fortunately, no households thought their life had become worse or even worse, which may be related to the generally positive economic growth in China over the past few decades.
Because the main aim of the SHSF program was the protection of forest resources, we wanted to understand changes in forests since the introduction of the program. In YY, 51.1% of households thought forests were ‘better’ or ‘much better’, while only 14.3% of households in YN and NN held the same view. On the contrary, fewer households in YY (3.4%) claimed that forest resources had been ‘worse’ or ‘much worse’ than those in YN (8.5%) and NN (39.0%). Nevertheless, most households still thought that forests suffered no significant change over the last few years.

4. Discussion and Conclusions

4.1. Effects of SHSF Program on Forest Biomass

Energy consumption in rural areas depends on access to local resources [38,39]. The Chinese biomass energy consumption accounts for 56% of total energy consumption in daily life and 1.5% in production, alleviating the pressure of the fossil fuel supply [40,41]. However, excess demand for biomass energy can have negative impacts on the balance of local ecosystems. Often people in rural areas would prefer to use a lot of firewood without any cost rather than purchase fossil fuel or electricity. Song et al., reported that 90.9%, 72.7%, and 93.4% of rural households in Anhui, Hubei, and Shanxi used wood as their residential energy resource [3]. The activity of wood-cutting can result in reduced forest quantity and quality, potentially followed by soil erosion, reduced ability to retain water, and reduced soil fertility. The main goal of the SHSF program was to establish healthy developmental mechanisms for ‘retaining water with forest, generating power with water, and protecting forest with electricity’, ensuring successful recovery of vegetation, and ecological restoration [42]. The 320 operational SHSF programs have reduced fuel wood consumption by 5.70 × 10⁶ m3 and protected about 74.67 × 10⁴ ha forest area [43]. Based on our study of protected and unprotected forests, the Fujiang SHSF program has protected 11.06 t·ha−1 and 7.15 t·ha−1 in masson pine and weeping cypress plantations, respectively, suggesting that this program has played an important role in forest protection. Our findings are in agreement with the existing literature on ecological benefit research. For example, numerous studies have demonstrated that human disturbance would reduce forest biomass, as well as vegetative carbon storage and soil carbon stocks [44,45,46]. Zhang forecasted that the project would reduce 3.21 × 10⁴ t fuel wood consumption by 2020 in Pu’ An county [47], and Liu et al., found that the SHSF program in Shanxi province, China saved ¥8,232,000 by reducing carbon dioxide emissions and ¥16,890 by reducing sulfur dioxide emissions [48]. As one of the important ecological programs, SHSF contributed much on the achievements of ecological forest restoration projects such as NFPP and SLCP, by reducing farmers’ reclamation, grazing, cutting wood and other man-made damage to the forest ecosystem. Depending on its own regulation ability, forest ecosystems play important roles in ecological services such as regulating the climate, conserving water and soil resources, breaking wind and fixing sands, purifying air, etc., which could gradually restore the degraded ecosystem and make them develop in the direction of virtuous cycle.
Previous biomass data was calculated using the energy conversion efficiency (ECE) between electricity and firewood, or some empirical data, such as the average firewood consumption per household. For example, both Liu and Sun [48,49] estimated the forest biomass with an ECE of 2.0 kg (kWh)−1, and <The guidelines for accounting ecological benefit of small hydropower substituting fuel > the calculation recommended the adoption of 5000 kg per household annually as an estimate [50]. If we estimated the protected forest biomass according to the guideline in the Fujiang SHSF program, the ECE would have been 2.35 kg (kWh)−1; however, our sampling suggested the ECE value was only about 1.28 kg (kWh)−1, which was 64% of the empirical value and 54% of the guideline. The field data was obviously smaller than the traditional methods, which may have been due to the difference between firewood-cutting and clear-cutting; the households preferred to collect unhealthy trees and some branches (even some shrubs) with the increasing awareness of the relationships between forest ecological health and sustainability. However, forests are a dynamic ecosystem [51], thus biomass growth may compensate for losses associated with firewood-cutting.

4.2. Effects of the SHSF Program on Households’ Income

Another important objective of the SHSF program was to help alleviate poverty, which corresponded well with the ‘precision-based poverty reduction’ policy [52,53]. Some studies have indicated that the SHSF program reduced household electrical bills by about 300 yuan annually by supplying cheap electricity, and household income increased by about 5000 yuan annually by liberating the workforce from firewood-cutting [43]. Our questionnaire survey found that YY households’ total income was higher than in YN and NN, and the SHSF program had a significant positive effect on off-farm employment income and total income. Although the total expenditure of YN households was maximal among the three study sites, the electricity cost was lowest and only about 62.6% and 51.8% of the total expenditures of YN and NN households, respectively. The ratio of electricity costs to total expenditure was 3.6% for YY households, but 57.1% and 52.9% for YN and NN households, respectively. In general, the SHSF program increased the households’ total income by liberating the workforce from firewood collecting for off-farm work, reduced expenses by providing cheaper electricity, and improved the living standard of most households. The ratio of off-farm income to total household income was significantly higher in YY households (Table 4). Residents had an average education of only 7.33 years; consequently, they generally engaged in manual labor with low wages. Ratios of electricity to total income and expenditures were significantly different between YY and the other two sites (Table 6), and residents paid more attention to electric bills, indicating that the price of electricity played an important role in the sustainability of the SHSF program.

4.3. Households’ Attitudes towards the SHSF Program

Most of the households had a positive attitude towards SHSF programs, which may be attributable to increased income and improved environmental and living conditions. However, more than 90% of households in YN and NN knew little about the background or the main purpose of the SHSF programs, although more than 50% of households expressed a desire to join the program. More information is required to improve public understanding of the SHSF program. Another cause for concern was that most of the residents’ intuitive sense of forest change was not optimistic. About 45.5%, 77.1%, and 46.8% in YY, YN, and NN, respectively, thought that the forest showed no significant change over the past several years; in NN, 36.4% of respondents claimed forest resources were worse than before. We should not only focus on the quantity of protected forest, but also on the quality of the forests.
In general, based on our field and questionnaire surveys, our study provided new empirical evidence that indicated optimistic prospects for the sustainability of the SHSF program. Factors that contribute to the sustainability of the SHSF program include: (1) the ecosystem biomass in protected plantations was significantly higher than the biomass of the unprotected plantations, and the differences mainly derived from arbor biomass. The biomass of PM and PW were 63.11 t·ha−1, and 17.62 t·ha−1, respectively. The energy conversion efficiency based on field investigations was merely 1.28 kg (kWh)−1, which was less than the empirical value and the guideline for accounting ecological benefit of small hydropower substituting fuel, respectively. (2) YY household’s income had been improved on off-farm employment and total income. Moreover, YY households had a lower electricity cost than YN and NN Based on the DID model calculating, the per capita net incomes of stock farming income, off-farm employment income, and total income increased by RMB 228.97 yuan, 771.53 yuan, and 912.68 yuan, respectively. Other than the ratio of R1, there were statistically significant differences for all other ratios at the 99% confidence level in YY, YN and NN. YY and YN were significantly different except for R1. There was significant difference between YY and NN in Re, R2 and Rp, on the contrary, YN and NN were not significant different in the three indexes. (3) Most of the residents supported the sustainable development of the SHSF program. SHSF provided an opportunity to make the residents use electrical appliances to improve the quality of life by providing cheap electricity. At the same time, the living conditions improved with decreasing usage of wood. Despite these overall positive conclusions, much work is still required, such as improving education of residents and popularizing the implementation process, purpose, and significance of the SHSF program [54]. Given the potentially positive social and ecological impacts of the SHSF program on vegetation restoration and livelihoods, further evaluation and monitoring of the program needs to be conducted so that timely policies can be made to address emerging problems.

Supplementary Files

Supplementary File 1

Acknowledgments

This study was supported by the Cooperation of International Science and Technology Cooperation (2012DFA60830) and the German ministry of education and research (BMBF) (02WCR1307).

Author Contributions

The study was conceived and designed by Xiaoxia Zhang. Experiments were conducted by Gaomin Wang and Yushen Zhu. Xiaoxia Zhang analyzed the data with the support of Tonggang Zha. Yun Zhao assisted with manuscript editing. All authors reviewed and revised the manuscript to its final form. The entire study was conducted under the supervision of Tonggang Zha.

Conflicts of Interest

The authors declare no conflict of interest.

References

  1. Shen, Y.; Liao, X.; Yin, R. Measuring the Aggregate Socioeconomic Impacts of China’s Natural Forest Protection Program. Environ. Dev. Econ. 2006, 11, 769–788. [Google Scholar] [CrossRef]
  2. Zhang, X.; Yang, Z.; Zha, T.; Zhang, Z.; Wang, G.; Zhu, Y.; Lyv, Z. Changes in the physical properties of soil in forestlands after 22 years under the influence of the Conversion of Cropland into Farmland Project in Loess region, Western Shanxi Province. Acta Ecol. Sin. 2017, 37, 416–424. [Google Scholar] [CrossRef]
  3. Song, C.; Zhang, Y.; Mei, Y.; Liu, H.; Zhang, Z.; Zhang, Q.; Zha, T.; Zhang, K.; Huang, C.; Xu, X.; et al. Sustainability of Forests Created by China’s Sloping Land Conversion Program: A comparison among three sites in Anhui, Hubei and Shanxi. For. Policy Econ. 2014, 38, 161–167. [Google Scholar] [CrossRef]
  4. Peter, S.; Roger, N.; Ainsley, J.; Benjamin, L.; Matthew, C.; Paul, J.; Sardar, M.; Penny, H. Climate change and the new world economy: Implications for the nature and timing of policy responses. Glob. Environ. Chang. 2006, 18, 380–396. [Google Scholar] [CrossRef]
  5. Pang, M.; Zhang, L.; Uligiati, S.; Wang, C. Ecological impacts of small hydropower in China: Insights from an emergy analysis of a case plant. Energy Policy 2015, 76, 112–122. [Google Scholar] [CrossRef]
  6. Wang, X.; Fend, Z. Survey of rural household energy consumption in China. Energy 1996, 21, 703–705. [Google Scholar]
  7. Rozelle, S. Grain for Green: Cost-Effectiveness and Sustainability of China’s Conservation Set-Aside Program. Land Econ. 2005, 81, 247–264. [Google Scholar] [CrossRef]
  8. Zhang, Y.; Song, C. Impacts of Afforestation, Deforestation, and Reforestation on Forest Cover in China from 1949 to 2003. J. For. 2006, 104, 383–387. [Google Scholar]
  9. Ali, J.; Benjaminsen, T.A.; Hammad, A.A.; Dick, Ø.B. The road to deforestation: An assessment of forest loss and its causes in Basho Valley, Northern Pakistan. Glob. Environ. Chang. 2002, 15, 370–380. [Google Scholar] [CrossRef]
  10. Sharman, N.; Tiwari, P.; Sood, Y. A comprehensive analysis of strategies, policies and development of hydropower in India: Special emphasis on small hydro power. Renew. Sustain. Energy Rev. 2013, 18, 460–470. [Google Scholar] [CrossRef]
  11. Jager, H.I.; Mcmanamay, R.A. Comment on “Cumulative biophysical impact of small and large hydropower development in Nu River, China” by Kelly M. Kibler and Desiree D. Tullos. Water Resour. Res. 2014, 50, 758–759. [Google Scholar] [CrossRef]
  12. Darmawi; Sipahutar, R.; Bernas, S.M.; Imanuddin, M.S. Renewable energy and hydropower utilization tendency worldwide. Sustain. Energy Rev. 2013, 17, 213–215. [Google Scholar] [CrossRef]
  13. Zhou, Y.; Li, H.; Wang, K.; Bi, J. China’s energy-water nexus: Spillover effects of energy and water policy. Glob. Environ. Chang. 2016, 40, 92–100. [Google Scholar] [CrossRef]
  14. Kong, Y.; Kong, Z.; Liu, Z.; Wei, C.; An, G. Substituting small hydropower for fuel: The practice of China and the sustainable development. Renew. Sustain. Energy Rev. 2016, 65, 978–991. [Google Scholar] [CrossRef]
  15. Lu, X.; Zeng, P.; Ma, Z. Analysis of Status Quo and Prospect of Substituting Small Hydropower Station for Fuel Project in China. Water Resour. Power 2008, 6, 115–117. [Google Scholar]
  16. Kong, Y.; Zhang, L.; Uligiati, S.; Wang, C. Small hydropower in China: The survey and sustainable future. Sustain. Energy Rev. 2015, 48, 425–433. [Google Scholar] [CrossRef]
  17. The Ministry of Water Resources (MWR). Planning of the Ecological Protection Project of National Small Hydropower for Fuel; MWR: Beijing, China, 2002.
  18. Xing, Y.; Li, R.; Zhao, H.; Ma, Z.; Qin, J. Ecological Protection and Sustainable Development of the Engineering of Small Hydropower Alternating Fuel. China Waterpower Electr. 2011, 10, 10–16. [Google Scholar] [CrossRef]
  19. Kadiyala, A.; Kommalapati, R.; Huque, Z. ArticleEvaluation of the Life Cycle Greenhouse Gas Emissions from Hydroelectricity Generation Systems. Sustainability 2016, 8, 539. [Google Scholar] [CrossRef]
  20. Sharma, H.K.; Sharma, J.K.; Chauhan, R.S. Mitigation of damage & O&M problems due to silt at Nathpa Jhakri Hydro Power Station—1500 MW. In Proceedings of the Third International Conference on Silting Problems in Hydropower Projects, New Delhi, India, 27–28 February 2008. [Google Scholar]
  21. Zhong, Y.; Power, G. Some environmental impacts of hydroelectric projects on fish in Canada. Impact Assess. 1996, 14, 285–308. [Google Scholar] [CrossRef]
  22. Private Sector Hydropower Development Project. Manual for Developing and Reviewing Water Quality Monitoring Plans and Results for Hydropower Projects. Available online: http://erg.com.np/wp-content/uploads/2014/09/Manual-for-Developing-and-Reviewing-Water-Quality.pdf (accessed on 8 June 2017).
  23. Zhang, L.; Pang, M.; Wang, C.; Uligiati, S. Environmental sustainability of small hydropower schemes in Tibet: An emergy-based comparative analysis. J. Clean. Prod. 2016, 135, 97–104. [Google Scholar] [CrossRef]
  24. Huang, B. The Study of Sustainable Development for Small Hydropower Replacing Firewood Unit Based on Eco-Economic Model; Xi’an University of Technology: Xi’an, China, 2008. [Google Scholar]
  25. He, Z.; Huang, D.; Wang, B. Evaluation research on poverty alleviation performance in poor areas promoted by small hydropower stations for fuel projects: A case study of Majiang County in Guizhou province. China Rural Water Hydropower 2015, 9, 178–182. [Google Scholar]
  26. Luo, Y.; Zhang, X.; Wang, X.; Zhu, J.; Hou, Z.; Zhang, Z. Forest Biomass Estimation Methods and Their Prospects. Sci. Silvae Sicicae 2009, 45, 129–134. [Google Scholar]
  27. Bondlamberty, B.; Wang, C.; Gower, S.T. Aboveground and belowground biomass and sapwood area allometric equations for six boreal tree species of northern Manitoba. Can. J. For. Res. 2002, 38, 1441–1450. [Google Scholar] [CrossRef]
  28. Chave, J.; Andalo, C.; Brown, S.; Cairns, M.A.; Chambers, J.Q.; Eamus, D.; Fölster, H.; Fromard, F.; Higuchi, N.; Kira, T.; et al. Tree allometry and improved estimation of carbon stocks and balance in tropical forests. Oecologia 2005, 145, 87–99. [Google Scholar] [CrossRef] [PubMed]
  29. Vieilledent, G.; Vaudry, R.; Andriamanohisoa, S.F.D.; Rakotonarivo, O.S.; Randrianasolo, H.Z.; Razafindrabe, H.N.; Rasamoelina, M. A universal approach to estimate biomass and carbon stock in tropical forests using generic allometric models. Ecol. Appl. 2012, 22, 572–583. [Google Scholar] [CrossRef] [PubMed]
  30. Wang, T. A Study on Individual Arbor Biomass Models of Pinus Massoniana Platation of Jiangle Fujian; Beijing Forestry University: Beijing, China, 2012. [Google Scholar]
  31. Shi, P.; Zhong, Z.; Li, X. A study on the biomass of alder and cypress artificial mixed forest in Sichuan. Chin. J. Plant Ecol. 1996, 20, 524–533. [Google Scholar]
  32. Yuan, W.; Jiang, B.; Ge, Y.; Zhu, J.; Shen, A. Study on Biomass Model of Key Ecological Forest in Zhejiang Province. J. Zhejiang For. Sci. Technol. 2009, 29, 1–5. [Google Scholar] [CrossRef]
  33. Dong, M.; Wang, G. Application of Double Difference Method in the Evaluation of Effects of Ecological Immigration—Case of Ningxia. J. Agrotech. Econ. 2010, 8, 87–93. [Google Scholar]
  34. Bertrand, M.; Duflo, E.; Mullainathan, S. How Much Should We Trust Differences-in-Differences Estimates? Q. J. Econ. 2004, 119, 249–275. [Google Scholar] [CrossRef]
  35. Shi, Z. Analysis of the Continuation of the Grain for Green Project—An Empirical Study Based on Mei County in Shanxi Province; Zhejiang University: Hangzhou, China, 2010. [Google Scholar]
  36. Shen, L. The Empirical Analysis for the Influence of the Policy of “Home Appliances Going to the Countryside” on Rural Household’ Consumption; Tsinghua University: Beijing, China, 2013. [Google Scholar]
  37. Wang, X.; Hao, X.; Jin, L. Study on rural household energy consumption in China based on household investigation from typical counties. Trans. Chin. Soc. Agric. Eng. 2014, 30, 206–212. [Google Scholar] [CrossRef]
  38. Zhang, M.; Su, B. Assessing China’s rural household energy sustainable development using improved grouped principal component method. Energy 2016, 113, 509–514. [Google Scholar] [CrossRef]
  39. Zheng, X.; Wei, C.; Qin, P.; Guo, J.; Yu, Y.; Song, F.; Chen, Z. Characteristics of residential energy consumption in China: Findings from a household survey. Energy Policy 2014, 75, 126–135. [Google Scholar] [CrossRef]
  40. Huo, M.; Zhang, Z. Natural Resources of China; Higher Education Publishing House: Beijing, China, 2001. [Google Scholar]
  41. Chen, G.; Chen, B. Resource analysis of the Chinese society 1980–2002 based on exergy—Part 2: Renewable energy sources and forest. Energy Policy 2007, 35, 2038–2050. [Google Scholar] [CrossRef]
  42. Li, X.; Xu, L. Simple Analysis of Energy Utilization and Sustainable Development in China. Procedia Environ. Sci. 2012, 13, 873–878. [Google Scholar] [CrossRef]
  43. Xing, Y.; Zou, T. Practice of precision -based poverty reduction in mountainous areas: Take small hydropower replacing wood fuel construction as a case. China Water Resour. 2015, 23, 25–27. [Google Scholar]
  44. Lin, S.; Yang, M.; Cao, Z.; Liu, H.; Chen, Y. Effect of different human-caused disturbances on above-ground biomass and productivity of Pinus massoniana forests. Acta Bot. Boreal-Occident Sin. 2004, 24, 516–522. [Google Scholar] [CrossRef]
  45. Fang, Y.; Mo, J.; Sandra, B.; Zhou, G.; Zhang, Q.; Li, D. Storage and distribution of soil organic carbon in Dinghushan Biosphere Reserve. Acta Ecol. Sin. 2004, 24, 135–142. [Google Scholar] [CrossRef]
  46. Liu, Y; Wang, Q.; Yu, G.; Zhu, X.; Zhan, X.; Guo, Q.; Yang, H.; Li, S.; Hu, Z. Ecosystems carbon storage and carbon sequestration potential of two main tree species for the Grain for Green Project on China’s hilly Loess Plateau. Acta Ecol. Sin. 2011, 31, 4277–4286. [Google Scholar]
  47. Zhang, X. The Environment Effects of the Replace Rural Fuel by the Small Hydropower and the Reasonable Structure and Proportion of the Rain-for-Green in the Experimental; Unit of Pu’an County Guizhou Province; Nanjing Forestry University: Nanjing, China, 2006. [Google Scholar]
  48. Liu, H.; Fei, J.; Sun, T. An assessment on the ecological benefit of small hydropower substituting firewood program. China Rural Water Hydropower 2004, 10, 111–113. [Google Scholar]
  49. Sun, T.; Zhu, Z.; Li, X. A study on the ecological benefit of small hydropower substituting firewood. Small Hydropower 2005, 2, 15–18. [Google Scholar]
  50. Xing, Y.; Li, R.; Xu, J. Guidelines of Calculating Ecological Benefit on the Project of Small Hydropower Substituting for Fuel; China Water & Power Press: Beijing, China, 2013. [Google Scholar]
  51. Keeling, H.C.; Phillips, O.L. The global relationship between forest productivity and biomass. Glob. Ecol. Biogeogr. 2007, 16, 618–631. [Google Scholar] [CrossRef]
  52. Zhao, W.; Wang, J. Under the New Normal “Precise Poverty Alleviation” Inclusive Innovation Mechanism Research. China Popul. Resour. Environ. 2015, 25, 170–173. [Google Scholar]
  53. Chatterjee, S. Poverty Reduction Strategies—Lessons from the Asianand Pacific Region on Inclusive Development. Asian Dev. Rev. 2015, 22, 1–11. [Google Scholar]
  54. Liu, X.; Mu, R. Public environmental concern in China: Determinants and variations. Glob. Environ. Chang. 2016, 37, 116–127. [Google Scholar] [CrossRef]
Figure 1. National pilot distribution of small hydropower for fuel (SHSF) in China 2003–2015.
Sustainability 09 00988 g001
Figure 2. Total biomass of protected and unprotected masson pine and weeping cypress plantations. Note: Error bars show standard deviations. Different letters indicate significant differences within each plantation type (p < 0.05).
Sustainability 09 00988 g002
Figure 3. Households’ responses to a selected set of key qualitative questions.
Sustainability 09 00988 g003
Table 1. Tree component biomass allometric equations of masson pine and weeping cypress.
Tree TypeComponentAllometric EquationR2
Masson pineTrunkW1 = 0.0395 (D2 H)0.93300.9762
BranchW2 = 1.32 D3.60060.9047
LeafW3 = 5.07 D3.48920.7987
RootW4 = 4.44 (D2 H)0.93920.9772
Weeping cypressTrunkW1 = 0.0754 (D2 H)0.79340.9450
BranchW2 = 0.0350 (D2 H)0.71190.9550
LeafW3 = 0.0685 (D2 H)0.65830.9590
RootW4 = 0.0415 (D2 H)0.67650.9690
Note: W is component biomass, D is DBH, H is tree height, and R2 is the correlation coefficient.
Table 2. Comparisons of tree, shrub, and litter biomass in the stands of different areas (t·ha−1).
Biomass TypesStand TypesMeanStd. DeviationMinimumMaximum
Arbor biomassPM61.70a1.9859.7763.73
UM50.78b2.6048.1553.34
PW15.89c0.2015.6816.08
UW9.48d1.258.2410.73
Shrub biomassPM1.18b0.091.081.24
UM0.98b0.050.921.02
PW1.73a0.091.671.83
UW0.99b0.030.961.01
Litter biomassPM0.23a0.060.160.28
UM0.21a0.050.240.34
PW————————
UW————————
Abbreviations: Protected plantations of masson pine (PM), Protected plantations of weeping cypress (PW), Unprotected plantations of masson pine (UM), Unprotected plantations of weeping cypress (UW). Different small letters indicate significant differences within the same biomass type (p < 0.05). —— Litter biomass was not found.
Table 3. Descriptive statistics for household-level variables in Fujiang, Wengbao, and Dexing villages.
MeanStd. DeviationMinimumMaximum
Education (E)YY6.963.350.0016.00
YN7.282.630.0012.00
NN7.752.680.0012.00
Cropland area (mu)YY4.775.200.0034.00
YN9.0311.000.0060.00
NN6.284.960.0027.50
Off-farm income (yuan)YY29,267.0524,392.032500.00122,500.00
YN18,442.8615,644.270.0070,000.00
NN20,448.5712,125.200.0050,000.00
Agricultural income (yuan)YY2991.885608.590.0038,700.00
YN12,815.5719,234.810.0092,000.00
NN5166.758365.130.0055,000.00
Total income (yuan)YY32,258.9224,659.053900.00125,770.00
YN31,258.4320,880.672000.0092,000.00
NN25,615.3211,318.9310,700.0055,000.00
Total expenditure (yuan)YY23,788.1816,756.685300.0088,000.00
YN22,808.8814,010.33420060,000.00
NN22,932.418593.46300040,000.00
Electricity cost (yuan)YY860.68376.980.002000.00
YN1054.71527.500.003600.00
NN1274.55682.160.003600.00
Abbreviations: Fujiang village (YY) had an existing SHSF program with a small hydropower plant, Wengbao village (YN) is close to a small hydropower plant but does not take part in any SHSF program, and Dexing village (NN) does not have access to a small hydropower plant. The same below. 1 mu = 1/15 ha, yuan: the unit of RMB.
Table 4. Estimates of first-order difference model of SHSF’s effect on per capita net income (unit: yuan).
Per Capita Net IncomeCrop FarmingStock FarmingOff-Farm EmploymentTotal
Net effect of SHSF−106.92228.97771.53 *912.68 *
(−0.94)(1.42)(2.17)(2.59)
Note: The values in brackets are t statistic. * Between site difference at 5% significant level.
Table 5. Summary statistics for derived ratios.
ItemsSiteMeanStd. DeviationMinimumMaximum
Ratio of agricultural income to total household income (Ra) **YY0.0930.2420.0000.901
YN0.4100.3530.0001.000
NN0.2020.2110.0001.000
Ratio of off-farm income to total household income (Ro) **YY0.9070.2420.0991.000
YN0.5900.3530.0001.000
NN0.7980.2110.0001.000
Ratio of electricity cost to total household income (Re) **YY0.0270.0150.0000.060
YN0.0340.0380.0000.240
NN0.0500.0440.0000.277
Ratio of electricity cost to agricultural income (R1) *YY0.2881.0960.00020.000
YN0.0820.5260.0103.600
NN0.2470.4080.0008.250
Ratio of electricity cost to off-farm income (R2) **YY0.0290.0650.0000.384
YN0.0570.0640.0070.333
NN0.0620.0560.0000.360
Ratio of electricity cost to total expenditure (Rp) **YY0.0360.0220.0000.094
YN0.0460.0390.0000.211
NN0.0560.0600.0000.360
Note: ** Between site difference at 1% significant level. * Between site difference at 5% significant level.
Table 6. Pairwise multiple comparisons for the significant difference in means among Fujiang, Wengbao, and Dexing villages.
VariablesComparison ApproachSite (I)Site (J)Mean Difference (I-J)p-Value
Ratio of agricultural income to total household income (Ra)Games-HowellYYYN−0.2050.000
NN0.0340.596
YNYY0.2050.000
NN0.1710.002
Ratio of off-farm income to total household income (Ro)Games-HowellYYYN0.2050.000
NN0.0340.596
YNYY−0.2050.000
NN−0.1710.002
Ratio of electricity cost to total household income (Re)Games-HowellYYYN−0.0240.000
NN−0.0270.000
YNYY0.0240.000
NN−0.0030.914
Ratio of electricity cost to agricultural income (R1)Games-HowellYYYN0.9180.085
NN0.2800.806
YNYY−0.9180.805
NN−0.6380.001
Ratio of electricity cost to off-farm income (R2)LSDYYYN−0.0370.000
NN−0.0210.029
YNYY0.0370.000
NN0.0160.146
Ratio of electricity cost to total expenditure (Rp)Games-HowellYYYN−0.0260.000
NN−0.0310.000
YNYY0.0260.000
NN−0.0050.828

