1. Introduction
Agricultural production has both natural and social properties, and its process contains considerable uncertainty [
1]. Since the “family-contract responsibility system” was carried out in China in the 1980s, the rural household has become the behavioral agent in the rural economic activities of China, and the fundamental unit of agricultural production [
2]. The rural household’s farmland use and crop choices have a direct effect on output benefits [
3] and influence the maintenance of farmland quality [
4], preservation of the ecological environment [
5,
6], development and utilization of resources in rural areas, evolution of agricultural landscape patterns, and sustainable development of rural areas [
7], among others. Although the income of the rural household depends less and less on crop management as industrialization develops in the rural area, crop management is still one of the major economic activities for the rural household [
8].
Analyses of the production activities of the rural household form three branches at present: the school of organization and production [
9], the school of rational peasants [
10], and the historical school [
11]. In the past, the production activity of the rural household was determined by family consumption, and the household’s economic objective was to “meet its consumption instead of pursuit of market sales for gaining maximum profits [
11]”. More studies, however, show that the rural household not only works according to its own consumption but also optimizes its production patterns in accordance with market prices in pursuit of maximum profits [
9]. Therefore, analyses of the production activity of the rural household cannot be totally divorced from the assumption of the “rational man” and cannot ignore the household’s objective of avoiding risks for maximum family utility.
The production activities of rural households are currently the main focus areas of study for scholars. According to previous studies, the driving factors of the rural household production activity are the regional advantages and the natural conditions of the farmland [
12] (soil conditions [
13], water resources and irrigation conditions [
14,
15] and transport convenience and availability [
16]), the characteristics and resources of the rural household (farmers’ ages [
17], household types [
18], the family dependency ratio [
19], the structure of labor force [
20], the agricultural income ratio [
21].), and the characteristics of the market economy (market demands and prices [
22,
23,
24], and national policies [
25]).
The Food and Agriculture Organization (FAO) of the United Nations proposed the Globally Important Agricultural Heritage Systems (GIAHS) in 2002, which aims to establish important agricultural heritage systems to preserve systems of relevant landscapes, biodiversity, and traditional knowledge as a base for sustainable management [
26]. The plan seeks to gain worldwide acknowledgement and support. In China, the Honghe Hani Rice Terraces System (HHRTS), a representative of traditional farming society in China, was listed among the GIAHS in 2010 [
27] and has gradually become a model for dynamic preservation and an example of an important agricultural heritage. HHRTS has an over 1300-year-old farming history. The vertical distribution of the forest-village-terrace-river ecological landscape forms the typical characteristics of HHRTS. Within its system is a unique energy flow, a demonstration of the law of material circulation, and high value in ecology, agricultural production, landscapes, and culture. Its agricultural biodiversity maintenance mechanism demonstrates the significance of preserving traditional agriculture. In recent years, agricultural technology modernization, which is production growth-oriented, brings threats to the dynamic protections of agricultural heritages represented by HHRTS, leading to the gradual disappearance of traditional farming modes and agricultural landscapes with long histories [
28].
Red rice, a representative of traditional local crops, is an important part of HHRTS. It is an improved variety that has been cultivated using traditional farming modes, with qualities of stable production and stable disease resistance. These factors enable to red rice play a positive role in maintaining the heredity diversity of the species and provide a base for the study of other crops’ responses to climate change. In the meanwhile, the thousands of years of cultivation in the Hani terraced fields confirm the significance of traditional material resources in maintaining stability and supplying water resources to HHRTS. However, the Hani terraced fields areas are facing similar issues to most other traditional agriculture areas: the large number of chemical fertilizers used and the replacement of traditional crops, represented by red rice, by high-yielding hybrid rice. These changes threaten crop diversity and make it difficult to maintain the diversity of natural species, bringing serious ecological issues and food safety problems to the local area [
29]. The germplasm resources represented by red rice need to be protected through cooperation from governments, households, and others, especially through encouraging rural households to plant red rice.
Therefore, a study of the production activity of the rural household and an analysis of its driving factors has significance in maintaining the stability of HHRTS and preserving its original landscape patterns. This paper, based on outcomes of prior studies, discusses problems facing the Hani terraced fields during agricultural modernization development from the perspective of the planting structure of crops and its driving factors, in the hope of offering advice on dynamic protections and sustainable development of agricultural heritage.
2. Methodology
2.1. Overview of the Study Area
HHRTS is mainly distributed along the Honghe River in the middle and lower parts of the Ailao Mountains in southern Yunnan. It has a long history and a large scale, involving Yuanyang County, Honghe County, Jinping County and Lvchun County. This paper takes Yuanyang County as the study area, which lies among the core areas of the HHRTS. Yuanyang County is located in the southern part of Yunnan Province and lies within the geological range of 102°27′~103°13′ E and 22°49′~23°19′ N. Its landform is mainly mountainous with the lowest altitude of 144 m and the highest altitude of 2939.6 m. The total area is 221,232 hm
2. The total crop planting area reached 51,768 hm
2 in 2014, taking 23.4% of the total area of the county. Planting is the most important means of livelihood for the local rural households in Yuanyang County. Water fields are mainly used for rice plantation. Before the “reform and opening-up policy”, red rice, a traditional crop, had always been planted. After 1980, hybrid rice was gradually planted primarily through ratooning [
30]. At present, in Yuanyang County, hybrid rice, red rice, corn and soybeans are the staple grain crops, and mangos, bananas, rubber, palms and firs are the main cash crops.
In recent years, common households have been planting less red rice, and it has been gradually replaced by hybrid rice offering obvious advantages. The gradual decrease of red rice planting, on the one hand, will impact the dynamic protection of agricultural heritage and the cultural inheritance of traditional farming, and, on the other hand, will result in simplification of grain crops, which is disadvantageous for the protection of agricultural biodiversity in the area and the stability of HHRTS. Food systems act as complex social-ecological systems, involving multiple interactions between human and natural components [
31]. Compared to hybrid rice, red rice plays a positive role in the agricultural biodiversity conservation and the traditional culture of the area. First, red rice has been cultivated for hundreds of years in HHRTS. During the Shiyuenian, Kuzhazha and other traditional Hani festivals, the Hani people use red rice to offer sacrifices to gods or ancestors [
32]. Second, the genetic diversity of red rice is three times that of hybrid rice [
33]. Genetic diversity protects agricultural biodiversity and, in particular, a wider deployment of agricultural biodiversity is an essential component in the sustainable delivery of a more secure food supply [
34]. Meanwhile, red rice is an ideal healthy food resource: it contains seven of eight amino acids that cannot be synthesized in the human body [
35]. Third, red rice has good adaptability to the environment and less reliance on chemical fertilizers. It can maintain a stable and moderate level of production for a long time, and ensure food security for farmers [
36].
2.2. Analytical Framework
First, the paper, based on references and field investigations, considered potential factors that influence the rural household’s decisions to grow crops in the Hani terrace areas. Second, according to the ratio of actual planting of hybrid rice and red rice, the paper categorized households and constructed a seemingly unrelated regression (SUR) model to analyze and determine what factors are significantly relevant in influencing rural households’ planting decisions. Finally, based on the results of correlation analysis and general statistical analysis on the survey data of the rural household, the paper discusses the influential mechanisms of the driving factors of planting decisions by rural households through further filtering and analyzing of the significantly relevant factors that influence the rural households to plant hybrid rice and red rice.
2.3. Data Sources
The paper took the approach of a combination of a questionnaire survey and a Participatory Rural Appraisal (PRA) [
37] and made an investigation centering on the planting structure of the main grain crops by the rural household, and the driving factors. Investigation and research was made in 10 villages of two towns and three townships of Yuanyang County, Honghe Hani and Yi Autonomous Prefecture, Yunnan Province, during July and August, in 2015 (
Table 1). Towns and townships involved were those where terraced fields are densely distributed, namely Xinjie Town, Niujiao Zhai Township, Xiaoxinjie Township, etc. According to the total number of households in every village, 15%~30% of households in every village were randomly chosen to be surveyed. The total households surveyed reached 230. In the end, 199 households finished the survey. Apart from questionnaires with obvious mistakes and incomplete answers, 150 valid questionnaires were returned, taking 75.4% of the sample. The research involved 43.32 hm
2 of farmland and 41.23 hm
2 of effective plantation.
2.4. Variable Selection
First, making relevant references offered by former researchers, the paper chose a series of factors that influence the rural household’s planting choices. Second, based on on-the-spot survey, the paper made sure that factors with unique regional characteristics according to living habits and conventions of the rural household in the Hani terrace area were represented. Finally, 21 influential variables from four factor categories are determined, namely: ① Family background factors, involving the total number of family members, the householder’s gender, the age of the householder, the education duration of the householder, the ethnicity of the householder, the health condition of the householder, labor force for farming, and the householder’s expectation of farming to later generations. ② Natural factors, concerning the quality of farmland, the water quality of irrigation, and the average altitude of farmlands. ③ Community factors, including village development types, participant cooperative numbers, rural product types, and annual times of agricultural technology training. ④ Economic factors, comprising agricultural income ratios, managed farmland scales, the cost-income ratios of hybrid rice and red rice, and the labor productivity of hybrid rice and red rice.
The paper set the ratio of planting area of hybrid rice and the ratio of planting area of red rice to explained variables and took the actual survey data as the value assignment base. Variables of family background factors, natural factors, community factors and economic factors were set as explanatory variables and their value assignments are presented in the
Table 2.
The paper carried out a test of significance by Pearson correlation coefficients of the variables above with the help of the statistical software StataMP 14. According to the principle that if 0.5 ≤ │r│ ≤ 0.8 and sig < 0.05, it was regarded as a moderate correlation, and if │r│ ≥ 0.8 and sig < 0.01, it was regarded as high correlation, analyses were given that linear correlations did not exist in 21 variables. In the meanwhile, StataMP 14 was applied for the collinearity test of the variables above. Tolerance < 1, namely VIF (variance inflation factor) > 10, determined whether collinearity existed in the variables. After testing, collinearity did not exist in the 21 available variables. Finally, the 21 variables above were chosen in the model for analysis.
2.5. Difference Test of the Category of the Rural Household
In order to have a targeted analysis on driving factors that influenced hybrid rice plantation and red rice plantation, the rural household was sorted into two categories according to their actual plantation: if the plantation ratio of red rice was higher than that of hybrid rice, the household was marked as a “red rice plantation-oriented household (RR household)”, otherwise, it was marked as a “hybrid rice plantation-oriented household (HR household)”. The RR household and the HR household comprised 34% and 66% of the total households surveyed. Before identifying influential factors of hybrid rice plantation and red rice plantation of different categories of rural households, it was necessary to confirm whether changes of the 21 variables above had the same effect on the two categories of the rural household. If the test result confirmed that different categories gained different effects from the variables, a study of different factors on the basis of different categories of the rural household had some degree of significance.
The Logit model was applied to the difference test of the influential factors of the categories of rural households. The HR household was taken to be the reference—it needed to test the difference change of the RR household as the influential factors changed. The household category was assumed to be the discrete variable,
y.
y = 0 represented the HR household.
y = 1 represented the RR household.
X represented the explanatory variable.
β represented the regression coefficient. If the influential factors of the two categories had big differences, it showed that it was necessary to classify factors that influence the rural household to choose crops on the basis of the household category [
38].
2.6. Analysis on Driving Factors
In order to analyze how characteristics of the rural household and owned resources have an effect on crop choices of individual rural households, the rural household crop choice system was established for seemingly unrelated regression analyses of the explained variable and the explanatory variable, to show how characteristics of the rural household and owned resources had an effect on the rural household’s crop choices. Considering contemporaneous correlations among explanatory variables, the SUR model [
39] was applied for parameter estimation. This model can identify correlations of random errors in every model and obtain a smaller parameter estimation variance, so the estimation result is more effective. It is a major method for correlation analysis [
40]. The software used was StataMP 14. The model is as follows:
In a regression equation system with M regression equations, the
ith equation must meet:
Yi is the observed value of the ith explained variable. Xij is the observed value of the jth explanatory αij and βij are regression coefficient equations. εij is the residual term.
Based on the result of the SUR model, the paper selected the driving factors that influenced the rural household’s planting decisions from significantly relevant factors, through statistical analyses. In addition, the influential mechanism of driving factors was discussed by combining the results of correlation analysis and general statistical analysis.
3. Results
3.1. Situation of Crop Planting
Crops planted in Yuanyang County are mainly hybrid rice, red rice, corn, beans (mainly including peanuts, soybeans, kidney beans, etc.), vegetables (mainly including Chinese cabbages and ferns), fruit (mainly including mangoes, and sugar canes), rubber, palms, firs, and so on (
Table 3).
In the area of Yuanyang, red rice planting poses a general situation such that the total number of the household that plants red rice decreases but the average planting area per household is still large, which leads to the total planting area of red rice being far smaller than that of hybrid rice, which is impacts negatively on the preservation of traditional crop varieties of the local area and on the maintenance of crop diversity. Red rice as a specialty of the Hani terrace area, suffers restrictions of characteristics and natural conditions, and recently, it is planted by a limited number of local specialized cooperatives and big growers rather than being promoted and sold was a common endeavor within a local agricultural specialty. Generally, a family treats hybrid rice as a staple food for daily life. Red rice is primarily stored in one’s own home and is often eaten during festivals or special celebrations.
3.2. Description of the Rural Household
According to the research data, the households surveyed were mainly families of six members. The householder was often a middle-age Hani man who had received nine years or more of education. The average total income of the whole family was 41,111.51 RMB/year, in which the average agricultural income was 7490.55 RMB/year, taking 36.15% of the total income. The rest of income sources included tourism reception, trades, and migrant work. They comprised 23.43%, 25.83% and 14.59% of total income respectively. Average planting area was 0.27 hm
2 per household. Average farmland quality was not very good. Average irrigation quality was a little poor. The average altitude of farmland reached 1364.85 m. The average planting proficiency was approximately one or two per household (
Table 4).
For the HR household and the RR household, there were big differences in the total numbers of family members, the gender of the householders, the ethnicity of the householders, the health condition of the household, and so on. Compared with the HR household, the RR household had more family members, higher ratios of the female to male householders, and non-Han householders, and better health conditions for the householders.
3.3. The Result of the Difference Test
From the perspective of particular effects caused by different factors, among the family background factor, the natural factor, the social factor and economic factor, more than one had an effect on the two categories of the rural household. The result shows that changes of the influential factors had different degrees of effects on the two categories (
Table 5). When the HR household was taken to be the reference, the ethnicity of the householder, the average altitude of farmlands, the product type, times of agricultural technology training, the labor productivity of hybrid rice and the labor productivity of red rice of the RR household had relative changes of 2.756%, 0.028%, 0.738%, 1.302%, −0.009% and 0.086% respectively. Therefore, it was significant to analyze the factors that influence the rural household to choose crop varieties on the basis of the category of the rural household.
3.4. Results of the Correlation Analysis
The result of the SUR model indicated that significantly relevant factors for planting hybrid rice and red rice varied a lot with different categories of the rural household (
Table 6).
3.4.1. The Red Rice Plantation-Oriented Household
The factors that had relevance to this category of the household whose hybrid rice planting took 1% significance level, included the gender of the householder (−), the ethnicity of the householder (−), and times of participation in agricultural technology training (−). The factors that had relevance to their hybrid rice planting took 5% significance level, include the age of the householder (+), the householder’s expectation of farming to later generations (+), the average altitude of farmlands (−), etc.
The factors that had relevance to this category of the household whose red rice planting took 1% significance level, included the ethnicity of the householder (+), labor force for farming (+), the farmland quality (−), etc. The factors that had relevance to their red rice planting took a 5% significance level, including the number of total family members (−), and the gender of the householder (+).
3.4.2. The Hybrid Rice Plantation-Oriented Household
The factors that had relevance to this category of the household whose hybrid rice planting took 1% significance level, included the cost-income ratio of hybrid rice (+), the cost-income ratio of red rice (+), and the labor productivity of red rice (−). The factors that had relevance to hybrid rice planting took a 5% significance level, including the age of the household (+), the participant cooperative number (+), and the labor productivity of hybrid rice (−).
The factors that had relevance to this category of the household whose red rice planting took a 1% significance level, included the ethnicity of the householder (+), the cost-income ratio of hybrid rice (+), and the labor productivity of hybrid rice (+), etc. The factors that had relevance to red rice planting took a 5% significance level, including the age of the householder (+), and the cost-income ratio of red rice (−).
3.5. Analysis of Driving Factors
The result of the SUR model showed that the factors that influence the rural household to choose crops presented big differences because of the category of the rural household. The same factor may cause differences in planting the same crop by different categories of the household. Therefore, the factors above that have common significant influences on hybrid rice and red rice and factors with certain consistency from in the survey data were used in deep analyses in order to explore their affecting mechanisms.
3.5.1. The Family Background Factor
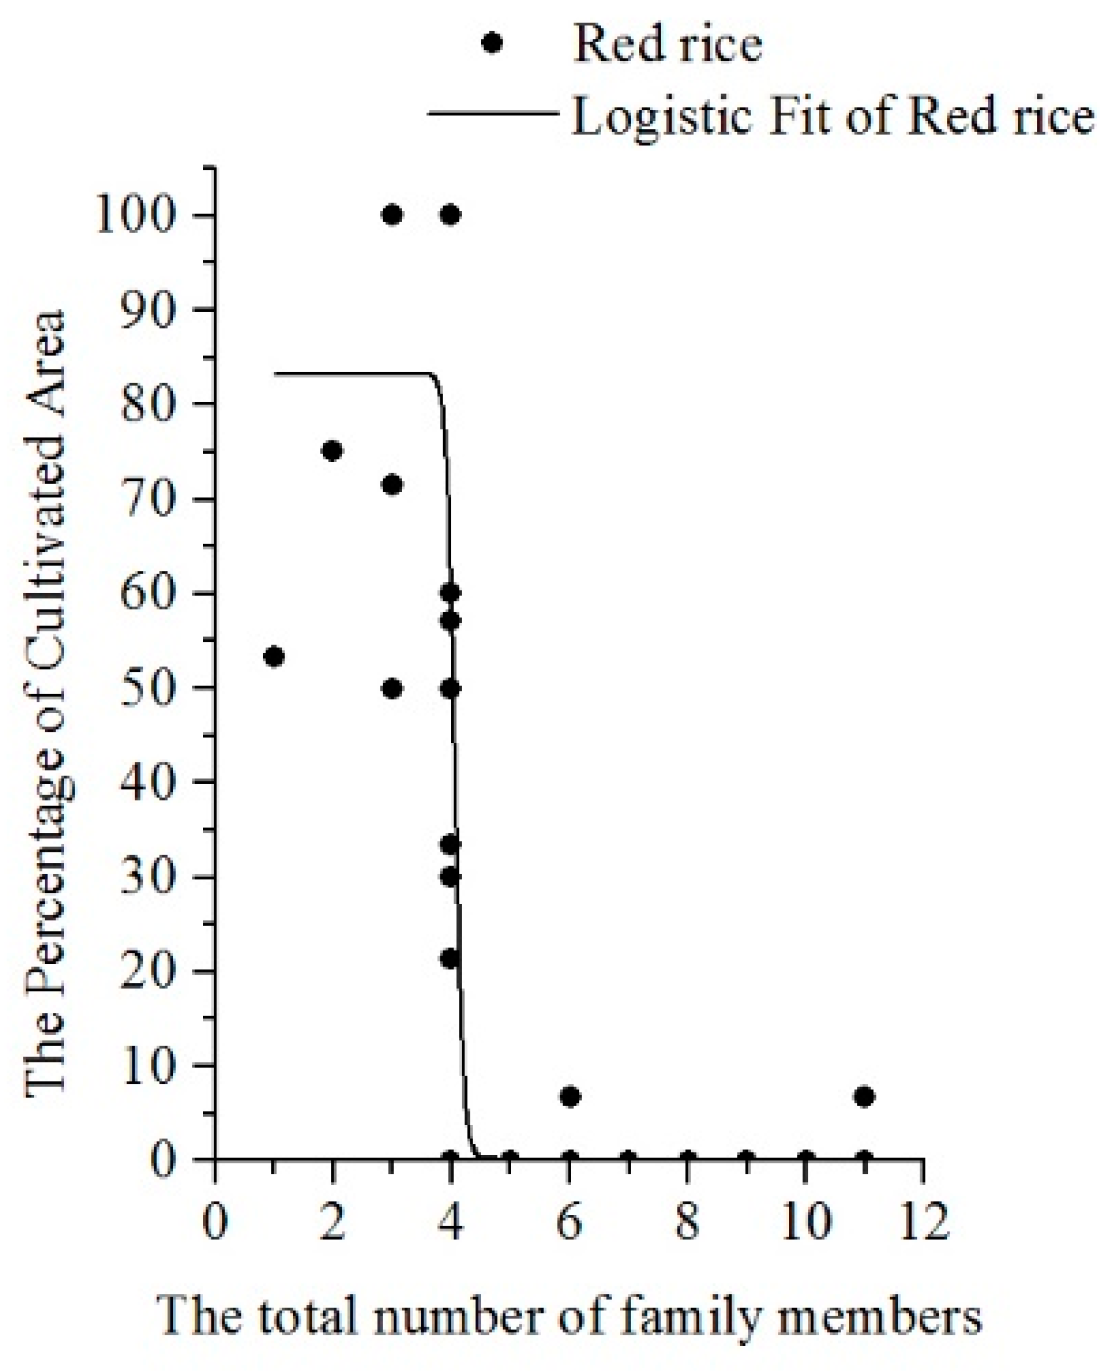
The Number of Total Family Members. The regression result showed that the number of total family members had a negative influence on red rice planting of both categories of the rural household. The following chart, based on survey data of the rural household, is a scatter diagram drawn with the software of OriginPro 2016 64 Bit, and a high fitting degree of the Logistic regression equation (R
2 = 0.678) was applied to obtain a fitting curve by nonlinear fitting of the data. The result showed that the rural household that had a higher proportion (the area proportion ≥ 50%) of red rice planting mainly gathered in the area where there were fewer family members (family members ≤ 4). In the meantime, as the number of the family member rose, the planting area of red rice generally decreased (
Figure 1). This indicated that the number of total family members was one of the significant factors that influence red rice planting. The household that had more members tended to plant less red rice. In the meanwhile, according to degrees and coefficients of significance, the higher the planting ratio of red rice, the more strongly the number of family members had restrictions on red rice planting.
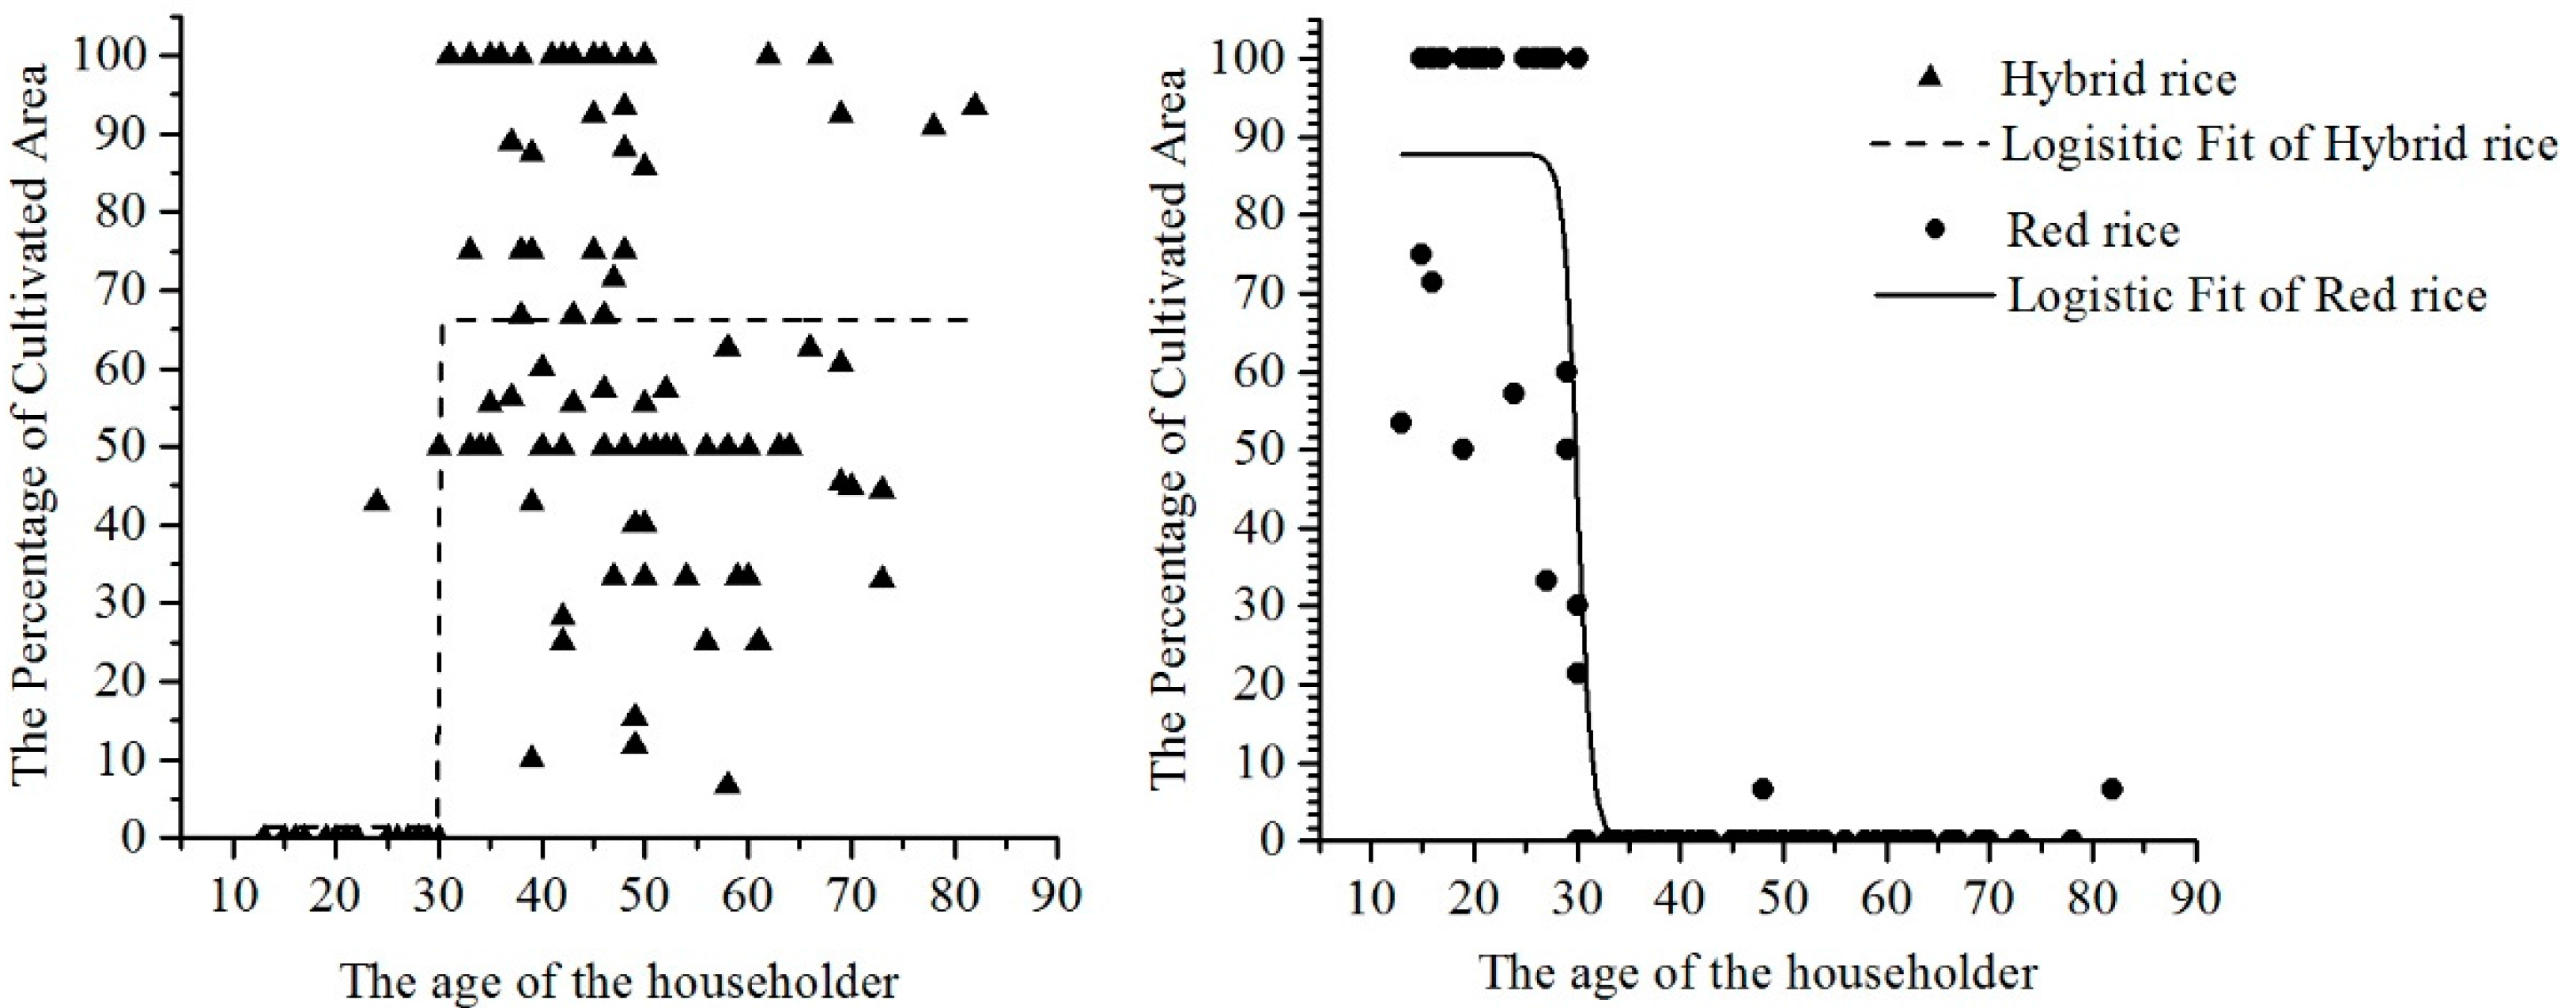
The Age of the Householder. The SUR model showed that the age of the householder had a positive influence on hybrid rice planting of all households, and also has a positive influence on red rice planting for the hybrid rice plantation-oriented household. According to the scatter diagram based on the research data and the Logistic regression equation and the fitting curve (the fitting curve of hybrid rice is R
2 = 0.561 and the fitting curve of red rice is R
2 = 0.561), as the age of the householder rose, the area proportions of planting hybrid rice and red rice generally demonstrated a rising tendency and a declining tendency respectively (
Figure 2). This can showed that the age of the householder is one of the significant driving factors that influence hybrid rice planting. In the meantime, according to degrees and coefficients of significance, the smaller the proportion of planting hybrid rice was, the stronger the driving degree was.
The Ethnicity of the Householder. The ethnicity of the householder had a positive influence on red rice planting of all households, and had a negative influence on hybrid rice planting for the RR household. The household surveyed could be categorized into two: the Han household and the non-Han household, in terms of ethnicity. The Han households comprised just 12.11% of the total household surveyed. The non-Han households included the Hani people, the Yi people, the Miao people, and the Dai people (
Figure 3). The result showed that the ethnicity of the householder is one of the significant driving factors that influence red rice planting. In the meantime, according to degrees and coefficients of significance, the bigger the proportion of planting red rice is, the stronger the driving degree is.
3.5.2. The Natural Factor
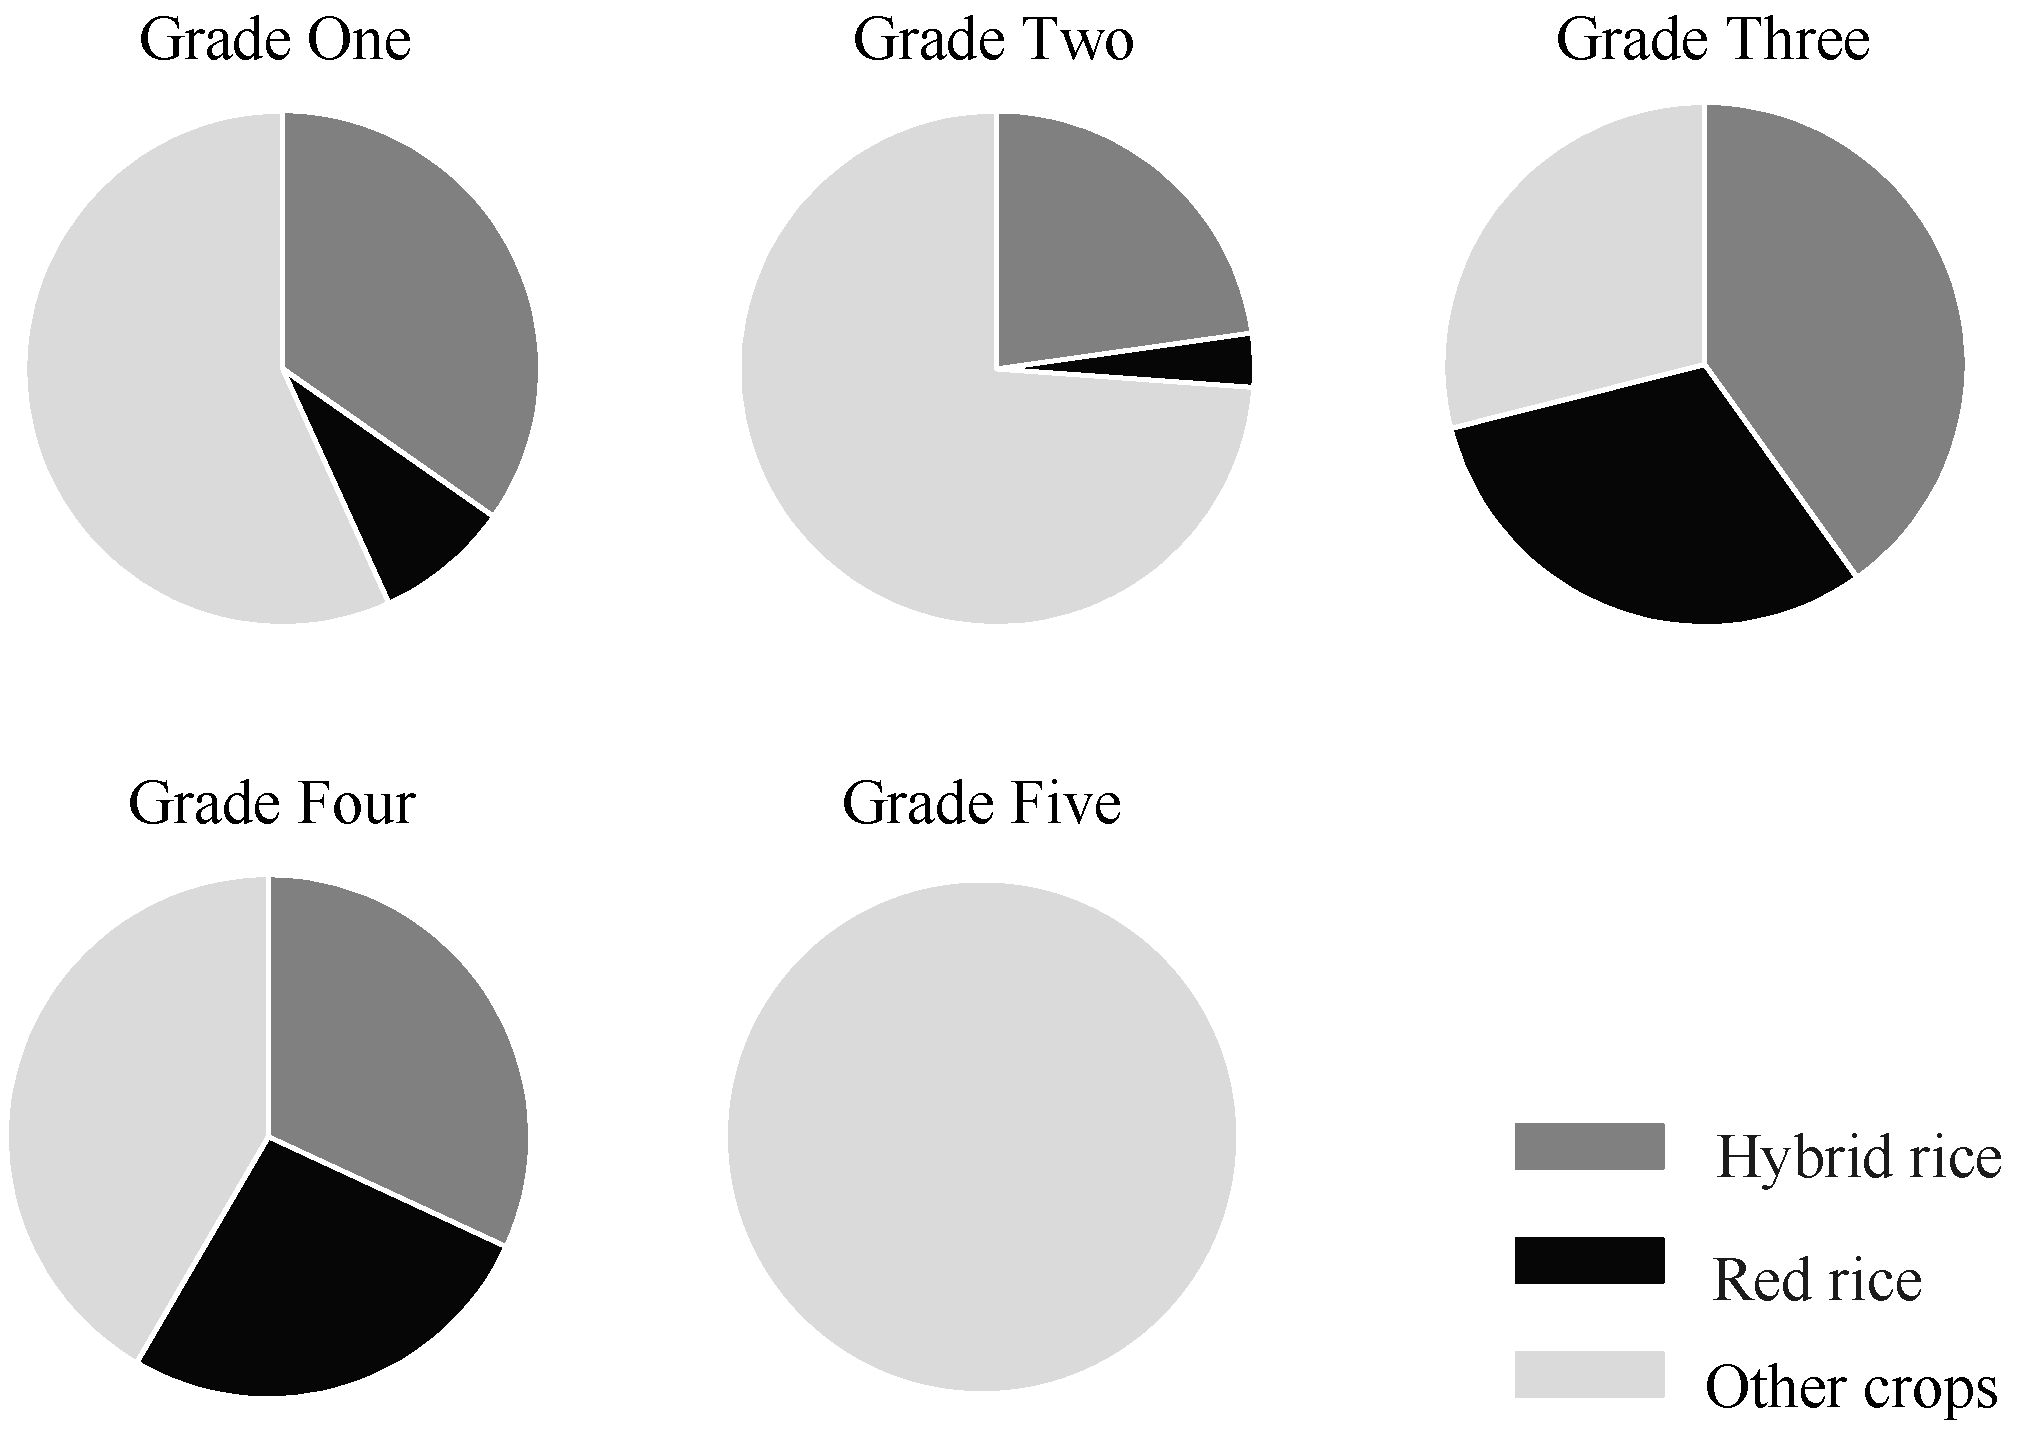
The Irrigation Water Quality. The site condition of farmlands and the irrigation water quality were key factors that influenced the rural household to choose crops. Classification of irrigation water quality in research is by the subjective standards of the rural household, which involves four items—the water source, the water quality, and the quantity and quality of the irrigation canal. Each one of the items has five grades and Grade Five is regarded as optimal water quality. The irrigation water quality of the effective farmland surveyed was mainly Grade One and Grade Two, which was 75.42% of the effective area of farmlands. In terms of red rice, the irrigation water quality was higher, and the proportion of red rice was higher (
Figure 4). Although the result of the SUR model shows that the irrigation water quality has a significant positive influence and a significant negative influence on hybrid rice planting and red rice planting for the RR household respectively, analyses of the survey data failed to present a result that was consistent with the results of the SUR model. Thereupon, the affecting mechanism of the irrigation water quality needs to be further analyzed in the future.
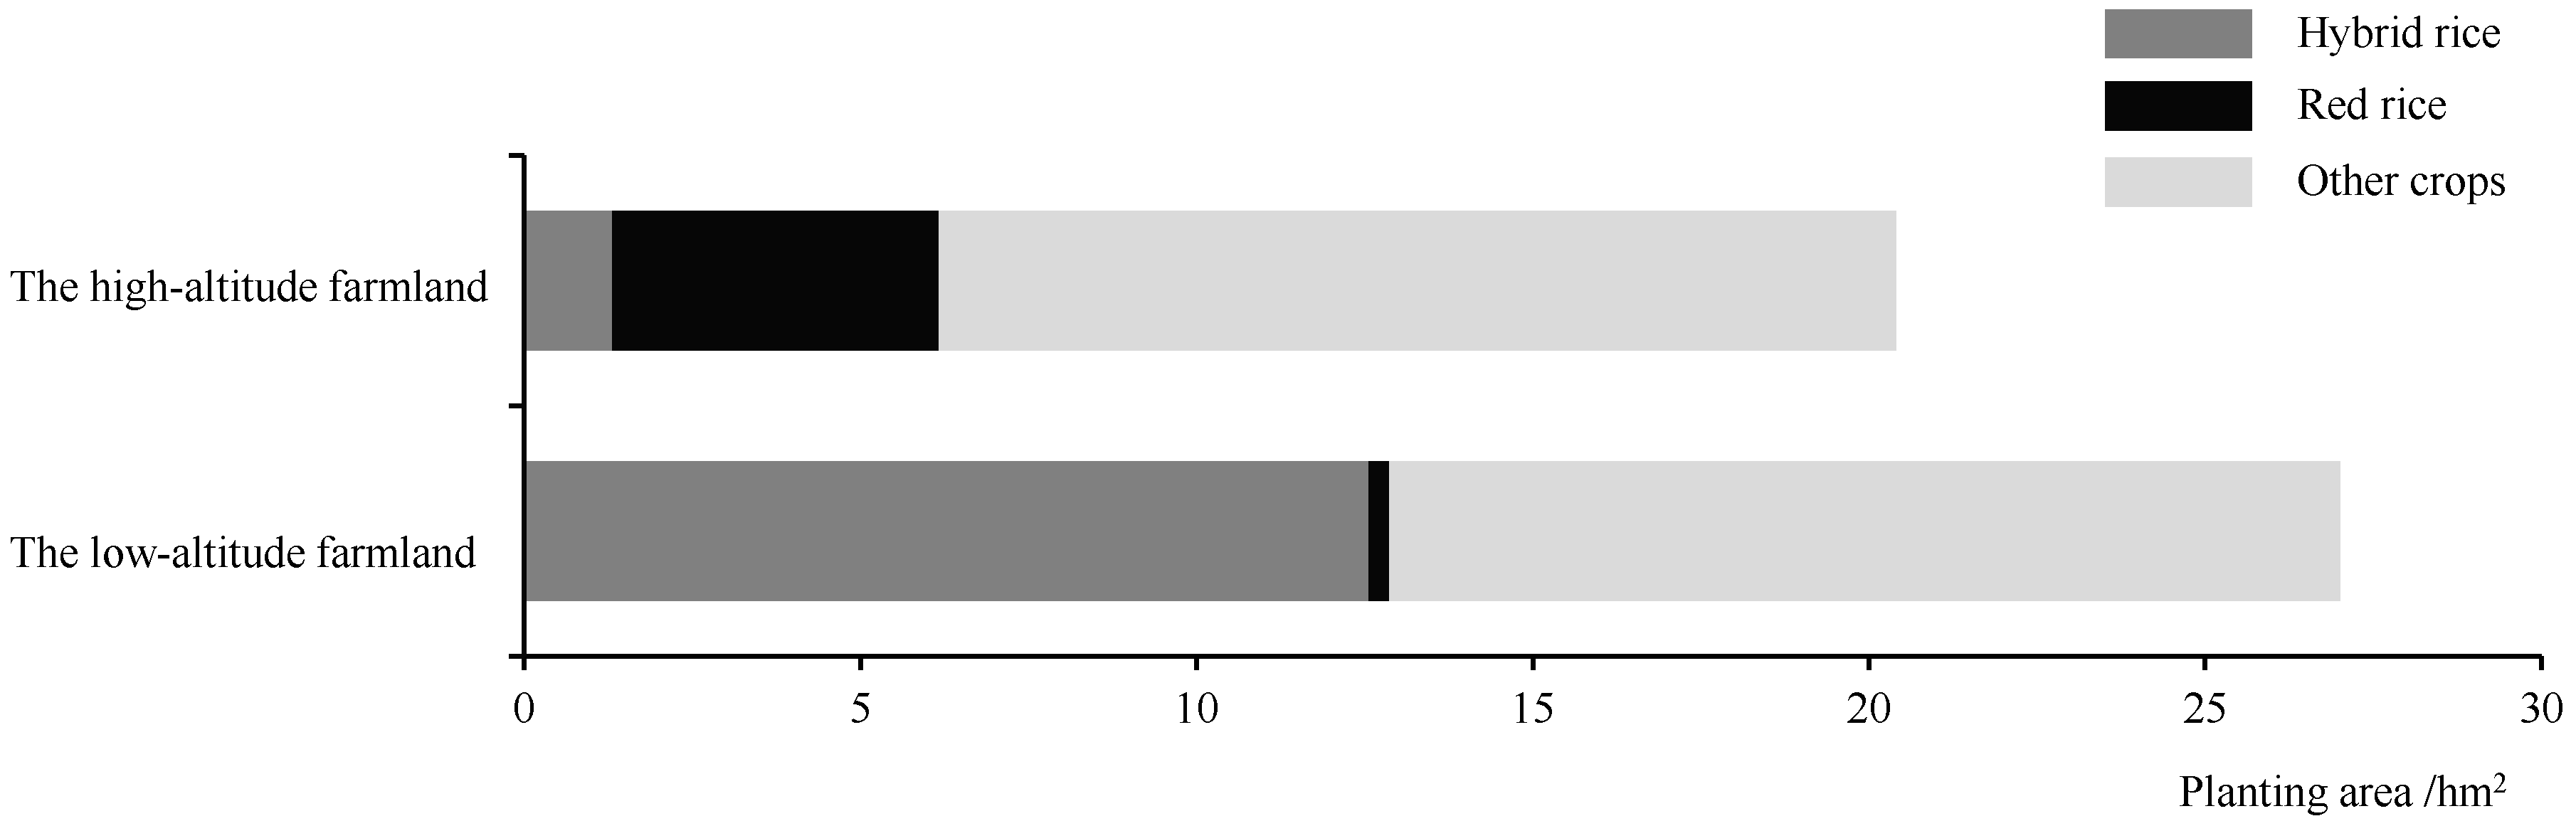
The Average Altitude of the Farmland. One slope of the Hani rice terrace in Yuanyang County can be converted into over 3000 terraces with an angle of ranging from 15° to 75°. The elevation variation, caused by this special vertical characteristic, becomes a key factor that influences the household’s crop choices. Field investigations and the household survey indicated that red rice has strong adaptability to high-altitude farmlands, and its planting altitude ranges from 1400 to 1700 m; the planting altitude of hybrid rice is lower, ranging from 1000 to 1600 m. The farmlands surveyed are categorized into two, bounded by the lowest altitude of red rice planting of 1400 m. Low-altitude farmland (which is below 1400 m) is mainly cultivated with corn and hybrid rice, with a total area of 88.31% the total area of the low-altitude farmland. High-altitude farmland (which is over 1400 m) is cultivated with much more red rice than hybrid rice, but the planting area of red rice takes just 34.44% of the total planting area of the high-altitude farmland. As for the high-altitude farmland, fruit and beans have the largest planting areas (
Figure 5). In accordance with the result of the SUR model above, the altitude of the farmland was one of the significant driving factors of red rice planting and hybrid rice planting. Also, according to the degree of significance of the factor, the altitude of the farmland has a strong driving force for red rice planting.
HHRTS has a structure of vertical landscapes composed by four elements, forest, village, terrace, and river [
41]. Pools and brooks conceived by high mountains and dense forests flow along the zigzagged ditches downward into villages for use by human and cattle, and then gather in terraced fields [
42]. Red rice planting needs higher altitudes. After thousands of years of cultivation and screening, they become the first barrier for brooks from forests flowing downward. In the high-altitude farmland, red rice has a smaller planting area, which is disadvantageous for maintaining the stability of the terrace eco-system and supplying water to the low-altitude farmland. If the situation continues, the landscape pattern of the Hani terrace and food safety in the area will be threatened.
3.5.3. The Social Factor
The Number of Participation in Cooperatives. The red rice planting of Yuanyang County has developed a management model of “company+base+household”. Relying on enterprises, specialized cooperatives have been established. By cooperatives contracting purchase agreements with planting households and offering tech-supports and fine seeds, the rural household is encouraged to plant terraced red rice. The result of the SUR model shows that the number of participation in cooperatives has had a significant positive influence on red rice planting and hybrid rice planting of the RR household and the HR household respectively. But surveys indicate that by 2015, Yuanyang County had 67 farmer’s specialized cooperatives, with just two cooperatives engaging in planting and marketing of red rice (
Table 7). The survey data showed that in the area of the Hani terrace the rural household participated in a small number of cooperatives. On average, one household participated in less than one cooperative. Thereupon, the affecting mechanism that the number of participation in cooperatives influences red rice planting and hybrid rice planting needs to be further discussed, but the number of participants in cooperatives has certain driving forces on the rural household’s crop choices.
Times of Participation in Agricultural Technology Training. The SUR results showed that time of participation in agricultural technology training has a negative influence and a positive influence on hybrid rice planting and red rice planting of the RR household respectively. However, the survey data indicated that annual times of participation in agricultural training per household was less than once. Thereupon, the affecting mechanism that times of participation in agricultural technology training influence the planting structure of the rural household needs more complete data support. The survey data showed that 87.3% of the household surveyed had a strong willingness to participate in agricultural technology training. Suggestions have been offered to the local government for agricultural technology training to be organized in a planned way for improving the knowledge level and planting skills of the rural household.
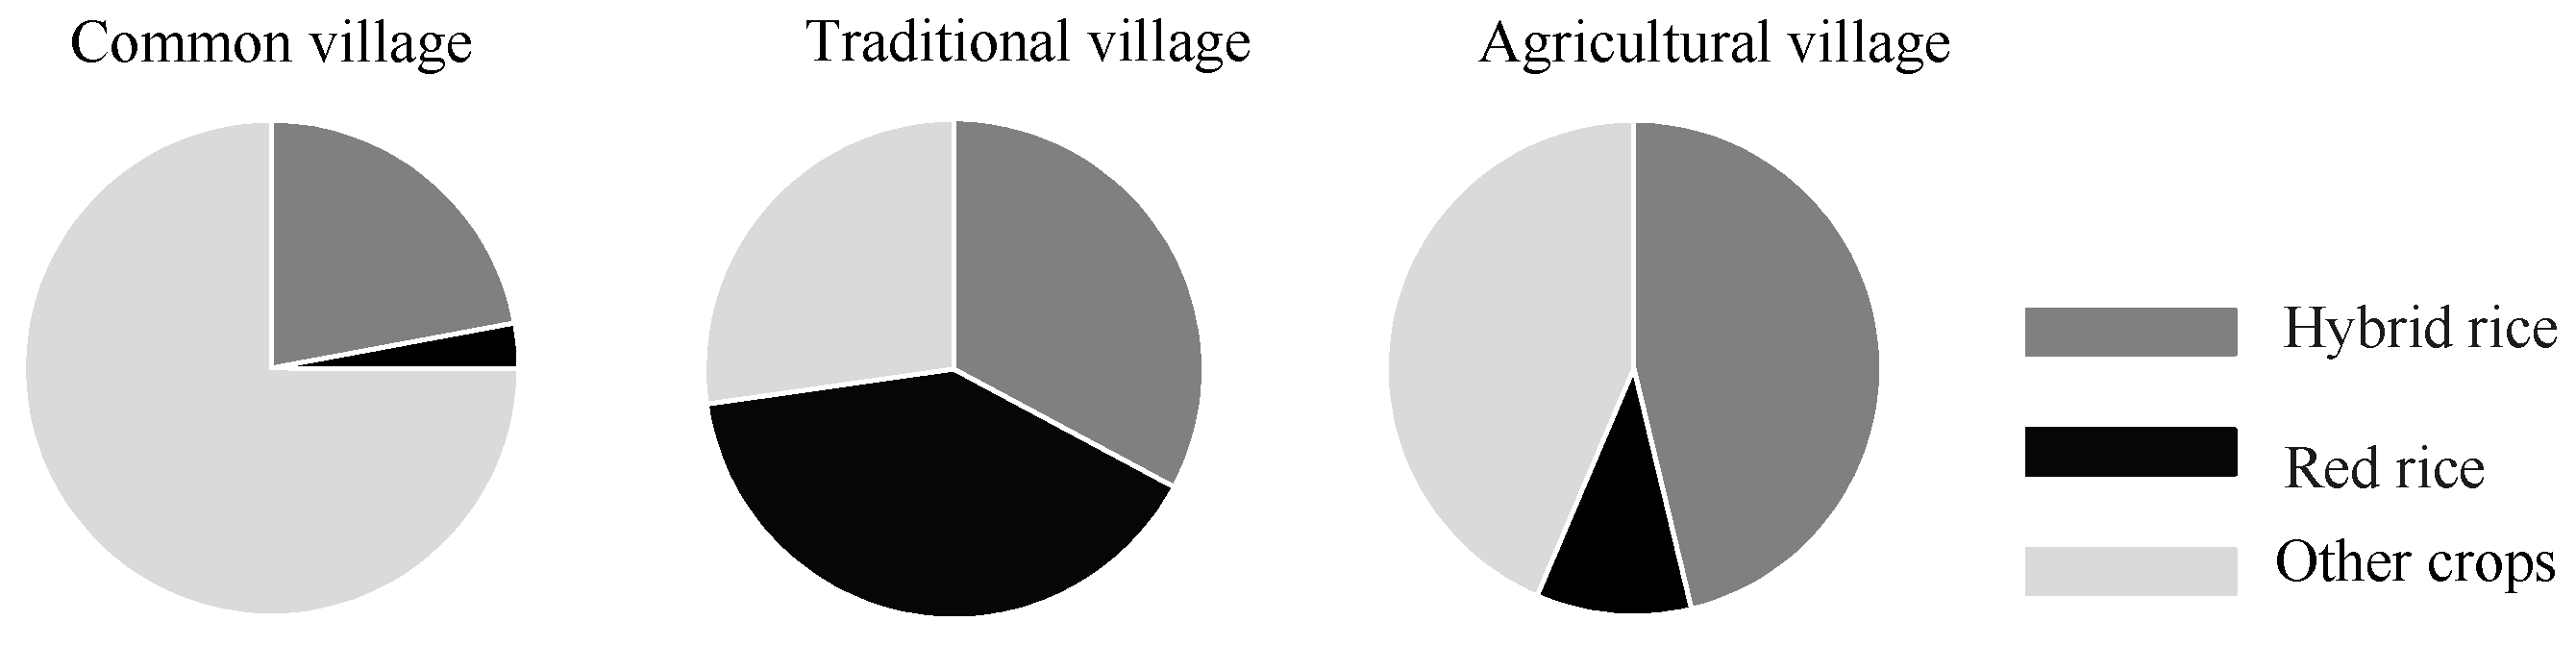
The Development Type of the Village. Although the development type of the village had a significant negative influence on red rice planting of the RR household, the whole survey data showed that households in different villages of different types have big differences in the planting structure.
The villages surveyed were categorized into three development types: Category One is the common village, including Guoqi and Zuota of Niujiao Zhai Township; Category Two is the traditional village that aims to develop tourism, including Xinjie, Qingkou, Duoyishu, and Pugao Old Stockade of Xinjie Town, and Qingkou is a well-known “Hani folklore village”, concentrating on demonstration of four elements of the Hani rice terrace; Category Three is the village that aims to develop agricultural production, including Village One and Village Two of Niujiao Zhai Township, as well as Fish Pool Village and Xinzhai of Xiaoxinjie Township. Xiaoxinjie Township is one of the main production areas of red rice in Yuanyang County, and the two specialized cooperatives of red rice in Yuanyang County are also located there.
Regarding the planting structure, the common village has the richest crop varieties. Each proportion of hybrid rice, corn, beans and fruit approaches near one quarter. The proportion of red rice planting was the highest in traditional villages that aim to develop tourism, with 39.94%. In villages that aimed to develop agricultural production, hybrid rice and corn take the leading place (
Figure 6).
3.5.4. The Economic Factor
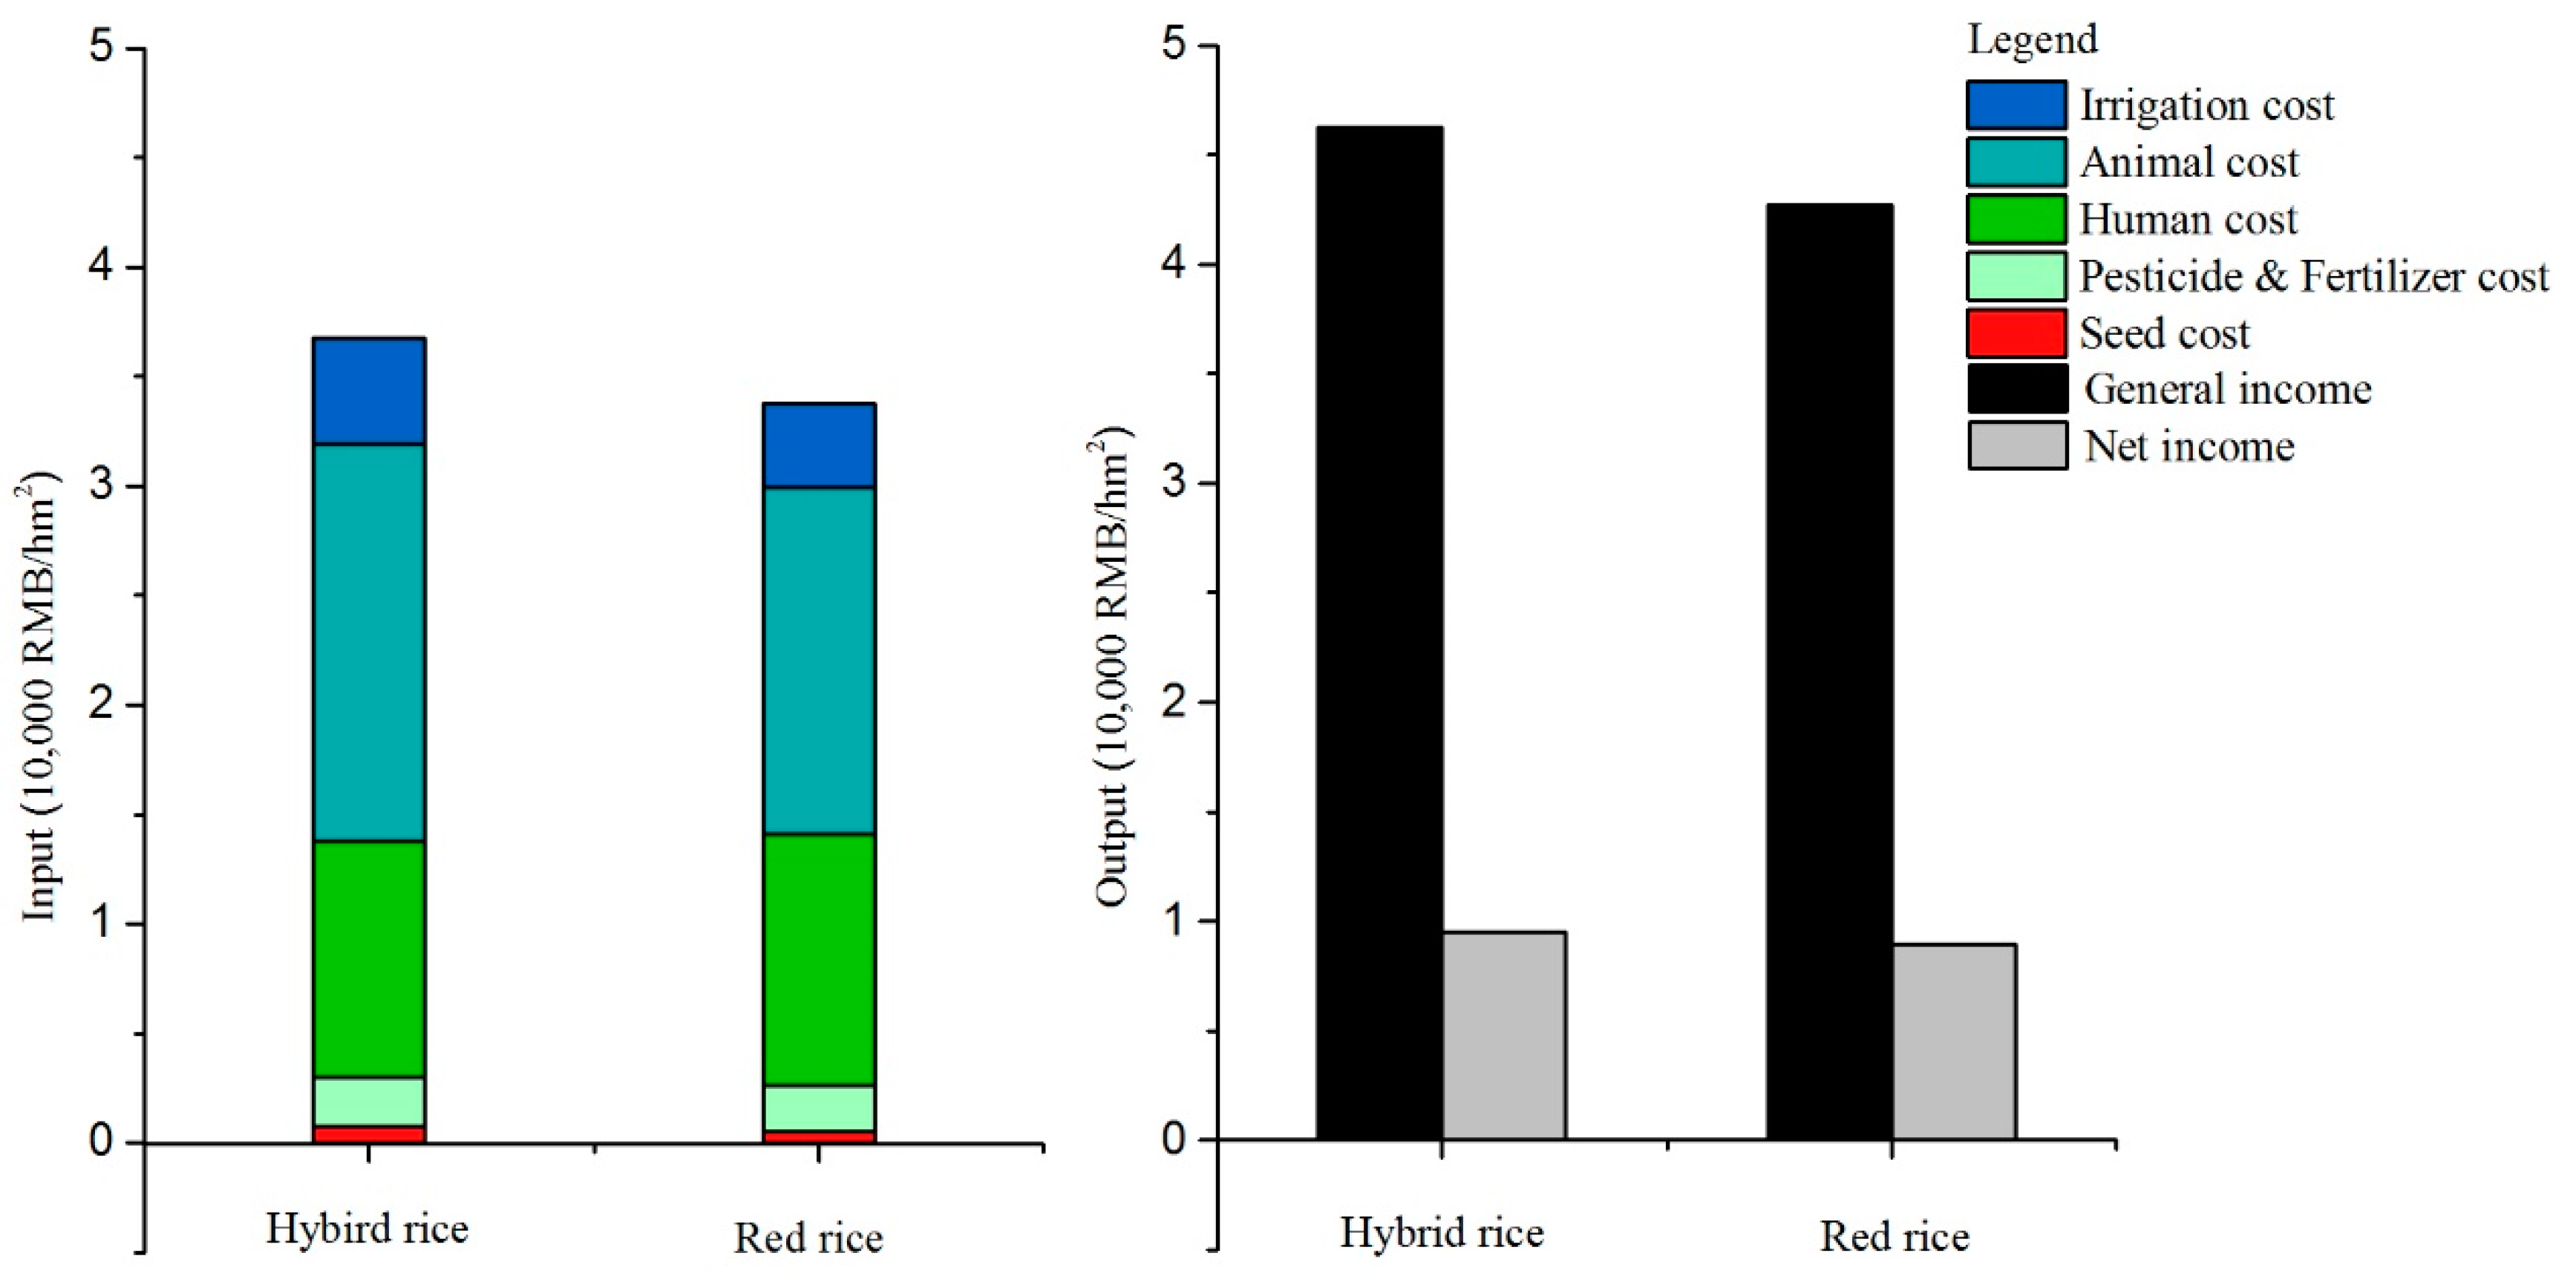
The Cost-income Ratio of the Crop. The SUR result showed that the cost-income ratios of hybrid rice had a significant positive influence both on hybrid rice planting of all households and on red rice planting of the HR household, and the cost-income ratios of hybrid rice had a significant negative influence on red rice planting of the RR household. The cost-income ratios of red rice had a significant positive influence on hybrid rice planting of all households and a significant negative influence on red rice planting of all households.
Generally speaking, in the open market, rural household tend to plant crops that can bring higher profits. But field investigations found that 97.3% of the local households surveyed planted crops to meet their self-consumption, and less than 3% of the households surveyed did grain business. The local grain and crop market is still less developed. It was found that in the current market, the rural households judged the economic profit of crops only by crop yields per unit, rather than by market trading, and the influence of the cost-income ratio on the rural household’s crop choices showed itself mainly by more straightforward measurements of yields per unit, and planting costs. The following chart depicts the input and output of red rice and hybrid rice according the field investigations: the yield of red rice per unit was far lower than that of hybrid rice. The yields per unit were respectively 1187.5 kg/hm
2 and 2197.07 kg/hm
2. But the cost and net profit of red rice approached approximately to those of hybrid rice. The yields per unit area were, respectively, 1187.5 kg/hm
2 and 2197.07 kg/hm
2. The total planting costs were respectively 33,775.66 RMB/hm
2 and 36,781.93 RMB/hm
2. Net profits were respectively 8974.24 RMB/hm
2 and 9506.15 RMB/hm
2. Meantime, the cost-income ratio of red rice was higher than that of hybrid rice, respectively being 26.57% and 25.84% (
Figure 7). It was found that the influence of the cost-income ratio on the rural household’s crop choices in the Hani terrace area shows itself by the crop yield per unit area. According to the assumption of the “rational man” in economics and the result of the SUR model, the yield of hybrid rice per unit area was the significant driving factor that influenced the rural households to plant hybrid rice. The higher the proportion of red rice planting was, the stronger the driving force was. The yield of red rice per unit area was a significant restraint factor for red rice planting. The higher the proportion of red rice planting was, the stronger the restraint degree was. In the meanwhile, the yield of red rice per unit area was the significant driving factor of hybrid rice planting. The higher the proportion of red rice planting was, the stronger driving force was.
The Labor Productivity of the Crop. The results of the SUR model indicated that the labor productivity of red rice has a significant positive influence and a significant negative influence on red rice planting and hybrid rice planting of all households respectively, and that the labor productivity of hybrid rice has a negative influence and a positive influence respectively on hybrid rice planting and red rice planting for the HR household only.
The survey data showed that red rice and hybrid rice have a big difference in labor productivity, respectively being 16.74 RMB/h and 52.81 RMB/h. The migrate workers from the Hani terrace area mainly engage in short-term jobs within the county or the prefecture, 90.1% of whom surveyed said that they will return to their hometowns to plant and plough during busy farm work periods. Therefore, the opportunity cost of the rural household’s planting activities can be negligible. In consistent with the SUR result above, the influence of the labor productivity of hybrid rice on the rural household’s planting choices shows itself when there is a large scale of hybrid rice planting, which means that some hybrid rice plantings are replaced with red rice planting when the rural household is encouraged to extend hybrid rice planting. The labor productivity of red rice is the significant driving factor that influences the rural household to plant red rice. The higher the proportion of red rice planting is, the stronger the driving force is. In the meanwhile, the labor productivity of red rice is the significant restraint factor of hybrid rice planting. The higher the proportion of hybrid rice planting is, the stronger the restraint degree is.
4. Conclusions
This paper, based on household survey data in Yuanyang County of Honghe Hani and Yi Autonomous Prefecture, Yunnan Province, established a SUR model to analyze the current situations of the planting structure and driving factors of HHRTS. The conclusions are as follows: ① In the effective farmland of 41.23 hm2 surveyed, the arrangement was hybrid rice>corn>fruit>red rice>beans>other crops>vegetables, in terms of their total planting areas and the average planting area per household. Red rice and hybrid rice, as the primary grain crops in the Hani terraced area, had mutual substitutability. There were a small number of households planting red rice, but the average planting area per household was larger, which caused the total planting area of red rice to be far smaller than that of hybrid rice. This was disadvantageous for the protection of local traditional crops and maintaining crop diversity. ② The SUR model indicated that for the RR household, red rice planting was more stable and more difficult to be replaced by hybrid rice planting when the householder was a non-Han male, the average altitude of the farmland was higher, the household had more occurrences of participation in agricultural technology training, and the labor productivity of red rice was higher. ③ In line with the results of correlation analyses and factor analyses, the significant driving factors of red rice planting included the ethnicity of the household, the average altitude of the farmland, and the labor productivity of red rice. Significant restraint factors of red rice planting included the total number of family members and the yield of red rice per unit area. The significant driving factors of hybrid rice planting included the age of the householder, the yield of hybrid rice per unit area, and the yield of red rice per unit area. Significant restraint factors of hybrid rice planting included the average altitude of the farmland and the labor productivity of red rice.
5. Discussion
As stated above, the key point of protecting and maintaining the stability of HHRTS lies in encouraging the rural household to plant red rice. The results of correlation analyses and factor analyses in the paper showed that the significant driving factors of red rice planting included the ethnicity of the householder, the average altitude of the farmland, and the labor productivity of red rice. Among these, the former two belonged to inherent family characteristics and natural characteristics, aspect which are difficult to interfere with. Therefore, the critical factor in encouraging the rural household to plant red rice is to enhance the labor productivity of red rice.
In general, besides soil quality, labor rates, and land productivity, agricultural labor productivity also depend on the conversion degrees of agricultural products into agricultural output value. The conversion rate of output value is a vital factor that influences labor productivity [
43]. To be specific, the factors of agricultural labor productivity include the size of the land used per unit of worker [
44], the product’s yield per unit of farmland [
45], the agricultural production structure [
46], and the price of the agricultural product [
47]. Therefore, to realize a dynamic protection of HHRTS, a suggestion is proposed to aim at raising the proportion of red rice planting with an encouragement mechanism for the rural household’s planting behaviors, established as follows:
For the rural household. An encouragement mechanism to raise the proportion of red rice planting should be established on the basis of the category of the rural household. The suggestions are as follows: ① The RR household should be encouraged to participate in more red rice specialized cooperatives and agricultural technology trainings sessions, and to increase family farming proficiency. ② The HR household should be encouraged to receive higher-level education and frequent health check-ups. The following chart respectively presents the significant positive factors of red rice planting by the RR household and the HR household.
For the community. Increasing the proportion of red rice planting should be an aim, and the local rural community should extend and expand the size and the number of red rice-specialized cooperatives. In the meantime, frequent availability of agricultural technology training and fine seeds to rural households, led by cooperatives, is suggested. Planting efficiency needs to be enhanced while maintaining traditional planting modes. Moreover, the local rural community is advised to popularize relevant knowledge of agricultural heritage, and to improve the understanding of the importance of traditional crops.
For the local government. Suggestions include three aspects. ① Brand shaping work needs to be promoted to increase added value. In the prefecture, led by the prefectural government of Honghe Hani and Yi Autonomous Prefecture, a unified brand of traditional crops represented by terrace red rice needs to be established. It needs to promote the quality evaluation system of the agricultural product, authorize use of this brand to qualified further-processing enterprises and specialized cooperatives, and increase added value of traditional crops to raise market transaction prices and improve planting enthusiasm of the rural household. ② The government needs to develop a multiple agricultural production structure, which centers on red rice. HHRTS embodies production values, ecosystem values, social values, and cultural values, and has beneficial conditions for industrial coexistence development [
48]. The local government is advised to take traditional crop planting as a developing first industry, and focus on traditional crops represented by red rice, take further processing of agricultural specialties as a developing second industry, and develop further processing products of traditional crops represented by red rice, and to take rural tourism and eco-recreation as a developing third industry, and further highlight cultural connotations of traditional crops in the production and life of the Hani, Yi, and other ethnic groups to develop special tours and village stays. ③ Intense research and scientific supports should be put into fine seeds of red rice. At present, red rice has a low yield, which badly impacts the rural household’s planting enthusiasm. The local government is suggested to provide more support into fine seed breeding and seeding of red rice, to scientifically improve yields.
Due to data availability and problem complexity, the paper has some weak points to be further discussed: ① The paper takes section data from 2015 and analyzes this from the perspectives of the economic benefit of the crop, the characteristics of the farmland, the family characteristics of rural households, and owned resources, rather than making long-term analyses on changes to the planting structure. ② In terms of the characteristics of the farmland, the farmland quality is categorized just by subjective evaluations of the rural household, which cannot reveal farmland quality completely and objectively. ③ HHRTS has rich cultural resources and different ethnic groups with different living habits and behaviors, so the influences of cultural connotations for the crop itself on planting choices, cannot be presented in the paper.


