Impact of Population Growth on the Water Quality of Natural Water Bodies

Department of Information Science and Control Engineering, Nagaoka University of Technology, 1603-1, Kamitomioka, Nagaoka 940-2188, Japan
*
Author to whom correspondence should be addressed.
Sustainability 2017, 9(8), 1405; https://0-doi-org.brum.beds.ac.uk/10.3390/su9081405
Submission received: 10 July 2017
/
Revised: 3 August 2017
/
Accepted: 4 August 2017
/
Published: 9 August 2017
(This article belongs to the Collection Eutrophication and Sustainable Management of Water)
Abstract
:Human activities pose a significant threat to the water quality of rivers when pollution exceeds the threshold limit. Urban activities in particular are highlighted as one of the major causes of contamination in surface water bodies in Asian countries. Evaluation of sustainable human population capacities in river watersheds is necessary to maintain better freshwater ecosystems in a country while achieving its development goals as a nation. We evaluated the correlation between the growth rate of the population in a watershed area and water quality parameters of a river ecosystem. The Kelani River in Sri Lanka was selected for the study. The highest correlation coefficients of 0.7, 0.69, 0.69 (p < 0.01) corresponding to biochemical oxygen demand (BOD), dissolved oxygen (DO) and total coliform (TC) were obtained with the population in watersheds of the Kelani river in Sri Lanka. Thus, we propose a quantitative approach to estimating the population capacity of watersheds based on water quality classification standards (WQCS), employing the Bayesian network (BN) classification model. The optimum population ranges were obtained from the probability distribution table of the population node in the BN. The results showed that the population density should be approximately less than 2375 to keep the water quality in the watershed for bathing and drinking purposes and approximately less than 2672 for fish and other aquatic organisms. This research will offer a means that can used to understand the impact of population on water quality in river basins and confer direct influence on natural water bodies.
1. Introduction
Due to rapid urbanization, human activities have had a significant impact on the ecological environment [1]. Owing to the huge discharge of municipal wastewater and urban drainage into river basins, the effect is more pronounced in the water quality in these areas. This in turn affects the aquatic lives and agriculture, and hence the humans who reside in these areas. The challenge for any country is to undertake sustainable development without causing damage to the natural environment, e.g., avoiding crucial issues leading to the rapid deterioration and degradation of the water quality in the water supply intake points [2,3]. Further, cost-effective methods are more convenient for developing countries to protect their natural resources. Rapid population growth as a result of urbanization is commonly observed in the flat regions of many countries, hence the flat beds of river basins are more susceptible to being affected.
The high average annual range in biochemical oxygen demand (BOD), total coliform (TC) and low dissolved oxygen (DO) levels reported in the rivers of some South Asian countries are mainly due to the huge discharge of municipal wastewater and urban drainage into river basins [4]. Further, many studies have found untreated sewage to be the most critical issue with respect to water contamination, because 40% of the global population do not have adequate sanitary facilities [5,6]. Changes to land use, land cover or river basins in watershed areas, such as high scale agricultural activities, unplanned infrastructure developments, and sand mining, change the water quality and water balance due to human activities. Furthermore, the contents of untreated disposal or spatial disposal items such as organic materials, salinization, nutrients, suspended sediment, enteric virus, and oil and grease are directly affecting the water quality in river basins [7,8]. Furthermore, the aquatic chemical composition is possibly influenced by human activities [6]. This may be caused by improperly planned urbanization or uncontrolled development [9]. This has been made evident by Hongmei Bu et al.’s work conducted on the Jinshui River in China, where they reported that the population had a significant impact on most of the water quality parameters [10]. Thereby, they identified a population capacity for the river basin, and estimated the possible increase of population. The possibility to control the impact of anthropogenic activities by analyzing the impact levels of urban, suburban and rural areas on the river basin was described in the research done on a river in Shanghai, China [1]. A fecal coliform analysis of a long-term, stream water-quality monitoring system in the city of Atlanta shows the effect of urbanization, whereby contamination exceeded Georgia’s water quality standard for all usage levels [11]. A study of the spatial correlation between urbanization and water quality parameters based on a regional perspective showed that human activities are positively correlated with the degradation of water quality in the river. Further, urban population density is used to evaluate the impact of urbanization [12].
The Kelani River in Sri Lanka is rich with biodiversity and many natural resources, and plays an important role in the sustainable development of the country. More than 25% of the Sri Lankan population take benefits from the river [13]. Unfortunately, it is considered to be one of the most polluted rivers in Sri Lanka [14]. Further, unplanned anthropogenic activities (towns) together with, industrial and agricultural activities have been highlighted as major threats [15]. The lower and middle regions of the Kelani River, which consist of flatbed areas, have faced a threat from human activities due to urbanization. In the Ma Oya tributary in the lower region of the Kelani River, the exceeded standards were BOD (60%) and DO (80%). Further, standard levels of COD, BOD and DO have been exceeded in the Raggahawatte sub-stream in the middle reach of the river basin, which includes flatbeds, submontane and dense forests [13]. Sri Lanka, as a developing country with an increasing population, needs to show adequate concern for the management of existing water resources while achieving sustainable economic development; the availability of drinking water is a primary requirement for the citizens. Considering this situation, the responsible authorities in Sri Lanka have already proposed many sustainable utilization approaches for the Kelani River [16]. In this study, we propose an approach that can be used for analyzing the impact of population growth on the water quality of natural water bodies. Further, under the assumption that the existing water quality management approaches and the human impact remains the same, with no implementation of water treatment plants or no changes in the human activities, the study aimed to obtain the optimum population range that can be accommodated within the carrying capacity of the watershed. The spatial context for the case study in this research comprised the lower and middle regions of the Kelani River.
Complexity and uncertainty are leading factors for concern when analyzing spreading sources of pollution such as those due to anthropogenic activities on natural water ecosystems [17]. Classification models can be used to analyze various influential factors in natural environmental processes and in this case, we analyze the impact of human activities using the water quality classification standards (WQCS) for a river basin [18]. Among various classification models, such as the Bayesian network (BN), artificial neural networks (ANNs), decision trees and support vector machines, we propose to use the BN model to find the optimum population ranges that can be carried by the natural environment in a watershed [19]. The BN is a network with nodes representing probabilistic variables and links representing probabilistic dependencies. The conditional probability distribution given to each variable represents the influence of the parent nodes. The BN was employed to derive the sustainable population ranges for specific water uses such as drinking, bathing and fishing through analyzing the probabilistic influence between the water quality parameters and the population.
The following two steps were employed in this research to achieve the goal of our research: In the first step, the influence of human activities on the water quality in the five watersheds of the Kelani River was evaluated considering three urbanization levels categorized based on the population density of watersheds. Further, the population index (PI) was calculated for each urbanization category and comparisons were made among the PI values of each year to evaluate the human impact. Then we evaluated the correlation between the water quality parameters, such as Total Coliform (TC), NO3−, DO, chemical oxygen demand (COD), BOD, and the population in five watersheds. The results of the first step were used to find the most correlated parameters with the population. The classification model was developed as the second step. TC, DO, and BOD were used to qualitatively define the population ranges using the BN classification model. Upon developing the BN, the probability distribution table of the population node in the BN were analyzed to quantitatively derive the sustainable population ranges to maintain a certain level of water quality.
2. Materials and Method
2.1. Study Area
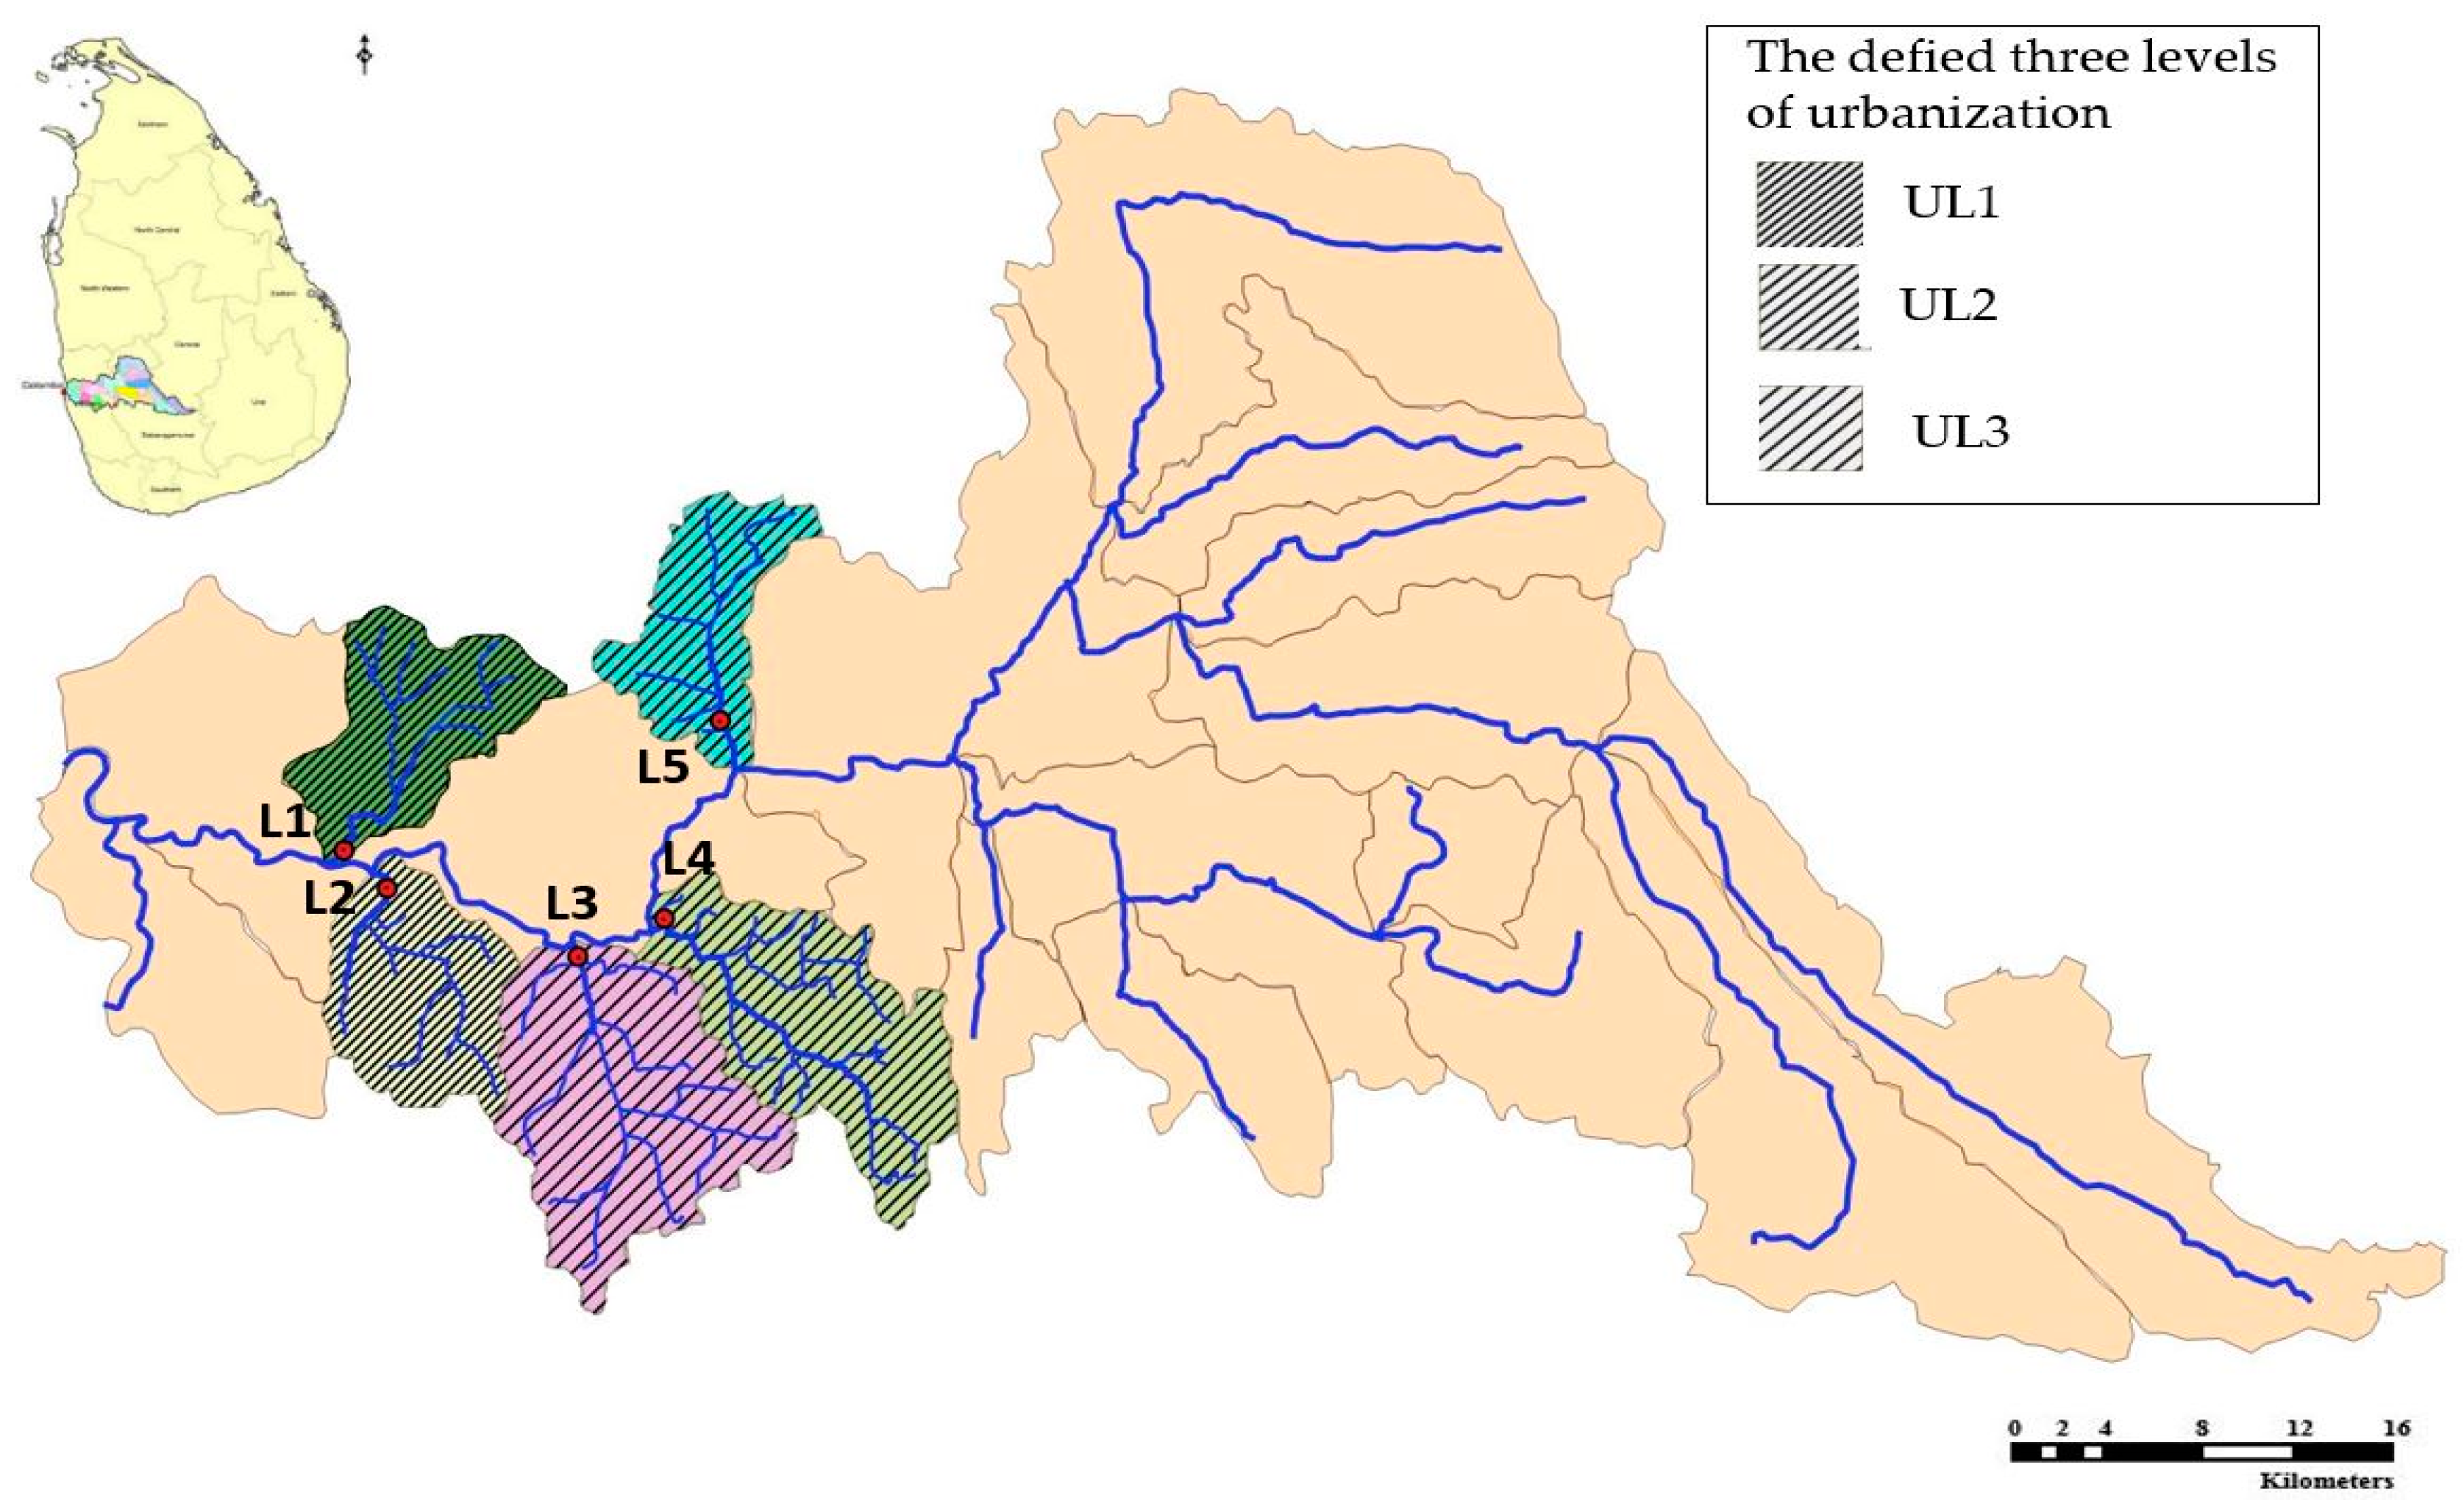
The study concerns the lower and middle regions of the Kelani River (6°50′–7°05′ N, 80°12′–79°10′ E), which are located in the Western Province of Sri Lanka (Figure 1). The river is 145 km long and covers an area of 2292 km2 and is the third largest watershed in Sri Lanka. Ranking as the fourth longest river in the country, it stretches from the Sri Pada mountain range to Colombo. Colombo is one of the most highly urbanized areas in the Asian region [20]. The Kelani River supplies approximately 80% of the water used in the Colombo district, and it is a primary source of drinking water for the Colombo district. Some municipalities of the Colombo district are in the L1 and L2 regions as shown in Figure 1. However, it is the most polluted river in Sri Lanka due to the rapid growth of industries located in close vicinity to it [14,21]. The annual rainfall distribution in these regions varies from 2001 to 3000 (mm) [13]. Flood encroachment is another disaster which frequently occurs in the Kelani River. A major contributory factor to the flooding has been the rapid illegal construction (e.g., illegal construction of buildings, filling of marshlands for development) taking place in the lower reach area of the Kelani River (i.e., Colombo, Gampaha and Kegalle). This has increased the sediment loadings, organic and inorganic loadings in the river and resulted in the frequent floods [22]. We used the data from five sampling sites located in five different watersheds: Raggahawathta Ela (Biyagama), Maha Ela (PallewelaOya), PusweliOya, WakOya, and PugodaOya. The points L1–L5 in Figure 1 respectively denote the above-mentioned sampling sites.
The water samples were collected according to the three grab samples technique, i.e., from two sides of the river and from the middle at the depth of 0–30 cm. The methods applied for the analysis are specified by the standard methods for the examination of water and wastewater by the Central Environmental Authority (CEA) in Sri Lanka. Finally, the quality control tests were conducted in line with American Public Health Association (APHA), American Water Works Association (AWWA) and Water Environment Federation (WEF) 2005 standards [15]. The dataset, including five water quality parameters at five sampling points in different watersheds consisted of monthly data from 2003 to the end of 2013, with the exception of 2007 due to a lack of data pertaining to this period. We considered the data for all months of the year, including the dry and rainy seasons. The wet seasons are from April to June and from October to November, whereas December to March is considered as dry the season for Kelani River. From the existing data set on the Kelani River, the five water quality parameters namely, DO, COD, BOD5, TC and NO3− were used to analyze the correlation between water quality and population, representing a strong dataset [23]. There were some missing values and data errors due to both human and technical errors in the analysis, the recording of results and the failure to collect samples. Thus, we have 564 monthly data records of water quality in total.
Population data were obtained from the Department of Census and Statistics, Sri Lanka, which are published on the city population web site [24]. To calculate the population of each watershed, the percentages of local authority and secretariat divisions, in particular data from the report of the Kelani River Basin Multi-Stakeholder Partnership (KRMP), published in 2016, were used to calculate the population of each watershed [13]. The growth rate of the population, obtained from the 2001 and 2012 censuses, was applied to calculate the monthly population in each sub-watershed from 2003 to 2013. The census of the population in Sri Lanka is conducted once each 11 years and we assumed a constant growth rate for each watershed from 2003 to 2013. Therefore, to represent a more accurate population distribution, we projected the actual population in 2001 and 2012 of each watershed area as follows. We assumed that the population in 2001 was the same as in 2003 and that of 2012 was the same as in 2013. The populations in 2003 and 2013 for each watershed are given in the Table 1. The estimation of the population of L1 can be explained as follows: the population in January 2003 and the population in December in 2013 were assumed to be respectively 241,752 and 270,752. Then a continuous growth rate was assumed at 221.37 per month.
2.2. Analysis of Correlation
We used the integration pollution index to yearly evaluate and visualize the impact of human activities in each watershed area on the water quality of the river basin [1]. This was used to compare the effect of the population of the watershed on the water quality. The formula given in Equation (1) was used to calculate the integration pollution index of water quality for each sampling site.
where PI is the integrated pollution index and Cb is the actual water quality parameter value for each sample. The number of records pertaining to each of the five actual water quality parameters in each sampling site L1, L2, L3, L4 and L5 are 116, 111, 117, 106 and 114, respectively. C0 is the value of water quality standard. Here we used five water quality parameters, namely DO, COD, BOD5, TC and NO3− and water quality standards values for each parameter for the drinking category: 6 mg/L, 15 mg/L, 3 mg/L, 5000 MPN/100 mL and 5 mg/L, respectively. The m is the number of monitoring parameters. The urban and regional design, planning and disaster management mostly considers the urbanization levels when they want to make decisions by comparing the different regions such urban, suburban and rural. When categorized, with the most similar regions in one group according to density, it is easier to understand the impact of urbanization, rather than comparing the effect of the individual population in each region [1]. One of the crucial factors in defining the urbanization level is the population size and the density [25]. Therefore, considering the population distribution shown in Table 1, the five watersheds in Kelani River were classified into three categories as urbanized level one (UL1), which has a higher population, urbanized level two (UL2) which has intermediate population, and urbanized level three (UL3) which has lower population. Figure 1 shows the five watersheds according the above-mentioned three urbanization categories. Next, we compared the PI of each category of urbanization in every year. Then the correlation coefficient of each water quality parameter with population was calculated separately to identify the greatest effect.
2.3. The Development of the Classification Model
The development of the classification model based on a given data set is the typical task of data mining. Here, we develop the classification model used to classify the WQCS given in Table 2, and population. Further, these three parameters were selected according to the correlation between the water quality parameters and population. The WQCS given in Table 2 was mainly obtained from proposed water quality standards by Western Region Megapolis Planning in 2015, which is attached to the KRMP report [12]. Considering the WQCS for the inland water source in Sri Lanka given by the CEA, we assumed that the TC value of both Classes A and B was the same.
The water quality parameters selected based on their strength of correlation with the population in the previous step are given in Table 2.
The values of the water quality parameters which do not belong any of the classes A, B or C were assumed to be polluted and deemed as class D. In Table 2, the WQCS are overlapping. When classifying each record, all the five classification standards of class A were evaluated and if any were not satisfied, the classification standards of class B were checked. If any were not satisfied in B, then we moved to class C. If any records did not beloeng to any of the above three classes they were categorized under class D.
The problem domain of this classification s the set of variables TC, BOD, DO and population (POP) as well as the class variable CV = {A, B, C, D}. The BN classifier could be represented by the conditional probabilities of the unobserved class x0 on the given observed data x1, x2, …, xn in Equation (2).
where x0 is a variable representing the unobserved class CV and x1, x2, ..., xn are the set of variables of TC, BOD, DO and POP. The proportion ∝ holds because we assume the inputs are given. The BN implicitly encodes joint distributions and the probability of n attributes of xi can be decomposed as a product of the joint probability distribution as shown in Equation (3).
The one simple and very fast learning algorithm, K2, and tree augmented network (TAN) are two popular algorithms to learn BNs (the structure and probability distributions) from data [26]. Figure 2 shows two possible learning BN structures corresponding to the K2 and TAN algorithms. The K2 algorithm obtains the structure of the naïve Bayesian (NB) network, which assumes conditional independency among x1, ..., xn given x0 in Equation (3). The Bayesian network with TAN learning algorithm shows some dependencies between variables other than the class variable.
The score of the minimum description length (MDL) principle is used for evaluating the models trained by the K2 and TAN algorithms. It measures the quality of the network based on data by computing the log-likelihood of the resultant network while learning the network structure by searching possible sets of edges among each node and computing the conditional probabilities [27]. The equation computing the log-likelihood (LL) l (V|D) is shown in Equation (4). V is a set of random variables in the given data set (D = {r1, r2, ..., ry, ..., rQ}). D is the monthly data-set of water quality parameters containing DO, BOD and TC from the five sampling sites from 2003 to 2013 excepting 2007. The ry is the yth record of the data-set. Q is 564 the total number of records in the data-set (D). Equation (5) explains the MDL score algorithm. Y is the number of variables; LL is the log-likelihood and q is the number of records in data set (D). The value of LL is negative and the best structure should have the minimum score.
To evaluate the accuracy of both BN models, a 10-fold cross-validation was applied for the given dataset. The Weka workbench was used to learn the algorithm and evaluate the performance of the algorithms [26]. The Weka is a collection of state-of the-art machine learning algorithms and data preprocessing tools. The parameters of the BN classifier were changed as follows in the Weka tool. The SimpleEstimator-A 0.5 was used for both learning methods. It gives the direct estimates of the conditional probabilities. In the K2 learning algorithm, the randomOrder was keep as false to use the order of nodes given by the dataset and the maxNrOfParents was keep as one to obtain only the class node as parent. In the TAN algorithm, no specific options were applied. The given conditional probability table of the population node in the BN based on the TAN searching algorithm was analyzed to define the ranges of the population.
2.4. The Comparison of Classification Models
Using the same data-set, the accuracy and efficiency of the BN classification model was compared with the ANN model. The three-layered ANN with a backpropagation learning technique was developed for comparison. All algorithms ware executed in same computational environment (CPU used i5-3470, 3.20 GHz and RAM 8 GB).
3. Results and Discussion
3.1. Analysis of Water Quality
The population densities (per km2) of each watershed in 2003 were 3916, 3399, 913, 1791 and 2642, corresponding to L1–L5, respectively, while in 2013 they were 4385, 4150, 1133, 2137 and 3099, respectively. The average values of the above population densities were 4151, 3774, 1023, 1964 and 2871 corresponding to the watersheds L1–L5, considering that L1 and L2 are categorized as UL1, L4 and L5 as UL2, and L3 as UL3, as defined in Section 2.2. These watersheds cover 2.65%, 2.63%, 4.87%, 4.02% and 2.23% of the entire watershed area of the Kelani River, respectively [13]. The research conducted on the Shanghai estuary of the Yangtze River in China used a similar comparison to identify the impact of the population on water quality [1]. They categorized the watershed area as urban, suburban and rural as per the population density of each.
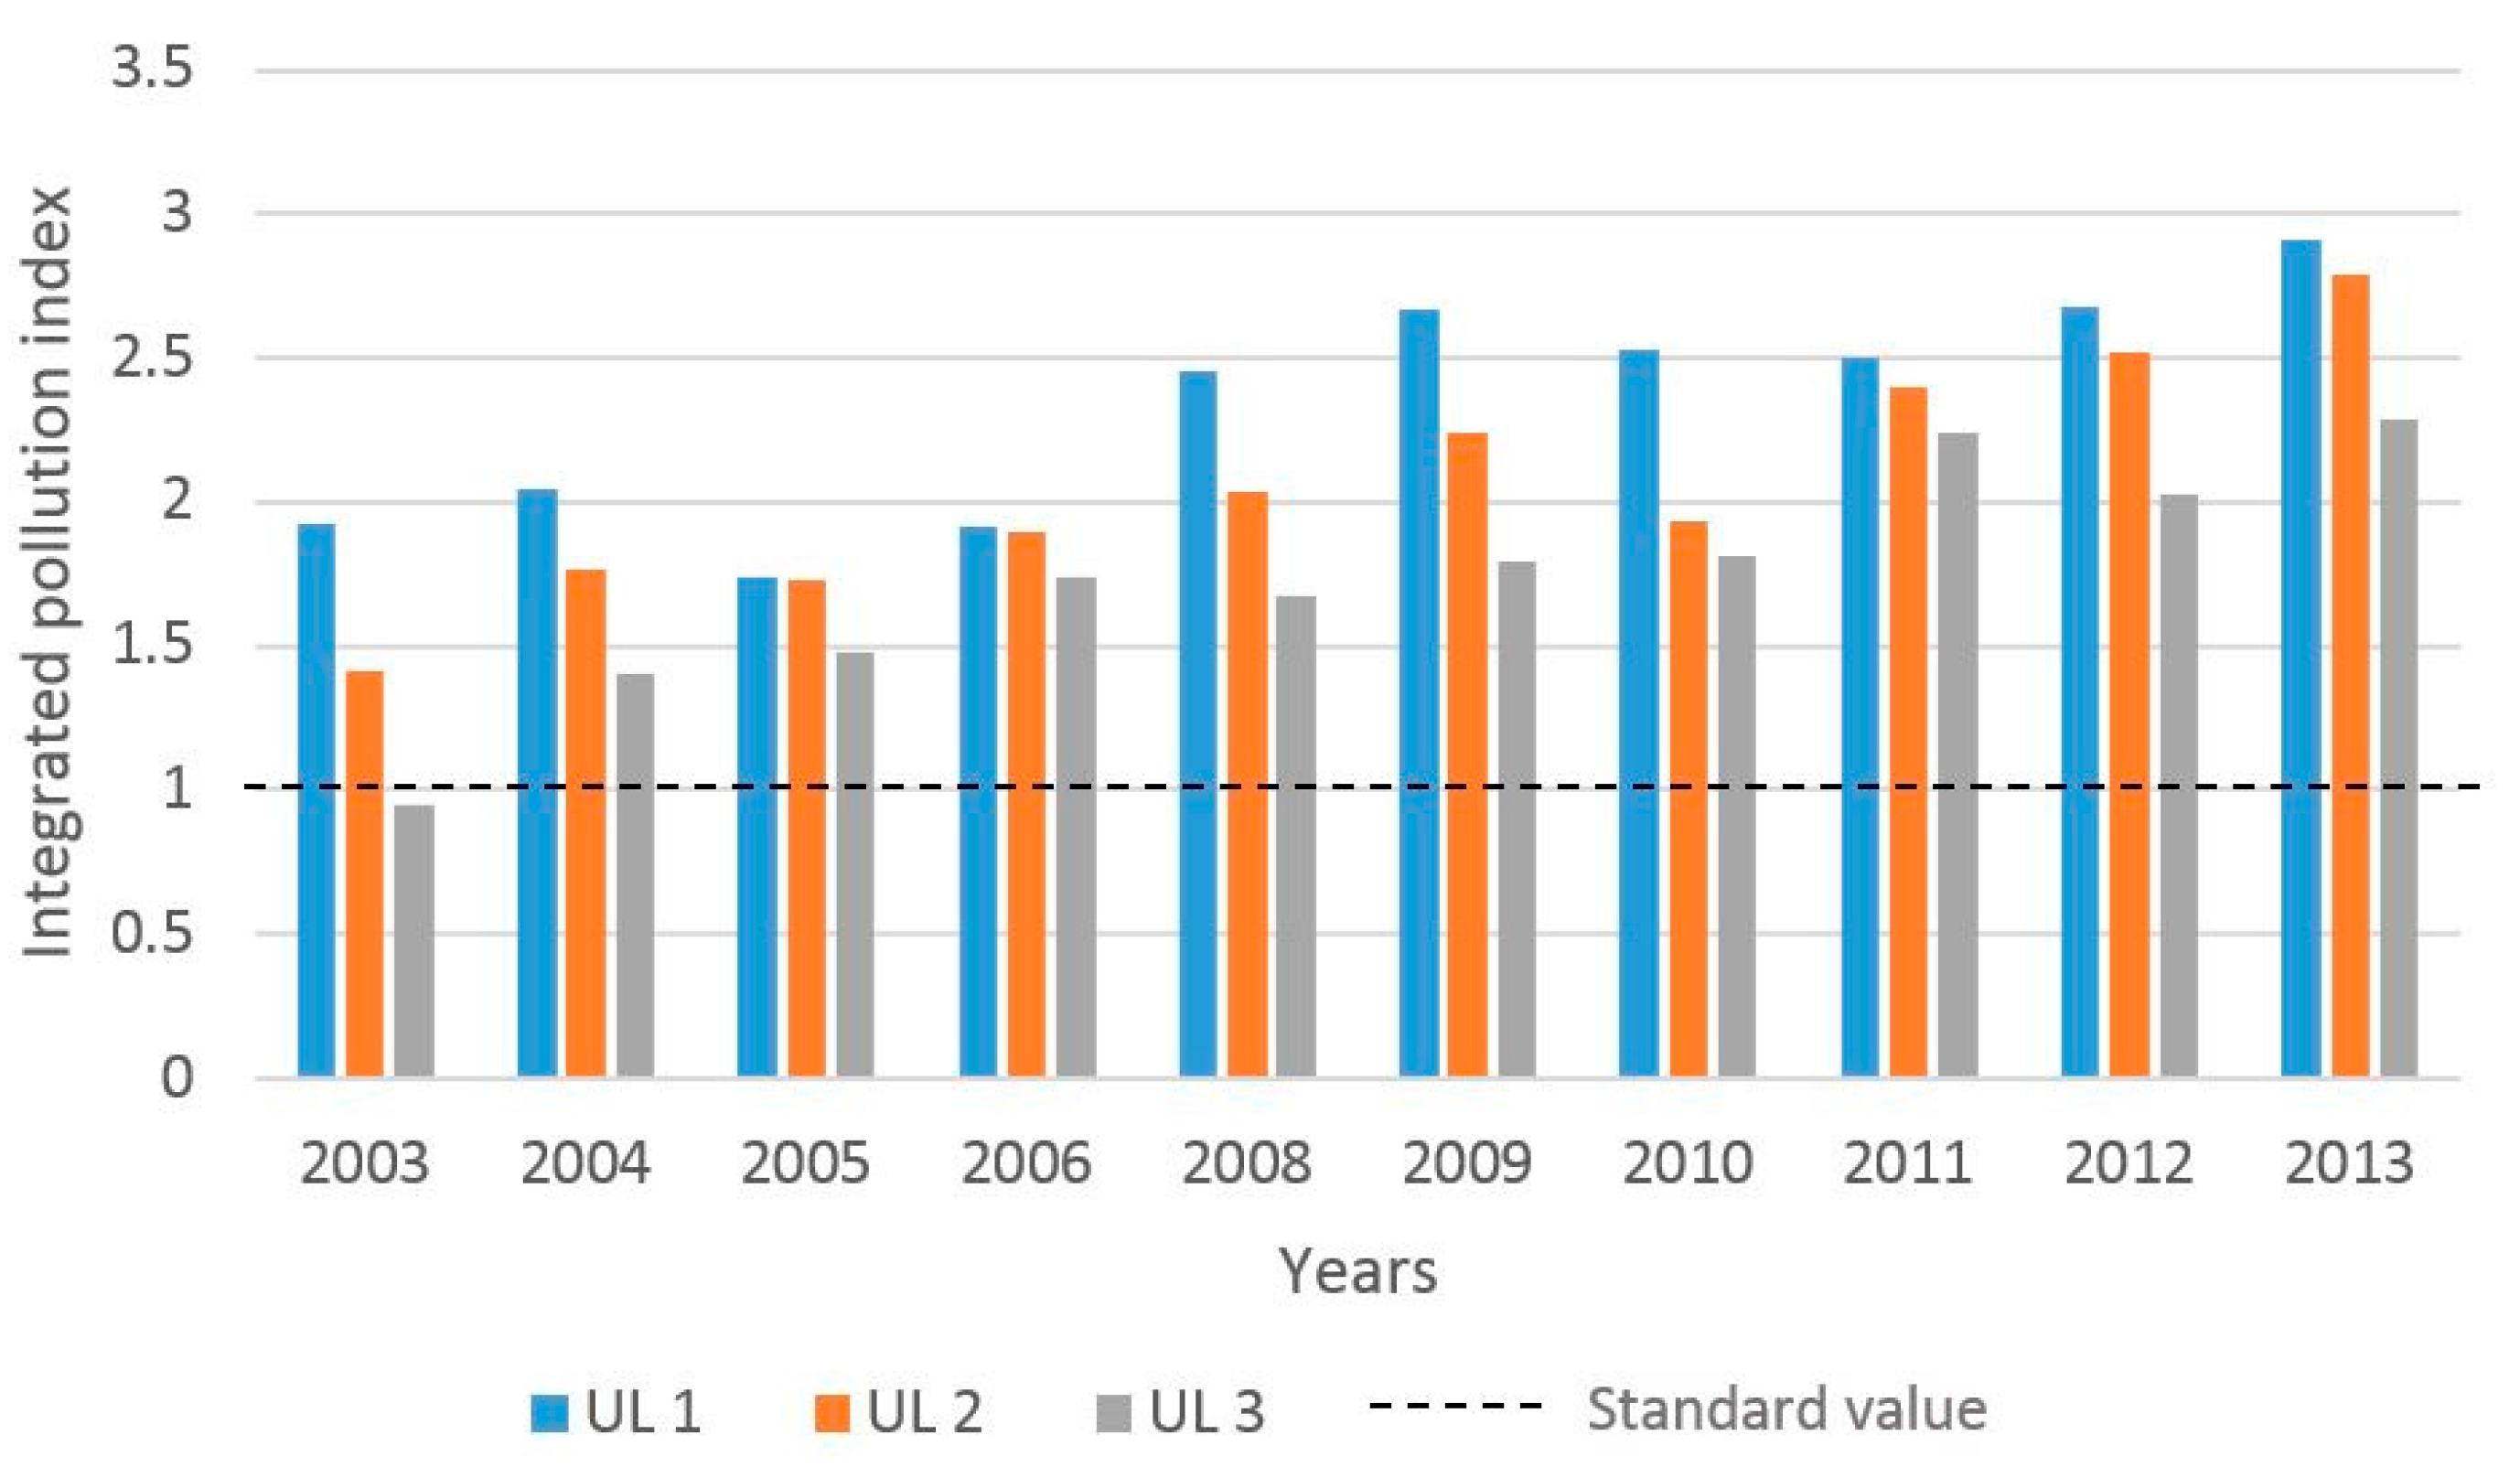
According to the PI, the impact of the level of urbanization on surface water quality during the monitoring period is shown in Figure 3. PI was higher in UL1 followed by UL2 and UL3 areas in each year from 2003 to 2013. However, in 2005 and 2006 the difference in PI between UL1 and UL2 were not significantly higher compared to the rest of the years. In the year 2006, both UL1 and UL2 scored a higher PI than UL3, with a significantly lower fall of 0.04 for UL1 compared to UL2 (UL1 obtained a PI value of 1.737 and UL 2 obtained a value of 1.726). In 2005, the PI value of UL1 was increased by 0.01 compared to UL2. Consequently, the contribution rate of pollution loads for each category showed the highest PI value in 2013 compared to other years.
The population growth rates from 2003 to 2013 in UL1, UL2 and UL3 are 16%, 18%, and 24%, respectively. When 2003 scenario is compared with that of 2013 under the context of PI, the percentage increase in PI of the three urbanization levels was 50%, 109% and 141%, which also corresponds to the population growth rates of each urbanization level. The PI value of all three categories in every year are above the standard value, except for UL3 in 2003. This indicates that the contamination of water occurs in all five watersheds.
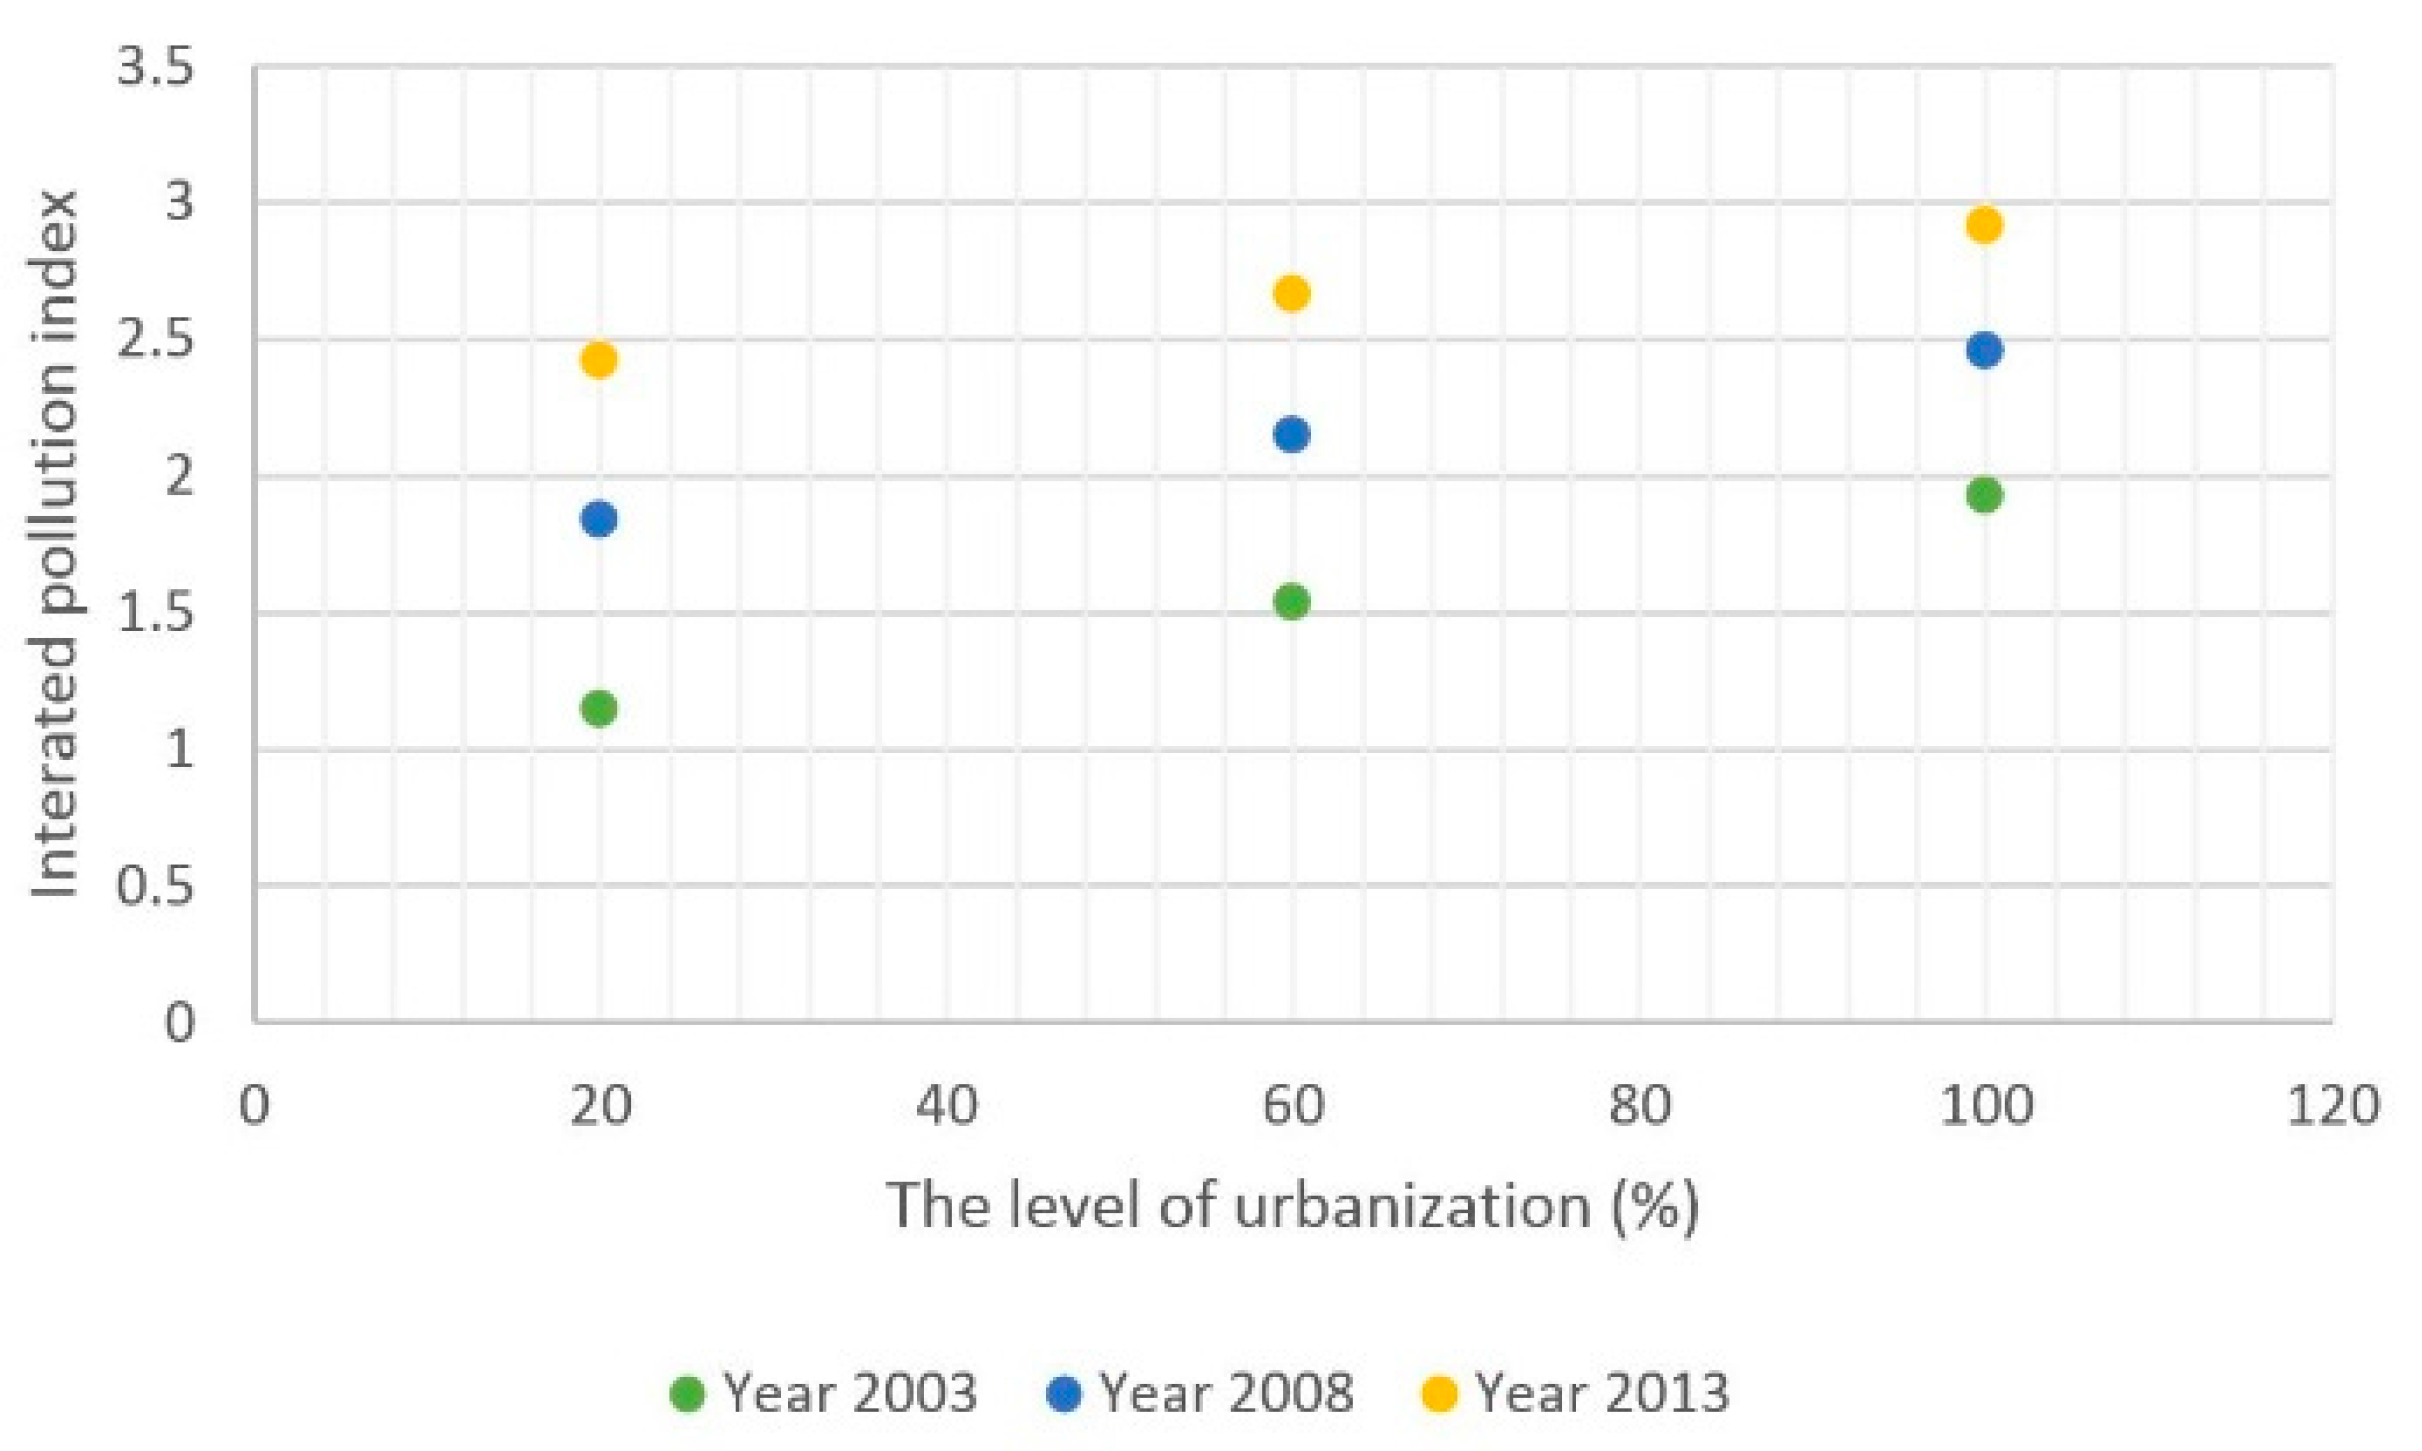
The PI increases with increasing level of urbanization in all five watersheds are shown in the three years 2003, 2008 and 2013 (Figure 4). The linear graph is used to represent the increment by considering the minimum and maximum PI values of the five watersheds and corresponding populations of a particular year. The calculation for 2003 can be explained as follows. The intensity of river pollution has clearly increased over time, with the increasing urbanization level. The PI levels have increased from 1.14, 1.53 and 1.92 to 2.42, 2.66 and 2.91, respectively. The spatial pattern of the integrated pollution index given by the present study closely relates to similar existing results from a study conducted on the Yangtze River in China [1].
We calculated the correlation coefficients between the five parameters and populations separately. The results are shown in the Table 3. All the variables were positively correlated with population except DO (p < 0.01). TC, BOD and DO showed a significantly high correlation with population. In general, the values of the correlation coefficients between 1.0 and 0.5 can be considered as indicating a strong relationship [28]. Further, to obtain a classification model of higher accuracy, we selected water quality parameters for which the correlation coefficient with population density were greater than 0.5. Data used in the study suggested that the five parameters TC, BOD, COD, DO and NO3− (Table 3), can be used as a model in development. However, only three parameters (TC, BOD and DO) were selected from the above, given that their correlation coefficient was greater than 0.5. The result of water quality in three urban areas in Nepal, India and Bangladesh also showed positive correlations of BOD and TC with population and a negative correlation of DO with population [4]. Further, less correlation between population density and NO3− has been shown in other research conducted in Sierra Nevada, California by Dylan S. Ahearn et al. [29]. The research conducted on the Jinshui River Basin of the South Qinling Mountains, China, predicted the most correlated water quality parameters, which have strong correlation with population, by defining the linear equations [10]. Comparison of the results for both rivers clearly illustrates the relationship between population and the water quality of the river basin.
3.2. The Development of the Classification Model
The water quality classification standards given in Table 2 were used to determine the water quality classes of the training data. The performance of the BN classification model was discussed with two different learning algorithms. The result of the ANN model with a backpropagation algorithm was used to compare the accuracy and efficiency of the BN model. The performance of the two classification models, ANN and BN are shown in Table 4. The TAN learning algorithm obtained −2280.95 as the minimum MDL score and had the highest accuracy level at 98.40% in the 10-fold cross-validation of the given dataset compared to the K2 learning algorithm. The least computational time also occurred in the BN model with the TAN learning algorithm. The accuracy of the ANN model was evaluated by changing some hidden layers and changing the training time (Epochs). Finally, the best performance of the ANN model occurred at 2000 epochs with 15 hidden layers. In the previous study on water quality classification, the BN showed better performance than the ANN [23]. As shown in Table 4, the best performance was achieved by the TAN algorithm of the BN. Therefore, this research used the BN classification model with the TAN learning algorithm to quantitatively define the population ranges.
The confusion matrix of the BN classification model is given in Table 5. Obtained values of recall and precision for each class based on the confusion matrix explain the performance of the classification model. Therefore, the total number of records of the test data set was 564. The recall values of A, B, C and D classes were 1.0, 1.0, 0.98 and 0.984 respectively. The precision values of the above classes were, respectively, 1.0, 0.97, 0.99 and 0.964. Further, the micro-averages of recall and precision were equal to 0.984.
3.3. Quantitative Population Range
The obtained probability distribution table of the population density attribute is shown in Table 6. The table represents the probability distribution of P (POP|CV) and helps us to understand the variation of the population density ranges according to the water quality classification classes.
This study has identified three different population ranges according to four water quality standards. The total probability of each class is equal to one. The water quality classification classes A and B demonstrate significantly higher probabilities compared to C in the lowest population density range POP-1. The probabilities are lower in A and B than in C in the POP-2 range. The probability of class D denoted the highest probability (0.875) in the POP-3 range. We can consider a population density of between 2375 and 2672 as the critical point of population density for water contamination. Except for class C, the population range for POP-2 does not show high probability values. Therefore, the POP-2 range is suitable for maintaining water quality in class C. Taken together, a watershed with a population density of less than 2375, helps to maintain water quality at a higher level with the classification classes A and B in the river basin, whereas a population density less than 2672 is helpful with regard to class C. This proposed population density can be taken into account when determining the carrying population density of the watersheds. Numerous studies that have been conducted on water pollution in river basins have identified a high correlation between population and water quality parameters [1,4,9,10]. The present study further evaluated the effects and defined threshold values for population density with respect to the classification of water quality in river basins.
Research conducted on the Jinshui River by Hongmei Bu et al. proposed a method to find the threshold value of population by a quadratic equation of the pollution index and population [10]. The threshold values of population was based on the total factor score of the sample site with the best water quality. In contrast, sustainable population density levels were derived from the WQCS of river water.
3.4. Proposed Method
Sri Lanka uses natural water resources to fulfil the country’s demand for water, which is increasing with population growth. The challenge is addressing the demand while achieving sustainable development through controlling and mitigating the impacts of urbanization, industrialization and agriculture on natural water sources. The responsible authorities in Sri Lanka have proposed a long-term strategy and the action plan for the management of Kelani River takes the above-mentioned point and non-point source pollution into consideration [13]. The evaluation and mitigation of the contamination and control of the non-point source pollution is more difficult than that of the point source pollution. Furthermore, contamination of the catchment areas of a river has been increasing due to urbanization near the many rivers [5,10]. Identifying the level of impact of non-point source pollution is very essential to facilitating the watershed ecosystem. Therefore, understanding the impact and mitigating the human effects on a river is highly required.
In this research, we introduced a method for finding the sustainable range of human population density that can be carried by the natural environment in a watershed. This proposed concept can be explained as a river classification method for different purposes such as drinking, bathing and fishing according to the population density of a particular watershed. Therefore, any country can apply this model for the new establishment of watershed management. Other than that, the existing urbanized watersheds can identify the threshold value of population and offer many waste-water treatment facilities to remove pollution. After training, the classification model can be applied to different watersheds in the same river to identify threshold population densities by considering watershed population without using water quality parameters. Due to this reason, it is a better and low-cost method for river water management specially in developing countries. According to the situation at the Ambatala water intake point in the Kelani River, which has faced problems many times in recent years due to its inability to maintain drinking water standards [13]. If they followed the population densities recommended by the proposed system, there would be a possibility to maintain the required water quality standards. Otherwise, as an alternative solution, a new water intake point can be suggested in the watershed that has a population density of less than 2375.
Reliable statistics and indicator values are essential for the effective implementation of management strategies and plans and for the control of the human activities happening in watershed areas, but these are lacking in many developing countries. Such numerical figures will render a greater feasibility for successful water resource and river basin management. The decision-making tools required for the above-mentioned processes can be practically contributed to by the threshold population densities derived in the present study.
Since a correlation is required between the water quality parameters and population density in order for any parameter to be used in the present model, the accuracy is limited by the fact of whether a certain parameter correlates with population density. The applicability of the model will be restrained if there is only a least number of correlations and the correlation coefficient is unsatisfactorily low. Land use and environmental factors may sometimes affect the river health more significantly than only the human population density of a river basin. For example, a river may go through heavily industrialized areas, large cultivated areas, or have a long course of length where soil erosion impacts are high [30].
The applicability of the present model is suitable for any country. Since relevant data are readily available in developed countries the model can be trained for existing data and it would produce positive implication s for multiple management objectives. The model can be further developed based on correlations between water quality and agricultural practices, industrialization, and infrastructure developments other than population density.
Addressing the environmental management problems and making suggestions to change the human behavior that cause such problems are vital for protecting nature [31]. Studies have been carried out to predict acceptable population levels in river basins, i.e., Hongmei Bu et al. estimated the population capacity of a river basin [10]. However, limiting the population living near a watershed would not always be a practical solution and may be the last option when it comes to the most critical situations. The population density ranges proposed by the present study can be adopted by the relevant management authorities in introducing new rules and regulations and setting appropriate standards. Further, these organizations need to take initiative in controlling the contamination of water bodies through anthropogenic activities. There is a need for establishing necessary wastewater treatment and sewage disposal mechanisms and properly examining the approval procedures for building construction, which should align with the recommended population ranges. Much research suggest the implementation of suitable water quality measures and the enhancement of wastewater treatment plants and drainage systems according to the urbanization level [29]. Regarding Kelani River, one research group has suggested water mitigation strategies, further including the application of water quality legislation to waste disposal and management practices (BMPs) [8]. Controlled surface water contamination has been achieved through political and economic activities such as restrictions on industrial expansion, new housing plans, reconstruction of urban areas and redistribution of the population around watershed areas [1]. Further, motivating and enhancing the interaction among all stakeholders and responsible authorities related to environmental management, such as infrastructure development authorities, community, economic and policy planners, legal officers and political parties is important [4,5,29]. Based on the findings of the present study, we would like to propose that stakeholders and relevant authorities including the CEA, Urban Development Authority (UDA) and International Union for the Conservation of Nature (IUCN) in Sri Lanka, draft necessary rules and regulations, taking into account the proposed population ranges. This would contribute to retaining the existing population in particular watersheds without moving them for the sake of water quality.
4. Conclusions
In this research, we have quantitatively identified the ideal range of population density for a watershed in order to maintain the quality of water at an appropriate level. We identified that water quality is worst in highly populated areas, average in medium populated areas and less serious in less populated areas. Further, we identified population density as a major factor that should be well controlled to overcome the rapid deterioration and degradation of the water ecosystem. The accuracy and ability of this method is based on the number of parameters showing a correlation with population and the strength of that correlation. This was based on our finding which revealed a positive correlation between the water quality parameters DO, BOD and TC and population. We have developed a method to find the appropriate population distribution using a BN classification model based on water quality parameters and population data. After obtaining the conditional probability table of the population node, we identified two ranges as follows: a watershed with a population density of less than 2375 is safe for drinking and bathing purposes, whereas a watershed with a population density between 2375 and 2672 is acceptable for fish and aquatic life. Therefore, it would be helpful in making decisions regarding environmental management. The proposed concept can be applied to predict water quality by using the population density and that would be a low-cost method for environmental management. Since many countries maintain databases related to the environment and changes in environmental quality, the present model can be trained with such data, in order to produce decision-making tools for environmental management. Finally, this research evaluated the impact of population on water quality in rivers based on a water quality classification model and pointed out the possibility of controlling pollution by raising the awareness of stakeholders and relevant authorities of natural water bodies.
Acknowledgments
We thank the Central Environment Authority in Sri Lanka for use the water quality data in Kelani River and given opportunity to discuss their requirements based on Kelani river water quality monitoring system.
Author Contributions
Chamara P. Liyanage conceived the study; he also designed and achieved the data analysis with technical help of Koichi Yamada; and both authors wrote the paper.
Conflicts of Interest
The authors declare no conflict of interest.
References
- Wang, J.; Da, L.; Song, K.; Li, B.-L. Temporal variations of surface water quality in urban, suburban and rural areas during rapid urbanization in Shanghai, China. Environ. Pollut. 2008, 152, 387–393. [Google Scholar] [CrossRef] [PubMed]
- Sabry, H. Thousands of Lives at Risk Kelani River Contamination. Sunday Lead. 2015. Available online: http://www.thesundayleader.lk/2015/09/27/thousands-of-lives-at-risk-kelani-river-contamination/ (accessed on 10 July 2017).
- International Decade for Action ‘Water for Life’ 2005–2015. 8 September 2015. Available online: http://www.un.org/waterforlifedecade/ (accessed on 6 April 2017).
- Karn, S.K.; Harada, H. Surface Water Pollution in Three Urban Territories of Nepal, India, and Bangladesh. Environ. Manag. 2001, 28, 483–496. [Google Scholar]
- Qin, H.; Su, Q.; Khu, S.-T.; Tang, N. Water quality changes during rapid urbanization in the Shenzhen River Catchment: An integrated view of socio-economic and infrastructure development. Sustainability 2014, 6, 7433–7451. [Google Scholar] [CrossRef]
- Groppo, J.D.; de Moraes, J.M.; Beduschi, C.E.; Genovez, A.M.; Martinelli, L.A. Trend analysis of water quality in some rivers with different degrees of development within the São Paulo State, Brazil. River Res. Appl. 2008, 24, 1056–1067. [Google Scholar] [CrossRef]
- Peters, N.E.; Meybeck, M.; Deborah, V.C. Effects of Human Activities on Water Quality. In Encyclopedia of Hydrological Sciences; Wiley Online Library, Wiley & Sons, Ltd.: New York, NY, USA, 2016. [Google Scholar]
- Athukorala, S.W.; Weerasinghe, L.S.; Jayasooria, M.; Rajapakshe, D.; Fernando, L.; Raffeeze, M.; Miguntanna, N.P. Ananlysis of Water Quality Variation in Kelani River, Sri Lanka Using Principal Componet Analysis. In Proceedings of the SAITM Research Symposium on Engineering Advancements, Malabe, Sri Lanka, 27 April 2013; pp. 129–135. [Google Scholar]
- Pompeu, P.S.; Alves, C.B.M. The Effects of Urbanization on Biodiversity and Water Quality in the Rio das Velhas Basin, Brazil. Am. Fish. Soc. 2005, 47, 11–22. [Google Scholar]
- Bu, H.; Liu, W.; Song, X.; Zhang, Q. Quantitative impacts of population on river water quality in the Jinshui River basin of the South Qinling Mts., China. Environ. Earth Sci. 2016, 75, 292. [Google Scholar] [CrossRef]
- Peters, N.E. Effects of urbanization on stream water quality in the city of Atlanta, Georgia, USA. Hydrol. Process. 2009, 23, 2860–2878. [Google Scholar] [CrossRef]
- Zhao, H.; Duan, X.; Stewart, B.; You, B.; Jiang, X. Spatial correlations between urbanization and river water pollution in the heavily polluted area of Taihu Lake Basin, China. J. Geogr. Sci. 2013, 23, 735–752. [Google Scholar] [CrossRef]
- Edussuriya, C.H.; Pathirag, S. Natural Resource Management and Monitoring Unit Published Final Report of Medium to Long-Term Multi-Stakeholder Strategy and Action Plan for Management and Conservation of the Kelanni River Basin; Central Environment Authority: Battaramulla, Sri Lanka, 2016. [Google Scholar]
- Ileperuma, O.A. Environmental pollution in Sri Lanka: A review. J. Natl. Sci. Found. Sri Lanka 2010, 28, 301–325. [Google Scholar] [CrossRef]
- Wijesinghe, T.W.A.W. Status of Water Quality of Kelani River; Central Environmental Authority: Battaramulla, Sri Lanka, 2010. [Google Scholar]
- Edussuriya, C.H.; Pathirag, S. Preliminary Perception Survey on Water Safety: Kelani River Basin; Central Environment Authority and IUCN Sri Lanka Office: Colombo, Sri Lanka, 2016. [Google Scholar]
- Day Sharon, K.; Geoff, T.; Eileen, P.; Jone, M. Effects of Population Growth on Water Quality in a Mountain Watershed; Colorado Convention Center: Exhibit Hall, Hong Kong, 2002. [Google Scholar]
- Abistado, K.G.; Arellano, C.N.; Maravillas, E.A. Weather forecasting using artificial neural network and Bayesian network. ResearchGate 2014. Available online: https://www.researchgate.net/publication/288746408_Weather_forecasting_using_artificial_neural_network_and_Bayesian_network (accessed on 6 July 2017).
- Rosly, R.; Makhtar, M.; Awang, M.K.; Rahman, M.N.A.; Deris, M.M. The study on the accuracy of classifiers for water quality application. Int. J. u-Serv. e-Serv. Sci. Technol. 2015, 8, 145–154. [Google Scholar] [CrossRef]
- Kawamura, M.; Jayamanna, S.; Tsujiko, Y.; Sugiyama, A. Comparison of urbanization of four Asian cities using satellite data. Doboku Gakkai Ronbunshu 1998, 1998, 97–105. [Google Scholar] [CrossRef]
- Liyanage, C.P.; Marasinghe, A.; Yamada, K. Comparison of Optimized Selection Methods of Sampling Sites Network for Water Quality Monitoring in a River. Int. J. Affect. Eng. 2016, 15, 195–204. [Google Scholar] [CrossRef]
- Fowze, J.S.M.; Liyanage, P.P. Flood Hazard Mapping in Lower Reach of Kelani River, Sri Lanka (PDF Download Available). ResearchGate 2008. Available online: https://www.researchgate.net/publication/228772034_Flood_hazard_mapping_in_lower_reach_of_Kelani_River_Sri_Lanka (accessed on 6 July 2017).
- Liyanage, C.P.; Yamada, K. Comparison of Water Quality Classification Models Using Artificial Neural Network and Bayesian Network. In Proceedings of the 2016 Joint 8th International Conference on Soft Computing and Intelligent Systems and 2016 17th International Symposium on Advanced Intelligent Systems, Hokkaido, Japan, 25–28 August 2016. [Google Scholar]
- Sri Lanka: Provinces & Cities—Population Statistics in Maps and Charts. City Popul. 2017. Available online: http://www.citypopulation.de/SriLanka-Cities.html (accessed on 6 July 2017).
- Dahly, D.L.; Adair, L.S. Quantifying the urban environment: A scale measure of urbanicity outperforms the urban-rural dichotomy. Soc. Sci. Med. 2007, 64, 1407–1419. [Google Scholar] [CrossRef] [PubMed]
- Witten, I.H.; Frank, E.; Hall, M.A. Data Mining: Practical Machine Learning Tools and Techniques, 3rd ed.; Morgan Kaufmann: Burlington, MA, USA, 2011. [Google Scholar]
- Neapolitan, R.E. Learning Bayesian Networks; Pearson Prentice Hall: Upper Saddle River, NJ, USA, 2004. [Google Scholar]
- Statistical Correlation—Strength of Relationship between Variables. Available online: https://explorable.com/statistical-correlation (accessed on 6 July 2017).
- Ahearn, D.S.; Sheibley, R.W.; Dahlgren, R.A.; Anderson, M.; Johnson, J.; Tate, K.W. Land use and land cover influence on water quality in the last free-flowing river draining the western Sierra Nevada, California. J. Hydrol. 2005, 313, 234–247. [Google Scholar] [CrossRef]
- El-Sheekh, M.M. Impact of Water Quality on Ecosystems of the Nile River. In The Nile River; Springer: Berlin, Germany, 2016; pp. 357–385. [Google Scholar]
- Altman, I.; Wohlwill, J.F. Behavior and the Natural Environment; Plenum Publishing Corporation: New York, NY, USA, 1983. [Google Scholar]
Figure 1.
The five watersheds in the Kelani River with their water sampling points and defined three levels of urbanization.
Figure 1.
The five watersheds in the Kelani River with their water sampling points and defined three levels of urbanization.

Figure 2.
Structures of the Bayesian network based on learning algorithms. (a) Structure of BN based on the K2 learning algorithm; (b) Structure of Bayesian Network (BN) based on Tree Augmented Naive Bayes (TAN) learning algorithm.
Figure 2.
Structures of the Bayesian network based on learning algorithms. (a) Structure of BN based on the K2 learning algorithm; (b) Structure of Bayesian Network (BN) based on Tree Augmented Naive Bayes (TAN) learning algorithm.

Figure 3.
Spatial pattern of the integrated pollution index in level of urbanization.

Figure 4.
Relation between the integrated pollution index and the level of urbanization considering the increment of population in 2003, 2008 and 2013.
Figure 4.
Relation between the integrated pollution index and the level of urbanization considering the increment of population in 2003, 2008 and 2013.


Table 1.
Population and density of watersheds.
| Watershed | Area (km2) | Population 2003 | Population Density 2003 | Population 2013 | Population Density 2003 |
|---|---|---|---|---|---|
| L1 | 61.74 | 241,752 | 3916 | 270,752 | 4385 |
| L2 | 61.46 | 208,910 | 3399 | 255,038 | 4150 |
| L3 | 113.67 | 103,746 | 913 | 128,794 | 1133 |
| L4 | 93.67 | 167,756 | 1791 | 200,138 | 2137 |
| L5 | 52.14 | 137,752 | 2642 | 161,601 | 3099 |
Table 2.
Water quality classification standards (WQCS).
| Parameter | Drinking Water with Simple Treatment | Bathing Water | Fish and Aquatic Life |
|---|---|---|---|
| Class-A | Class-B | Class-C | |
| TC as MPN/100 mL | <5000 | <5000 | <20,000 |
| DO mg/L | >6 | >5 | >3 |
| BOD5 mg/L | <3 | <4 | <4 |
Table 3.
Correlation coefficients of water quality parameters and population.
| Water Quality Parameters | Correlation Coefficients (p < 0.01) |
|---|---|
| TC | 0.687 |
| BOD | 0.745 |
| COD | 0.29 |
| DO | −0.699 |
| NO3− | 0.400 |
Table 4.
The summary of the performance of three classification models.
| Method of Model | Accuracy out of 564 (%) | Micro Average of Recall | Micro Average of Precision | Computational Time (S) |
|---|---|---|---|---|
| BN with K2 leaning algorithm | 548 (97.16%) | 0.972 | 0.973 | 0.02 |
| BN with TAN learning algorithm | 555 (98.43%) | 0.984 | 0.984 | 0.01 |
| ANNs | 551 (97.69%) | 0.977 | 0.977 | 3.62 |
Table 5.
The confusion matrix of the BN classification model with the TAN learning algorithm.
| Forecasted Quality | |||||
|---|---|---|---|---|---|
| A | B | C | D | ||
| Actual quality | A | 69 | 0 | 0 | |
| B | 0 | 36 | 0 | 0 | |
| C | 0 | 0 | 287 | 6 | |
| D | 0 | 1 | 2 | 163 | |
Table 6.
The population density classification ranges and probability of each classification class.
| Water Quality Classification Class | Probability of Class Variable in Each Density Range Defined by BN Models (... × 100%) | ||
|---|---|---|---|
| 0 to 2375 | 2375 to 2672 | Above 2672 | |
| (POP-1) | (POP-2) | (POP-3) | |
| A | 0.816 | 0.064 | 0.121 |
| B | 0.867 | 0.013 | 0.12 |
| C | 0.576 | 0.188 | 0.236 |
| D | 0.104 | 0.021 | 0.875 |
© 2017 by the authors. Licensee MDPI, Basel, Switzerland. This article is an open access article distributed under the terms and conditions of the Creative Commons Attribution (CC BY) license (http://creativecommons.org/licenses/by/4.0/).
Share and Cite
MDPI and ACS Style
Liyanage, C.P.; Yamada, K. Impact of Population Growth on the Water Quality of Natural Water Bodies. Sustainability 2017, 9, 1405. https://0-doi-org.brum.beds.ac.uk/10.3390/su9081405
AMA Style
Liyanage CP, Yamada K. Impact of Population Growth on the Water Quality of Natural Water Bodies. Sustainability. 2017; 9(8):1405. https://0-doi-org.brum.beds.ac.uk/10.3390/su9081405
Chicago/Turabian StyleLiyanage, Chamara P., and Koichi Yamada. 2017. "Impact of Population Growth on the Water Quality of Natural Water Bodies" Sustainability 9, no. 8: 1405. https://0-doi-org.brum.beds.ac.uk/10.3390/su9081405
Note that from the first issue of 2016, this journal uses article numbers instead of page numbers. See further details here.