Article

Employing SWOT Analysis and Normal Cloud Model for Water Resource Sustainable Utilization Assessment and Strategy Development

State Key Laboratory of Hydraulic Engineering Simulation and Safety, Tianjin University, Tianjin 300072, China
*
Author to whom correspondence should be addressed.
Sustainability 2017, 9(8), 1439; https://0-doi-org.brum.beds.ac.uk/10.3390/su9081439
Submission received: 3 July 2017 / Revised: 27 July 2017 / Accepted: 13 August 2017 / Published: 15 August 2017
(This article belongs to the Collection Eutrophication and Sustainable Management of Water)

Abstract

:
Water Resource Sustainable Utilization (WRSU) is becoming increasingly important, given growing water resource shortages and widening gaps between water supply and demand. Most existing studies have focused on WRSU levels without a dedicated strategy-oriented framework. In addition, uncertainties occur in the process of indicator quantification and grading, leading to a lack of accuracy in the assessment results. Therefore, in this study, stemming from water resource, societal, economic, and environmental dimensions, an indicator system with qualitative description was introduced by Strengths, Weaknesses, Opportunities, and Threats (SWOT) analysis to enable development and selection of sustainable water use strategies. A normal cloud model that is capable of addressing uncertainties was used to determine WRSU levels. The comprehensive evaluation results can both reflect the WRSU levels and select the most suitable strategy. The model’s utility was demonstrated by applying it to the case of Shandong province in China. Based on the results, most areas of Shandong province appear to be facing serious unsustainable issues. Appropriate development strategies based on the WRSU levels were provided for improving sustainable use of water resources. The proposed method offers an efficient means for WRSU assessment and strategy development. Moreover, it has the potential to be applied to other water resource issues.

1. Introduction

Water is a fundamental natural resource that influences social progress and economic development [1,2]. Water Resource Sustainable Utilization (WRSU) can contribute to sustainable human development by meeting the needs of present and future generations without unacceptable consequences. However, water demand has increased in several parts of the world, in response to rapid economic and human population growth over the past few decades; the gap between supply and demand is thus gradually widening [3]. In addition, inadequate awareness regarding the need for resource conservation, and lifestyles that are not environment friendly, have contributed to heavy pollution and exacerbated ecological problems. For the reasons above as well as varying climatic conditions, urbanization, and industrialization, the amount of wastewater generated will increase further; unsustainable use of water resources will thus likely become the biggest bottleneck hindering the increase in overall national wealth in the future [4]. In many Asian regions, numerous countries struggle to meet their water demands, as water quantity insufficiency has recently become a matter of great concern, with widening gaps between water supply and demand. Although many countries respond to water crises with water diversion projects, they also recognize the urgent need to develop water resource use plans and appropriate strategies for sustainable development, and to allow long-term maintenance of ecological cycles. Scientific WRSU assessment provides a foundation for sustainable water use strategy development [5], and it has become an important aspect in water resources research, considering that water resource issues are one of the greatest challenges facing modern society [6,7,8,9]. WRSU assessment is also one of the most complicated tasks in the study of water resources, owing to the wide range of indicators and uncertainties in the process of indicator quantification and grading [10].
The selection of assessment indicators is a key tool and guideline for sustainability assessment [11,12,13]. Indicators can be used to develop strategies and actions as they measure the state of or change in a specific system [14]. A number of concepts are relevant to WRSU indicators. According to Pülzl et al. [15], one of the keys to achieving a sustainable future lies in finding balance and equity between the environment, economy, and society. A chain flow is also created according to dynamic relationships and behaviors between environmental, economic, and social indicators. Koop et al. [9] focused more on the water resources, social, environmental, and financial characteristics of the water resources system and pointed out that these may affect managers’ operational processes. Zijp et al. [5] summarised the themes related to sustainability, and an overview was given to show that sustainability mainly covered planet (resources and environment), prosperity (economy and technology) and people (human and society) aspects. Most authors argue, however, that sustainable use of water resources should be based on persistence and continuity. For example, according to Sandoval-Solis et al. [16], coordinated development requires that water resources meet water resources, societal, economic, and ecological needs. In this contribution, we concluded that WRSU indicators should cover the following aspects: (a) maintain water resources sustainability; (b) guarantee the social and economic development and (c) ensure the virtuous circle of environment system. WRSU indicators were thus associated with water resource, societal, economic, and environmental dimensions. After years of study, a variety of sustainability assessment indicators have been developed. Wang et al. [17] summarized a series of indicators of sustainable development capacity from subsystems of the four dimensions. Such systems include total amount of water resource, urbanization rate, GDP per capita, and waste waterdischarge, etc. Hara et al. [14] listed the sustainability assessment indicators developed at Columbia and Yale universities (ESI): socio-economic dimension, measured in terms of water access and natural population growth etc.; environment dimension, measured in terms of sewage treatment ratio and wastewater discharge etc.; resource dimension, measured in terms of water availability and water supply etc. Balkema et al. [18] summarized multi-dimensional characters of sustainability, and some indicators will be helpful for our study such as land areas (economic dimension), water resource utilization for environment (environmental dimension) and local development level (social–cultural dimension). There are also scholars such as Ma et al. [19,20] and Zhang et al. [21] who mentioned some other indicators related to water resources assessment: water resources per capita, water producing coefficient, water utilization per unit of GDP, population density, water requirements for irrigation and proportion of environmental protection investment to GDP etc.
After assessment indicators are selected, many evaluation methods are used to assess WRSU. In previous studies, researchers have primarily adapted comprehensive index and fuzzy comprehensive evaluation methods. These have been thoroughly studied and applied in the water resources assessment field. Koop et al. [9] built a city blueprint framework aiming to analyze integrated water resources management, and used the blue city index to aggregate indicators and obtain an overall score. Aydin et al. [22,23] proposed a sustainability index (SI) in order to produce an overall score for sustainability assessment of water distribution systems. Zhao et al. [24] modeled a comprehensive evaluation index considering water quality, water quantity, population density, and GDP standards to obtain water resources risk levels. Gong et al. [25] established a fuzzy comprehensive evaluation model to evaluate water resources capacity and related dynamic trends, providing insights for scientific water management policies.
However, most of the reported indicators selected based on the four dimensions [14,17,18,19,20,21] and related evaluation methods above have focused on the current state of water resource issues [9,21,22,23,24,25]. Strategy-oriented principles have thus generally been ignored. More specifically, WRSU assessment studies have not included the formulation of development strategy scenarios that can be applied to different areas to improve water resource sustainability within a region of interest. Current indicators and methods can reflect the state of or change in a specific water resource system, but may not be useful to develop strategy. This limits the potential to apply water use practices toward future sustainable development goals. In addition, uncertainties manifested mainly in randomness and fuzziness are often unavoidable in the process of describing certain indicators. Randomness refers to the various connections between an indicator and external factors, and fuzziness refers to uncertainty in defining the exact boundary value of an indicator. Randomness and fuzziness occur simultaneously in the process of indicator quantification and grading, leading to a lack of accuracy in the assessment results [18,19]. Hence, the selection of indicators should be based not only on water resource, societal, economic, and environmental dimensions but also on a strategy-oriented principle. Furthermore, the uncertainty conversion between qualitative concepts and their quantitative expression should be given further consideration.
The purpose of this paper is to present a scientific approach for WRSU assessment as well as a broader view on sustainable development. Based on the Strengths, Weaknesses, Opportunities, and Threats (SWOT) analysis, an indicator system with qualitative description was introduced to enable development and selection of strategies for sustainable water use practices. A normal cloud model was integrated with the analytic hierarchy process (AHP)-entropy method and VFS technology to enable determination of WRSU levels. Moreover, strategies for pursuing sustainability were selected according to city position and the SWOT analysis matrix.
Following this introduction, the paper includes the following three sections. In Section 2, the basic situation in the research area was introduced, providing supporting data for assessment. Section 3 described the methodical approach and the detailed modeling procedure. Following application of the fundamental theory framework to the assessment process, the last two sections outlined the main results and presented a corresponding discussion, respectively.

2. Materials and Methods
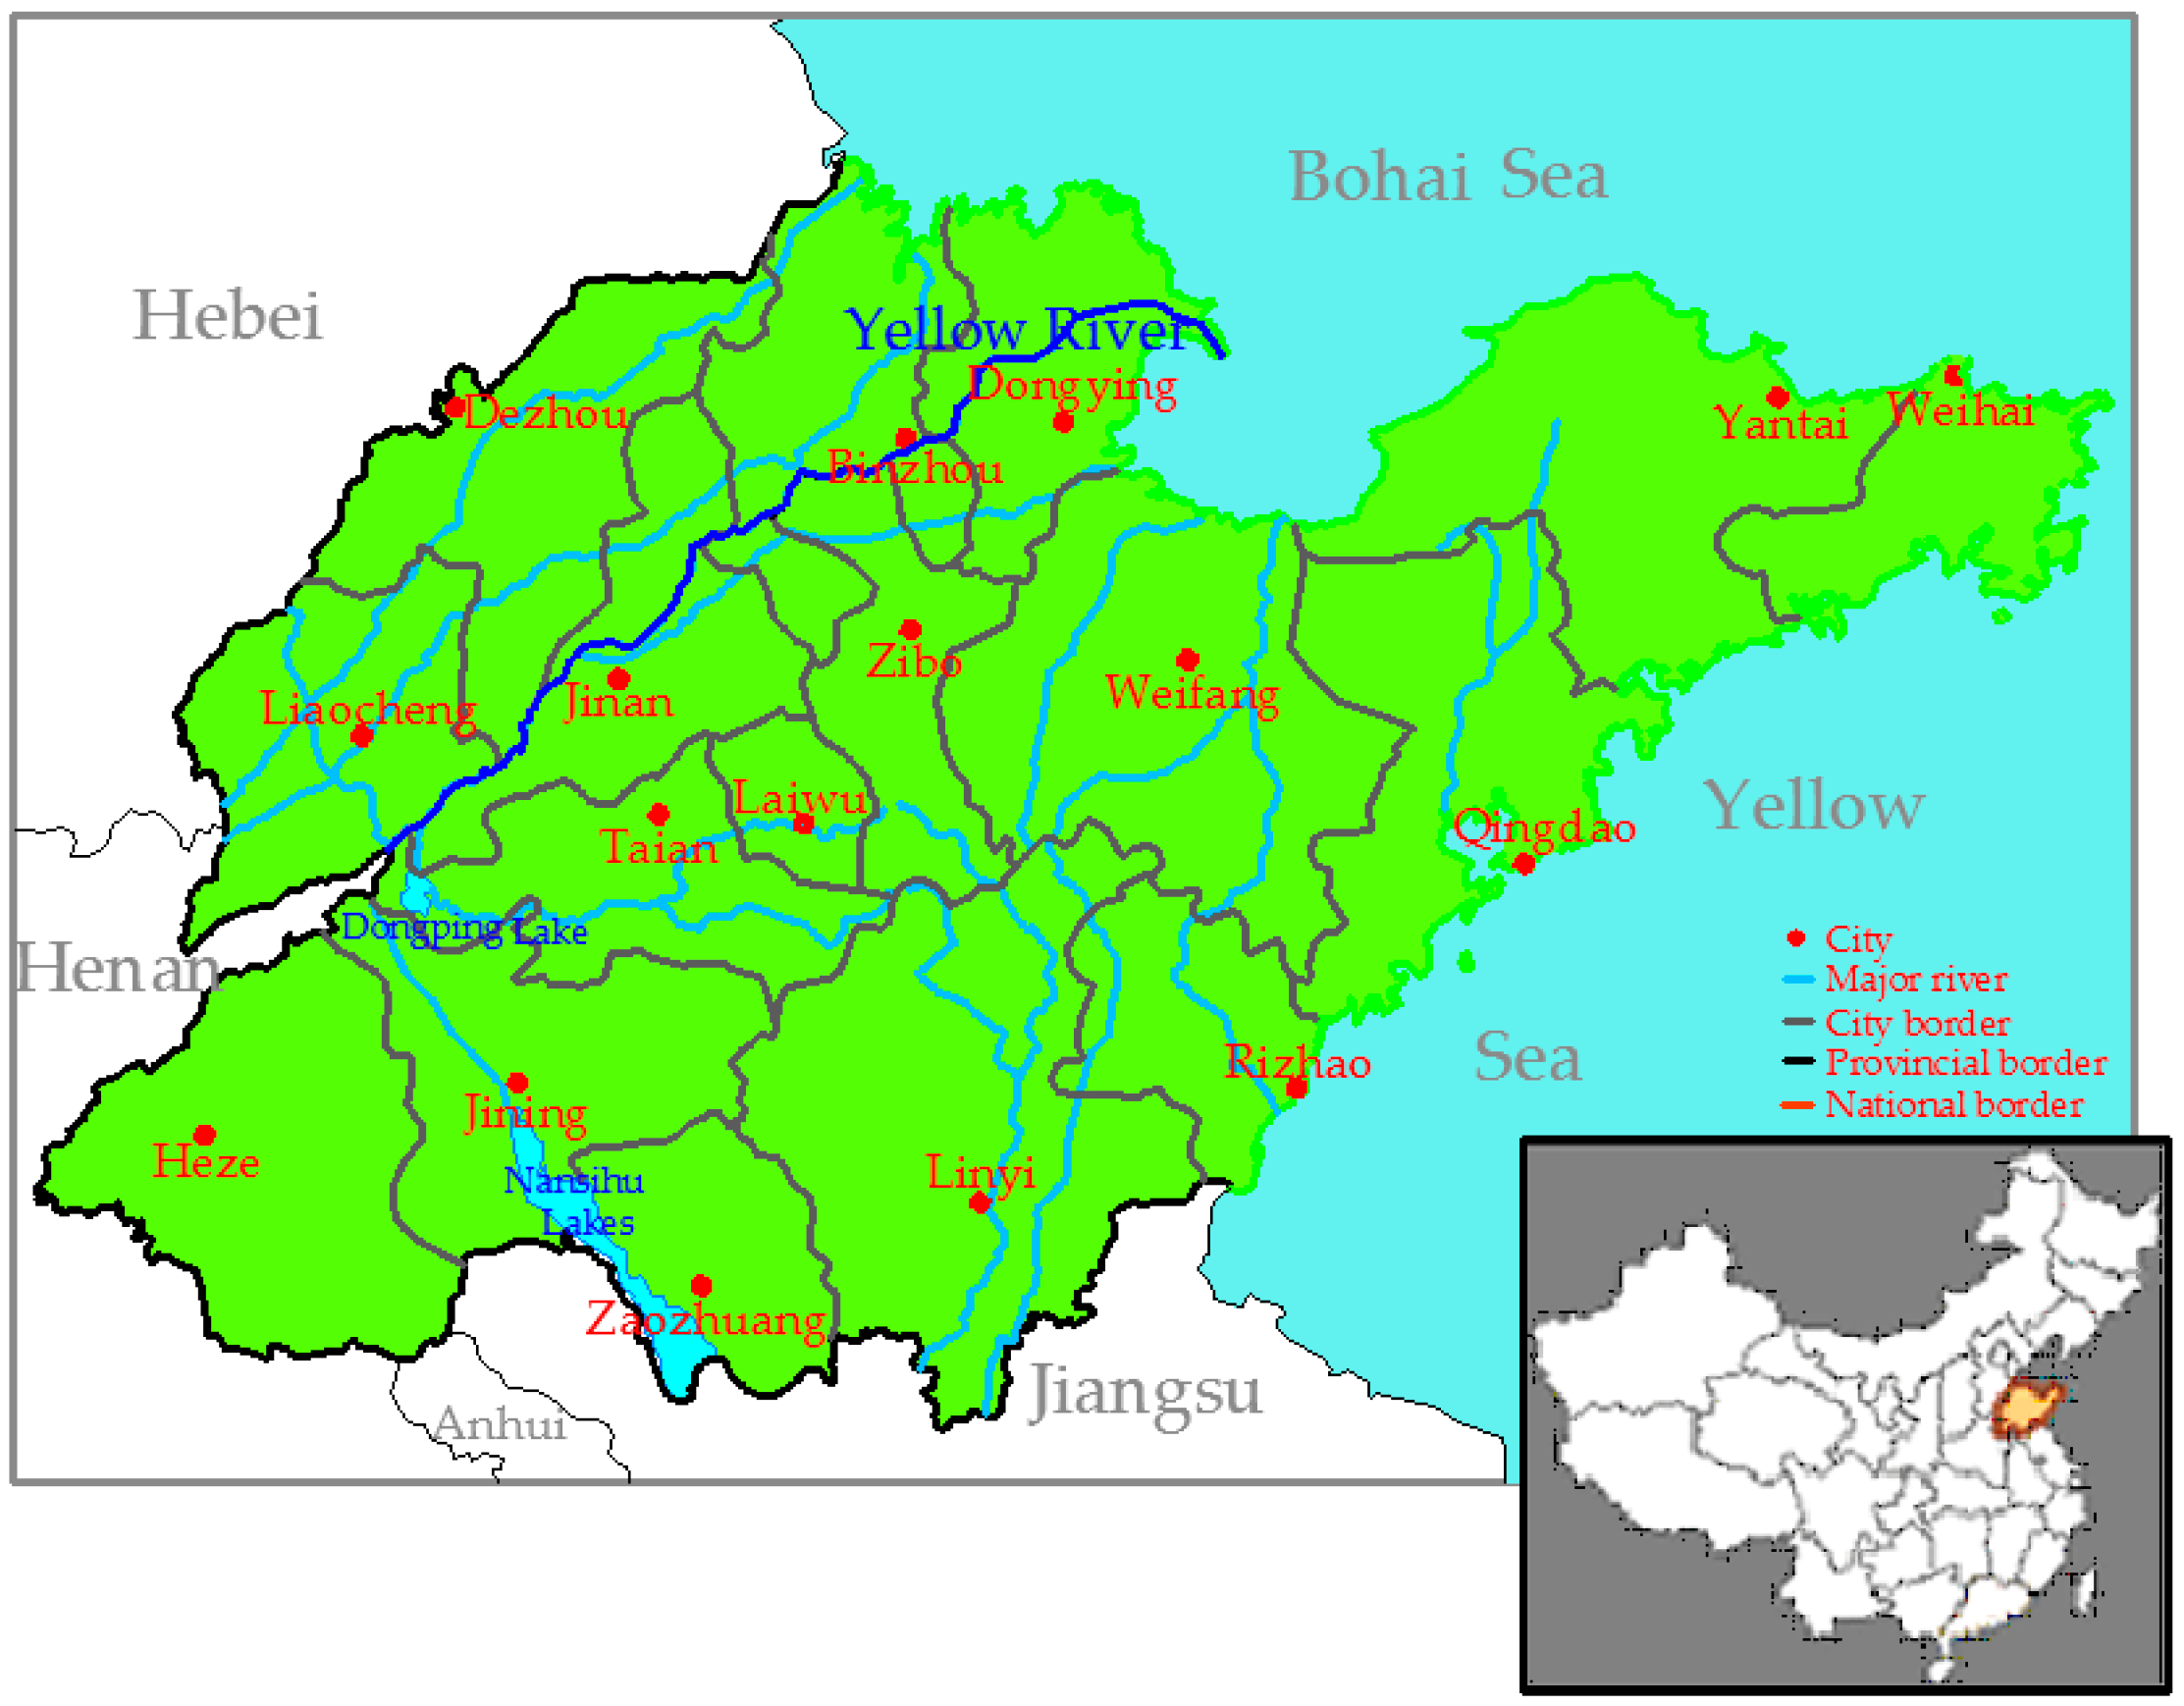
2.1. Research Area

Shandong province is located on the eastern coast of China, in the lowest reaches of the Yellow River (34°22.9′–38°24.01′ N; 114°47.5′–122°42.3′ E; Figure 1). Shandong belongs to the warm temperate monsoon region, with concentrated precipitation in summer and distinct seasons. The yearly average temperature is 11–14 °C and temperature distribution varies clearly along an east-west (rather than north-south) gradient. The province lies in a semi-arid and semi-humid region, and its water resources are mainly meteoric water. Average annual precipitation is about 676.5 mm, and runoff volume is 222.9 × 10⁹ m3. Shandong is an economically developed province with a large population, but its water resources are relatively insufficient, with frequent incidences of drought in recent years. For the above and a variety of other reasons like heterogeneous water resource distribution, aggravated water pollution and severe water waste, water managers have faced more difficult and complex water shortage problems. In low flow years, sediment deposition, abnormalities in the soil environment, and the Yellow River cutoff render the gap between water supply and demand even more severe, having significant negative impacts on the national economy and human life.
In this situation that increasingly threatens sustainable development, rational utilization and effective management of valuable water resources is particularly important; this in turn requires scientific WRSU assessment.

2.2. Methodology

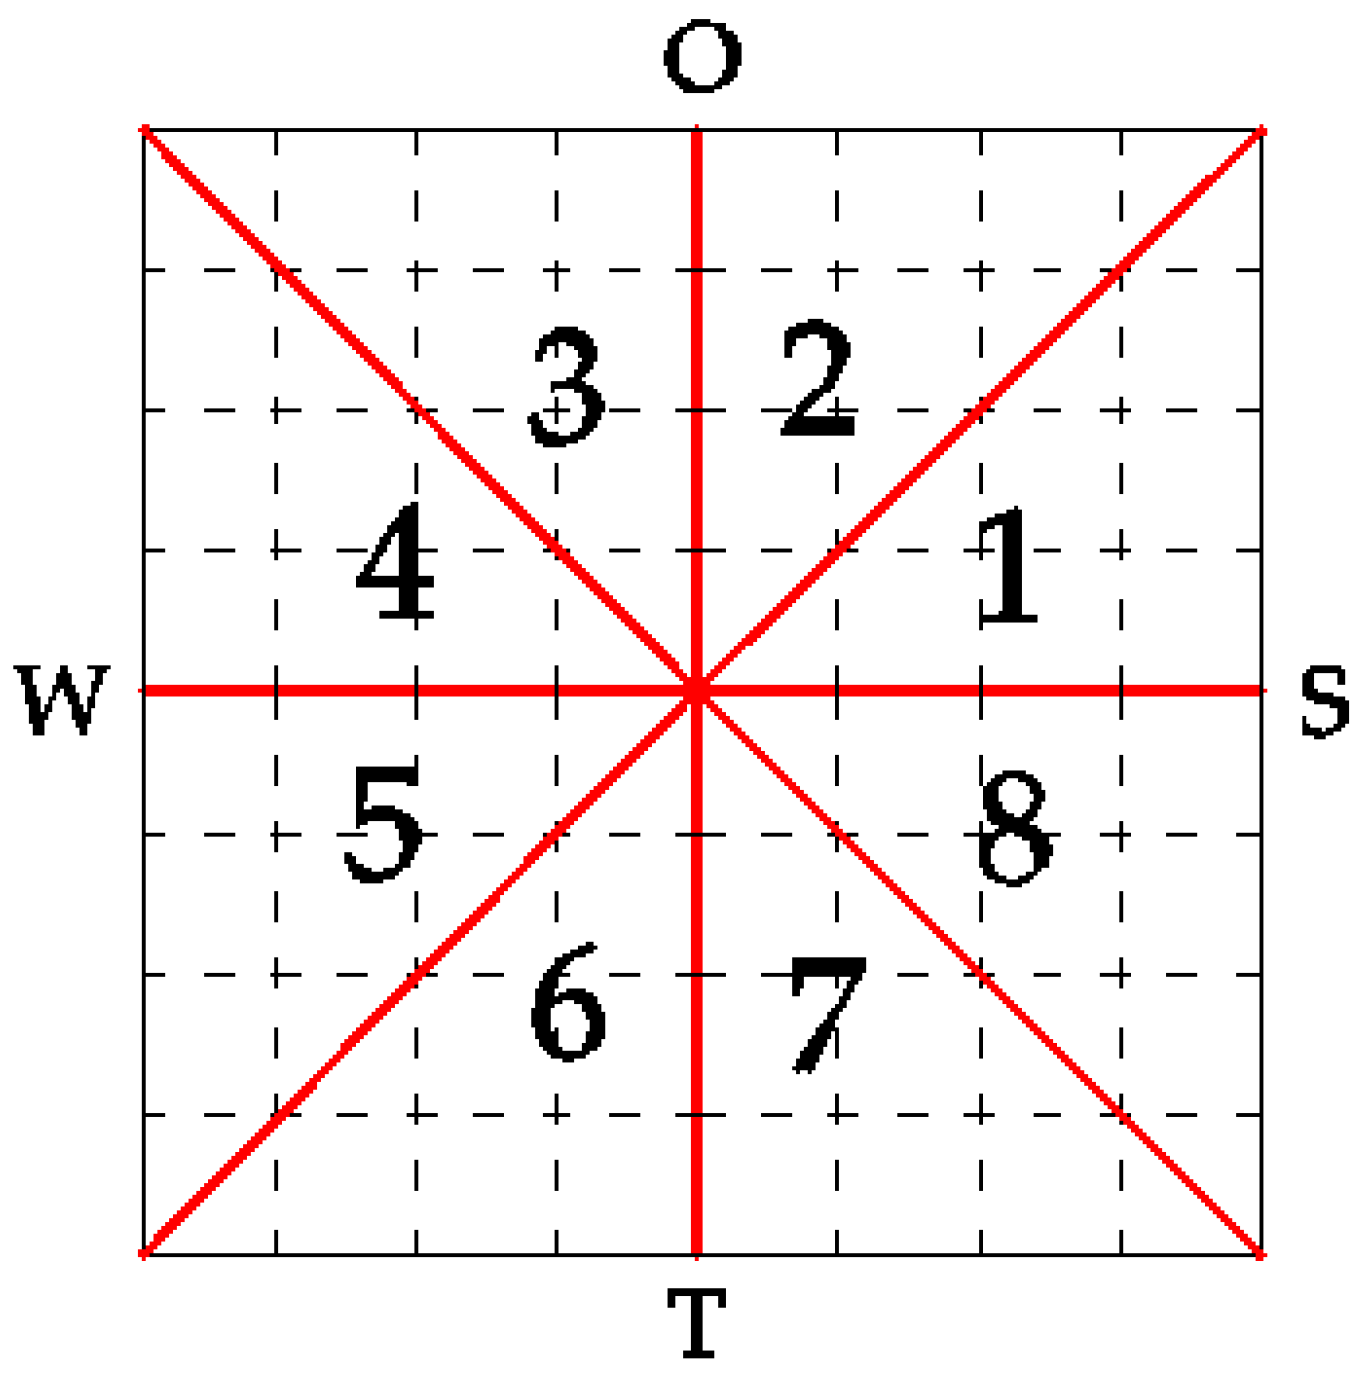
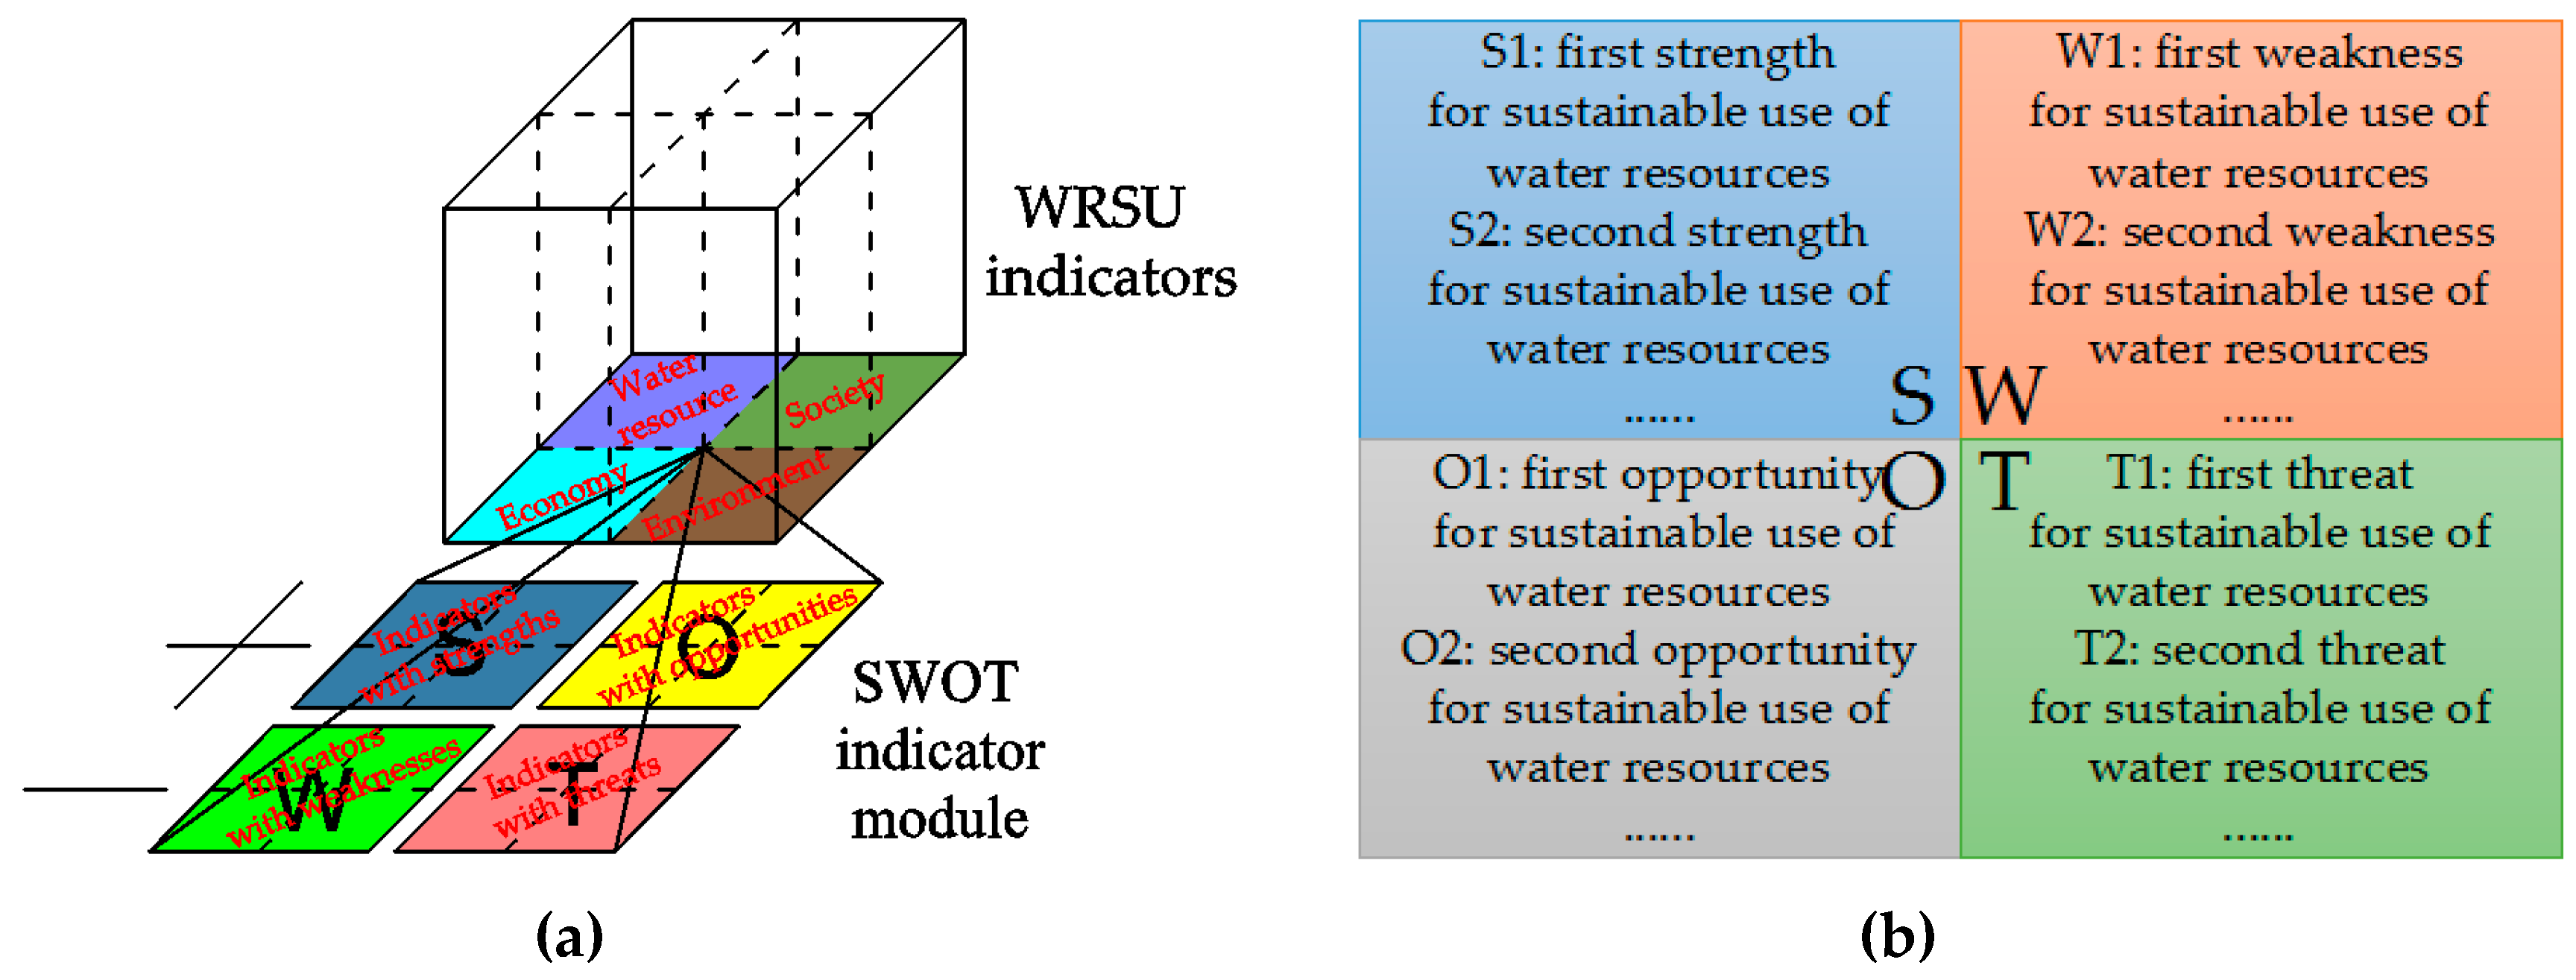
2.2.1. SWOT Analysis

SWOT analysis is a systematic and comprehensive strategy identification tool that considers factors relating to water resource systems, that is, internal and external factors [26,27]. SWOT stands for categorized internal (Strengths and Weaknesses) and external (Opportunities and Threats) factors [28,29,30]. It is also a combination of different effects, in which S and O have positive effects on the system, while W and T represent negative effects. SWOT analysis has been utilized in various fields concerned with decision-making and strategy guidance as it allows pair-wise comparisons between opportunities/threats and strengths/weaknesses [30,31,32,33,34]. This phase extends SWOT analysis to develop and select strategies.
• Strategy Development Process
Figure 2 shows the SWOT analysis matrix framework and strategy development for sustainable use of water resources. It is worth noting that strategies are defined according to the share of ideas from each SWOT element. For example, if the strategy is derived from S and O, and synthesizes two strengths and one opportunity, then it is named SO with the subtitle S, that is, SO-S type. At least one sub-type within each type group is recommended, so that cities can make the most appropriate selection.
• Strategy Selection Process
Through internal and external factors comparison, the positions of research objects can be illustrated in the SWOT coordinate diagram, shown in Figure 3, to allow analysis of strategic options.
It is evidently advantageous to be located in the first quadrant in Figure 3. Conversely, a city is relatively weak when positioned in the third quadrant. Decision-makers must be able to judge research object features with regard to meaningful suggestions and corresponding strategy types; the strategy zone is thus taken during position determination.
In the first quadrant, strengths outweigh weaknesses; opportunities outweigh threats. For strategy zone 1, there is more space to capitalize on strengths than to seize opportunities, and SO-S strategy is most suitable. For strategy zone 2, there is more space to seize opportunities than to capitalize on strengths, and SO-O strategy is most suitable.
In the second quadrant, weaknesses outweigh strengths; opportunities outweigh threats. For strategy zone 3, there is more space to seize opportunities than to avoid weaknesses, and WO-O is strategy is most suitable. For strategy zone 4, there is more space to avoid weaknesses than to seize opportunities, and WO-W strategy is most suitable.
In the third quadrant, weaknesses outweigh strengths; threats outweigh opportunities. For strategy zone 5, there is more space to avoid weaknesses than to avoid threats, and WT-W strategy is most suitable. For strategy zone 6, there is more space to avoid threats than to avoid weaknesses, and WT-T strategy is most suitable.
In the fourth quadrant, strengths outweigh weaknesses; threats outweigh opportunities. For strategy zone 7, there is more space to avoid threats than to capitalize on strengths, and ST-T strategy is most suitable. For strategy zone 9, there is more space to capitalize on strengths than to avoid threats, and ST-S strategy is most suitable.

2.2.2. Cloud Model

The cloud model (CM) is an effective tool proposed by DeYi Li in the 1990s to address uncertainty in conversions between qualitative concepts and their quantitative expressions [35]. Since there are various distribution functions, the CM can be divided into different types, including the normal cloud, half-up CM, and half-down cloud. The normal cloud model (NCM) has successfully gained general applicability and universality because several social and natural sciences phenomena are approximately subordinate to normal or semi-normal distribution [35,36,37]. The NCM is thus adopted in this study and can be defined as follows: let U be a discourse domain and let A be a qualitative concept in U. A contains three parameters to express certain digital characteristics of WRSU indicators [36,37,38,39], that is, expectation (Ex), entropy (En), and hyperentropy (He). If there exists a quantitative number x ( x U ) that is a random realization of A and satisfies expressions (1) and (2), the certainty degree of x to A is subject to Equation (3), then the distribution of x in A is a normal cloud.
x ~ N ( E x , E n 2 ) ,
E n 2 ~ N ( E x , H e 2 ) ,
y = exp ( ( x E x ) 2 2 E n 2 ) ,
Ex is the mathematical expectation of cloud drops that best represents a concept in the WRSU universal set. En measures the uncertainty of WRSU indicators. In randomness measurement terms, it represents the standard variance of indicators and in fuzzy set theory terms, it is the value range that can be accepted by the qualitative concept in discourse space. Additionally, He, as a measure of uncertainty to entropy, reveals the cohesion and randomness of its representative assessment indicator concept.
Let x i j f and x i j l be the upper and lower boundary values of the ith indicator to the jth level:
{ E x i j = ( x i j f + x i j l ) / 2 E n i j = | x i j f x i j l | / n H e = k ,
Two different theories have been summarized for Enij determination. In some studies [40,41], the parameter n had been fixed to 2.355, which mainly emphasize boundary value should have equal certainty degrees to its two adjacent levels. On the other hand, some other studies [36,38] clarify that the ‘‘3En criterion’’ of normal distribution requires 99.7% of cloud drops to be focused on [Ex − 3En, Ex + 3En]. This criterion requires n = 6 when Enij is applied to transform WRSU indicators quantitatively. In this study, we fix n to 6 as the second theory has more extensive applications.
k is a constant, and it can determine the “atomization” degree for a normal cloud. Higher value of k correlates with a greater dispersion feature of the cloud drops. k should be adjusted according to the uncertainty degree of indicators. In particular, when He = 0, the cloud model degrades into a normal membership function. Based on relevant references [36,38], assuming that k has a linear relationship with Enij: He = k = mEnij, as He is the uncertainty degree of En. Then m will be estimated using a range of values, say from 0.05 to 0.2, based on practical situation of applications.
Considered as a WRSU assessment process for various indicators, two major pillars of NCM are suggested: (a) determine the weight of an indicator to reflect its relative importance for assessment and (b) obtain precise WRSU levels according to the certainty degree and indicator weight.
  • Approach for Pillar (a)—the AHP-Entropy Method
    At present, methods of determining indicator weight can be divided into three categories.
    • Subjective weighting methods such as Delphi [42,43] and AHP [44,45,46,47,48,49,50,51]. With these methods, it is difficult to eliminate the influence of contrived factors. The final evaluation conclusion thus definitely includes subjectivity and blindness [52,53,54].
    • Objective weighting methods including entropy [55,56] and principal component analysis [48]. These ways of calculating weight unilaterally rely on pure mathematical operations without considering the real condition of the indicator itself. In practice, there are sometimes still substantial elements of disparity between the calculated weight and actual importance degree of indicator.
    • Combined weighting method. This method is intended to overcome the shortcomings of subjectively- or objectively-determined weights [57,58]. The AHP-entropy method (details in Appendix A and Appendix B), which takes into account both the data and the subjective preferences of decision-makers, is used as the solution for pillar (a) in this research.
  • Approach for Pillar (b)—the Variable Fuzzy Set Method (VFS)
The variable fuzzy set method (VFS) for ascertaining the certainty degree was introduced by Chen [59]. It takes into consideration the problems of level judgment distortion due to the maximum membership degree law. Due to its easy operation, scientific results, and clear physical meaning, VFS is used very frequently in assessments [59,60,61,62].

2.2.3. Procedure for WRSU Assessment and Strategy Development

Based on the SWOT analysis and cloud model descriptions in Section 2.2.1 and Section 2.2.2, and according to the technical approach for pillars (a) and (b), a procedure for WRSU assessment and strategy development was proposed as shown in Figure 4.
Indicator values need to be normalized before the first modeling step to eliminate dimensional differences and render indicators comparable. Generally, indicators can be divided into two categories—positive (higher value is good for WRSU level) and reverse (smaller value is good for WRSU level). Equations for positive and reverse indicators, respectively, are as follows:
x ( i , j ) = x * ( i , j ) x min ( j ) x max ( j ) x min ( j ) ,
x ( i , j ) = x max ( j ) x * ( i , j ) x max ( j ) x min ( j ) ,
where x * ( i , j ) is the origin value of the jth indicator of the ith city; x max ( j ) and x min ( j ) mark the minimum and maximum values, respectively, of the jth indicator.
The modeling procedure comprises the following steps:
Step 1: According to the special features of Shandong province and existing studies, WRSU indicators are selected from water resource, societal, economic, and environmental dimensions, which have briefly explained in Section 1 (WRSU indicators in Figure 5).
Step 2: WRSU indicators are then classified into internal and external factors. Each element (S, W, O, and T) is explored separately based on whether the factors have positive or negative effects on sustainable water resource use. Then describe each element (S, W, O, and T) qualitatively and formulate the development strategy (Figure 2). WRSU indicators are hence transformed into an indicator system with qualitative description, that is, SWOT indicator module (Figure 5).
Step 3: It was necessary to obtain assessment indicators and grading criteria for analysis. Some indicators can be acquired directly from the Statistical Yearbook of Shandong Province (2002–2012) and Shandong Water Resources Bulletin (2002–2012). Other can be obtained through relevant calculations using existing data for Shandong province.
Studies [63] have clarified that two principles should be considered to obtain indicator grading criteria: (1) when making grading criteria, we should refer to water resources laws and regulations, as well as recent water resources policy—both on the national and on the provincial levels; (2) the quantitative analysis, including economic development level and water resources can be exploited and utilized, should be done to decide whether the grading criteria are practical and operable. Based on grading criteria principles, statistical data on the provincial levels and grading criteria in widely accepted studies [11,24,25] are summarized in order to provide comparative references for our research area. Some grading criteria can be directly obtained from development plans of Shandong province [64]. For the grading criteria that cannot be obtained from previously mentioned sources, the following two steps were performed: (1) compare the provincial average levels of indicators in our research area with these in existing studies; (2) the grading criteria of existing studies are adjusted according to the proportion of provincial average levels to obtain grading criteria of our research area.
Step 4: Determine the cloud model parameters (Ex, En, He); for detailed theory, see Section 2.2.2.
Step 5: Determine the weight of different indicators. The combined weights, based on AHP and entropy methods, are calculated using maximal entropy theory and the Lagrange multiplier method, as per Equation (7) [48].
w i = ( w 1 i w 2 i ) 0.5 i = 1 m ( w 1 i w 2 i ) 0.5     ( i = 1 , 2 , 3 , , m ) ,
Here, two groups of combined weights should be calculated: (1) combined weights of WRSU indicators (wii), which are used for WRSU assessment; (2) combined weights of internal and external factors (wiin and wiex), which are used to determine cities’ positions in SWOT coordinate diagram. For wii, WRSU indicators will be calculated as a whole set of data; for wiin and wiex, internal and external factors will be calculated as two groups of separate data.
Step 6: The certainty degree matrix rij can be calculated by the forward cloud generator [29,30,31]. For assessment accuracy, the running processes can be performed repeatedly to obtain an average certainty degree matrix Rij, as shown in the following equation:
R i j = m = 1 N r i j / N ,
Step 7: The combined weights and average certainty degrees will be used as inputs for VFS to obtain comprehensive assessment scores g [60,61]:
{ g = g = 1 l g u g g = 1 l u g u g = 1 / [ 1 + ( d g a d g b ) p ] d g a = [ i = 1 m [ w i ( 1 R i j ) ] q ] 1 / q d g b = [ i = 1 m [ w i ( R i j ) ] q ] 1 / q ,
where p is the optimization guideline parameter, q is the distance parameter, and wi is the combined weight generated by Equation (7). This work adopts p = 1, q = 2. By inputs combined weights of WRSU indicators and these of internal and external factors, two groups of comprehensive assessment scores can be obtained, that is, the comprehensive assessment scores for each city and for external and internal factors, respectively.
Step 8: The comprehensive assessment scores for each city will help determine WRSU levels.
Step 9: The coordinate origin values are defined as the intermediate WRSU level (level II), providing a benchmark for external and internal assessment. Then the external and internal coordinate values can be calculated as follows [26]:
X X i = X O i X i , i = 1 , 2 , , n ,
Y Y i = Y O i Y i , i = 1 , 2 , , n ,
where XXi and YYi, represent the external and internal coordinate values of the ith city; Xi and Yi represent comprehensive assessment scores of the ith city’s external and internal factors, and XOi and YOi represent the coordinate origin value of the external and internal factors, respectively.
Step 10: During this step, the positions of all cities are illustrated in the SWOT coordinate diagram (Figure 3), to allow analysis of strategic options.

3. Case Study

3.1. Construction of WRSU Indicators and Strategy Development

This article takes the data of Shandong province in 2012 to demonstrate the model’s utility. WRSU indicators are intended to help strategy- and decision-makers have an integrated understanding of water resource, social, economic and environmental conditions that are critical for selecting strategic action. For this purpose, the selection of WRSU indicators should conform to the specific features of Shandong province, taking into account the relevant indicators in existing studies. From water resource, societal, economic, and environmental dimensions, we selected 19 variables that reflect the current WRSU levels (Figure 6a). Some indicators like I2-I3, I5-8, I11-I14 and I17-19 were gathered from the relevant literatures. The rest indicators were extracted by analyzing the significant policies from development plans of Shandong province. The water resource system components provide insights into local water resource conditions, current supply and utilization features, and existing problems. The societal and economic system components reflect their sustainability and stability under a particular water resource system. If the socio-economic system is not supported by the water resource system, it will obstruct or even go against sustainable use of water resources. The environmental system components represent pollutant discharge, pollutant treatment degree and environmental protection measures, reflecting sustainability press from environmental aspects and human consciousness of protecting environment.
SWOT analysis was then performed on the indicators (Figure 6b). Taking annual runoff depth as example, it is related to surface water resources and land area, which are both internal factors. Meanwhile, according to the data from Statistical Yearbook of Shandong Province (20022012) and Shandong Water Resources Bulletin (20022012), the annual runoff depth shows a downward trend in those years, it thus has negative effects on WESU. Annual runoff depth thus belongs to weakness. Each element (S, W, O, and T) was described qualitatively (Figure 6c), forming the SWOT indicator module, and a detailed overview of the strategies were given in Figure 7.
Grading criteria of indictors I1–I3, I6, I9–I10, I15 can be directly obtained from development plans of Shandong province. The rest are acquired according to grading criteria principles [63], grading criteria in existing studies [11,24,25] and statistical data on the provincial levels. Each indicator can be divided into 4 levels (I, II, III, IV) indicating “sustainable”, “critical sustainable”, “unsustainable”, and “totally unsustainable” situations, respectively. The symbols, descriptions, and grading criteria for these indicators are shown in Table 1.

3.2. Determination of Comprehensive Assessment Scores Based on Normal Cloud Model

The normal cloud parameters for indicators at different WRSU levels should be calculated for further computation process. Take the He of indicator I1 to level I as an example, here m is assumed as 0.05, 0.1, 0.15 and 0.2, respectively, the corresponding cloud drops are shown in Figure 8. For He = 0.05Enij, the dispersion feature is not well expressed; for He = 0.15Enij and 0.2Enij, cloud drops are too widely scattered, making the subsequent computation difficult. Further, distributions of the certainty degrees for He = 0.1Enij are ideal, of which the dispersion degree is both well expressed and distributed. In addition, the value 0.1 has been adopted in existing studies [36,38], it is thus reasonable.
Equation (4) can thus be transformed into:
{ E x i j = ( x i j f + x i j l ) / 2 E n i j = | x i j f x i j l | / 6 H e = 0.1 E n i j ,
(Ex, En, He) for indicators at different WRSU levels are shown in Table 2. The paired comparisons of indicators have been made to reflect their relative importance. By establishing consistent judgment matrix and performing consistent checks (Equations (1) and (2) in Appendix A), the subjective weight (AHP) can be obtained. Then objective weight (entropy) can be calculated by Equations (3)–(6) in Appendix B. Combined weights, as generated using the AHP-entropy method, are calculated using Equation (7). Weight results for the three techniques are given in Table 3. Meanwhile, the distributions of certainty degree for different levels are obtained by repeating calculations and subsequent conversion into the average certainty degrees matrix Rij. The weights in Table 3 and the average certainty degrees will be used as inputs for VFS, and Equation (9) are then employed to calculate the comprehensive assessment scores.
The comprehensive assessment scores (1.00–2.00, 2.00–3.00, 3.00–4.00) correspond to the WRSU levels (I–II, II–III, III–IV), respectively, as shown in Figure 9. By taking the external and internal factors and using Equations (10) and (11), two groups of data used to show the position of a city, that is, the comprehensive assessment scores of external and internal factors, and the coordinate values which help allocate all locations into one of the four quadrants, can be obtained (Table 4).

3.3. WRSU Assessment of Shandong Province

The spatial distribution of WRSU levels is depicted in Figure 10, according to WRSU comprehensive assessment scores of each city (see second column in Table 4).
From Table 4 and Figure 10, it can be observed that the WRSU levels for Jinan, Weihai, Binzhou, Laiwu, and Zibo are between I and II; WRSU assessment results in these cities are therefore very favorable, allowing for considerable social and economic development. A low natural population growth rate and strong sewage treatment capacities have contributed significantly to the stability of these cities. Taking Jinan and Zibo as examples, their wastewater treatment efficiencies are as high as 82% and 60%, while per capita GDP is 6.94 × 10⁴ Yuan and 7.78 × 10⁴ Yuan, respectively. The figures are all higher than the provincial average values. Based on the present situation, these cities can not only meet current social development needs, but also guarantee a certain period during which they will be able to meet future water demand.
For western areas of Shandong province, including Zaozhuang, Heze, Jining, and Liaocheng, WRSU levels are between III and IV. It is thus evident that they are in a serious situation tending towards unsustainable, due to their large population, lower per capita water resources, and increasing water demands for social and economic development. Additionally, indicators related to GDP growth and environmental pollution control in these cities all point to a grave situation, with prevailing water shortages across these areas. For example, in Jining, wastewater treatment efficiency is as low as 23%, which is located the bottom 6 in this province, and wastewater discharge is up to 2.27 × 10⁴ t/km2, leading to an increase in sewage generation. It is feared that such increase can pose threats on the environment such as water pollution and habitat destruction.
For the remaining cities in the southern and coastal areas of Shandong province, WRSU levels are between II and III. In these areas, social and economic development is lagging but water resource utilization ratios are increasing. These increase vulnerability by creating a wider gap between water supply and demand. Efforts are underway to reduce the gap but this city still has a long way to go to achieve sustainable use of water resources. In summary, the mean comprehensive assessment score is 2.4402, indicating that most cities are in an unsustainable situation.

3.4. Strategy Selection for Sustainable Use of Water Resources

Using the coordinate values (Table 4), the strategic position of the evaluated cities can be easily depicted in Figure 11. This can help decision-makers make the most suitable management decisions based on the SWOT analysis matrix for strategy development (Figure 7).
Figure 11 indicates that Binzhou, Weihai, Zibo, and Laiwu are located in the first quadrant, indicative of their external development opportunities and internal competitiveness. They are thus in the best position to face threats and weaknesses. As Laiwu is located in strategy zone 2, there is a gap between it and other cities located in strategy zone 1. In other words, it has more space to seize opportunities than to capitalize on strengths, so an SO-O strategy should be selected, while an SO-S strategy is more suitable for others. Conversely, Weifang, Yantai, Zaozhuang, Heze, Liaocheng, and Jining face serious threats and inherent weaknesses. They must hence not only strive for the most suitable market to avoid threats but also enhance internal competition. Weifang and Yantai are located in strategy zone 5; they should thus adopt WT-W strategy, while WT-T strategy should be adopted by the rest cities. For the cities located in the second quadrant, although they have opportunities, the weaknesses it face cannot be ignored. Taking into account the different strategy zones, WO-O and WO-W strategy should be adopted Linyi and the other two cities (Dezhou and Taian), respectively. Furthermore, Jinan, Qingdao, Dongying, and Rizhao are located in the fourth quadrant, indicating that they have strengths but that threats cannot be ignored. Considering the different strategy zones for cities in the fourth quadrants, the ST-S strategy should be implemented in Jinan and the ST-T strategy in Qingdao, Dongying, and Rizhao.

4. Discussion

4.1. Comparison Results of Three Evaluation Methods

The WRSU assessment results play a decisive role in this research, reflecting current WRSU levels and directly influencing strategy determination. To verify the rationality and validity of the NCM for WRSU assessment, two conventional evaluation methods, fuzzy comprehensive evaluation (FCE) and projection pursuit method (PP), were also employed for comparison. The computational processes for FCE and PP have been described by Lee et al. [65,66,67] and Ghasemi et al. [68,69], respectively. The assessment results for analysis are summarized in Table 5.
  • From the perspective of WRSU level rank, the spatial distribution of WRSU levels based on NCM accorded well with results from two conventional methods. Due to the different theoretical basis of the methods, there were slight deviations but this is understandable. The top five cities are Jinan, Laiwu, Binzhou, Weihai, and Zibo, with the southern and coastal areas of Shandong province showing a similar ranking result (between 6 and 14). The very low sustainability areas are mainly located in the western area. In general, when comparing NCM and FCE, 82.35% (14/17) of the city ranking positions remain unchanged; this ratio is 76.5% (13/17) for NCM and PP. There is thus sufficient evidence to indicate the considerable reliability of the cloud model.
  • The assessment results can be divided into two types—the WRSU levels and comprehensive scores—according to their implications. Taking Zaozhuang as an example, for FCE and PP, the values 0.3827 and 1.5178 are comprehensive scores; they reveal the relative WRSU level rank when compared with other cities, and the numbers alone are not useful. Comparatively, it can be seen that the score of NCM 3.0027 indicates that the WRSU level is between levels II and III, but it also further reveals the WRSU position by ranking with values.
  • By employing the VFS to calculate assessment scores, rather than considering only the final WRSU levels, more information can be obtained. For instance, the western areas of Shandong province all rank between III and IV, where their comprehensive assessment scores are 3.0027, 3.1178, 3.1455, and 3.4457, respectively. This difference indicates that Liaocheng has a higher likelihood of being at level IV compared with Zaozhuang, Heze and Jining. NCM therefore displays a more competitive solution when dealing with the WRSU levels.

4.2. Limitations in the Methodology Application

Because of the uncertainties of NCM parameters, data limitations and changes of national policies, the methodology is not without its limitations:
The cloud model parameter hyperentropy (He) need to be determined, but there are no fixed principles and guidelines for He determination. A variety of studies determine He values of different indicators by assuming the linear functions linking He to En (He = kEn). The coefficient k is obtained by engineers’ estimation, thus making the results have a certain subjectivity.
The construction of WRSU indicators within this study is based on the data available at the time. Only indicators related to pollutant emission and treatment have been taken into account in environmental system. However, it is quite obvious that other indicators (such as vegetation coverage rate and urban green space irrigation quota) are also closely related to environment aspect. For example, a decrease in vegetation coverage rate would affect greening level and environmental sustainability.
Another aspect which could be afforded improvement is the classification of each element (S, W, O, and T) for strategy development. As each indicator is classified based on its effect on the system, we have distinguished these indicators by observing the trend of historical data. However, the accuracy is insufficient since some historical curves of indicators are not consistently rising or falling. Hence, a supplemental analysis that quantifies the effect of indicator on WRSU needs futher study. Furthermore, implementation of national policies and their changes, undoubtedly disturbe the application of development strategies proposed in this paper. Forecasting of national development trends in combination by presetting different strategy scenarios could be more flexible for strategy application in the future.

5. Conclusions

The goal of this study was to identify a practical assessment model to be used for analyzing WRSU, and to recommend strategic measures that would reinforce sustainable water use practices. An integrated framework using SWOT analysis and the NCM was successfully applied to WRSU assessment and the identification of development strategies. Stemming from water resource, societal, economic, and environmental dimensions of WRSU indicators, and guided by the strategy-oriented principle, this study integrates the four dimensions with SWOT analysis to develop indicators and select strategies. Considering that evaluation models currently used cannot account for randomness and fuzziness in the process of indicator quantification and grading, this study used a normal cloud model for WRSU assessment. Finally, comprehensive assessment scores were obtained using the variable fuzzy set method. The proposed WRSU assessment and strategy development method was applied to Shandong province, China, as a case study, to demonstrate a more detailed modeling procedure. Its main conclusions can be summarized as follows:
  • WRSU levels for Jinan, Weihai, Binzhou, Laiwu, and Zibo are between I and II; WRSU assessment results in these cities are therefore favorable. In western areas of Shandong province, including Heze, Jining, and Liaocheng, WRSU levels are between III and IV, making it evident that they are facing serious issues and tending towards unsustainable. For remaining cities in the southern and coastal areas of Shandong province, WRSU levels are between III and IV. These cities still have a long way to go to achieve sustainable use of water resources. In summary, most cities are in an unsustainable situation.
  • Binzhou, Weihai, Zibo, and Laiwu have external development opportunities and internal competitiveness. They are thus in the best position to face threats and weaknesses. Develop ecological agriculture will be helpful for Laiwu; it will be useful for others to take advantage of economic prosperity to develop ecological tourism and improve water treatment level. Conversely, Weifang, Yantai, Zaozhuang, Heze, Liaocheng, and Jining face serious threats and have inherent weaknesses. Weifang and Yantai should develop labor-intensive industry, while the others should develop energy saving and emission reduction technology and resource recycling industry. In addition, Linyi, Dezhou, and Taian have both opportunities and weaknesses, as they are located in the second quadrant. Water resources optimal allocation will be an effective way for Linyi to improve WRSU level; optimization of water supply structure and energy revolution will be beneficial to others. Furthermore, Jinan, Qingdao, Dongying, and Rizhao are located in the fourth quadrant, indicating that they have strengths but that threats cannot be ignored. Jinan should pay attention to ecological concept promotion, circular economy and water-saving irrigation technology; the others should lay emphasis on optimization of economic structure.
  • The spatial distribution of WRSU levels by NCM showed high accordance with results obtained via two conventional evaluation methods, that is, fuzzy comprehensive evaluation (FCE) and projection pursuit method (PP). The comparison illustrated that the cloud model is an effective, reasonable, and scientific method to assess WRSU. The NCM assessment scores are also a more competitive solution when considering WRSU levels; they can not only reflect the WRSU levels, but also indicate the likelihood to be one level.
Overall, our research provides an important point of reference for determining WRSU levels and developing sustainable water use strategies. The approach presented in this study offers a new and effective way to assess WRSU and propose development strategies. In future studies, this method can be used to assessment and strategy development of water resource vulnerability, carrying capacity, and other relevant dimensions.

Acknowledgments

The research was supported by the National Science and Technology Support Program of China (2015BAB07B02), Science Fund for Creative Research Groups of the National Natural Science Foundation of China (Grant No. 51621092).

Author Contributions

Xueping Gao proposed the research idea and co-wrote the main manuscript. Lingling Chen designed the model and analyzed the data. Bowen Sun co-wrote and revised the paper. Yinzhu Liu completed the strategy development part in this research. All authors reviewed the manuscript.

Conflicts of Interest

The authors declare no conflict of interest.

Appendix A. Overview of the Analytic Hierarchy Process (AHP)

AHP is a multi-layer mathematical analysis model based on qualitative opinions and quantitative analysis. A hierarchical tree model is first created on the basis of the assessment indicator system related to the decision problem, which is composed of three layers, that is, goal, criteria, and indicators. Then, pair-wise comparisons for each hierarchy are constructed (Table A1), and consistency checks are considered as indispensable, given that decision-makers usually have inconsistent judgments.
Table A1. Relative Importance Degree of Indicators.
Assessment ScoresDescriptions
1Indicator Ii is equal important to indicator Ij
3Indicator Ii is slight important than indicator Ij
5Indicator Ii is obvious important than indicator Ij
7Indicator Ii is strong important than indicator Ij
9Indicator Ii is extreme important than indicator Ij
2,4,6,8Intermediate values of the above importance
ReciprocalIf Ii/Ij = cij, then Ij / Ii = 1 / cij
Consistency ratio (CR), estimated by Equations (A1) and (A2), measures the error made by decision-makers and consistency is considered to be satisfying when CR < 0.1.
C I = λ max m m 1 ,
C R = C I R I ,
Herein, C and λ max stands for the pair-wise comparison matrix and its maximum eigenvalue, respectively.
Then the priority weight can be obtained from C by calculating the eigenvector of the corresponding maximum eigenvalue. The weights of each layer to the previous one can thus be calculated. Finally, the weight of the indicator to the overall goal, that is, AHP weight, can be obtained by multiplying all the weights of each layer.

Appendix B. Entropy Weighting Method

Entropy is derived from thermodynamics in physics. It is a measure of how disordered a system is and indicates the amount of helpful information provided by the data. The idea is that entropy represents the role of the indicator in comprehensive evaluation. When the indicator values are evidently dispersed, this indicator provides greater effectiveness of information, entropy is lower, and the priority weight of the factor is higher, and vice versa. If the values of one indicator are equal or very close to all objects, then comprehensive evaluation indicates that this is unlikely to work.
Let Gij be the original assessment indicator matrix consisting of m samples and n indicators. The weight of the indicator can then be calculated after obtaining the normalized matrix of original data gij.
The specific formula is as follows:
w i = 1 H i m i = 1 m H i     ( 0 w i 1 , i = 1 m w i = 1 ) ,
where Hij is obtained by the equations below:
f i j = g i j j = 1 n g i j ,
H i = k j = 1 n f i j ln f i j ,
k = 1 ln n ,
where Hi and Wi represent the entropy and weight of indicator i, respectively, and assuming that when fij = 0, fijlnfij = 0; k is the Boltzmann constant.

References

  1. Nazer, D.W.; Siebel, M.A.; Van der Zaag, P.; Mimi, Z.; Gijzen, H.J. A financial, environmental and social evaluation of domestic water management options in the West Bank, Palestine. Water Resour. Manag. 2010, 24, 4445–4467. [Google Scholar] [CrossRef]
  2. Awad, W.R. The problem of utilization the water resources of the Republic of Iraq under progressive desertification conditions. Geogr. Nat. Resour. 2014, 35, 373–397. [Google Scholar] [CrossRef]
  3. Boyacioglu, H.; Boyacioglu, H. Utilization of statistics based classification approach to investigate water supply profile of Turkey. Environ. Monit. Assess. 2009, 152, 403–411. [Google Scholar] [CrossRef] [PubMed]
  4. Le, R.B.; van der Laan, M.; Vahrmeijer, T.; Bristow, K.L.; Annandale, J.G. Establishing and testing a catchment water footprint framework to inform sustainable irrigation water use for an aquifer under stress. Sci. Total Environ. 2017, 599–600, 1119–1129. [Google Scholar] [CrossRef]
  5. Zijp, M.C.; Sl, W.D.L.; Heijungs, R.; Broeren, M.L.; Peeters, R.; Van, N.A.; Shen, L.; Heugens, E.H.W.; Posthuma, L. Method selection for sustainability assessments: The case of recovery of resources from waste water. J. Environ. Manag. 2017, 197, 221–230. [Google Scholar] [CrossRef] [PubMed]
  6. Manju, S.; Sagar, N. Renewable energy integrated desalination: A sustainable solution to overcome future fresh-water scarcity in India. Renew. Sustain. Energy Rev. 2017, 73, 594–609. [Google Scholar] [CrossRef]
  7. Al-Kalbani, M.S.; Price, M.F.; Abahussain, A.; Ahmed, M.; O’Higgins, T. Vulnerability assessment of environmental and climate change impacts on water resources in Al Jabal Al Akhdar, Sultanate of Oman. Water 2014, 6, 3118–3135. [Google Scholar] [CrossRef]
  8. Akbal, F.; Gürel, L.; Bahadır, T.; İlknur, G.; Bakan, G.; Büyükgüngör, H. Multivariate statistical techniques for the assessment of surface water quality at the mid-black sea coast of Turkey. Water Air Soil Pollut. 2011, 216, 21–37. [Google Scholar] [CrossRef]
  9. Koop, S.H.A.; van Leeuwen, C.J. Assessment of the sustainability of water resources management: A critical review of the city blueprint approach. Water Resour. Manag. 2015, 29, 5649–5670. [Google Scholar] [CrossRef]
  10. Li, D.; Liu, C.; Gan, W. A new cognitive model: Cloud model. Int. J. Intell. Syst. 2009, 24, 357–375. [Google Scholar] [CrossRef]
  11. Hamouda, M.A.; Nour El-Din, M.M.; Moursy, F.I. Vulnerability assessment of water resources systems in the Eastern Nile Basin. Water Resour. Manag. 2009, 23, 2697–2725. [Google Scholar] [CrossRef]
  12. Yilmaz, B.; Harmancioglu, N.B. An indicator based assessment for water resources management in Gediz River Basin, Turkey. Water Resour. Manag. 2010, 24, 4359–4379. [Google Scholar] [CrossRef]
  13. Vermeulen, I.; Block, C.; Caneghem, J.V.; Dewulf, W.; Sikdar, S.K.; Vandecasteele, C. Sustainability assessment of industrial waste treatment processes: The case of automotive shredder residue. Resour. Conserv. Recycl. 2012, 69, 17–28. [Google Scholar] [CrossRef]
  14. Hara, K.; Uwasu, M.; Yabar, H.; Zhang, H. Sustainability assessment with time-series scores: A case study of Chinese provinces. Sustain. Sci. 2009, 4, 81–97. [Google Scholar] [CrossRef]
  15. Pülzl, H.; Prokofieva, I.; Berg, S.; Rametsteiner, E.; Aggestam, F.; Wolfslehner, B. Indicator development in sustainability impact assessment: Balancing theory and practice. Eur. J. For. Res. 2012, 131, 35–46. [Google Scholar] [CrossRef]
  16. Sandoval-Solis, S.; Mc Kinney, D.C.; Loucks, D.P. Sustainability index for water resources planning and management. J. Water Res. Plan. Manag. 2010, 137, 381–390. [Google Scholar] [CrossRef]
  17. Wang, Q.; Yuan, X.; Zhang, J.; Gao, Y.; Hong, J.; Zuo, J.; Liu, W. Assessment of the sustainable development capacity with the entropy weight coefficient method. Sustainability 2015, 7, 13542–13563. [Google Scholar] [CrossRef]
  18. Balkema, A.J.; Preisig, H.A.; Otterpohl, R.; Lambert, F.J.D. Indicators for the sustainability assessment of wastewater treatment systems. Urban. Water 2002, 4, 153–161. [Google Scholar] [CrossRef]
  19. Ma, H.; Shi, C.; Chou, N. China’s water utilization efficiency: An analysis with environmental considerations. Sustainability 2016, 8, 516. [Google Scholar] [CrossRef]
  20. Ma, H.; Chou, N.; Wang, L. Dynamic coupling analysis of urbanization and water resource utilization systems in China. Sustainability 2016, 8, 1176. [Google Scholar] [CrossRef]
  21. Zhang, J.; Wang, L. Assessment of water resource security in Chongqing city of China: What has been done and what remains to be done? Nat. Hazards 2015, 17, 2751–2772. [Google Scholar] [CrossRef]
  22. Aydin, N.Y.; Mays, L.; Schmitt, T. Sustainability assessment of urban water distribution systems. Water Resour. Manag. 2014, 28, 4373–4384. [Google Scholar] [CrossRef]
  23. Aydin, N.Y.; Mays, L.; Schmitt, T. Technical and environmental sustainability assessment of water distribution systems. Water Resour. Manag. 2014, 28, 4699–4713. [Google Scholar] [CrossRef]
  24. Zhao, J.; Jin, J.; Zhu, J.; Xu, J.; Hang, Q.; Chen, Y.; Han, D. Water resources risk assessment model based on the subjective and objective combination weighting methods. Water Resour. Manag. 2016, 30, 3027–3042. [Google Scholar] [CrossRef]
  25. Gong, L.; Jin, C. Fuzzy comprehensive evaluation for carrying capacity of regional water resources. Water Resour. Manag. 2009, 23, 2505–2513. [Google Scholar] [CrossRef]
  26. Menga Ebonzo, A.D.; Liu, X. The use of axiomatic fuzzy set theory in AHP and TOPSIS methodology to determine strategies priorities by SWOT analysis. Qual. Quant. 2013, 47, 2671–2685. [Google Scholar] [CrossRef]
  27. Arsić, S.; Nikolić, D.; Živan, Ž. Hybrid SWOT-ANP-FANP model for prioritization strategies of sustainable development of ecotourism in national park Djerdap, Serbia. For. Policy Econ. 2017, 80, 11–26. [Google Scholar] [CrossRef]
  28. Dzonzi-Undi, J.; Li, S. SWOT analysis of safety and environmental regulation for China and USA: Its effect and influence on sustainable development of the coal industry. Environ. Earth Sci. 2015, 74, 6395–6406. [Google Scholar] [CrossRef]
  29. Arabzad, S.M.; Ghorbani, M.; Razmi, J.; Shirouyehzad, H. Employing fuzzy TOPSIS and SWOT for supplier selection and order allocation problem. Int. J. Adv. Manuf. Technol. 2015, 76, 803–818. [Google Scholar] [CrossRef]
  30. Nagara, G.; Lam, W.H.; Lee, N.C.H.; Othman, F.; Shaaban, M.G. Comparative SWOT analysis for water solutions in Asia and Africa. Water Resour. Manag. 2015, 29, 125–138. [Google Scholar] [CrossRef]
  31. Srdjevic, Z.; Bajcetic, R.; Srdjevic, B. Identifying the criteria set for multicriteria decision making based on SWOT/PESTLE Analysis: A case study of reconstructing a water intake structure. Water Resour. Manag. 2012, 26, 3379–3393. [Google Scholar] [CrossRef]
  32. Rauch, P. SWOT analyses and SWOT strategy formulation for forest owner cooperations in Austria. Eur. J. For. Res. 2007, 126, 413–420. [Google Scholar] [CrossRef]
  33. Gasperi, D.; Pennisi, G.; Rizzati, N.; Magrefi, F.; Bazzocchi, G.; Mezzacapo, U.; Stefani, M.C.; Sanye-Mengual, E.; Orsini, F.; Gianquinto, G. Towards regenerated and productive vacant areas through urban horticulture: Lessons from Bologna, Italy. Sustainability 2016, 8, 1347. [Google Scholar] [CrossRef]
  34. Lee, K.L.; Huang, W.; Teng, J. Locating the competitive relation of global logistics hub using quantitative SWOT analytical method. Qual. Quant. 2009, 43, 87–107. [Google Scholar] [CrossRef]
  35. Qin, K.; Xu, K.; Liu, F.; Li, D. Image segmentation based on histogram analysis utilizing the cloud model. Comput. Math. Appl. 2011, 62, 2824–2833. [Google Scholar] [CrossRef]
  36. Wu, G.; Duan, K.; Zuo, J.; Zhao, X.; Tang, D. Integrated sustainability assessment of public rental housing community based on a hybrid method of AHP-Entropy weight and cloud model. Sustainability 2017, 9, 603. [Google Scholar] [CrossRef]
  37. Wang, J.; Niu, T.; Wang, R. Research and application of an air quality early warning system based on a modified least squares support vector machine and a cloud model. Int. J. Environ. Res. Public Health 2017, 14, 249. [Google Scholar] [CrossRef] [PubMed]
  38. Wang, D.; Liu, D.; Li, T.; Ding, H.; Singh, V.P.; Wang, Y.; Zeng, X. A cloud model-based approach for water quality assessment. Environ. Res. 2016, 148, 24–35. [Google Scholar] [CrossRef] [PubMed]
  39. Zhang, L.; Wu, X.; Chen, Q.; Ding, H.; Skibniewski, M.J.; Zhong, J. Developing a cloud model based risk assessment methodology for tunnel-induced damage to existing pipelines. Stoch. Environ. Res. Risk Assess. 2015, 29, 513–526. [Google Scholar] [CrossRef]
  40. Zhang, Y.; Yan, J.; Jiang, P.; Yang, N. Normal cloud model based evaluation of land resources ecological security in Hubei province. Trans. CSAE 2013, 29, 252–258. (In Chinese) [Google Scholar]
  41. Zhou, Q.; Zhang, X.; Wang, Z. Land use ecological risk evaluation in three gorges reservoir area based on normal cloud model. Trans. CSAE 2014, 30, 289–297. (In Chinese) [Google Scholar]
  42. Strand, J.; Carson, R.T.; Navrud, S.; Ortiz-Bobea, A.; Vincent, J.R. Using the Delphi method to value protection of the Amazon rainforest. Ecol. Econ. 2017, 131, 475–484. [Google Scholar] [CrossRef]
  43. Demidova, L.A. Multicriteria ranking of segments of urban engineering service networks by contradictory data using the Delphi method and Multiset theory. Autom. Doc. Math. Linguist. 2007, 41, 255–260. [Google Scholar] [CrossRef]
  44. Palchaudhuri, M.; Biswas, S. Application of AHP with GIS in drought risk assessment for Puruliya district, India. Nat. Hazards 2016, 84, 1905–1920. [Google Scholar] [CrossRef]
  45. Alsabbagh, M.; Siu, Y.L.; Guehnemann, A.; Barrett, J. Integrated approach to the assessment of CO2 e-mitigation measures for the road passenger transport sector in Bahrain. Renew. Sustain. Energy Rev. 2016, 71, 203–215. [Google Scholar] [CrossRef]
  46. Nicu, I.C. Cultural heritage assessment and vulnerability using analytic hierarchy process and geographic information systems (Valea Oii catchment, North-eastern Romania). An approach to historical maps. Int. J. Disast. Risk Reduct. 2016, 20, 103–111. [Google Scholar] [CrossRef]
  47. Jhariya, D.C.; Kumar, T.; Dewangan, R.; Pal, D.; Dewangan, P.K. Assessment of groundwater quality index for drinking purpose in the Durg district, Chhattisgarh using Geographical Information System (GIS) and Multi-Criteria Decision Analysis (MCDA) techniques. J. Geol. Soc. India 2017, 89, 453–459. [Google Scholar] [CrossRef]
  48. Rybczyńska, K.; Korniłłowicz-Kowalska, T. Evaluation of dye compounds’ decolorization capacity of selected H. haematococca and T. harzianum strains by principal component analysis (PCA). Water Air. Soil Pollut. 2015, 226, 1–15. [Google Scholar] [CrossRef] [PubMed]
  49. Parinet, B.; Lhote, A.; Legube, B. Principal component analysis: An appropriate tool for water quality evaluation and management–application to a tropical lake system. Ecol. Model. 2004, 178, 295–311. [Google Scholar] [CrossRef]
  50. Stefanidis, S.; Stathis, D. Assessment of flood hazard based on natural and anthropogenic factors using analytic hierarchy process (AHP). Nat. Hazards 2013, 68, 569–585. [Google Scholar] [CrossRef]
  51. Kim, S.E.; Seo, I.W.; Choi, S.Y. Assessment of water quality variation of a monitoring network using exploratory factor analysis and empirical orthogonal function. Environ. Modell. Softw. 2017, 91, 21–35. [Google Scholar] [CrossRef]
  52. Vahidnia, M.H.; Alesheikh, A.A.; Alimohammadi, A. Hospital site selection using fuzzy AHP and its derivatives. J. Environ. Manag. 2009, 90, 3048–3056. [Google Scholar] [CrossRef] [PubMed]
  53. Choudhary, D.; Shankar, R. An STEEP-fuzzy AHP-TOPSIS framework for evaluation and selection of thermal power plant location: A case study from India. Energy 2012, 42, 510–521. [Google Scholar] [CrossRef]
  54. Amiri, M.P. Project selection for oil-fields development by using the AHP and fuzzy TOPSIS methods. Expert Syst. Appl. 2010, 37, 6218–6224. [Google Scholar] [CrossRef]
  55. Jozi, S.A.; Shafiee, M.; Moradimajd, N.; Saffarian, S. An integrated Shannon’s Entropy-TOPSIS methodology for environmental risk assessment of Helleh protected area in Iran. Environ. Monit. Assess. 2012, 184, 6913–6922. [Google Scholar] [CrossRef] [PubMed]
  56. Shannon, C.E. A mathematical theory of communications. Bell Syst. Tech. J. 1948, 27, 379–423. [Google Scholar] [CrossRef]
  57. Freeman, J.; Chen, T. Green supplier selection using an AHP-Entropy-TOPSIS framework. Supply Chain Manag. 2015, 20, 327–340. [Google Scholar] [CrossRef]
  58. Nagpal, R.; Mehrotra, D.; Bhatia, P.K. Usability evaluation of website using combined weighted method: Fuzzy AHP and entropy approach. Int. J. Syst. Assur. Eng. Manag. 2016, 7, 408–417. [Google Scholar] [CrossRef]
  59. Chen, S. Theory and Model of Variable Fuzzy Sets and Its Application, 1st ed.; Dalian University of Technology Press: Dalian, China, 2009; pp. 26–32. ISBN 9787561151334. [Google Scholar]
  60. Pedrycz, W. Principles and methodology of fuzzy sets. J. Intell. Manuf. 1993, 4, 323–340. [Google Scholar] [CrossRef]
  61. Ezghari, S.; Zahi, A.; Zenkouar, K. A new nearest neighbor classification method based on fuzzy set theory and aggregation operators. Expert Syst. Appl. 2017, 80, 58–74. [Google Scholar] [CrossRef]
  62. Venkatramanan, S.; Chung, S.Y.; Rajesh, R.; Lee, S.Y.; Ramkumar, T.M.; Prasanna, V. Comprehensive studies of hydrogeochemical processes and quality status of groundwater with tools of cluster, grouping analysis, and fuzzy set method using GIS platform: A case study of Dalcheon in Ulsan City, Korea. Environ. Sci. Pollut. Res. 2015, 22, 11209–11223. [Google Scholar] [CrossRef] [PubMed]
  63. Bossel, H. Indicators of Sustainable Development: Theory, Method, Applications, 1st ed.; International Institute for Sustainable Development: Winnipeg, MB, Canada, 1999; pp. 1–19. ISBN 1895536138. [Google Scholar]
  64. Commission on Development and Reform of Shandong Province. Medium and Long Term Plan for Comprehensive Utilization of Water Resources in Shandong Province; Water Resources Department of Shandong Province: Shandong, China, 2016.
  65. Lee, M.-C. Information security risk analysis methods and research trends: AHP and fuzzy comprehensive method. Int. J. Comput. Sci. Inf. Technol. 2014, 6, 29–45. [Google Scholar] [CrossRef]
  66. Kumar, A.; Choi, S.K.; Goksel, L. Tolerance allocation of assemblies using fuzzy comprehensive evaluation and decision support process. Int. J. Adv. Manuf. Technol. 2011, 55, 379–391. [Google Scholar] [CrossRef]
  67. Chabukdhara, M.; Gupta, S.K.; Kotecha, Y.; Nema, A.K. Groundwater quality in Ghaziabad district, Uttar Pradesh, India: Multivariate and health risk assessment. Chemosphere 2017, 179, 167–178. [Google Scholar] [CrossRef] [PubMed]
  68. Ghasemi, J.B.; Zolfonoun, E. Simultaneous spectrophotometric determination of trace amount of polycyclic aromatic hydrocarbons in water samples after magnetic solid-phase extraction by using projection pursuit regression. Environ. Monit. Assess. 2013, 185, 2297–2305. [Google Scholar] [CrossRef] [PubMed]
  69. Guan, X.; Liang, S.; Meng, Y. Evaluation of water resources comprehensive utilization efficiency in the Yellow River Basin. Water Sci. Technol. Water Supply 2016, 28, 1561–1570. [Google Scholar] [CrossRef]
Figure 1. The research area.
Sustainability 09 01439 g001
Figure 2. SWOT Analysis Matrix Framework.
Sustainability 09 01439 g002
Figure 3. Position of Research Objects in the SWOT Coordinate Diagram.
Sustainability 09 01439 g003
Figure 4. The Modeling Procedure Used in this Research.
Sustainability 09 01439 g004
Figure 5. The Process of Forming SWOT Indicator Module. (a) Indicator Construction and Classification; (b) Qualitative Descriptions of SWOT about the Indicators.
Sustainability 09 01439 g005
Figure 6. WRSU Assessment Indicator System. (a) Details of WRSU Indicators; (b) SWOT Indicator Module based on SWOT Analysis; (c) Qualitative Descriptions of each Element (S, W, O, and T).
Sustainability 09 01439 g006
Figure 7. Strategies for Improving Sustainability Based on Each Element (S, W, O, and T).
Sustainability 09 01439 g007
Figure 8. Cloud Drop Distributions with Different He (the Blue Curve is for Comparison; Here He = 0).
Sustainability 09 01439 g008
Figure 9. Comprehensive Assessment Scores and their Corresponding WRSU Levels.
Sustainability 09 01439 g009
Figure 10. Spatial Distribution of WRSU Levels.
Sustainability 09 01439 g010
Figure 11. SWOT Coordinate Diagram Showing All Cities’ Positions.
Sustainability 09 01439 g011
Table 1. Descriptions and Grading Criteria for WRSU Indicators.
IndicatorsDescriptionsGrading CriteriaIndicator Types
IIIIIIIV
I1Surface water resources/Land area200–90050–20010–500–10Positive
I2Total water resources/Precipitation0.5–0.60.3–0.50.1–0.30–0.1Positive
I3Total water resources/Total population0.20–0.400.10–0.200.05–0.100.00–0.05Positive
I4 0–1010–2020–3030–50Reverse
I5Total water resources/Cultivated area3–61.5–30.6–1.50–0.6Positive
I6 0–11–1.51.5–22–3Reverse
I7Total population/Land area0–2020–5050–100100–300Reverse
I8 60–7050–6040–500–40Positive
I9Irrigation area/Cultivated area50–6030–5010–300–10Positive
I10Cultivated area/Total population0.60–1.000.08–0.600.05–0.080–0.05Positive
I11Total water consumption of industry/Gross industrial output value0–66–88–1212–18Reverse
I12Gross domestic product/Total population3.00–7.740.66–3.000.35–0.660–0.35Positive
I13Total water consumption/Gross domestic product0–2424–140140–610610–1060Reverse
I14Total water consumption of agriculture/Gross agricultural output value1500–20001000–1500500–10000–500Positive
I15Eco-environmental water consumption/Total water consumption3–52–31–20–1Positive
I16Discharge of sewage/Surface runoff0–0.010.01–0.020.02–0.050.05–0.10Positive
I17Total wastewater treatment/Wastewater discharge60–9050–6010–500–10Positive
I18Total industrial wastewater discharge/Land area0–11–22–33–4Reverse
I19Total urban life wastewater discharge/Land area0–1.51.5–2.52.5–3.53.5–4.5Reverse
Table 2. Normal Cloud Parameters for Indicators at Different WRSU Levels.
Indicators(Ex, En, He) of Indicator i at Different WRSU Levels
IIIIIIIV
I1(550, 116.67, 11.67)(125, 25.00, 2.50)(30, 6.67, 0.67)(5, 1.67, 0.17)
I2(0.55, 0.017, 0.002)(0.4, 0.033, 0.003)(0.2, 0.033, 0.003)(0.05, 0.017, 0.002)
I3(0.300, 0.033, 0.003)(0.150, 0.017, 0.002)(0.075, 0.008, 0.001)(0.025, 0.008, 0.001)
I4(5, 1.67, 0.17)(15, 1.67, 0.17)(25, 1.67, 0.17)(40, 3.33, 0.33)
I5(4.5, 0.50, 0.05)(2.25, 0.25, 0.025)(1.05, 0.15, 0.015)(0.30, 0.10, 0.01)
I6(0.50, 0.170, 0.017)(1.25, 0.083, 0.008)(1.75, 0.083, 0.008)(2.50, 0.170, 0.017)
I7(10, 3.33, 0.33)(35, 5.00, 0.50)(75, 8.33, 0.83)(200, 33.33, 3.33)
I8(65, 1.67, 0.17)(55, 1.67, 0.17)(45, 1.67, 0.17)(20, 6.67, 0.67)
I9(55, 1.67, 0.17)(40, 3.33, 0.33)(20, 3.33, 0.33)(5, 1.67, 0.17)
I10(0.80, 0.067, 0.007)(0.34, 0.087, 0.009)(0.07, 0.005, 0.001)(0.03, 0.008, 0.001)
I11(3, 1.00, 0.100)(7, 0.33, 0.033)(10, 1.70, 0.050)(15, 1.00, 0.100)
I12(5.37, 0.79, 0.079)(1.83, 0.39, 0.039)(0.51, 0.05, 0.005)(0.18, 0.06, 0.006)
I13(12, 4.00, 0.40)(82, 19.33, 1.93)(375, 78.33, 7.83)(835, 75.00, 7.50)
I14(1750, 83.33, 8.33)(1250, 83.33, 8.33)(750, 83.33, 8.33)(250, 83.33, 8.33)
I15(4.0, 0.33, 0.033)(2.5, 0.17, 0.017)(1.5, 0.17, 0.017)(0.5, 0.17, 0.017)
I16(0.01, 0.002, 0.0002)(0.02, 0.002, 0.0002)(0.04, 0.005, 0.0005)(0.08, 0.008, 0.0008)
I17(75, 5.00, 0.50)(55, 1.67, 0.17)(30, 6.67, 0.67)(5, 1.67, 0.17)
I18(0.5, 0.167, 0.017)(1.5, 0.167, 0.017)(2.5, 0.167, 0.017)(3.5, 0.167, 0.017)
I19(0.75, 0.250, 0.025)(2.00, 0.167, 0.017)(3.00, 0.167, 0.017)(4.00, 0.167, 0.018)
Table 3. Results of the AHP-entropy Method for Weight Determination.
IndicatorsWeights of WRSU Indicators Weights of Internal and External Factors
AHPEntropyCombined WeightsAHPEntropyCombined Weights
I80.02290.03310.0280Internal factors0.04580.06730.0565
I90.00980.04770.02870.01960.09680.0582
I110.06660.02220.04440.13310.04520.0891
I120.02600.06540.04570.05210.13290.0925
I130.06230.02430.04330.12470.04940.0870
I140.06230.06980.06610.12470.14180.1332
I10.07500.07810.07650.15000.15860.1543
I60.07500.02600.05050.15000.05270.1014
I70.07500.04660.06080.15000.09470.1224
I100.02500.07910.05210.05000.16070.1053
I20.01950.04800.0338External factors0.03900.09470.0669
I30.13060.08040.10550.26110.15850.2098
I50.05000.09410.07200.09990.18540.1426
I150.05000.10320.07660.09990.20340.1516
I40.11660.03170.07420.23320.06240.1478
I160.04850.02870.03860.09700.05650.0767
I170.04850.05820.05330.09700.11470.1058
I180.01820.02700.02260.03640.05330.0448
I190.01820.03620.02720.03640.07130.0539
Table 4. Comprehensive Assessment Scores and Coordinate Values of each City.
CitiesComprehensive Assessment ScoresCoordinate Values
WRSU LevelsInternal Factor ScoresExternal Factor ScoresInternal Coordinate ValuesExternal Coordinate Values
Zaozhuang3.00272.83213.1335−0.8321−1.1335
Heze3.11782.40123.3774−0.4012−1.3774
Jining3.14552.02163.3724−0.0216−1.3724
Liaocheng3.44572.46763.5405−0.4676−1.5405
Dezhou2.63702.97301.8185−0.97300.1815
Jinan1.31451.27892.05340.7211−0.0534
Qingdao2.39791.86312.76140.1369−0.7614
Weihai1.64491.25221.84870.74780.1513
Yantai2.87432.94992.8461−0.9499−0.8461
Weifang2.76052.81572.4333−0.8157−0.4333
Taian2.28212.45621.7299−0.45620.2701
Binzhou1.58741.37881.89610.62120.1039
Dongying2.64081.97803.19160.0220−1.1916
Laiwu1.58451.74071.11410.25930.8859
Linyi2.38172.53881.4232−0.53880.5768
Rizhao2.97401.88283.60680.1172−1.6068
Zibo1.69231.16831.79110.83170.2089
Average2.4402
Table 5. Comparisons of WRSU Assessment Results Using Three Different Methods.
CitiesComprehensive Assessment ScoresWRSU Condition Rank
FCEPPNCMFCEPPNCM
Zaozhuang0.38271.51783.0027JinanJinanJinan
Heze0.37151.38473.1178LaiwuLaiwuLaiwu
Jining0.36541.20483.1455BinzhouZiboBinzhou
Liaocheng0.35451.18873.4457WeihaiWeihaiWeihai
Dezhou0.43481.68842.6370ZiboBinzhouZibo
Jinan0.48362.4971.3145DongyingTaianTaian
Qingdao0.41252.09752.3979LinyiLinyiLinyi
Weihai0.46042.22011.6449TaianQingdaoQingdao
Yantai0.40091.67812.8743DezhouWeifangDezhou
Weifang0.40421.89722.7605QingdaoDongyingDongying
Taian0.44872.17862.2821WeifangDezhouWeifang
Binzhou0.4701 2.21581.5874YantaiYantaiYantai
Dongying0.45341.83472.6408RizhaoRizhaoRizhao
Laiwu0.47972.22651.5845ZaozhuangZaozhuangZaozhuang
Linyi0.45032.16872.3817HezeHezeHeze
Rizhao0.38941.63142.9740JiningJiningJining
Zibo0.4583 2.22071.6923LiaochengLiaochengLiaocheng

