Article

Factors Affecting Spatial and Temporal Concentration Variability of Pharmaceuticals: Comparison between Two WWTPs

1
Department of Science and High Technology, University of Insubria, Via G.B. Vico 46, 21100 Varese, Italy
2
Department of Biotechnologies and Life Sciences, University of Insubria, Via Dunant 3, 21100 Varese, Italy
3
Department of Theoretical and Applied Sciences, University of Insubria, Via G.B. Vico 46, 21100 Varese, Italy
4
Department of Civil, Environmental and Mechanical Engineering, University of Trento, Via Mesiano 77, 38123 Trento, Italy
5
Preclinical Department, Faculty of Medicine, Lucian Blaga University of Sibiu, Victoriei Bd. 10, 550024 Sibiu, România
*
Author to whom correspondence should be addressed.
Sustainability 2017, 9(8), 1466; https://0-doi-org.brum.beds.ac.uk/10.3390/su9081466
Submission received: 20 July 2017 / Revised: 13 August 2017 / Accepted: 17 August 2017 / Published: 18 August 2017
(This article belongs to the Collection Risk Assessment and Management)

Abstract

:
The presence of emerging organic micropollutants (such as pharmaceuticals) in sewage has been, for a long time, an issue of great concern within the international scientific debate. This item represents one of the main challenges related to a sustainable development, with particular concern to the public health control. While most of the work has been concentrated on their detection and the evaluation of their average level, little is known about the spatial and temporal variability of concentrations of these compounds in the effluent and its capability to affect the concentrations in time of the receiving water body. In this study, three sampling campaigns were carried out at two different wastewater treatment plants (WWTPs) in Varese area (Northern Italy) with the aim of monitoring the occurrence of some pharmaceuticals to evaluate their removal efficiency. The detected pharmaceuticals were: Ofloxacin, Ibuprofen, Atenolol, Bezafibrate, Carbamazepine, Salbutamol, Cyclophosphamide and Hydrochlorothiazide. The results obtained, together with the analysis of the characteristics of the chemicals and of the two WWTPs, allowed evaluating the factors affecting the spatial and temporal concentration variability in effluent waters and the potential influence of this variability in driving the exposure of the aquatic ecosystems in the receiving water body.

1. Introduction

The presence of emerging organic micropollutants (such as pharmaceuticals) in sewage represents one of the main scientific arguments to be discussed to apply the principles of a sustainable development. Clearly, this argument is centered on a correct approach of the risk assessment and management. The presence of micropollutants represents a strong problem, but also an important opportunity to face and modify some human behavior. The interest related to the presence of micropollutant is due to the fact that, after being excreted in sewers by human body (as parent compounds or as metabolites), they firstly enter the wastewater treatment plants (WWTPs) and then surface water bodies, since WWTPs are generally not able to effectively remove them [1,2,3]. They can be found in the aquatic environment and, being potentially active (even though at very low concentrations), they can exert several types of effects on aquatic ecosystems [4,5] and not yet clear consequences on human beings. However, while a body of knowledge is growing on the presence of such chemicals in sewage and surface waters, very little information is available regarding the spatial and temporal variations of such concentrations. This issue was pointed out among the most critical points in the evaluation of surface water ecosystem exposure in a recent opinion of the three scientific committees of the European Commission [6]. Facing this item answers to a specific need related to some of the Sustainable Development Goals (SDGs), such as SDG 3 (Good health and wellbeing), SDG 6 (Clean water and sanitation) and SDG 14 (Life below water). The lack of temporally and spatially variable concentrations in water and sediment does not allow perceiving gradients in a particular region and evaluating the role of variable loadings in driving the exposure. This issue was dealt with, in a recent publication, by Di Guardo and Hermens [7], who list the problems related to the lack of such data, from monitoring issues to the impossibility of reconstructing dynamic modeling scenarios to evaluate realistic concentrations of exposure. While it is generally acquired that WWTPs show continuous and quasi-constant emissions of unretained chemicals, little is known about the real variations of such emissions due to plant differences (number and types of stages), loading change (consumption and use patterns) and/or environmental variables (temperature, precipitation, etc.).
To analyze the importance of some of the issues outlined above, three sampling campaigns were carried out in 2009 at two different WWTPs in Varese (a town of about 80,000 inhabitants, Northern Italy) [8,9]. The attention was focused on eight of the most frequently detected pharmaceuticals in the influent of WWTPs in Italy (antibiotics, anti-inflammatories, β-blockers, lipidic regulators, anti-epileptics, β-sympathomimetics and diuretics [10,11]). To assess the seasonal variation in the occurrence and removal in WWTPs of the studied pharmaceuticals, as well as the temporal loadings to receiving surface waters of pharmaceuticals, the sampling campaigns were carried out in different periods of the year and on different days of the week. The objective of this work is therefore to quantify and compare the capability of the two WWTPs to treat incoming waters in terms of their spatial and temporal concentration variability and to analyze the factors which drive such variation. Finally, a tentative calculation of the influence of such variability on the exposure concentrations of aquatic ecosystems in a receiving water body was performed to illustrate the relevance of such dynamic discharge.

2. Materials and Methods

2.1. WWTPs Monitored

Three sampling campaigns were carried out at two different WWTPs (Varese Olona-Pravaccio, from now on “P1” and Varese Lago-Bardello, from now on “P2”), both of which based on activated sludge (AS) process and fed by combined sewers. The P1 plant is a conventional AS plant, with an operating capacity of 49,800 population equivalents (p.e.). The P2 plant, which has an operating capacity of 27,700 p.e., combines the AS process with denitrification/nitrification to enhance the nitrogen removal [12]. It also applies the addition of ferric salts (FeCl3), as a tertiary treatment, to enhance phosphorus removal and, furthermore, the final disinfection with sodium hypochlorite to reduce the microbial activity.
The main features of the two plants are gathered in Table 1. P1 and P2 plants treat domestic (around 60%) and industrial (both around 40%: for P1, most of which coming from food and metallurgic factories; for P2, most of which coming from electrical household appliances factories, textile and dairy) wastewater. The P2 plant also treats wastewater coming from the main Varese hospital, which is a medium size (more than 500 beds) structure.

2.2. Sampling Campaigns

Pharmaceuticals were sampled in three different periods of the year (April, June and September 2009) and on different days of the week. Two sampling points, along the wastewater line of each plant, were taken into account: influent (raw sewage for both plants) and effluent (treated sewage for both plants). Two daily composite samples (influent and effluent) for one to three days a week, depending on the specific sampling campaign (sampling days: Monday, representative of the weekend, i.e., Saturday plus Sunday, from now on “Mon”; Wednesday, representative of Tuesday, from now on “Wed”; Friday, representative of Thursday, from now on “Fri”), were collected using automated samplers which collected an integrated sample of 9.6 L composed with 50 mL every 15 min over 48 h (Mon, i.e., Saturday plus Sunday) or 100 mL every 15 min over 24 h (Wed and Fri, i.e., Tuesday and Thursday, respectively).
All the samples were collected during dry weather days, with the exception of Friday, 10 April, and of Monday 28 September (just with regard to P2), when less than 1 mm of rain was registered. Only the measured soluble concentrations were evaluated, without considering either sorbed or conjugate compounds. This was done after checking that concentrations of pharmaceuticals in the particulate phases were negligible (lower than the limit of quantification). All the analyses were performed twice and the mean of two replicates was considered as the final detected value for each investigated compound.

2.3. Chemicals

The reference standards of all the investigated pharmaceutical compounds were purchased from Sigma-Aldrich (Steinheim, Germany); Salbutamol-D3 and Ibuprofen-D3 were purchased from CDN isotopes (Quebec, QC, Canada). All solvents used were Sigma reagent grade. Water, methanol and acetonitrile (Sigma-Aldrich, Steinheim, Germany) were LC-MS (Liquid Chromatography–Mass Spectrometry) grade.

2.4. Sample Preparation

A volume of 100 mL of the integrated sample was taken and centrifuged at 8900 RPM (revolutions per minute) for 15 min in order to separate the liquid from the solid portion. The liquid portion was directly processed using SPE (solid phase extraction), while the solids were freeze-dried and later extracted by repeated USE (ultrasonic solvent extraction). Liquid and solid samples were spiked with 20 ng of deuterated standard (Salbutamol-D3, Ibuprofen-D3). SPE was performed by using an Oasis MCX cartridge (60 mg, Waters Corp., Milford, MA, USA [10]).

2.5. High Performance Liquid Chromatography-Tandem Mass Spectrometry (HPLC-MS/MS)

Before analysis, the samples were dissolved in 100 μL of 0.1% formic acid in LC-MS grade water. The extracts were filtered on regenerated cellulose syringe filters 150, 0.2 μm (PHENEX, Phenomenex, Torrance, CA, USA) for further clean up. The HPLC analysis was performed in a Finnigan Surveyor MS plus HPLC system (Thermo Electron Corporation, San Diego, CA, USA). Chromatographic separations were conducted onto a Luna C8 column 50 mm × 2 mm i.d., 3 μm particle size (Phenomenex, Torrance, CA, USA). For the analysis in positive mode, the eluent A was formic acid 0.1% in water and the eluent B was formic acid 0.1% in acetonitrile.
For the negative analysis, the eluent A was water, the eluent B was acetonitrile; before entering the mass spectrometry ion source, 1% triethylamine (TEA) was injected (flush syringe of 3 μL/min). The elution gradient was 2–95% B within 10 min, 95% B for 2 min and 6 min to equilibrate the column (200 µL/min). For the mass spectrometry quantification, a Finnigan LXQ linear ion trap mass spectrometer, equipped with an electro spray ionization (ESI) ion source (Thermo Electron Corporation, San Diego, CA, USA), was used. The analyses were done in positive (spray voltage 4.5 kV, capillary temperature 270 °C) or negative mode (spray voltage 3 kV, capillary temperature 250 °C). The optimization of collision energy for each substance, the tuning parameters and the choice of fragments to confirm the identity of target compounds were done in continuous flow mode, by using standard solution at concentration of 10 ng/μL.

2.6. Quantification and Method Validation

The target compounds were identified by comparing fragmentation and retention time with the corresponding reference standard. To quantify them, the two highest precursor ion/product ion transitions were used. To analyze an array of 12 different molecules, by taking into account the difficulty or the impossibility of obtaining labeled I.S. for each substance (in agreement with [8,10]), only two deuterated I.S. were used: Salbutamol-D3 to quantify positive pharmaceutical compounds and Ibuprofen-D3 for negative compounds. For the quantification, the peak area of each compound was normalized to the peak area of the appropriate I.S. A concentration of 1 ng/L was considered as the limit of detection (LOD) of the method and the limit of quantification (LOQ) was fixed at 5 ng/L.

2.7. Flow Rate Calculations for the Aquatic Contamination Exercise

To predict temporal exposure concentration variability in river water, 2009 was divided into two different periods, i.e., the autumn/winter period (from 1 January 2009 to 20 March 2009 and from 21 September 2009 to 31 December 2009) and the spring/summer period (from 21 March 2009 to 20 September 2009), aiming at defining two well distinguished seasonal scenarios.
We selected P1 WWTP, for which it was possible, for both the periods, to collect not only the data regarding the flow daily treated by the plant itself, but also the data regarding the Olona River flow (the surface water body where P1 plant discharges its effluent). To calculate flow data for the Olona River, we used the level data measured every day at the hydrometric station of Ponte Vedano, downstream from the plant, and we converted them into flow data by using the run-off curves provided by the Regional Agency for Environment Protection-Hydrographic Service [13] of Lombardy. Since there are no other significant rivers between the plant and the measurement station and there are neither diversions nor river intakes in the middle, we assumed that the Olona River flow values connected with the P1 discharge point were the same as those previously calculated. For three of the investigated compounds (i.e., Ofloxacin, Carbamazepine and Ibuprofen), we calculated the daily load (g/day) entering the plant by multiplying the yearly average flow (m3/day) and the yearly average concentrations (ng/L, mean of the values detected during the three analytical campaigns, i.e., 940 ng/L, 1639.2 ng/L and 1275 ng/L for Ofloxacin, Carbamazepine and Ibuprofen, respectively) and we assumed this load as constant over the year. After that, we calculated the daily output load by taking into account the median removal rate found, for the same compounds, by Castiglioni et al. [14], who reported different values for winter and summer. During the stormwater events which caused the combined sewer overflows (CSO) working (in other terms, the portion of the flow exceeding 43,200 m3/day to bypass the plant and being directly discharged), an estimation of the daily load directly discharged, without treatment, into the Olona River was made for each compound, on the basis of the percentage of the daily flow deviated towards the bypass. This contribution was summed up to that coming from the treated effluent. The obtained output loads were then divided by the total flow (P1 and Olona River) to predict, for each seasonal scenario, the expected concentrations in surface water (under the assumption of instantaneously mixing) and thus the temporal exposure variability of aquatic ecosystems.

3. Results and Discussion

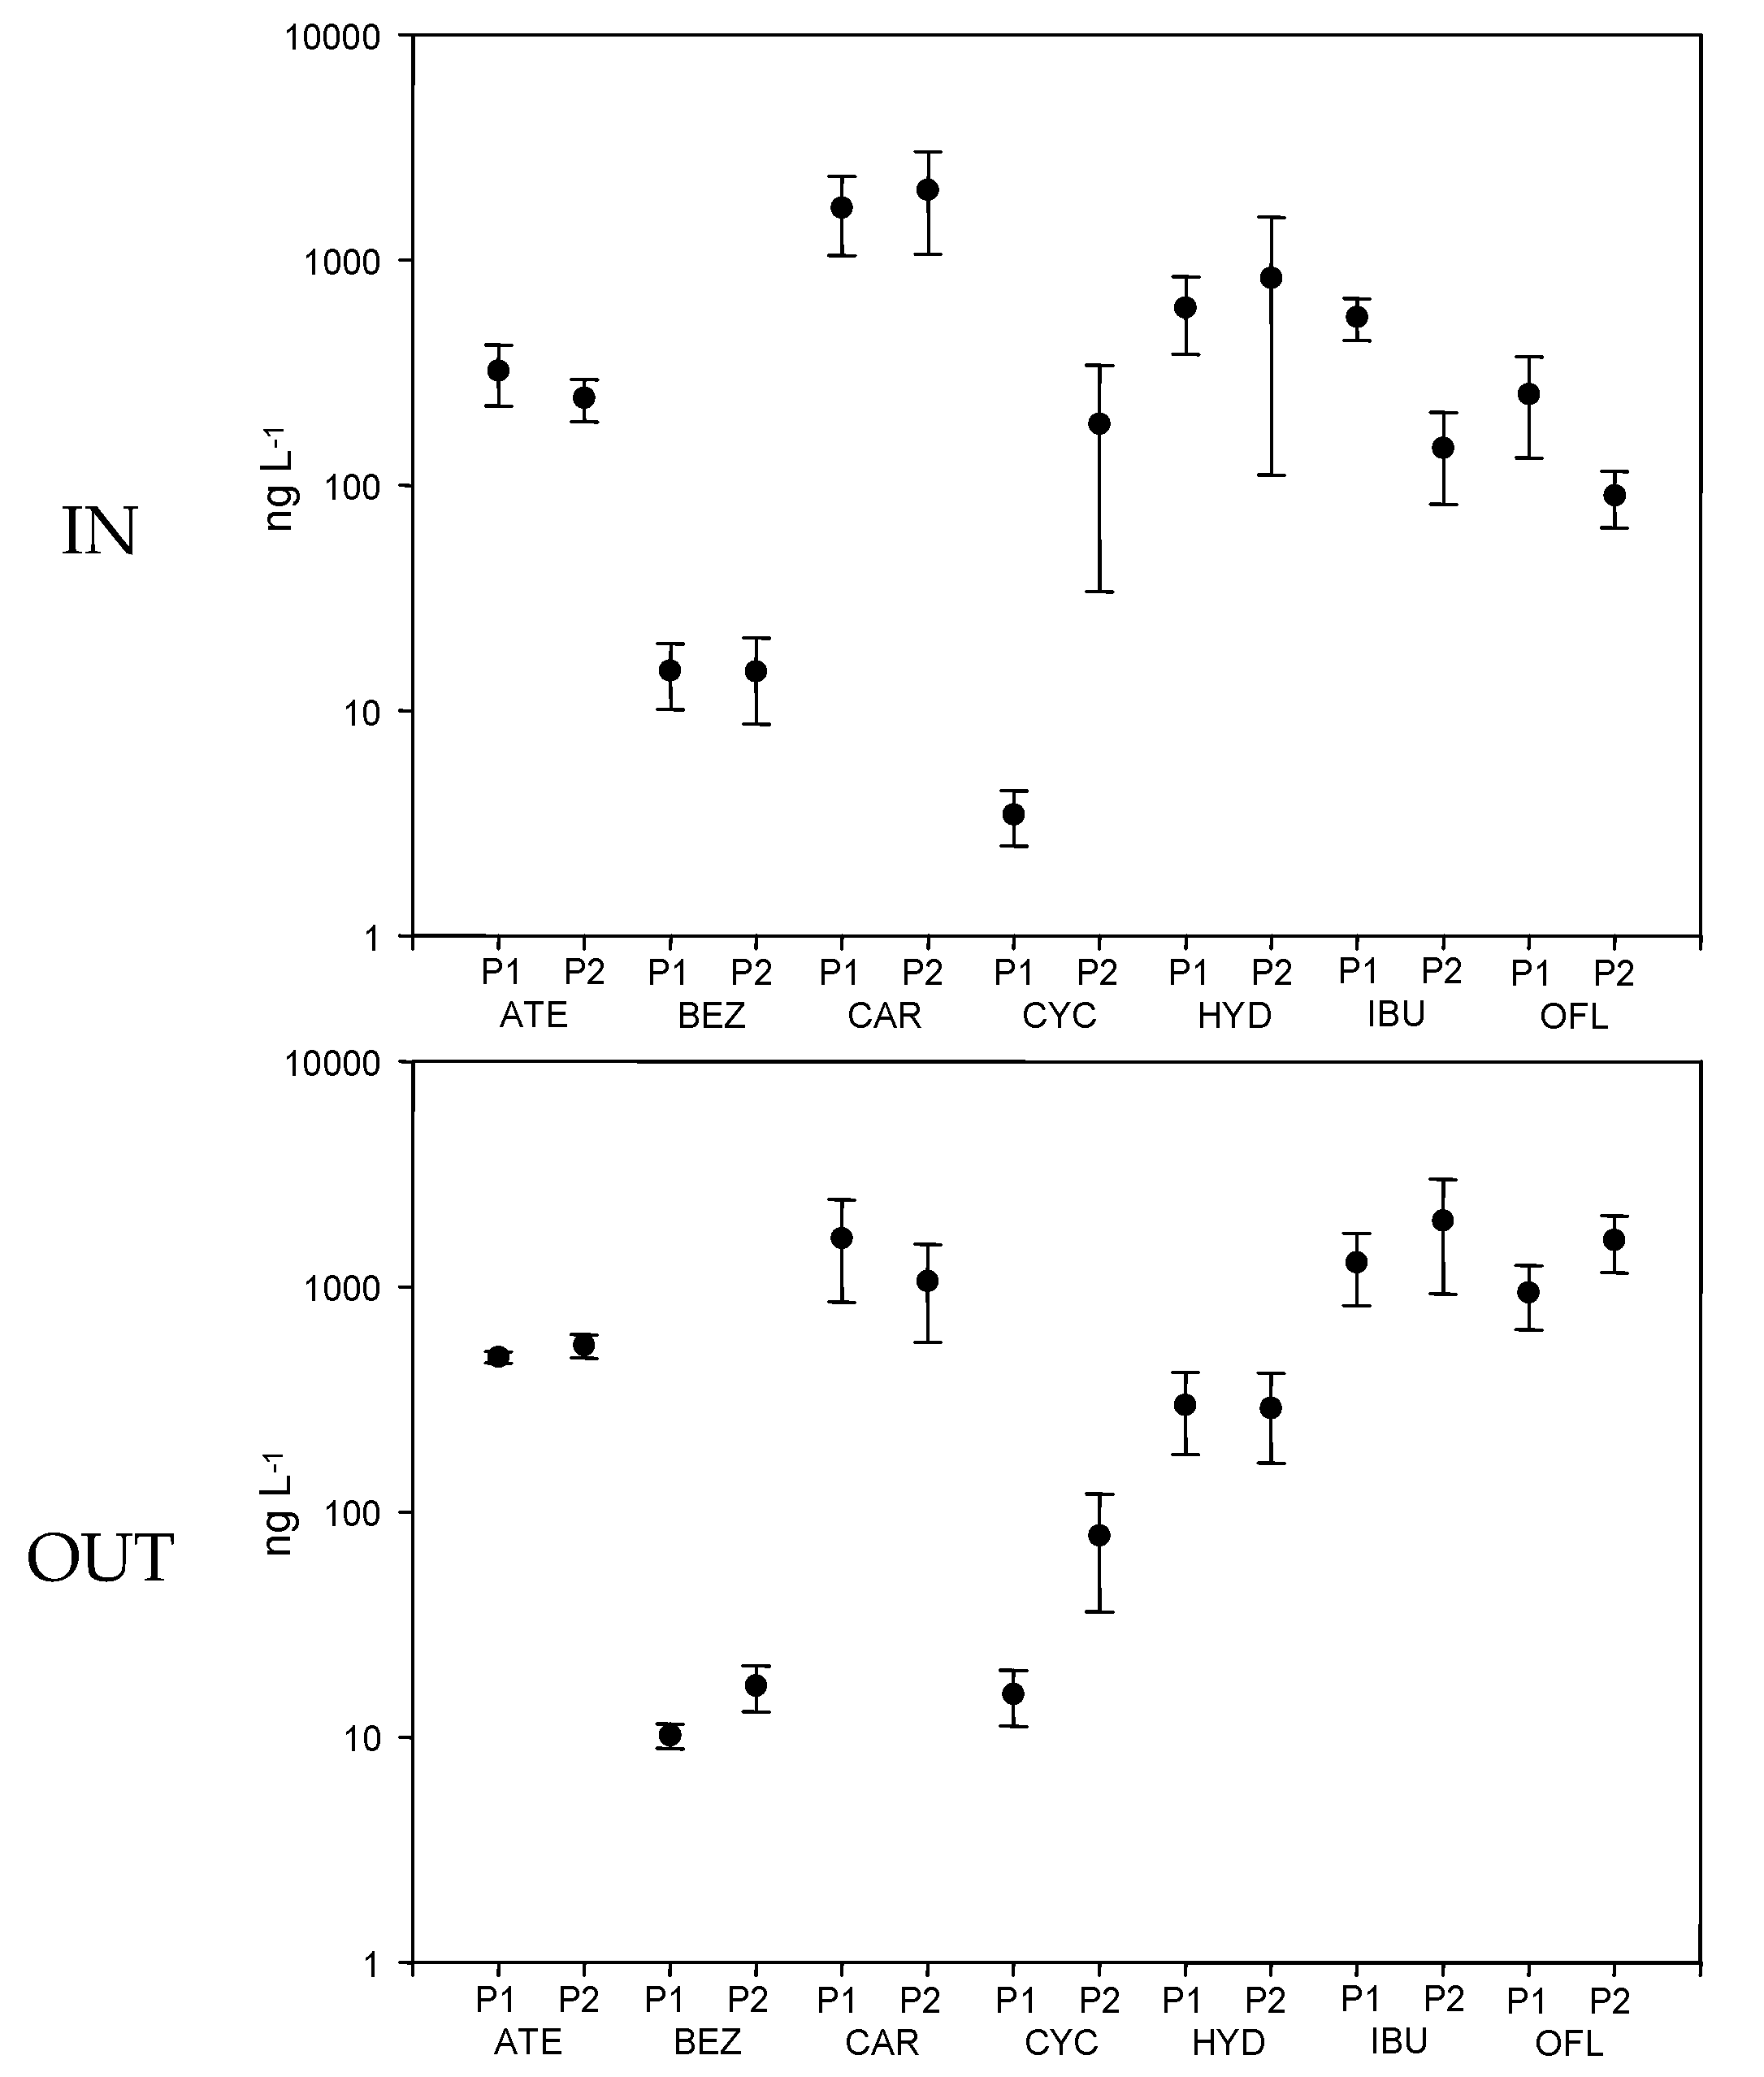
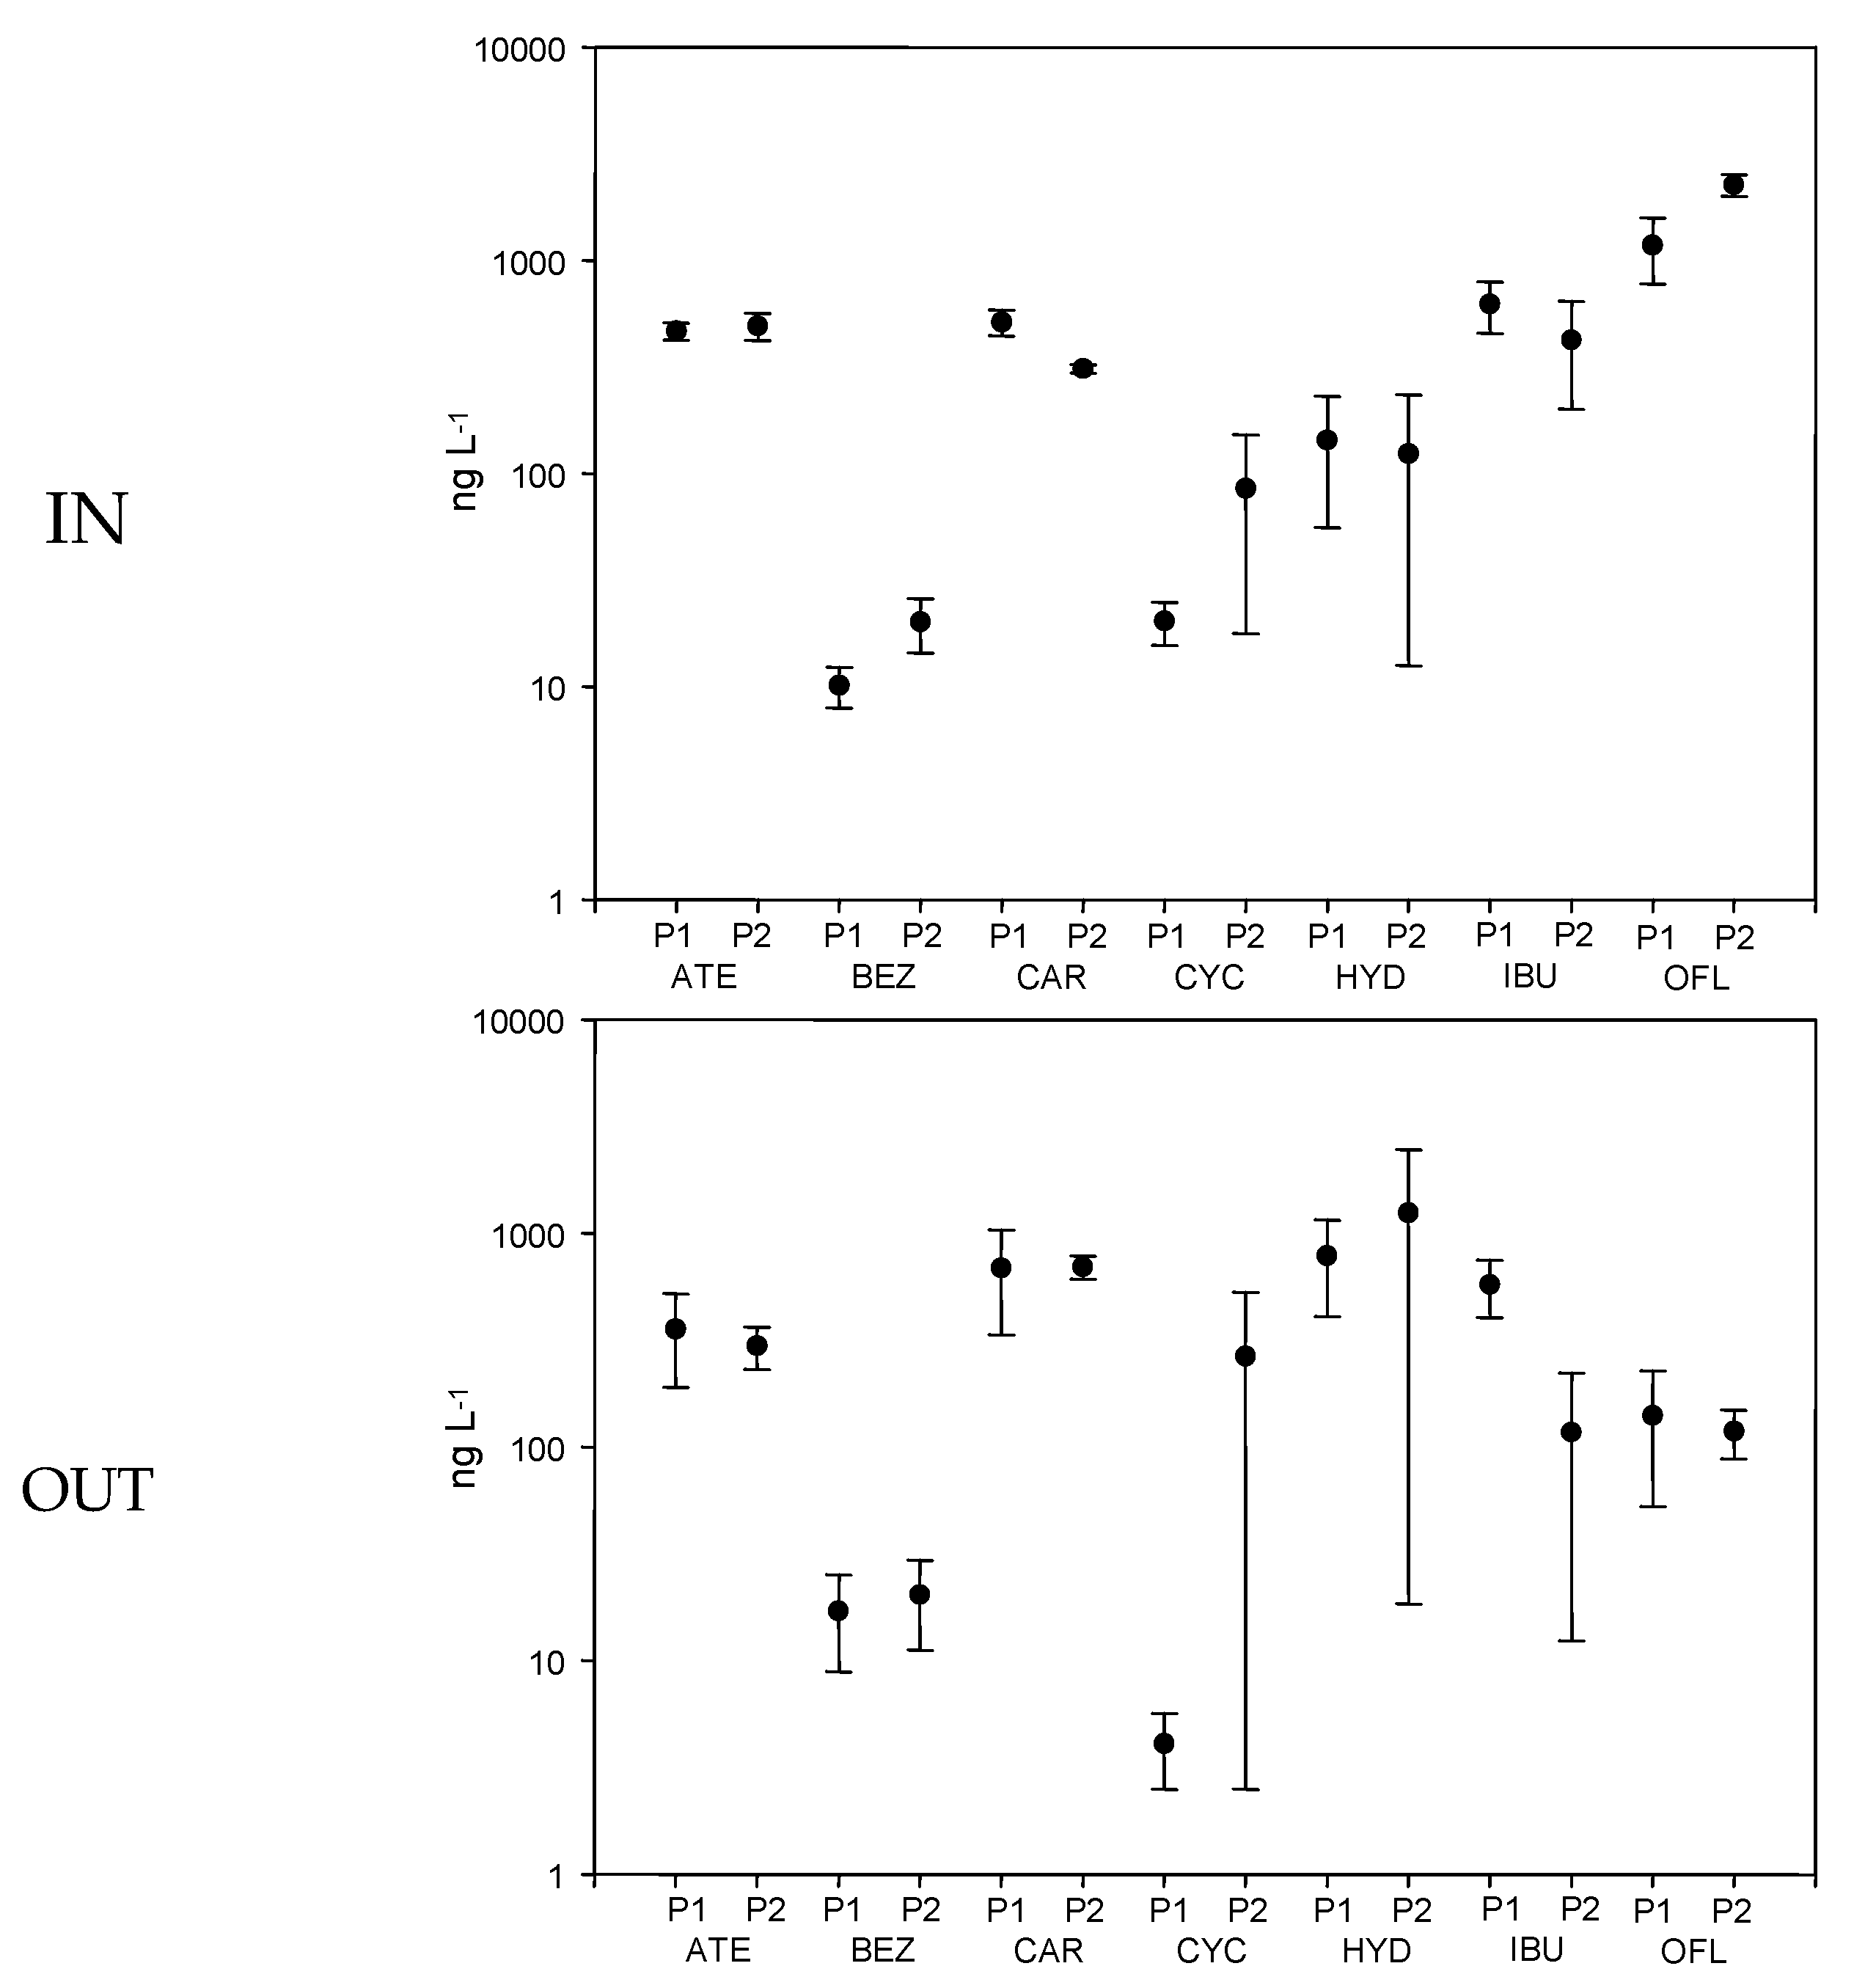
3.1. Spatial Variability of Pharmaceutical Concentrations in WWTPs

Given the similar incoming sewage water flows of the two plants (around 28,000 m3/day 28 thousand cubic meters per day, although the population equivalents of P1 are about double of those of P2, Table 1), the comparison of input and output concentrations could give an idea of the expected spatial variability of chemical loads to surface waters in the same territory. Looking at the general variability of concentrations (Figure 1), the pharmaceuticals measured at the highest concentrations in the influent (see Table 2 for details) were Carbamazepine (maximum in the range 1600–4500 ng/L), Ibuprofen (maximum in the range 1600–3000 ng/L) and Ofloxacin (maximum in the range 2000–2600 ng/L), often greater than the literature range (100–1000 ng/L, [11]).
The other chemicals were generally measured at several hundred nanograms per liter (Atenolol, Hydrochlorothiazide) or in the range of tens to about two hundred nanograms per liter (Bezafibrate, Cyclophosphamide) or very low (even under the LOQ) for Salbutamol (not reported in the picture), as also appears in another study by Zuccato et al. [11]. This is generally consistent, in terms of ranking, with a recent review of Verlicchi et al. [15], who collected data of 264 WWTPs from various global locations, mostly in Europe: in the raw influent to municipal WWTPs, the variability of analgesics/anti-inflammatories was found to range between 1.6 and 373,000 ng/L; the range of variability of antibiotic concentrations was between 1 and 32,000 ng/L; the observed ranges of variability were 2.5–10,000 ng/L for antihypertensives, 6–25,000 ng/L for β-blockers and 4–6000 ng/L for diuretics; the variability for the lipid regulators was found to range 1–30,000 ng/L and for psychiatric drugs 2.5–25,000 ng/L; and the observed ranges of variability were 50–150 ng/L for β-agonists and 19–360 ng/L for antineoplastics. Regarding the effluent, a somehow similar picture of the concentrations (Figure 1 and Table 2) appears: Carbamazepine is still at the highest concentrations (maximum in the range 3000–5700 ng/L) and Hydrochlorothiazide follows (maximum in the range 1300–3700 ng/L). This is consistent with the findings of other authors [8,10,12,16]. In the above-mentioned review of Verlicchi et al. [15], with regard to 264 WWTPs from various global locations (mostly in Europe), the variability of analgesics/anti-inflammatories was found to range between 1 and 57,000 ng/L; the range of variability of antibiotic concentrations was between 1 and 6700 ng/L and that of antihypertensives was 2.5–11,000 ng/L; the range of variability was 5–73,000 ng/L for β-blockers and 4–1800 ng/L for diuretics; the variability for the lipid regulators was found to range 1.5–80,000 ng/L and for psychiatric drugs 1–20,000 ng/L; and the observed ranges of variability were 10–170 ng/L for β-agonists and 2–2900 ng/L for antineoplastics. In a study carried out by Kostich et al. [17], who measured the concentrations of 56 prioritized pharmaceuticals in effluents from 50 large wastewater treatment plants in the US, Hydrochlorothiazide was found in every sample (mean 1100, max 2800 ng/L), while Atenolol (mean 940, max 3000 ng/L) and Carbamazepine (mean 97, max 240 ng/L) were found in over 90% of the samples. Ibuprofen was found up to 4200 ng/L (mean 460 ng/L) and Ofloxacin up to 660 ng/L (mean 160 ng/L). Our results show that the two plants behave similarly in certain cases and quite differently in others: in terms of influent concentrations, the two plants receive similar average concentrations of Atenolol, Carbamazepine, Hydrochlorothiazide, Ibuprofen and Ofloxacin, while concentrations of Bezafibrate differ by a factor of about 2 and Cyclophosphamide by a factor of about 4. In addition, the range of variation in input (difference between minimum and maximum concentration) can be rather different (e.g., Carbamazepine, Ibuprofen, Cyclophosphamide and Hydrochlorothiazide in P2), while it is somehow comparable for the other chemicals.
When evaluating effluent concentrations, the different behavior of the two plants is clearly shown: for Cyclophosphamide the difference among average values is a factor of about 54, for Ofloxacin a factor of 2.3, for Ibuprofen a factor of 3.8, and for Atenolol, Bezafibrate, Carbamazepine and Hydrochlorothiazide a factor of less than 1.3. The range of minimum/maximum values sometimes spans three orders of magnitude (Carbamazepine in P1), two (Hydrochlorothiazide in P2) or one (Carbamazepine and Ibuprofen in P2), while it is smaller with the other chemicals.

3.2. Temporal Variability of Pharmaceutical Concentrations in WWTPs

While the analysis of data of the previous section allowed appreciating the average yearly input and output concentrations and their relative variation, the availability of data for three days in the same week of the month of April allows comparing the relative intra-week variations. Figure 2 shows the averages of P1 and P2 influent and effluent concentrations and their variation (standard error). The sampled days include the Mon contribution (resulting from weekend loads) as well as Wed and Fri ones.
The comparison between the April values (Figure 2) versus the annual averages (Figure 1) shows that concentrations of some drugs (input and output) can be substantially overlapped to the average (Atenolol, Bezafibrate and Ofloxacin) or showing larger variations (sometimes non detects) for Cyclophosphamide or Hydrochlorothiazide. The pharmaceuticals that differ most are Carbamazepine (a factor of 3 lower in April in both influents, resulting in similar differences in the effluents) and Ibuprofen, which differs in the influents (a factor of about 2 lower for P1 and 4.6 for P2) but not in the effluents (practically the same concentrations in P1 and slightly less variable for P2). While the annual variations of Figure 1 can give an idea of the potential expected spatial and temporal variability depending on all causes (consumption, use patterns, WWTP characteristics, environmental conditions such as temperature etc., the comparison of April concentrations to the annual averages allows to evaluate overall seasonal factors capable (or not) to influence such concentrations. In general, April concentrations are lower and with a reduced variability, especially in the influent (apart the exception noted). When looking at the intra-week variability, for P1 Mon (resulting from weekend chemical use) is the day for which the highest concentrations are present (6 times out of 7) in the influent and Fri for the effluent (5 out of 7), while for P2 the peaks of concentrations do not present a precise pattern and are more mixed. This type of variability indicates that P1 seems to be more prone to receive higher weekend concentrations compared to P2 and this is to be taken into account when considering the impact of pharmaceuticals to receiving surface water, object of the following sections.

3.3. Factors Affecting Variability of Aquatic Ecosystem Exposure

A number of factors can affect the variability of aquatic ecosystem exposure, as a result of WWTP discharges. To evaluate their contribution to discharge variability, we grouped them in four categories:
(i)
physical-chemical and degradation properties of the compounds;
(ii)
their consumption rates;
(iii)
WWTPs characteristics and their removal efficiency; and
(iv)
water flow variations of the WWTP and the receiving water body.
This last point will be illustrated with a calculation of variable exposure concentration in the Olona River in Section 3.4.

3.3.1. Physical-Chemical and Degradation Properties of Pharmaceuticals

The removal efficiency of a WWTP severely affects pharmaceuticals environmental fate and, therefore, the aquatic ecosystems exposure the two major removal pathways are sorption onto sludge (which is generally the case with lipophilic compounds) and biodegradation. Both sorption and biodegradation are strictly bound to the physical-chemical properties of the drugs. Most of the chemicals analyzed (with the exception of Ofloxacin) are characterized by low sorption partition coefficients (Table 3) (octanol-water partition coefficient, Kow and distribution coefficient, Kd) and therefore it is less likely that sorption to sewage sludge would be a major removal process [18].
Many of the pharmaceuticals have one or more acidic dissociation constant, pKa, in the range <7.5–8, which would make the chemical substantially available as dissociated form at environmental pH. In terms of degradation potential, Ibuprofen, Hydrochlorothiazide and possibly Bezafibrate and Atenolol appear as being relatively biodegradable, while the others show half-lives (HLs) substantially confirming a scarce degradation during their travel time through a WWTP.

3.3.2. Consumption Rates and Use Patterns

One of the factors affecting variability of aquatic ecosystem exposure can be found in different pharmaceuticals consumption rates and posology, which is reflected on different concentrations in the influent and, possibly, in the effluent. For example, Ofloxacin was detected (in both plants) mainly during the April 2009 sampling campaign, showing a remarkable seasonal influence on antibiotics consumption, which is more sporadic than that of other compounds, such as β-blockers or Carbamazepine, which are generally consumed for long periods [16,39]. For some compounds, since they are sold on a medical prescription, it is easier to estimate their occurrence in WWTP influents; for others, such as the over the counter drugs (e.g., Ibuprofen), it could be more difficult to predict their input concentrations, which can be greatly variable along the year even inside the same plant (Figure 1 and Figure 2).
Looking at our data, a certain variability in Cyclophosphamide input concentrations, during the same season, might be attributed to the different nature of incoming loads to the plants. This drug, in fact, was found in concentrations up to 220 ng/L in the influent of P2, while the maximum concentration in the influent of P1 was about 29 ng/L. The presence of this antineoplastic compound in the influent of P2 at concentrations higher than those detected in the influent of P1 could be explained by taking into account the fact that the main Varese hospital discharges its wastewater into the pipes that convey sewage to the P2 plant. The use of Cyclophosphamide is mainly nosocomial, even though it is often administered during out-patient treatment, which could mask the real source of release of this substance into the environment. After administration in hospital, in fact, the patient usually goes back to his/her residency and therefore the excretion can occur through household drains. For that reason, the entry pathway of antineoplastics in the sewage system strongly depends on the type of hospitalization (complete or out-patients).

3.3.3. WWTPs Features

Among the WWTPs factors affecting the different pharmaceuticals removal efficiency, the technology implemented, the operating parameters (e.g., hydraulic retention time (HRT) and sludge retention time (SRT)) and the reactor configuration are probably the most noteworthy. It is generally accepted that technologies such as membrane bioreactor (MBR), ozonation and advanced oxidation processes (AOPs) appear more efficient in eliminating pharmaceutical residues than conventional AS processes [40].
As for HRT and SRT, they both play an important role, since the former is the average length of time that a soluble compound remains in the reactor and the latter is the mean residence time of microorganisms [41,42]. P1 and P2 are both conventional AS plants, hence differences in removal efficiency have to be primarily searched in operating conditions and tertiary treatments adopted. In our study, Carbamazepine seems to show the same behavior as that found in the literature [15], i.e., its removal rate is influenced neither by HRT nor by SRT [43]: in fact, the only positive removal of this compound occurs in P1, where both HRT and SRT are shorter. For Atenolol and Ofloxacin, SRT seems to play a more crucial role than HRT, since they are better removed in P2 plant. As for Ibuprofen, P2, which works at HRT > 12 hours and at SRT in the range 10–20 days, is generally more efficient [44] in removing it. Finally, considering the tertiary treatments adopted by the two plants, some differences could be found and a contribution to the increase of the removal rate of some compounds can be found. P2 is equipped with a predenitrification-nitrification compartment, which is absent in P1, where just the conventional oxidation tank exists.
The presence of a stage for the advanced removal of nitrogen guarantees a different microbial activity, responsible for the enhanced degradation of some of the investigated compounds. Furthermore, P2 is also equipped with a tank for the advanced phosphorus removal with ferric chloride (FeCl3) and the better Bezafibrate removal (from 31% to 100%) in this plant, compared to that found in P1 (maximum 15%), could probably be ascribed to this factor, which seems to be more influent than HRT and SRT.

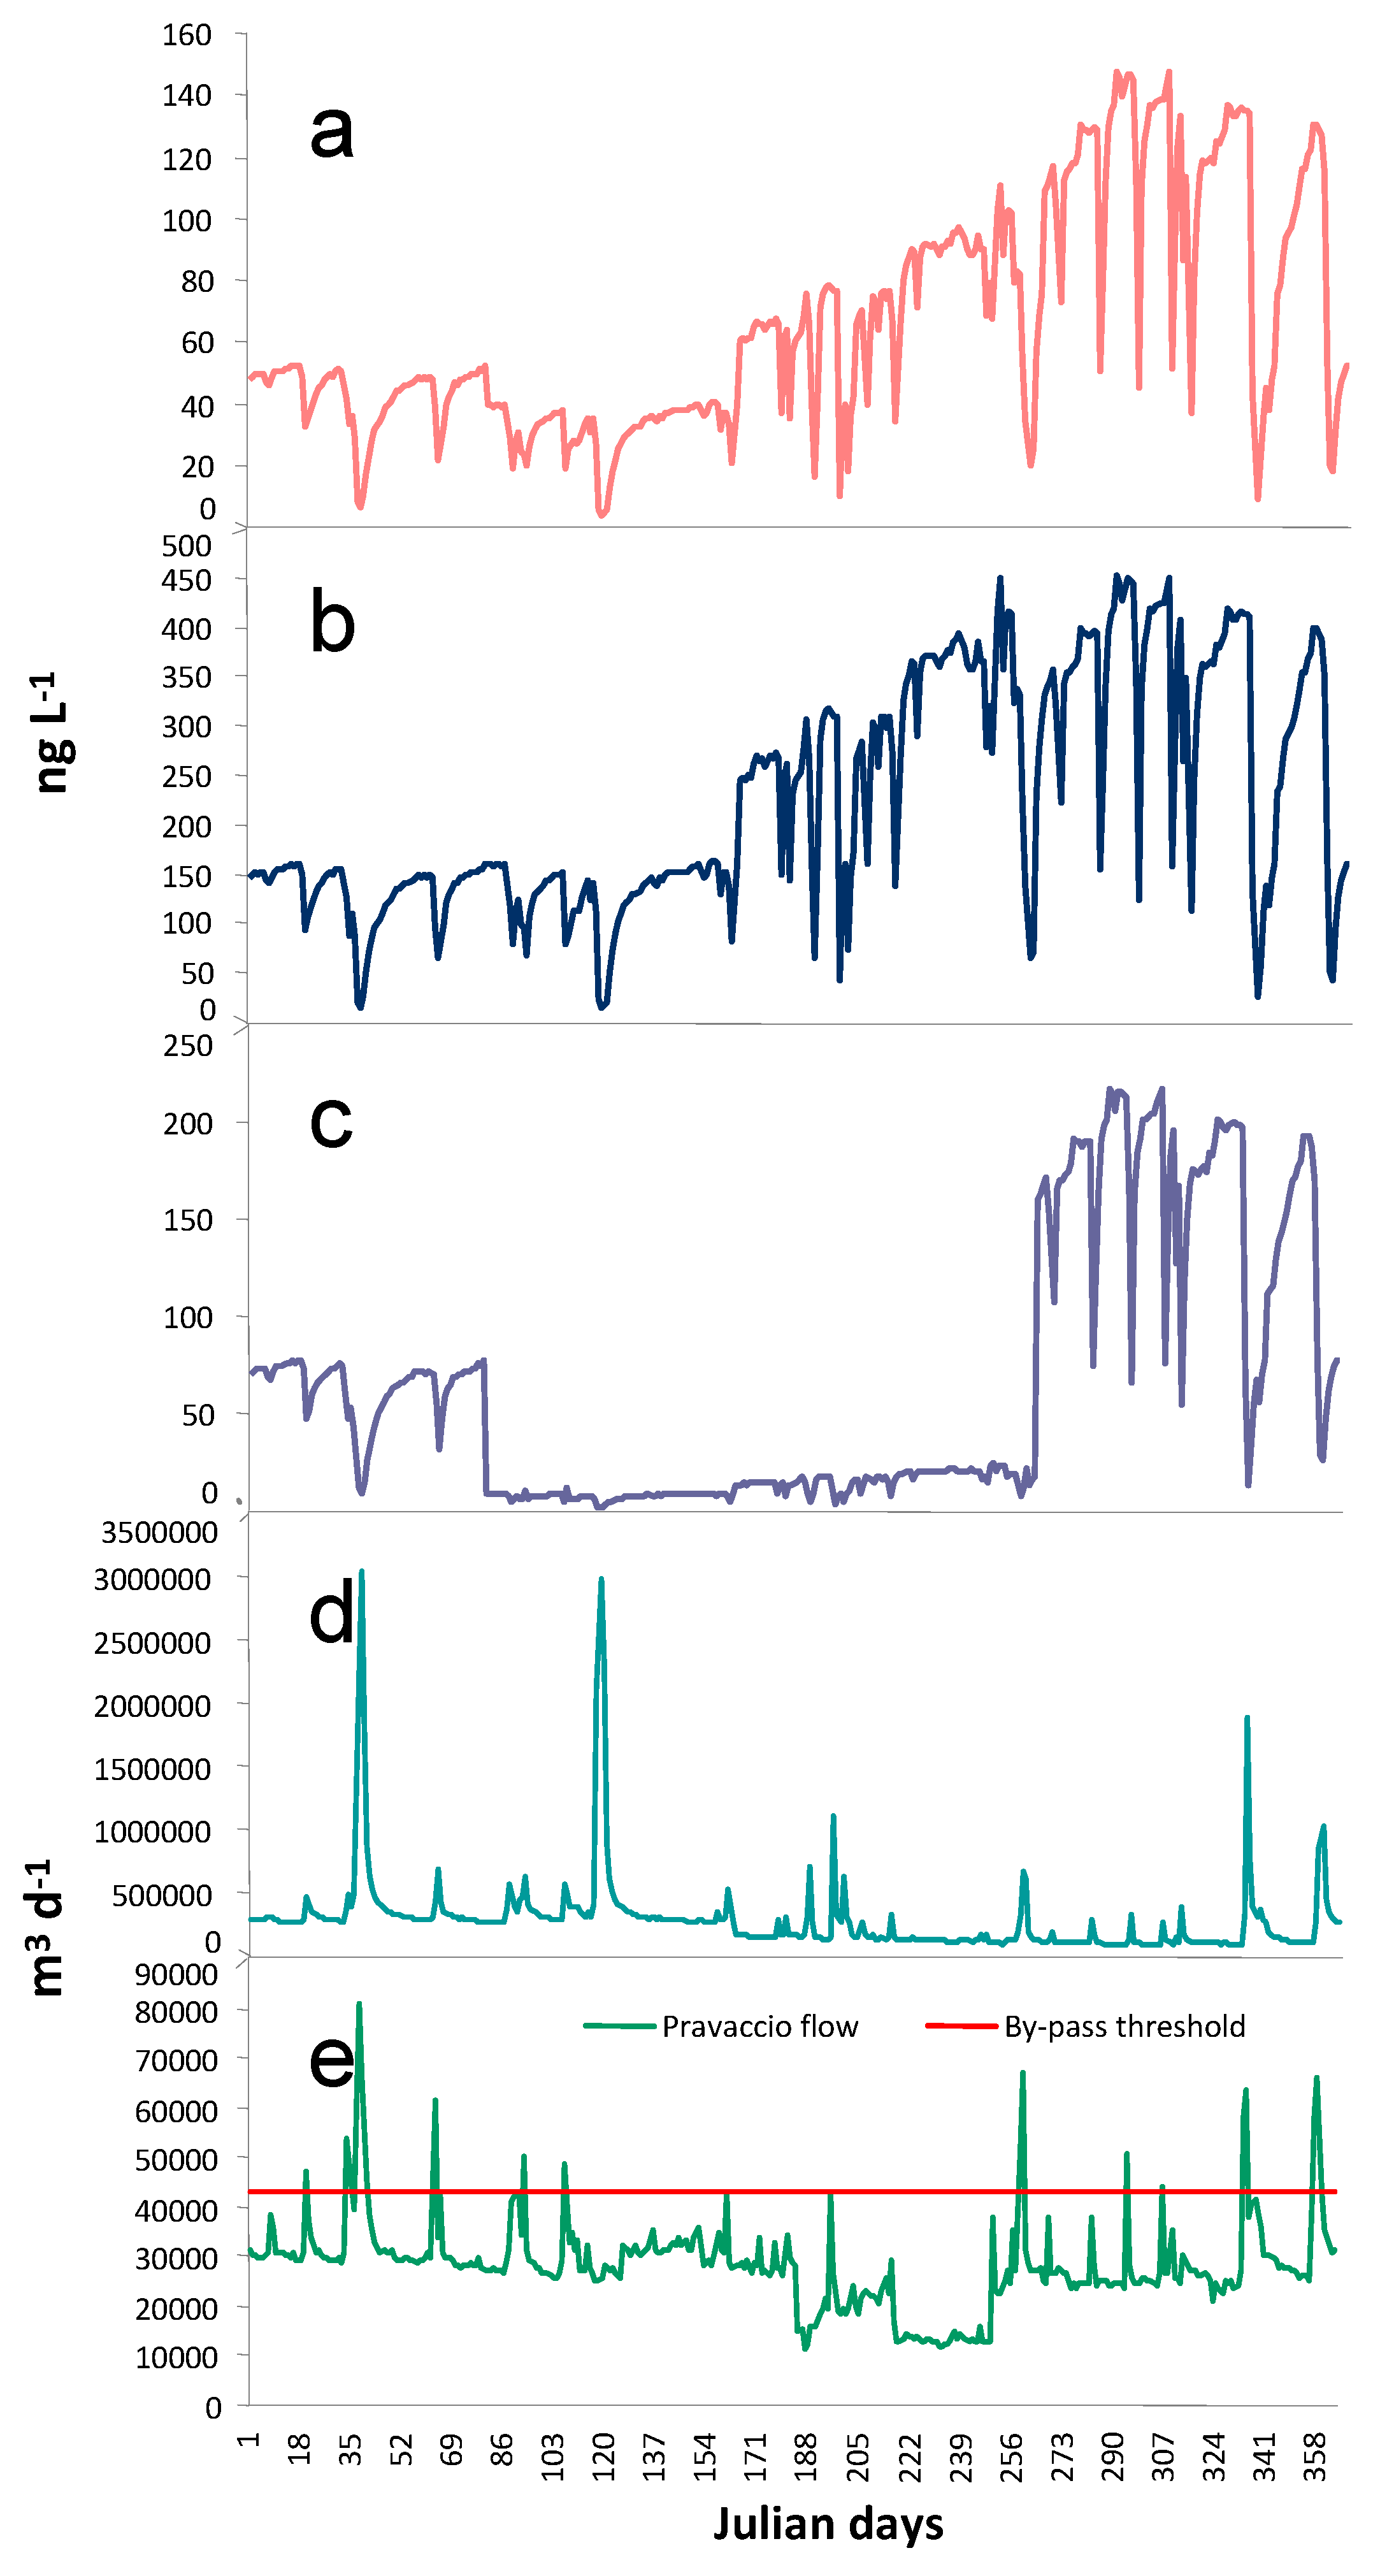
3.4. Predicting Temporal Exposure Concentration Variation in River

To assess the predicted exposure concentration (PEC) variation in time of the measured pharmaceuticals in the Olona River depending on P1 effluent discharge, a simple dilution calculation was performed.
Although a calculation using a dynamic river model would allow to better calculate exposure concentrations (since it would integrate all major loss processes), the dilution calculation, as the one proposed here, is capable to give a worst case scenario to be considered for further analysis. The aim is to give a picture of possible concentration variations in time and their variations as influenced by the main driving forces [45]. This is particularly important since WWTP effluents are often considered and modeled as steady emissions (such as the model GREATER, [46]). The main drivers for variability in water concentrations are, among others, chemical degradation in the plant (removal rate) and in the receiving waters, adsorption to suspended solids and biota, such as macrophytes and algae (for non polar chemicals), emission patterns and environmental variability (which in turn depends on precipitations) influencing water flows in the plant (bypass flow) as well as water flow in the receiving water body. Based on the above driving forces, three different behaviors can be outlined and can be shown in Figure 3:
(i)
type 1 behavior (use pattern dominated, e.g., Ofloxacin, Figure 3a);
(ii)
type 2 behavior (environment dominated, e.g., Carbamazepine, Figure 3b); and
(iii)
type 3 behavior (removal rate dominated, e.g., Ibuprofen, Figure 3c).
Ofloxacin is characterized by an unsteady emission into the environment, which is mainly influenced by its use pattern, strictly bound to seasonality. Degradation seems to play a role of minor importance, since removal rate does not differ so much between winter (43%) and summer (57%). Carbamazepine, instead, is not affected at all by degradation factors, being its removal rate negligible all year round; moreover, it does not seem to follow any particular pattern use, hence only environmental variability can be observed. As for Ibuprofen, it is possible to state that its emission into the environment is quite steady all over the year and that its variability is mainly affected by environmental factors, such as temperature. This is demonstrated by the different removal rate observed in winter (38%) compared to that found in summer (93%). From the hydraulic point of view, similar behaviors can be observed for the three investigated compounds, but the range of variability changes a lot; aquatic ecosystems are, in fact, exposed to different environmental concentrations and loads depending on the compound: for Ofloxacin, environmental concentrations are always under 200 ng/L (with a variation from a few ng/L to about 150 ng/L); for Carbamazepine, values up to 450 ng/L can be observed in both the seasons (with a variation from a few ng/L to about 450 ng/L), while for Ibuprofen concentrations in winter are almost ten times higher than those found in summer (with a variation from a few ng/L to about 200 ng/L).
To evaluate the impact of pharmaceuticals occurred during CSO events on aquatic ecosystems exposure, data were collected for the two plants: these events were, on the whole, 18 for P1 and eight for P2 during 2009. The P1 data were used to calculate the impact of CSO events on Olona River concentrations, which were calculated starting from the level data measured every day at the hydrometric station of Ponte Vedano, downstream from the plant [13]. During the 18 CSO events occurred during the year 2009, a mean of 13,300 m3/day were discharged untreated into the Olona River, ranging from a minimum of 540 m3/day (0.4% of the Olona flow on the same day) to a maximum of 37,530 m3/day (1.2% of the Olona flow on the same day). The proportion between the flow discharged untreated by the plant and the Olona flow grew up to 4.3% during the CSO event occurred in March 2009, since the Olona flow, in that period, was quite low probably because of the preceding long period of dry weather. Taking into account the CSO contribution to the discharge, the contribution for the 18 events is not negligible for the three selected chemicals of the exercise: for Ofloxacin and Carbamazepine, while the minimum contribution was just 1.2% and 2.1%, respectively (on 3 November 2009, Day 307) of the treated loads, the maximum was about 46% and 60% respectively (on 7 February 2009, Day 38), with an average of about 21% and 32%; for Ibuprofen, the minimum contribution was about 2% (on 3 November 2009, Day 307) of the treated loads, the maximum about 89% (on 17 September, 2009 Day 260) with an average of about 40%.

4. Conclusions

The results obtained, together with the analysis of the two WWTPs, allowed evaluating the factors affecting the spatial and temporal concentration variability in effluent waters and the potential influence of this variability in driving the exposure of the aquatic ecosystems in the receiving water body. This shows that the currently available steady-state modeling tools to predict resulting concentrations in river water bodies are not adequate to account for concentration variations in time that can be variable up to two orders of magnitude and often within the same season. While the calculation represents a worst-case scenario (dilution at the point of entry), it shows the need to evaluate the dynamic and temporal behavior of concentrations of pharmaceuticals deriving from WWTP to properly predict the peak exposure of aquatic ecosystems. Such task can be accomplished in the future, for example, by coupling a dynamic surface water model (such as the DynA Model, [47]) to the scenario of outflowing yearly concentration to properly consider the role of sedimentation, degradation and other processes occurring in the receiving water body.

Acknowledgments

Many thanks to Fondazione Comunitaria Varesotto Onlus, which funded the project “Pharmaceuticals emergency in municipal wastewater—Monitoring and study of treatment processes” and to Prealpi Servizi S.r.l., which manages P1 and P2 plants, co-financier of the project. Special thanks to Antonio Di Guardo. We would also like to thank Giordano Urbini, Alessio Broggi, Matteo Bossi, Dario Galli (Varese Hospital Pharmacy), Michele Russo (ARPA-IDRO, Lombardy Region), Camilla Galli (Osservatorio Campo dei Fiori) and Dario Pessina (ASPEM).

Author Contributions

Cristiana Morosini came up with the initial idea, then she collected and processed the data, both the WWTPs and the Olona River datasets and wrote the first draft of the manuscript. Milena Marsoni was responsible for the chemical analyses and Vincenzo Torretta was responsible for organizing the research activity with the manager of the plants. All the co-authors contributed in writing the final version of the manuscript.

Conflicts of Interest

The authors declare no conflict of interest.

References

  1. Calamari, D.; Zuccato, E.; Castiglioni, S.; Bagnati, R.; Fanelli, R. Therapeutic drugs in the rivers Po and Lambro in Northern Italy: A strategic survey. Environ. Sci. Technol. 2003, 37, 1241–1248. [Google Scholar] [CrossRef]
  2. Tixier, C.; Singer, H.P.; Oellers, S.; Muller, S.R. Occurrence and fate of Carbamazepine, Clofibric Acid, Diclofenac, Ibuprofen, Ketoprofen, and Naproxen in surface waters. Environ. Sci. Technol. 2003, 37, 1061–1068. [Google Scholar] [CrossRef] [PubMed]
  3. Tahar, A.; Tiedeken, E.J.; Clifford, E.; Cummins, E.; Rowan, N. Development of a semi-quantitative risk assessment model for evaluating environmental threat posed by the three first EU watch-list pharmaceuticals to urban wastewater treatment plants: An Irish case study. Sci. Total Environ. 2017, 603–604, 627–638. [Google Scholar] [CrossRef] [PubMed]
  4. Fent, K. Effects of Pharmaceuticals on Aquatic Organisms. In Pharmaceuticals in the Environment. Sources, Fate, Effects and Risks, 3rd ed.; Kümmerer, K., Ed.; Springer: Berlin, Germany, 2008; pp. 175–203. [Google Scholar]
  5. Gheorghe, S.; Petre, J.; Lucaciu, I.; Stoica, C.; Nita-Lazar, M. Risk screening of pharmaceutical compounds in Romanian aquatic environment. Environ. Monit. Assess. 2016, 188, 379. [Google Scholar] [CrossRef] [PubMed]
  6. New Challenges for Risk Assessment. Available online: http://ec.europa.eu/health/scientific_committees/consumer_safety/docs/sccs_o_131.pdf (accessed on 1 October 2014).
  7. Di Guardo, A.; Hermens, J.L.M. Challenges for exposure prediction in ecological risk assessment. Integr. Environ. Assess. Manag. 2013, 9, 4–14. [Google Scholar] [CrossRef] [PubMed]
  8. Torretta, V. PAHs in Wastewater: Removal efficiency in a conventional wastewater treatment plant and comparison with model predictions. Environ. Technol. 2012, 33, 851–855. [Google Scholar] [CrossRef] [PubMed] [Green Version]
  9. Torretta, V.; Katsoyiannis, A. Occurrence of polycyclic aromatic hydrocarbons in sludges from different stages of a wastewater treatment plant in Italy. Environ. Technol. 2013, 34, 937–943. [Google Scholar] [CrossRef] [PubMed]
  10. Castiglioni, S.; Bagnati, R.; Calamari, D.; Fanelli, R.; Zuccato, E. A multiresidue analytical method using solid-phase extraction and high-pressure liquid chromatography tandem mass spectrometry to measure pharmaceuticals of different therapeutic classes in urban wastewaters. J. Chromatogr. A 2005, 1092, 206–215. [Google Scholar] [CrossRef] [PubMed]
  11. Zuccato, E.; Castiglioni, S.; Fanelli, R.; Reitano, G.; Bagnati, R.; Chiabrando, C.; Pomati, F.; Rossetti, C.; Calamari, D. Pharmaceuticals in the environment in Italy: Causes, occurrence, effects and control. Environ. Sci. Pollut. Res. Int. 2006, 13, 15–21. [Google Scholar] [CrossRef] [PubMed]
  12. Raboni, M.; Torretta, V.; Urbini, G. Influence of strong diurnal variations in sewage quality on the performance of biological denitrification in small community wastewater treatment plants (WWTPs). Sustainability 2013, 5, 3679–3689. [Google Scholar] [CrossRef] [Green Version]
  13. Portale Idrologico Geografico di ARPA Lombardia. Available online: http://idro.arpalombardia.it/pmapper4.0/map.phtml?dg=idro,scaledeflusso,lomb,com,fiumi,laghi,CTR10,CTR50,ORTO,PANO&me=1466213.61762,5063146.335,1503023.5130699998,5087550.165&language=it&config=default (accessed on 1 October 2014).
  14. Castiglioni, S.; Bagnati, R.; Fanelli, R.; Pomati, F.; Calamari, D.; Zuccato, E. Removal of pharmaceuticals in sewage treatment plants in Italy. Environ. Sci. Technol. 2006, 40, 357–363. [Google Scholar] [CrossRef] [PubMed]
  15. Verlicchi, P.; Al Aukidy, M.; Zambello, E. Occurrence of pharmaceutical compounds in urban wastewater: Removal, mass load and environmental risk after a secondary treatment—A review. Sci. Total Environ. 2012, 429, 123–155. [Google Scholar] [CrossRef] [PubMed]
  16. Vieno, N.M.; Tuhkanen, T.; Kronberg, L. Elimination of pharmaceuticals in sewage treatment plants in Finland. Water Res. 2007, 41, 1001–1012. [Google Scholar] [CrossRef] [PubMed]
  17. Kostich, M.S.; Batt, A.L.; Lazorchak, J.M. Concentrations of prioritized pharmaceuticals in effluents from 50 large wastewater treatment plants in the US and implications for risk estimation. Environ. Pollut. 2014, 184, 354–359. [Google Scholar] [CrossRef] [PubMed]
  18. Torretta, V.; Ragazzi, M.; Trulli, E.; De Feo, G.; Urbini, G.; Raboni, M.; Rada, E.C. Assessment of biological kinetics in a conventional municipal WWTP by means of the oxygen uptake rate method. Sustainability 2014, 6, 1833–1847. [Google Scholar] [CrossRef] [Green Version]
  19. Küster, A.; Alder, A.C.; Escher, B.I.; Duis, K.; Fenner, K.; Garric, J.; Hutchinson, T.H.; Lapen, D.R.; Péry, A.; Römbke, J.; et al. Environmental risk assessment of human pharmaceuticals in the European Union: A case study with the β-Blocker Atenolol. Integr. Environ. Assess. Manag. 2010, 6, 514–523. [Google Scholar] [CrossRef] [PubMed]
  20. Barron, L.; Nesterenko, E.; Hart, K.; Power, E.; Quinn, B. Holistic visualisation of the multimodal transport and fate of twelve pharmaceuticals in biosolid enriched topsoils. Anal. Bioanal. Chem. 2010, 397, 287–296. [Google Scholar] [CrossRef] [PubMed]
  21. Sipma, J.; Osuna, B.; Collado, N.; Monclús, H.; Ferrero, G.; Comas, J.; Rodriguez-Roda, I. Comparison of removal of pharmaceuticals in MBR and activated sludge systems. Desalination 2010, 250, 653–659. [Google Scholar] [CrossRef]
  22. Morais, S.A.; Delerue-Matos, C.; Gabarrell, X.; Blánquez, P. Multimedia fate modeling and comparative impact on freshwater ecosystems of pharmaceuticals from biosolids-amended soils. Chemosphere 2013, 93, 252–262. [Google Scholar] [CrossRef] [PubMed]
  23. Gros, M.; Petrović, M.; Ginebreda, A.; Barceló, D. Removal of pharmaceuticals during wastewater treatment and environmental risk assessment using hazard indexes. Environ. Int. 2010, 36, 15–26. [Google Scholar] [CrossRef] [PubMed]
  24. Grossberger, A.; Hadar, Y.; Borch, T.; Chefetz, B. Biodegradability of pharmaceutical compounds in agricultural soils irrigated with treated wastewater. Environ. Pollut. 2014, 185, 168–177. [Google Scholar] [CrossRef] [PubMed]
  25. Zuccato, E.; Castiglioni, S.; Fanelli, R. Identification of the pharmaceuticals for human use contaminating the Italian aquatic environment. J. Hazard. Mater. 2005, 122, 205–209. [Google Scholar] [CrossRef] [PubMed]
  26. Clara, M.; Strenn, B.; Kreuzinger, N. Carbamazepine as a possible anthropogenic marker in the aquatic environment: Investigations on the behavior of Carbamazepine in wastewater treatment and during groundwater infiltration. Water Res. 2004, 38, 947–954. [Google Scholar] [CrossRef] [PubMed]
  27. Li, W.C. Occurrence, sources, and fate of pharmaceuticals in aquatic environment and soil. Environ. Pollut. 2014, 187, 193–201. [Google Scholar] [CrossRef] [PubMed]
  28. Kümmerer, K.; Al-Ahmad, A. Estimation of the cancer risk to humans resulting from the presence of cyclophosphamide and ifosfamide in surface water. Environ. Sci. Pollut. Res. Int. 2010, 17, 486–496. [Google Scholar] [CrossRef] [PubMed]
  29. Delgado, L.F.; Dorandeu, C.; Marion, B.; Gonzalez, C.; Faucet-Marquis, V.; Schetrite, S.; Albasi, C. Removal of a cytostatic drug by a membrane bioreactor. Desalination Water Treat. 2009, 9, 112–118. [Google Scholar] [CrossRef]
  30. Zhang, J.; Chang, V.W.; Giannis, A.; Wang, J.Y. Removal of cytostatic drugs from aquatic environment: A review. Sci. Total Environ. 2013, 445–446, 281–298. [Google Scholar] [CrossRef] [PubMed]
  31. Lin, A.Y.-C.; Lin, Y.-C.; Lee, W.-N. Prevalence and sunlight photolysis of controlled and chemotherapeutic drugs in aqueous environments. Environ. Pollut. 2014, 187, 170–181. [Google Scholar] [CrossRef] [PubMed]
  32. Hydrochlorothiazide. Available online: http://www.chemspider.com/Chemical-Structure.3513.html (accessed on 1 October 2014).
  33. Stuer-Lauridsen, F.; Birkved, M.; Hansen, L.P.; Holten Luetzhøft, H.-C.; Halling-Sørensen, B. Environmental risk assessment of human pharmaceuticals in Denmark after normal therapeutic use. Chemosphere 2000, 40, 783–793. [Google Scholar] [CrossRef]
  34. Radjenović, J.; Petrović, M.; Barceló, D. Fate and distribution of pharmaceuticals in wastewater and sewage sludge of the conventional activated sludge (CAS) and advanced membrane bioreactor (MBR) treatment. Water Res. 2009, 43, 831–841. [Google Scholar] [CrossRef] [PubMed]
  35. Hazardous Substances Data Bank (HSDB). Available online: http://toxnet.nlm.nih.gov/cgi-bin/sis/search2/r?dbs+hsdb:@term+@rn+@rel+58-93-5 (accessed on 1 October 2014).
  36. Brigante, M.; DellaGreca, M.; Previtera, L.; Rubino, M.; Temussi, F. Degradation of hydrochlorothiazide in water. Environ. Chem. Lett. 2005, 2, 195–198. [Google Scholar] [CrossRef]
  37. Hansch, C.; Leo, A.; Hoekman, D. Exploring QSAR—Hydrophobic, Electronic, and Steric Constants; Hansch, C., Leo, A., Hoekman, D.H., Eds.; American Chemical Society: Washington, DC, USA, 1995; Volume 2, p. 348.
  38. Wu, D.; Li, H.; Liao, S.; Sun, X.; Peng, H.; Zhang, D.; Pan, B. Co-sorption of ofloxacin and Cu(II) in soils before and after organic matter removal. Sci. Total Environ. 2014, 481, 209–216. [Google Scholar] [CrossRef] [PubMed]
  39. Al Aukidy, M.; Verlicchi, P.; Jelić, A.; Petrović, M.; Barceló, D. Monitoring release of pharmaceutical compounds: Occurrence and environmental risk assessment of two WWTP effluents and their receiving bodies in the Po Valley, Italy. Sci. Total Environ. 2012, 438, 15–25. [Google Scholar] [CrossRef] [PubMed]
  40. Torretta, V.; Urbini, G.; Raboni, M.; Copelli, S.; Viotti, P.; Luciano, A.; Mancini, G. Effect of Powdered Activated Carbon to Reduce Fouling in Membrane Bioreactors: A Sustainable Solution. Case Study. Sustainability 2013, 5, 1501–1509. [Google Scholar] [CrossRef] [Green Version]
  41. Radjenović, J.; Petrović, M.; Barceló, D. Advanced mass spectrometric methods applied to the study of fate and removal of pharmaceuticals in wastewater treatment. Trends Anal. Chem. 2007, 26, 1132–1144. [Google Scholar] [CrossRef]
  42. Luciano, A.; Viotti, P.; Mancini, G.; Torretta, V. An integrated wastewater treatment system using a BAS reactor with biomass attached to tubolar supports. J. Environ. Manag. 2012, 113, 51–60. [Google Scholar] [CrossRef] [PubMed] [Green Version]
  43. Zhang, Y.; Geiβen, S.U.; Gal, C. Carbamazepine and diclofenac: Removal in wastewater treatment plants and occurrence in water bodies. Chemosphere 2008, 73, 1151–1161. [Google Scholar] [CrossRef] [PubMed]
  44. Jelić, A.; Gros, M.; Petrović, M.; Ginebreda, A.; Barceló, D. Occurrence and Elimination of Pharmaceuticals during Conventional Wastewater Treatment. In Emerging and Priority Pollutants in Rivers. Bringing Science into River Management Plans. The Handbook of Environmental Chemistry; Guasch, H., Ginebreda, A., Geiszinger, A., Eds.; Springer: Berlin, Germany, 2012; pp. 1–23. [Google Scholar]
  45. Viotti, P.; Luciano, A.; Mancini, G.; Torretta, V. A wastewater treatment using a biofilm airlift suspension reactor with biomass attached to supports: A numerical model. Int. J. Environ. Sci. Technol. 2014, 11, 571–588. [Google Scholar] [CrossRef] [Green Version]
  46. Boeije, G.; Vanrolleghem, P.; Matthies, M. A geo-referenced aquatic exposure prediction methodology for ‘down-the-drain’ chemicals. Contribution to GREAT-ER # 3. Water Sci. Technol. 1997, 36, 251–258. [Google Scholar]
  47. Di Guardo, A.; Ferrari, C.; Infantino, A. Development of a dynamic aquatic model (DynA Model): Estimating temporal emissions of DDT to Lake Maggiore (N. Italy). Environ. Sci. Pollut. Res. Int. 2006, 13, 50–58. [Google Scholar] [CrossRef] [PubMed]
Figure 1. Concentrations of detectable pharmaceuticals in: influents (top); and effluents (bottom) of the two plants P1 and P2 (all available samples, averages with standard error). No detects were calculated as 0.5 limit of detection (LOD). Notes: ATE = Atenolol; BEZ = Bezafibrate; CAR = Carbamazepine; CYC = Cyclophosphamide; HYD = Hydrochlorothiazide; IBU = Ibuprofen; OFL = Ofloxacin.
Sustainability 09 01466 g001
Figure 2. Concentrations of detectable pharmaceuticals in: influents (top); and effluents (bottom) of the two plants P1 and P2 during the sampled days in April (averages with standard error). No detects were calculated as 0.5 limit of detection (LOD). Notes: ATE = Atenolol; BEZ = Bezafibrate; CAR = Carbamazepine; CYC = Cyclophosphamide; HYD = Hydrochlorothiazide; IBU = Ibuprofen; OFL = Ofloxacin.
Sustainability 09 01466 g002
Figure 3. Concentrations of pharmaceuticals in Olona River: (a) Ofloxacin; (b) Carbamazepine; and (c) Ibuprofen, compared to: Olona River flow (d); and P1 treated flow (e) in 2009. The horizontal line in (e) represents the threshold of water contribution of CSO (bypass flow).
Sustainability 09 01466 g003
Table 1. Main features of the two monitored wastewater treatment plants (WWTPs).
Treatment Unit CharacteristicsPlant P1Plant P2
Pre-treatmentsScreenScreen/Oil and Sand Removal
Primary clarificationPresent cAbsent
Biological treatmentActivated SludgePredenitrification/Activated Sludge-Nitrification
Secondary clarificationPresentPresent
Tertiary treatmentsAbsent dPhosphorus Removal with FeCl3; Chemical Clarification; Disinfection with sodium hypochlorite
Average a flow rate (m3/day)28,28628,645
Population equivalents (p.e.) a49,80027,700
Operating F:M
(KgBOD5/KgSS·day) b
0.230.09
SRT (days) b3.111.8
HRT (hours) b2331.7
Notes: a Mean of the monthly values of flow rates registered during the year 2009 in each plant; p.e. referred to 2009; b F:M: Food To Microorganisms Ratio (evaluated during the three analytical campaigns); SRT: Sludge Retention Time (average value, as mean of the monthly values of the year 2009); HRT: Hydraulic Retention Time (average value, as mean of the monthly values of the year 2009, referred to the whole plant); c Oil and Sand Removal Unit located inside the first clarifier; d Disinfection unit built after 2009.
Table 2. Concentrations of pharmaceuticals (ng/L) in influent/effluent in the two plants P1 and P2.
Pharmaceutical (ng/L)SampleP1 P2
AprilJuneSeptemberAprilJuneSeptember
MonWedFriMonMonMonWedFriMonMon
AtenololInfluent540389472498532352537592504754
Effluent37957.32632357186181296413208116
BezafibrateInfluent14.528.217.7311.488.9010.3419.9630.115.888.10
Effluent17.73(a)30.8916.207.576.7316.5737.6810.87(a)
CarbamazepineInfluent6494844082131452428331533416152723
Effluent8737.2411783418298956266585923815721
CyclophosphamideInfluent29.2317.9813.6914.03(a)22018.4917.06131(a)
Effluent(a)7.26(a)(a)(a)791(a)(a)136(a)
HydrochlorothiazideInfluent304(a)12469336619.693475.63659412
Effluent987130656.76443269(a)369634.33257156
IbuprofenInfluent4314839622857164286424815829555579
Effluent23073176375030922.63326(a)256123
OfloxacinInfluent1950101458410001522385265117611065165
Effluent115(a)30269414770.6410917524.0370.61
SalbutamolInfluent(a)(a)(a)(a)6.63(a)(a)(a)(a)8.95
Effluent(a)5.87(a)(a)10.01(a)(a)(a)(a)7.07
Note: (a) is not detected, lower than the limit of quantification (LOQ, 5 ng/L).
Table 3. Physical-chemical and degradation properties of the investigated chemicals.
PharmaceuticalLog KowKd (L/KgTSS)pKaHL (Water) (d)
Atenolol0.16 [19]15 [20]; 64 [21]9.6 [22]No significant to medium removal efficiency [23]
Bezafibrate4.25 [24]14 [20]3.6 [24]83% degraded in 6d [25]
Carbamazepine2.45 [24]11 [26]; 20–68 [27]13.9 [27]100 [25]
Cyclophosphamide0.63 [28]457–933 (a) [29]2.84 [30]; 4.5–4.8 [31]44 (sunlight), 80 (dark), lake water [29]
Hydrochlorothiazide−0.07 [32]0.1 (b) [33]; 20.2–25.8 (b) [34]7.0 and 9.2 [21]; 7.9 [35] <5 [36]
Ibuprofen3.97 [24]; 4 [27]10–60 [27]4.5–5.2 [27]<1 [25]
Ofloxacin−0.39 [37]1000–31,000 [38](c)6.05 and 8.22 [21]; 10.6 [25]
Salbutamol0.01 [33](c)5.9 [20](c)
Notes: (a) sludge/supernatant; (b) estimated; (c) not available.

