China’s Tree Residue Sources and Quantity Estimation


1
School of Economics and Management, Beijing Forestry University, Beijing 100083, China
2
School of Economics and Management, North China Electric Power University, Beijing 102206, China
3
Department of Development Planning and Funds Management, State Forestry Administration of China, Beijing 100714, China
4
China National Forest Products Industry Association, Beijing 100013, China
5
City Economic Research Institute, Jiangxi Academy of Social Sciences, Nanchang 330077, China
*
Author to whom correspondence should be addressed.
Sustainability 2017, 9(9), 1659; https://0-doi-org.brum.beds.ac.uk/10.3390/su9091659
Submission received: 28 June 2017
/
Revised: 4 September 2017
/
Accepted: 10 September 2017
/
Published: 19 September 2017
(This article belongs to the Special Issue Reducing Agricultural and Food Waste: Implications for Biodiversity and the Environment)
Abstract
:In China, due to forest resource scarcity, the problem of timber supply shortage has been around for a long time. The recycling and utilization of tree residues may effectively alleviate the situation and will contribute to emissions reduction and environmental protection. Therefore, this study aims to identify the tree residue resources and estimates their quantity in order to provide a basis for related research, such as its comprehensive utilization. This study redefines and reclassifies tree residue resources, in particular, it adds three tree residue resources: tree seedling residue, sanitation felling residue and urban greening and trimmings. This study divides the forest final felling and bucking residue resource into the stumpage section and the non-stumpage section, respectively, scientifically selects values of the percent of merchantable volume and the proportion of non-stumpage biomass of the stumpage volume, separately estimates the quantity of bamboo felling, bucking and processing residues, classifies the forest product processing zone into the sawing section and the forest product processing section, and estimates the current waste wood recycling quantity by tracking the timber output of previous years. The estimation results for tree residue quantity indicate that China’s tree residue reached 511.63 Mt in 2015, of which the forest tending and thinning residue was 406.76 Mt, nearly four-fifths of the total tree residue. Among the 31 provinces (municipalities and autonomous regions), more than half (55.57%) of the potential reserve of tree residues is distributed in the 13 provinces of southern China, 25% in the 10 provinces in the north, and approximately 20% in the plain and hilly areas. During the 12th Five-Year Plan period, the tree residue reserves showed positive growth. In the past three years (2014–2016), all state-owned forestry farms and collective-owned natural forests stopped commercial felling gradually, which directly resulted in a reduction of log output, thereby also curbing the growth of tree residue to a certain extent. Since the log output has ceased to further decline from 2017, it is predicted that China’s tree residue will continue the upward trend.
1. Introduction
In consideration of China’s shortage of forest resources and lack of timber supply, the reasonable utilization of residue produced in forest production and operations may effectively alleviate the situation and will be of profound significance for the low-carbon efforts, emissions reduction and environmental protection. This study aims to identify the tree residue resources and estimate their quantity in order to provide a basis for related research, such as its comprehensive utilization.
Over the past dozen years, much research has been carried out in China in tree residue quantity estimation, mainly in three categories: residue produced in the process of forest harvesting and tree seedling [1,2,3,4,5] and wood processing residue [6,7], trimmings of tree tending and thinning [1,2,4,5,8,9,10,11] and waste wood recycling [12,13]. The estimation is mostly made according to the resource estimation model developed in line with the top-down system analysis idea and according to quantity of each category of forest resource and the corresponding conversion coefficient [3,8,9,14,15,16,17,18,19,20]. The existing problems include: the definition of tree residue is incomplete, and the estimation scope does not include the tree residue produced in the process of tree seedling and sanitation felling residue; the estimation of the urban greening residue and trimmings is rough; improper selection or even emission of the empirical-data-based estimation benchmarks, methods and coefficients, in addition to insufficient study of the details, resulting in high differences in the tree residue estimation. For example, Zhang Weidong and other scholars estimated that residues produced in forest growth and production were 884 Mt in 2013 [9] while Wang H. et al. estimated it was 302.84 Mt [18].
Compared with existing studies, this study estimates China’s tree residue quantity with the latest forestry production statistics data from the following perspectives: first, redefine and classify the tree residue, and add tree residue from the process of tree seedling, sanitation felling residue and urban greening and trimmings to the estimation so as to make its content and scope more complete; second, divide the forest final felling and bucking residues into the stumpage section and non-stumpage section, and systematically study literature to select the residue output ratio and the proportion of forest final felling and bucking residue in a scientific way, and reasonably estimate the forest final felling and bucking residue; third, separately estimate the bamboo felling, bucking and processing residues to make up the shortage of related research; fourth, classify the forest product processing zone into the sawing and the forest product processing sections to estimate the residue quantity; fifth, estimate the current waste wood recycling quantity by tracking the historical timber output to make the estimation result more reasonable, and sum up the total tree residue.
2. Materials and Methods
The research targets the obtainable tree residue instead of the theoretic total quantity. Considering the ecological recovery of the felling area, we remove part of the felling residue left in the felling area (stumps of broad-leaved trees) [20]. The residue produced in the process of sawing and wood product processing cannot be completely collected, for example powder leftovers [7], thus they are also excluded in this study. When selecting the values of the residue output ratio from the previous studies, the worst occasions of residue output were chosen.
2.1. Definition and Classification of Tree Residue
Most scholars of China reach consensus on the definition and classification of tree residue to some extent. They start from the forest growth, production and operation processes and classify the tree residues into woodland residue and forestry residue. A small number of scholars divide the forestry operation into stumping, tending management, trimming, thinning, afforestation seedling, final felling, bucking and processing residues according to collection means [9].
Based on the National Forestry Biomass Energy Development Plan (2010–2020) and the Technical Requirements on the Formulation of Annual Forest Felling Quota during the 12th Five-Year Plan Period, in combination with the felling type (final felling, tending felling and other felling) and different stages of afforestation [21,22], the study divides the tree residue into five categories according to its source, namely the tree residue from the process of tree seedling, residue produced in the process of forest tending and thinning, final felling and bucking residue, forest product processing residue, and waste wood (Figure 1).
2.1.1. Tree Seedling Residue
Tree seedling residue refers to seedling pruning, stem setting and stem cuttings leftover in the process of tree seedling before afforestation [9]. China has seen rapid growth of nursery stock. In 2015, the number reached 67.1 billion trees, equaling to that in 2014, an increase of 7.1 billion trees compared with that in 2013 [23,24,25]. The continuous growth momentum makes the quantity of tree residue increasingly remarkable.
2.1.2. Tree Tending and Thinning Residue
This term refers to the undersized logs, branches, shrubs, bark, leaves, roots and other tree residue produced in the process of forest tending and thinning, forest cleaning operations and tending and pruning in unprotected woodland. The quantity of residue produced in forest thinning is more than one times of that of felling and bucking leftovers, and makes up quite a large part of the tree residue [17,18].
This study divides the residue produced in the process of tree tending and thinning into forest tending and thinning residue and woodland production residue by referring to the land ownership identified in the national forest resource survey [16]. The forest tending and thinning residue is produced in the process of tending, thinning and clean-up activities of timber forest, protection forest and special forest. Woodland production residue means trees growing in the forest under a low protection level (e.g., Grade IV protection woodland of China) or non-woodland, and not included in the forest for industrial timber purpose, including shrub stumping residue, residue from economic forest tending management, pruning residue of trees inside and alongside farmland and scattered forest, and urban greening and pruning residue [3,16,18].
In the process of forest tending, sanitation felling of trees hit by abiotic and biotic damaging agents or trees in poor sanitation conditions mainly involved cutting trees without a cultivation future because of such harms [26], normally conducted in combination with other tending and felling, and is conducted alone only after a large-scale sudden disaster. Such residues have a high potential. In 2015 alone, 13,000 hectares of forest were hit by fire, and 12.18 million hectares hit by diseases, pests and mice [24]. However, considering the randomness of natural disasters and the lack of an authoritative dead wood felling guide, the statistical data is insufficient for estimating such residue. This study does not cover such estimation and leaves it for future research.
2.1.3. Final Felling and Bucking Residue
The final felling and bucking residue refers to the bark, branches, treetops, stumps and waste timber that are not suitable for being produced into economic timber, firewood and small-dimension timber [27]. This study divides it into commercial timber, i.e., stumpage, non-stumpage residue and bamboo felling residue produced in log (commercial timber) and firewood production. The commercial timber area consists of the stumpage and non-stumpage sections because their accumulation has different proportions in the standing stock [5]. Non-stumpage residue mainly includes roots and branches, whereas stumpage residue mainly includes bark, branches, treetops, stumps and waste timbers that are not suitable for being produced into economic timber, firewood and small-dimension timber.
2.1.4. Forest Product Processing Residue
The forest product processing residue mainly includes bark, slab edgings, offal, sawdust, abrasive flour and shavings etc. For example, sawmill residue, and waste produced in the processing of plywood and particle board production [28]. The directly used log and firewood produce almost no residue during processing [28,29], most parts of the residue for paper-making is in the form of black liquor which is reused in the pulping and paper-making industry as bio-energy [30,31] and is therefore not covered by the study. This study mainly calculates the forest product processing residue produced in the stages of log sawing and sawn timber being produced into wood products.
2.1.5. Waste Wood
The waste wood is mainly wood derelicts from the infrastructure and durable wood consumer goods, and wood discards from industrial products, logistics and warehousing, convention and exhibition and construction sites and disposable wood derelicts [32]. Each year China sees at least 50 million m3 of waste wood, equaling the annual merchantable timber output [33]. With increasing demand for life quality, the replacement of wooden furniture is becoming faster and faster. Though old railroad ties and old electric poles have a relatively longer replacement cycle, the recycling quantity each year reaches nearly 100 Mt [34]. Each year China discards more than 45 billion pairs of disposable chopsticks, and does not recycle these chopsticks intentionally [35]. Waste wood is a high potential reserve in China, and improvement of the recycling rate can alleviate China’s shortage of timber to some extent.
2.2. Methods
This study uses the top-down model to estimate the residue quantity of the five categories. It comprehensively considers the data availability and rationality when selecting specific variables. The following paragraphs will explain the calculation method in detail.
2.2.1. Estimation of Tree Tending and Thinning Residue
The thinning and pruning of different types and different intensities produce undersized timber, branch and root residues of different qualities and quantities. This study therefore makes a detailed division of the forest type and thinning intensity, and calculates the residue from urban tree pruning.
• Estimation Formula
The yields of tree residue are variable depending on the different forest types in different areas, and their productivity and collectability [1]. By referring to Yuan’s calculation method for tree residue quantity and Perttu, A.’s thinning intensity data , this study constructs the Formulas (1) and (2).
where is the quantity (Mt) of tending and thinning residue; is the reserve (m3) or area (hectare) of the j-th type forest of i-th age group; is the thinning intensity or residue production intensity of the j-th type forest of i-th age group; is the residue output ratio of the j-th type forest of i-th age group; i = 1 or 2 refers to the young growth forest and middle-aged forest respectively; and = 1, 2 or 3 stands for timber forest, protection forest and special forest respectively.
where is the quantity (Mt) of woodland production residue; and is the area (hectare) of economic forest, shrubbery and scattered forest or the number of trees inside and alongside farmland. stands for the residue output ratio of the corresponding forest type. See Table 1 and Table 2 for the values of the variables.
According to the study of Guo Huibin on the interlucation of natural forest and man-made young growth forest, it is appropriate to choose 10% and 15% for the thinning intensity of young growth forest and middle-aged forest [37]. However, considering that middle-aged forest thinning will deliver 40% of industrial logs [38], i.e., that the tree residue is 60% of articles obtained from thinning, the middle-aged forest thinning intensity was eventually determined to be 9%. The residue output intensity of protection forest and special forest was determined to be 0.2 [1,36]. In addition, the tree residue output of the economic forest varies from area to area, and thus it was divided into three areas, southern, plain and hilly and northern areas. The southern area includes Zhejiang, Fujian, Jiangxi, Hunan, Hubei, Guangdong, Hainan, Yunnan, Guizhou, Sichuan, Chongqing, Guangxi and Tibet, totally 13 provinces, municipalities and autonomous regions; the plain and hilly area includes Beijing, Tianjin, Hebei, Shandong, Henan, Jiangsu, Anhui and Shanghai provinces (municipalities); and the northern area includes Liaoning, Jilin, Heilongjiang, Ningxia, Xinjiang, Shanxi, Shaanxi, Gansu and Qinghai, totally 10 provinces (autonomous regions). Taiwan, Hong Kong and Macao are not included in the study [18].
• Estimation of urban greening tree residue
Based on the provision of the Evaluation Standards for Urban Landscaping and Greening that “the shrub coverage in greenbelt should not be lower than 70%” [39], this study converted the greening area of various regions [40,41] into a minimum vertical projection area of the trees and shrubs of various regions. Then it referred to the number of garden trees in Tianjin in 2015 [42,43,44] to calculate trees in a unit vertical projection area, then estimated the quantity of greening trees in various regions by multiplying trees in a unit vertical projection area and the minimum vertical projection area of trees and shrubs of various regions, and then worked out the urban greening trees of various regions. Finally, this study adopted the residue output ratio of trees inside and alongside farmland to estimate the quantity of urban green tree residue of various regions.
According to the data in China Statistical Yearbook 2016, the urban green coverage of 31 provinces varies in the range of 29.8–48.4%, and the average urban green coverage is 39.43%. The urban green coverage of Beijing is 48.4% (highest), while Tianjin’s level is 36.4%, which represents the lower level of urban greening in China. Because only the greening tree numbers of Beijing and Tianjin city are available, based on the conservative estimation principle, this study adopts Tianjin’s green coverage to estimate trees in a unit greening area.
2.2.2. Estimation of Final Felling and Bucking Residue
Considering that firewood is not a tree residue source according to the definition and classification of tree residue in this study, this study revised Wang’s calculation equation [18], constructing Formulas (3) and (4), to calculate the tree residue produced in the final felling and bucking by stumpage residue and non-stumpage residue, specifically calculating the timber output, percent of merchantable volume, wood density, and other variables. The non-stumpage residue was calculated based on the stumpage reserve and corresponding proportion. Because the volume and quality of wood will vary with the moisture content of wood, the wood density refers to the density of a moisture content, for example full dry density, air-dry density (moisture content about 15%) and basic density. Among them, air-dry density is the most commonly used index in estimating the amount of forest residue, due to the fact that its humidity tends to balance with the relative humidity of the atmosphere. This study adopts the air-dry density to indicate wood density,
where is the quantity (Mt) of stumpage residue produced in the process of tree final felling and bucking; is the annual log output (m3) from tree final felling and bucking process of China; is the percent of merchantable volume (proportion between log volume and stumpage volume); stands for annual output (m3) of firewood from the tree final felling and bucking process; and is the wood air-dry density (i.e., the weight of air-dry timber is divided by the volume of air-dry wood).
where is the quantity (Mt) of non-stumpage residue produced in the process of tree final felling and bucking; and c stands for the proportion of non-stumpage biomass of the stumpage volume.
This study selected 0.618 t/m3 (the mean air-dry density of the 228 main tree species of China) [45] as the value of wood air-dry density, and based on Wang’s study, chose 77.17% (weighted average of 1393 samples of the percent of merchantable volume in 43 studies) [18] as the value for the percent of merchantable volume.
The non-stumpage residue mainly includes branches and roots. This study determines the factor c according to the percentage of the respective non-stumpage residue of broad-leaved trees and conifer, and the weight of the two kinds of timber output (the area of broad-leaved trees and conifer is 1:1). See Table 3 for the related data.
This study chose the worst residue output occasion, and calculated the quantity of non-stumpage final felling residue regardless of whether they were conifer or broad-leaved trees. Since the biomass of branches and roots is 25% and 20% of the stumpage volume (Table 3), c is determined to be 45% accordingly.
2.2.3. Estimation of Forest Product Processing Residue
The forest product processing residue consists of residue produced in the stages of log sawing and sawn timber being produced into wood products. The process of log sawing is based on the sawn timber output; the process of sawn timber being produced into wood product is based on the factory lumber statistics data. Thus, the wood processing residue is calculated by comprehensively considering the proportion of log sawing residue and the wood product processing residue. Based on Wang’s study [18] and taking account the loss factor of residue in the sawing process and wood product processing, this study constructed Formula (5).
where is quantity (Mt) of forest product processing residue; is the annual output (m3) of sawn timber; is the sawn timber yield rate, which refers to the ratio of the volume of the square lumber (the finished product of the sawing process) to the volume of the log before sawing. is the attrition rate of residue from the sawing process. Some factors such as mechanical loss and powder collection difficulties result in residue losses in the sawing process. The attrition rate of residue in the sawing process refers to the ratio of the loss volume of residue in the sawing process to the volume of the log sawn. is the annual output (m3) of factory lumber, specifically the timber used for processing in the forestry statistics yearbook; stands for the wood product yield rate; and is the attrition rate of residue produced in the wood product processing. See Table 4 for the forest product processing yield rate, residue proportion and residue attrition rate.
The study chose the worst occasion of residue output, 74%, for the sawn timber yield rate , and 60% for the wood product yield rate . The attrition rate of the sawing process and wood product processing is 4% and 1.5% respectively [6] while the proportion of obtainable residue for the sawn timber and wood product processing is 22% and 38.5%, respectively.
2.2.4. Estimation of Bamboo Felling and Bucking and Processing Residue
Considering that bamboo timber uses quite different technology and standards from wood processing, felling and bucking, and that the residue proportion is different, this study calculated the bamboo processing, felling and bucking residue separately. Based on the significant correlation between the ground part biomass of bamboo and the bamboo culm [46,47,48,49,50], this study estimated the weight of bamboo branches and leaves through the weight of bamboo culm and arrived at the residue proportion by working out the bamboo timber utilization rate. This study borrowed Wang’s estimation formula [18]. However, instead of only choosing a comprehensive proportion between bamboo culm and branches and leaves, this study investigated and set the proportions for the large-diameter Phyllostachys heterocycla cv. pubescens, and other bamboo and small-diameter bamboo separately to estimate the weight of bamboo branches and leaves. Formula (6) is as follows:
where is quantity (Mt) of the bamboo felling and processing residue; i = 1, 2 or 3 stands for large-diameter Phyllostachys heterocycla cv. pubescens, and other species of bamboo with a large diameter and a small diameter respectively; is the output for species i of bamboo; is the proportion between bamboo branches and leaves and bamboo culms for species i of bamboo; is the proportion of the bamboo timber processing residue (ratio between the bamboo processing residue and the bamboo timber volume); and is the weight of the unit of bamboo timber.
• Proportion between bamboo culm and branches and leaves
The proportion between bamboo branches and leaves and bamboo culm refers to the ratio between the dry weight of fixed and dried branches and leaves and the bamboo culm. The proportion is different among different species of bamboo. China’s bamboo mainly includes Phyllostachys heterocycla cv. pubescens and others. To simplify the calculation, we set the proportion for the large-diameter Phyllostachys heterocycla cv. pubescens, other bamboo and small-diameter bamboo.
Researchers mostly choose Phyllostachys heterocycla cv. pubescens for a specific area to estimate the proportion of various organs of the ground part of the bamboo [46,48,49,50,51]. Xu Zhenguo studied the relationship of the biomass of the ground part among Dendrocalamus latiflorus of different ages and the results show that the proportion of bamboo culm mass increases with age [52]. See Table 5 for the proportion between bamboo branches and leaves and bamboo culm of Phyllostachys heterocycla cv. pubescens, other species of bamboo and small-diameter bamboo in previous studies.
This study chose the lowest occasion of residue output and determined the proportion between bamboo branches and leaves and bamboo culm of Phyllostachys heterocycla cv. pubescens to be 26.1%, and 23.6% for the proportion of other species of bamboo, represented by Dendrocalamus latiflorus; for the small-diameter bamboo, we adopted the data of one-year Dendrocalamus latiflorus, i.e., 40.8% [52]; the unit bamboo culm weight is 15 kg/bamboo tree [18].
• Proportion of bamboo timber processing residue
A lot of research has been carried out on the bamboo timber processing and utilization rate. For example, Liu Zhikun (2003) and Zheng Xingfu (2004) and other scholars have drawn the conclusion that “above 60% bamboo timber become processing residue” [53,54]. Except for bamboo particleboard, the utilization rates of other kinds of bamboo use are all below 50%, and some even as low as 20–25%. For example, the utilization rate of bamboo flooring is 20–25% [55]. The bamboo timber utilization rate of various kinds of bamboo board profiles is only 30–50% [56]. This study supposed a high processing utilization rate (i.e., the low discard rate) and adopted 50% for the proportion of bamboo timber processing residue.
2.2.5. Estimation of Waste Wood
To facilitate the estimation, the study divided the waste wood into two categories, first, the directly used log (Purlin for house building, wire pole and pit prop, etc.) that is eliminated with expiry of the service life, and second, replaced processed wood products. When estimating the waste wood recycling quantity (Mt) from the perspective of the directly used log and wood product service life, this study traced the directly used log and wood product output throughout history, and set an average service life and a recycling rate for them to estimate the current potential waste wood quantity [18].
China’s wood-based panel output has kept growing over the past decade, from 30 million cubic meters in 2000 to 320 million cubic meters in 2015, wood products made from wood-based panels (such as furniture, etc.) continue to increase, and have become a major source of waste wood. However, considering that the main material of wood-based panels is tree residue, in order to avoid double counting, the estimation in this study does not include the quantity of recycled wood products made from wood-based panels. The estimation formula is as follows:
where stands for the waste wood quantity (Mt) in n-th year; is the output (m3) of directly used log in m-th year; is the recycling rate of directly used log; is the output (m3) of processing timber in m’ year; is the sawn timber yield rate; is the wood product yield rate; is the wood product recycling rate; and p is the wood air-dry density. The differences between n and m and n and indicate the service life of directly used log and wood product, in this study both are set as 12 years, and the recycling rate of these two kinds of waste wood are both set at 65% [18].
2.3. Data Source
The seedling output and merchantable volume of firewood, directly used log, factory lumber, bamboo timber and sawn timber needed for the calculation of the final felling and bucking residue and waste wood are from the China Forestry Statistical Yearbook (2011–2015). The basic data for the estimation of the tending and thinning residue is quoted from the National Forestry Resource Statistics—the 8th National Forestry Resource Survey. The urban greening data is quoted from the China Statistical Yearbook 2016. All above data sources are the most authoritative, and are officially published.
3. Results
This study systematically expounded the tree residue classification and estimation methods, and prudently chose the related parameters to make the estimation of tree residue quantity more reasonable and credible. The estimation results and discussions of tree residue quantity are as follows:
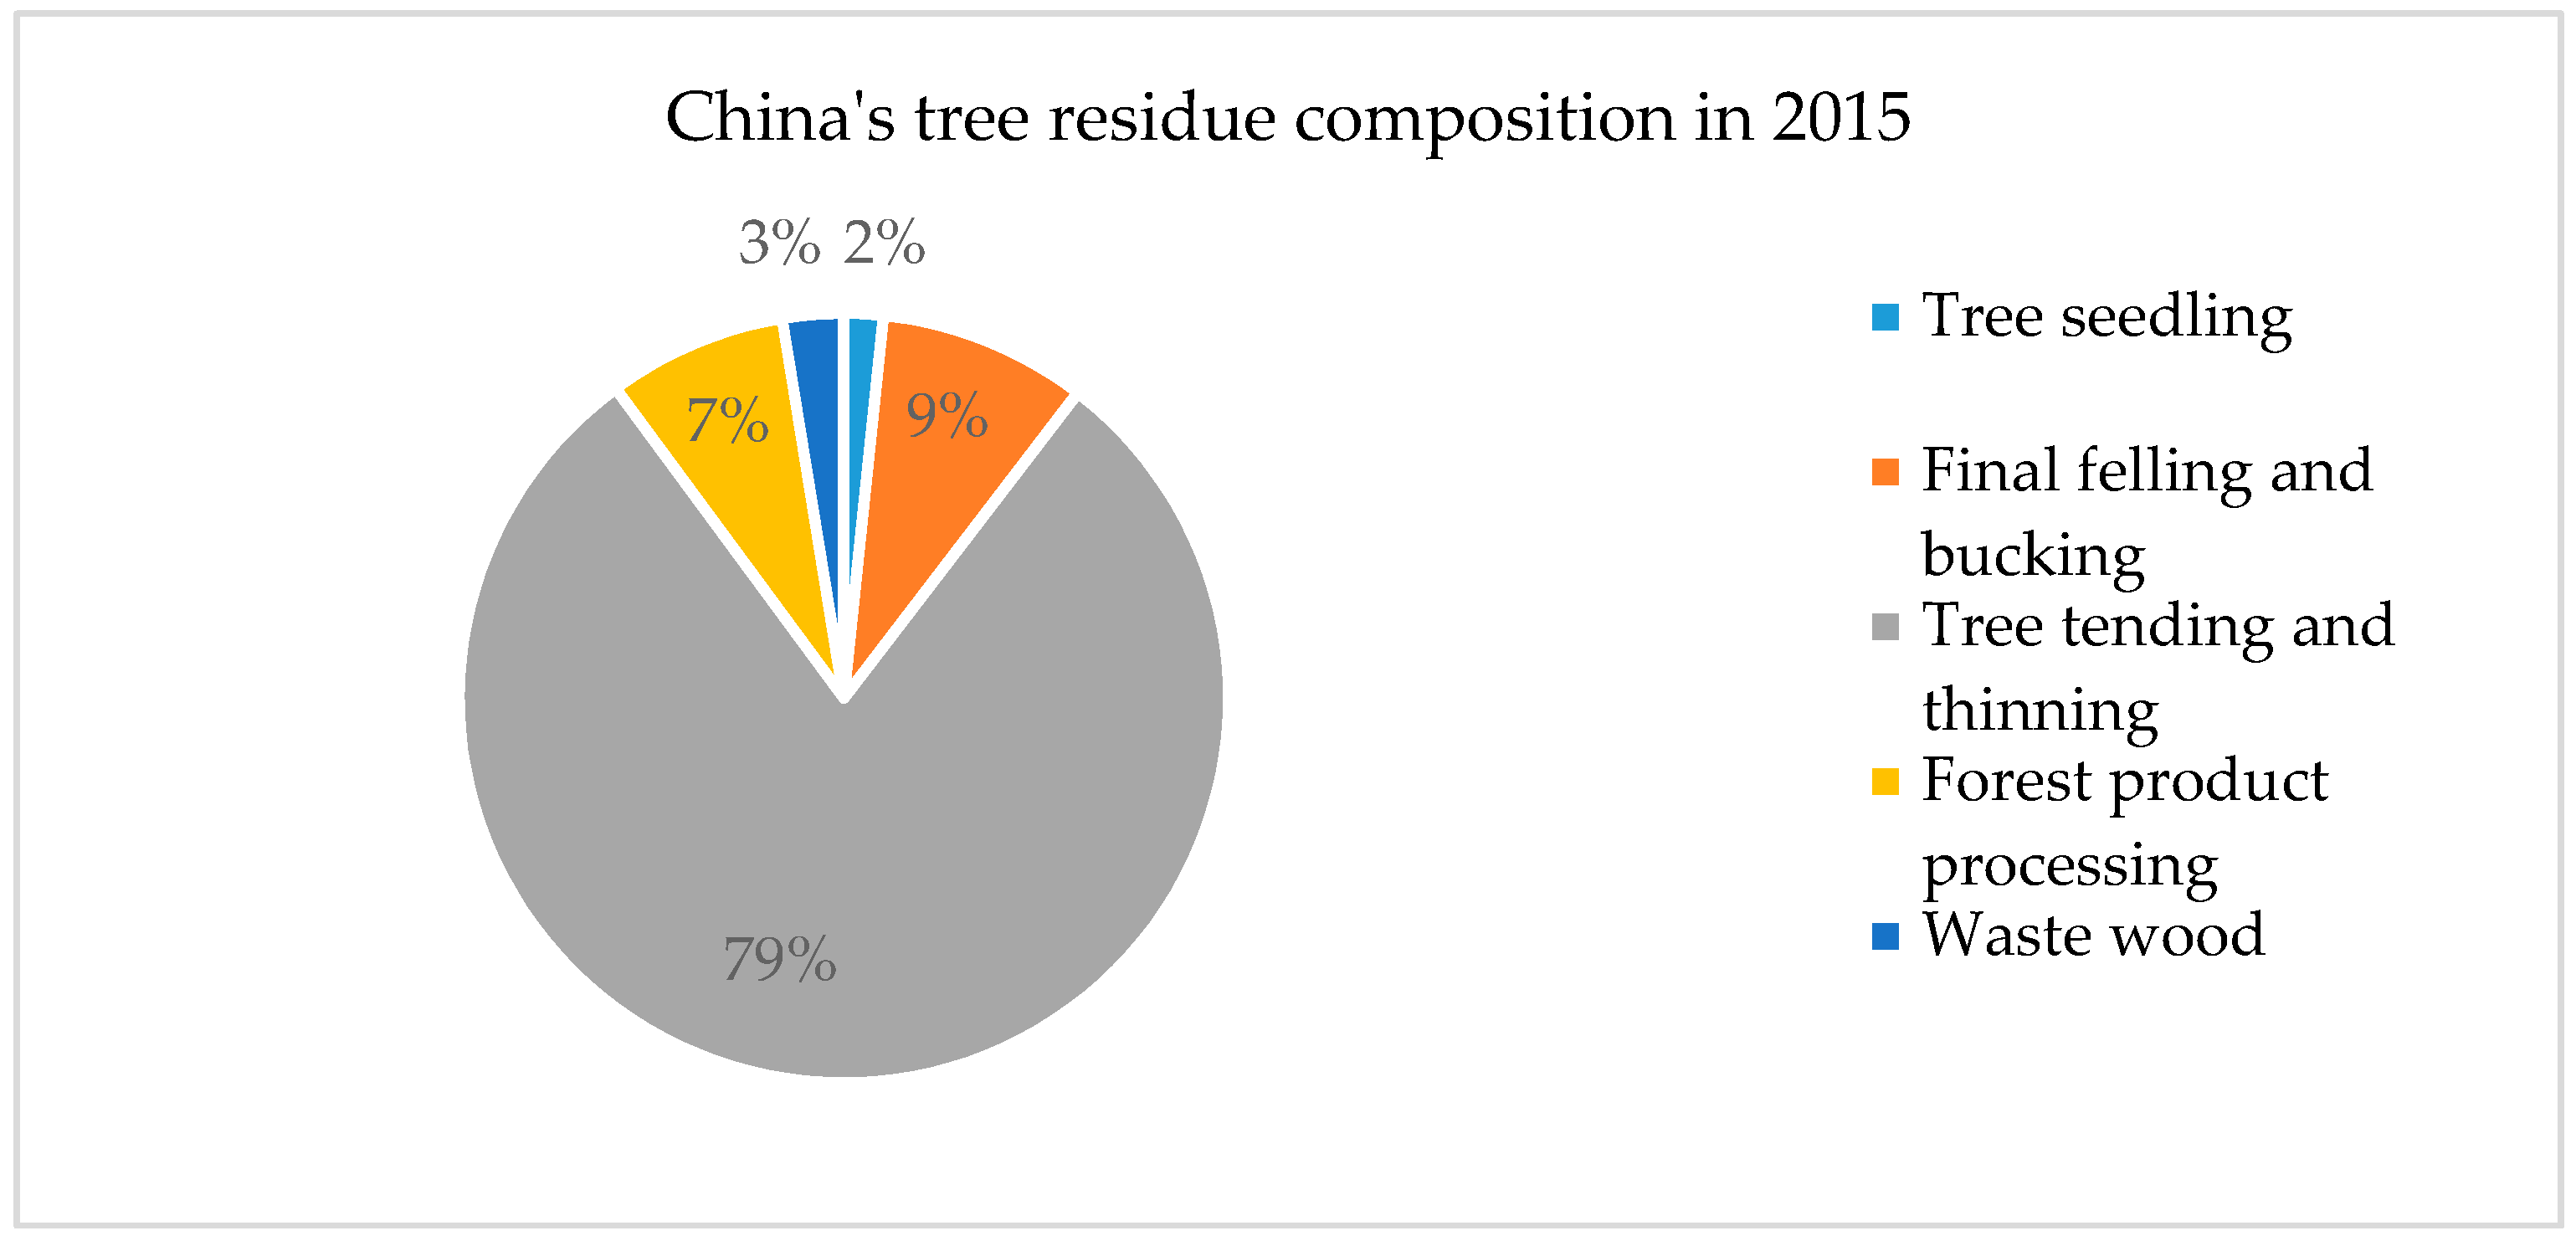
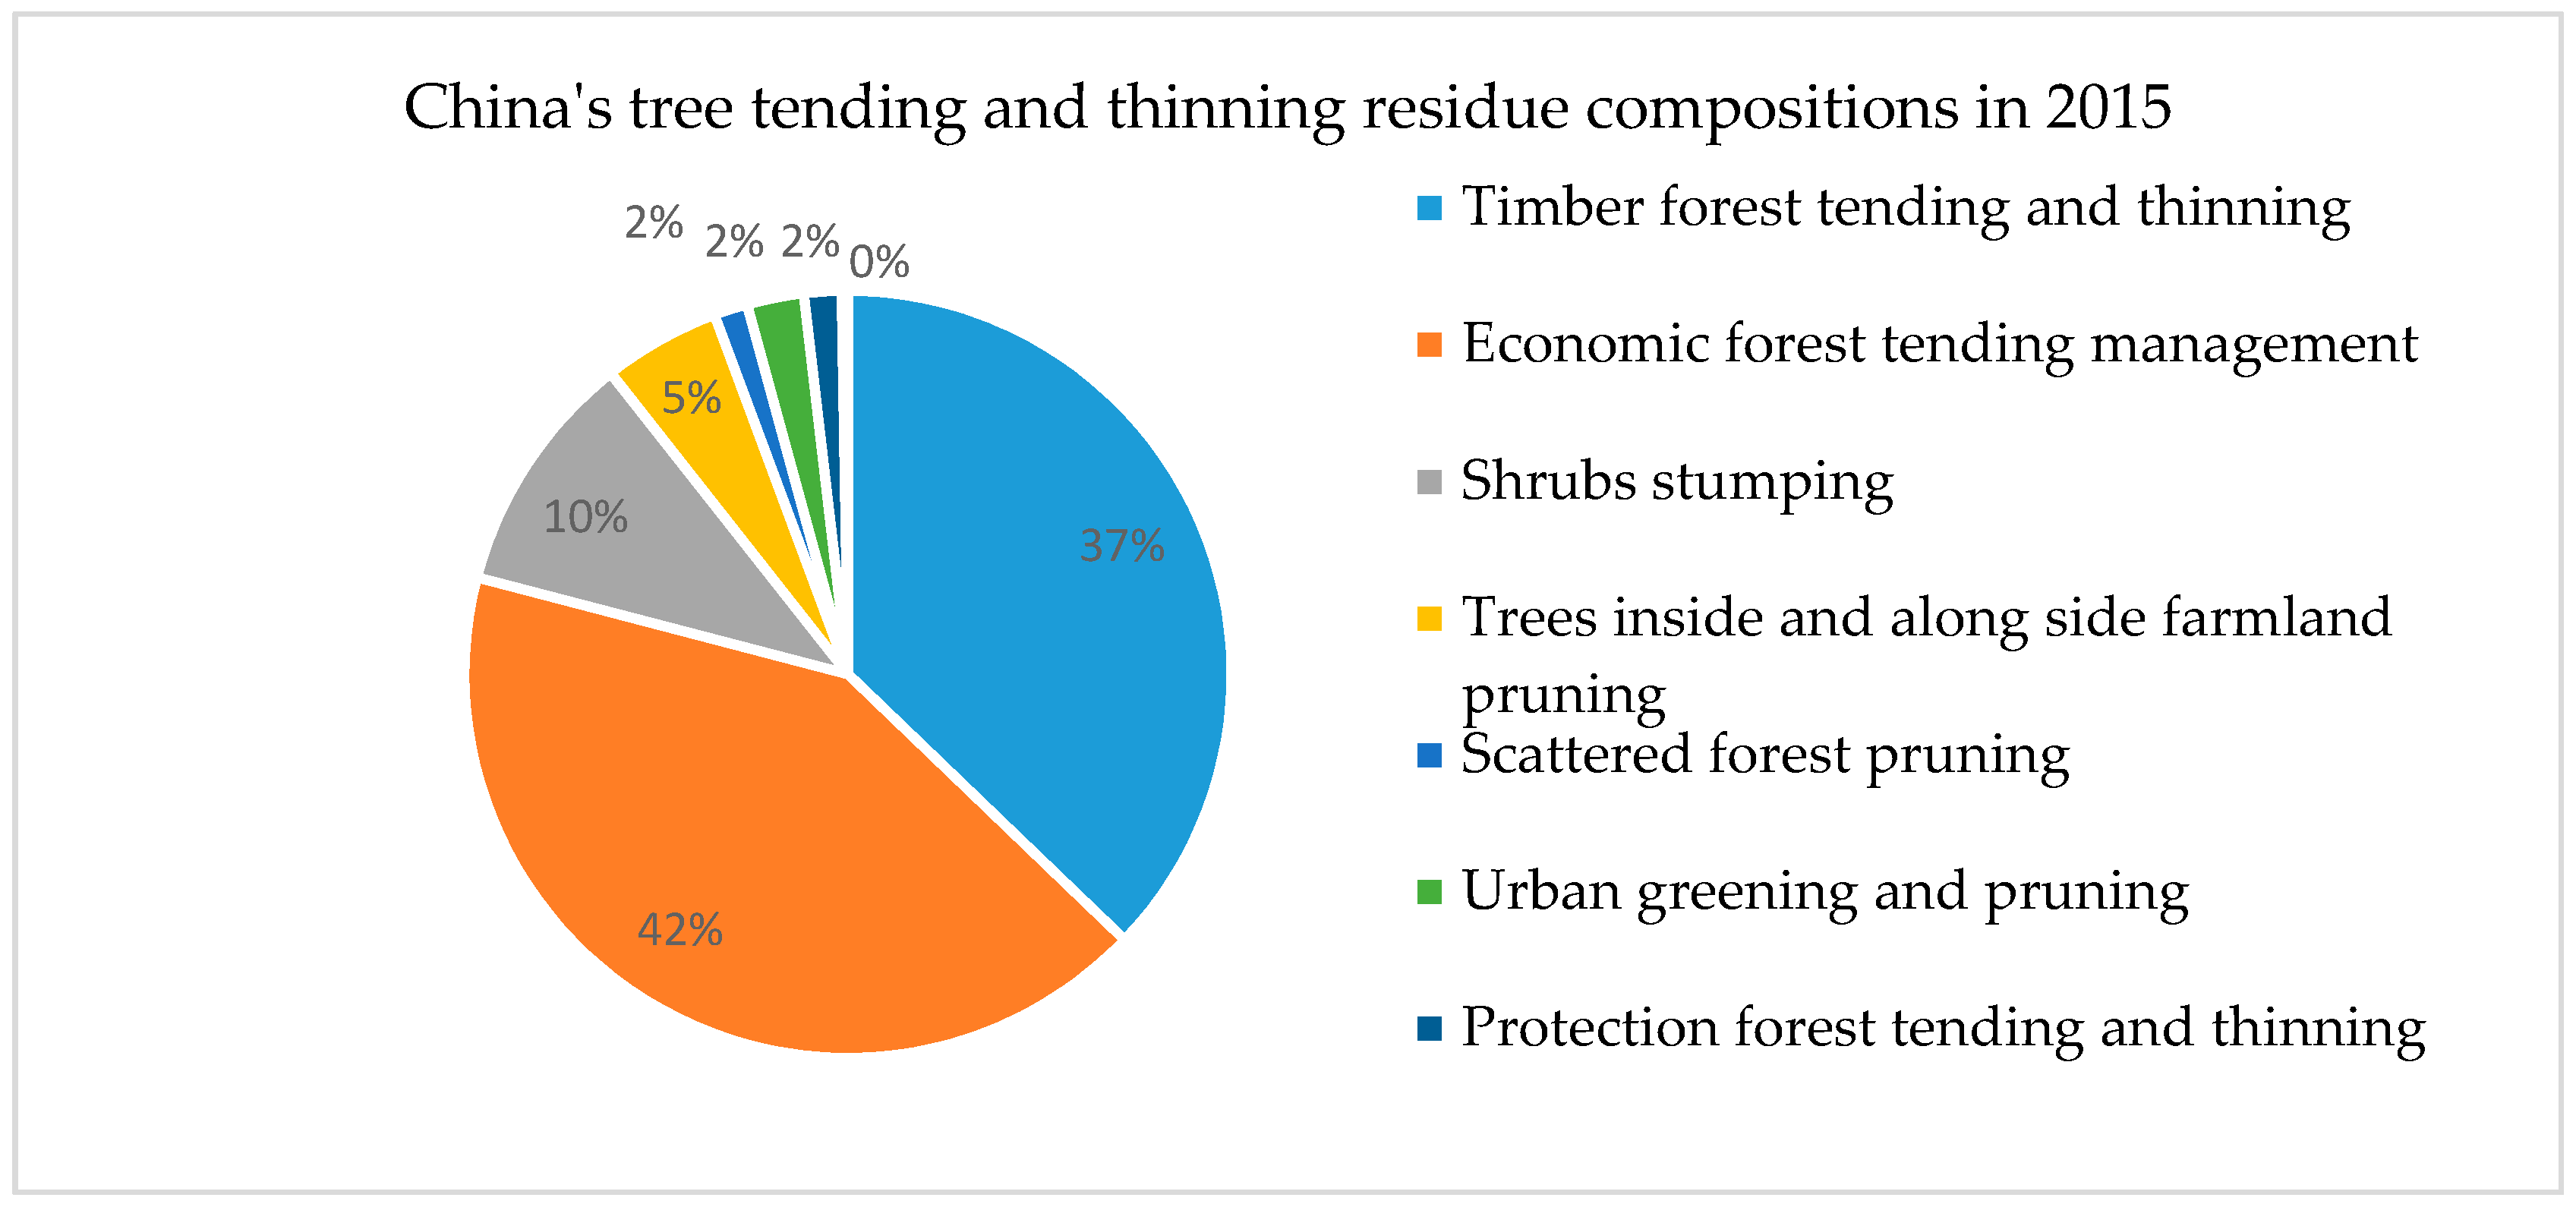
- In 2015, China’s tree residue reached 511.63 Mt (Table 6), of which the forest tending and thinning residue was 406.76 Mt, nearly 4/5 of the total tree residue (Figure 2). The tending and thinning residue from economic forests and timber forests was 170.43 and 151.18 Mt, accounting for 33.3% and 29.5% of the total; the final felling and bucking residue was 44.8241 Mt, and the forest product processing residue was 38.5103 Mt, accounting for 8.76% and 7.53% of the total, respectively (Figure 3). In particular, as China is a massive importer of timber and imported log processing will also produce a certain amount of residue, we chose 40% as the residue output ratio for imported log processing to make a rough estimation, and the results show that there were about 10 Mt residue produced each year during 2011–2015, accounting for about 2% of the total. Due to a lack of detailed data and little effect, this was not included in the estimation scope of this study.
- Among the 31 provinces (municipalities and autonomous regions), more than a half (55.57%) of the potential reserve of tree residue is distributed in the 13 provinces of southern China, 25% in the 10 provinces in the north, and approximately 20% in the plain and hilly areas. Guangxi boasts the highest potential reserve of tree residue, reaching 55.57 Mt, or 10.93% of the total (Table 7).
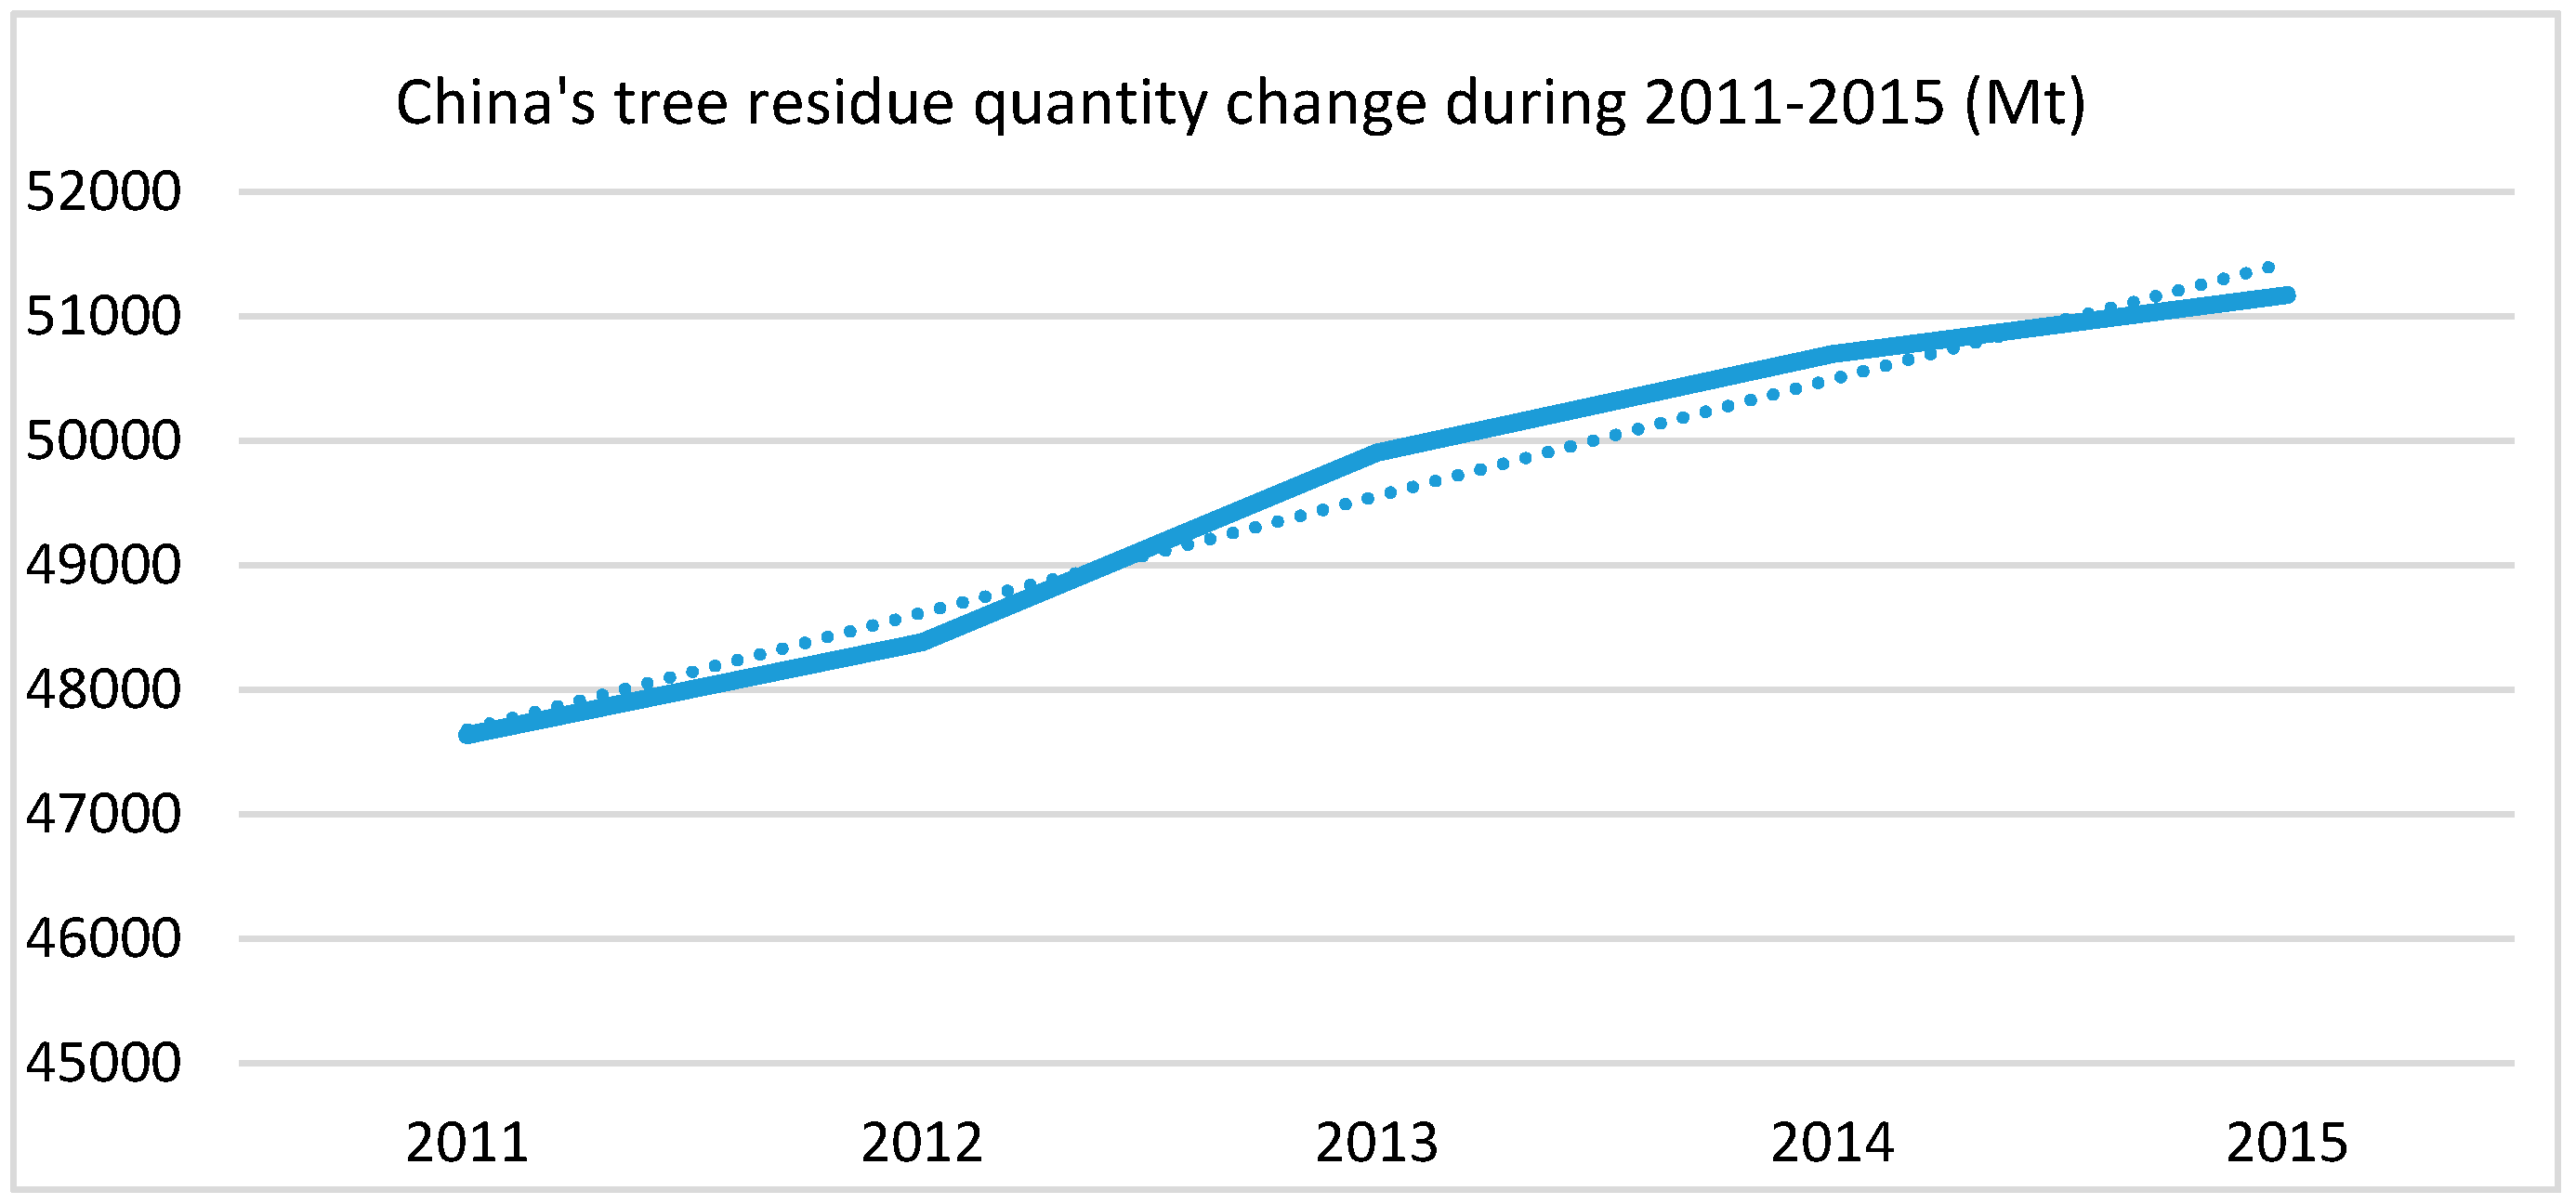
- During the 12th Five-Year Plan period, the tree residue reserve showed positive growth. In the years between 2011 and 2013, the growth rate increased year by year. The annual average growth rate from 2011 to 2014 was about 1.8%, and the growth rate in 2013 was 3.14%. The growth rate declined in 2014, and showed a further decline in 2015 (Figure 4).
4. Discussion
The above results show that more than half of the potential reserve of tree residue is distributed in southern China, 25% in the north, and approximately 20% in the plain and hilly areas, and that Guangxi boasts the highest potential reserves. This is caused by various factors such as climate characteristics, forest type, tree dimensions, etc. The vast majority of China’s forest resources are concentrated in the northeast and southwest. The southern areas mostly lie in a tropical zone, and are China’s largest economic forest and artificial forest base, where forestry has always been well-developed, whereas climate characteristics (less rain, temperature, etc.) lead to poor forest resources in the northern, plain and hilly areas. According to the report of the 8th National Forestry Resource Survey results, the reserve percentage of young growth timber forest in the 13 provinces of southern China, the 10 provinces in northern areas and the plain and hilly areas are 70%, 20% and 10%, respectively; the reserve percentage of middle-aged timber forests are 60%, 30%, and 10%, respectively; while the percentages of economic forest areas are 60%, 20%, and 20%, respectively. This means that the reserve of young growth and middle-aged timber forest and economic forest area in the 13 provinces of southern China all exceed the sum of the corresponding resources in other areas. According to the estimation results of this study, 79% of the tree residue in China comes from forest tending and thinning, followed by final felling and bucking and forest product processing. As a result, “more than a half (55.57%) of the potential reserve of tree residues are distributed in the 13 provinces of southern China, 25% in the 10 provinces in the north, and approximately 20% in the plain and hilly areas”. In addition, Guangxi is located in China’s south, the northern tropical and subtropical monsoon climate zones, where it is warm, and there are rich calories and abundant rainfall. All of these conditions are very suitable for tree growth. The forest coverage of Guangxi ranked fourth nationwide, the fast-growing plantation area and the artificial forest area ranked first, timber forest and young growth forest and middle-aged forest reserves ranked first and third respectively, and the economic forest area and bamboo timber output ranked second, respectively [23]. In addition, the factory lumber output of Guangxi is very large, making up one-third of the total output in China. The factors above are main reasons for Guangxi being ranked first nationwide for tree residue.
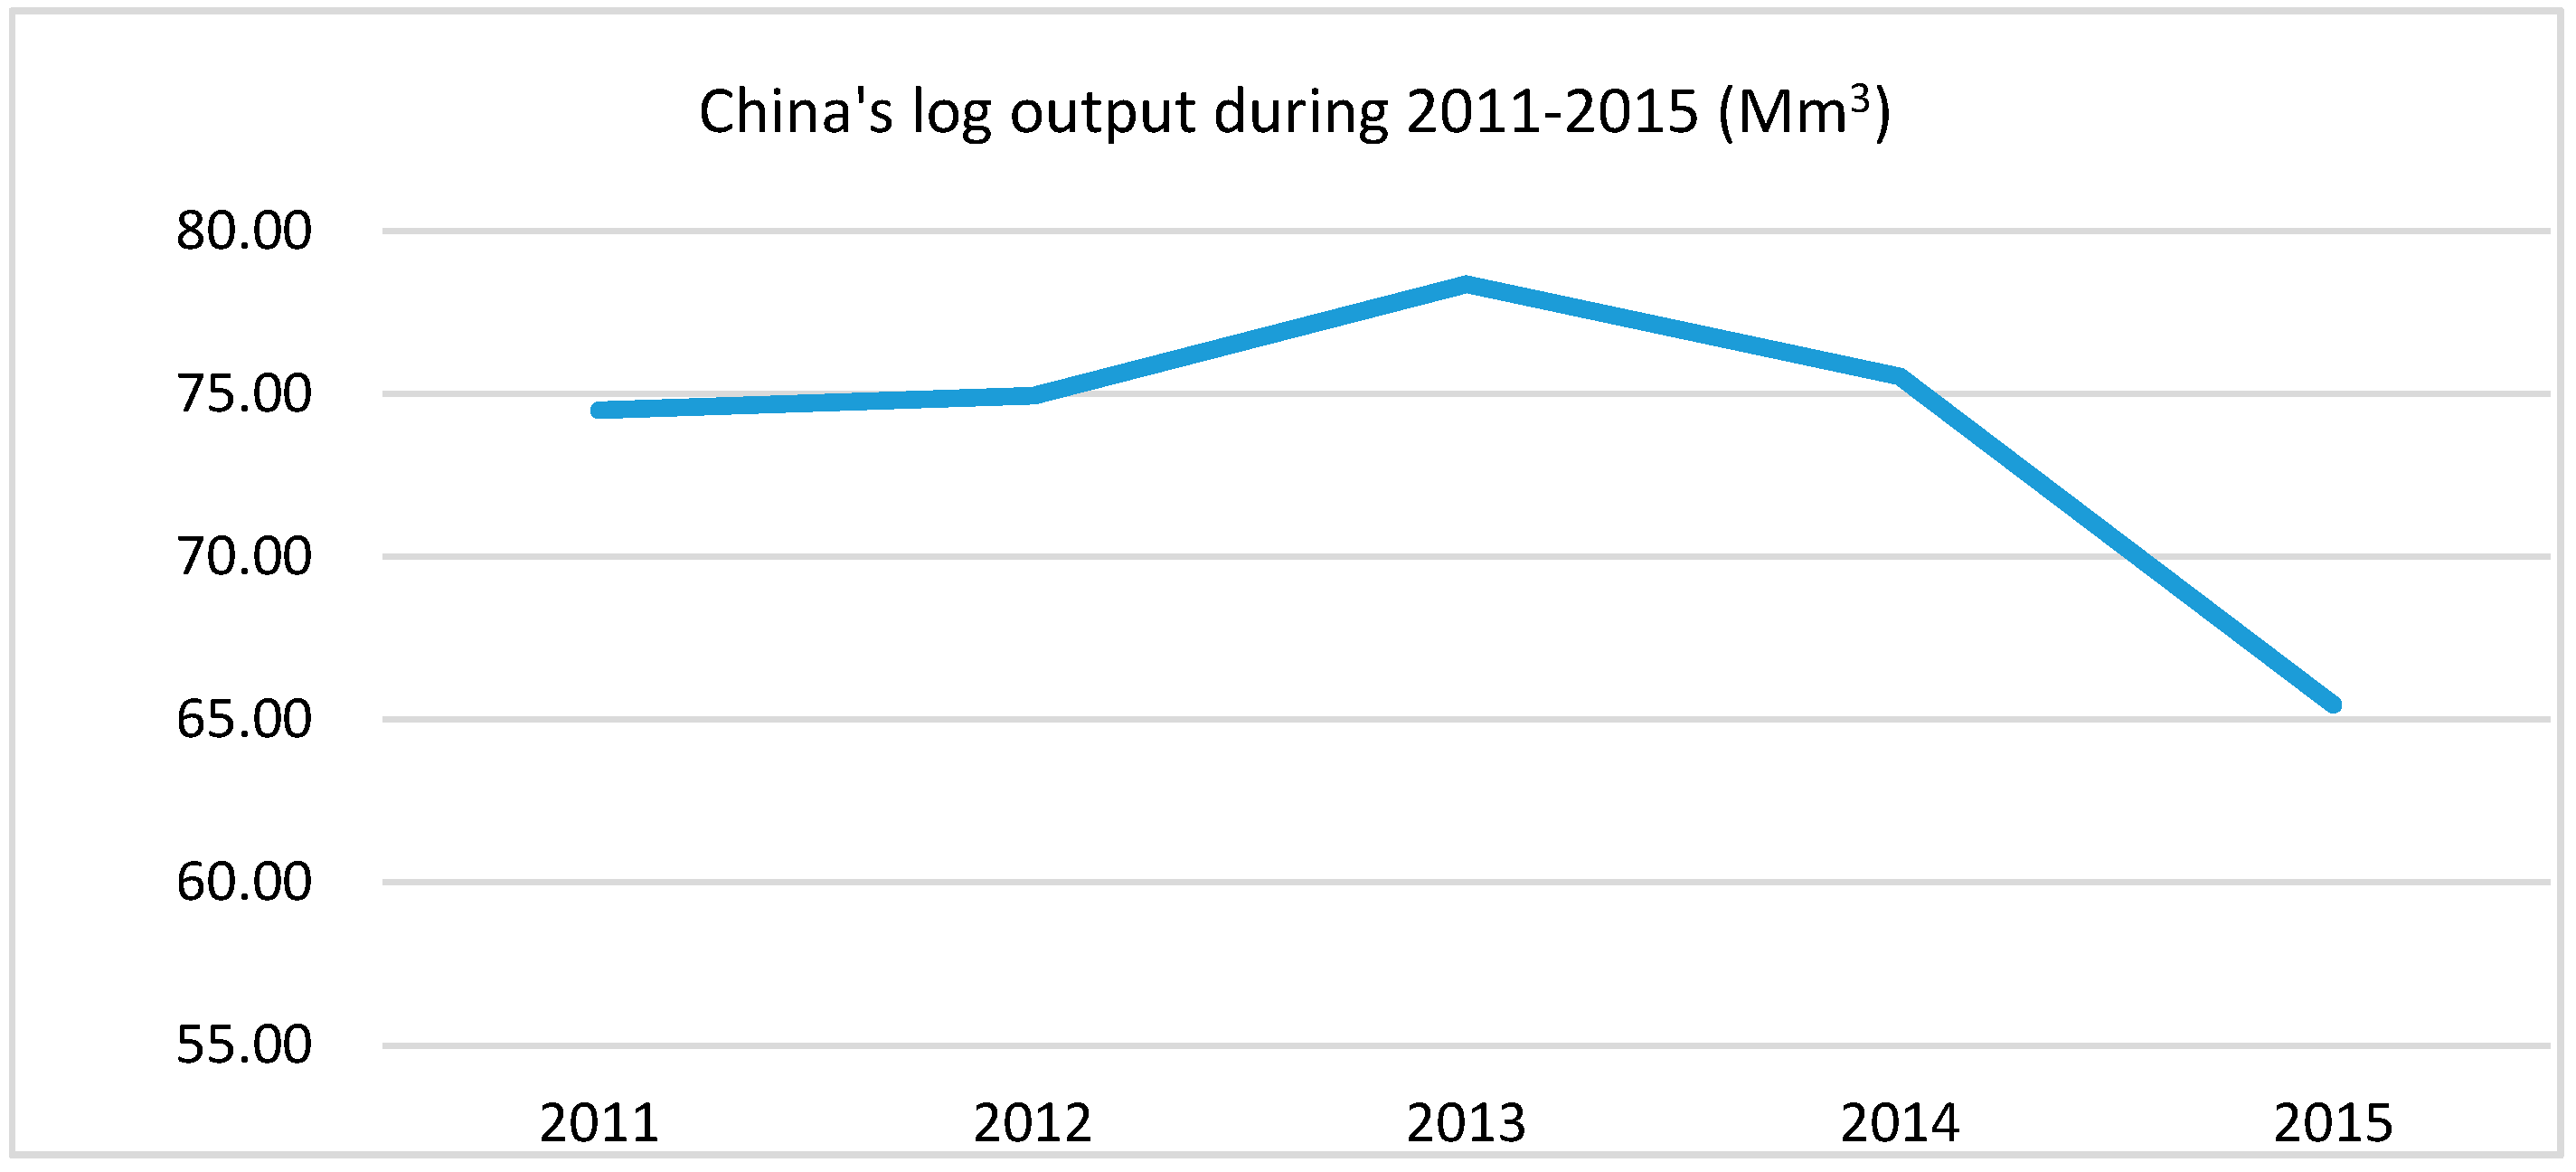
● During 2011–2015, the tree residue reserve showed positive growth. The growth rate increased from 2011 to 2013 but declined in 2014 and 2015. It was because Longjiang Forestry Industry Group and the Greater Khingan Range Forestry Group stopped natural forest commercial felling since 2014, while Jilin Forestry Industry Group, Changbaishan Forestry Industry Group, Inner Mongolia Greater Khingan Range Forestry Industry Group and 100 state-owned forestry farms in the Greater Khingan Range area of Inner Mongolia, and Beijing, Tianjin and Hebei stopped commercial felling of natural forests. The nationwide felling ban of natural forests had a great influence on the log output of China. In 2014 and 2015, log production reduced by 2.83 million m3 and 10 million m3 against the previous year (Figure 5). This directly resulted in a 20% reduction of the tree residue produced in felling and bucking in the three years (2013–2015), nearly 7.5 Mt. Though China has made great efforts in timber forest reserves, fast growth and yield [57], the tree cultivation period (above 10 years for the medium and long periods) constrains the immediate timber gain [58]. Therefore, the log output can hardly increase in the short term. The quantity of tree residue produced in the small scope and low-intensity cultivation of natural forests can hardly be compared with the final felling. In contrast, the output of bamboo timber and sawn timber increased year by year. All these facts reduced the contribution of tree residue produced by felling and bucking to the total quantity of tree residue.
In 2016, all state-owned forestry farms and collectively-owned natural forests stopped commercial felling, directly resulting in a reduction of 5.56 million m3 in the log output. The reduction in the log output constrained the growth of tree residue before 2014. However, as the log output ceases to decline further, in accordance with the positive growth during the 12th Five-Year Plan period, and the main forestry indexes, such as forest coverage and forest reserves are linearly and steadily increase, as appears in the Forestry Development 13th and 12th Five-Year Plan [59,60], it is predicted that China’s tree residue will possibly continue the original upward trend as of 2017. The recycling and scientific and reasonable utilization of tree residue (according to the estimation results of this study, the vast majority of the tree residue in China comes from forest tending and thinning, final felling and bucking and forest product processing) can alleviate the contradiction between supply and demand caused by the decline in timber output, and can also create more economic benefits and increase employment, which should attract more attention from the government, enterprises and researchers.
This is a holistic study of logging and mill residue and waste wood in China, that provides a rough overview of the resources and quantity of tree residue. We hope it can provide reference for related research into tree residue.
Author Contributions
Yiwei Guo and Erli Dan conceived the study idea and co-wrote the paper; Xiaoyan Liu conducted data collection and compilation; Changliang Jie conducted the data computation and analysis; Zhuo Kong and Feng Shi revised the paper.
Conflicts of Interest
The authors declare no conflict of interest.
References
- Yuan, Z.; Wu, C.; Huang, H. Research and development on biomass energy in China. Int. J. Energy Technol. Policy 2002, 1, 108–144. [Google Scholar] [CrossRef]
- Xu, J. Research on Tree Biomass and Resource Collecting Radium Model; Beijing Forestry University: Beijing, China, 2006. [Google Scholar]
- Liu, G.; Shen, L. Quantitative evaluation and geographical distribution of China’s biomass energy. J. Nat. Resour. 2007, 1, 9–19. [Google Scholar]
- Yang, Y.-L.; Zhang, P.-D.; Zhang, W.-L.; Tian, Y.; Zheng, Y.; Wang, L. Quantitative appraisal and potential analysis for primary biomass resources for energy utilization in China. Renew. Sustain. Energy Rev. 2010, 14, 3050–3058. [Google Scholar]
- Jiang, M. Investigation on forest yield ratio and logging residue. Hunan For. Sci. Technol. 1992, 19, 31–33. [Google Scholar]
- Wang, D. The “three rate” calculation in the wood processing. For. Econom. 1983, 3, 44–49. [Google Scholar]
- Liu, S.; Li, H. The use of logging residue of forestry enterprises. For. Eng. 1992, 2, 23–26. [Google Scholar]
- Lv, W.; Wang, C.; Wang, G.; Yu, G.; Zhang, C.; Zhang, D.; Liu, J. Study on the development potential of China’s forest biomass energy. Energy China 2005, 11, 25–30. [Google Scholar]
- Zhang, W.; Zhang, L.; Zhang, C.; Yu, D. China’s forest biomass energy resource classification and quantity estimation. J. Beijing For. Univ. (Soc. Sci.) 2015, 2, 52–55. [Google Scholar]
- Long, H. Study on Chinese Biomass Energy Resource Protection and Industrial Development; Beijing Normal University: Beijing, China, 2011. [Google Scholar]
- Zhang, L. Study on Raw Materials Supply and Industrialization of Forest Bio-Power Generation in China; Beijing Forestry University: Beijing, China, 2010. [Google Scholar]
- Zhou, D. Utilization of Recycled wood in manufacture of wood composites. In Proceedings of the First International Symposium on Recycling Waste Wood, Beijing, China, 1 November 2005. [Google Scholar]
- Chu, J.; Duan, X.; Yu, H. Waste wood recycling research progress based on low carbon economy. China For. Prod. Ind. 2014, 4, 7–10. [Google Scholar]
- Pan, X. The Assessment of Forest Biomass Energy Resource Potential; Beijing Forestry University: Beijing, China, 2014. [Google Scholar]
- Cao, Y.; Lv, J. Present situation and Prospect of utilization of forest biomass energy. In Proceedings of the First National Symposium on Biomass Materials Science and Technology, Beijing, China, 19 August 2007. [Google Scholar]
- Wang, G.; Lv, W.; Liu, J.; Wang, S.; Lv, Y.; Wang, G.; Xu, J.; Wang, Y. Special topics on forest biomass energy in China. China For. Ind. 2006, 1, 12–21. [Google Scholar]
- Cai, F.; Zhang, L.; Zhang, C.-H. Potential of woody biomass energy and its availability in China. J. Beijing For. Univ. (Soc. Sci.) 2012, 4, 103–107. [Google Scholar]
- Wang, H.; Zuo, X.; Wang, D.; Bi, Y. The estimation of forest residue resources in China. J. Cent. South Univ. For. Technol. 2017, 2, 29–38. [Google Scholar]
- Ma, Z.; Ma, Z. Theoretical resources potential assessment method of forestry residues and its application based on biomass conversion factor. For. Inventory Plan. 2015, 1, 1–9. [Google Scholar]
- Robert, L.; Dimitris, A.; Elisabeth, W. Supply assessment of forest biomass—A bottom-up approach for Sweden. Biomass Bioenergy 2015, 75, 213–226. [Google Scholar]
- State Forestry Administration. Circular of the State Council on the Examination and Approval of the Forest Cutting Quota for the Twelfth Five-Year Plan Period. Available online: http://www.forestry.gov.cn/main/4818/content-797152.html (accessed on 28 June 2017).
- State Forestry Administration. National Forestry Biomass Energy Development Plan. Available online: http://www.forestry.gov.cn/uploadfile/main/2013-6/file/2013-6-13-849baa6325bb40a59e559641beaa9ee0.pdf (accessed on 28 June 2017).
- State Forestry Administration. China Forestry Statistical Yearbook 2014, 1st ed.; China Forestry Publishing House: Beijing, China, 2015; p. 468. ISBN 9787503881343.
- State Forestry Administration. China Forestry Statistical Yearbook 2015, 1st ed.; China Forestry Publishing House: Beijing, China, 2016; p. 474. ISBN 9787503882470.
- State Forestry Administration. China Forestry Statistical Yearbook 2013, 1st ed.; China Forestry Publishing House: Beijing, China, 2014; p. 474. ISBN 9787503876097.
- State Forestry Administration. Design of Forest Tending Operations. Available online: http://www.forestry.gov.cn/uploadfile/main/2014-10/file/2014-10-8-5ea9726a54274c65858845b1d6ee6df3.doc (accessed on 28 June 2017).
- Gao, J. Discussion on logging residue. J. Inn. Mong. For. 1982, 10, 1. [Google Scholar]
- Chipo, S. An assessment of biomass residue sustainably available for thermochemical conversion to energy in Zimbabwe. Biomass Bioenergy 2013, 52, 131–138. [Google Scholar]
- Collins, O.; Stefania, P.; Salvatore, F.; Lorenzo, B. Bioenergy potential of agricultural and forest residues in Uganda. Biomass Bioenergy 2013, 56, 515–525. [Google Scholar]
- Karin, E.; Lars, J.; Nilssona, M. New energy strategies in the Swedish pulp and paper industry—The role of national and EU climate and energy policies. Energy Policy 2011, 39, 1439–1449. [Google Scholar]
- Marion, H.; Anne, R.; Christine, C.; Dominique, L. Hydrothermal treatment of black liquor for energy and phenolic platform molecules recovery in a pulp mill. Biomass Bioenergy 2016, 89, 105–112. [Google Scholar]
- Cheng, R.; Wang, L. Recycling methods of waste wood in China. China For. Prod. Ind. 2006, 4, 7–10. [Google Scholar]
- Tao, Y. Problems and Countermeasures of waste wood recycling in China. China Wood-Based Panels 2008, 2, 5–7. [Google Scholar]
- Huang, B.; Zhao, M.; Wang, Y.; Yang, J.; Zhang, J. Recovery and reuse of waste wooden furniture—Taking Changsha city as an example. Furnit. Inter. Des. 2012, 5, 88–89. [Google Scholar]
- Zhou, J.; Zhou, Y.; Liu, X. New Energy Chemistry, 1st ed.; Zhengzhou University Press: Zhengzhou, China, 2009; ISBN 9787564501129. [Google Scholar]
- Guo, H. Methods and significance of forest thinning. Agrochem. Sci. Technol. 2013, 20, 1. [Google Scholar]
- Zhao, G. The production situation and recycling of disposable chopsticks. In Proceedings of the First International Symposium on Waste Wood Recycling, Beijing, China, 1 November 2005. [Google Scholar]
- Anttila, P.; Vaario, L.M.; Pulkkinen, P.; Asikainen, A.; Duan, J. Availability, supply technology and costs of residual forest biomass for energy—A case study in northern China. Biomass Bioenergy 2015, 83, 224–232. [Google Scholar] [CrossRef]
- Ministry of Housing and Urban-Rural Development of the People’s Republic of China. Available online: http://www.ksgreen.gov.cn/HtmlEditorUploadFile/2014-02/201402071636346467.zip (accessed on 28 June 2017).
- The State Council of the People’s Republic of China. Available online: http://www.gov.cn/gongbao/content/2001/content_60905.htm (accessed on 28 June 2017).
- National Afforestation Environmental Protection Commission. Available online: http://www.forestry.gov.cn/uploadfile/main/2011-7/file/2011-7-12-8920476e3e204817a8d33e821e5fdb44.pdf (accessed on 28 June 2017).
- National Bureau of Statistics of China. China Statistical Yearbook 2016; China Statistics Press: Beijing, China, 2016; Chapter 25-10.
- Beijing Municipal Bureau of Landscape and Forestry. Available online: http://www.bjyl.gov.cn/zwgk/tjxx/201604/t20160401_178532.html (accessed on 28 June 2017).
- Tianjin Municipal Bureau of Landscape and Forestry. Available online: http://www.tjssrw.gov.cn/system/2016/03/04/012251965.shtml (accessed on 28 June 2017).
- Wood Density of Main Timber Species in China. Available online: http://www.docin.com/p-538775470.html (accessed on 28 June 2017).
- Wang, C.; Jiang, Z.-H.; Guo, Q.-R.; Liu, G.-L.; Li, Z.-D.; Shi, L. Biomass allocation of above ground components of Phyllostachys edulis and its variation with body size. Chin. J. Ecol. 2014, 8, 2019–2024. [Google Scholar]
- Cao, Z. A preliminary study on the biomass and its ecological benefits of mixed forest of bamboo and tung tree. Jiangxi For. Sci. Technol. 2009, 1, 18–20. [Google Scholar]
- Xiao, F.; Fan, S.; Wang, S.; Xiong, C.; Zhang, C.; Liu, S.; Zhang, J. Carbon storage and spatial distribution in Phyllostachy pubescens and Cunninghamia lanceolata plantation ecosystem. Acta Ecol. Sin. 2007, 7, 2794–2801. [Google Scholar]
- Zhou, G.; Jiang, P. Carbon density, carbon storage and its spatial distribution of Phyllostachy pubescens. Sci. Silvae Sin. 2004, 6, 20–24. [Google Scholar]
- Qi, L.; Fan, S.; Xiao, W.; Ai, W.; Meng, Y.; Du, M.; Zeng, L. Age structure, biomass allocation and carbon storage pattern of Phyllostachys edulis of various business objections in hilly area of central Hunan. Resour. Environ. Yangtze Basin 2012, 21, 69–73. [Google Scholar]
- He, D.; Hong, W.; Wu, C.; Lan, B.; Huang, H.; Wu, X. Study on biomass and energy distribution of natural Phyllostachys heterocycla cv. Pubescens in Wuyi Mountains and its comparison with high-yield forest. Acta Bot. Boreali-Occident. Sin. 2003, 2, 291–296. [Google Scholar]
- Xu, Z. Allocation of above ground biomass and model optimization of Dendrocalamus latiflorus munro. J. Cent. South Univ. For. Technol. 2016, 4, 80–84. [Google Scholar]
- Liu, Z. Study on comprehensive utilization of bamboo processing residues. J. Bamboo Res. 2003, 1, 55–59. [Google Scholar]
- Zheng, X. The research and market analysis on using bamboo processing residues to produce activated carbon. World Bamboo Rattan 2004, 4, 28–30. [Google Scholar]
- Luo, H.; Jiang, X.; Li, X.; Hu, X. Research progress of the bamboo carbon preparation by bamboo processing residues. Environ. Sci. Manag. 2008, 12, 156–160. [Google Scholar]
- Jiang, X.; Wan, X.; Hu, X. Comprehensive utilization of bamboo processing residues. Res. Agric. Mod. 2006, 27, 266–268. [Google Scholar]
- State Forestry Administration. Available online: http://www.forestry.gov.cn/uploadfile/main/2010-11/file/2010-11-26-54d3530a54c0443e8be223361e1a28ee.pdf (accessed on 28 June 2017).
- Zheng, Z. The cultivation technology of constructing fast-growing timber forest of Taiwania flousianain secondary generation of Chinese fir cutting-blank. Anhui Agric. Sci. Bull. 2017, 1, 80–81. [Google Scholar]
- State Forestry Administration. Forestry Development “The 13th Five-Year Plan”. Available online: http://www.forestry.gov.cn/uploadfile/main/2016-5/file/2016-5-19-4e0699f79b4b4a2ab03843684dd32c76.pdf (accessed on 8 August 2017).
- State Forestry Administration. Notice of the State Forestry Administration on Printing and Distributing “The 12th Five-Year Plan” for Forestry Development. Available online: http://www.forestry.gov.cn/main/4818/content-797384.html (accessed on 8 August 2017).
Figure 1.
The sources of tree residue.
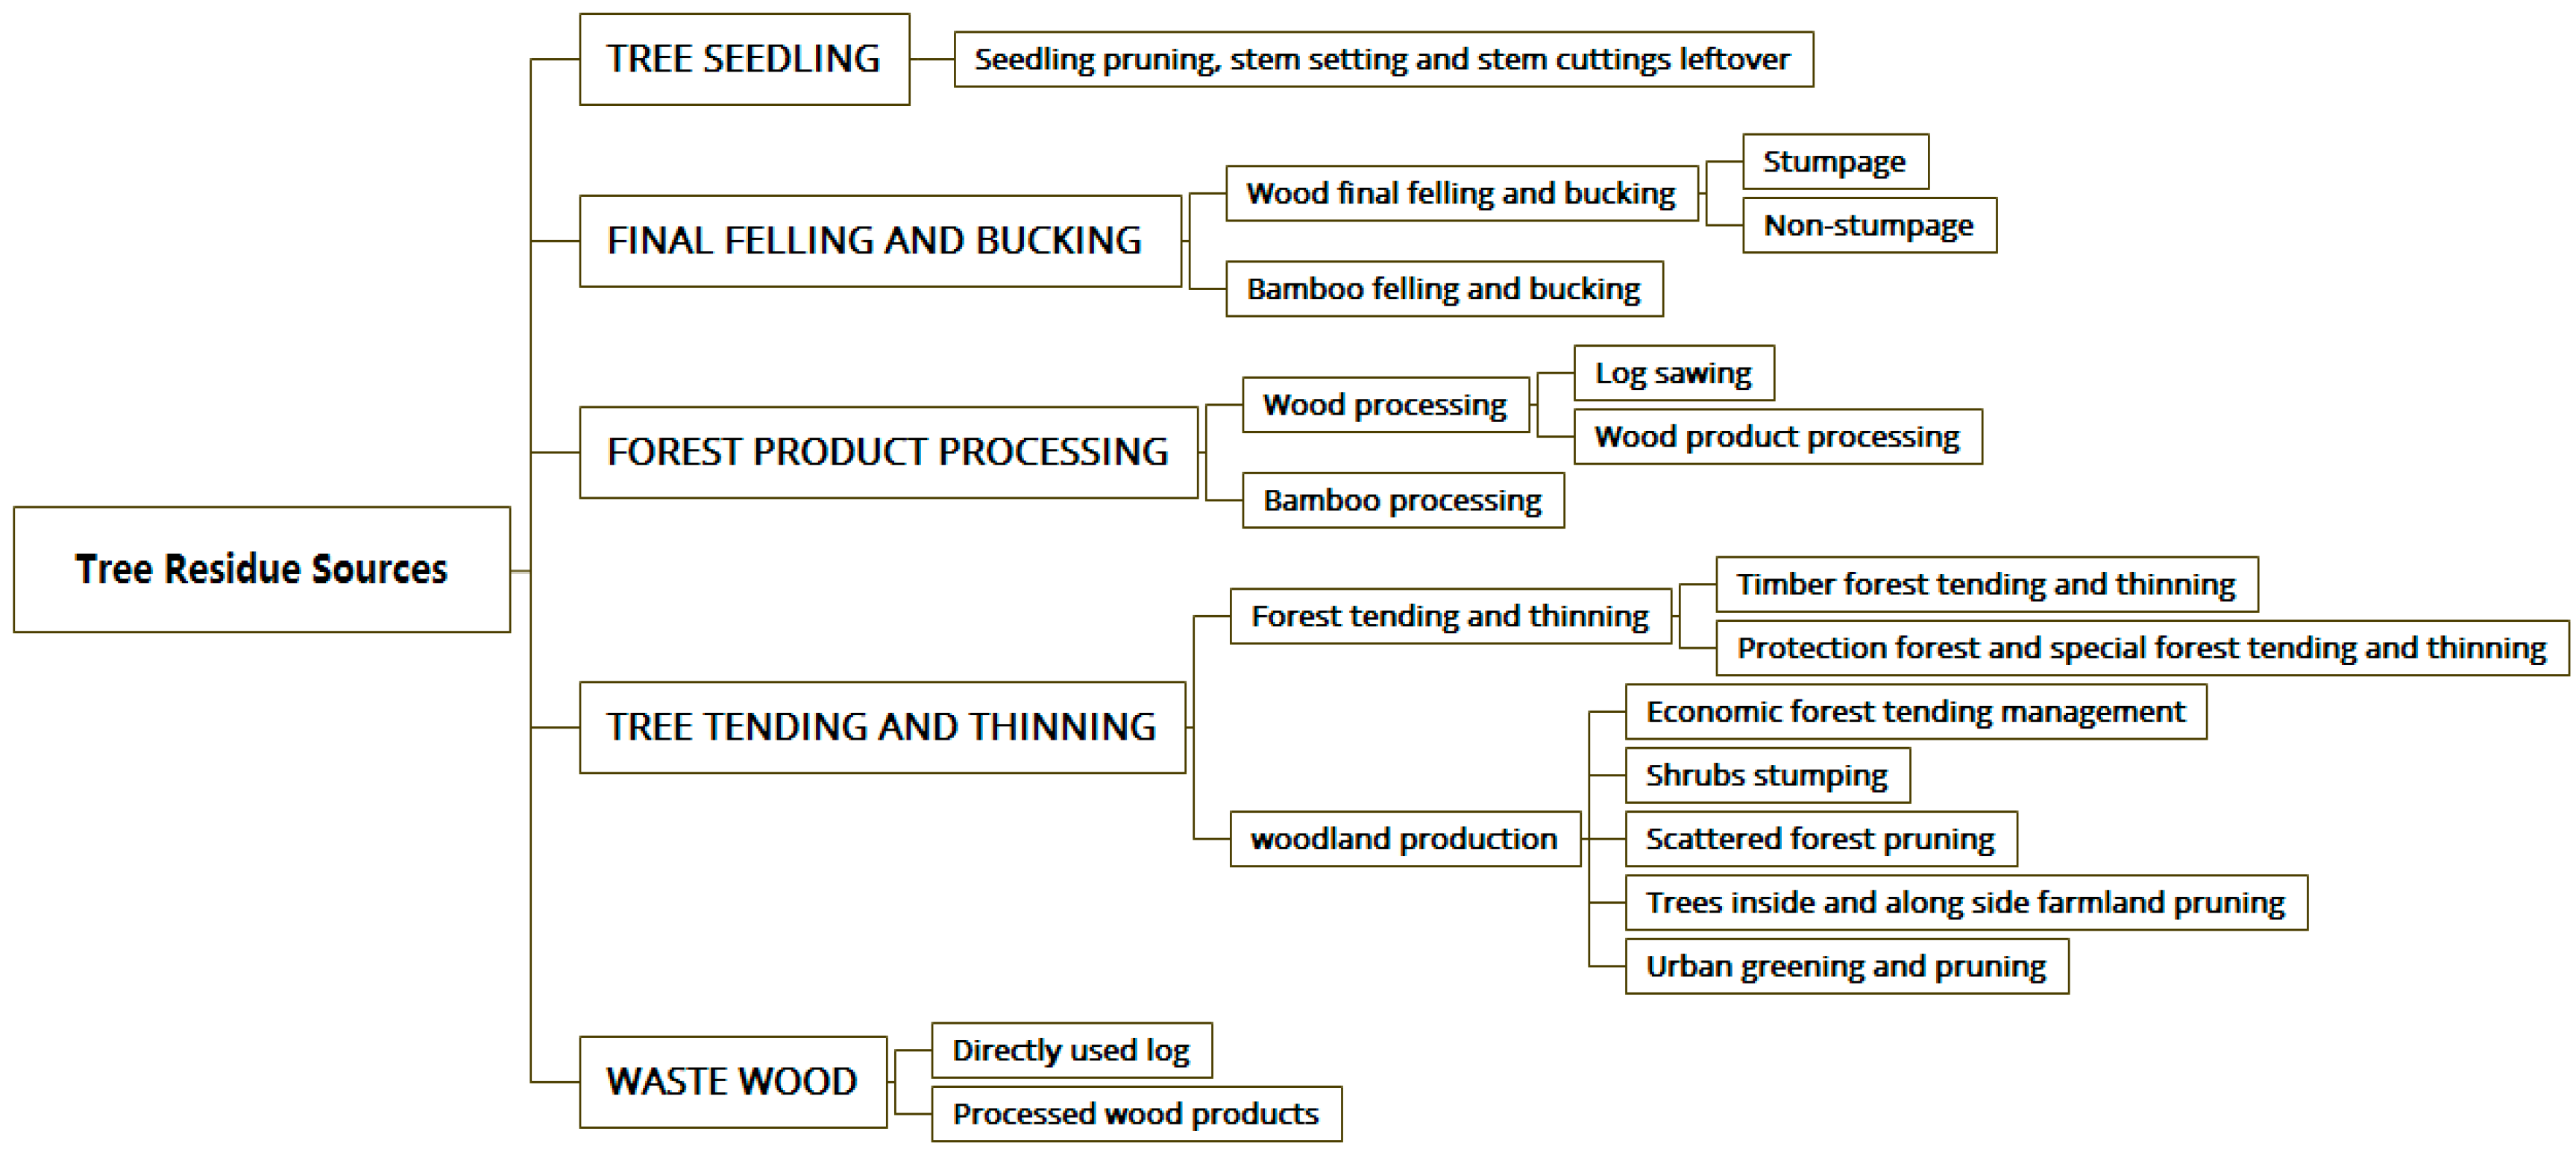
Figure 2.
China’s tree residue composition in 2015.

Figure 3.
China’s tree tending and thinning residue composition in 2015.

Figure 4.
China’s tree residue quantity change during 2011–2015 (Mt).

Figure 5.
China’s log output during 2011–2015 (Mm3).


Table 1.
The variable values of residue produced in the process of forest tending and thinning.
| The reserve of timber forest (m3) | : 10%; : 9% | 706.7 kg/m3 [36] |
| The area of protection or special forest (hectare) | 0.2 | 375 kg/hectare [1,37] |
Table 2.
The related variable values of woodland production residue.
| The area of economic forest | 8500 kg/hectare (southern, plain and hilly areas); 7500 kg/hectare (northern areas) [18] |
| The area of shrubbery forest | 750 kg/hectare [1] |
| The area of scattered forest | 1200 kg/hectare [1] |
| The number of trees inside and alongside farmland | 2 kg/tree [1] |
Table 3.
The proportion of non-stumpage biomass of the stumpage volume.
| Non-Stumpage | Tree Type | Proportion (%) | Value (%) |
|---|---|---|---|
| Branches | conifer | 20–30 [18], 35–40 [5] | 25 |
| broad-leaved tree | 30–40 [18] | ||
| Roots | nifer | 15 [18] | 20 |
| broad-leaved tree | 25 [18] |
Table 4.
The forest product processing yield rate, residue proportion and residue attrition rate.
| Yield Rate (%) | Residue Proportion (%) | Residue Attrition Rate (%) | Reference | |
|---|---|---|---|---|
| log sawing | 70 | 30 | [6] | |
| 71.33 | 28.67 | [18] | ||
| 74 | 26 | [7] | ||
| Wood product processing | 50.15 | 49.85 | [6] | |
| 56.72 | 43.28 | [18] | ||
| 60 | 40 | [7] | ||
| log sawing | 2–4 | [6] | ||
| Wood product processing | 0.5–1.5 |
Table 5.
The proportion between bamboo branches and leaves and bamboo culm.
| Bamboo Type | Proportion (%) | Reference | Area and Bamboo Type Investigated |
|---|---|---|---|
| Phyllostachys heterocycla cv. pubescens | 33.04 | [45] | Anhui in the south of the Yangtze River, Phyllostachys heterocycla cv. pubescens |
| 27.3 | [46] | Nanping City, Fujian Province, Phyllostachys heterocycla cv. pubescens in mixed forest of bamboo and tung tree | |
| 33.7 | [49] | Hilly area of central Hunan, Phyllostachys heterocycla cv. pubescens | |
| 26.1 | [47] | Huitong city, Hunan Province, Phyllostachys heterocycla cv. pubescens | |
| 27.0 | [51] | Wuyi mountains, natural Phyllostachys heterocycla cv. pubescens | |
| 26.7 | [51] | Wuyi mountains, high-yield Phyllostachys heterocycla cv. pubescens | |
| Dendrocalamus latiflorus | 23.6 | [52] | |
| One-year Dendrocalamus latiflorus | 40.8 | [52] |
Table 6.
China’s tree residue sources and quantity in 2015.
| Tree Residue Sources | Quantity (Mt) | Total (Mt) | ||
|---|---|---|---|---|
| Tree seedling | Seedling pruning, stem setting and stem cuttings leftover | 839.18 | 839.18 | |
| Tree tending and thinning | Forest tending and thinning | Timber forest tending and thinning | 15,118.56 | 40,676.02 |
| Protection forest and special forest tending and thinning | 749.29 | |||
| Woodland production | Economic forest tending management | 17,043.31 | ||
| Shrubs stumping | 4192.67 | |||
| Scattered forest pruning | 578.67 | |||
| Trees inside and alongside farmland pruning | 2018.83 | |||
| Urban greening and pruning | 974.69 | |||
| Final felling and bucking | Wood final felling and bucking | Stumpage | 779.39 | 4482.41 |
| Non-stumpage | 2359.13 | |||
| Bamboo felling and bucking | 1343.89 | |||
| Forest product processing | Wood processing | Log sawing | 1361.34 | 3851.03 |
| Wood product processing | 725.83 | |||
| Bamboo processing | 1763.86 | |||
| Waste wood | Directly used log | 606.83 | 1314.48 | |
| Processed wood products | 707.65 | |||
| Total (Mt) | 51,163.12 | |||
Table 7.
Tree residue composition of each province of China in 2015 (Mt).
| Area | Province (Municipalities and Autonomous Regions) | Tree Seedling | Final Felling and Bucking | Tree Tending and Thinning | Forest Product Processing | Waste Wood | Total | ||
|---|---|---|---|---|---|---|---|---|---|
| Wood | Bamboo | Wood | Bamboo | ||||||
| Plain and hilly area | Beijing | 1.45 | 1.08 | 0.00 | 201.57 | 0.19 | 0.00 | 1.01 | 205.30 |
| Tianjin | 2.82 | 9.26 | 0.00 | 46.12 | 0.00 | 0.00 | 0.00 | 58.20 | |
| Hebei | 57.27 | 24.45 | 0.00 | 1230.33 | 39.43 | 0.00 | 11.90 | 1363.38 | |
| Shandong | 96.35 | 135.60 | 0.00 | 1337.42 | 290.82 | 0.00 | 12.90 | 1873.09 | |
| Henan | 39.39 | 97.35 | 6.78 | 1033.17 | 74.08 | 1.02 | 20.25 | 1272.04 | |
| Jiangsu | 36.88 | 60.89 | 3.53 | 800.51 | 49.42 | 2.68 | 11.84 | 965.75 | |
| Anhui | 9.69 | 180.64 | 86.60 | 1081.13 | 120.51 | 65.97 | 79.03 | 1623.57 | |
| Shanghai | 1.49 | 0.00 | 0.02 | 71.55 | 0.00 | 0.00 | 0.00 | 73.06 | |
| Southern area | Zhejiang | 58.58 | 64.87 | 97.97 | 1500.80 | 72.07 | 101.88 | 53.23 | 1949.40 |
| Fujian | 5.44 | 213.24 | 361.01 | 1808.66 | 92.23 | 712.67 | 143.63 | 3336.88 | |
| Jiangxi | 19.78 | 109.35 | 78.34 | 1828.24 | 64.81 | 43.61 | 91.44 | 2235.57 | |
| Hunan | 7.42 | 120.26 | 28.61 | 2149.50 | 102.64 | 30.91 | 113.00 | 2552.34 | |
| Hubei | 24.79 | 77.81 | 16.24 | 1431.73 | 78.59 | 15.54 | 25.86 | 1670.56 | |
| Guangdong | 6.68 | 337.74 | 126.24 | 2107.75 | 97.06 | 112.21 | 75.91 | 2863.59 | |
| Hainan | 2.94 | 48.29 | 3.00 | 801.36 | 16.16 | 6.28 | 13.75 | 891.78 | |
| Yunnan | 10.98 | 144.08 | 84.29 | 4379.25 | 79.92 | 90.61 | 45.29 | 4834.42 | |
| Guizhou | 16.19 | 87.17 | 8.87 | 981.54 | 36.00 | 5.60 | 10.87 | 1146.24 | |
| Sichuan | 11.31 | 69.83 | 164.47 | 2655.92 | 40.33 | 87.5 | 10.14 | 3039.50 | |
| Chongqing | 11.01 | 15.00 | 53.44 | 618.11 | 10.65 | 55.47 | 0.10 | 763.78 | |
| Guangxi | 15.62 | 951.51 | 221.49 | 3290.87 | 402.68 | 431.19 | 120.16 | 5433.52 | |
| Xizang | 0.39 | 0.00 | 0.00 | 837.48 | 1.29 | 0.00 | 6.03 | 845.19 | |
| Northern area | Liaoning | 26.08 | 66.80 | 0.00 | 1503.49 | 74.19 | 0.00 | 46.08 | 1716.64 |
| Jilin | 32.60 | 152.46 | 0.00 | 1288.02 | 60.86 | 0.00 | 114.27 | 1648.21 | |
| Heilongjiang | 21.45 | 75.10 | 0.00 | 1800.02 | 123.69 | 0.00 | 203.79 | 2223.05 | |
| Inner Mongolia | 52.05 | 70.16 | 0.00 | 1875.65 | 151.39 | 0.00 | 91.15 | 2240.40 | |
| Xinjinag | 31.43 | 17.22 | 0.00 | 918.99 | 2.22 | 0.00 | 8.30 | 978.16 | |
| Shanxi | 56.40 | 3.08 | 0.00 | 652.92 | 2.91 | 0.00 | 1.60 | 716.91 | |
| Shanxi | 54.01 | 2.60 | 2.93 | 1412.37 | 2.39 | 0.72 | 1.97 | 1476.99 | |
| Gansu | 84.44 | 1.82 | 0.06 | 596.31 | 0.34 | 0.00 | 0.12 | 683.09 | |
| Qinghai | 17.86 | 0.60 | 0.00 | 350.78 | 0.16 | 0.00 | 0.80 | 370.20 | |
| Ningxiang | 26.39 | 0.26 | 0.00 | 84.46 | 0.14 | 0.00 | 0.06 | 111.31 | |
| 839.18 | 3138.52 | 1343.89 | 40,676.02 | 2087.17 | 1763.86 | 1314.48 | 51,163.12 | ||
© 2017 by the authors. Licensee MDPI, Basel, Switzerland. This article is an open access article distributed under the terms and conditions of the Creative Commons Attribution (CC BY) license (http://creativecommons.org/licenses/by/4.0/).
Share and Cite
MDPI and ACS Style
Guo, Y.; Dan, E.; Liu, X.; Kong, Z.; Shi, F.; Jie, C. China’s Tree Residue Sources and Quantity Estimation. Sustainability 2017, 9, 1659. https://0-doi-org.brum.beds.ac.uk/10.3390/su9091659
AMA Style
Guo Y, Dan E, Liu X, Kong Z, Shi F, Jie C. China’s Tree Residue Sources and Quantity Estimation. Sustainability. 2017; 9(9):1659. https://0-doi-org.brum.beds.ac.uk/10.3390/su9091659
Chicago/Turabian StyleGuo, Yiwei, Erli Dan, Xiaoyan Liu, Zhuo Kong, Feng Shi, and Changliang Jie. 2017. "China’s Tree Residue Sources and Quantity Estimation" Sustainability 9, no. 9: 1659. https://0-doi-org.brum.beds.ac.uk/10.3390/su9091659
Note that from the first issue of 2016, this journal uses article numbers instead of page numbers. See further details here.