Target Recognition in SAR Images Based on Information-Decoupled Representation

School of Psychology, Shaanxi Normal University, Xi’an 710062, China
*
Author to whom correspondence should be addressed.
Remote Sens. 2018, 10(1), 138; https://0-doi-org.brum.beds.ac.uk/10.3390/rs10010138
Submission received: 25 November 2017
/
Revised: 15 January 2018
/
Accepted: 16 January 2018
/
Published: 19 January 2018
(This article belongs to the Section Remote Sensing Image Processing)
Abstract
:This paper proposes an automatic target recognition (ATR) method for synthetic aperture radar (SAR) images based on information-decoupled representation. A typical SAR image of a ground target can be divided into three parts: target region, shadow and background. From the aspect of SAR target recognition, the target region and shadow contain discriminative information. However, they also include some confusing information because of the similarities of different targets. The background mainly contains redundant information, which has little contribution to the target recognition. Because the target segmentation may impair the discriminative information in the target region, the relatively simpler shadow segmentation is performed to separate the shadow region for information decoupling. Then, the information-decoupled representations are generated, i.e., the target image, shadow and original image. The background is retained in the target image, which represents the coupling of target backscattering and background. The original image and generated target image are classified using the sparse representation-based classification (SRC). Then, their classification results are combined by a score-level fusion for target recognition. The shadow image is not used because of its lower discriminability and possible segmentation errors. To evaluate the performance of the proposed method, extensive experiments are conducted on the Moving and Stationary Target Acquisition and Recognition (MSTAR) dataset under both standard operating condition (SOC) and various extended operating conditions (EOCs). The proposed method can correctly classify 10 classes of targets with the percentage of correct classification (PCC) of 94.88% under SOC. With the PCCs of 93.15% and 75.03% under configuration variance and 45° depression angle, respectively, the superiority of the proposed is demonstrated in comparison with other methods. The robustness of the proposed method to both uniform and nonuniform shadow segmentation errors is validated with the PCCs over 93%. Moreover, with the maximum average precision of 0.9580, the proposed method is more effective than the reference methods on outlier rejection.
1. Introduction
The interpretation of synthetic aperture radar (SAR) images has important meanings for both civilian and military applications [1,2,3,4,5]. SAR images are interpreted for sea ice monitoring and classification in [2]. Gao et al. examined the change detection in SAR images based on deep learning [3]. Bai et al. analyzed SAR images to map earthquake-induced damages [4] and recognized regional tsunami damages [5] using machine learning techniques. This study focused on the automatic target recognition (ATR) of SAR images [1], which aims to determine the target type of an SAR image with unknown label by matching the information in the input SAR image with that in the training samples. Generally, the information can be divided into three categories: discriminative information, confusing information and redundant information [6,7]. The discriminative information indicates the portion shared by the same target class and different from other classes. The confusing information often varies in the same class or shares much resemblance with other targets. The redundant information only contains redundancy and has little meanings from the aspect of target recognition. Therefore, to improve the SAR ATR performance, the discriminative information in SAR images should be fully exploited. Meanwhile, the confusing and redundant information must be suppressed.
After preprocessing steps such as clutter rejection and denoising [8,9], a typical SAR image of a ground target can be divided into three components: target region, shadow and background [10]. The target region describes the electromagnetic scattering characteristics of the target. The shadow reflects the target’s geometrical information such as physical sizes and shape. The background pixels represent the responses of the background. Therefore, the background mainly contains the redundant information, which has little meanings from the aspect of target recognition. Both target region and shadow contain discriminative information. They also contain some confusing information because of the similarity shared by different targets. To improve the ATR performance, the discriminative information should be decoupled for matching. There are two typical methods to decouple the discriminative information in literatures: image segmentation and feature extraction. In image segmentation, some methods [11,12,13,14,15] conduct target segmentation first, and only the target region is used for target recognition. The operation indeed eliminates most of the redundant information (background) and confusing information in the shadow. However, the discriminative information in the shadow is also neglected. Moreover, SAR target segmentation remains difficult problem because of the unclear target contour in SAR images [10,11]. Therefore, the target segmentation may also lose some discriminative information in the original target region because of possible segmentation errors. Some researchers use the shadow [16,17] for target recognition. Although they have achieved good results, the discriminability of shadow is assumed to be notably limited particularly with the increase of candidate targets [18]. In feature extraction, various kinds of features [19,20,21,22,23,24,25,26,27] have been applied to SAR images including geometrical features, projection features and scattering center features. Typical geometrical features are physical sizes [11], shape [13,14,15], target contour [16], etc. They intuitively describe the targets and are discriminative for target recognition. The projection features can be efficiently extracted by multiplying the original image with a projection matrix. The principle component analysis (PCA) [19], non-negative matrix factorization (NMF) [20], random projection [21], etc. are notably effective to reduce the high dimensionality of original SAR images while retaining the discriminative information for target recognition. The scattering center features reflect the electromagnetic scattering characteristics of the target. Because of the rich physically relevant descriptions, the attributed scattering centers have been effectively used for SAR ATR [25,26,27,28,29]. However, most of these features aim to reduce the redundancy in the original SAR images and can hardly reduce the confusing information.
An SAR ATR method is proposed to exploit the discriminative information in SAR images based on information-decoupled representations in this study. As stated above, the discriminative information is contained in the target region and shadow. Under standard operating condition (SOC) [1], where the test images are captured under similar conditions with the training samples, both target region and shadow contain discriminative information and tend to form consistent decisions. Hence, the joint use of the two components will contribute to better recognition results. However, under some extended operating conditions (EOCs) [1], the target region or shadow may be corrupted. Then, the corrupted part should not be used or weighted less in the recognition. Under these conditions, the image segmentation is preferred to thoroughly remove the confusing part (target region or shadow).
In this study, the original SAR images are used to generate three information-decoupled representations: target image, shadow image and target–shadow image. Because of the outstanding properties of the shadow, which always contains much lower intensity values [15], the shadow segmentation is much simpler than the segmentation of target region. Moreover, the inaccurateness of the shadow segmentation will result in a smaller loss of discriminative information. First, the shadow is first separated from the original SAR image as a binary region. By replacing the shadow region with randomly selected background pixels, the target image is generated. Thus, the target image only contains the target backscattering and background. The target–shadow image is directly represented by the original SAR image, which is coupled by the target backscattering, shadow and background. The three components may have different advantages for target recognition. Under SOC, both target region and shadow contain more discriminability than confusion and tend to share similar similarity patterns over the training samples. Therefore, their joint usage, i.e., the original image, is preferred to best embody the discriminative information and suppress the confusing information. Under some EOCs, the discriminative information in the target image or shadow is weakened, and the confusing information increases. It is predictable that better results should be achieved when the shadow or target image is not used or weighted less.
For a particular feature, the decision engine should be carefully designed to exploit its discriminability to improve the ATR performance [13]. With the fast development of pattern recognition and machine learning techniques, many advanced classifiers [30,31,32,33,34,35,36,37] have been successfully applied to SAR ATR, such as the support vector machine (SVM) [28,29], sparse representation-based classification (SRC) [21,31,32,33], convolutional neural network (CNN) [35], adaptive boosting (Adaboost) [36] and discriminative graphical models [37]. Among these classifiers, SRC is notably robust to EOCs such as noise corruption and partial occlusion [38]. Therefore, SRC is used to classify the original and target images. Then, the classification results are combined using a score-level fusion [10,39,40] for the target recognition. The shadow image is not used because of its lower discriminability and possible segmentation errors. The advantages of the score-level fusion can be analyzed from two aspects. On the one hand, it is difficult to decide the operating conditions of the test image in practical applications. Then, little prior information can be used to select the component for recognition. However, the decision fusion of these components can effectively improve the robustness of the ATR method to various EOCs. On the other hand, some test samples under SOC may also have different shadows with the training samples and other samples under EOCs may have similar shadow with the training samples because of the effects of uncertain factors. Then, the original image and target image complement each other during the score-level fusion to improve the effectiveness and robustness of the proposed method to both SOC and various EOCs. To evaluate the proposed method, extensive experiments are conducted on the Moving and Stationary Target Acquisition and Recognition (MSTAR) [41] dataset under SOC and typical EOCs, i.e., configuration variance and depression angle variance. Moreover, the proposed method is tested with possible shadow segmentation errors and outlier confusion. By comparing with several state-of-the-art SAR ATR methods, we demonstrate that the proposed method is more effective and robust.
The remainder of this paper is organized as follows. Section 2 introduces the information model of SAR image and detailed procedure to generate the information-decoupled representations. Then, in Section 3, the principle of SRC is explained. The detailed implementation of the proposed target recognition method is also illustrated. Extensive experiments are conducted on the MSTAR dataset under SOC and typical EOCs to evaluate the performance of the proposed method in Section 4.
2. Information-Decoupled Representation of the SAR Image
2.1. Information Model of SAR Image
It is crucial to understand the information in SAR images; thus, the discriminative information can be decoupled for target recognition. Figure 1 shows the SAR imaging model. The backscattering of the target forms the target region and the scattering of the background corresponds to the background pixels in the SAR image. A portion of the target and background is occluded at a special view angle. Then, no responses are received from the occluded regions, which results in a dark patch in the SAR image, i.e., the target’s shadow [15]. In fact, the shadow contains a back projected estimate of the target’s profile. Based on the analysis, the measured SAR image can be modeled as follow:
In Equation (1), denotes the measured SAR image; is the imaging process, which includes zero padding, windowing, Fourier transformation, etc.; is the target characteristics; and is the background noise. The term represents the parts related to the target, including the target region and shadow at elevation and azimuth . The target region contains the backscattering of the target, whereas the shadow indirectly reflects the physical sizes of the target. Therefore, both target region and shadow provide discriminative information for target recognition. However, because of the change in and , the images of the same target under different view angles may have notably different target regions and shadows [37]. Meanwhile, the target regions or shadows of different targets may share some resemblances. As a result, they also include some confusing information. Because the original SAR image contains both the target region and shadow, it contains all the discriminative information. However, it also contains all confusing information.
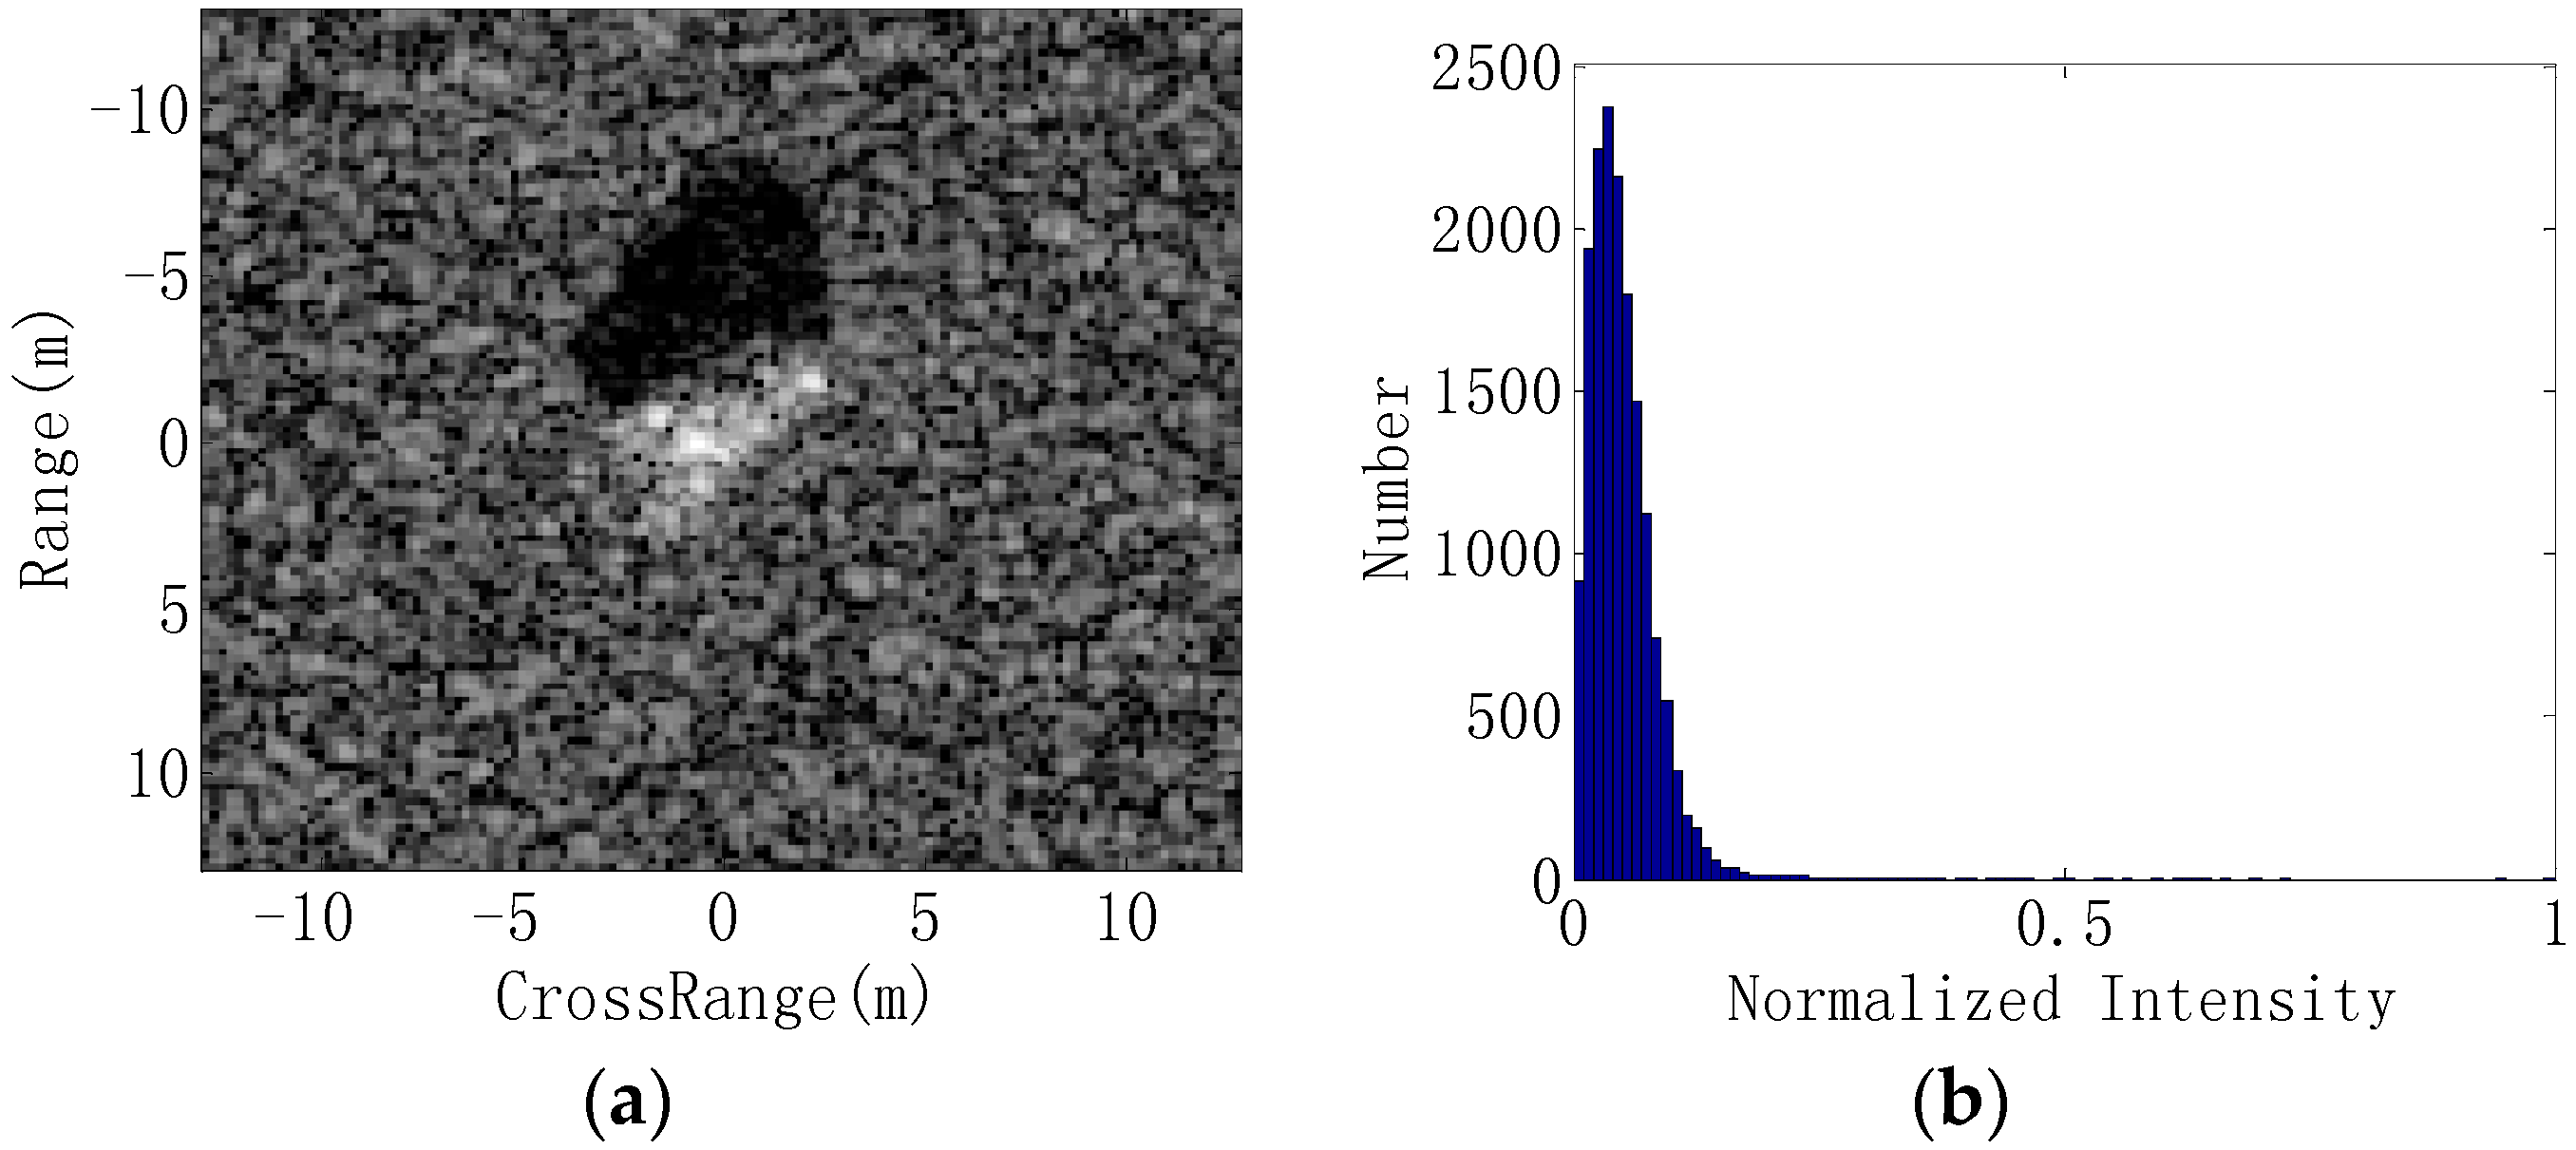
According to information theory, the amount of information in an SAR image is conveyed by the distribution of the intensity values, i.e., the entropy [42,43]. Incidents with lower probabilities are more informative. Figure 2b shows the histogram of the SAR image in Figure 2a, whose intensities are normalized. In general, the target region contains pixels of high intensities, whereas the shadow region includes the low intensities. The background region is mainly filled with pixels with medium intensities. The target region and shadow contain much fewer pixels than the background. Hence, the background contains little discriminative or confusing information for target recognition. Therefore, it is not necessary to eliminate the background in SAR images when they share similar backgrounds. The target region often has a broader intensity range than the shadow which is filled with pixels with notably low intensities. Consequently, the target region is much more informative than the shadow. Table 1 qualitatively summarizes the information in SAR images, which includes the source, main constituent and amount.
2.2. Shadow Segmentation
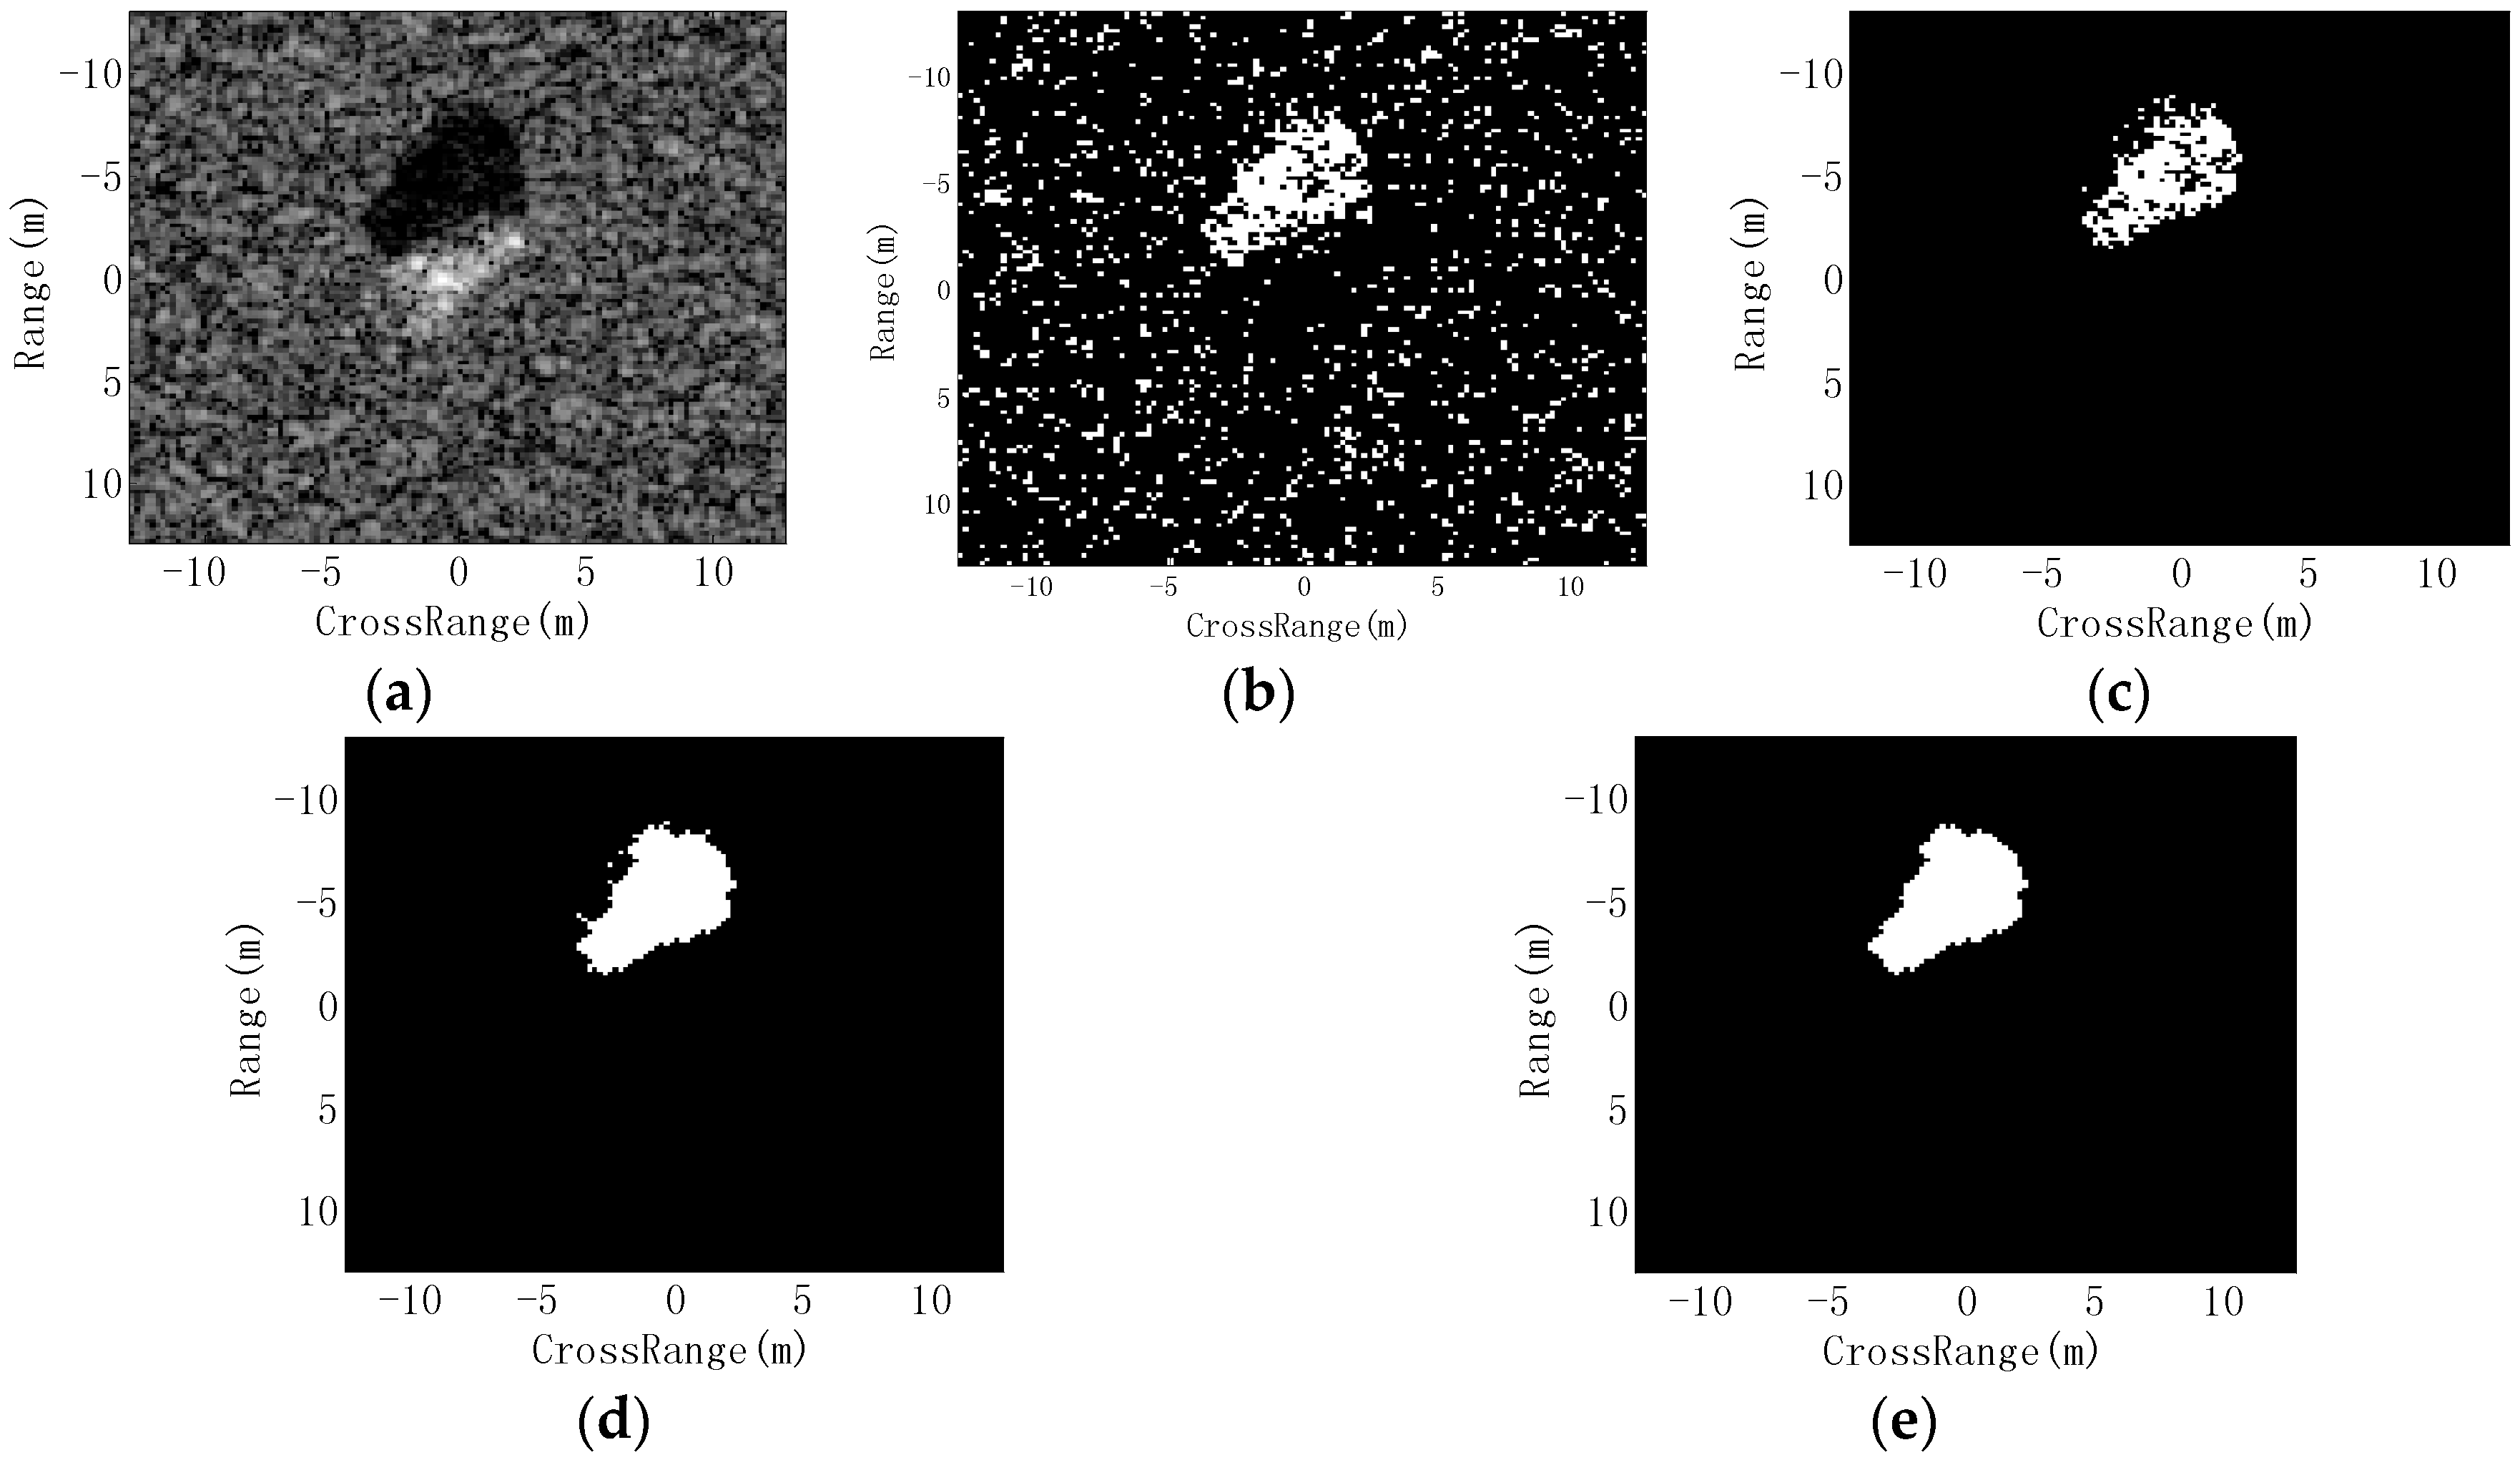
The shadow always contains much lower intensities than the background and target region, and it often has a much clearer contour than the target region. Thus, it is much easier to segment the shadow than the target region. Moreover, the imprecise shadow segmentation will cause less information loss to the recognition than target segmentation. The main steps of shadow segmentation are as follows:
- Step 1
- The mean of all normalized image intensities is used as the threshold for the preliminary segmentation.
- Step 2
- A 5 × 5 count filter [44] is used to remove the isolated small regions caused by speckle noises in the background.
- Step 3
- The morphological closing operation [44] is performed to connect the binary shadow region.
- Step 4
- The morphological opening operation [44] is used to smooth the contour of the shadow.
Figure 3 illustrates the shadow segmentation of an SAR image of a BMP2 target from the MSTAR dataset. After the threshold segmentation, t many false alarms from the background remain as shown in Figure 3b. The count filter eliminates most of the false alarms and produces a disconnected shadow (Figure 3c). The morphological closing operation connects the shadow region (Figure 3d), and Figure 3e is the final shadow region after the morphological opening operation.
2.3. Information-Decoupled Representation
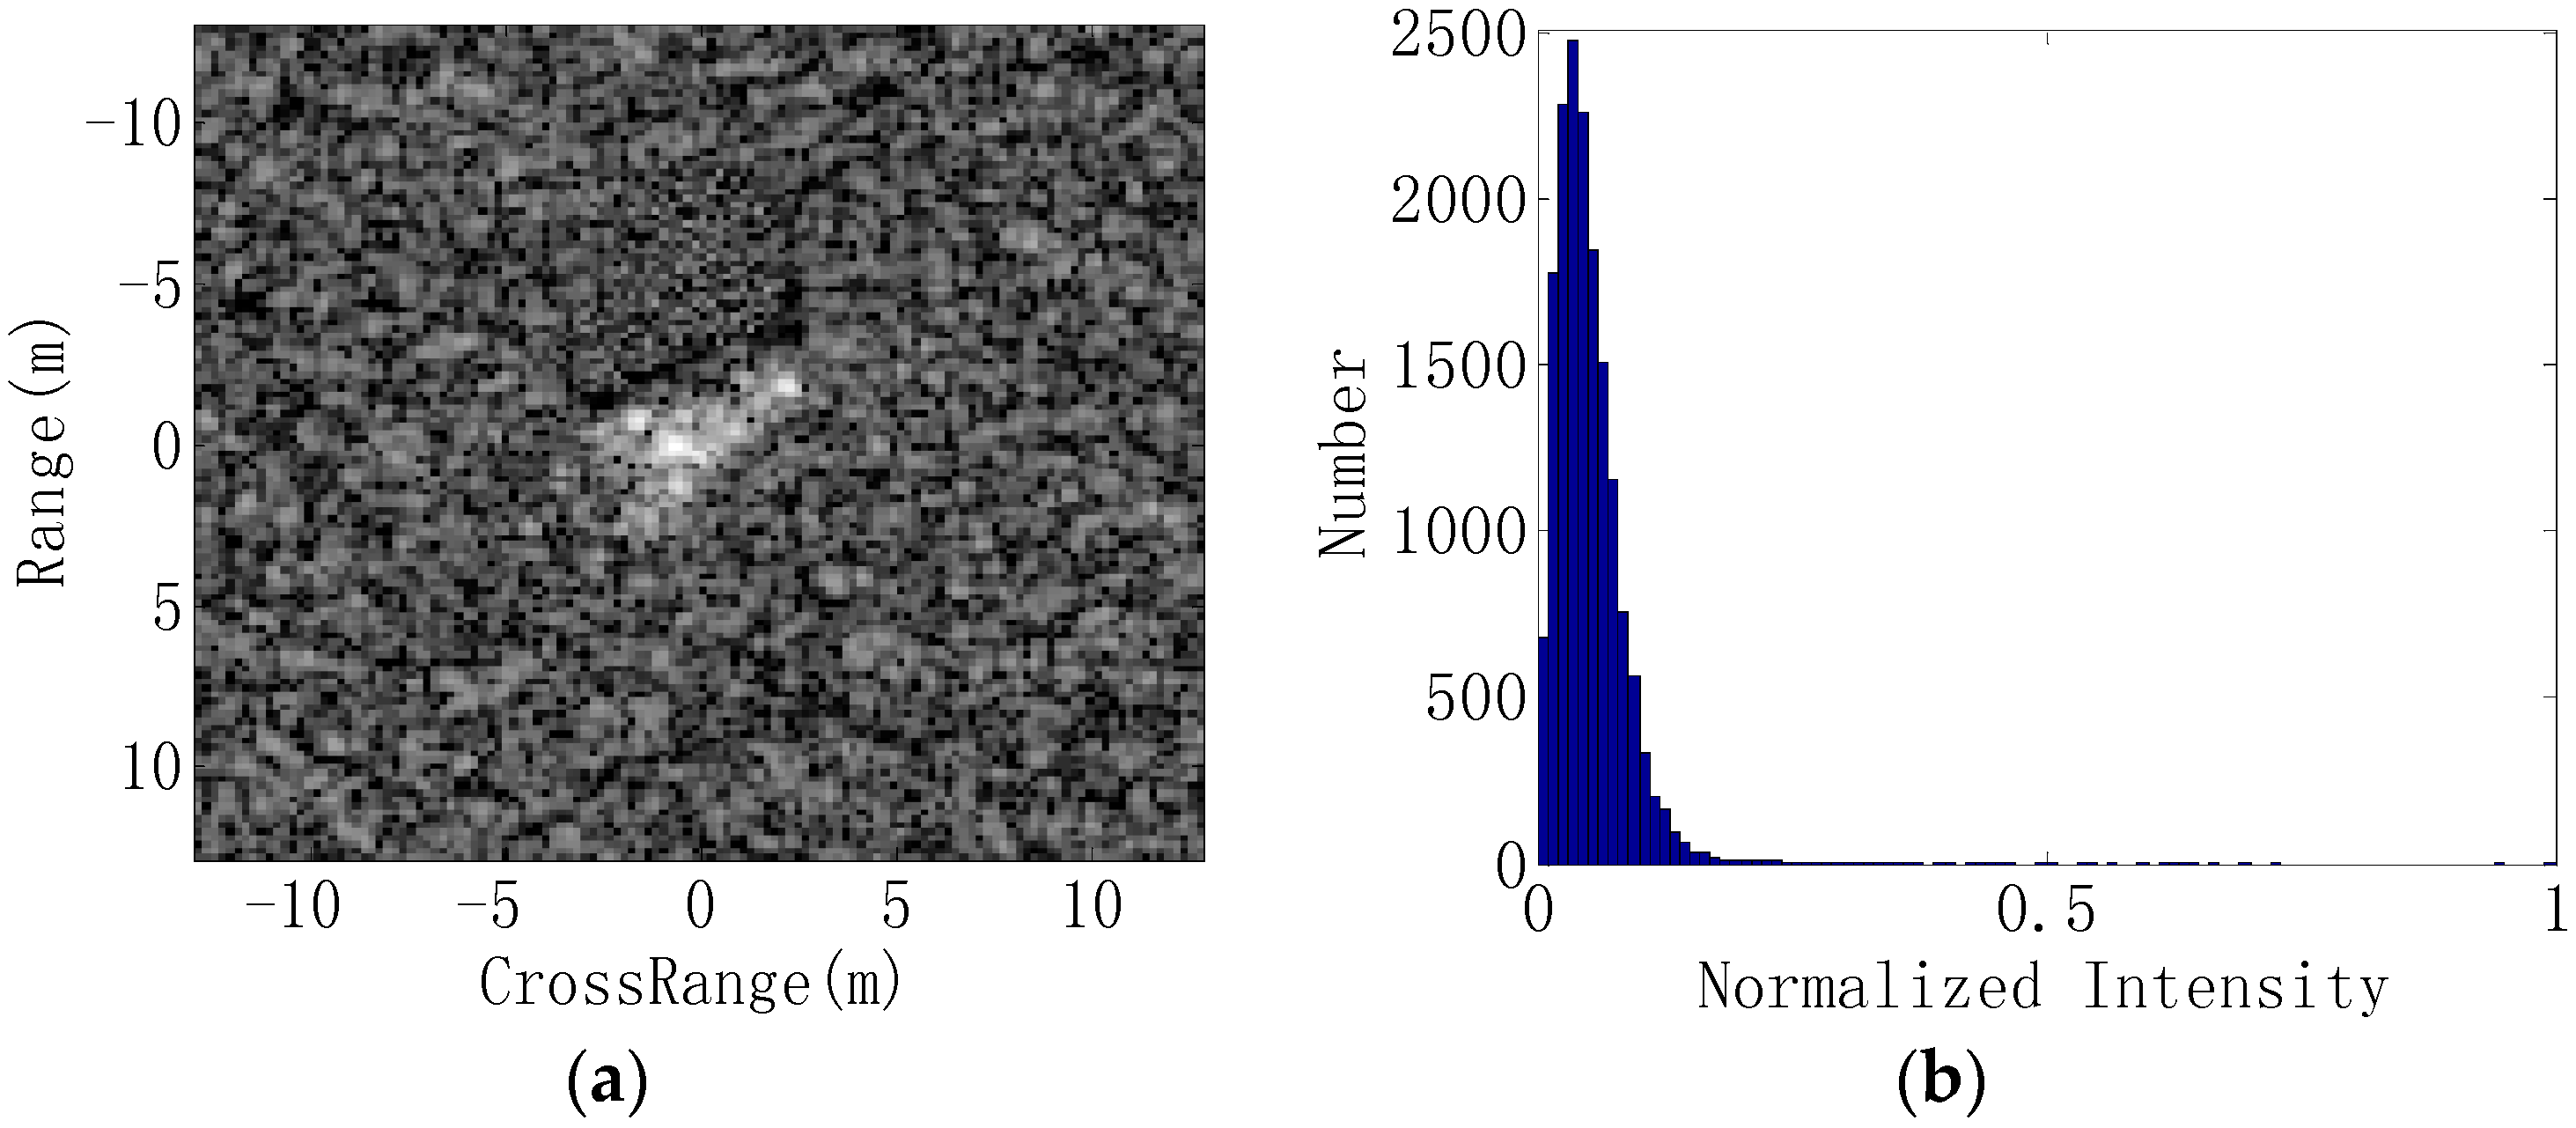
By replacing the extracted shadow with randomly selected background pixels in the original image, the target image is obtained as Figure 4b. Compared with the original image in Figure 2a, the target image represents the coupling of target backscattering and the background with no shadow. The original image, target image and shadow image reflect the discriminative information from different aspects. It is theoretically optimal to perfectly fuse the three components for target recognition. However, the shadow image is not used in this paper because of the following considerations. First, the shadow contains much less discriminative information than the target region, so it is not efficient to separately classify it at comparable time consumption with other components. Second, because of possible shadow segmentation errors, the discriminability of the extracted shadow is actually impaired. Third, the discriminative information in the shadow is totally conveyed by the shape (or contour). Thus, it is difficult to design an effective and efficient classifier for shadow recognition [11]. Finally, the original image can cover much of the shadow discriminability such as the physical sizes of the target.
Comparing Figure 2a and Figure 4a, we observe that the original image and target image share a large common area. However, they have different information. When the shadow in the original image is replaced by the background pixels, the intensity distribution of the target image is different from the original one. A comparison of the histograms in Figure 2b and Figure 4b shows that the target image has much fewer pixels with notably low intensities. When the test image is captured under SOC, both backscattering in the target region and shape information in the shadow are discriminative for the target recognition. For EOCs, where the target backscattering or shadow shape is distorted, the use of only the target image is more suitable to avoid the confusion from the shadow. For example, the image captured at a low depression angle has a much larger shadow than that at the larger depression angle [45]. Under this condition, the shadow should not be used because it may introduce more confusing information than the discriminative information. The original image and target image can provide different discriminabilities, which can complement each other for a robust target recognition.
3. Score-Level Fusion for Target Recognition
3.1. Sparse Representation-Based Classification (SRC)
The SRC assumes that a test sample from class lies in the same subspace with its truly corresponding class [38]. Consequently, it can be recovered from the sparse representation with respect to the global dictionary of individual classes. We denote the dictionary constructed by training samples from classes as , where includes the samples from the class; is the dimension of the training sample; and is the total number of all the training samples: . Then, the sparse coefficients are solved as follows [21,38]:
where is the sparse coefficient vector, and is the permitted error tolerance. Because of the non-convex -norm objective, the optimization problem in Equation (2) is an NP-hard problem. Typical approaches to solve the problem are either approximating the original problem with -norm based convex relaxation such as an -minimization [38] or resorting to greedy schemes such as orthogonal matching pursuit (OMP) [21,34,39,40]. The detailed implementation of the OMP algorithm to solve Equation (2) is presented in Algorithm 1 [46], which will be used in the following target recognition.
After the sparse coefficient vector is solved, the SRC decides the identity of the test sample as the class with the minimum reconstruction error [21,34,39,40].
where and denote the corresponding coefficients reconstruction error to the class. The SRC is more robust to noise corruption and partial occlusion than other prevalent classifiers such as SVM [38], which is also a motivation to use it in this paper.
| Algorithm 1 Orthogonal matching pursuit (OMP) [46] |
|
| Output: The proposed solution obtained after iterations. |
3.2. Target Recognition via Score-Level Fusion
Based on the decisions from the original and target images, a score-level fusion is performed to combine the two results. As an effective strategy of decision fusion, the score-level fusion can produce more robust recognition results [10,39,40]. In the framework of SRC, the residual of a certain class reflects the distance from the test image to the manifold spanned by the training samples of that class. A smaller minimum residual indicates a more reliable decision [10]. Thus, it is reasonable to evaluate the similarities of the test sample with individual classes based on the residual of each class. For a consistent comparison, a normalized score is used to evaluate the classification results as follow:
To fuse the two scores, a linear combination is performed according to Equation (5).
where and are the normalized scores of the original image and target image, respectively; and and are the corresponding weights with a summation of 1. By adjusting the weights, disproportional importance is put on different components.
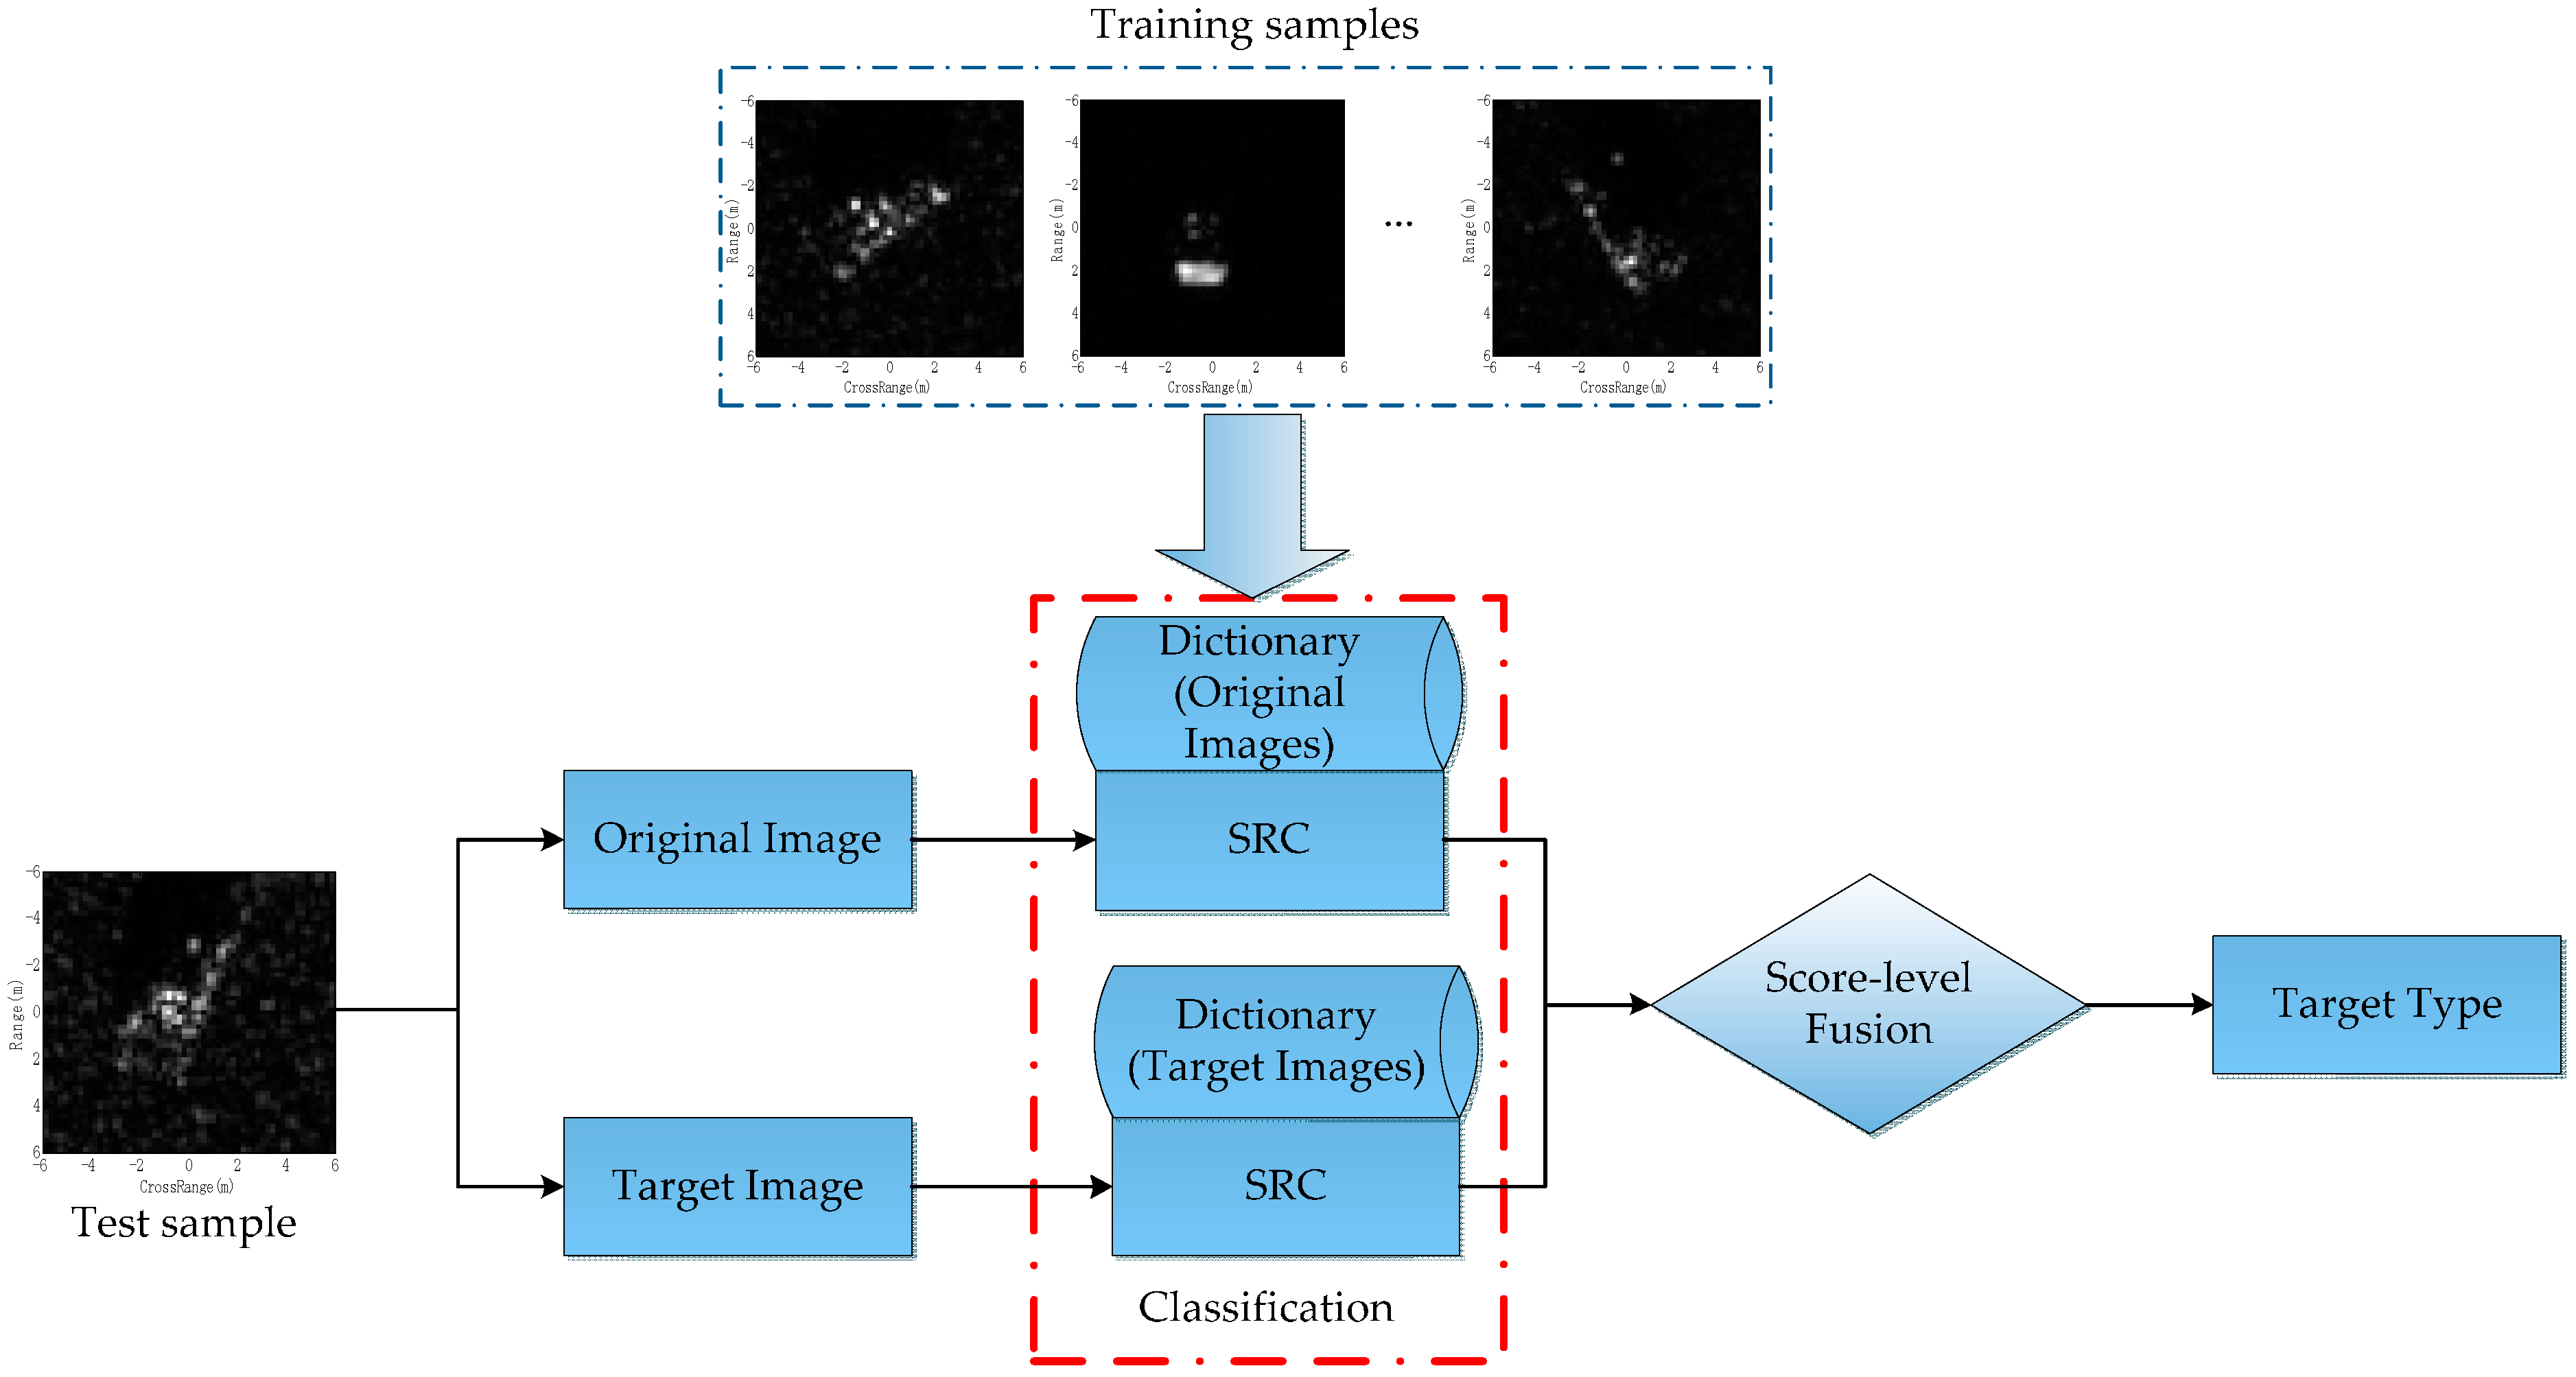
As a decision fusion strategy, the score-level fusion is demonstrated effective in several relevant literatures [10,39,40]. In the proposed classification scheme for the information-decoupled representations, the merit of SRC, such as good robustness to noise corruption and partial occlusions, can be inherited. Moreover, the score-level fusion can effectively combine the advantages of the original and target images. Therefore, it is predicable that the proposed method can improve the effectiveness and robustness of the SAR ATR. The detailed procedure of the proposed method is illustrated in Figure 5. Considering the high dimensionality of the original image and target image, random projection [21,33,47] is used to reduce the dimension. As indicated in [47], the random projection is a good “partner” for “compressive classification” including SRC. To solve the sparse coefficients, the OMP algorithm is used, which is demonstrated to be effective in SAR ATR [21,34,39,40].
4. Experiment
4.1. Data Preparation
The MSTAR dataset is used for performance evaluation in this paper, and includes the SAR images of ten classes of ground targets collected by the X-based SAR sensors. The SAR images have a resolution of 0.3 m × 0.3 m, covering the full azimuths from 0° to 359° at two depression angles of 15° and 17°. The optical images and corresponding SAR images of the ten targets are shown in Figure 6. Available samples of the ten targets in the training and test sets are summarized in Table 2.
To quantitatively evaluate the proposed method, several state-of-the-art SAR ATR methods are compared, including SVM [30] and CNN [35]. Meanwhile, SRC is performed on the segmented target image, which is denoted as Segment-SRC. The target segmentation method was proposed in [36]. However, the target segmentation errors will impair the recognition performance [10,13]. For fair comparison, the random projection is used to reduce the dimensionality of the original SAR images in SVM and Segment-SRC in consistency with the proposed method. The performances of individual information-decoupled representations by SRC are also compared. The SRCs performed on the original image and target image are denoted as Original-SRC and Target-SRC, respectively. According to the experimental results, the selected weights for the original image and target image 0.5 and 0.5 to indicate identical importance on both components. The dimensionality of the random projection is set to be 1024 [33]. In the remainder of this section, the experiment is first conducted under SOC, i.e., a 10-class recognition problem. Then, the proposed method is tested under several typical EOCs, i.e., configuration variance and depression angle variance. Moreover, the proposed method is tested with shadow segmentation errors to evaluate its robustness. Finally, the outlier rejection performance of the proposed method is evaluated.
4.2. Recognition under SOC
In this experiment, the 10-class samples in Table 2 are used for algorithm evaluation and comparison. The images captured at 17° depression angle are used for training, and the images at 15° depression angle are tested. For BMP2 and T72 with three different serial numbers, only the serials, Sn_9563 for BMP2 and Sn_132 for T72 are used for training. As shown in the confusion matrix in Table 3, T62 and BDRM2 can be recognized with a probability of correct classification (PCC) of 100% by the proposed method. BMP2 and T72 suffer the lowest PCCs (below 90%) mainly because of the configuration variations between the training set and test set.
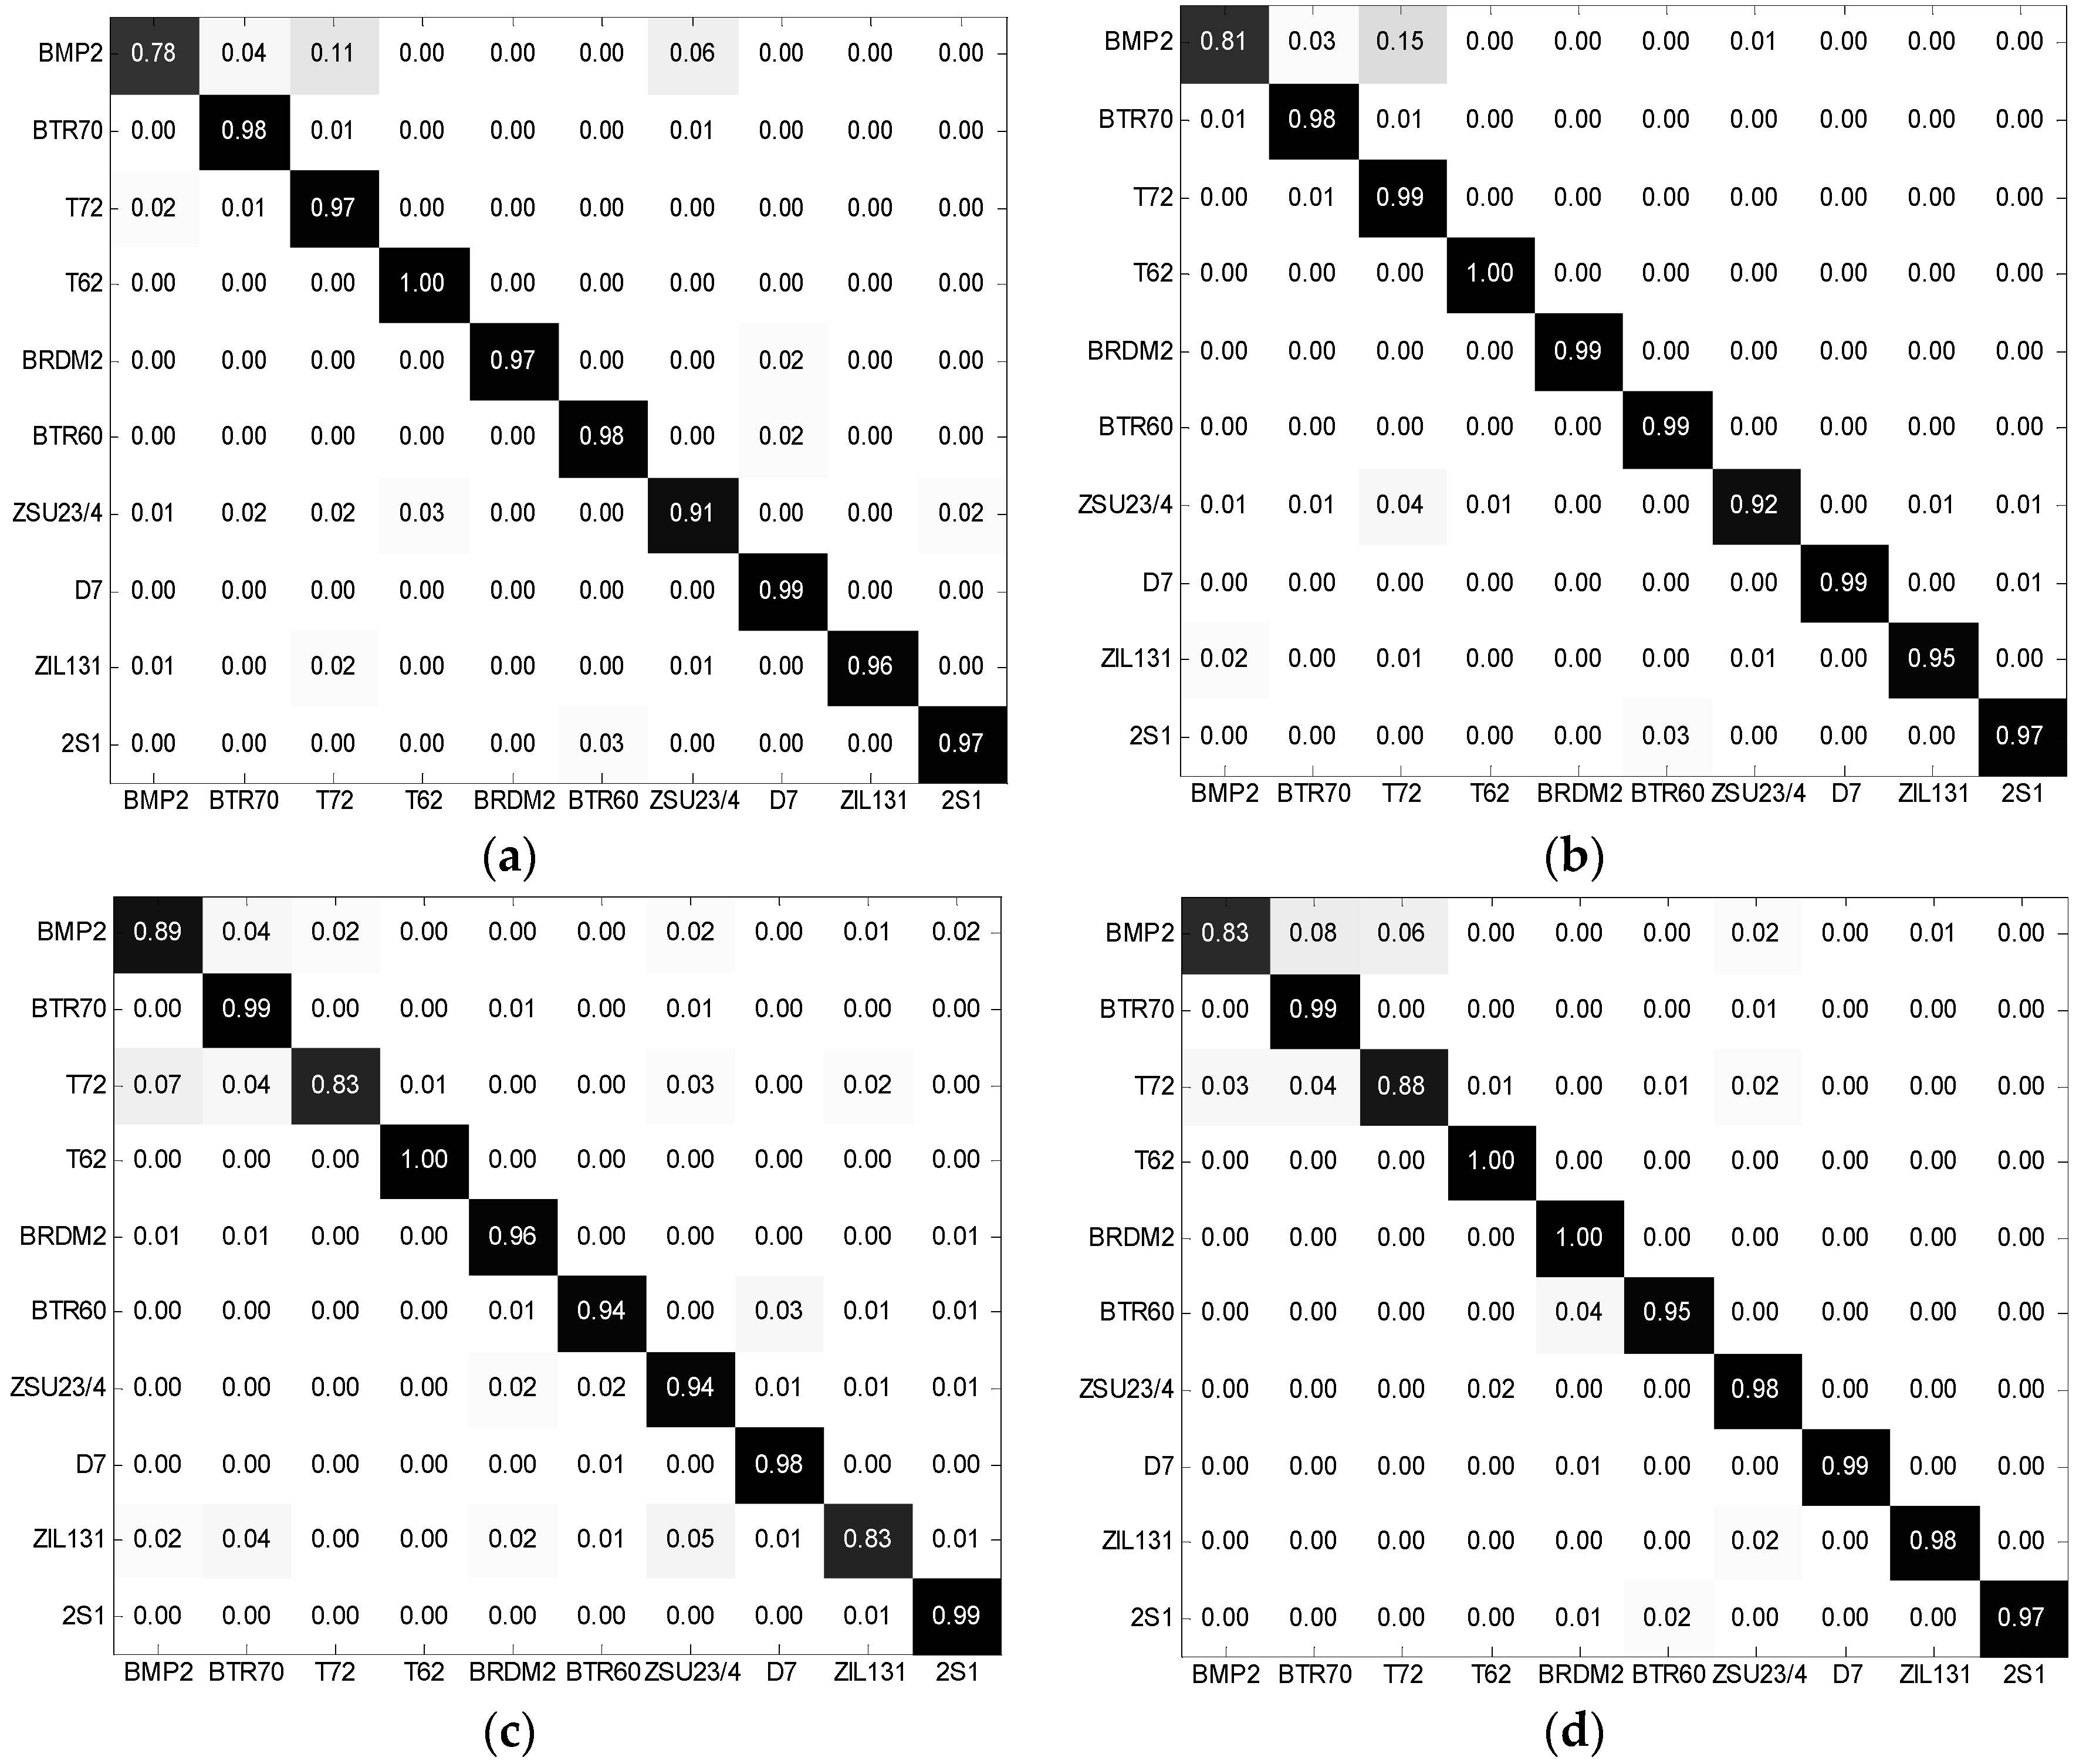
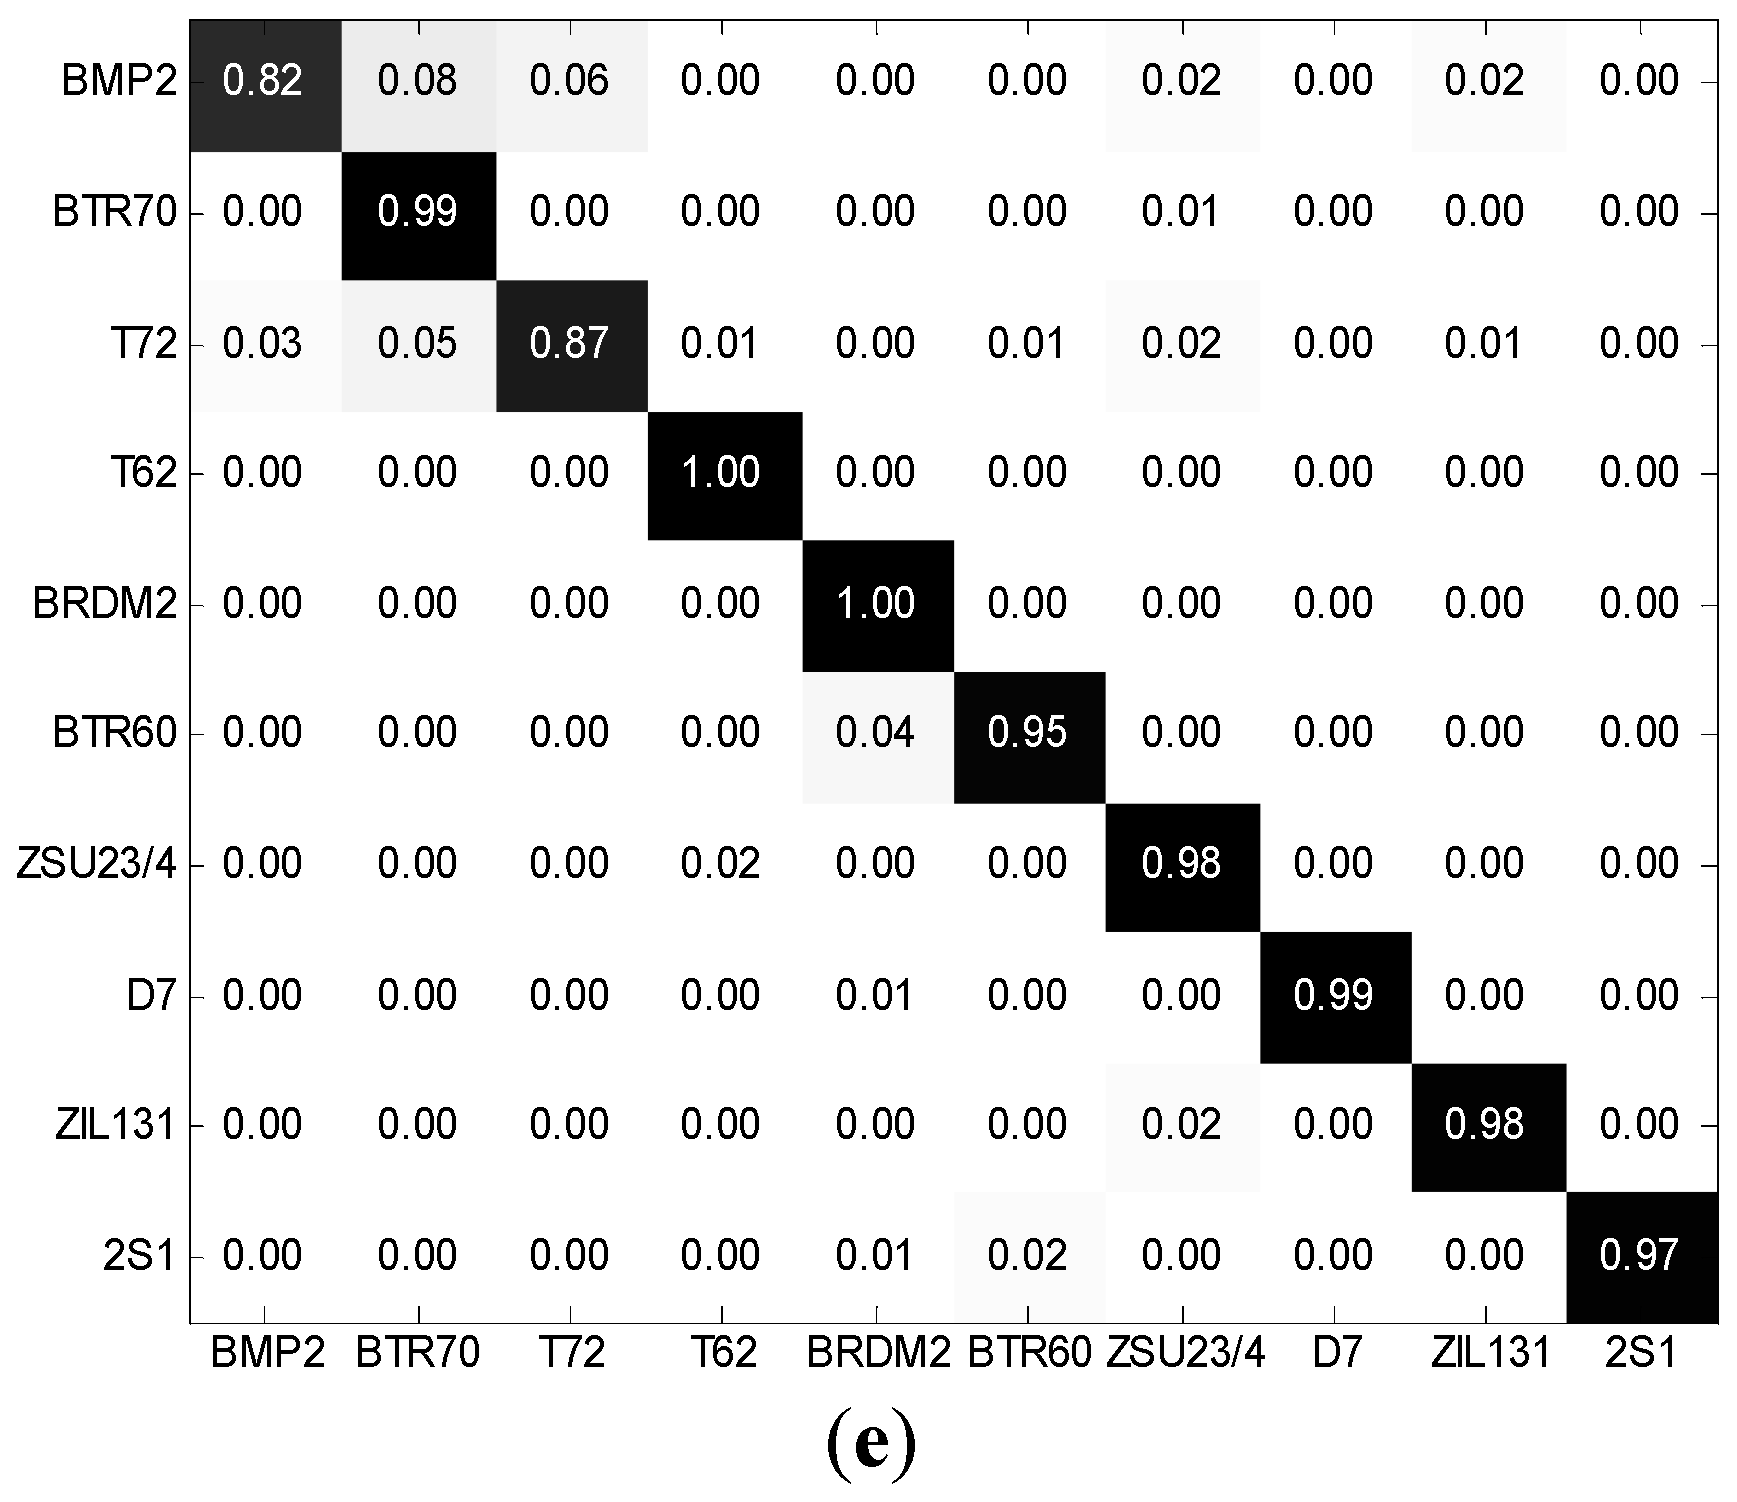
Table 4 compares the performance of the proposed method with the reference methods including the average PCC and time consumption to recognize a single MSTAR image. The proposed method achieves the highest PCC among all methods. Moreover, the proposed method has more than 1% improvement in PCC over SVM. The PCC of CNN is only slightly lower than that of the proposed method. The possible reason is that the CNN is trained by the intensity images with no loss of information caused by the random projection. The score-level fusion of the original image and target image contributes to the higher PCC of the proposed method compared to the Original–SRC and Target–SRC. It is also noticeable that the original image achieves better performance than the target image because the shadow also provides discriminative information for correct recognition under SOC. Compared with the Segment–SRC, SRC achieves a slightly higher PCC on the target image probably because the target segmentation errors impair the performance. The original image and target image are fused to complement each other to better handle the differences between the training and the test samples, i.e., 2° depression angle variance and the configuration variance in BMP2 and T72. In detail, some test samples under SOC may have different shadows with the training ones. For these samples, the target image is more appropriate for correct classification. Using the score-level fusion, the target image provides complementary discriminability for the original image to improve the recognition performance. Therefore, the proposed method achieves the best performance. The confusion matrices of the reference methods are displayed in Figure 7 for detailed comparison. All the methods consume approximately 77 ms to recognize a single MSTAR image. With such time consumption, all of them can satisfy the demand of real-time processing.
4.3. Recognition under EOCs
In real-world scenarios, many cases of SAR ATR are performed under EOCs. Therefore, it is important that the designed SAR ATR algorithms can handle various EOCs [1,37,48,49]. In this subsection, the proposed method is tested under two typical EOCs: configuration variance and depression angle variance.
4.3.1. Configuration Variance
A certain class of military target may have different configurations for different applications. Therefore, it is meaningful to test the ATR algorithms in terms of configuration variance. Table 5 presents the dataset for this experiment with four targets: BMP2, T72, BTR60 and T62. BMP2 and T72 have three serial numbers. The serials Sn_9563 for BMP2 and Sn_132 for T72 at 17° depression angle are used for training, and the remaining configurations (Sn_9566, Sn_c21, Sn_812 and Sn_s7) at 15° depression angle are tested. Therefore, the configurations of BMP2 and T72 for testing are not contained in the training set. Table 6 compares the performances of different methods in terms of configuration variance. Similar to the results under SOC, the fusion of the original image and target image contributes to the improved performance of the proposed method. With the highest PCC, the proposed method has the best robustness to configuration variance. The configuration variance changes some local structures of the target but the physical sizes and shape of the entire target are maintained. Therefore, the shadows of different configurations remain notably similar, which provides discriminability for the target recognition. Consequently, the original image performs better than the target image. Similar to the SOC target recognition, the proposed method can handle possible discordances between training and test sets using the score-level fusion.
4.3.2. Depression Angle Variance
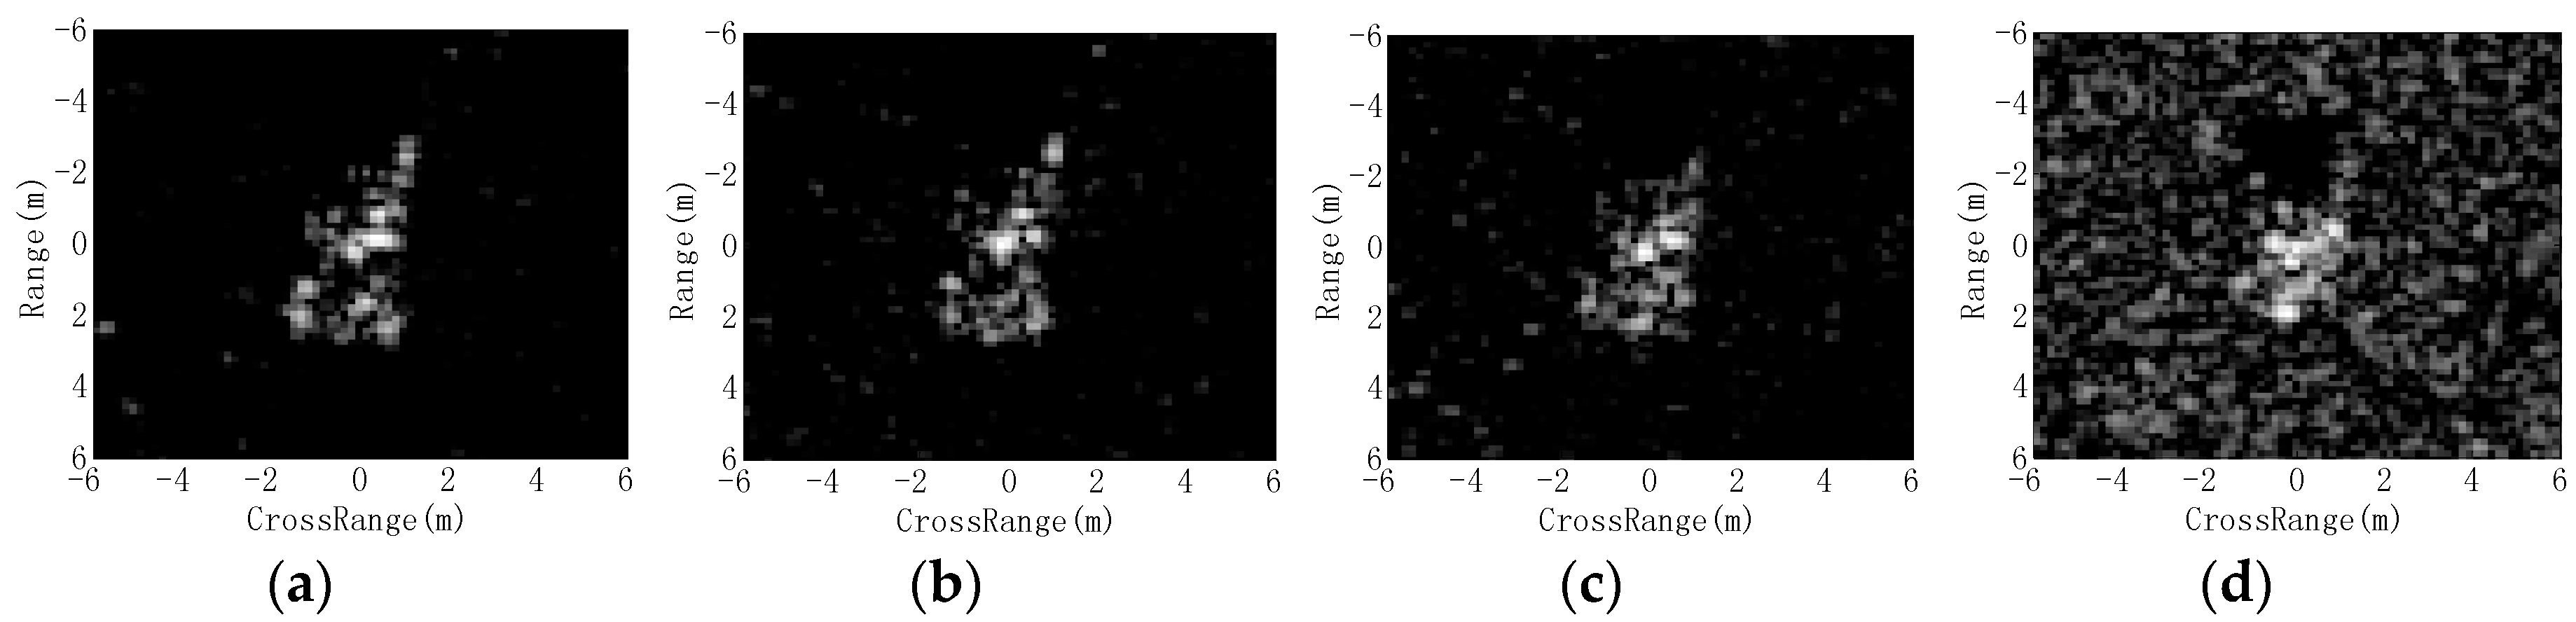
The robustness of an ATR method to a depression angle variance is also crucial because the test SAR images may be captured at a notably different depression angle from the training samples. Therefore, in this experiment, we evaluate the proposed method under depression angle variance. As summarized in Table 7, the dataset includes images of three targets (2S1, BRDM2 and ZSU23/4) at 4 depression angles (15°, 17°, 30° and 45°). The samples at 17° depression angle are used for training and the remaining ones are tested. Figure 8 shows the images of 2S1 target at different depression angles. The detailed recognition results of the proposed method under different depression angles are presented in Table 8. When the depression angle variance is not significant, the recognition is performed under SOC. Therefore, it is predictable that the test samples at 15° and 30° depression angles can be recognized with notably high PCCs. However, a drastic change in the depression angle (from 17° to 45°) will modify the global properties such as the random projection features of the images, which results in ungraceful performance degradation.
The proposed method is compared with the reference methods in Table 9, which achieves the highest PCC at each depression angle. In addition to the proposed method, Segment-SRC and Target-SRC also achieve PCCs over 70% at 45° depression angle. The large depression angle variance causes a severe deformation of the shadow shape as shown in Figure 8. Therefore, it is beneficial to improve the recognition performance without using the shadow under this condition. The proposed method can effectively inherit the discriminability of the target image. Moreover, the original image is fused to provide some complementary discriminability for target recognition because some test samples under a large depression angle variance have similar shadows with the training ones. Consequently, the proposed method achieves the best robustness to depression angle variance.
4.4. Robustness to Shadow Segmentation Errors
Shadow segmentation is the basis for the following generation of information-decoupled representations. In this section, the proposed method is evaluated with possible shadow segmentation errors to evaluate its robustness.
4.4.1. Region Deformation
First, the morphological erosion operation [43] is used to deform originally extracted shadow. Several structuring elements are designed to simulate different extents of shadow deformation as follows:
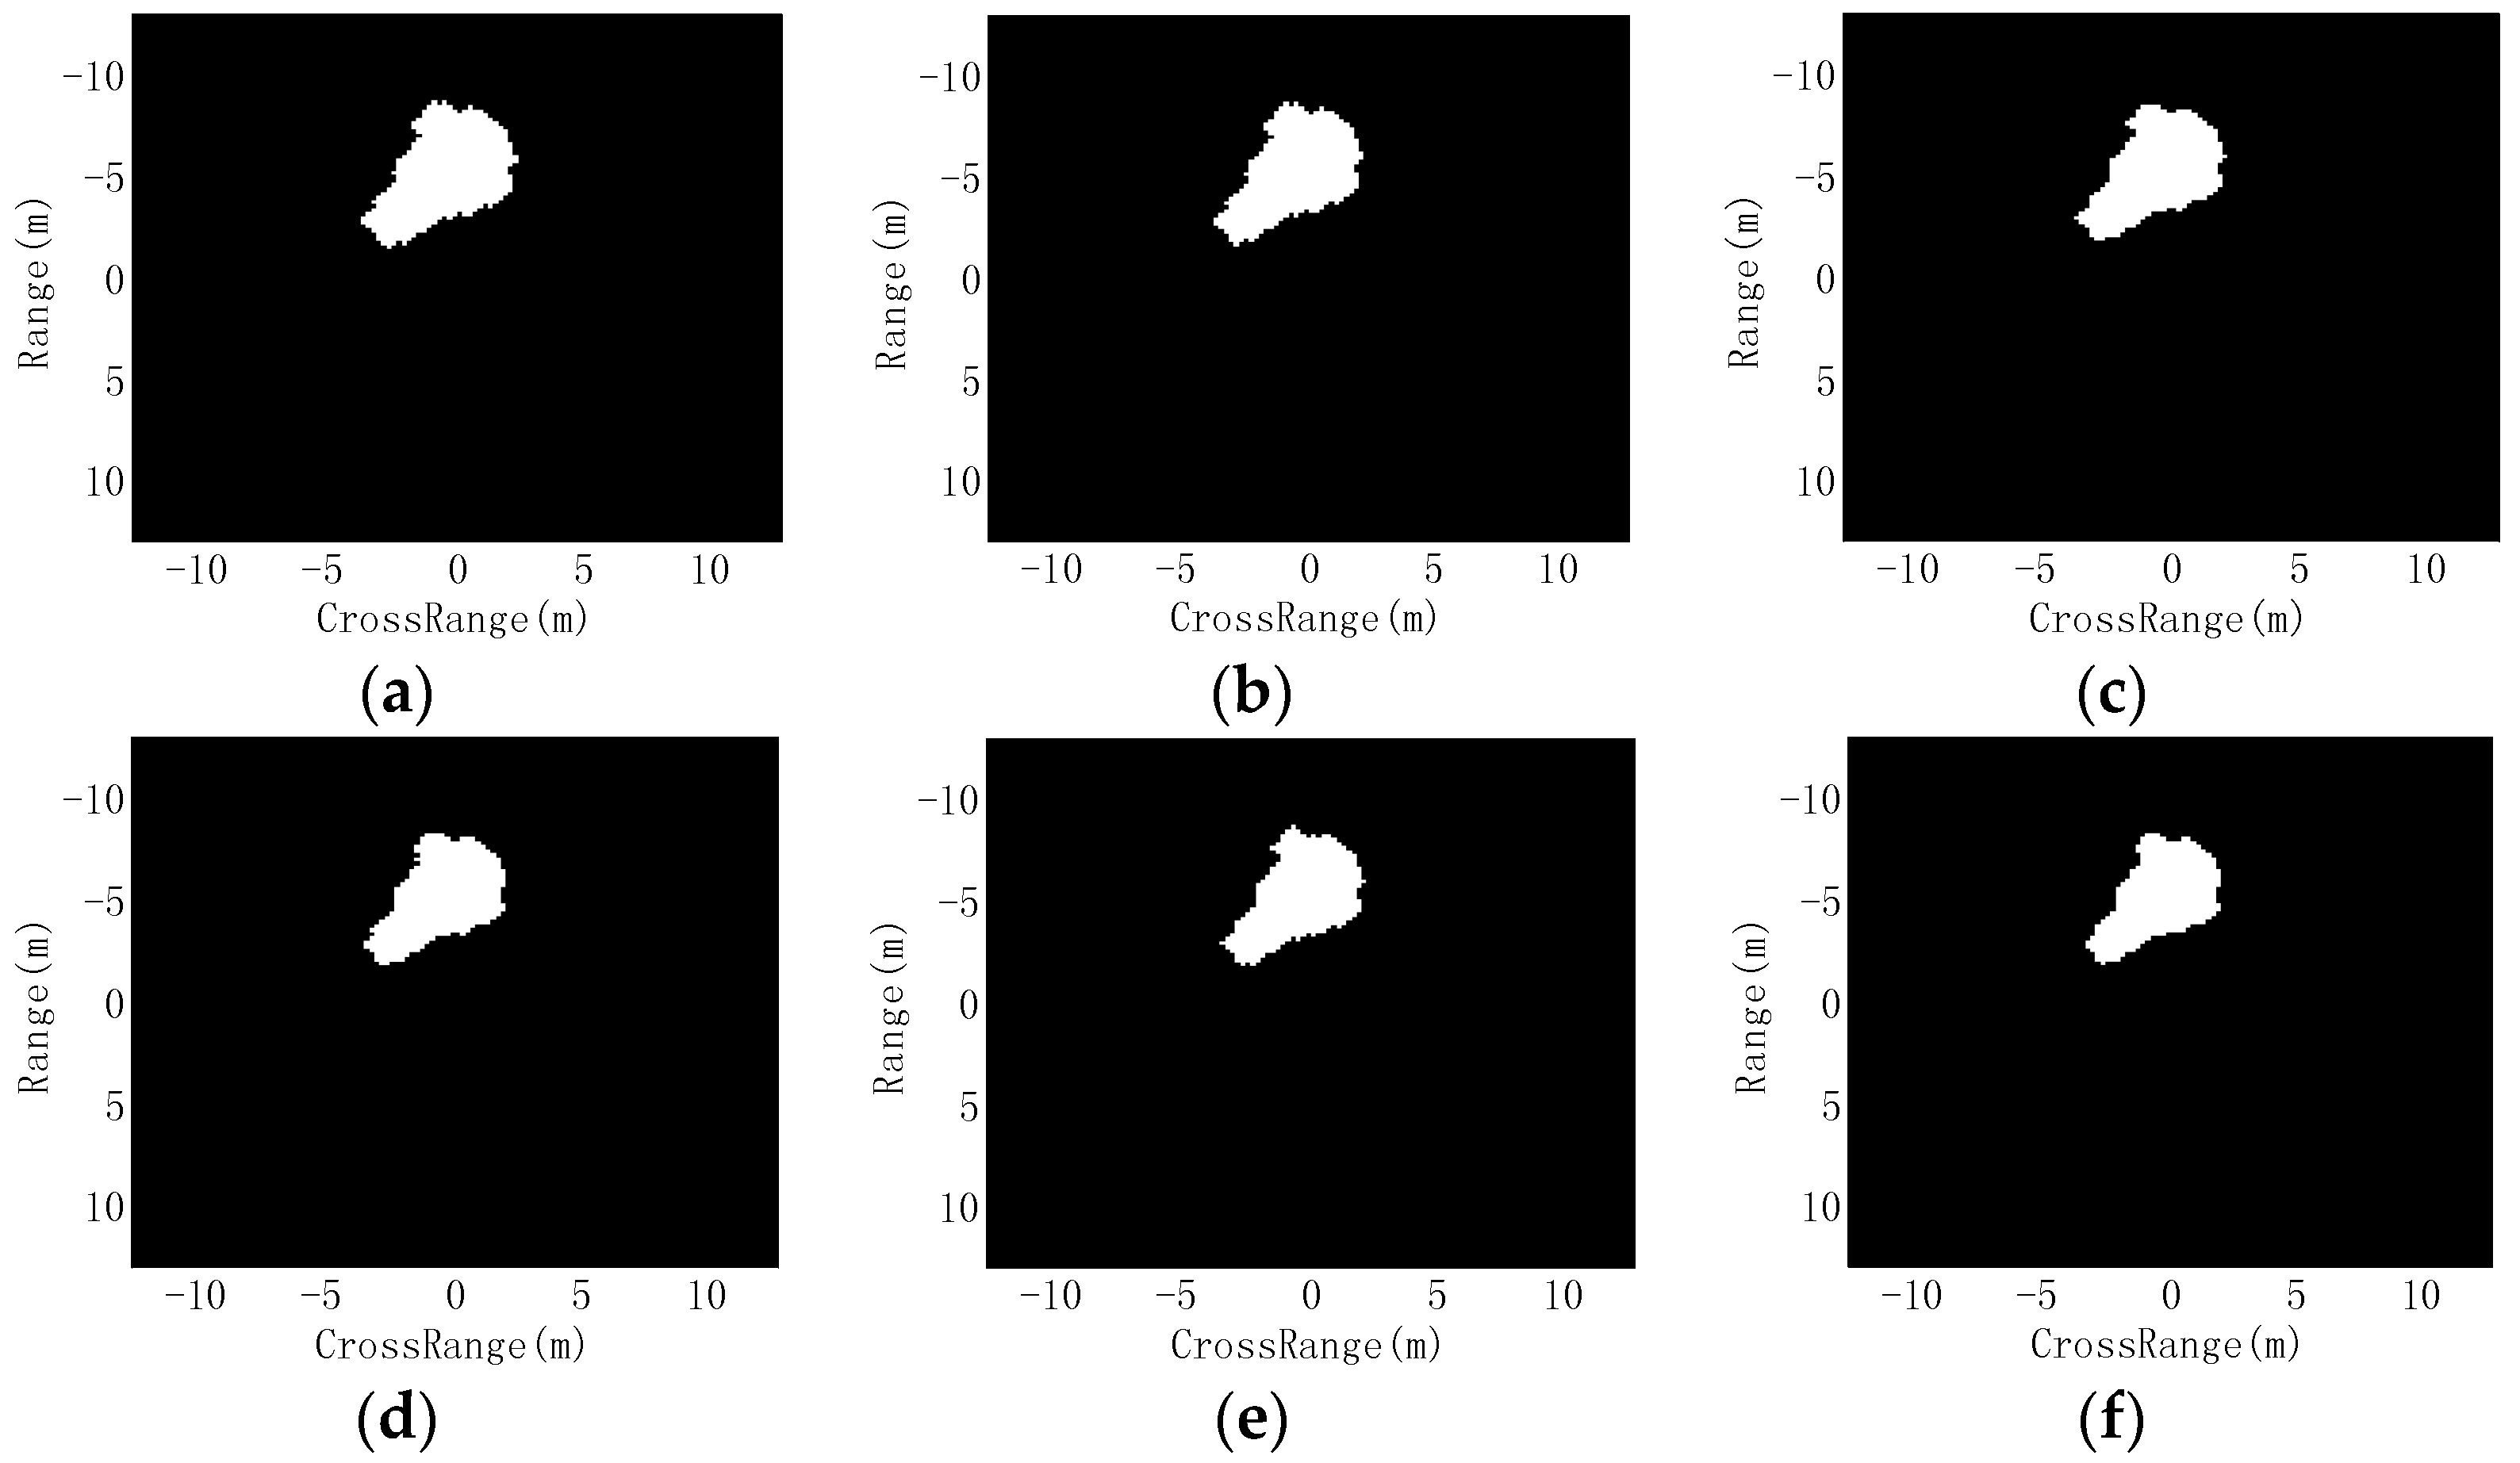
Figure 9 shows the distorted shadows after the erosion operations. The region and contour distribution vary under different structuring elements. In comparison, the Segment-SRC is tested under deformations of the target region, which are also obtained by eroding the segmented target region using the structuring elements in Equation (6). Table 10 displays the PCCs of the proposed method and Segment-SRC under different extents of segmentation errors. The distortion of the target region will cause a big loss to the target backscattering. As a result, the performance of Segment-SRC sharply decreases. The results indicate that the recognition methods performed on the target regions are notably sensitive to the segmentation errors. For the proposed method, the shadow distortion hardly degrades the performance. On the one hand, the shadow is not classified for recognition, so the shadow segmentation errors are not directly passed to the recognition results. On the other hand, according to the generation of information-decoupled representations, when the extracted shadow can cover most of the truth, the target image can be properly constructed. As shown in Figure 8, most of the true shadow region is maintained in the erosion results. Therefore, the generated target image can continue to work with high effectiveness for the target recognition.
4.4.2. Performance under Different Thresholds
In the proposed shadow extraction method in Section 2.2, the threshold is set to be the mean of the entire intensities. The change of the threshold will cause irregular deformations to the extracted shadow. For the experimental evaluation, the threshold is set to be 50%, 70%, 90%, 110%, 130% and 150% of the original one, and then the PCC of the proposed method is calculated at each threshold. Figure 10 shows the results of shadow segmentation at different thresholds. Unlike the morphological erosion results in Figure 9, the shadow deforms nonuniformly with change of the threshold. The average PCCs of the proposed method at different thresholds are plotted in Figure 11, in which the x coordinate represents the proportion of the original threshold. At a notably low threshold, some of the shadow pixels are not correctly segmented. Then, the generated target image still contains many shadow pixels, which causes some degradation to the proposed method. In contrast, at a notably high threshold, some target and background pixels will be segmented as the shadow region, which also results in the incorrectness of the target image. However, the PCCs at different threshold can remain higher than 93%, which indicates the robustness of the proposed method to changing thresholds. The performance of the proposed method is related to the precision of the generated target image. Although some background pixels are segmented as the shadow, as shown in Figure 10f, the target image can be properly generated. Then, there is only a small decrease in the PCC. In comparison, when more shadow pixels are not correctly separated out (e.g., Figure 10a), the generated target image has lower precision. However, because of the fusion of original image and target image, the proposed method can maintain good performance.
4.5. Outlier Rejection
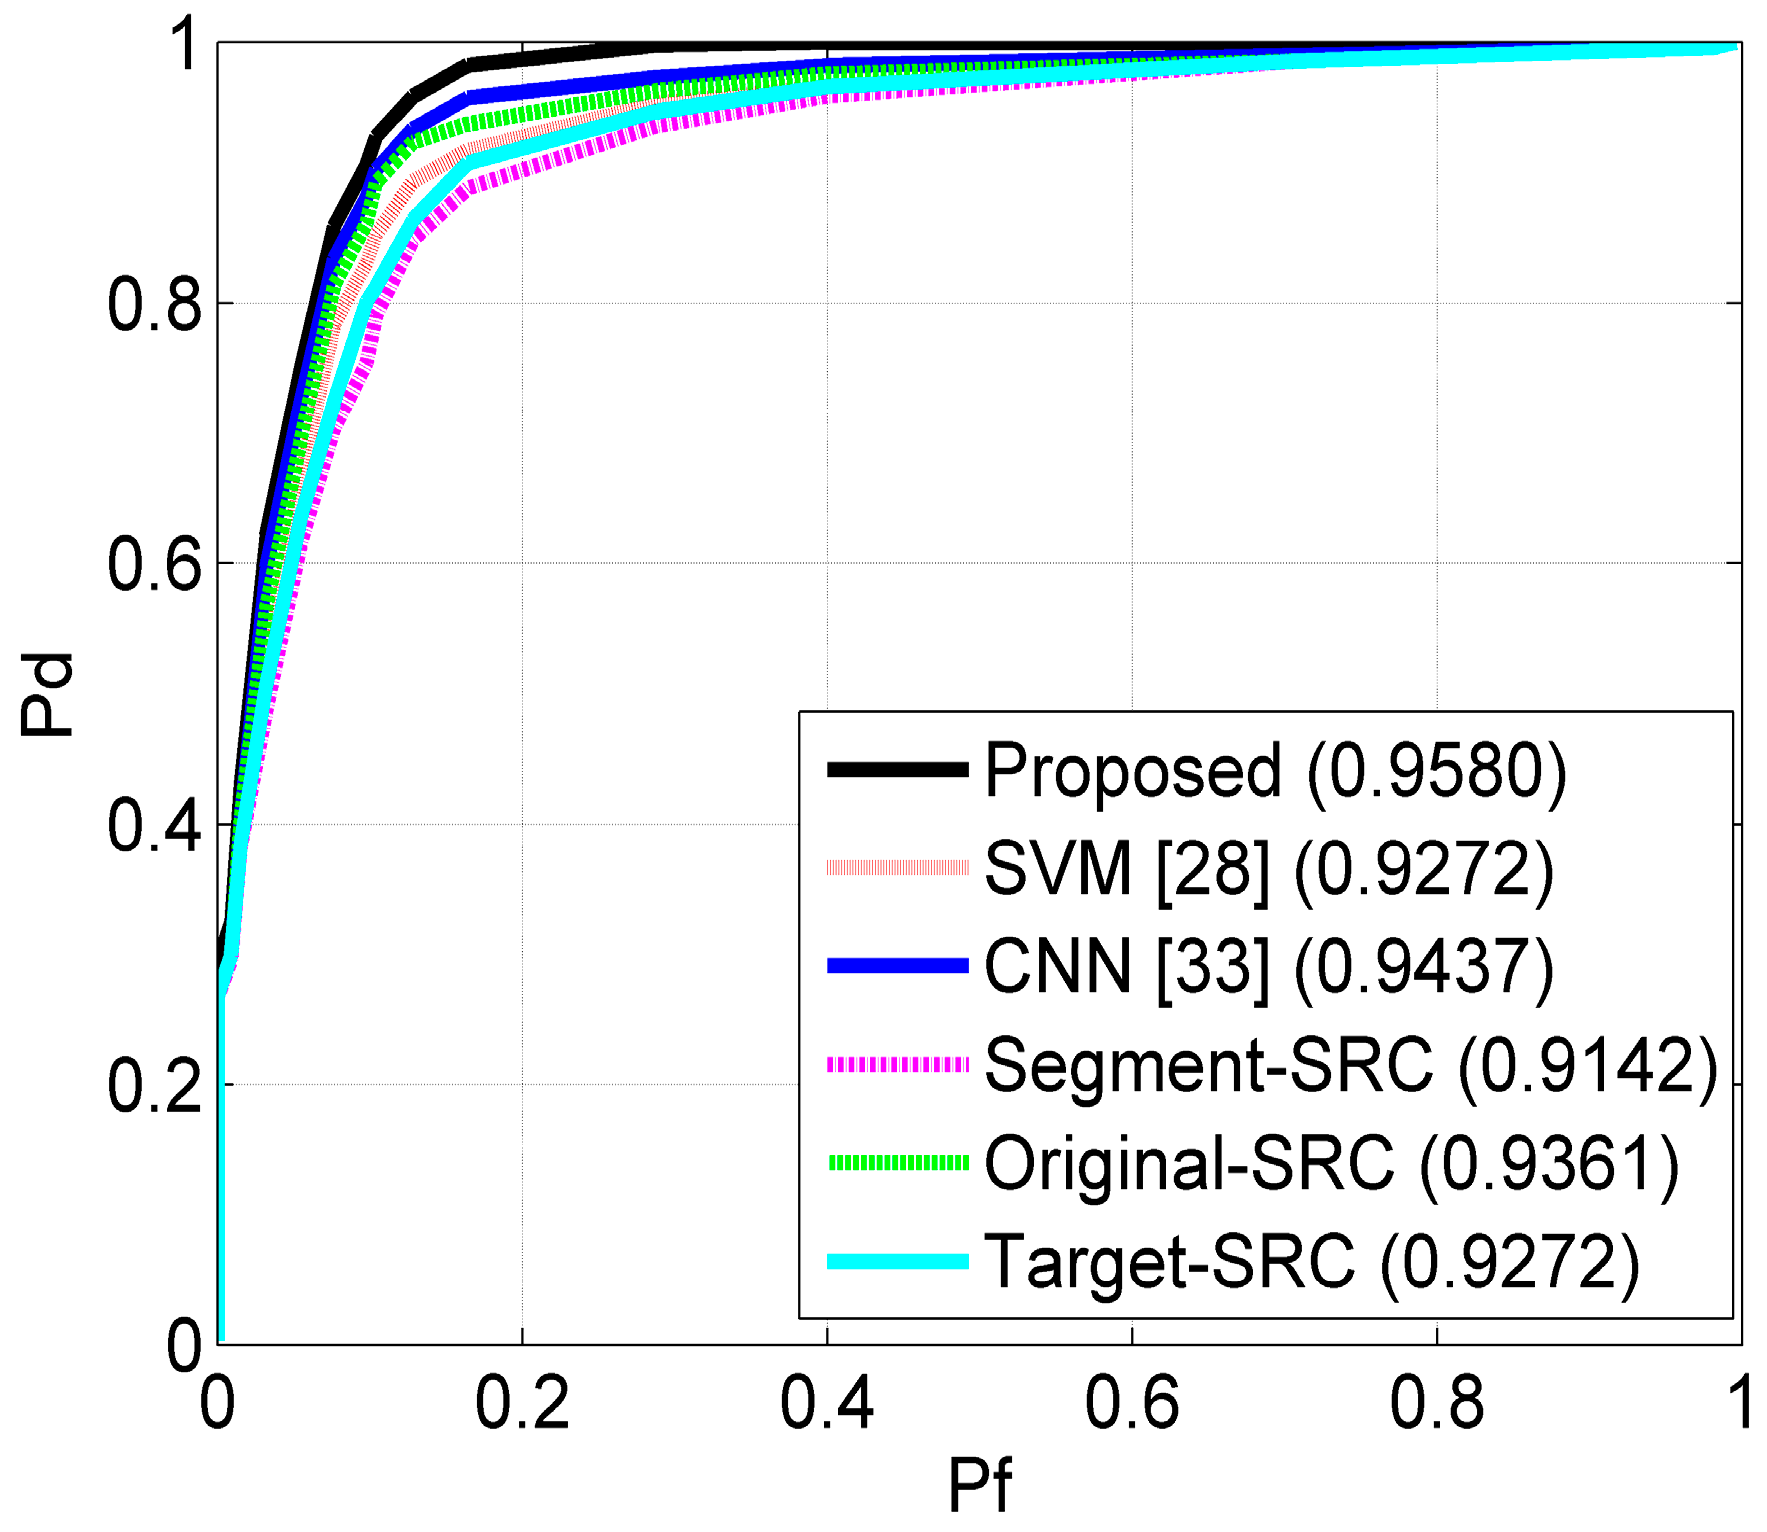
The outlier rejection performance is also crucial for an SAR ATR method, which can effectively reduce the false alarms during target recognition. Following the preceding works [37,50], three targets (BMP2, BTR70 and T72) are used as the training set while two confuser targets (2S1 and D7) to be rejected are included in the test set. It must be noted that the samples of confuser targets are not used in the training phase. Each method decides the test sample to be an “in-class” target [50] or outlier according to the preset threshold on the decision value. Then, the probability of detection (Pd) and probability of false alarm (Pf) are computed based on the correct decisions. By varying the threshold in a certain range, the receiver-operating characteristics (ROC) curves are generated, which is one of the most widely used approaches to assess the capability of outlier rejection.
As shown in Figure 12, when the Pf is lower than 0.4, the Pd obtained using the proposed method is significantly higher than the ones obtained using the reference methods. To quantitatively evaluate the outlier rejection performance, the area under the ROC curves is calculated as the average precision (the numbers in the brackets in Figure 11). With the maximum average precision, the proposed method is demonstrated most robust on outlier rejection. The score-level fusion of the original and target images effectively enhances the separability between the “in-class” targets and outliers. Therefore, the proposed method is more capable of rejecting outliers.
5. Conclusions
This paper proposes a target recognition method for SAR images by exploiting the discriminative information contained in SAR images. The original image is used to construct information-decoupled representations: target image and shadow image. The original image and target image are classified by SRC whose results are combined using a score-level fusion. Experiments conducted under SOC and various EOCs demonstrate the excellent performance of the proposed method. The comparison with some state-of-the-art methods further validates its superiority. Based on the experimental results, several conclusions can be drawn. (1) According to the results under SOC and configuration variance, the shadow can actually provide discriminability for target recognition. Therefore, merely using the target region without shadow will cause information loss; (2) According to the results under depression angle variance, the shadow may bring more confusion when it is severely deformed. The combination of the original and target images can effectively improve the robustness to large depression angle variance; (3) The score-level fusion can promote the recognition performance including PCC and robustness to various EOCs; (4) The proposed method is insensitive to the shadow segmentation errors, including both uniform and nonuniform ones, whereas the methods based on target segmentation are closely related to the segmentation precision; (5) The proposed method has good capability of rejecting outliers to reduce the false alarms during target recognition.
As future work, more classification schemes and fusion strategies can be applied to the proposed information-decoupled representations. Moreover, some efficient and robust shadow classification methods may be employed to incorporate the shadow image into the fusion framework.
Acknowledgments
This work was supported by the National Natural Science Foundation of China under Grant No. 31500897 and the Fundamental Research Funds of the Central Universities under Grant No. 1301030696.
Author Contributions
Ming Chang proposed the general idea of the method and performed the experiments. Xuqun You reviewed the idea and provided many suggestions. This manuscript was written by Ming Chang.
Conflicts of Interest
The authors declare no conflict of interest.
References
- El-Darymli, K.; Gill, E.W.; McGuire, P.; Power, D.; Moloney, C. Automatic Target Recognition in Synthetic Aperture Radar Imagery: A State-of-the-Art Review. IEEE Access 2016, 4, 6014–6058. [Google Scholar] [CrossRef]
- Dabboor, M.; Montpetit, B.; Howell, S.; Haas, C. Improving sea ice characterization in dry ice winter conditions using polarmetric parameters from C- and l-Band SAR data. Remote Sens. 2017, 9, 1270. [Google Scholar] [CrossRef]
- Gao, F.; Liu, X.; Dong, J.Y.; Zhong, G.Q.; Jian, M.W. Change detection in SAR images based on deep Semi-NMF and SVD networks. Remote Sens. 2017, 9, 435. [Google Scholar] [CrossRef]
- Bai, J.B.; Adriano, B.; Mas, E.; Koshimura, S. Machine learning based building damage mapping from the ALSO-2/PALSAR-2 SAR imagery: Case study of 2016 Kumamoto earthquake. J. Disaster Res. 2017, 12, 646–655. [Google Scholar] [CrossRef]
- Bai, J.B.; Gao, C.; Singh, S.; Koch, M.; Adriano, B.; Mas, E.; Koshimura, S. A framework of rapid regional tsunami damage recognition from post-event TerraSAR-X imagery using deep neural networks. IEEE Geosci. Remote Sens. Lett. 2018, 15, 43–47. [Google Scholar] [CrossRef]
- Li, J.C.; Duan, C.J.; Fei, Z.Y. A novel variable selection approach for redundant information elimination purpose of process control. IEEE Trans. Ind. Electron. 2016, 63, 1737–1744. [Google Scholar] [CrossRef]
- Chen, X.; Gu, Y.F. Class-specific feature selection with local geometric structure and discriminative information based on sparse similar samples. IEEE Geosci. Remote Sens. Lett. 2015, 12, 1932–1936. [Google Scholar]
- Xu, L.L.; Li, J.; Shu, Y.M.; Peng, J.H. SAR image denoising via clustering-based principal component analysis. IEEE Trans. Geosci. Remote Sens. 2014, 52, 6858–6869. [Google Scholar]
- Argenti, F.; Lapini, A.; Bianchi, T.; Alparone, L. A tutorial on speckle reduction in synthetic aperture radar Images. IEEE Geosci. Remote Sens. Mag. 2013, 1, 6–35. [Google Scholar] [CrossRef]
- Dong, G.G.; Kuang, G.Y. Classification on the monogenic scale space: Application to target recognition in SAR image. IEEE Trans. Image Process. 2015, 24, 2527–2538. [Google Scholar] [CrossRef] [PubMed]
- Park, J.; Park, S.; Kim, K. New discrimination features for SAR automatic target recognition. IEEE Geosci. Remote Sens. Lett. 2013, 10, 476–480. [Google Scholar] [CrossRef]
- Huang, Y.L.; Pei, J.F.; Yang, J.Y.; Liu, X. Neighborhood geometric center scaling embedding for SAR ATR. IEEE Trans. Aerosp. Electron. Syst. 2014, 50, 180–192. [Google Scholar] [CrossRef]
- Ding, B.Y.; Wen, G.J.; Ma, C.H.; Yang, X.L. Target recognition in synthetic aperture radar images using binary morphological operations. J. Appl. Remote Sens. 2016, 10, 046006. [Google Scholar] [CrossRef]
- Amoon, M.; Rezai-rad, G. Automatic target recognition of synthetic aperture radar (SAR) images based on optimal selection of Zernike moment features. IET Comput. Vis. 2014, 8, 77–85. [Google Scholar] [CrossRef]
- Papson, S.; Narayanan, R.M. Classification via the shadow region in SAR imagery. IEEE Trans. Aerosp. Electron. Syst. 2012, 48, 969–980. [Google Scholar] [CrossRef]
- Anagnostopulos, G.C. SVM-based target recognition from synthetic aperture radar images using target region outline descriptors. Nonlinear Anal. 2009, 71, e2934–e2939. [Google Scholar] [CrossRef]
- Cui, J.J.; Gudnason, J.; Brookes, M. Automatic recognition of MSTAR targets using radar shadow and super resolution features. In Proceedings of the IEEE International Conference on Acoustics, Speech, and Signal Processing (ICASSP), Philadelphia, PA, USA, 18–23 March 2005. [Google Scholar]
- Schumacher, R.; Schiller, J. Non-cooperative target identification of battlefield targets—Classification results based on SAR images. In Proceedings of the IEEE International Radar Conference, Arlington, VA, USA, 9–12 May 2005. [Google Scholar]
- Mishra, A.K. Validation of PCA and LDA for SAR ATR. In Proceedings of the 2008 IEEE Region 10 Conference, Hyderabad, India, 19–21 November 2008; pp. 1–6. [Google Scholar]
- Cui, Z.Y.; Cao, Z.J.; Yang, J.Y.; Feng, J.L.; Ren, H.L. Target recognition in synthetic aperture radar via non-negative matrix factorization. IET Radar Sonar Navig. 2015, 9, 1376–1385. [Google Scholar] [CrossRef]
- Thiagarajan, J.; Ramamurthy, K.; Knee, P.P.; Spanias, A.; Berisha, V. Sparse representation for automatic target classification in SAR images. In Proceedings of the 2010 4th Communications, Control and Signal Processing (ISCCSP), Limassol, Cyprus, 3–5 March 2010. [Google Scholar]
- Karine, A.; Toumi, A.; Khenchaf, A.; Hassouni, M.E. Saliency attention and sift keypoints combinations for automatic target recognition on MSTAR dataset. In Proceedings of the International Conference on Advanced Technologies for Signal and Imaging Processing (ATSIP), Fez, Morocco, 22–24 May 2017. [Google Scholar]
- Karine, A.; Toumi, A.; Khenchaf, A.; Hassouni, M.E. Visual salient sift keypoints descriptors for automatic target recognition. In Proceedings of the 6th European Workshop on Visual Information Processing (EUVIP), Marseille, France, 25–27 October 2016. [Google Scholar]
- Song, S.L.; Xu, B.; Yang, J. SAR target recognition via supervised discriminative dictionary learning and sparse representation of the SAR-Hog feature. Remote Sens. 2016, 8, 683. [Google Scholar] [CrossRef]
- Ding, B.Y.; Wen, G.J.; Huang, X.H.; Ma, C.H.; Yang, X.L. Target recognition in synthetic aperture radar images via matching of attributed scattering centers. IEEE J. Sel. Top. Appl. Earth Obs. Remote Sens. 2017, 10, 3334–3347. [Google Scholar] [CrossRef]
- Ding, B.Y.; Wen, G.J.; Zhong, J.R.; Ma, C.H.; Yang, X.L. A robust similarity measure for attributed scattering center sets with application to SAR ATR. Neurocomputing 2017, 219, 130–143. [Google Scholar] [CrossRef]
- Ding, B.Y.; Wen, G.J.; Huang, X.H.; Ma, C.H.; Yang, X.L. Data augmentation by multilevel reconstruction using attributed scattering center for SAR target recognition. IEEE Geosci. Remote Sens. Lett. 2017, 14, 979–983. [Google Scholar] [CrossRef]
- Ding, B.Y.; Wen, G.J.; Zhong, J.R.; Ma, C.H.; Yang, X.L. Robust method for the matching of attributed scattering centers with application to synthetic aperture radar automatic target recognition. J. Appl. Remote Sens. 2016, 10, 016010. [Google Scholar] [CrossRef]
- Ding, B.Y.; Wen, G.J.; Ma, C.H.; Yang, X.L. Decision fusion based on physically relevant features for SAR ATR. IET Radar Sonar Navig. 2017, 11, 682–690. [Google Scholar] [CrossRef]
- Zhao, Q.; Principe, J.C. Support vector machines for synthetic radar automatic target recognition. IEEE Trans. Aerosp. Electron. Syst. 2001, 37, 643–654. [Google Scholar] [CrossRef]
- Liu, H.C.; Li, S.T. Decision fusion of sparse representation and support vector machine for SAR image target recognition. Neurocomputing 2013, 113, 97–104. [Google Scholar] [CrossRef]
- Karine, A.; Toumi, A.; Khenchaf, A.; Hassouni, M.E. Target recognition in radar images using weighted statistical dictionary-based sparse representation. IEEE Geosci. Remote Sens. Lett. 2017, 14, 2403–2407. [Google Scholar] [CrossRef]
- Zhang, H.C.; Nasrabadi, N.M.; Zhang, Y.N.; Huang, T.S. Multi-view automatic target recognition using joint sparse representation. IEEE Trans. Aerosp. Electron. Syst. 2012, 48, 2481–2497. [Google Scholar] [CrossRef]
- Song, H.B.; Ji, K.F.; Zhang, Y.S.; Xing, X.W.; Zou, H.X. Sparse representation-based SAR image target classification on the 10-class MSTAR Data set. Appl. Sci. 2016, 6, 26. [Google Scholar] [CrossRef]
- Chen, S.Z.; Wang, H.P.; Xu, F.; Jin, Y.Q. Target classification using the deep convolutional networks for SAR images. IEEE Trans. Geosci. Remote Sens. 2016, 47, 1685–1697. [Google Scholar] [CrossRef]
- Sun, Y.J.; Liu, Z.P.; Todorovic, S.; Li, J. Adaptive boosting for SAR automatic target recognition. IEEE Trans. Aerosp. Electron. Syst. 2007, 43, 112–125. [Google Scholar] [CrossRef]
- Srinivas, U.; Monga, V.; Raj, R.G. SAR automatic target recognition using discriminative graphical models. IEEE Trans. Aerosp. Electron. Syst. 2014, 50, 591–606. [Google Scholar] [CrossRef]
- Wright, J.; Yang, A.; Ganesh, A.; Sastry, S.; Ma, Y. Robust face recognition via sparse representation. IEEE Trans. Pattern Anal. Mach. Intell. 2009, 31, 210–227. [Google Scholar] [CrossRef] [PubMed]
- Ding, B.Y.; Wen, G.J.; Huang, X.H.; Ma, C.H.; Yang, X.L. Target recognition in SAR images by exploiting the azimuth sensitivity. Remote Sens. Lett. 2017, 8, 821–830. [Google Scholar] [CrossRef]
- Ding, B.Y.; Wen, G.J. Target recognition of SAR images based on multi-resolution representation. Remote Sens. Lett. 2017, 8, 1006–1014. [Google Scholar] [CrossRef]
- The Air Force Moving and Stationary Target Recognition Database. Available online: http://www.sdms.afrl.af.mil/datasets/mstar/ (accessed on 5 April 2015).
- Sullivan, J.; Blahut, R.; Snyder, D. Information-theoretic image formation. IEEE Trans. Inf. Theory 1998, 44, 2094–2123. [Google Scholar] [CrossRef]
- Shannon, C. A mathematical theory of communication. Bell Syst. Tech. J. 1948, 27, 379–423. [Google Scholar] [CrossRef]
- Gonzalez, R.C.; Woods, R.E. Digital Image Processing, 3rd ed.; Prentice Hall: Upper Saddle River, NJ, USA, 2008; ISBN 978-71-2109-600-6. [Google Scholar]
- Ravichandran, B.; Gandhe, A.; Simith, R.; Mehra, R. Robust automatic target recognition using learning classifier systems. Inf. Fusion 2007, 8, 252–265. [Google Scholar] [CrossRef]
- Pati, Y.C.; Rezaiifar, R.; Krishnaprasad, P.S. Orthogonal matching pursuit: Recursive function approximation with application to wavelet decomposition. In Proceedings of the 27th Asilomar Conference on Signal, System and Computers, Pacific Grove, CA, USA, 1–3 November 1993. [Google Scholar]
- Majumdar, A.; Ward, R.K. Robust classifier for data reduced via random projections. IEEE Trans. Syst. Man Cybern. B Cybern. 2010, 40, 1359–1371. [Google Scholar] [CrossRef] [PubMed]
- Doo, S.; Smith, G.; Baker, C. Target classification performance as a function of measurement uncertainty. In Proceedings of the 5th Asia-Pacific Conference on Synthetic Aperture Radar, Singapore, 1–4 September 2015. [Google Scholar]
- Ding, B.Y.; Wen, G.J. Exploiting multi-view SAR images for robust target recognition. Remote Sens. 2017, 9, 1150. [Google Scholar] [CrossRef]
- Scherreik, M.D.; Rigling, B.D. Open set recognition for automatic target classification with rejection. IEEE Trans. Aerosp. Electron. Syst. 2016, 52, 632–642. [Google Scholar] [CrossRef]
Figure 1.
SAR imaging model.

Figure 2.
Histogram of an SAR image: (a) Original image; (b) Histogram.

Figure 3.
Illustration of the shadow extraction: (a) original image; (b) after the threshold segmentation; (c) after the counter filter; (d) after the morphological closing operation; and (e) after the morphological opening operation.
Figure 3.
Illustration of the shadow extraction: (a) original image; (b) after the threshold segmentation; (c) after the counter filter; (d) after the morphological closing operation; and (e) after the morphological opening operation.

Figure 4.
The histogram of the generated target image: (a) target image; and (b) histogram.

Figure 5.
Illustration of the proposed target recognition method.

Figure 6.
Types of military targets: (top) optical images; and (bottom) SAR images.

Figure 7.
Confusion matrices of the reference methods: (a) SVM; (b) CNN; (c) Segment–SRC; (d) Original–SRC; and (e) Target–SRC.
Figure 7.
Confusion matrices of the reference methods: (a) SVM; (b) CNN; (c) Segment–SRC; (d) Original–SRC; and (e) Target–SRC.


Figure 8.
SAR images of 2S1 at different depression angles: (a) 15°; (b) 17°; (c) 30°; and (d) 45°.

Figure 9.
Distorted shadow under different structuring elements: (a) original shadow; (b) S1; (c) S2; (d) S3; (e) S4; and (f) S5.
Figure 9.
Distorted shadow under different structuring elements: (a) original shadow; (b) S1; (c) S2; (d) S3; (e) S4; and (f) S5.

Figure 10.
Segmented shadow regions at different thresholds: (a) 50%; (b) 70%; (c) 90%; (d) 110%; (e) 130%; and (f) 150% (of the original threshold).
Figure 10.
Segmented shadow regions at different thresholds: (a) 50%; (b) 70%; (c) 90%; (d) 110%; (e) 130%; and (f) 150% (of the original threshold).

Figure 11.
The average PCCs of the proposed method at different thresholds for shadow segmentation.

Figure 12.
The ROC curves of different methods. (ROC: receiver-operating characteristics)


Table 1.
Information in the target region, shadow and background of the SAR image.
| Source | Main Constituent | Amount |
|---|---|---|
| Target region | Discriminability and confusion | High |
| Shadow | Discriminability and confusion | Relative high |
| Background | Redundancy | Low |
Table 2.
Training and test sets in the experiments.
| Class | BMP2 | BTR70 | T72 | T62 | BDRM2 | BTR60 | ZSU23/4 | D7 | ZIL131 | 2S1 |
|---|---|---|---|---|---|---|---|---|---|---|
| Training Set (17°) | 233(Sn_9563) | 233 | 232(Sn_132) | 299 | 298 | 256 | 299 | 299 | 299 | 299 |
| 232(Sn_9566) | 231(Sn_812) | |||||||||
| 233(Sn_c21) | 228(Sn_s7) | |||||||||
| Test Set (15°) | 195(Sn_9563) | 196 | 196(Sn_132) | 273 | 274 | 195 | 274 | 274 | 274 | 274 |
| 196(Sn_9566) | 195(Sn_812) | |||||||||
| 196(Sn_c21) | 191(Sn_s7) |
Table 3.
Recognition results of the proposed method under SOC. (PCC: probability of correct classification).
Table 3.
Recognition results of the proposed method under SOC. (PCC: probability of correct classification).
| Class | BMP2 | BTR70 | T72 | T62 | BDRM2 | BTR60 | ZSU23/4 | D7 | ZIL131 | 2S1 | PCC (%) |
|---|---|---|---|---|---|---|---|---|---|---|---|
| BMP2 | 487 | 38 | 46 | 0 | 0 | 0 | 11 | 0 | 5 | 0 | 82.96 |
| BTR70 | 0 | 196 | 0 | 0 | 0 | 0 | 0 | 0 | 0 | 0 | 100 |
| T72 | 24 | 22 | 508 | 12 | 0 | 1 | 12 | 0 | 3 | 0 | 87.29 |
| T62 | 0 | 0 | 0 | 274 | 0 | 0 | 0 | 0 | 0 | 0 | 100 |
| BDRM2 | 0 | 0 | 0 | 0 | 274 | 0 | 0 | 0 | 0 | 0 | 100 |
| BTR60 | 0 | 0 | 0 | 1 | 10 | 260 | 0 | 1 | 0 | 1 | 95.24 |
| ZSU23/4 | 2 | 0 | 0 | 3 | 0 | 0 | 190 | 0 | 0 | 0 | 95.44 |
| D7 | 0 | 0 | 1 | 0 | 1 | 0 | 0 | 272 | 0 | 0 | 99.27 |
| ZIL131 | 1 | 0 | 0 | 0 | 2 | 0 | 3 | 0 | 268 | 0 | 97.81 |
| 2S1 | 1 | 0 | 0 | 0 | 5 | 2 | 0 | 0 | 0 | 266 | 97.08 |
| Average | 94.88% |
Table 4.
Recognition performance of the proposed method under SOC.
| Method | Proposed | SVM [28] | CNN [33] | Segment-SRC | Original–SRC | Target–SRC |
|---|---|---|---|---|---|---|
| PCC (%) | 94.88 | 93.85 | 94.82 | 92.85 | 93.66 | 93.16 |
| Time Consumption (ms) | 78.25 | 76.56 | 79.12 | 77.56 | 77.24 | 77.33 |
Table 5.
Dataset with configuration variance.
| BMP2 | T72 | BTR60 | T62 | |
|---|---|---|---|---|
| Training set (17°) | 233(Sn_9563) | 232(Sn_132) | 256 | 299 |
| Test set (15°) | 196(Sn_9566) 196(Sn_c21) | 195(Sn_812) 191(Sn_s7) | 195 | 273 |
Table 6.
Performances of different methods in terms of configuration variance.
| Method | Proposed | SVM [28] | CNN [33] | Segment-SRC | Original–SRC | Target–SRC |
|---|---|---|---|---|---|---|
| PCC (%) | 93.15 | 91.01 | 91.54 | 90.61 | 91.17 | 90.69 |
Table 7.
Dataset with depression angle variance.
| Depression Angle | 2S1 | BDRM2 | ZSU23/4 | |
|---|---|---|---|---|
| Training set | 17° | 299 | 298 | 299 |
| Test set | 15° | 274 | 274 | 274 |
| 30° | 288 | 287 | 288 | |
| 45° | 303 | 303 | 303 |
Table 8.
Recognition results of the proposed method under depression variance.
| Depression Angle | Class | Results | PCC (%) | Average (%) | ||
|---|---|---|---|---|---|---|
| 2S1 | BDRM2 | ZSU23/4 | ||||
| 15° | 2S1 | 272 | 1 | 1 | 99.27 | 99.39 |
| BDRM2 | 0 | 272 | 2 | 99.27 | ||
| ZSU23/4 | 1 | 0 | 273 | 99.64 | ||
| 30° | 2S1 | 285 | 1 | 2 | 98.96 | 99.07 |
| BDRM2 | 1 | 284 | 2 | 98.95 | ||
| ZSU23/4 | 1 | 1 | 286 | 99.31 | ||
| 45° | 2S1 | 199 | 73 | 31 | 65.68 | 75.03 |
| BDRM2 | 18 | 227 | 58 | 74.92 | ||
| ZSU23/4 | 12 | 35 | 256 | 84.49 | ||
Table 9.
Comparison with reference methods for different depression angles.
| Method | PCC (%) | ||
|---|---|---|---|
| 15° | 30° | 45° | |
| Proposed | 99.39 | 99.07 | 75.03 |
| SVM [28] | 99.01 | 98.42 | 66.01 |
| CNN [33] | 98.88 | 97.42 | 64.17 |
| Segment–SRC | 99.01 | 98.58 | 70.24 |
| Original–SRC | 98.97 | 98.01 | 64.74 |
| Target–SRC | 99.25 | 98.96 | 74.14 |
Table 10.
The PCCs under segmentation errors (%).
| Structuring Element | S1 | S2 | S3 | S4 | S5 |
|---|---|---|---|---|---|
| Proposed method | 94.66 | 94.63 | 94.54 | 94.51 | 94.50 |
| Segment–SRC | 91.41 | 90.85 | 89.01 | 89.14 | 87.57 |
© 2018 by the authors. Licensee MDPI, Basel, Switzerland. This article is an open access article distributed under the terms and conditions of the Creative Commons Attribution (CC BY) license (http://creativecommons.org/licenses/by/4.0/).
Share and Cite
MDPI and ACS Style
Chang, M.; You, X. Target Recognition in SAR Images Based on Information-Decoupled Representation. Remote Sens. 2018, 10, 138. https://0-doi-org.brum.beds.ac.uk/10.3390/rs10010138
AMA Style
Chang M, You X. Target Recognition in SAR Images Based on Information-Decoupled Representation. Remote Sensing. 2018; 10(1):138. https://0-doi-org.brum.beds.ac.uk/10.3390/rs10010138
Chicago/Turabian StyleChang, Ming, and Xuqun You. 2018. "Target Recognition in SAR Images Based on Information-Decoupled Representation" Remote Sensing 10, no. 1: 138. https://0-doi-org.brum.beds.ac.uk/10.3390/rs10010138
Note that from the first issue of 2016, this journal uses article numbers instead of page numbers. See further details here.