Portraying Urban Functional Zones by Coupling Remote Sensing Imagery and Human Sensing Data
by
 , , ,
, , ,
Wei Tu
1,2,3 ,
,
Zhongwen Hu
2,4,*,
Lefei Li
5,
Jinzhou Cao
5,
Jincheng Jiang
1,2,
Qiuping Li
6 and
Qingquan Li
2,5 1
Shenzhen Key Laboratory of Spatial Information Smart Sensing and Services & Research Institute for Smart Cities, School of Architecture and Urban Planning, Shenzhen University, Shenzhen 518060, China
2
Key Laboratory for Geo-Environmental Monitoring of Coastal Zone of the National Administration of Surveying, Mapping and Geoinformation, Shenzhen University, Shenzhen 518060, China
3
Key Laboratory of Urban Land Resources Monitoring and Simulation, Ministry of Land and Resources, Shenzhen 518034, China
4
College of Life Science and Oceanography, Shenzhen University, Shenzhen 518060, China
5
State Key Laboratory of Information Engineering in Surveying, Mapping, and Remote Sensing, Wuhan University, Wuhan 430079, China
6
Center of Integrated Geographic Information Analysis, School of Geography and Planning, Sun Yat-sen University, Guangzhou 510275, China
*
Author to whom correspondence should be addressed.
Remote Sens. 2018, 10(1), 141; https://0-doi-org.brum.beds.ac.uk/10.3390/rs10010141
Submission received: 15 December 2017
/
Revised: 10 January 2018
/
Accepted: 16 January 2018
/
Published: 18 January 2018
Abstract
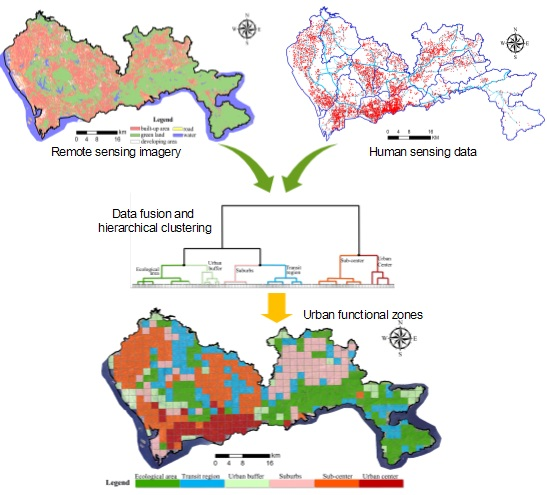
:Portraying urban functional zones provides useful insights into understanding complex urban systems and establishing rational urban planning. Although several studies have confirmed the efficacy of remote sensing imagery in urban studies, coupling remote sensing and new human sensing data like mobile phone positioning data to identify urban functional zones has still not been investigated. In this study, a new framework integrating remote sensing imagery and mobile phone positioning data was developed to analyze urban functional zones with landscape and human activity metrics. Landscapes metrics were calculated based on land cover from remote sensing images. Human activities were extracted from massive mobile phone positioning data. By integrating them, urban functional zones (urban center, sub-center, suburbs, urban buffer, transit region and ecological area) were identified by a hierarchical clustering. Finally, gradient analysis in three typical transects was conducted to investigate the pattern of landscapes and human activities. Taking Shenzhen, China, as an example, the conducted experiment shows that the pattern of landscapes and human activities in the urban functional zones in Shenzhen does not totally conform to the classical urban theories. It demonstrates that the fusion of remote sensing imagery and human sensing data can characterize the complex urban spatial structure in Shenzhen well. Urban functional zones have the potential to act as bridges between the urban structure, human activity and urban planning policy, providing scientific support for rational urban planning and sustainable urban development policymaking.

1. Introduction
Cities are human settlements where people engage in different activities and interact with the man-made space and natural environment. Global urban area occupies less than 2% of the Earth’s land surface, but consists of more than 50 percent of the world’s population [1]. In China, the urbanization rate has increased from 26.4 percent in the year 1992 to 57.4 percent in 2016 as 400 million people have mitigated to cities [2]. From a global view, it is estimated that total urban population will rise to five billion in the year 2030. This transition has enormous economic, social and environmental consequences [3,4]. Targeting the aim of sustainable cities, remote sensing has been widely used to monitor the spatial structure, economy and environment of cities [5,6,7,8,9,10].
Many studies have been conducted on urban morphology to portray urban spatial structure [11,12,13,14,15]. Several significant theories have been developed, such as the concentric zone theory, the sector theory, the multiple nuclei theory and the polycentric theory. These advanced theories capture the urbanization process and benefit associated land management and urban planning. One stand of urban morphology study is to investigate the function provided by urban space. Urban functional zone is a mixture of urban functions and characterized by the role of urban space in the whole city, like urban center, sub-center, suburbs, ecological area, etc. [16,17]. The identification of urban functional zones provides useful insights for urban planners to capture the urban growth and make sustainable development policy.
Urban functional zone analysis traditionally relies on land use and land cover (LULC), which can be acquired by labor- and cost-intensive land survey. Remote sensing is another fast and efficient approach to capture land cover and land use data to facilitate related studies. For example, Aubrecht and León Torres [15] classified mixed or residential areas from nighttime light (NTL) images. Yang and Lo [18] used time series Landsat TM images to extract land use/cover change data of the Atlanta, Georgia, metropolitan area in the United States. The landscape gradient from the urban center to the rural area has been observed to illustrate urban growth [19,20,21,22,23,24,25]. Using several landscape metrics, Lin et al. [17] extracted land use from Pleiades images to investigate the urban functional landscape pattern in Xiamen, China. Yu and Ng [24] classified land use from Landsat TM images and performed gradient analysis to analyze spatial and temporal urban sprawl dynamics in this city. These studies focus on the spatial features in the city, but ignore the effect of human activity. However, in the highly urbanized cities in Asia, such as Singapore, Hong Kong, Beijing and Shenzhen, most land parcels are covered by man-made infrastructures that are a mix between residential, businesses and work function. Such complex urban environments raise a great challenge in understanding urban structure using only remote sensing imagery.
A city is a complex system that includes human beings and the natural environment. Human activity has a significant impact on urban morphology because of the interaction of urban space and human beings. Human beings are un-ignorable components of the city. So are the humanistic aspects involved [4,26,27,28,29]. However, human activities have not been well integrated with remote sensing, due to the lack of massive human activities data. Ubiquitous location awareness technologies such as the Global Navigation Satellite System (GNSS), mobile phone positioning and Wi-Fi positioning allow humans to act as sensors to perceive the surrounding environment [30,31]. Massive human sensing data are available, such as vehicle GPS data [32,33,34], mobile phone records [35,36,37,38,39,40] and social media data [41,42,43,44]. These large-volume human sensing data record the time and the position of people; therefore, they provide much useful information about human activities in the city [35,39].
Human sensing data provide us with unprecedented opportunities to reveal human activity distribution and the implied urban function. They enable us to image the city in alternative approaches. Ratti et al. [35] mapped the cell phone usage at different times of the day. Their results provided a graphic representation of city-wide human activities and the evolution through space and time. Considering the relationship between human activities and land use, Pei et al. [37] developed a clustering approach to classify land use with time series aggregated mobile phone data. Using NTL images as the proxy of human activity, Chen et al. [36] identified the urban center or sub-center and the surface slope to indicate the urban land use intensity gradient by considering human activities implicitly. Recently, Cai et al. [44] fused NTL images and social media check-in data to identify the polycentric structure in megacities, including Beijing, Chongqing and Shanghai, China. These pioneering studies support the potential of human sensing data in urban studies. However, human sensing data have still not been integrated with remote sensing imagery to portray urban functional zones [45].
In this study, we present a novel data fusion framework integrating remote sensing imagery and the highly penetrating mobile phone positioning data to analyze urban functional zones comprehensively. Landscape metrics were calculated based on land cover from SPOT 5 images. Human activities data were extracted from mobile phone positioning data. By coupling them with urban cells, urban functional zones were identified using hierarchical clustering. Gradient analysis [17,18,19,20,46] in three typical transects was applied to portray the landscape and human activity pattern from urban center to urban border. An experiment in Shenzhen, China, was conducted to validate the proposed framework. The results were explored to address the following questions: (1) What are the general patterns of landscapes in different urban function zones (taking Shenzhen as a case)? (2) What are the general patterns of human activity in different urban function zones (taking Shenzhen as a case)? (3) What is the composite effect of remote sensing imagery and human sensing data in portraying urban functional zones? The answers to these questions will demonstrate the spatial dynamics of both landscape and human activity in the city. They deepen the understanding of the city growth and help urban planners make sustainable development policies.
2. Study Area and Dataset
2.1. Study Area
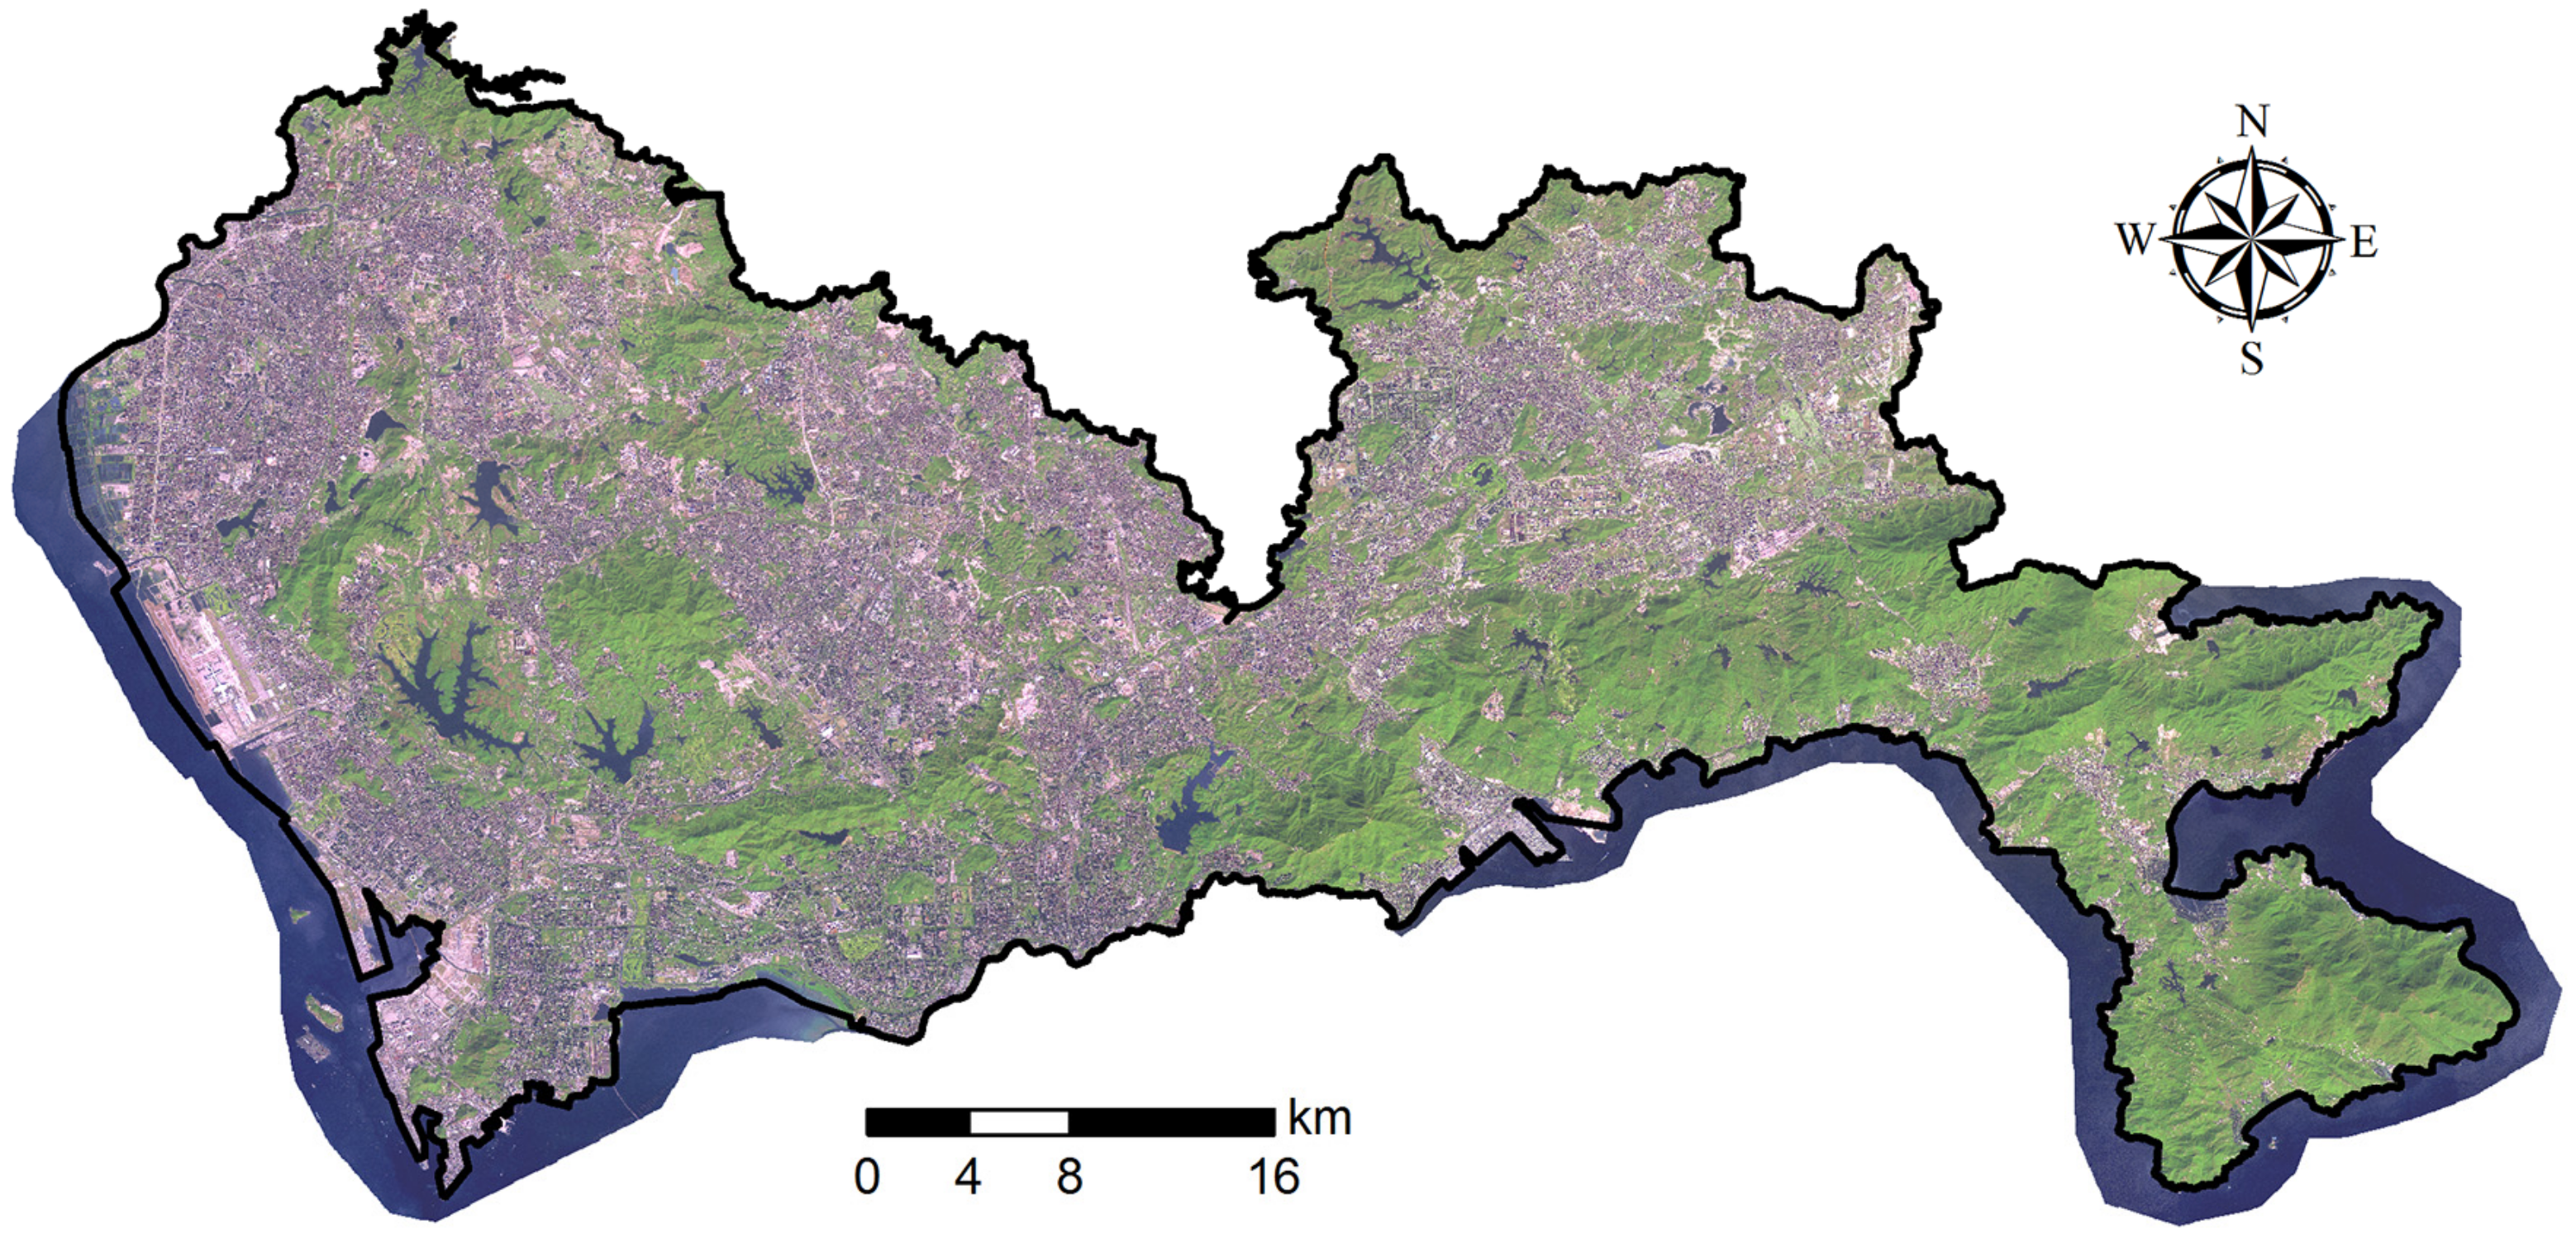
Shenzhen is a coastal city in the south of China, located at the east of the Pearl River Delta, with an area of 1996 km2 (Figure 1). As the first Special Economic Zone (SEC) of China, Shenzhen has experienced rapid urbanization since 1983 [47]. Shenzhen has expanded from a small village with 0.6 million people to a megacity with a population of 16 million in 2015 [48]. It consists of 10 administrative districts, with the urban center (including Futian and Luohu) in southern Shenzhen, where Shenzhen city began. In recent years, the urbanized area of Shenzhen gradually expanded from the urban center to the west (Nanshan and Baoan), the north (Longhua and Guangming) and the east (Yantian, Longgang, Pingshan and Dapeng).
2.2. Dataset
2.2.1. Remote Sensing Images
The multispectral and the panchromatic SPOT-5 images collected on 30 November 2013 were used to map the land covers of Shenzhen in this study. These multispectral images and the panchromatic images were fused using a pansharpening method embedded in PCI Geomatica and then mosaicked using the ENVI software. The obtained image has 37,368 × 19,440 pixels, 4 spectral channels and 2.5 m/pixel. The final images were obtained by cropping the mosaicked image using the vector covering Shenzhen city as shown in Figure 2. It implies that most of Shenzhen is covered by built-up areas and green land. Most of the built-up areas are aggregated at the south, west, north and in central Shenzhen. East Shenzhen, which is reserved as a natural park, has many forests, mountains and beaches. We used these remote sensing images to extract land cover in Shenzhen.
2.2.2. Mobile Phone Positioning Data
The mobile phone positioning data used were provided by a dominant mobile communication company in Shenzhen. They were recorded by the 5349 cell towers of this company, covering the whole city. This dataset contains time series positions of 9.2 million mobile phone users during one workday in March 2012. The positions of mobile phone users were recorded at a half-hour interval; thus, there are 48 records for each user if the user’s mobile phone does not turn off. For a user, each positioning record has four fields, including a user ID (i), a time stamp (t), longitude (xit) and latitude (yit). The spatial resolution of location is restricted at the cell tower level, which is approximately 100–500 m. In total, there are 245 million records in this dataset. Figure 3 displays the spatial distribution of cell towers and mobile phone positioning data. It demonstrates that many cell towers are distributed in the urbanized area. A few cell towers are located in the forest along roads in east Shenzhen. It also indicates that more mobile phone positioning data are aggregated at the urban center in the south, but less in the north, which implies the difference of human activity intensity. Using this useful data, daily human activities (in-home, working and social activity) of mobile phone users were extracted to portray urban function zones with land cover data from remote sensing imagery. It should be noted here that human activities are have regularity; therefore, it is reasonable to fuse these one-day mobile phone positioning data with remote sensing imagery.
3. Methodology
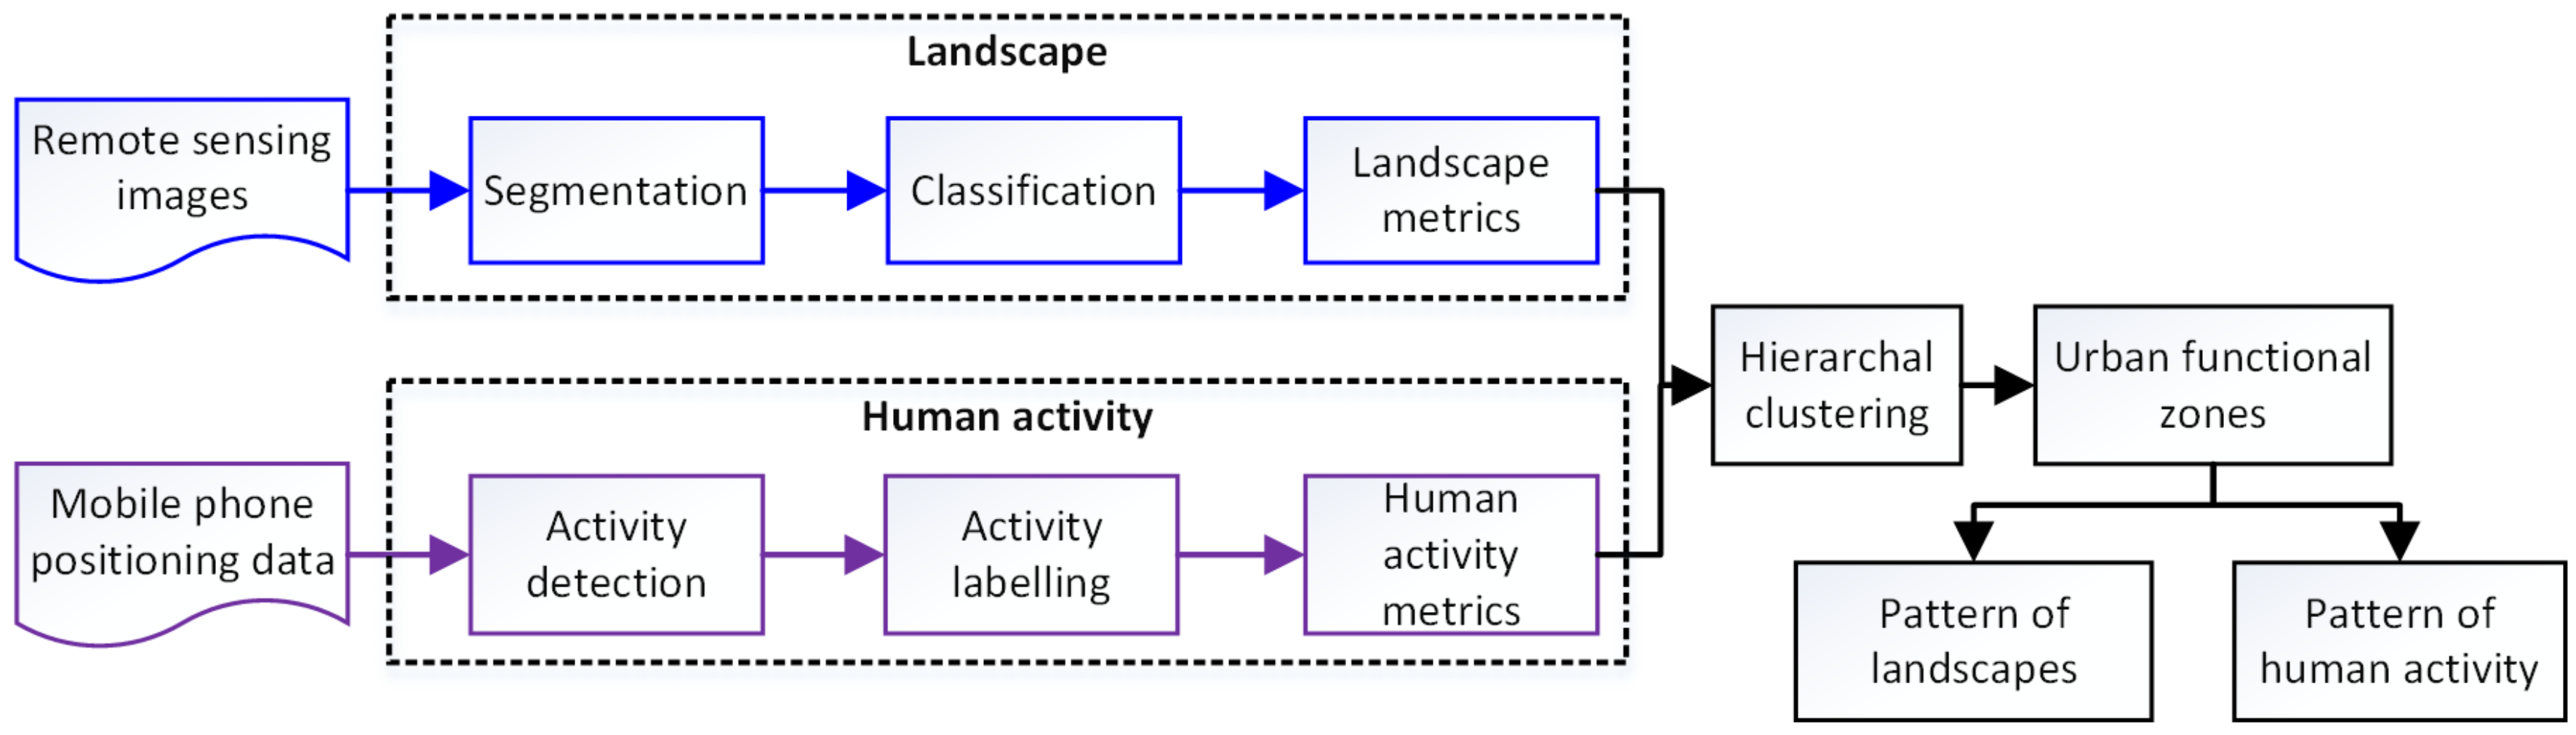
A data fusion framework coupling remote sensing imagery and human sensing data is presented to portray urban functional zones. The workflow is illustrated in Figure 4. Urban landscapes are extracted from remote sensing imagery; city-wide human activities are recognized from massive mobile phone positioning data. Coupling landscapes and human activity metrics in the urban cell, a hierarchal clustering method is used to identify urban functional zones. Finally, the pattern of landscapes and human activities in different urban functional zones and typical transects is analyzed.
3.1. Landscapes
3.1.1. Image Segmentation
An object-based image analysis (OBIA) approach was used to quantify the landscapes from SPOT 5 images. The OBIA approach is usually used for classifying high spatial resolution remote sensing images, because of the high accuracy by employing spectral, textural, spatial and contextual features.
In this approach, the SPOT-5 image was first partitioned into non-overlapping regions, which were used as basic units for classification, instead of individual pixels. Many image segmentation methods could be used for this task, such as watershed transformation [49] and the graph-based method [50]. However, the most popular method used in remote sensing applications is the multi-resolution/scale image segmentation method [51], because it can produce multi-resolution and high-quality results. In this study, the region merging-based multi-scale image segmentation method was used [52], and the multi-scale regions were recorded using the bi-level scale-sets model (BSM) [53]. The BSM records the hierarchical regions using a scale-indexed tree structure and is very efficient to retrieve the segmentation results of different scales and to estimate an optimal scale parameter.
In the implementation of the BSM, the criterion proposed by Baatz and Schäpe [54] was used, which was the most widely-used criterion in multi-resolution image segmentation. There are two key parameters that control the quality of the segmentation results: the weight of color features wcolor and the weight of compactness wcompt. A high wcolor will result in a segmentation result with high spectral homogeneity, however, with irregular shapes. A high wcompt will make the regions more compact. From a number of experiments, two empirical parameters wcolor = 0.3, wcompt = 0.5 were set.
Another key parameter for an OBIA approach is the scale parameter a for the multi-scale image segmentation. In the BSM work, segmentation results of different scales could be retrieved efficiently, and the optimal one could be chosen using some unsupervised methods, such as the estimation of scale parameter (ESP) method [55], the global score (GS) method [56] and the overall goodness F-measure (OGF) [57]. In this study, different segmentation results from the minimum scale to the maximum scale were retrieved, with an interval of 1. Then, the OGF method was used to estimate the optimal scale parameter, which was used to control the fineness of the final result. A larger a will result in a finer result. To avoid the irreparable negative impact of under-segmentation from a number of experiments, we used a large parameter a = 3, where the final result was slightly over-segmented. Then, this segmentation result was used for feature extraction and classification.
3.1.2. Object-Based Image Classification
The classification is used to enrich the land cover information for segmented objects. Land cover is recognized with a supervised classification method. For every segmented object, spectral, shape and textural features are extracted for the classification.
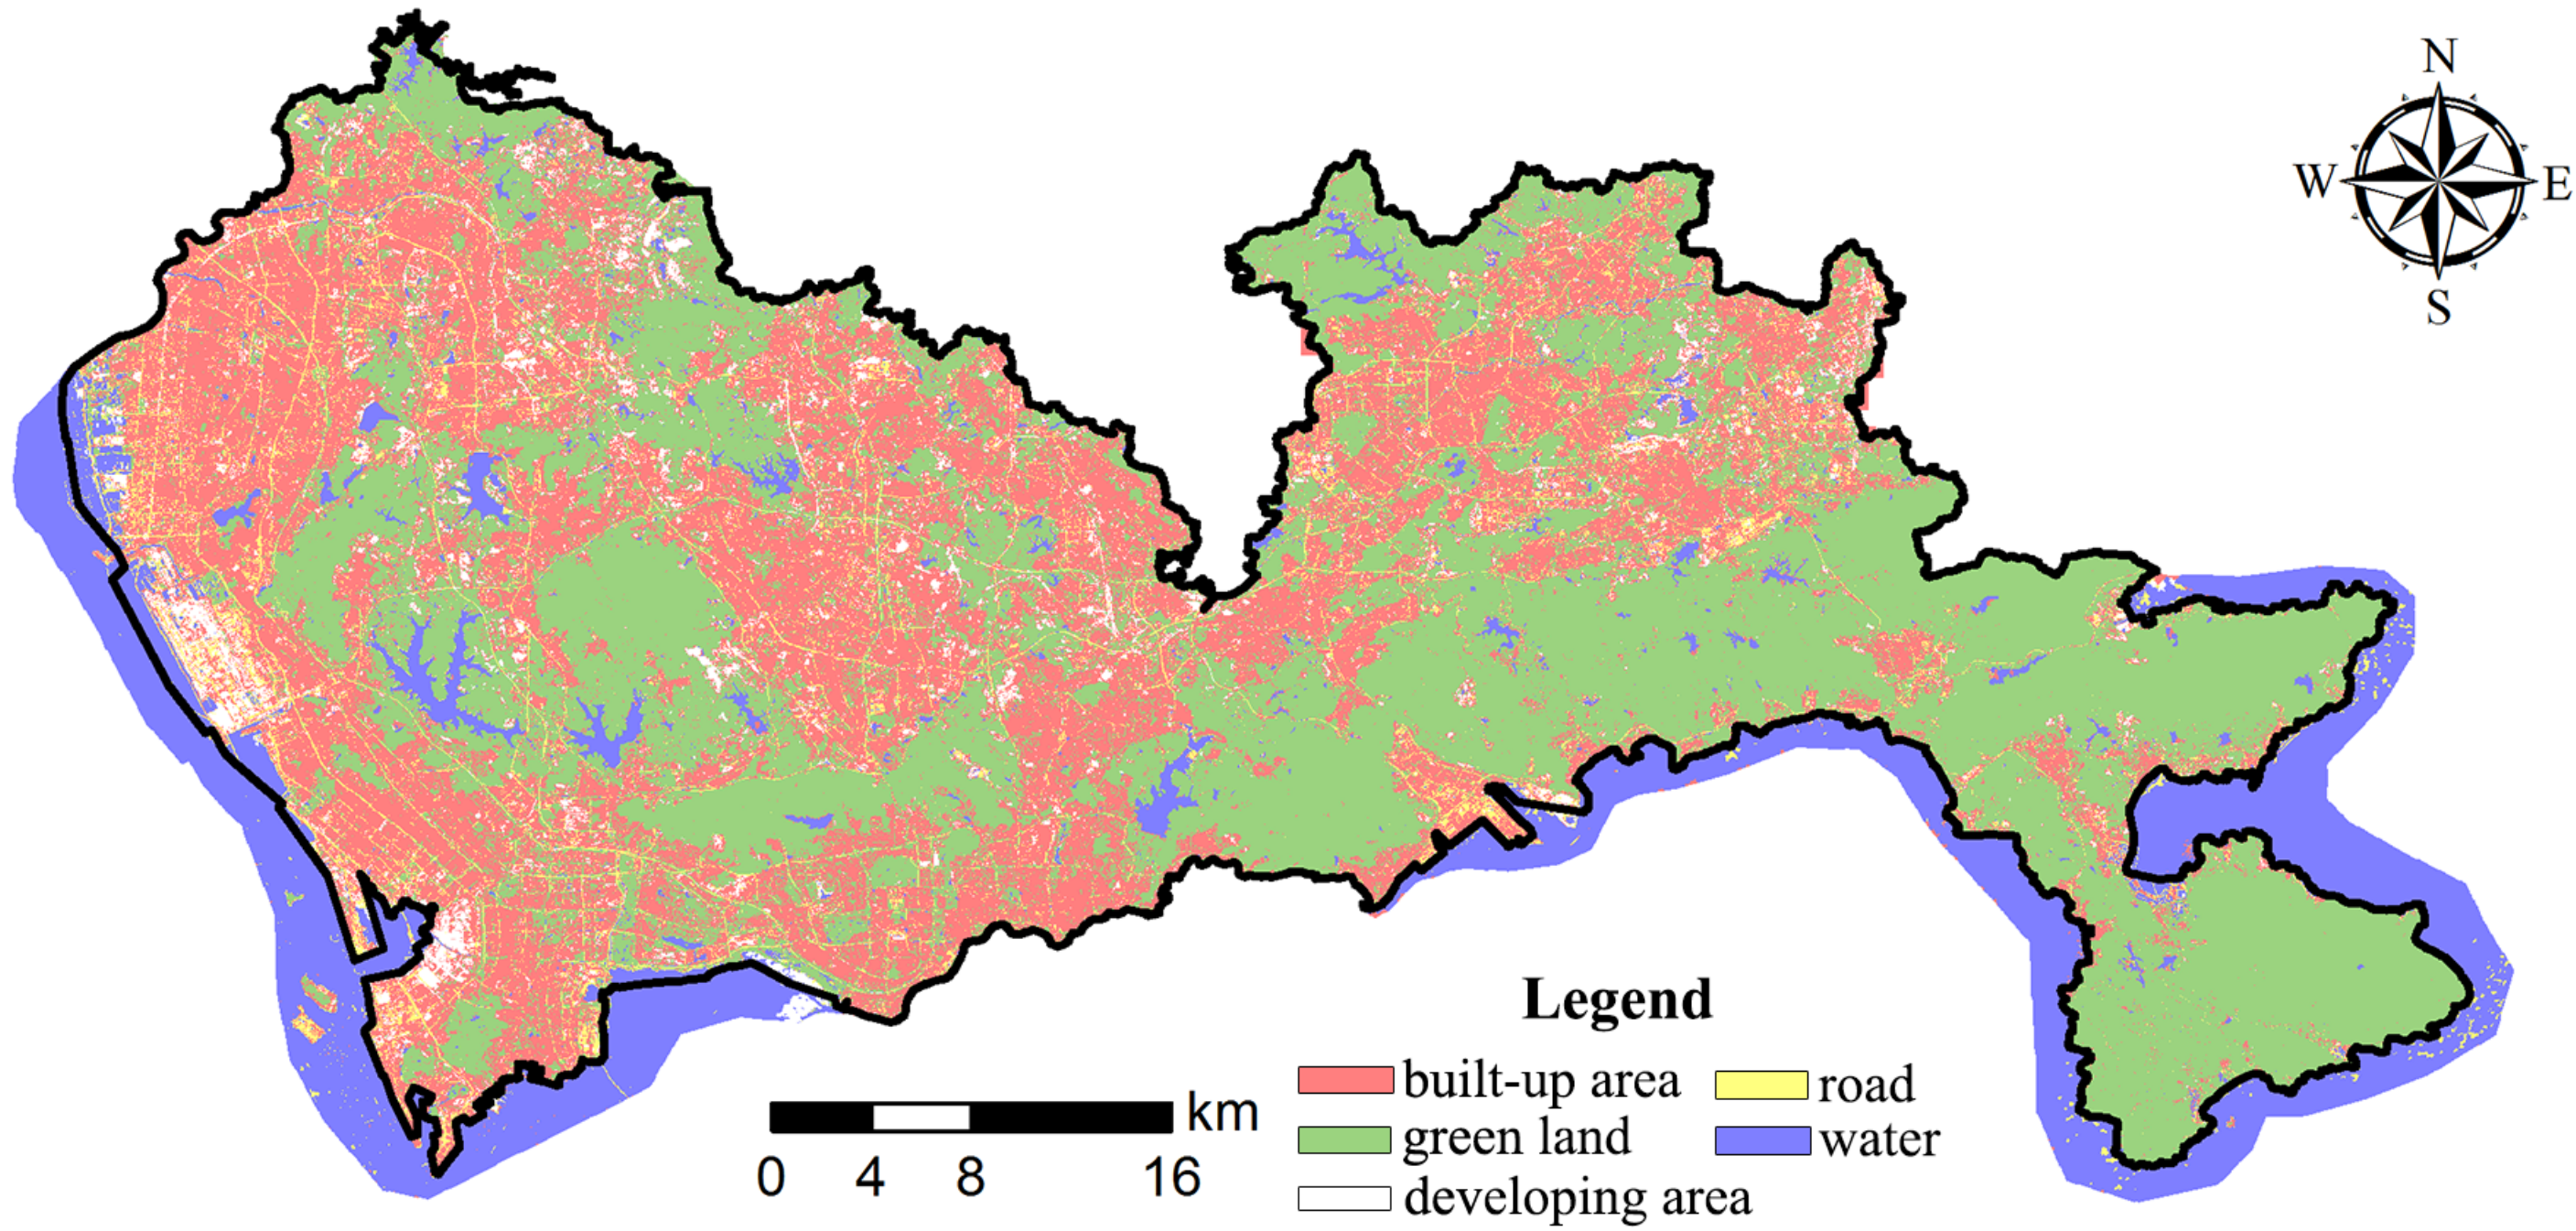
The minimum, maximum, mean value, the standard deviation of the original four spectral channels and the mean of normalized difference vegetation index (NDVI) were used as the spectral features. The area index and the perimeter shape index [58] were used as the shape feature. Since the focus of this study is to analyze the structure of the city, a specific texture index named PANTEX [59] was used. The PANTEX procedure employs grey-level co-occurrence matrix (GLCM) contrast measures to calculate a rotation-invariant isotropic texture index. It is sensitive to dense residential buildings [60]. Thus, it is usually used to extract built-up areas from high spatial resolution remote sensing images in a high-density city like Shenzhen. In this study, the maximum, minimum and mean value of the PANTEX index of each segment were used as the texture features. Based on these features, all the segmented objects were classified using the support-vector-machine (SVM) classifier [61]. Six hundred and twenty-nine objects distributed around the city were selected as the samples to train the SVM classifier, and then the classifier was applied to label the class for each segmented object. Finally, all segmented objects were classified into five type land covers, including built-up area, road, green land, water and developing areas. Taking 600 samples randomly distributed in the city, the accuracy of land cover was evaluated. Our results indicate that the land cover results achieved an overall accuracy 95.33% and a Kappa coefficient 0.9433. Figure 5 displays the obtained land cover map. It suggested that Shenzhen has been highly urbanized as many areas are covered by built-up area or green land.
3.1.3. Landscape Metrics
Landscape metrics quantify the specific spatial characteristics of LULC. A suite of landscape metrics has been developed for landscape analysis, such as class area (CA), patch density (PD), the number of patches (NP), patch shape index (PSI) and Shannon’s diversity index (SHDI) [61,62,63]. Table 1 lists the landscape metrics used in this study. The class-level metrics contain total class area (CA) and the patch density (PD). The landscape-level metrics include NP and SHDI. This is calculated by Equation (1):
where pi is the proportion of the landscape occupied by patch types i and m is the number of types.
The vector data of the landscapes were converted to a raster format at a pixel size using ArcGIS 10.2. Landscape metrics were then calculated at the class and landscape levels using the raster version of the FRAGSTATS program (Version 4.2) [64].
3.2. Human Activity
3.2.1. Activity Detection
The raw mobile phone positioning data lack activity semantic information such as “in-home”, “working” or “social activity”. Because of the natural rhythm of human beings, human activities display regularity in both space and time [65]. Therefore, it is reasonable to recognize human activities from sequential mobile phone positioning data. It should be noted here that daily human activities refer to in-home, working and social activity (i.e., shopping, education, sports, etc.) that take more than one hour.
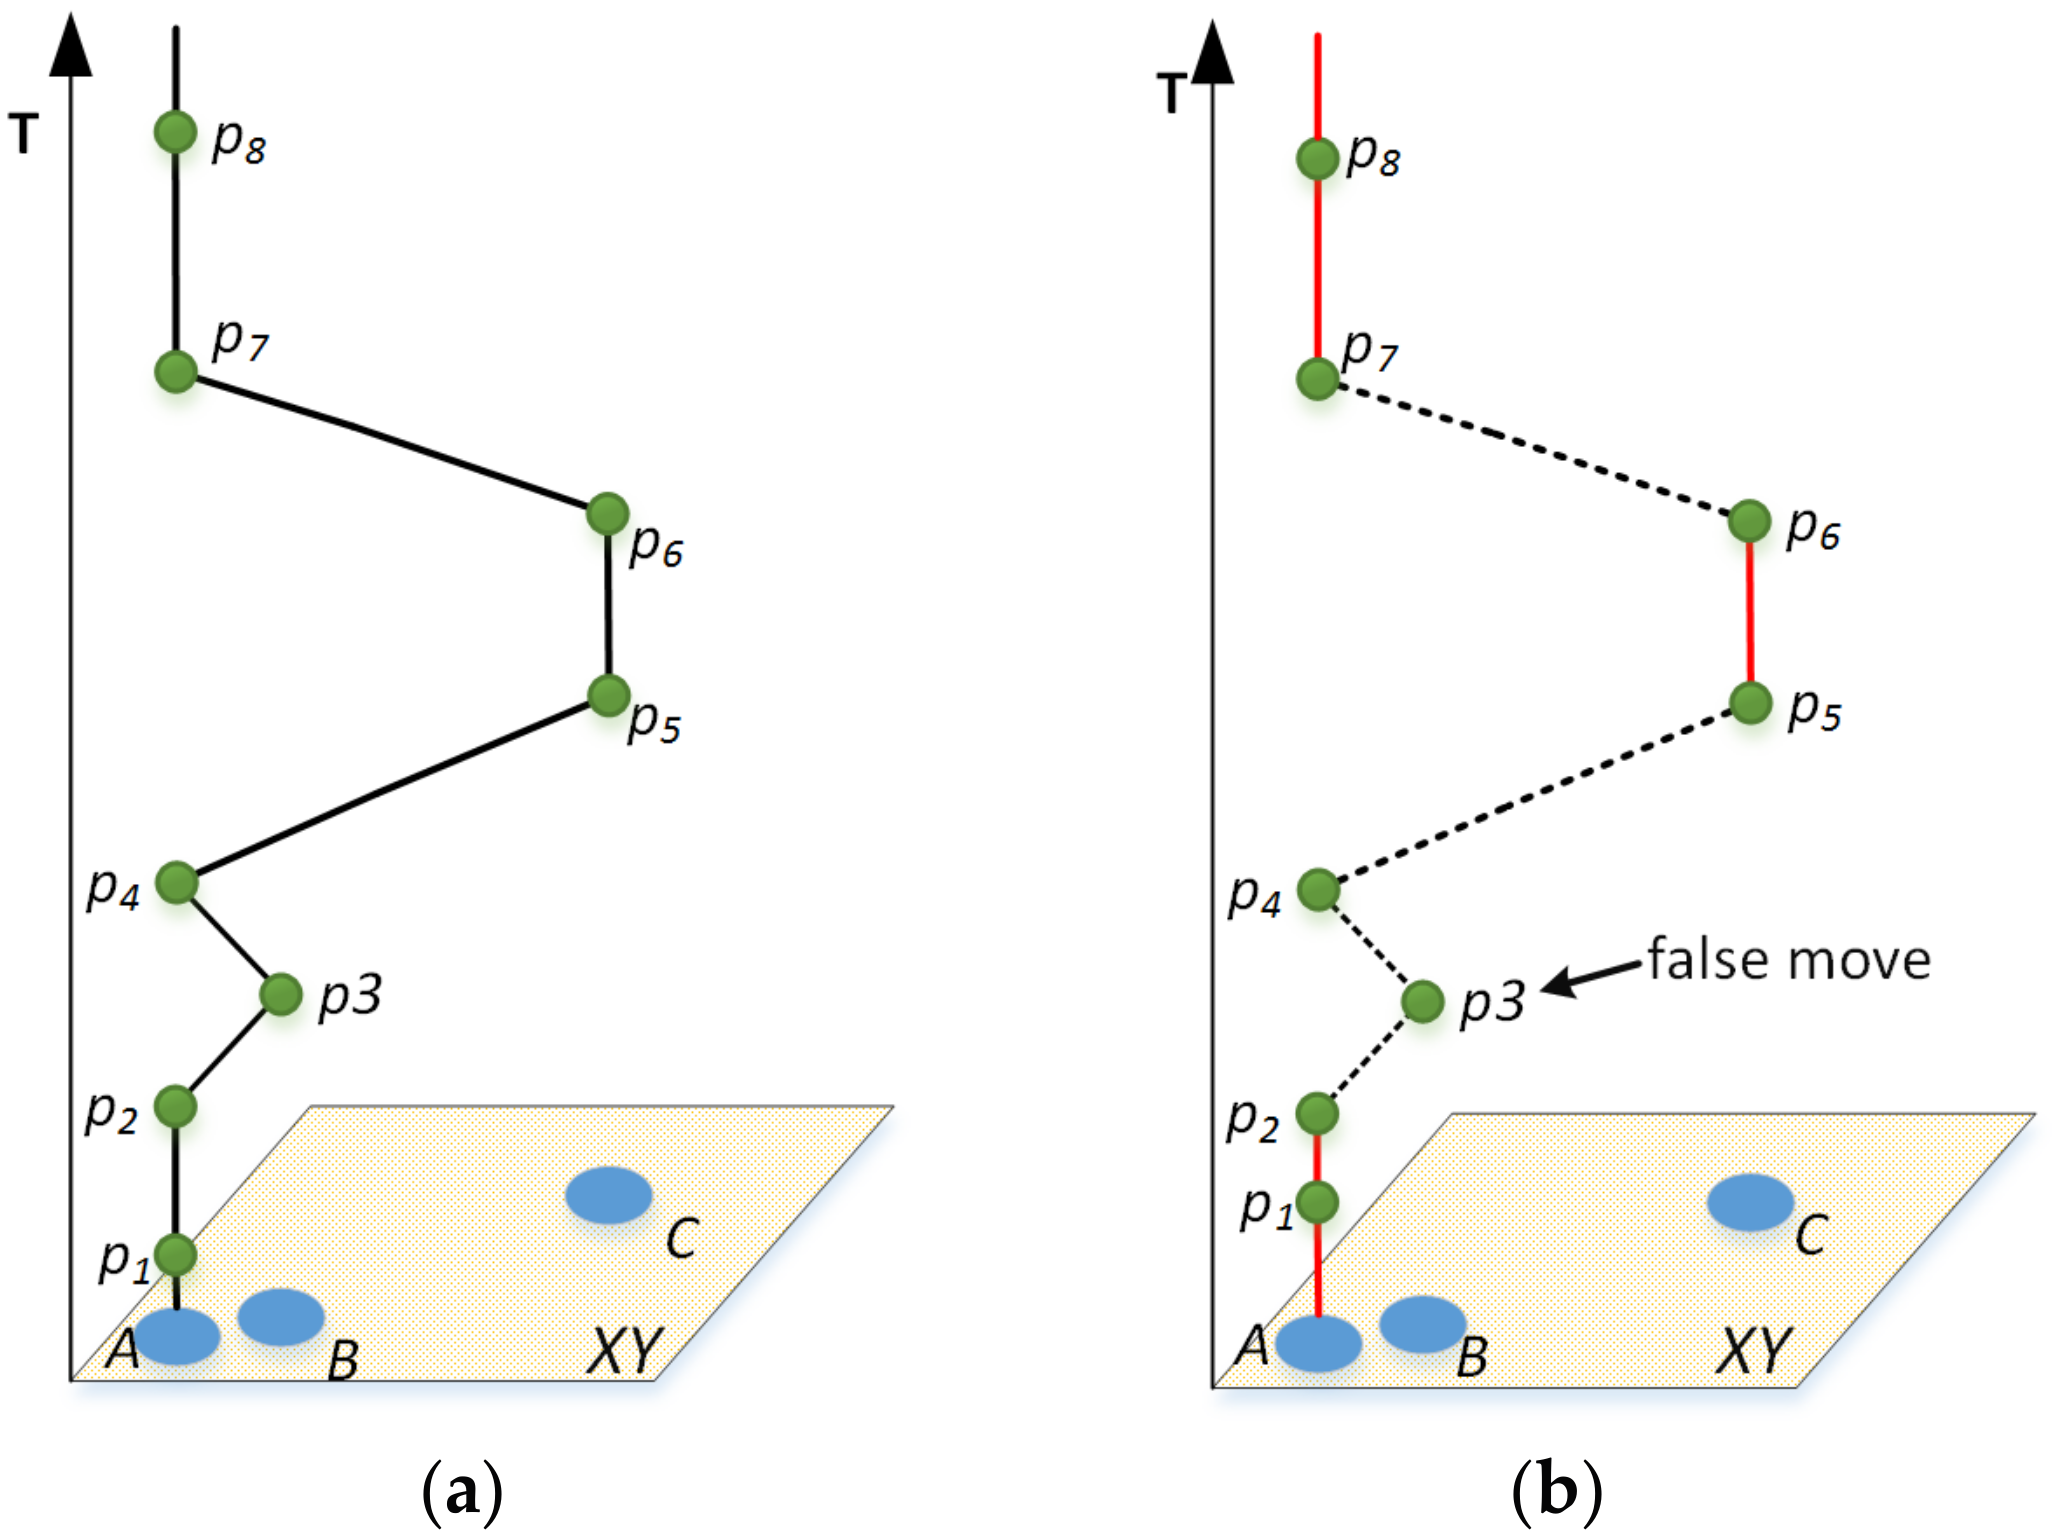
City-wide daily human activities were extracted from massive mobile phone positioning data. Potential human activities without type information were first detected. A user’s mobile phone records were sorted by time and connected as a spatial-temporal trajectory (Figure 6a). Then, if two consecutive records are at the same location, in other words, the user does not move, a potential activity is identified, such as p1–p2, p5–p6, p7–p8 in Figure 6b; such that, the trajectory was split into two types of segments: the vertical segments representing human activities at fixed places and the slope segments indicating a move between places.
It should be noted that the positioning jump between neighbor towers exists because of signal noises, i.e., the point p3. To overcome this issue, following Tu et al. [39], a distance threshold d was used to filter false moves: if the distance from a point to the next point is less than d, the move can be omitted, and this point can be merged into current points of a potential activity. Considering the positioning error of mobile phone sensing data, we set d to 500 m. After processing all mobile phone positioning data person by person, city-wide human activities without type information were obtained.
3.2.2. Rule-Based Activity Labeling
Daily human activities have a natural regularity because of the rhythm of human beings [60]. Regarding mobile phone positioning data, the spatial-temporal characteristics of trajectory indicate the information about the home and workplace of a user [38]. Considering the diurnal rhythm of human beings [33], the potential human activities were labeled with “in-home”, “working” and “social activity” according to time windows. The time window for in-home activity was set as [0:00, 6:00], while the time window for working activity was set as [9:00, 17:00]. The semantic information of potential human activities was enriched as follows:
- In-home activity labeling: For a user, if the total duration in a fixed place is more than half of the early morning period [0:00–6:00], this place will be defined as home. All potential activities located at the home of this person are recognized as in-home activities.
- Working activity labeling: If the total duration in a place is more than half of the daily working period [9:00–12:00] and [14:00–17:00], this place will be defined as the workplace. Considering the living style, the time [12:00, 14:00] for lunch is eliminated from working time to avoid biases. Finally, all potential activities located in the workplace of this user are defined as the working activities.
- Social activity labeling: The remaining non-in-home or non-working activities are labeled as social activities.
Finally, 31,669,042 activities were obtained for the 9.2 million users. Table 2 reports the summary of human activities. Among these, 14,470,460 potential human activities were labeled as in-home, 10,459,657 as working and 6,738,925 as social activities. Figure 7 displays the distribution of human activities. It indicates that three types of human activities cover most of the area of Shenzhen, in line with the built-up area in Figure 5 generally. However, very few human activities are found in the lakes, mountains and forests. To verify the accuracy of the results, they were compared with the household travel investigation of 2010 in Table 2. This suggests that they are matched well as the biggest gap is 2.9%, appearing for in-home activities. Therefore, they are acceptable for the integration with landscapes from remote sensing imagery.
3.2.3. Human Activity Metrics
A set of metrics summarizing in-home, working and social activities is used to quantify human activities, including the mean , the standard variation and the ratio of each type of activity (j = in-home, working and social activity), the number of cell towers, the average area of cell tower area and the density of human activity.
3.3. Hierarchical Cluster Analysis
The whole city was split into a grid with a resolution of 2000 m, following the approach of Lin et al. [17]. Landscape metrics and human activity metrics were integrated in spatial cells. Therefore, each grid cell was described by a vector combining both landscape metrics and human activity metrics . The landscape metrics contains CAi and PDi (i = built-up area, road, green land, water and developing area) at the class level and NP and SHDI at the landscape level. The human activity metrics includes the mean , the standard variation and the ratio of each type activity (j = in-home, working and social activity), the number of cell towers (NCT), the average area of the cell tower service area (ACTSA) and the density of human activities, d.
The hierarchical cluster analysis [66] was used to group grid cells from the bottom to the top. Before the clustering, both landscape and human activity metrics were normalized. Ward clustering [67,68] for minimizing the increased distance of within-cluster distance was used. The within-cluster distance is defined as Equation (2).
The increased distance merging two clusters is defined as Equation (3):
where i is an element in Cluster A or Cluster B, and are the centers of cluster s and m and n are the number of elements in Cluster A and B.
Finally, grid cells in the different clusters were identified as the proper urban functional zones with expert knowledge. Gradient analysis in three typical transects was conducted to investigate the pattern of landscapes and human activities.
4. Results
4.1. Urban Functional Zones
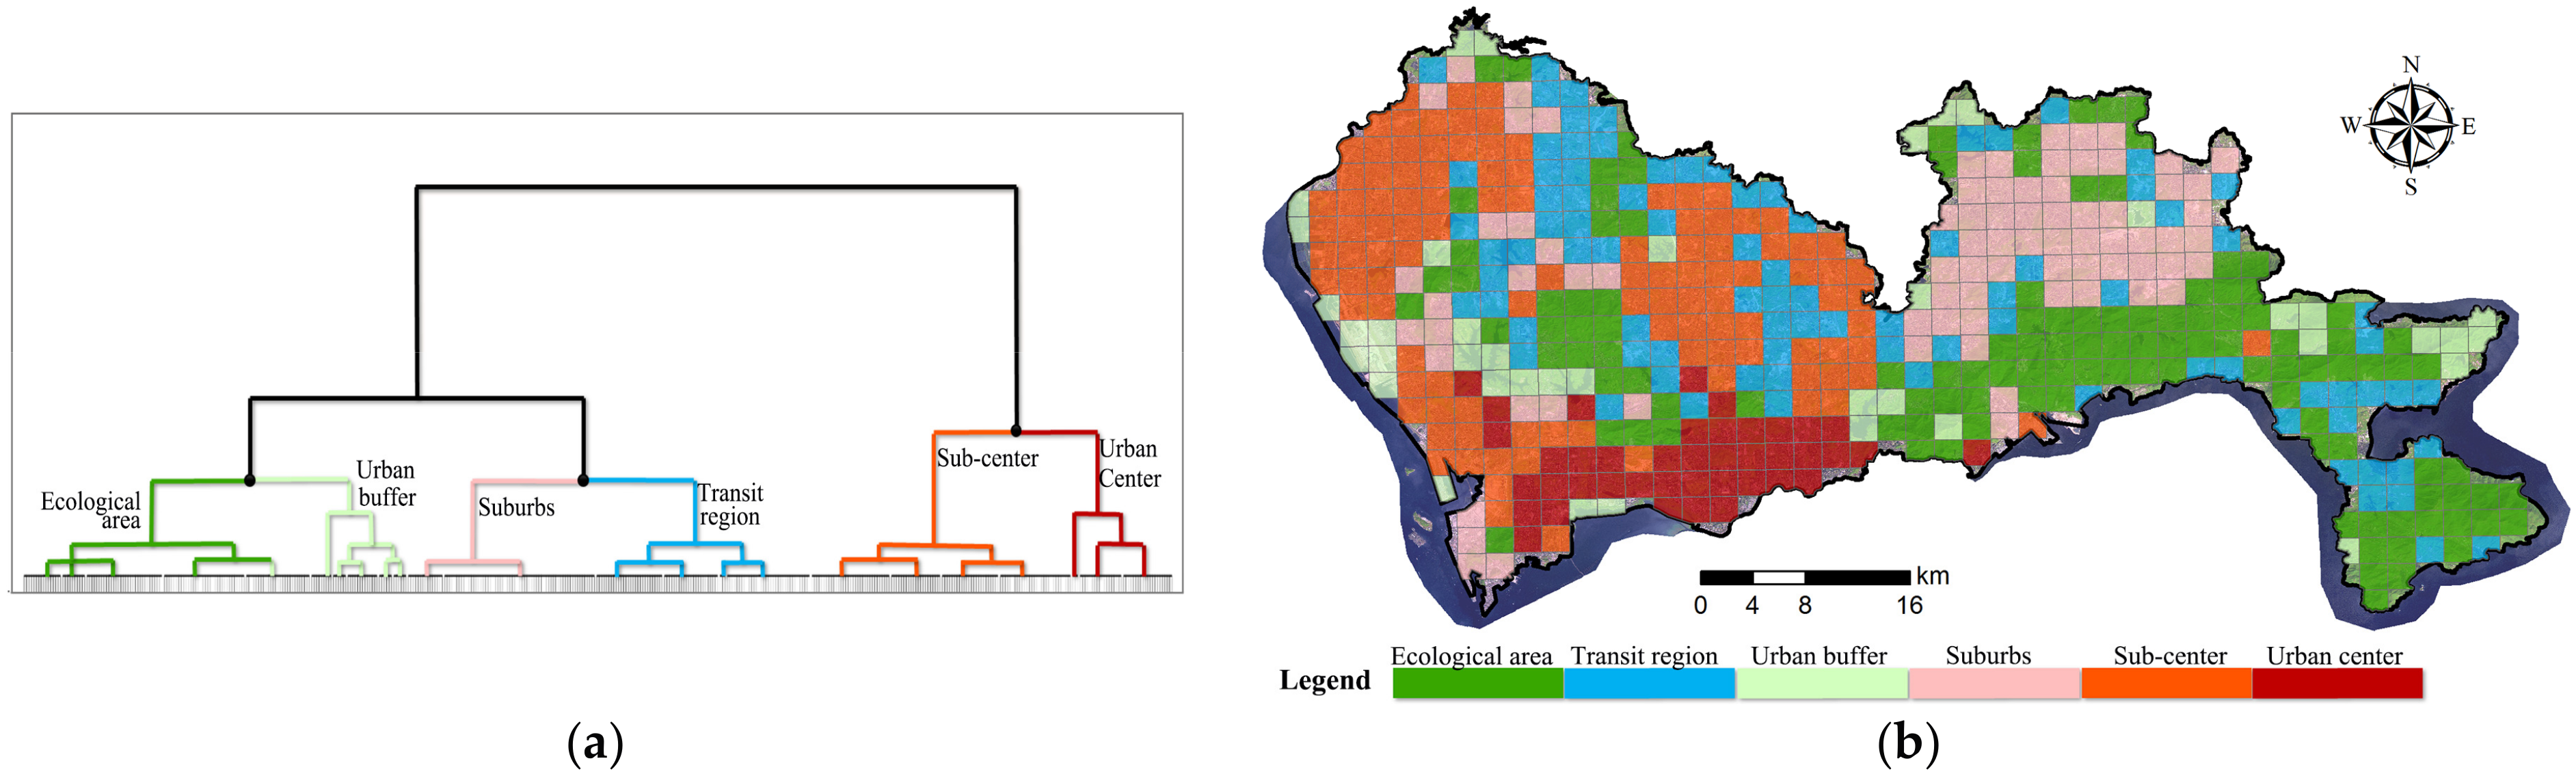
All urban cells are divided into six categories that represent typical urban function zones: urban center, sub-center, suburbs, transit region, urban buffer and the ecological area. The dendrogram generated by the hierarchal cluster analysis (Figure 8a) suggests the similarity of grid cells with the same urban functions. The spatial distribution of urban cells with different functions is displayed in Figure 8b. The urban center contains 42 cells, most of which are in Nanshan, Futian and Luohu district. The sub-center has 108 cells, appearing at the west and the north of Shenzhen, and only two appear in east Shenzhen. The suburb has 78 grid cells, most gathering at northeast Shenzhen. The urban buffer contains 40 cells, at the boundary of the urbanized area or the ecological area. The ecological area has 119 cells to provide ecological service for the public. The transit region has 89 cells, connecting different functional areas.
Table 3 reports the composition of landscapes and human activities in urban functional zones. It indicates that built-up area and green land are two main landscapes in Shenzhen city. From a city-wide view, the ranking of landscapes is: green land > built-up area > developing area > water > road. Regarding urban functional zones, the compositions of landscapes are different. Urban center, sub-center and suburbs have a similar ranking: built-up area > green land > road, developing area or water. However, sub-center rather than urban center has the most built-up area, which defies common sense. This implies that the land cover is not sufficient to identify urban center and sub-center in Shenzhen. Transit regions have the most developing area at 57.3 ha per urban cell. Urban buffer near lakes has less built-up area (46.2 per cell), but more water (77.6 per cell). The remaining ecological area is dominated by green land, about 330.9 ha per cell. These results characterized the status of the landscape in different urban functional zones.
These results also suggest that human activities are differentiated in the six urban functional zones. The ranking of three kinds of human activities in all functional zones is: in-home > working > social activity. Although urban center and suburbs share similar landscapes, urban center has the most in-home (332 per ha), working (260.7 per ha) and social activity (195.2 per ha). Sub-center has the second most in-home (128.4 per ha), working (82 per ha) and social activity (51.5 per ha), which are less than that in urban center. The suburbs have median in-home (60 per ha), working (45.4 per ha) and social activity (24.1 per ha). The ecological area has the least in-home (13.5 per ha), working (8.3 per ha) and social activity (3.8 per ha). Considering the intensity of human activities, the ranking is: urban center > sub-center > suburbs > transit region > urban buffer > ecological area. These variations of human activities suggest the differentiation of functions.
The dendrogram in Figure 8a further demonstrates the clustering hierarchy, which suggests the composite effect of both landscape and human activity. It can be seen that, if the cluster number is reduced, the group of ecological area and urban buffer will be firstly merged because of the similar landscape and human activity. The spatial distribution of the corresponding cells also suggests that they share spatial boundaries. If the cluster number further reduces, suburbs and transit regions will be merged. After that, the third merging will appear at the sub-center and urban center. Such a hierarchy validates the composite effect of landscape and human activity on revealing the urban functional zones.
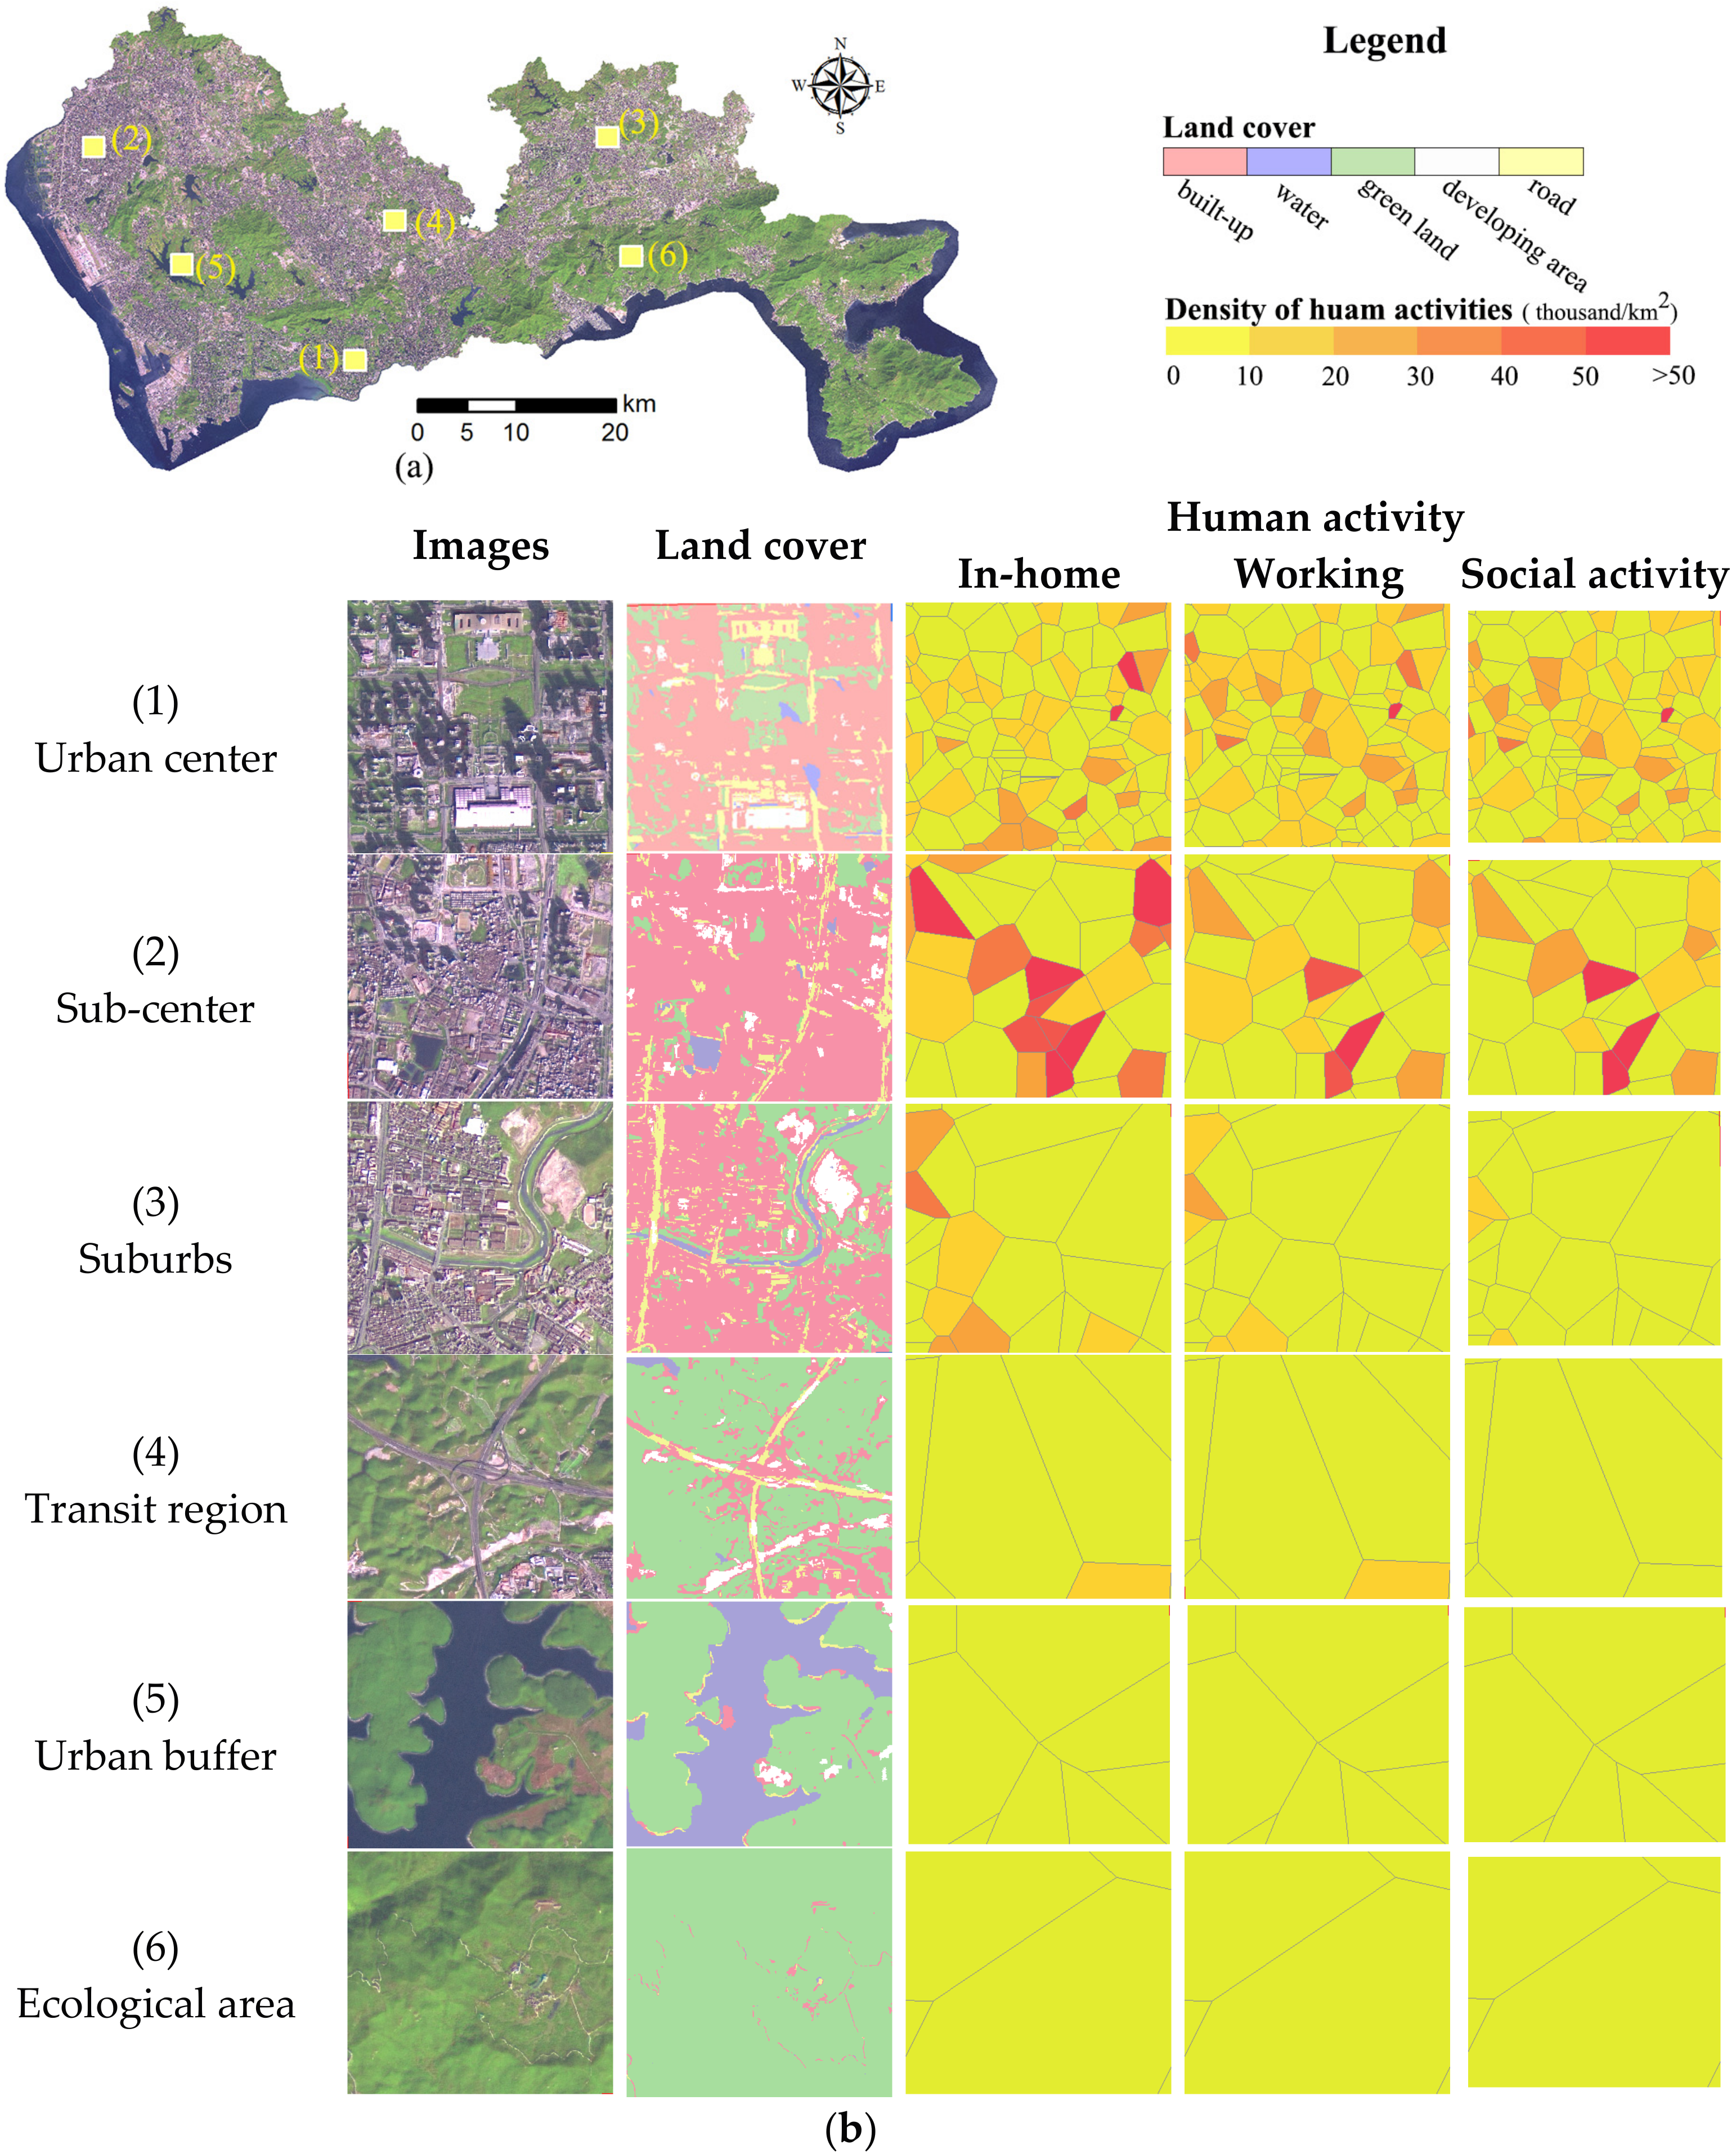
Six representative urban cells in different urban functional zones were examined to evaluate these results. The locations of these cells and the corresponding land cover and human activities are displayed in Figure 9. Results in these cells indicate that many errors of the land cover results appear in the built-up area, the road and the developing area. This demonstrates that representative cells of urban centers, sub-centers and suburbs have large ratios of built-up landscape, where human activities are aggregated, while the other three cells contain much green land. Regarding human activities, it suggests that, from Cell (1)–(6), the density of in-home, working and social activity decreases, accompanied by the number of cell tower polygons. This implies that there is not much difference in human activities in the urban buffer and ecological areas.
4.2. Gradient Analysis of Landscapes and Human Activity
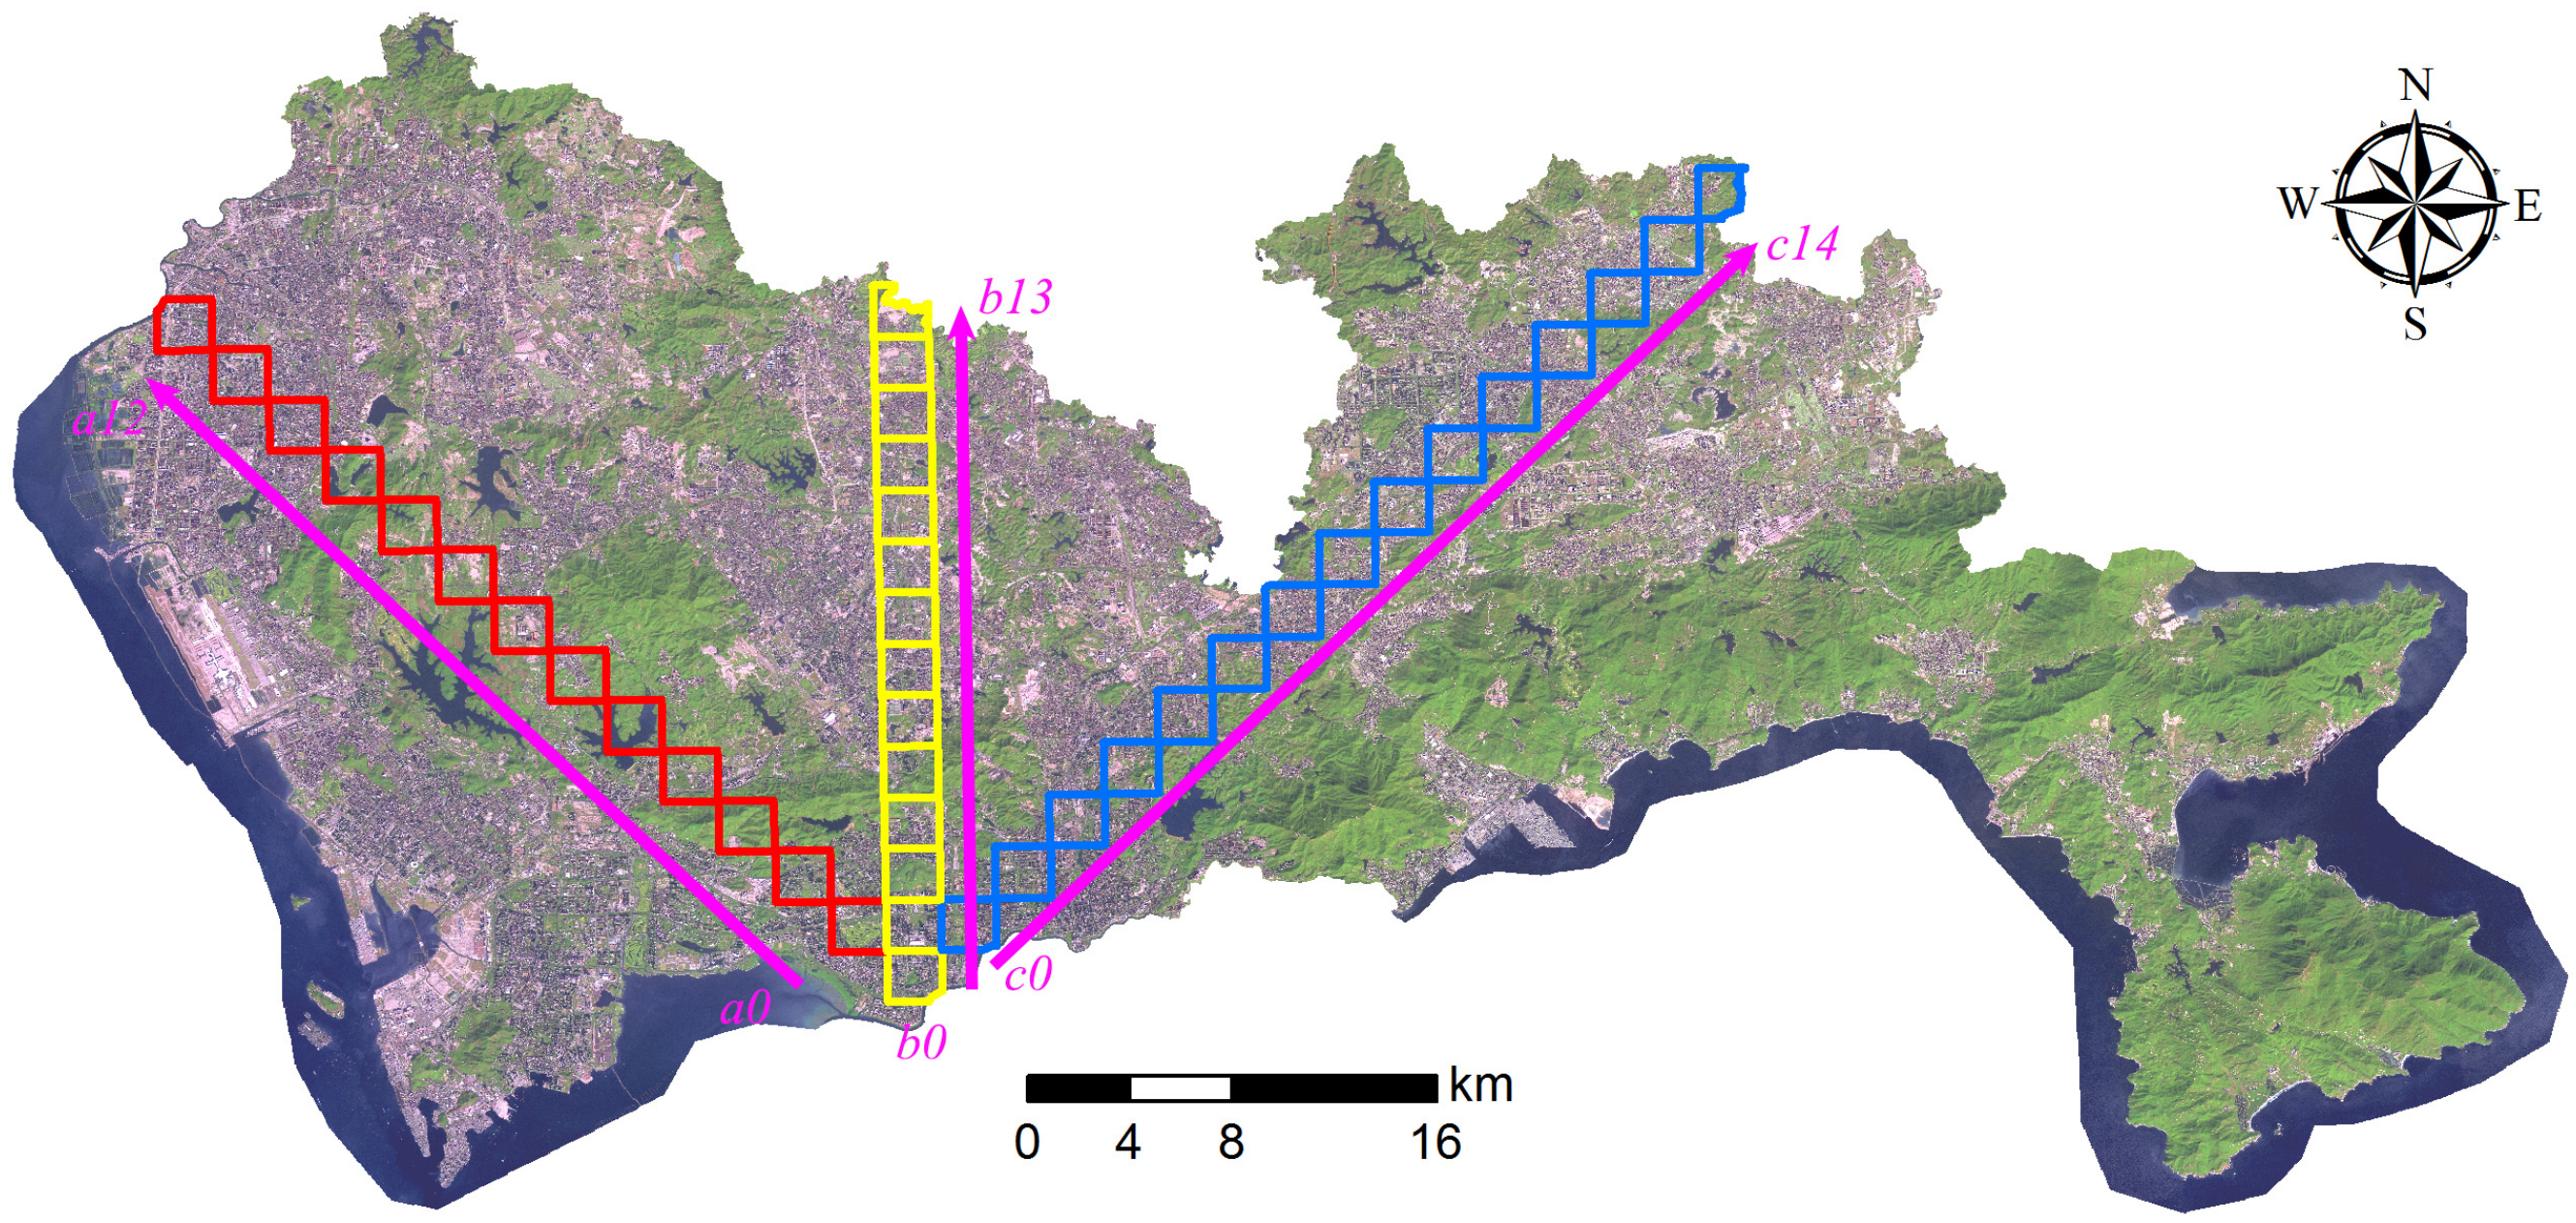
Gradient analysis helps to investigate spatial and temporal urban sprawl dynamics [19,20]. Three representative transects were selected to further analyze the patterns of landscapes and human activities, as Figure 10 shows. All of them are rooted in central business areas of Futian district. The northwest transect (a) directing to Baoan is composed of 13 2 km × 2 km urban cells. The north transect (b) directing to Longhua has 13 urban cells. The northeast transect (c) directing to Longgang has 15 urban cells. In total, 41 cells were selected for the following gradient analysis.
4.2.1. Pattern of Landscapes
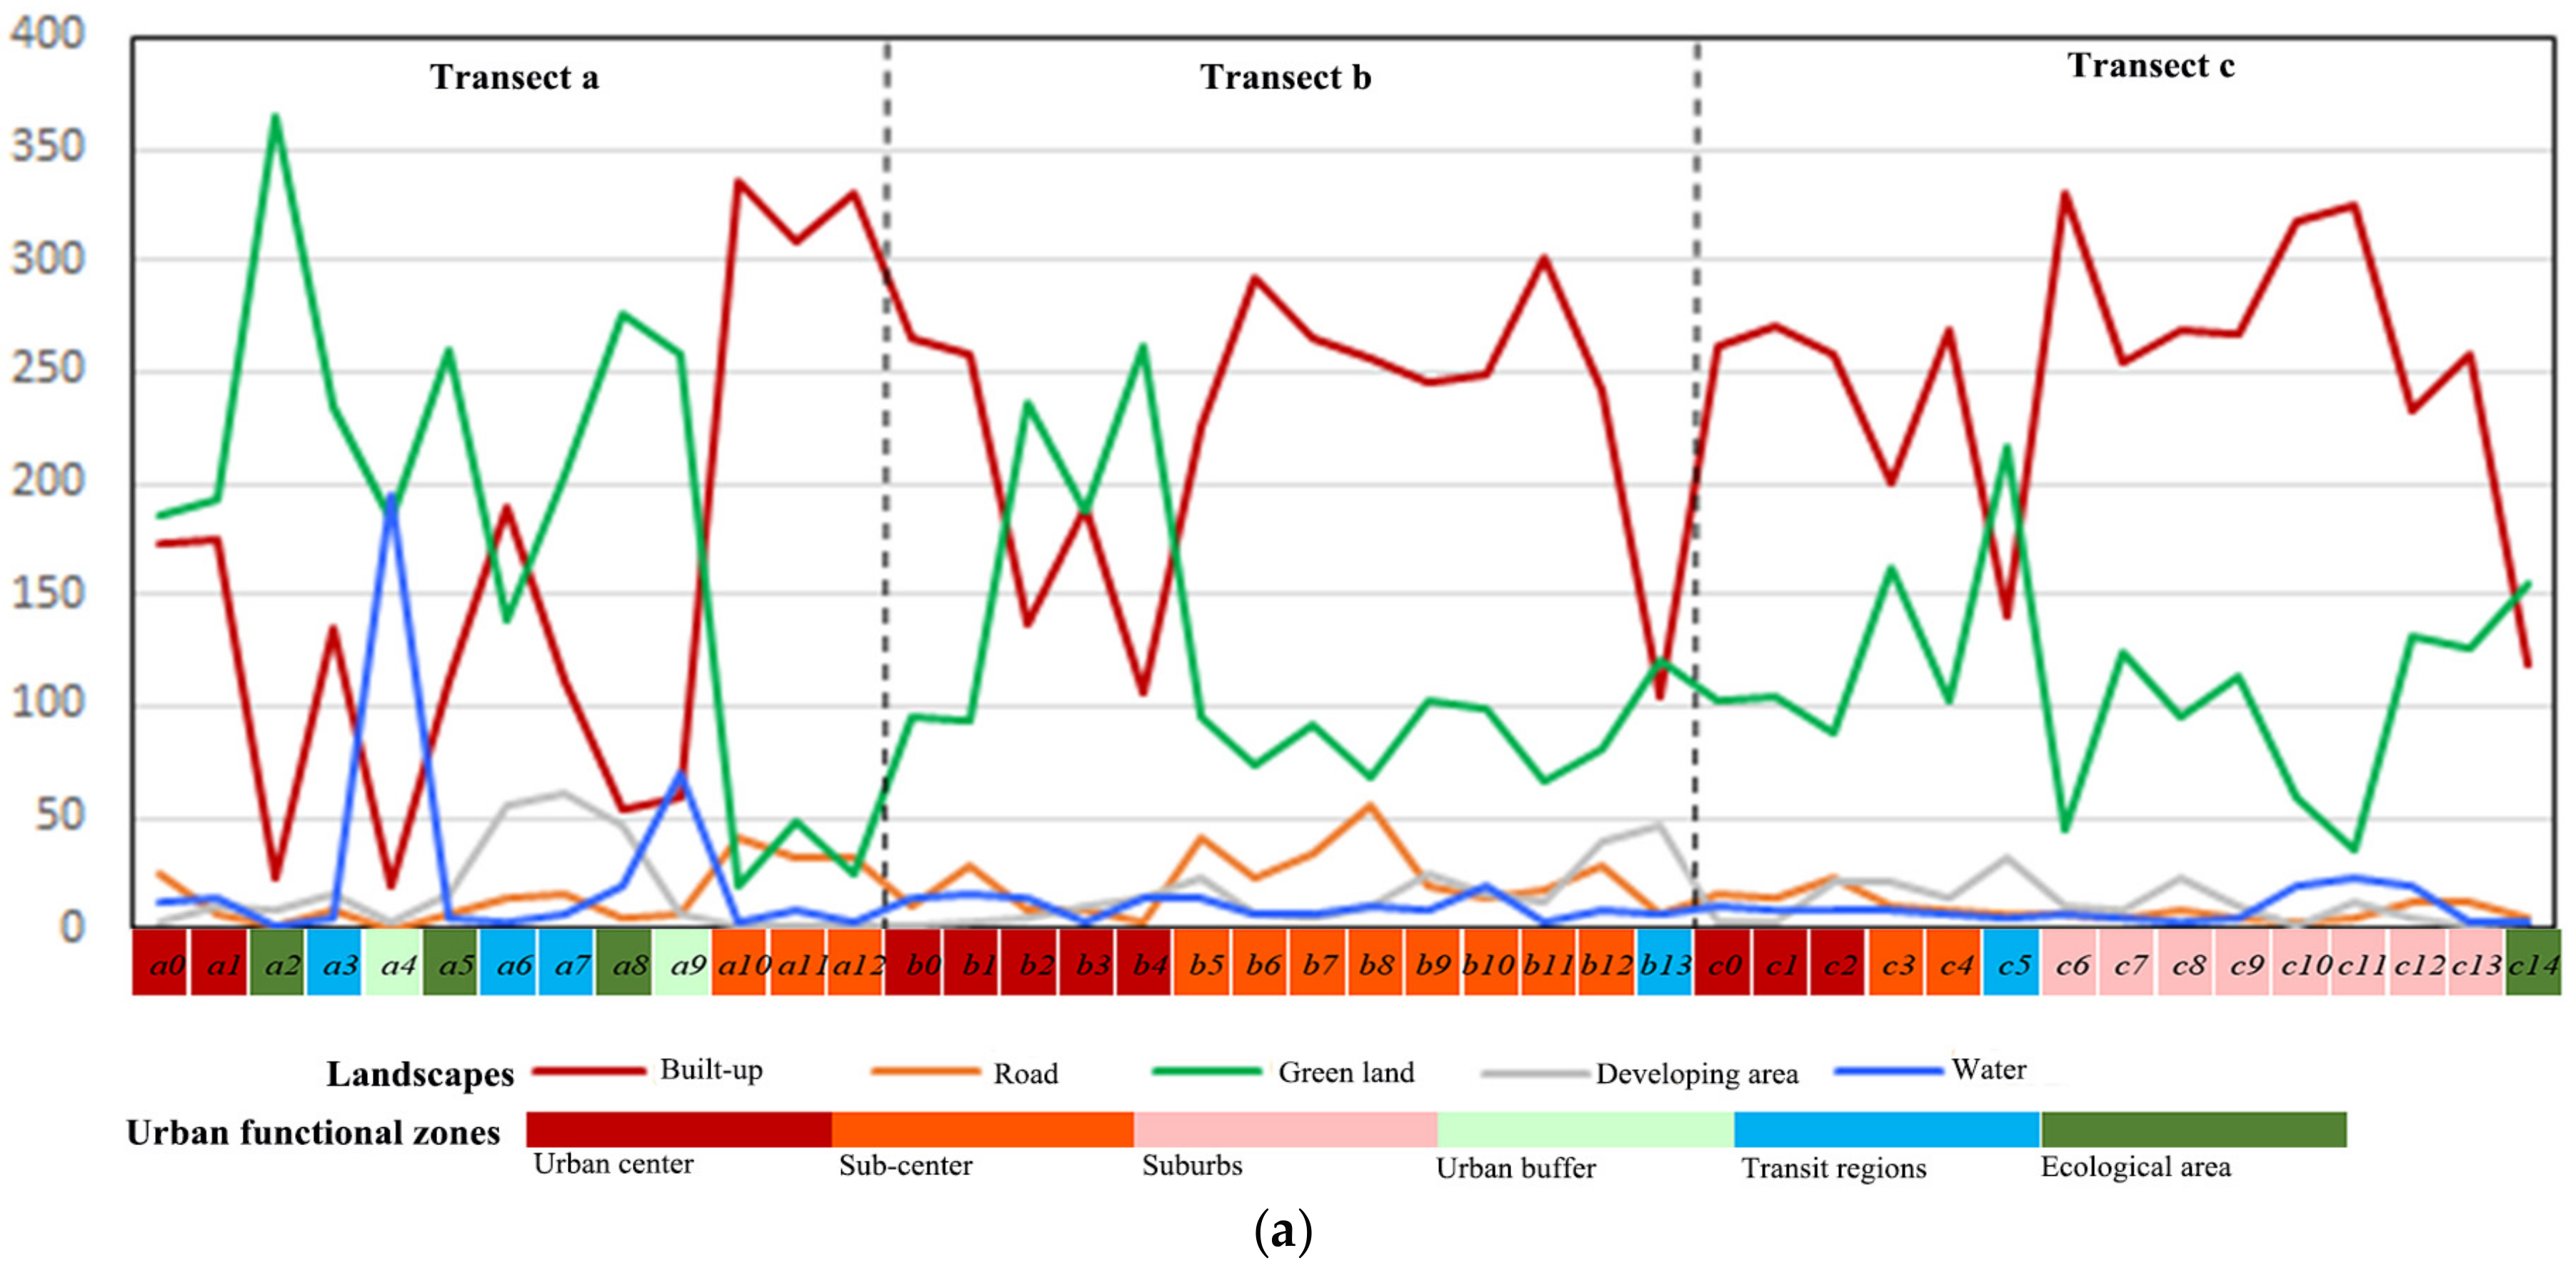
The class area of five landscapes from remote sensing images in three transects is displayed in Figure 11a. It illustrates that landscapes change sharply from urban center to urban border. The built-up landscape is dominated in the zones with urban center, sub-center and suburbs, where we functionally expect five cells (a0–a1, b2–b4), where many green land patches are designed to keep the balance between urban development and ecological service. The water and the road landscape are numerous, most of which are less than 50 ha in a cell except for the a4, a9 and b8 cells. There is a small number of developing areas, especially in the urban center. The peak number of developing areas appears at the transit regions, a6 and a7, 54.5 ha per cell. Regarding green land, there are more than 200 ha in ecological cells. This suggests the high degree of urbanization in Shenzhen as 24 cells are built-up area and necessary green land and water.
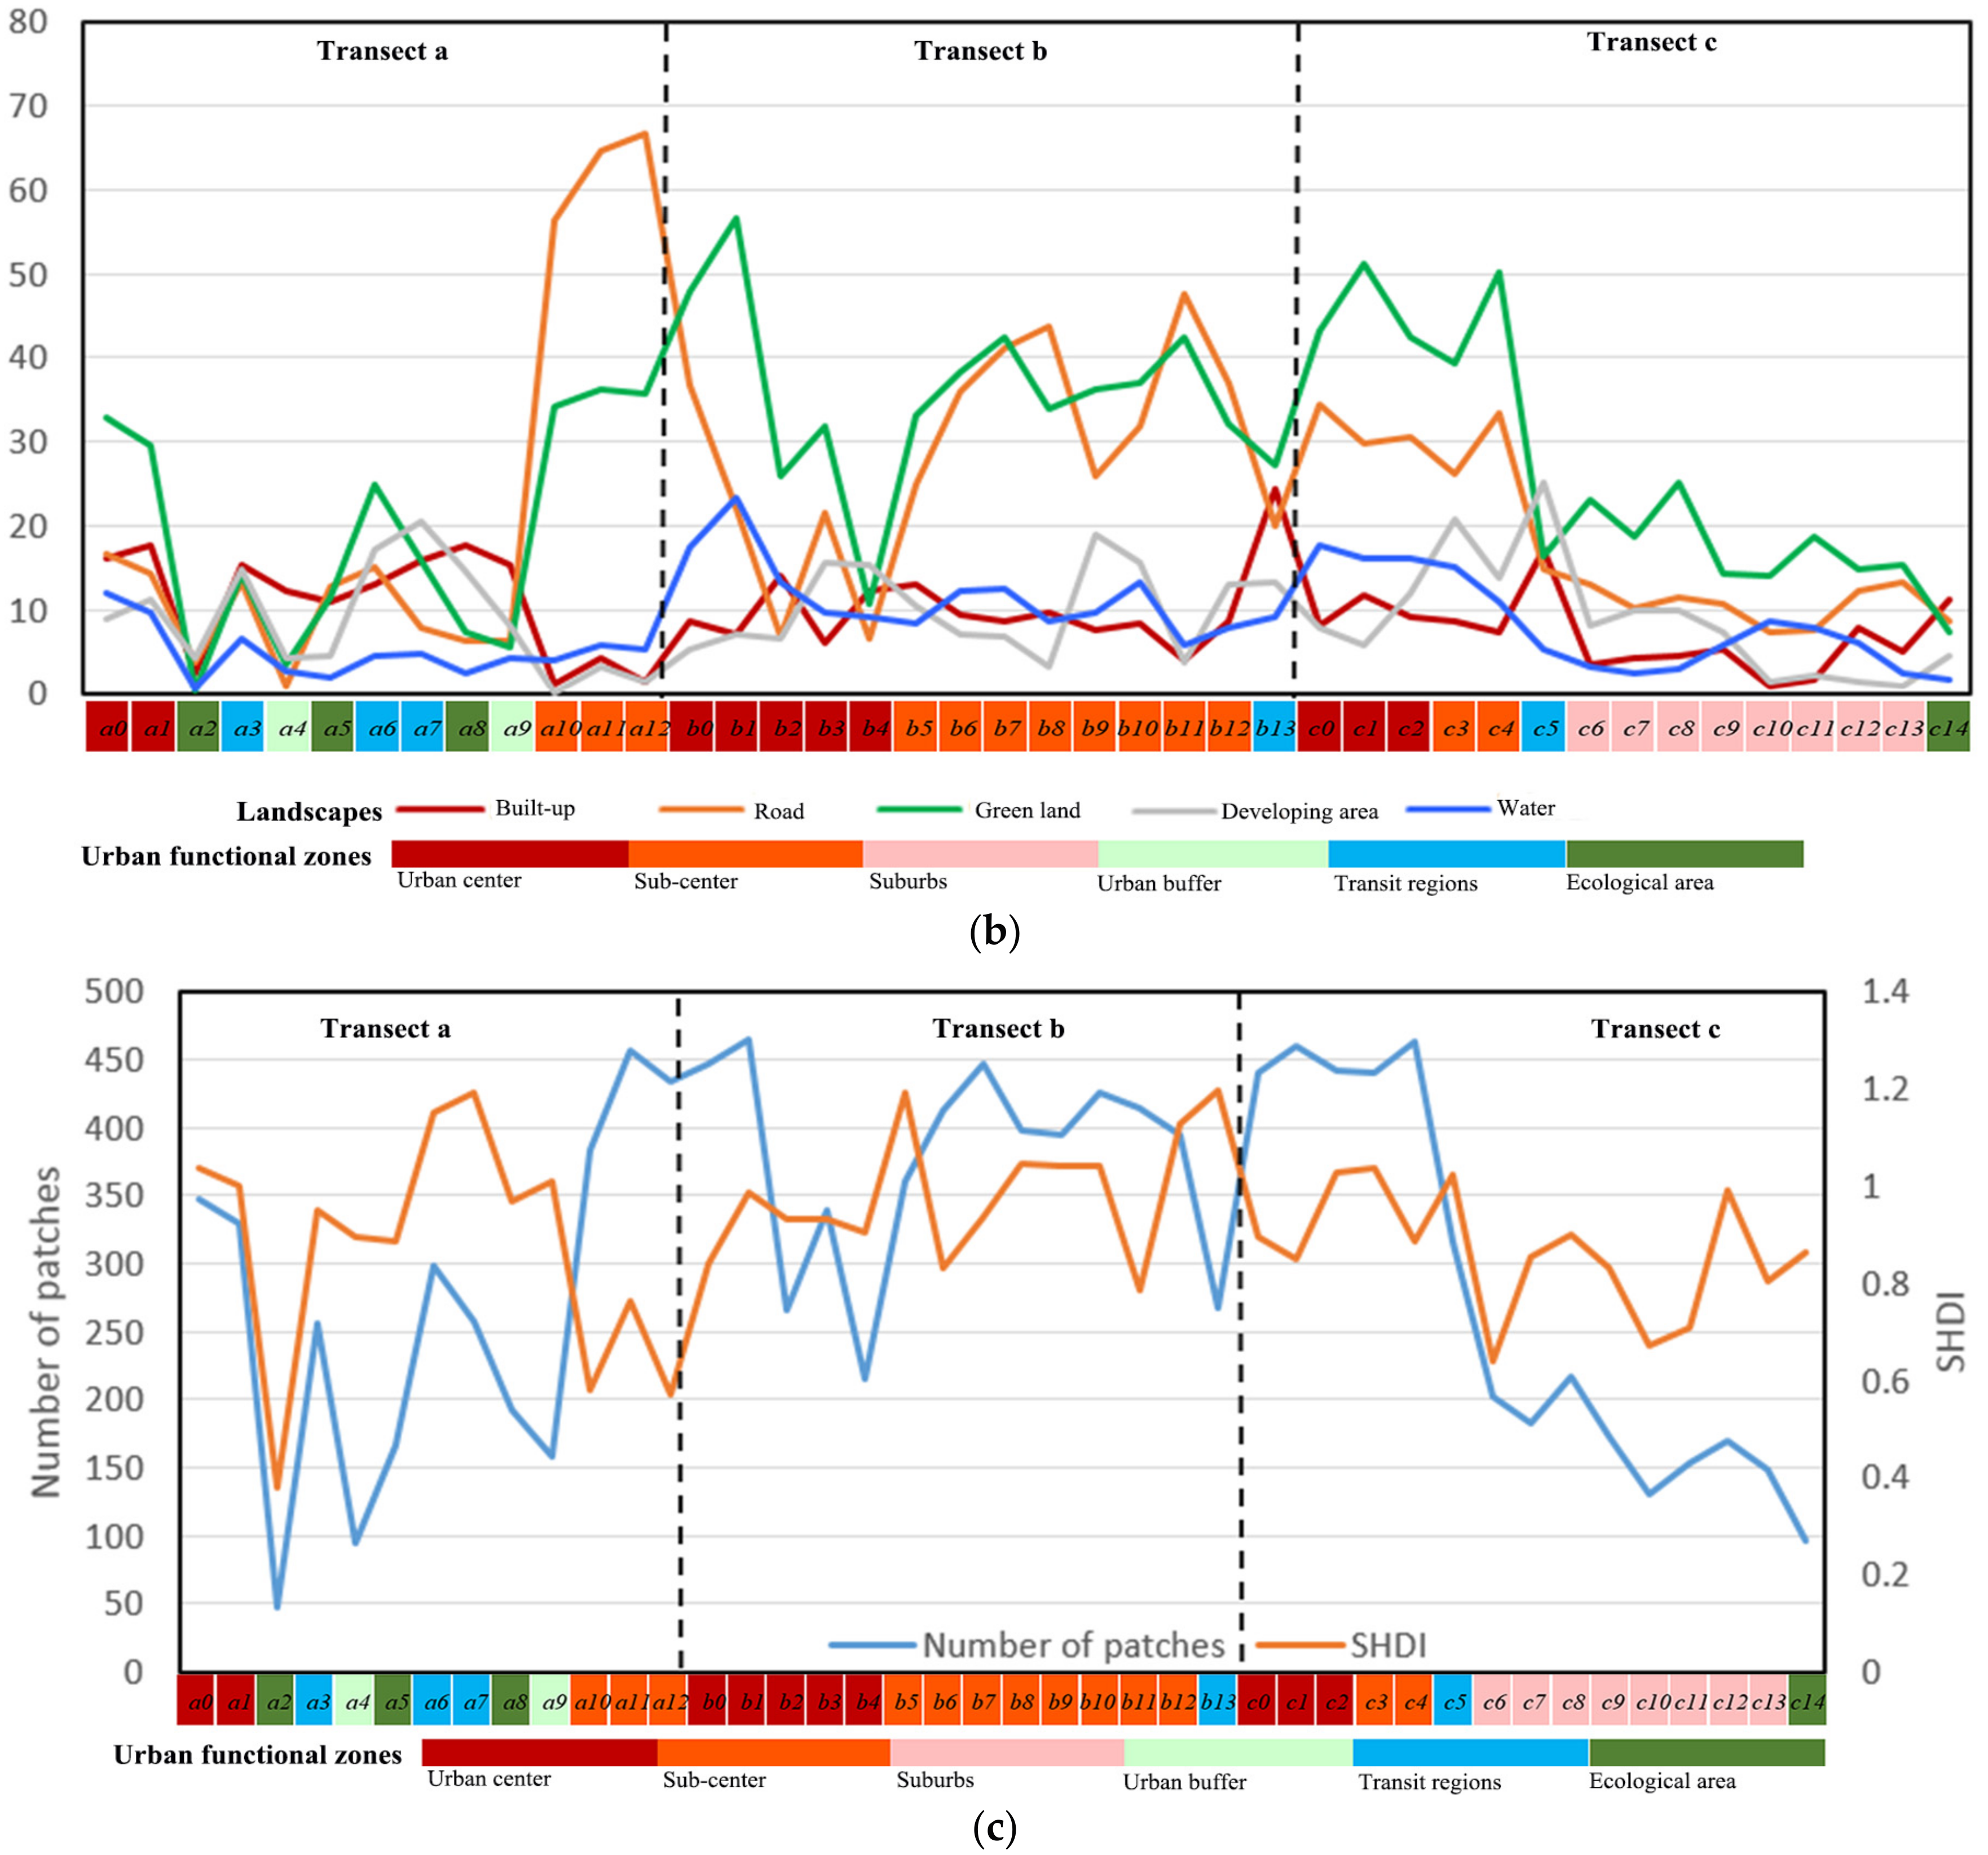
Figure 11b shows the pattern of patch density. It demonstrates that all five landscapes are less than 70 patches per ha. Basically, green land and road landscape have a higher patch density, which partially indicates the fragmented landscapes disturbed by human beings; while built-up area, water and developing area have a lower density, suggesting connected landscapes. Although the class area of the five spatial landscapes are similar in urban center and sub-center, the patch density is different in these six functional zones. The patch density of road landscape and green land is higher in sub-center zones. This means more fragmented roads and green landscapes, which may be due to self-development in these places, where urban development does not completely follow the government’s plan.
Figure 11c illustrates the variations of the number of patches (NP) and SHDI. A large NP suggests an intensive human distribution on natural environments. It demonstrates that the peak of NP appears at the sub-center (a12 and b7) and urban center (b1, c1 and c4), where the most human activities occur (see Figure 3). The valley of NP is with the ecological area (a2) and sub-center (a12). Regarding SHDI, which represents the diversity of landscapes in a cell, it starts with a medium value in the urban center, increases in the sub-center, decreases in the ecological area and achieves the most in the transit region (a7).
4.2.2. Pattern of Human Activities
Characteristics of human activities along the urban gradient are presented in Figure 12. Figure 12a displays the intensity of three types of human activities. The basic trend along the urban gradient is declining. The head cells of all three transects have a higher density of human activities at more than 200 thousand per ha. As the distance to the head cell increases, all three human activities reduce to less than 200 thousand per ha. In Transect a, all three type human activities reduce to the lowest value in the ecological area, Cell a8; it then returns to a median value in the sub-center, Cells a10–a12 at the end of this transect. Finally, this value achieves the lowest at less than 50,000 at the corresponding end. In Transect b, the density of in-home, working and social activities also decreases from the urban center to the sub-center and the transit region. The same trend also appears at Transect c, where the density of human activities in the cells follows the ranking: urban-center (c0–c2) > sub-center (c3–c4) > suburbs (c6–c13) > transit region (c5) > ecological area (c14).
Figure 12b displays the ratios of human activities in each cell. As the distance to the head cell increases, a general increasing trend can be seen from the ratios of in-home. The in-home ratio achieves the peak at a5, b4 and c14 respectively in the corresponding transects. Conversely, the working ratio decreases firstly and then increases, which indicates many jobs in the urban center. Regarding social activity, the ratio starts with a high value at the urban center and achieves the lowest in the transit region (a7), sub-center (b9) or ecological area (b13 and c14). These different trends characterize the differentiation of the function of urban space.
Combined with the landscapes from remote sensing images and the human activities from mobile phone positioning data, these important integrated characteristics help us to distinguish urban functional landscape patterns in Shenzhen city.
4.3. Comparison
To further evaluate the effect of the data fusion, we also grouped all urban cells with the landscape metrics from remote sensing imagery or human activities from mobile phone positioning data with the same hierarchical clustering. The obtained results were compared to those in Section 4.1.
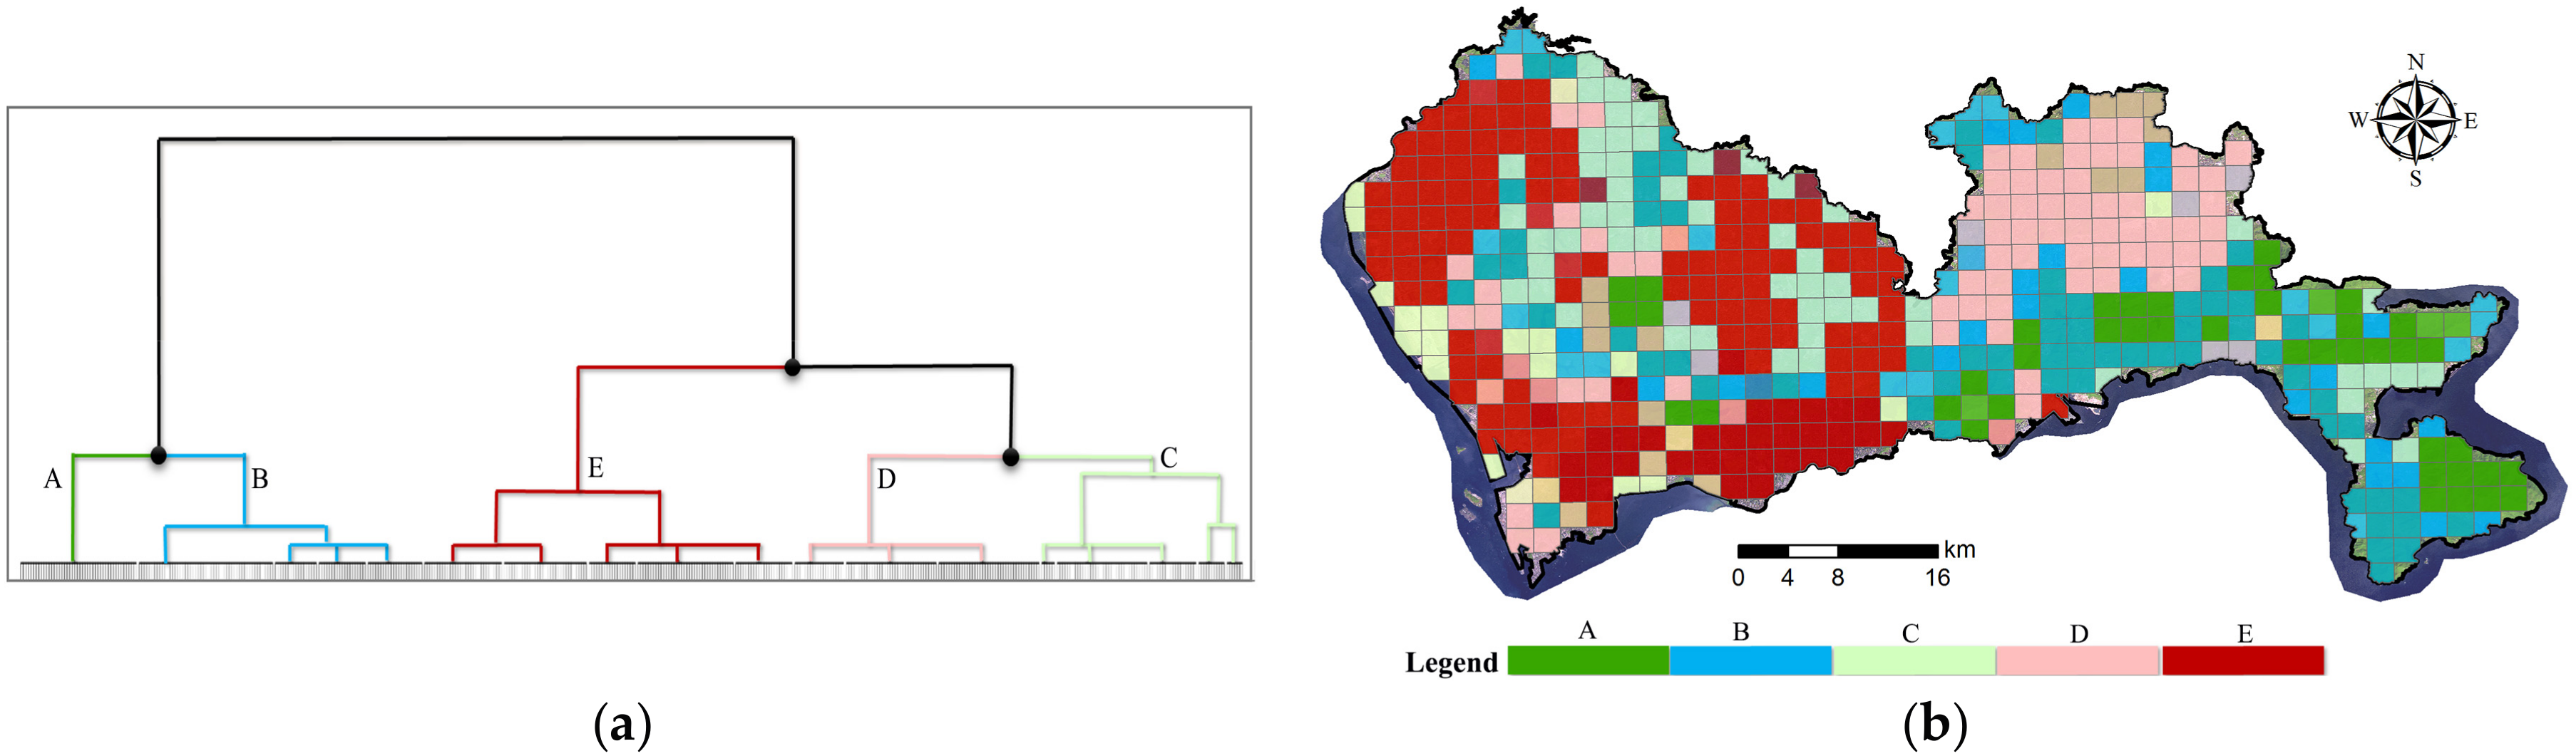
Figure 13 shows the dendrogram and spatial distribution of the clustering results with the landscapes. There are two branches at the root, rather than three branches in Figure 8a. One branch is with Clusters A and B, which mostly covers the natural area, as Figure 13b displays. The other branch is with Clusters C, D and E, covering many man-made places. Table 4 further reports the cross-comparison between this result with the clusters in Section 4.1. It indicates that Cluster A shares 42 cells with the ecological area. Clusters B and C are composited of cells with five types of functions, without sub-center or ecological area, respectively. Cluster D is dominated by the transit region function (54 cells), associated with 17 urban buffer cells. Cluster C is dominated by 71 suburbs cells, associated with 12 ecological cells. Cluster E is mixed with 34 urban center cells, 103 sub-center cells, 4 suburbs cells and 3 transit regions.
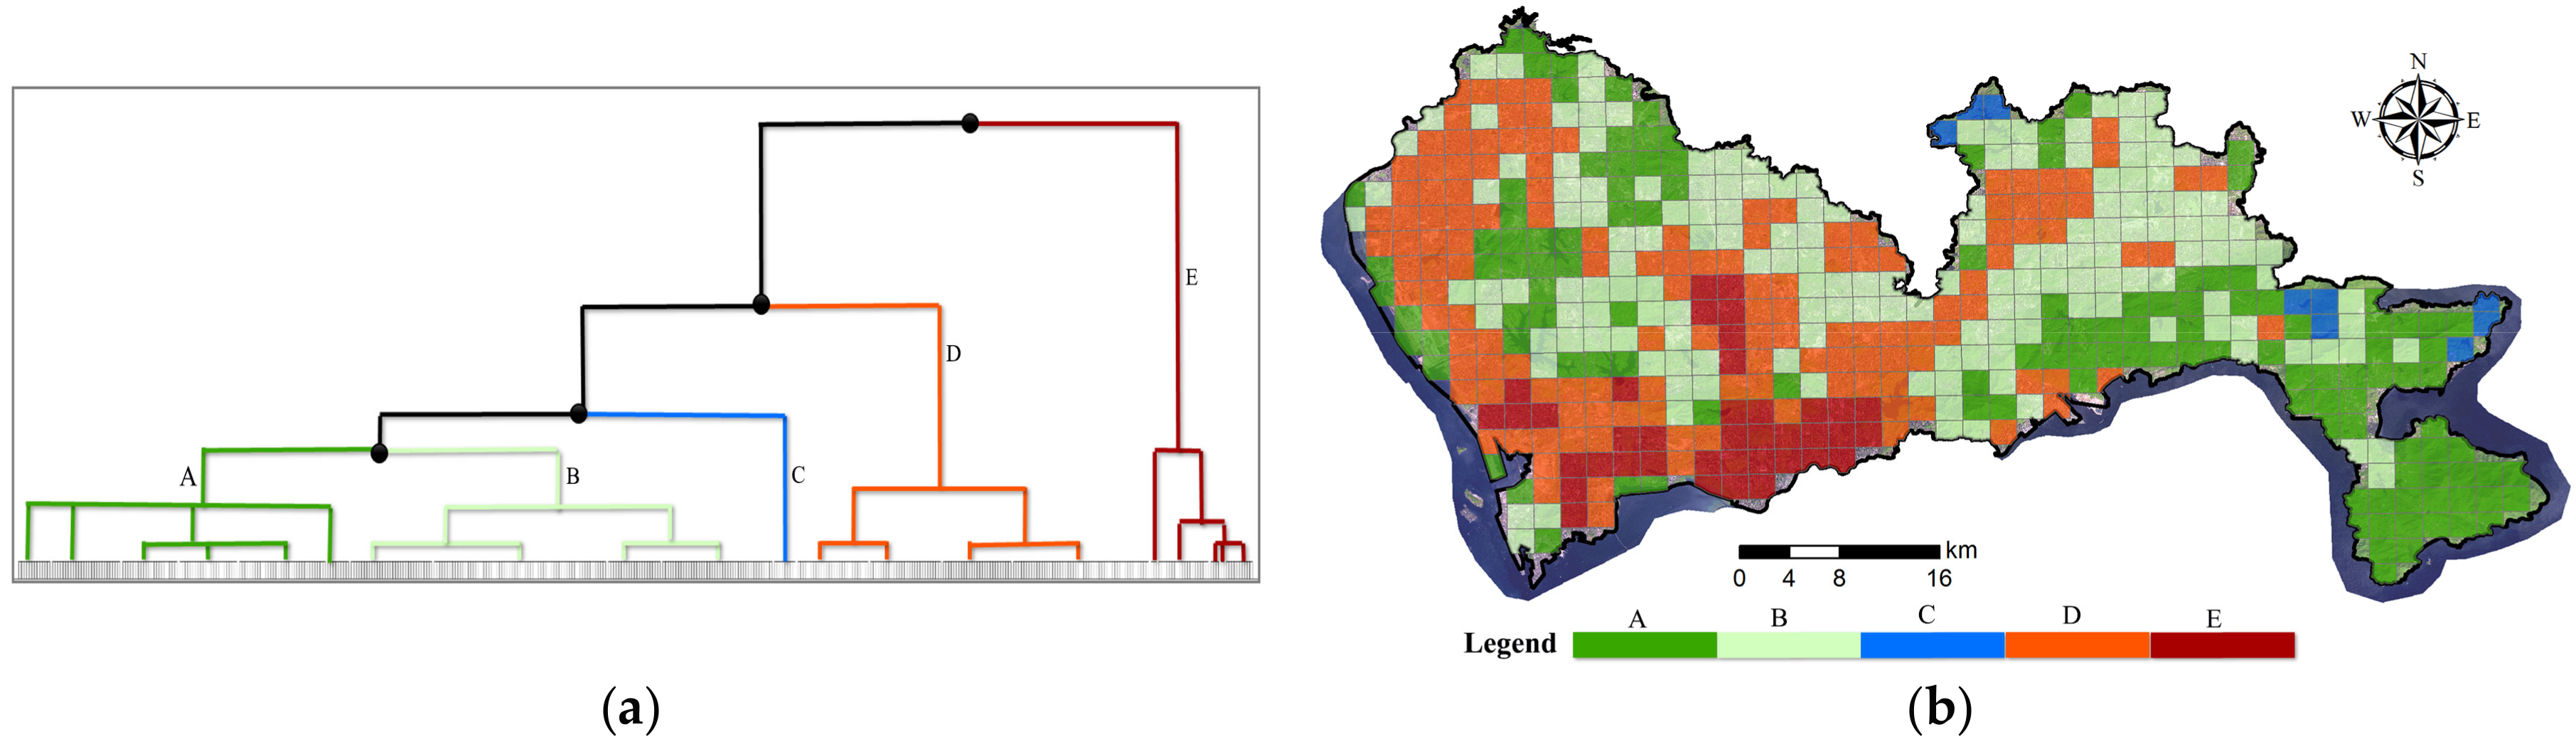
Figure 14 shows the dendrogram and the cluster results of human activities. With the knowledge of human activities in the city, it demonstrates that the clustering hierarchy mainly follows the density of human activities, except that Cluster C almost has no human activities. Cluster E shares 31 cells with urban centers. Cluster D has common cells with all six types of urban function zone. The most common cells appear at the sub-center, consisting of 79 cells. Clusters B and A both contain cells with five urban functions, but without urban centers. In other words, human activities are not well distinguished from the ecological area or the low degree of urbanized area with the low-density human activity.
In summary, the comparison between the clustering results of single source sensing data suggests that remote sensing or human sensing (taking mobile phone positioning data as an example) has its own drawbacks in highly or lowly urbanized areas, respectively. The fusion of remote sensing imagery and mobile phone positioning data shows a good performance in portraying urban functional zones in highly urbanized cities like Shenzhen, China.
5. Discussion
The experiment in Shenzhen, China, demonstrates that urban functions differentiate from urban center to urban border, because of the spatially-varying composition of landscape and human activities in this modern city. There are six urban functional zones in Shenzhen, including urban center, sub-center, suburbs, urban buffer, transit region and ecological area. The spatial distribution of these urban functional zones conforms to the classic urban spatial structure theories to a certain degree. For example, there is one urban center in the south, three sub-centers in west and north Shenzhen and one suburb core in northeast Shenzhen (Figure 8b), all of which have relatively high density of the built-up area and human activities. This urban spatial structure validates that the development of Shenzhen is aiming at the multi-clusters structure in the Shenzhen Comprehensive Plan 2010–2020 [69], which also complies with the polycentric theory [70]. The intensity and composition of human activities in these zones further indicate that the suburbs are inferior to sub-centers, which lag behind the aim of the Shenzhen Comprehensive Plan 2010–2020.
It can also be seen that the urban center is aggregated with the most working, social and in-home activities. Following the direction of three typical transects, the intensity of human activity declines greatly from the urban center to the suburbs. The ratio of in-home is lower in the urban center, but higher in the sub-center or suburbs. The ratio of working has a reverse trend. These variations are in line with the concentric zone theory. However, landscapes in these three zones are similar (Table 3), which does not conform to the classic concentric zone theory.
Compared with traditional urban studies relying on LULC, the proposed framework enables the portraying of urban functional zones by integrating landscape metrics from remote sensing imagery and human activity information from the new mobile phone positioning data, providing comprehensive urban knowledge for city planners, e.g., the description of the urban spatial structure, the accurate assessment of urban development status, etc. Actually, a number of studies has been conducted to analyze urban landscapes or urban functions [17,18,19,20,21,22,23,24], without human activities information, but more and more human sensing data give us an alternative approach to mapping the spatial structure of the city [35,37,41]. Fusing human sensing data with remote sensing imagery in urban studies has seldom been reported or analyzed in the literature. This study fills the gap with a novel framework, which differs from the previous studies in three main aspects.
(1) Daily human activities have been extracted for urban studies. Massive human sensing data like mobile phone positioning data and social media data contain much information about human activities. However, they do not explicitly report human activities; therefore, they are used as proxies of human activity in several studies [37,44]. Considering the rhythm and the regularity of human activities, three main human activities are extracted from mobile phone positioning data. This useful information provides us alternative images about the city (Figure 7).
(2) Both landscape metrics and human activity metrics have been used to describe urban space. Previously, most related studies used only landscape metrics inferred from remote sensing imagery to analyze urban space [17,18,19,20,21,22,23,24]. The humanistic aspect of urban space has been ignored. We integrate landscape metrics from SPOT-5 images and human activities from mobile phone positioning data to describe the urban cell. Using these useful metrics, we adopt hierarchal clustering to identify urban functional zones. The experiment in Shenzhen testifies that the fusion of remote sensing imagery and human sensing data can well characterize the complex pattern of the urban functional zones in Shenzhen.
(3) The pattern of landscape and human activities along the urban-suburbs gradient has been investigated. Although landscape gradient analysis has achieved success in many studies, for example Luck and Wu’s research in Phoenix, Arizona, USA [19], Yu and Ng’s study in Guangzhou, China [24], Lin et al.’s work in Xiamen, China [17], etc., it is not effective in Shenzhen, a highly urbanized city with more than 40% of the area covered by built-up land, as Section 4.3 demonstrates. By fusing landscape metrics and human activity, this study uncovers comprehensive patterns of landscape and human activities across the city. It reveals that there is a significant gradient in human activity from the urban center to suburbs and the ecological area.
6. Conclusions
Portraying urban functional zones provides a useful description of urban space usage. It helps urban planners to understand the urban development status and the urban spatial structure; therefore, it benefits both urban planning and sustainable urban development. This article presents a novel data fusion framework coupling remote sensing imagery and human sensing data to identify urban functional zones in a megacity. LULC were classified from SPOT 5 images with the bi-level set segmentation and the SVM classifier to calculate landscape metrics. Daily human activities were extracted from massive mobile phone positioning data. By integrating landscape metrics and human activity metrics, six urban functional zones including urban center, sub-center, suburbs, transit region, urban buffer and ecological area were identified using a hierarchical clustering method. The gradient of landscapes and human activities was revealed in three typical transects rooted in the urban center.
The experiment was conducted in Shenzhen, China. The results indicate that there are different compositions of landscapes and human activities in different urban functional zones. Following the gradient from the urban center to suburbs and ecological area, the intensity and the composition of human activities vary significantly. Landscape metrics are similar in urbanized areas (including urban centers, sub-centers and suburbs), where the intensity and the composition of human activities are differentiated. On the other hand, landscape metrics are distinguished at the less urbanized areas (including an urban buffer, transit region and ecological area). This proves that existing urban development of Shenzhen has gone far beyond the explanation capacity of the classical theories. It also demonstrates that the fusion of remote sensing imagery and human sensing data can well characterize the complex pattern of the urban functional zones in Shenzhen.
In the future, we plan to collect more mobile phone positioning data. Although previous studies have verified the regularity of human activity, long-term mobile phone positioning data are expected to examine the reliability of human activity labeling. We also plan to conduct an experiment in another city to validate the robustness of the proposed framework. On the other hand, the presented data fusion framework will be extended to be integrated with other human sensing data, like open street map (OSM), geo-tagged photos, social media data, vehicle trajectories, etc. Expanded resources will further deepen the understanding of complex urban spatial structure.
Acknowledgments
This work was financially supported by the National Natural Science Foundation of China (#41401444, #91546106, #41501369), the Basic Research Program of Shenzhen Science and Technology Innovation Committee (#JCYJ20170302144402023), the Open Fund of Key Laboratory of Urban Land Resources Monitoring and Simulation, Ministry of Land and Resources, China (#KF2016-02-009, #KF2016-02-010), and the Natural Science Foundation of Shenzhen University(#2016065, #2017052).
Author Contributions
Wei Tu and Zhongwen Hu established the data fusion framework and wrote the paper. Lefei Li implemented the remote sensing data processing procedure, Jinzhou Cao processed the mobile phone positioning data. Qiuping Li and Qingquan Li conceived of and designed the experiments. Jincheng Jiang analyzed the results.
Conflicts of Interest
The authors declare no conflict of interest. The founding sponsors had no role in the design of the study; in the collection, analysis or interpretation of data; in the writing of the manuscript; nor in the decision to publish the results.
References
- United Nations. The World’s Cities in 2016. 2016. Available online: http://www.un.org/en/development/desa/population/publications/pdf/urbanization/the_worlds_cities_in_2016_data_booklet.pdf (accessed on 20 August 2017).
- SCNESDRPC. Statistical Communique on National Economic and Social Development of the People’s Republic of China in 2016. 2016. Available online: http://www.stats.gov.cn/tjsj/zxfb/201702/t20170228_1467424.html (accessed on 27 August 2017).
- Wu, J. Urban ecology and sustainability: The state-of-the-science and future directions. Landsc. Urban Plan. 2014, 125, 209–221. [Google Scholar] [CrossRef]
- Batty, M. The size, scale, and shape of cities. Science 2008, 319, 769–771. [Google Scholar] [CrossRef] [PubMed]
- Yang, X. Urban Remote Sensing: Monitoring, Synthesis and Modeling in the Urban Environment; Wiley-Blackwell: Hoboken, NJ, USA, 2011. [Google Scholar]
- Weng, Q.H. Thermal infrared remote sensing for urban climate and environmental studies: Methods, applications, and trends. ISPRS J. Photogramm. Remote Sens. 2009, 64, 335–344. [Google Scholar] [CrossRef]
- Jensen, J.R.; Cowen, D.C. Remote sensing of urban suburban infrastructure and socio-economic attributes. Photogramm. Eng. Remote Sens. 1999, 65, 611–622. [Google Scholar]
- Taubenböck, H.; Esch, T.; Felbier, A.; Wiesner, M.; Roth, A.; Dech, S. Monitoring urbanization in mega cities from space. Remote Sens. Environ. 2012, 117, 162–176. [Google Scholar] [CrossRef]
- Weng, Q. Global Urban Monitoring and Assessment through Earth Observation; CRC Press: Boca Raton, FL, USA, 2014. [Google Scholar]
- Blaschke, T.; Hay, G.J.; Weng, Q.H.; Resch, B. Collective sensing: Integrating geospatial technologies to understand urban systems: An overview. Remote Sens. 2011, 3, 1743–1776. [Google Scholar] [CrossRef]
- Liu, H.; Huang, X.; Wen, D.; Li, J. The use of landscape metrics and transfer learning to explore urban villages in China. Remote Sens. 2017, 9, 365. [Google Scholar] [CrossRef]
- Mesev, V. Exploring the Temporal Lag between the Structure and Function of Urban Areas. In Urban Remote Sensing: Monitoring, Synthesis and Modeling in the Urban Environment; Yang, X., Ed.; John Wiley & Sons, Ltd.: Chichester, UK, 2011. [Google Scholar]
- Chen, Y.; Liu, X.; Li, X. Analyzing Parcel-Level Relationships between Urban Land Expansion and Activity Changes by Integrating Landsat and Nighttime Light Data. Remote Sens. 2017, 9, 164. [Google Scholar] [CrossRef]
- Lo, C.P. The application of geospatial technology to urban morphological research. Urban Morphol. 2007, 11, 81–90. [Google Scholar]
- Aubrecht, C.; León Torres, J.A. Evaluating Multi-Sensor Nighttime Earth Observation Data for Identification of Mixed vs. Residential Use in Urban Areas. Remote Sens. 2016, 8, 114. [Google Scholar] [CrossRef]
- Greene, R.P.; Pick, J.B. Exploring the Urban Community: A GIS Approach; Pearson: London, UK, 2011. [Google Scholar]
- Lin, T.; Sun, C.; Li, X.; Zhao, Q.; Zhang, G.; Ge, R.; Ye, H.; Huang, N.; Yin, K. Spatial pattern of urban functional landscapes along an urban—Rural gradient: A case study in Xiamen city, China. Int. J. Appl. Earth Obs. Geoinf. 2016, 46, 22–30. [Google Scholar] [CrossRef]
- Yang, X.; Lo, C.P. Using a time series of satellite imagery to detect land use and land cover changes in the Atlanta, Georgia metropolitan area. Int. J. Remote Sens. 2002, 23, 1775–1798. [Google Scholar] [CrossRef]
- Luck, M.; Wu, J. A gradient analysis of urban landscape pattern: A case study from the Phoenix metropolitan region, Arizona, USA. Landsc. Ecol. 2002, 17, 327–339. [Google Scholar] [CrossRef]
- McDonnell, M.J.; Hahs, A.K. The use of gradient analysis studies in advancing our understanding of the ecology of urbanizing landscapes: Current status and future directions. Landsc. Ecol. 2008, 23, 1143–1155. [Google Scholar] [CrossRef]
- Vizzari, M.; Hilal, M.; Sigura, M.; Antognelli, S.; Joly, D. Urban-rural-natural gradient analysis with CORINE data: An application to the metropolitan France. Landsc. Urban Plan. 2018, 171, 18–29. [Google Scholar] [CrossRef]
- Weng, Y. Spatiotemporal changes of landscape pattern in response to urbanization. Landsc. Urban Plan. 2007, 81, 341–353. [Google Scholar] [CrossRef]
- Ji, W.; Ma, J.; Twibell, R.W.; Underhill, K. Characterizing urban sprawl using multi-stage remote sensing images and landscape metrics. Comput. Environ. Urban Syst. 2006, 30, 861–879. [Google Scholar] [CrossRef]
- Yu, X.J.; Ng, C.N. Spatial and temporal dynamics of urban sprawl along two urban—Rural transects: A case study of Guangzhou, China. Landsc. Urban Plan. 2007, 79, 96–109. [Google Scholar] [CrossRef]
- Antrop, M. Landscape change: Plan or chaos? Landsc. Urban Plan. 1998, 41, 155–161. [Google Scholar] [CrossRef]
- Chen, Z.Q.; Yu, B.L.; Song, W.; Liu, H.X.; Wu, Q.S.; Shi, K.F.; Wu, J.P. A new approach for detecting urban centers and their spatial structure with nighttime light remote sensing. IEEE Trans. Geosci. Remote Sens. 2017, 55, 6305–6319. [Google Scholar] [CrossRef]
- Liu, Y.; Liu, X.; Gao, S.; Gong, L.; Kang, C.; Zhi, Y. Social sensing: A new approach to understanding our socioeconomic environments. Ann. Assoc. Am. Geogr. 2015, 105, 512–530. [Google Scholar] [CrossRef]
- Thakuriah, P.; Tilahun, N.; Zellner, M. Seeing Cities through Big Data; Springer International Publishing: New York, NY, USA, 2017. [Google Scholar]
- Goodchild, M.F. Citizens as sensors: The world of volunteered geography. GeoJournal 2007, 69, 211–221. [Google Scholar] [CrossRef]
- Batty, M. The pulse of the city. Environ. Plan. B 2010, 37, 575–577. [Google Scholar] [CrossRef]
- Yang, Y.; Tian, L.; Yeh Anthony, G.O.; Li, Q.Q. Zooming into individuals to understand the collective: A review of trajectory-based travel behavior studies. Travel Behav. Soc. 2014, 1, 719–723. [Google Scholar]
- Fang, Z.; Shaw, S.-L.; Tu, W.; Li, Q.Q.; Li, Y.G. Spatio temporal analysis of critical transportation links based on time geographic concepts: A case study of critical bridges in Wuhan, China. J. Transp. Geogr. 2012, 23, 44–59. [Google Scholar] [CrossRef]
- Tu, W.; Cao, R.; Yue, Y.; Zhou, B.D.; Li, Q.P.; Li, Q.Q. Spatial variations in urban public ridership derived from GPS trajectories and smart card data. J. Transp. Geogr. 2017, in press. [Google Scholar]
- Tu, W.; Li, Q.Q.; Fang, Z.X.; Shaw, S.L.; Zhou, B.D.; Chang, X.M. Optimizing the locations of electric taxi charging stations: A spatial–temporal demand coverage approach. Transp. Res. C 2016, 65, 172–189. [Google Scholar] [CrossRef]
- Ratti, C.; Frenchman, D.; Pulselli, R.M.; Williams, S. Mobile landscapes: Using location data from cell phones for urban analysis. Environ. Plan. B 2006, 33, 727–748. [Google Scholar] [CrossRef]
- Ahas, R.; Aasa, A.; Yuan, Y.; Raubal, M.; Smoreda, Z.; Liu, Y.; Ziemlicki, C.; Tiru, M.; Zook, M. Everyday space–time geographies: Using mobile phone-based sensor data to monitor urban activity in Harbin, Paris, and Tallinn. Int. J. Geo-Inf. Sci. 2015, 29, 2017–2039. [Google Scholar] [CrossRef]
- Pei, T.; Sobolevsky, S.; Ratti, C.; Shaw, S.-L.; Li, T.; Zhou, C. A new insight into land use classification based on aggregated mobile phone data. Int. J. Geo-Inf. Sci. 2014, 28, 1988–2007. [Google Scholar] [CrossRef]
- Xu, Y.; Shaw, S.-L.; Zhao, Z.; Yin, L.; Lu, F.; Chen, J.; Fang, Z.; Li, Q. Another Tale of Two Cities: Understanding Human Activity Space Using Actively Tracked Cellphone Location Data. Ann. Am. Assoc. Geogr. 2016, 106, 489–502. [Google Scholar]
- Tu, W.; Cao, J.Z.; Yue, Y.; Shaw, S.L.; Zhou, M.; Wang, Z.S.; Chang, X.M.; Xu, Y.; Li, Q.Q. Coupling mobile phone and social media data: A new approach to understanding urban functions and diurnal patterns. Int. J. Geo-Inf. Sci. 2017, 31, 2331–2358. [Google Scholar] [CrossRef]
- Gonzalez, M.C.; Hidalgo, C.A.; Barabasi, A.L. Understanding individual human mobility patterns. Nature 2008, 453, 779–782. [Google Scholar] [CrossRef] [PubMed]
- Chen, Y.; Liu, X.; Li, X.; Liu, X.; Yao, Y.; Hu, G.; Xu, X.; Pei, F. Delineating urban functional areas with building-level social media data: A dynamic time warping (DTW) distance based k-medoids method. Landsc. Urban Plan. 2017, 160, 48–60. [Google Scholar] [CrossRef]
- Cao, J.Z.; Tu, W.; Li, Q.Q.; Zhou, M.; Cao, R. Exploring the distribution and dynamics of functional regions using mobile phone data and social media data. In Proceedings of the 14th International Conference on Computers in Urban Planning and Urban Management, Boston, MA, USA, 10 July 2015. [Google Scholar]
- Huang, W.; Li, S.N. Understanding human activity patterns based on space-time-semantics. ISPRS J. Photogramm. Remote Sens. 2016, 121, 1–10. [Google Scholar] [CrossRef]
- Cai, J.; Huang, B.; Song, Y. Using multi-source geospatial big data to identify the structure of polycentric cities. Remote Sens. Environ. 2017, 202, 210–221. [Google Scholar] [CrossRef]
- Aubrecht, C.; Steinnocher, K.; Hollaus, M.; Wagner, W. Integrating earth observation and GIScience for high resolution spatial and functional modeling of urban land use. Comput. Environ. Urban Syst. 2009, 33, 15–25. [Google Scholar] [CrossRef]
- McGarigal, K.; Cushman, S.A. The Gradient Concept of Landscape Structure; Wiens, J.A., Moss, M.R., Eds.; Issues and Perspectives in Landscape Ecology; Cambridge University Press: Cambridge, UK, 2005; pp. 112–119. [Google Scholar]
- Schneider, A.; Mertes, C.M. Expansion and growth in Chinese cities, 1978–2010. Environ. Res. Lett. 2014, 9, 024008. [Google Scholar] [CrossRef]
- Shenzhen Statistics Yearbook 2016. 2016. Available online: http://www.sztj.gov.cn/xxgk/tjsj/tjnj/201701/W020170120506125327799.pdf (accessed on 7 June 2017).
- Roerdink, J.B.; Meijster, A. The watershed transform: Definitions, algorithms and parallelization strategies. Fund Inform. 2000, 41, 187–228. [Google Scholar]
- Felzenszwalb, P.F.; Huttenlocher, D.P. Efficient graph-based image segmentation. Int. J. Comput. Vis. 2004, 59, 167–181. [Google Scholar] [CrossRef]
- Benz, U.C.; Hofmann, P.; Willhauck, G.; Lingenfelder, I.; Heynen, M. Multi-resolution, object-oriented fuzzy analysis of remote sensing data for GIS-ready information. ISPRS J. Photogramm. Remote Sens. 2004, 58, 239–258. [Google Scholar] [CrossRef]
- Haris, K.; Efstratiadis, S.N.; Maglaveras, N.; Katsaggelos, A.K. Hybrid image segmentation using watersheds and fast region merging. IEEE Trans. Image Process. 1998, 7, 1684–1699. [Google Scholar] [CrossRef] [PubMed]
- Hu, Z.; Li, Q.; Zou, Q.; Zhang, Q.; Wu, G. A bilevel scale-sets model for hierarchical representation of large remote sensing images. IEEE Trans. Geosci. Remote Sens. 2016, 54, 7366–7377. [Google Scholar] [CrossRef]
- Baatz, M.; Schäpe, A. Multiresolution Segmentation: An optimization approach for high quality multi-scale image segmentation. In Angewandte Geographische Informationsverarbeitung XII; Wichmann: Karlsruhe, Germany, 2000; pp. 12–23. [Google Scholar]
- Drǎguţ, L.; Tiede, D.; Levick, S.R. ESP: A tool to estimate scale parameter for multi-resolution image segmentation of remotely sensed data. Int. J. Geo-Inf. Sci. 2010, 24, 859–871. [Google Scholar] [CrossRef]
- Johnson, B.; Xie, Z. Unsupervised image segmentation evaluation and refinement using a multi-scale approach. ISPRS J. Photogramm. Remote Sens. 2011, 66, 473–483. [Google Scholar] [CrossRef]
- Johnson, B.A.; Bragais, M.; Endo, I.; Magcale-Macandog, D.B.; Macandog, P.B.M. Image segmentation parameter optimization considering within-and between-segment heterogeneity at multiple scale levels: Test case for mapping residential areas using Landsat imagery. ISPRS Int. J. Geo-Inf. 2015, 4, 2292–2305. [Google Scholar] [CrossRef]
- Pesaresi, M.; Gerhardinger, A.; Kayitakire, F.C.C.O. A robust built-up area presence index by anisotropic rotation-invariant textural measure. IEEE J. Sel. Top. Appl. Earth Obs. Remote Sens. 2008, 1, 180–192. [Google Scholar] [CrossRef]
- ECognition Developer. 9.0 User Guide; Trimble Germany GmbH: Munich, Germany, 2014. [Google Scholar]
- Hu, Z.; Li, Q.; Zhang, Q.; Wu, G. Representation of block-based image features in a multi-scale framework for built-up area detection. Remote Sens. 2016, 8, 155. [Google Scholar] [CrossRef]
- Cortes, C.; Vapnik, V. Support vector machine. Mach. Learn. 1995, 20, 273–297. [Google Scholar] [CrossRef]
- Peng, J.; Wang, Y.; Zhang, Y. Evaluating the effectiveness of landscape metrics in quantifying spatial patterns. Ecol. Indic. 2010, 10, 217–223. [Google Scholar] [CrossRef]
- Uuemaa, E.; Antrop, M.; Roosaare, J.; Marja, R.; Mander, Ü. Landscape metrics and indices: An overview of their use in landscape research. Living Rev. Landsc. Res. 2009, 3, 1–28. [Google Scholar] [CrossRef]
- McGarigal, K.; Cushman, S.; Ene, E. FRAGSTATS v4: Spatial Pattern Analysis Program for Categorical and Continuous Maps; Computer Software Program Produced by the Authors at the University of Massachusetts; University of Massachusetts: Amherst, MA, USA, 2012; Available online: http://www.umass.edu/landeco/research/fragstats/fragstats.html (accessed on 25 September 2017).
- Sevtsuk, A.; Ratti, C. Does urban mobility have a daily routine? Learning from the aggregate data of mobile networks. J. Urban Tech. 2010, 17, 41–60. [Google Scholar] [CrossRef]
- Johnson, S.C. Hierarchical clustering schemes. Psychometrika 1967, 32, 241–254. [Google Scholar] [CrossRef] [PubMed]
- Ward, J.H. Hierarchical grouping to optimize an objective function. J. Am. Stat. Assoc. 1963, 58, 236–244. [Google Scholar] [CrossRef]
- Murtagh, F.; Legendre, P. Ward’s Hierarchical Agglomerative Clustering Method: Which Algorithms Implement Ward’s Criterion? J. Classif. 2014, 31, 274–295. [Google Scholar] [CrossRef]
- Shenzhen Comprehensive Urban Plan 2010–2020. 2011. Available online: http://www.szpl.gov.cn/ywzy/ghzs/201710/t20171024_443924.html (accessed on 15 November 2017).
- McMillen, D.P.; McDonald, J.F. A nonparametric analysis of employment density in a polycentric city. J. Reg. Sci. 1997, 37, 591–612. [Google Scholar] [CrossRef]
Figure 1.
The study area in China.

Figure 2.
The SPOT-5 images.

Figure 3.
Spatial distribution of mobile phone positioning data: (a) 5349 cell towers in Shenzhen; (b) 245 million mobile phone positioning records.
Figure 3.
Spatial distribution of mobile phone positioning data: (a) 5349 cell towers in Shenzhen; (b) 245 million mobile phone positioning records.

Figure 4.
The workflow of the presented framework.

Figure 5.
Land cover from SPOT-5 images.

Figure 6.
Human activity detection from mobile phone records. (a) The trajectory of a mobile phone user; (b) trajectory segmentation. Vertical segments denote human activities at fixed places. Slope segments denote moves between places.
Figure 6.
Human activity detection from mobile phone records. (a) The trajectory of a mobile phone user; (b) trajectory segmentation. Vertical segments denote human activities at fixed places. Slope segments denote moves between places.

Figure 7.
Human activity from mobile phone records. (a) Density of in-home; (b) density of working; (c) density of social activity.
Figure 7.
Human activity from mobile phone records. (a) Density of in-home; (b) density of working; (c) density of social activity.

Figure 8.
Urban functional zones. (a) The dendrogram. (b) Clustering result (with six clusters).

Figure 9.
Representative urban cells. (a) Locations of urban cells; (b) SPOT-5 images, land cover and human activities.
Figure 9.
Representative urban cells. (a) Locations of urban cells; (b) SPOT-5 images, land cover and human activities.

Figure 10.
Representative transects.

Figure 11.
Patten of landscapes along urban gradient. (a) Class area; (b) patch density; (c) number of patches and Shannon’s diversity index (SHDI).
Figure 11.
Patten of landscapes along urban gradient. (a) Class area; (b) patch density; (c) number of patches and Shannon’s diversity index (SHDI).


Figure 12.
Spatial pattern of human activities along the urban gradient: (a) density; (b) ratio.

Figure 13.
Cluster result with landscapes: (a) the dendrogram; (b) clustering map.

Figure 14.
Cluster result with human activity: (a) the dendrogram; (b) clustering map.


Table 1.
Spatial landscape metrics selected in this study.
| Name | Description |
|---|---|
| Total class area (CA) | Total area of one class landscape |
| Patch density (PD) | Patch count per square km of one class landscape |
| Number of patches (NP) | Total number of patches |
| Shannon’s diversity index (SHDI) | Equals minus the sum, across all patch types, of the proportional abundance of each patch type multiplied by that proportion |
Table 2.
Comparison of human activities from human sensing data with household travel investigation.
Table 2.
Comparison of human activities from human sensing data with household travel investigation.
| Name | In-Home | Working | Social Activities |
|---|---|---|---|
| Count | 14,470,460 | 10,459,657 | 6,738,925 |
| Ratio | 45.7% | 33.0% | 21.3% |
| Ratio in the household travel investigation 2010 dataset | 42.8% | 34.3% | 22.9% |
Table 3.
Composition of landscape and human activity.
| Name | No. of Cells | Area (km2) | Landscape Composition (ha/cell) | Human Activity (n/ha) | |||||||
|---|---|---|---|---|---|---|---|---|---|---|---|
| Built-Up Area | Water | Green Land | Road | Developing Area | In-Home | Working | Social Activity | ||||
| Global | 476 | 1845 | 148.6 | 17.8 | 186.3 | 14.0 | 24.3 | 78.4 | 56.7 | 36.5 | |
| Urban functional zones | Urban center | 42 | 164.2 | 206.7 | 15.0 | 146.1 | 12.7 | 10.4 | 322 | 260.7 | 195.2 |
| Sub-center | 108 | 425.8 | 268.8 | 10.4 | 76.2 | 29.4 | 9.7 | 128.4 | 82 | 51.5 | |
| Suburbs | 78 | 308.5 | 226.9 | 13.1 | 131.8 | 13.1 | 14.8 | 60 | 45.4 | 24.1 | |
| Transit region | 89 | 342.8 | 109.8 | 17.6 | 188.7 | 11.3 | 57.3 | 28 | 18 | 7.8 | |
| Urban buffer | 40 | 141.4 | 56.2 | 77.6 | 196.6 | 20.3 | 12.9 | 21 | 15.2 | 11 | |
| Ecological area | 119 | 462.3 | 28.8 | 8.6 | 330.9 | 1.3 | 27.8 | 13.5 | 8.3 | 3.8 | |
Table 4.
The comparison of different clustering results.
| Urban Center | Sub-Center | Suburbs | Transit Region | Urban Buffer | Ecological Area | ||
|---|---|---|---|---|---|---|---|
| Remote sensing images based clusters | A | 0 | 0 | 0 | 0 | 4 | 42 |
| B | 1 | 0 | 1 | 25 | 19 | 65 | |
| C | 3 | 3 | 2 | 54 | 17 | 0 | |
| D | 3 | 2 | 71 | 8 | 0 | 12 | |
| E | 34 | 103 | 4 | 3 | 0 | 0 | |
| Human sensing data based clusters | A | 0 | 1 | 7 | 31 | 21 | 68 |
| B | 0 | 20 | 39 | 51 | 7 | 46 | |
| C | 0 | 0 | 0 | 9 | 0 | 0 | |
| D | 10 | 79 | 32 | 7 | 11 | 5 | |
| E | 31 | 8 | 0 | 0 | 0 | 0 |
© 2018 by the authors. Licensee MDPI, Basel, Switzerland. This article is an open access article distributed under the terms and conditions of the Creative Commons Attribution (CC BY) license (http://creativecommons.org/licenses/by/4.0/).
Share and Cite
MDPI and ACS Style
Tu, W.; Hu, Z.; Li, L.; Cao, J.; Jiang, J.; Li, Q.; Li, Q. Portraying Urban Functional Zones by Coupling Remote Sensing Imagery and Human Sensing Data. Remote Sens. 2018, 10, 141. https://0-doi-org.brum.beds.ac.uk/10.3390/rs10010141
AMA Style
Tu W, Hu Z, Li L, Cao J, Jiang J, Li Q, Li Q. Portraying Urban Functional Zones by Coupling Remote Sensing Imagery and Human Sensing Data. Remote Sensing. 2018; 10(1):141. https://0-doi-org.brum.beds.ac.uk/10.3390/rs10010141
Chicago/Turabian StyleTu, Wei, Zhongwen Hu, Lefei Li, Jinzhou Cao, Jincheng Jiang, Qiuping Li, and Qingquan Li. 2018. "Portraying Urban Functional Zones by Coupling Remote Sensing Imagery and Human Sensing Data" Remote Sensing 10, no. 1: 141. https://0-doi-org.brum.beds.ac.uk/10.3390/rs10010141
Note that from the first issue of 2016, this journal uses article numbers instead of page numbers. See further details here.