Mineral Mapping Using the Automatized Gaussian Model (AGM)—Application to Two Industrial French Sites at Gardanne and Thann


1
Commissariat à l’Energie Atomique et aux énergies alternatives, CEA/DAM/DIF, F-91297 Arpajon, France
2
UMR-CNRS 6112—LPG Nantes, Université de Nantes, 2 rue de la Houssinière, BP 92208, 44322 Nantes CEDEX 3, France
*
Author to whom correspondence should be addressed.
Remote Sens. 2018, 10(1), 146; https://0-doi-org.brum.beds.ac.uk/10.3390/rs10010146
Submission received: 23 November 2017
/
Revised: 22 December 2017
/
Accepted: 16 January 2018
/
Published: 19 January 2018
(This article belongs to the Section Remote Sensing in Geology, Geomorphology and Hydrology)
Abstract
:The identification and mapping of the mineral composition of by-products and residues on industrial sites is a topic of growing interest because it may provide information on plant-processing activities and their impact on the surrounding environment. Imaging spectroscopy can provide such information based on the spectral signatures of soil mineral markers. In this study, we use the automatized Gaussian model (AGM), an automated, physically based method relying on spectral deconvolution. Originally developed for the short-wavelength infrared (SWIR) range, it has been extended to include information from the visible and near-infrared (VNIR) range to take iron oxides/hydroxides into account. We present the results of its application to two French industrial sites: (i) the Altéo Environnement site in Gardanne, southern France, dedicated to the extraction of alumina from bauxite; and (ii) the Millennium Inorganic Chemicals site in Thann, eastern France, which produces titanium dioxide from ilmenite and rutile, and its associated Séché Éco Services site used to neutralize the resulting effluents, producing gypsum. HySpex hyperspectral images were acquired over Gardanne in September 2013 and an APEX image was acquired over Thann in June 2013. In both cases, reflectance spectra were measured and samples were collected in the field and analyzed for mineralogical and chemical composition. When applying the AGM to the images, both in the VNIR and SWIR ranges, we successfully identified and mapped minerals of interest characteristic of each site: bauxite, Bauxaline® and alumina for Gardanne; and red and white gypsum and calcite for Thann. Identifications and maps were consistent with in situ measurements.
1. Introduction
The identification and mapping of the mineral composition of by-products and residues from industrial sites is a topic of growing interest because it may provide information on plant-processing activities and their impact on the surrounding environment. The management of industrial by-products has the potential, for example, to pollute surface and ground water or generate dust with a possible impact on human health. Many by-products can also have beneficial properties that make them suitable for applications in which they can replace virgin materials, for example, in the construction/building industry and, to a lesser extent, in agriculture and horticulture. Therefore, the use of a by-product generally requires detailed knowledge of its composition, physical properties and variations in quality.
Imaging spectroscopy has clearly proven over the years to be a powerful tool for environmental monitoring, in particular by allowing researchers to map soil mineral markers based on their diagnostic spectral signatures (e.g., [1,2,3,4]). Minerals exhibit a number of distinct absorptions reflecting their composition and type. These absorptions vary in position, relative strength, and shape. Additionally, the scattering process contributes significantly to the global shape of the reflectance spectrum or continuum. The continuum, which corresponds to the overall reflected light color of an object relative to incident light, is related to physical properties of the surface (e.g., grain size, roughness, moisture content, local slope, etc.). So, surface reflectance as acquired by imaging spectrometers, if analyzed properly, can provide information on the spatial distribution of surface chemical composition, concentration and proportions of constituents in a pixel and, eventually, surface physical properties.
Several approaches have been followed to take advantage of these properties, from the simplest such as spectral indices (e.g., [5] and references therein) relying on absorption position and relative strength, to more sophisticated attempts to take full advantage of the spectral shape, relying on reference spectral libraries (e.g., Tetracorder [6]) or more physically based approaches such as the modified Gaussian model (MGM) developed by Sunshine et al. [7,8]. The latter is based on spectral deconvolution in the visible-near infrared (VNIR) range, assuming that absorption features attributable to iron are modified Gaussians superimposed on a straight-line continuum in the wavenumber space, and it has been used extensively in planetology (e.g., [7,8,9,10]). Some authors have extended this approach to identify minerals with various compositions, such as phyllosilicates, presenting specific narrow absorptions in the shortwave infrared (SWIR) range [11,12]. The model has also been improved by Pompilio et al. (the exponential Gaussian optimization (EGO) model [13,14]) to take into account possible asymmetry and saturation of the absorption bands to avoid too many non-meaningful Gaussians. Some modifications have also been made to continuum modeling from the simple and easy-to-use approach of Clark and Roush [15], such as using a second-order polynomial to better adjust the overall shape of natural spectra [16], using a linear spline interpolation [11], or including the fundamental water absorption bands in the continuum model around 2800 nm [17]. This physically based MGM offers the advantage of being independent of site or measurement conditions, provides information on both chemical and physical properties of the surface, and has proven to be one of the most powerful tools for the deconvolution of the reflectance spectrum of binary or ternary mixtures as well as overlapping absorption features. However, the MGM deconvolution is a semi-automatic process as it needs an initial set of parameters, representing a priori constraints. Due to the large size of hyperspectral datasets, more robust and stable automated methods are desirable. Moreover, the MGM results are highly dependent on this initial set of parameters. Derivatives have been used as a means to estimate these parameters from the data themselves (e.g., [11,18,19] and references therein). However, this method is sensitive to instrumental noise and can lead to overfitting, creating Gaussians that no longer represent meaningful absorption bands. Makarewicz [11] has addressed this problem by smoothing the continuum-removed spectra. In a previous study, we developed for the SWIR the automatized Gaussian model (AGM) [20] which uses an iterative procedure based on a root-mean square error (RMSE) threshold to deal with overfitting.
Here, we have the three following objectives: (i) the automatic identification and mapping of minerals relying as much as possible on physical bases, using spectral deconvolution, with no a priori knowledge for starting parameters; (ii) the identification of industrial processes based on mineral markers from residues; and (iii) the test on two French industrial sites that look similar on standard multispectral color composites but involve different processes and products/residues.
Therefore, the paper is organized as follows. The first “Materials and Methods” section presents the two sites, the associated processes and the spectral signatures of the main materials, as well as the images, the AGM method and its extension to the VNIR domain, and the mineral database used in the study. The results obtained for the two sites are presented in the “Results” section, and the last section provides conclusions and future research directions.
2. Materials and Methods
2.1. Sites, Associated Processes and Spectral Signatures of Main Materials
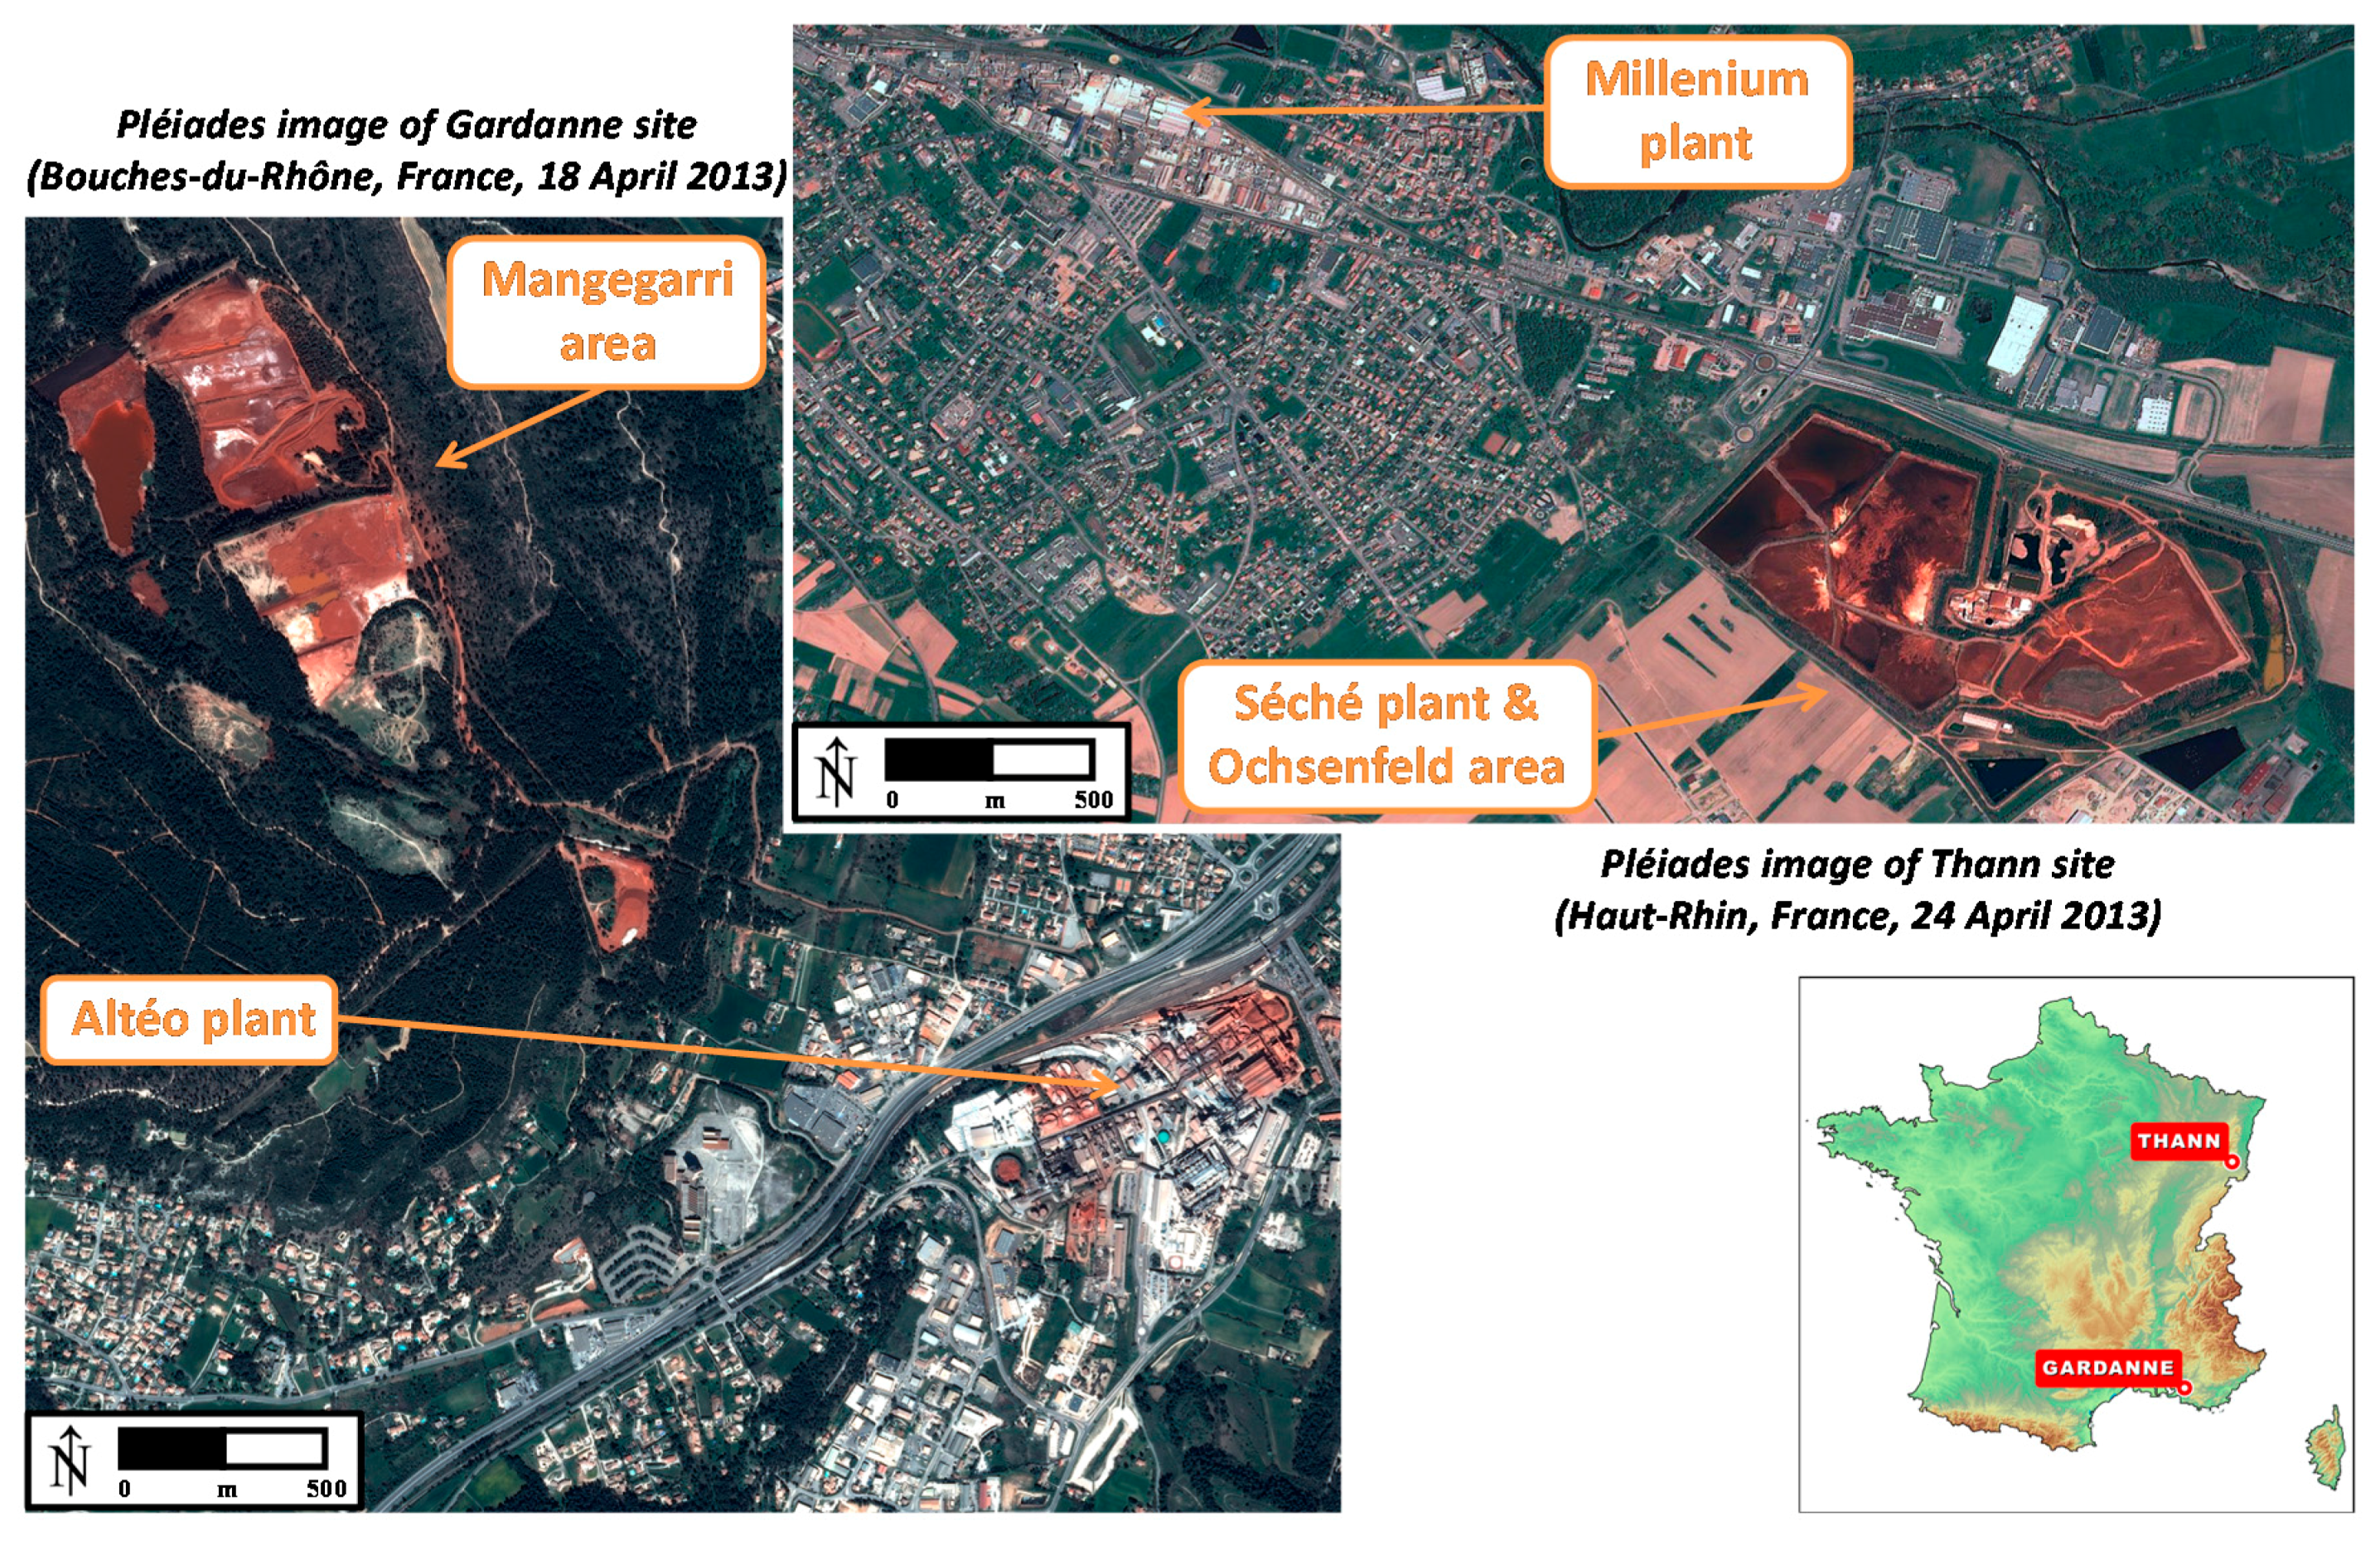
In this work, we present two examples from French industrial sites (Figure 1): (i) the Altéo Environnement site, Gardanne, southern France; and (ii) the Millennium Inorganic Chemicals and Séché éco Services sites, Thann, eastern France. These could appear similar on standard multispectral color composites (red/brownish storage areas and white heaps) although their processes are different.
Hereafter, we describe the sites and the associated processes as well as the spectral signatures of the main minerals encountered.
2.1.1. Altéo Environnement plant, Gardanne, France
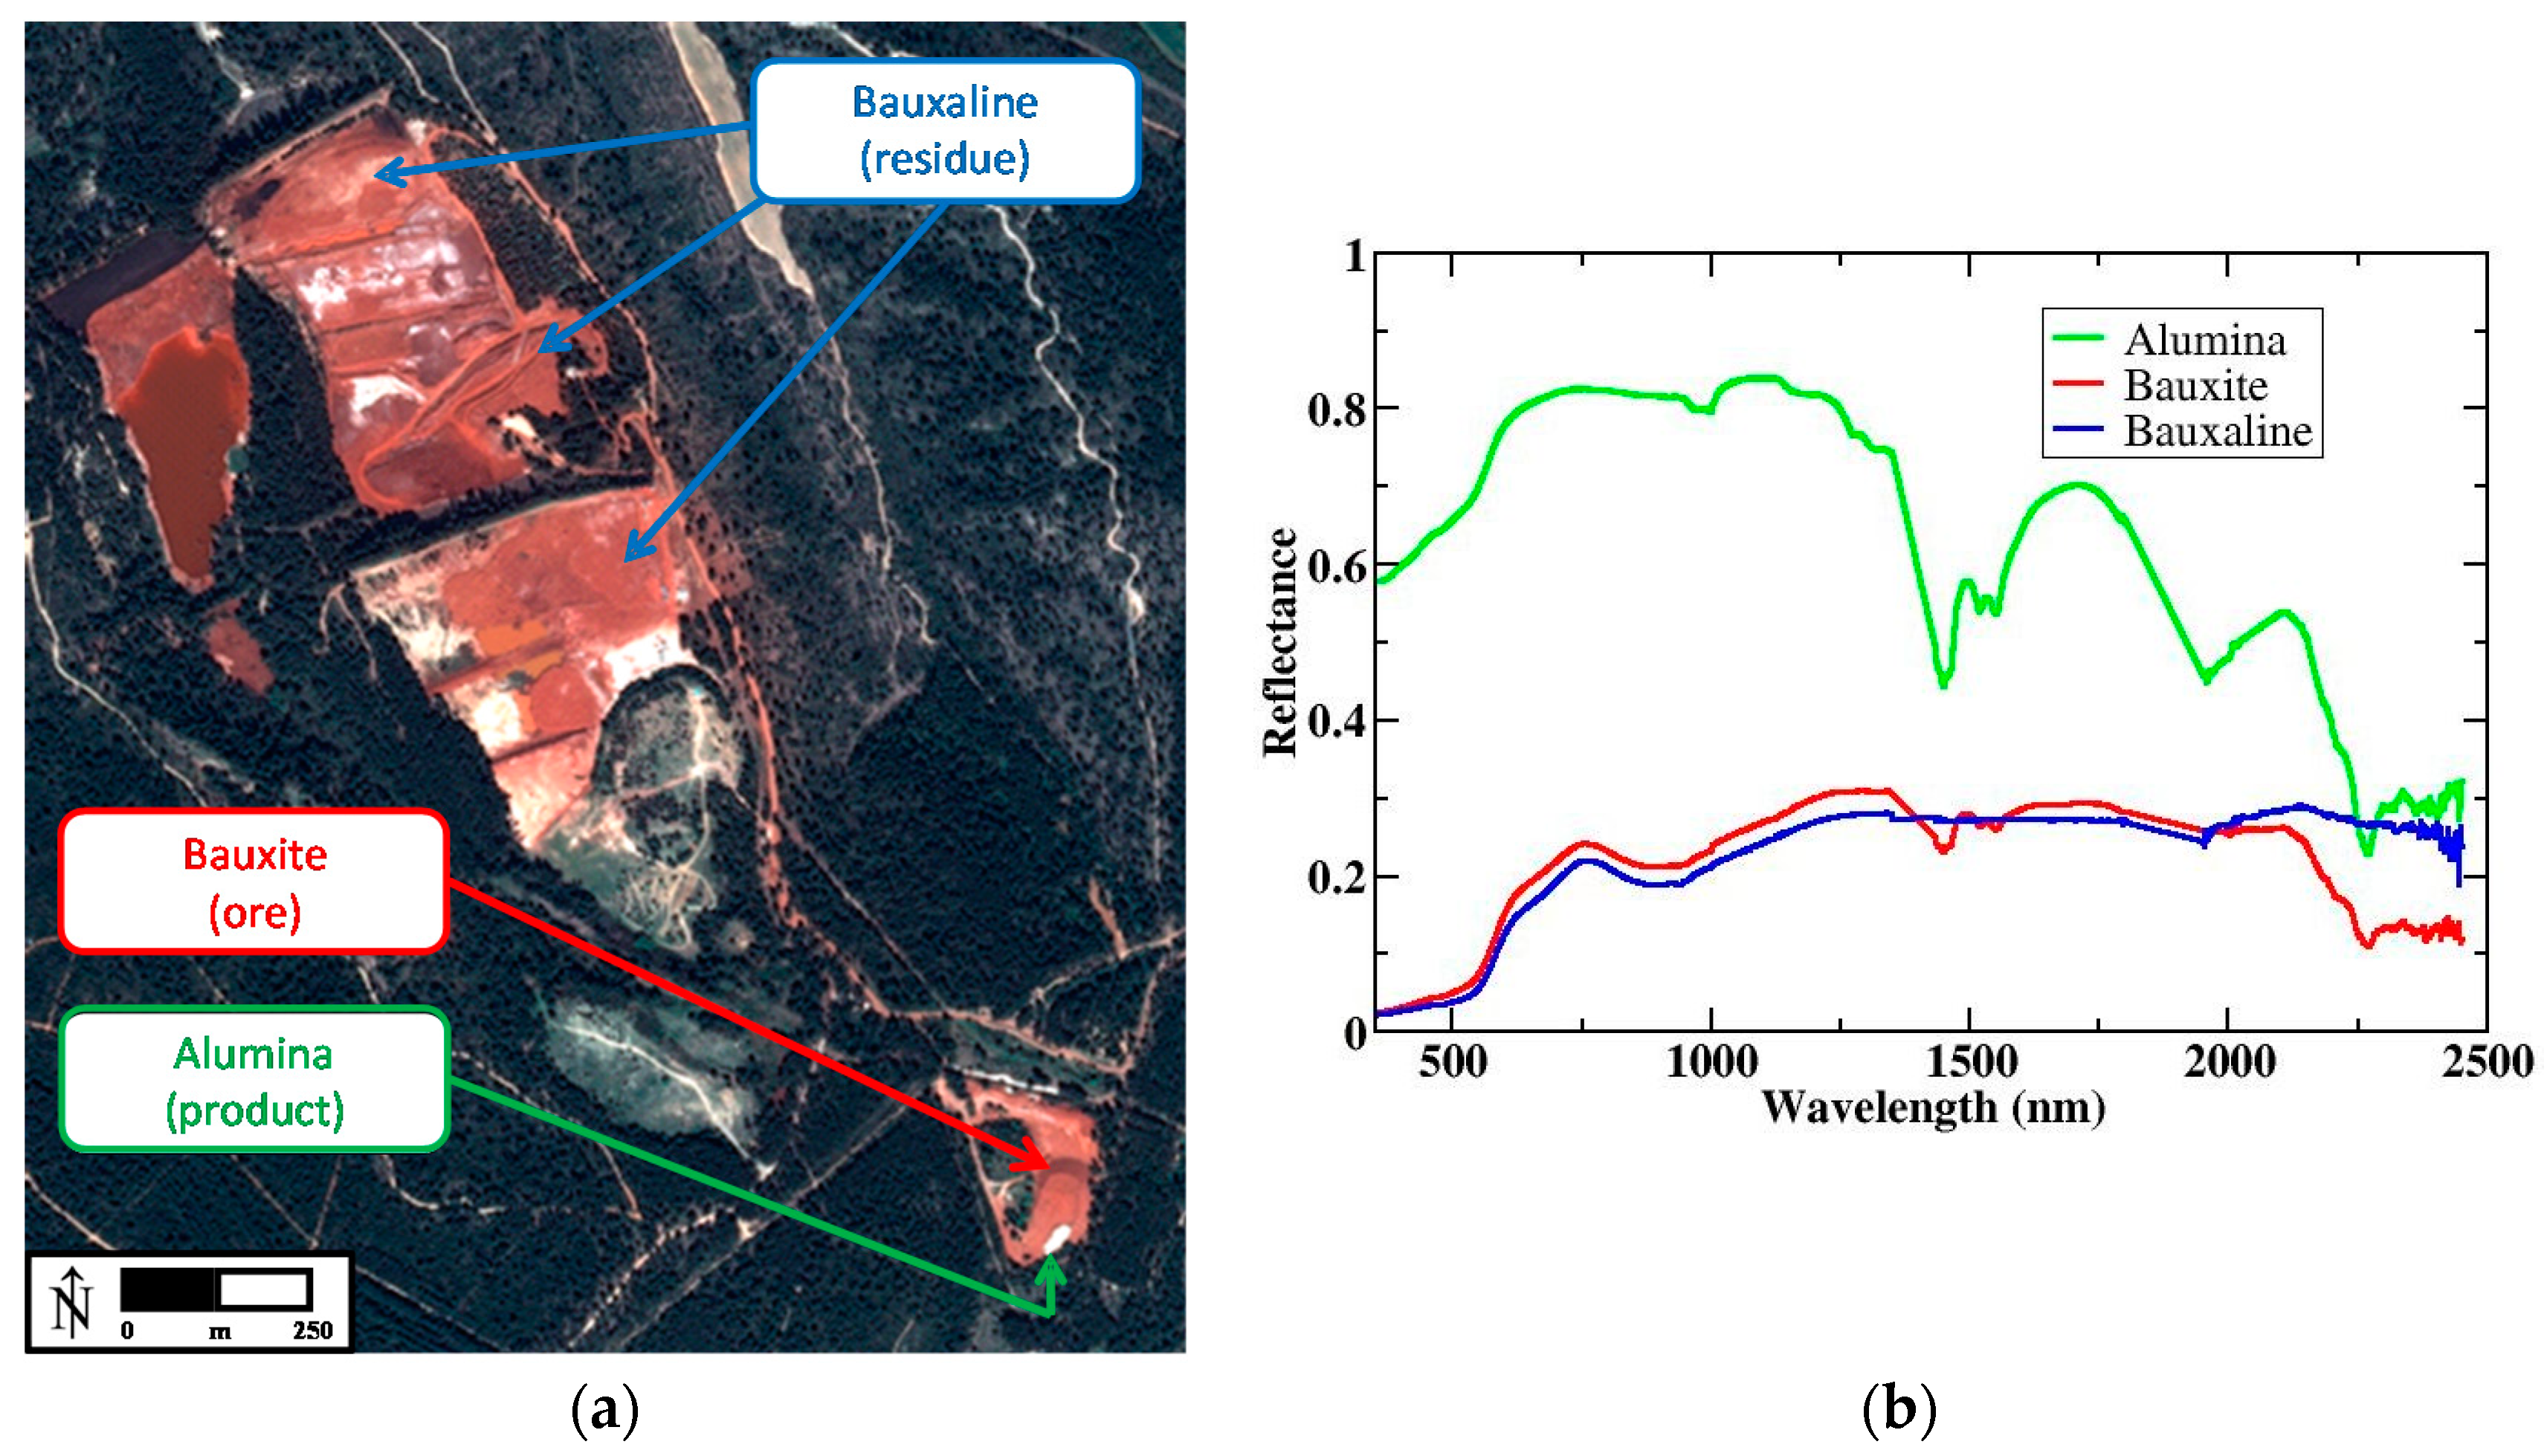
The Altéo Environnement site is dedicated to the extraction of alumina from bauxite, using the Bayer process [21,22]. Bauxite, the ore, is generally a mixture of hydrous aluminum oxides, aluminum hydroxides, clay minerals and insoluble materials such as quartz, hematite, magnetite, siderite and goethite. The aluminum minerals in bauxite can include gibbsite, boehmite and diaspore. The Bayer process converts bauxite ore to alumina (aluminum oxide) by digesting it via sodium hydroxide (NaOH), converting the aluminum oxide in the ore to sodium aluminate. The remaining insoluble residue or red mud (~45% liquor and ~55% solid mud), also called here Bauxaline®, is an alkaline, iron-rich by-product which is removed by means of flocculation and decantation [21,22,23,24]. The remaining solution is cooled and aluminum hydroxide precipitates. The final product is a dry, white anhydrous alumina powder, composed here of pure corindon. For the Altéo plant, the waste of the Bayer process is stored on the Mangegarri area. That is, one expects to identify and map stockpiles of ore (bauxite), processed alumina and heaps of red mud waste (Bauxaline®) as shown in Figure 2a.
The full characterization of these waste materials (red mud) needs to be understood to ensure the residue is safely disposed of and that suitable storage facilities are constructed. Red mud hazards include dust (fine particle size, highly alkaline, containing significant amounts of iron, aluminum, calcium and sodium plus trace amounts of various elements such as barium, boron, cadmium, chromium, cobalt, gallium, lead, scandium and vanadium [25]) that can potentially spread pollutants under windy conditions [26,27,28], long-term management and outdoor storage. Currently, the residual processed liquids are assessed to be of sufficient environmental quality to be allowed to be deposited in the Mediterranean Sea.
For validation purposes, soil samples and field reflectance spectra were acquired with an ASD FieldSpec® FR3 (Figure 2b). Sample compositions were determined using X-ray diffraction (XRD) and scanning electron microscopy (SEM), confirming the identification based on spectral analysis. The main spectral features observed in the VNIR at ~900 nm can be related to iron oxide, both for bauxite and Bauxaline®. In the SWIR, the Al-OH feature at ~2270 nm can be observed in the reflectance spectra of bauxite and alumina. Additionally, for bauxite, shoulders around 2160 nm and 2210 nm could be attributed to kaolinite, but are masked by the stronger Al-OH feature, indicating low kaolinite content (see Section 2.1.3 for a summary of main spectral characteristics).
2.1.2. Millennium Inorganic Chemicals and Séché éco Services plants, Thann, France
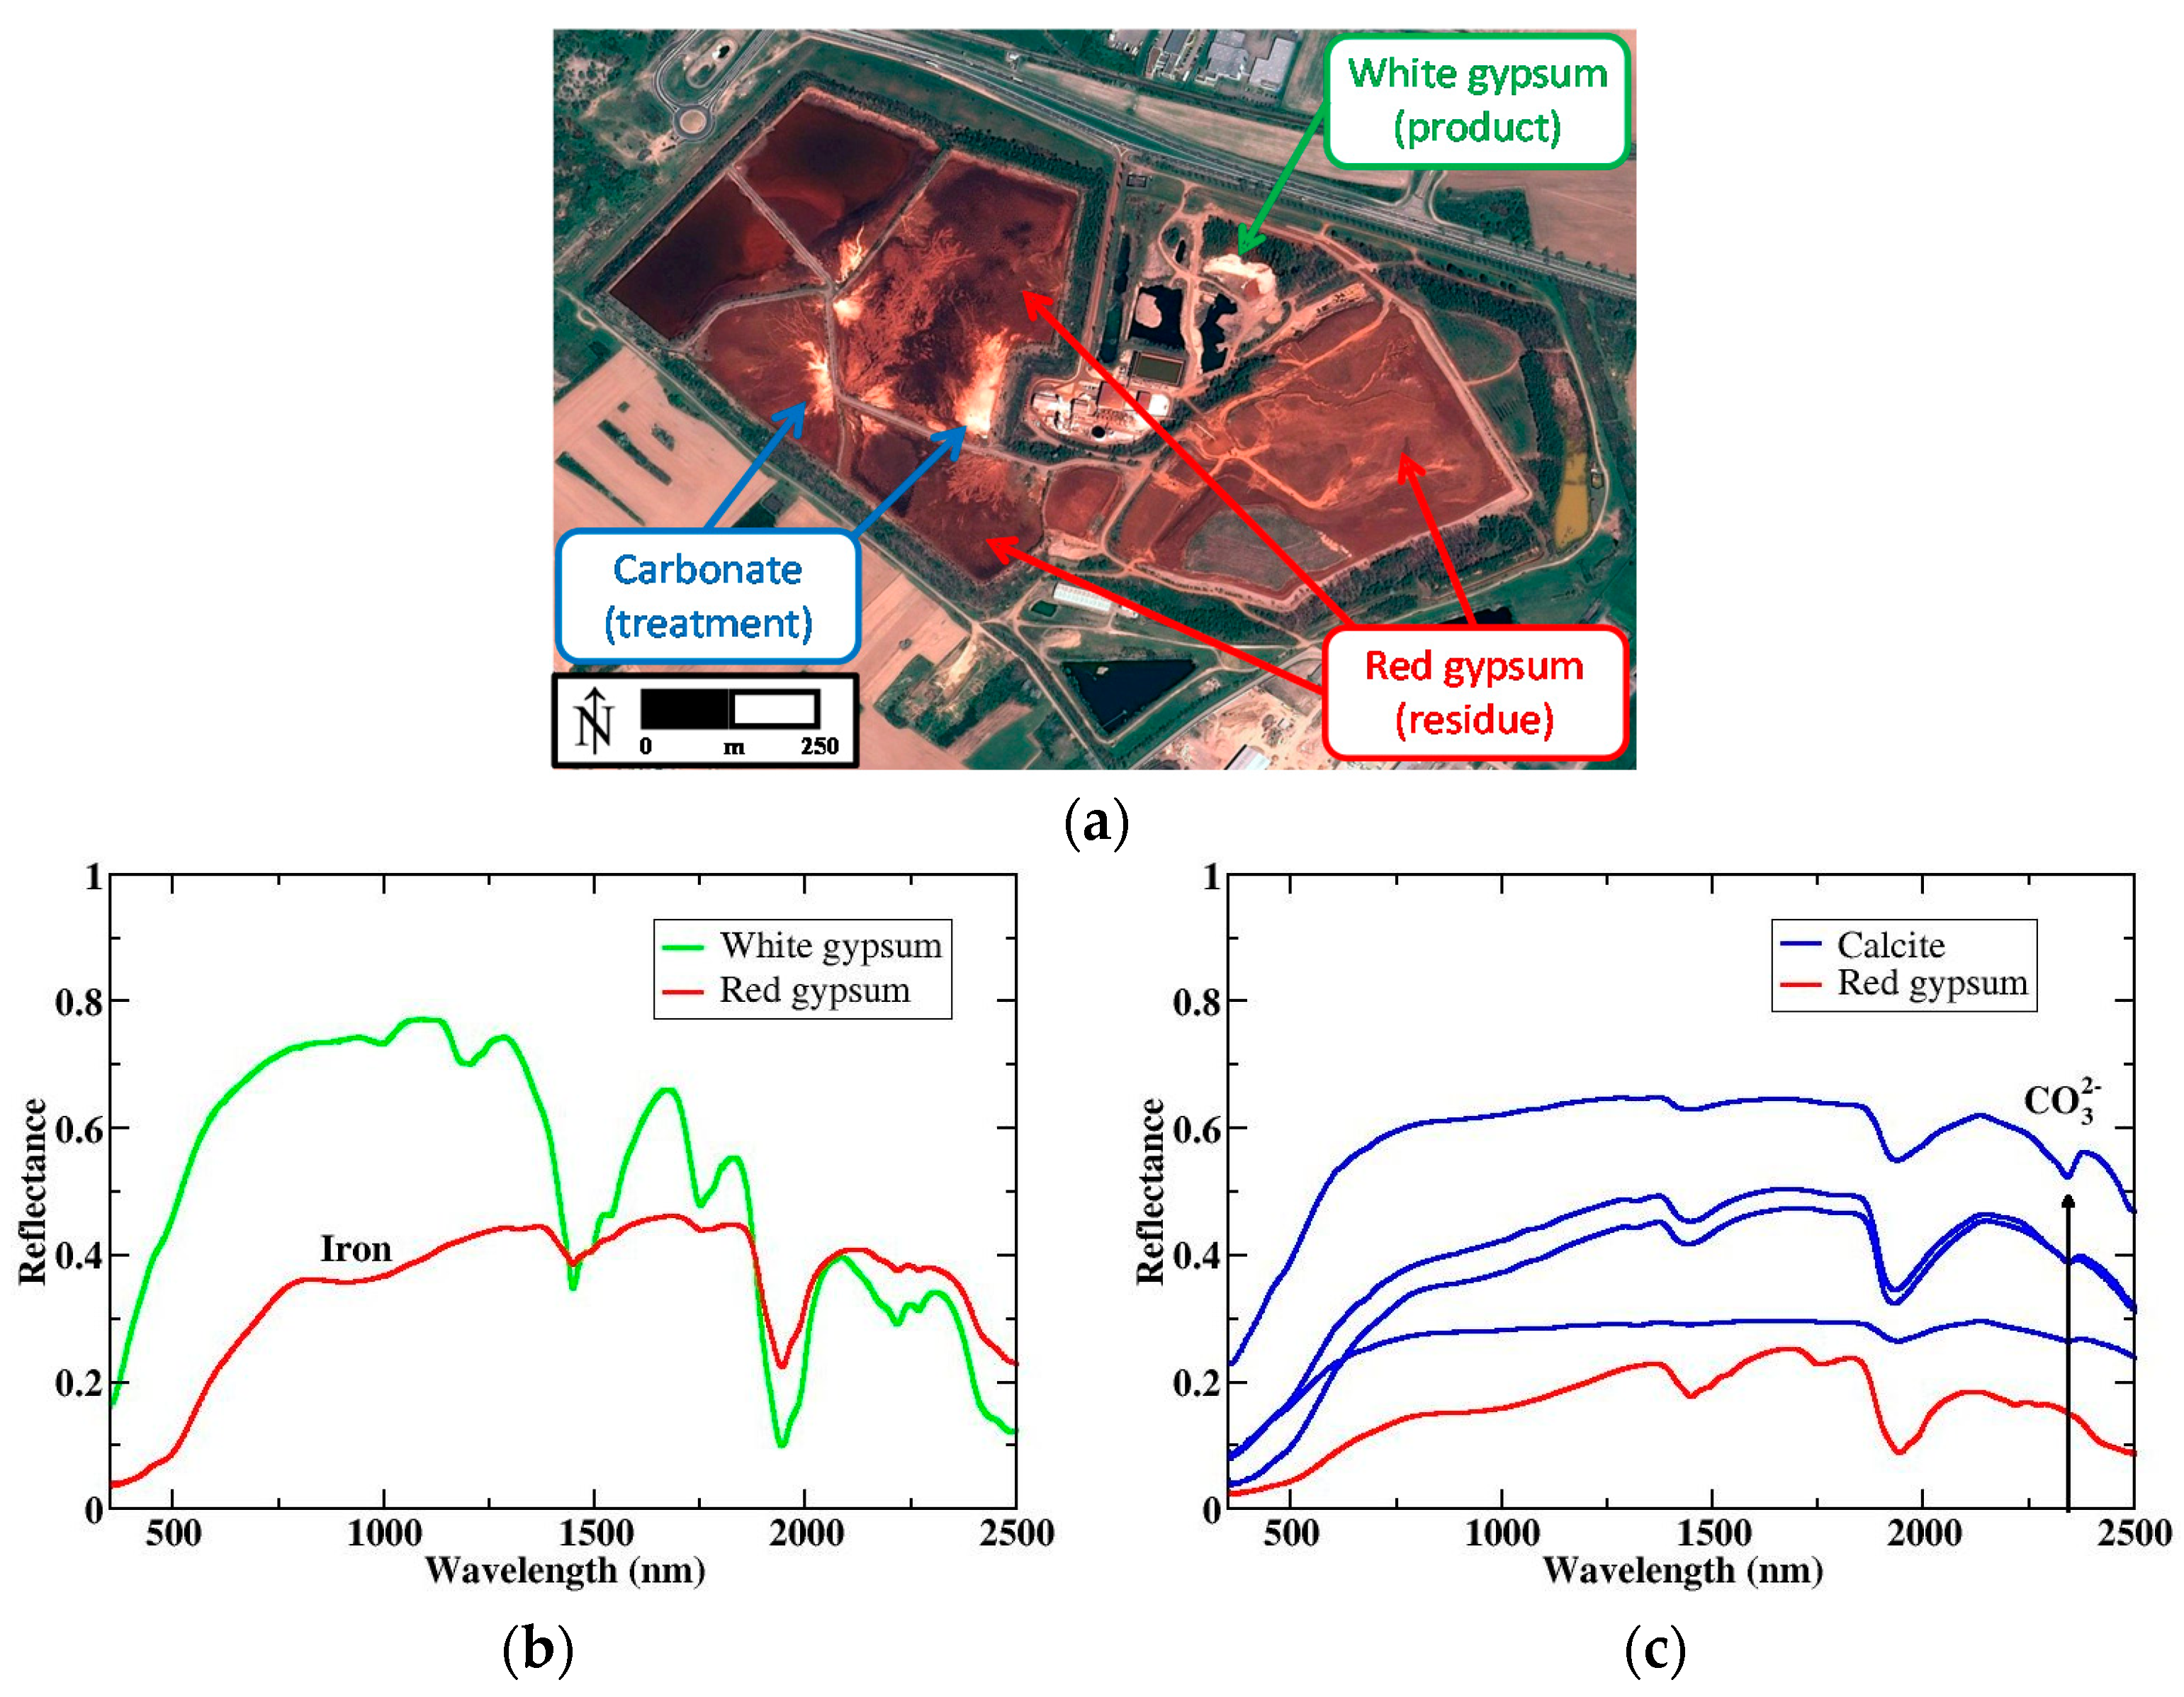
The Millennium Inorganic Chemicals plant produces titanium dioxide (TiO2) from ilmenite and rutile. It uses a sulfate-based process with sulfuric acid to extract and purify TiO2 in anatase crystal form. The associated Séché Éco Services plant is used to neutralize the resulting effluents. The neutralization step requires adding lime, or limestone, to the weak acid stream, generating a co-product called red gypsum—the red coloring being related to iron hydroxides. Thus, the main mineral components of this neutralization process are gypsum, iron oxide and carbonate (calcite), that we should then expect to identify and map on the Ochsenfeld waste storage area (Figure 3a).
Due to poor weather conditions at the time when we could access the site, samples were collected in the field and measured with the same ASD spectrometer in the laboratory (Figure 3b,c). Sample compositions were also determined using XRD and SEM, confirming the identification made based on spectral analysis.
As seen in Figure 3b, the main features correspond to gypsum whose characteristic absorption features are located at 1750, 2216 and 2265 nm, the diagnostic being the 1750 nm feature. As expected, the red gypsum spectrum exhibits the same features, but weaker, plus a VNIR feature around 1000 nm indicative of the iron charge transfer and crystal field. The spectral signature clearly shows the effect of the mixture of iron oxides (absorption ~1000 nm but flat spectrum in the SWIR) with gypsum.
Figure 3c shows a comparison between the spectrum of red gypsum and those of the series of samples collected in the dry lagoon, showing calcite in various proportions (the absorption at ~2300 nm is typical of carbonates). The change in strength of the typical absorption feature of calcite located at 2340 nm can be easily related to the change in percentage of calcite in this area. Similarly, the change of shape in the VNIR strongly correlates with the contribution of iron oxihydroxides. Wavelength positions of the characteristic absorption features of the minerals of interest for both sites are summarized in Section 2.1.3. Absorption features around 1400 nm and 1900 nm, indicative of H2O and OH stretching and bending fundamentals, are not considered here since we are working with airborne images for which these spectral regions are strongly affected by atmospheric water vapor absorption.
2.1.3. Summary of Wavelength Positions for the Main Characteristic Absorption Features for the Two Sites
The two sites appear similar on standard multispectral color composites. However, the industrial processes being different, the main minerals encountered are also different and can be mapped from their spectral signatures. For Gardanne, bauxite and alumina are characterized by the features at 1524 nm and 1551 nm related to OH stretching overtones and the Al-OH feature at 2270 nm. For bauxite, the spectrum also contains the iron 895 nm absorption feature, which is the only characteristic absorption observed in the Bauxaline® spectrum. For gypsum at Thann, the feature at 1750 nm is caused by OH− or H2O bending, stretching and rotational overtones, or S-O bending overtones; and those at 2178 nm and 2217 nm are caused by 3ν3 S-O or the OH/H2O combination and/or overtones. For red gypsum, the feature in the VNIR at 980 nm is also visible. Finally, the 2340 nm feature of calcite is due to Ca-CO3.
2.2. Methods
We describe hereafter the methodology we used to process the images for the spectral deconvolution and mapping of minerals of interest.
2.2.1. Atmospheric Correction of the Images
The hyperspectral images used for this study were, for Gardanne, HySpex VNIR and SWIR images acquired in September 2013, with a 0.5 m and a 2 m spatial resolution for the VNIR and SWIR respectively; and for Thann, an APEX image acquired in June 2013, with a 3 m spatial resolution. The HySpex images of Gardanne were atmospherically corrected using ATCOR4 [29]. The Quick Atmospheric Correction (QUAC) module included in the ENVI® software [30] was used for the APEX image over Thann because of instrumental calibration issues (D. Schläpfer and A. Hueni, personal communication).
Reflectance images were spatially down-sampled to improve the signal-to-noise ratio (SNR) and to limit the number of pixels in order to speed up computation of the mineral maps. Moreover, in the case of Gardanne, the down-sampling helped in dealing with the different pixel sizes of the VNIR and SWIR cameras. Hence, the HySpex VNIR and SWIR images for Gardanne had a 5 m spatial resolution and the APEX image for Thann had a 12 m spatial resolution.
Finally, since our main objective here was the identification of mineral markers in by-products or heaps of residues, vegetation and water pixels were masked using the HYSOMA toolbox [31] and only pixels located within the sites were considered (see masks defined in Section 3.1.2 and Section 3.2.2). Dealing with dust detection or quantification of constituents was a different issue which implied taking into account the problem of mixtures and accurate quantification (meaning adequate in situ measurements for validation), and will constitute our next step now that this simpler case of identification has been validated.
2.2.2. AGM Spectral Deconvolution Method
The method used in this study is the automated Gaussian model (AGM [20]), which allows for automatic identification and mapping of minerals and relies as much as possible on physical bases, using spectral deconvolution based on the MGM of Sunshine et al. [7], with no a priori knowledge for starting parameters. Originally developed for the SWIR, we extended it to the VNIR. In this current version, it runs for the full spectral range, from initialization using spectral derivatives to spectral deconvolution and mineral identification, with a global approach. The modeling combines exponential Gaussians [13,14], a continuum including the fundamental water absorption at 2800 nm and fall-off toward the ultraviolet (UV) range, and deals with overfitting to keep only the relevant Gaussians. Mineral identification is automatically done based on characteristic absorption feature positions for a series of typical industrial minerals. The AGM was successfully tested in the SWIR for 14 minerals representative of industrial environments (e.g., quarries, mines, industries) and more than 98% of the simulated spectra were correctly identified. It was also applied to two airborne visible/infrared imaging spectrometer (AVIRIS) images, including the famous Cuprite test site [20], with results consistent with ground truth data.
For this study, we extended it to include information from the VNIR to take iron oxides/hydroxides into account. For the continuum, we consider the original MGM model (a straight line in wavenumber characterized by a slope and an intercept) to which we add a Gaussian centered at 200 nm to model the fall-off toward the UV, the SWIR continuum model and the exponential Gaussians being unchanged. The spectral modeling can then be written as:
where
with the band center; the band width; Si the band strength; the band asymmetry; the band saturation; c0 the continuum offset; and c1 the continuum slope. GUV and GWATER are the Gaussians used to fit the fall-off observed in the UV and the SWIR [17]. The model is initialized using spectral derivatives and optimized using a least-squares minimization algorithm (Levenberg–Marquardt [32]). Overfitting is processed by using an iterative procedure based on a RMSE threshold. Once the parameters of the absorption features are estimated, they are used in the identification procedure.
2.2.3. Mineral Database and Identification Procedure
The identification procedure is based on an expert system that uses the Guides for Mineral Exploration (GMEX) approach such that it assumes that most minerals have a characteristic spectrum and, therefore, major (deepest) diagnostic absorption features with well-known wavelength positions [33]. These deepest absorptions can be associated with secondary diagnostic absorptions for final distinction between spectrally similar minerals. Here, absorption feature parameters (position, width, strength) are compared to a database of tabulated values (it is not the spectra themselves that are compared, but the values of their absorption parameters). The minerals considered in the database are alunite, alumina, calcite, Fe-chlorite, Mg-chlorite, dolomite, gibbsite, buddingtonite, gypsum, illite, jarosite, kaolinite, montmorillonite, nontronite, talc, for the SWIR domain; and we added, for the VNIR, iron-bearing minerals (goethite, jarosite, hematite) and rare earth elements (light REE: neodymium, heavy REE: erbium).
3. Results
At both sites, the AGM was first applied to spectra of pixels representative of the surfaces of interest, of which reflectance spectra were acquired in the field or from samples. The purpose was to validate the approach before running it on the images. In this study, the VNIR and SWIR were treated separately for two reasons. Firstly, we wanted to evaluate the performances of the algorithm on each spectral range separately, the physical processes causing the spectral signatures of minerals in the VNIR (absorptions caused by charge transfers and crystal field, general shape influenced by scattering, grain size, illumination, etc.) and, in the SWIR (absorptions resulting from overtones and combinations of fundamental absorptions related to vibration/rotation of bonds, general shape more influenced by moisture) being different, thus leading to different absorption and continuum shapes (often broad in the VNIR and narrow in the SWIR). Secondly, we wanted to take into account the different characteristics of the images coming from separate instruments covering the VNIR and the SWIR, as is the case for the HySpex cameras used over the site of Gardanne which acquire images with a different spatial resolution. Note that the asymmetry and saturation parameters were not taken into account at this stage as our goal was first to assess the performance of the algorithm with minimum parameters.
3.1. Mineral Identification at Gardanne
3.1.1. AGM Spectral Deconvolution Results
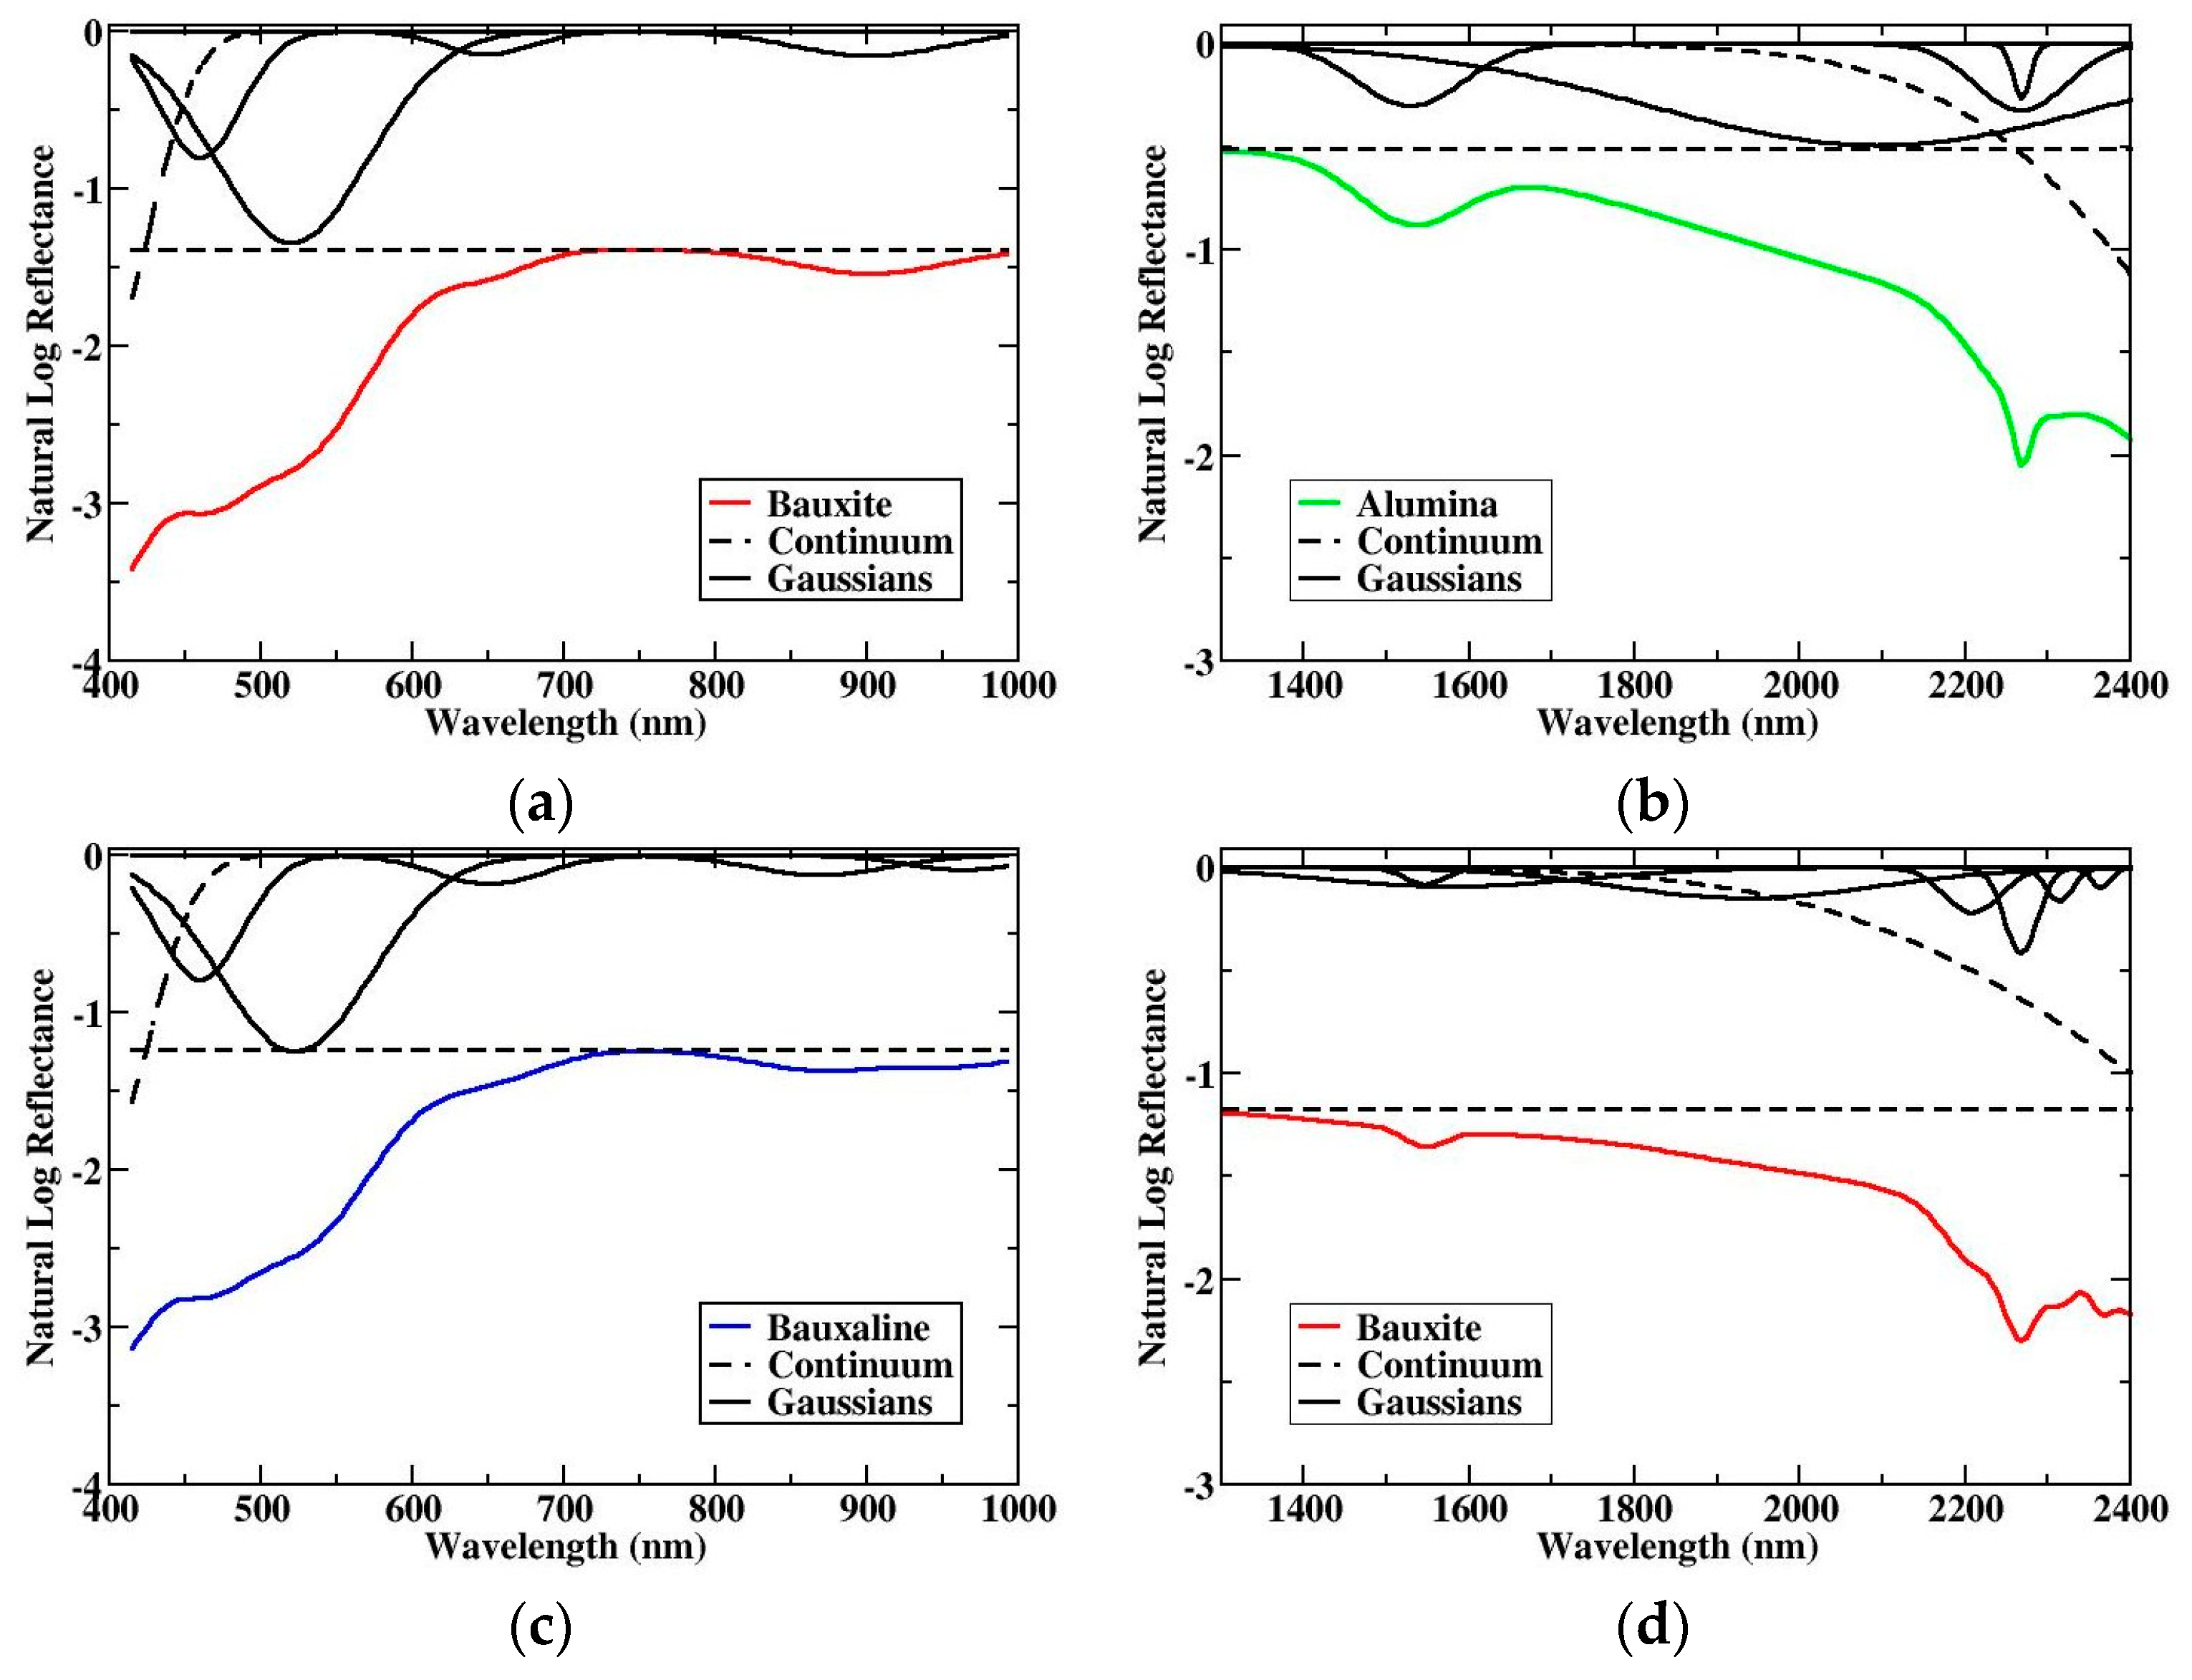
For the Gardanne site (Figure 4), bauxite, Bauxaline® and alumina are identified. Moreover, the spectral signature of the bauxite ore allows identifying its mineralogy as gibbsite, which can be processed more easily at relatively low pressure [34]. Other techniques such as atomic absorption spectroscopy or X-ray fluorescence cannot directly discriminate minerals of similar atomic composition such as gibbsite, boehmite and diaspore [35], but they can be easily discriminated with NIR spectroscopy as shown here. Identifications were consistent with in situ measurements.
In the VNIR, identical deconvolution results are obtained for bauxite and Bauxaline® because of the presence of iron, identified as hematite based on the position of the absorption feature ~870 nm. Note the difficulty of estimating simultaneously c1 and GUV, the algorithm tending to favor the Gaussian. In the SWIR, there is a clear identification of the Al-OH features typical of gibbsite for both bauxite and alumina, while Bauxaline® shows a “flat” spectrum, consistent with its composition as a residue.
3.1.2. Maps
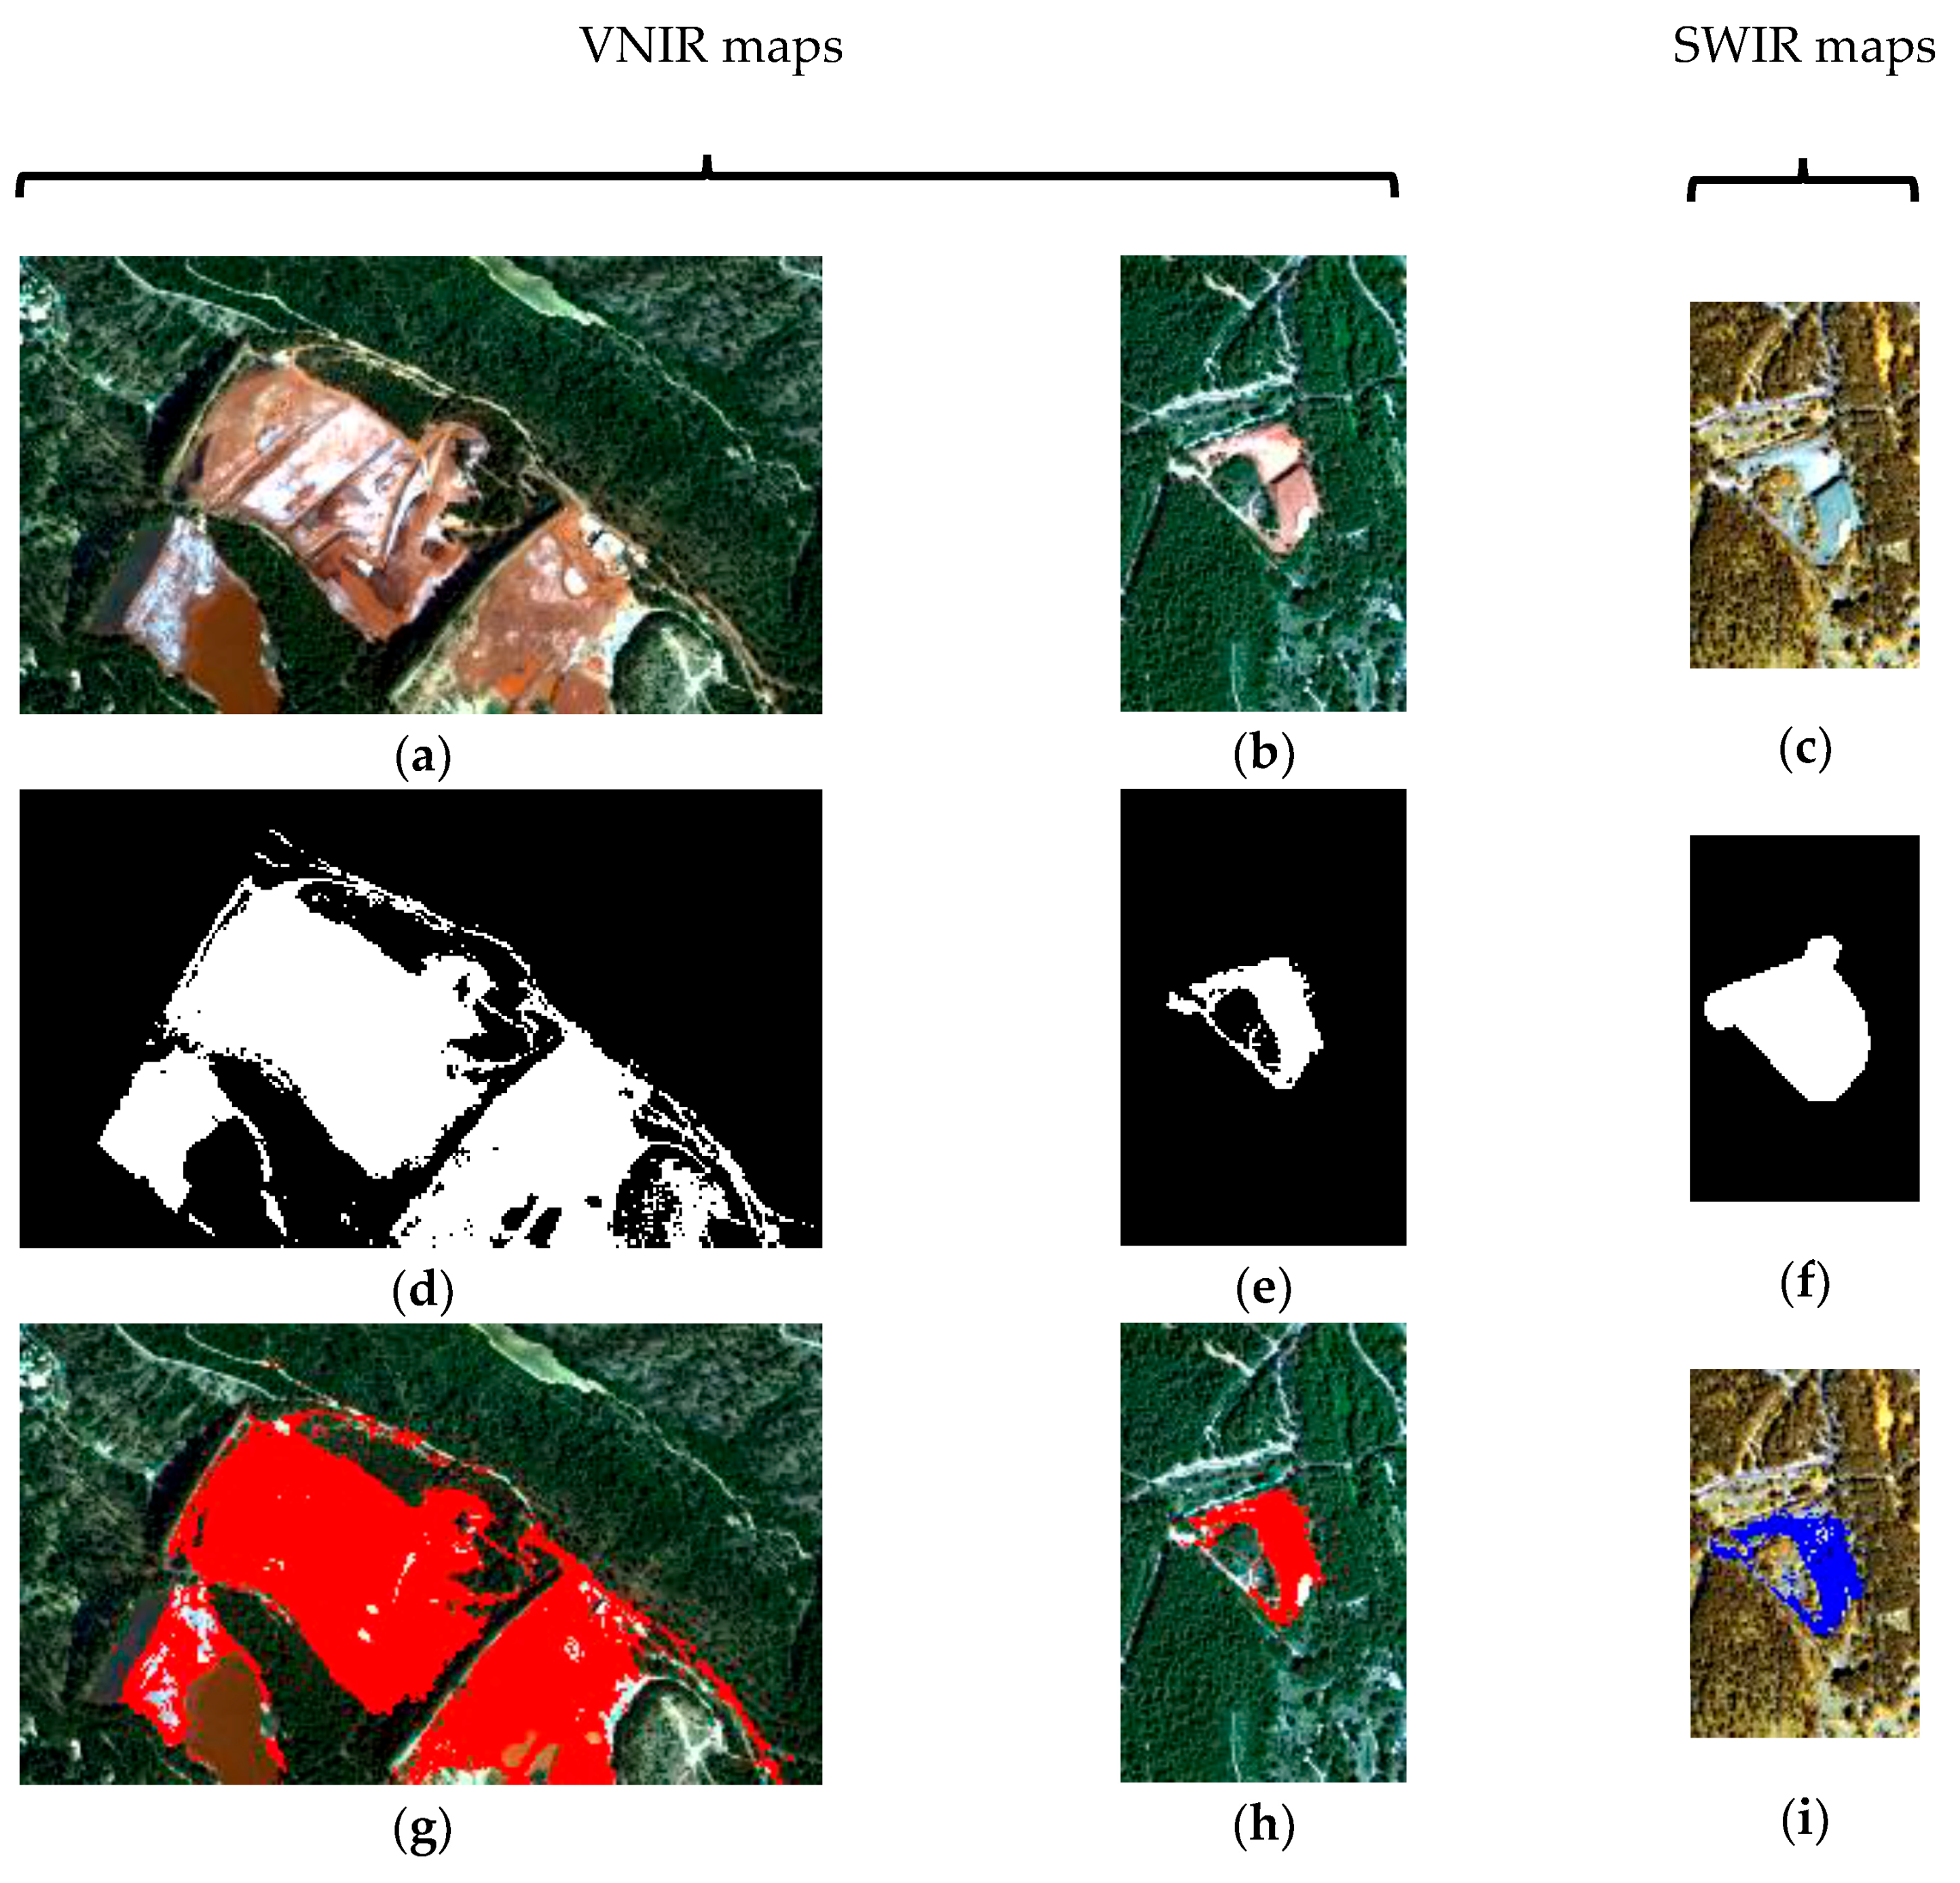
When applied to the images, pixels containing bauxite and/or Bauxaline® are well located using the VNIR absorption feature attributable to iron, around 890 nm (Figure 5g,h). Similarly, pixels containing bauxite and/or alumina are identified based on the Al-OH absorption feature in the SWIR at ~2270 nm (Figure 5i). Minerals of interest can then be identified when combining the results in the VNIR and SWIR, using the following identification key: pixels in red on the VNIR map and in blue on the SWIR map contain bauxite (iron absorption in the VNIR plus Al-OH absorption in the SWIR); pixels in red in the VNIR and not colored in the SWIR contain Bauxaline® (iron absorption only); while pixels in blue in the SWIR and not colored in the VNIR contain alumina (no iron absorption, Al-OH only). These results are consistent with in situ observations. Combining VNIR and SWIR results leads to the clear identification and mapping of all three constituents, despite some common features. The resulting maps clearly lead to the identification of the site as being dedicated to the extraction of alumina from bauxite, the type of which can be specified as gibbsite based on its spectral characteristics.
3.2. Mineral Identification at Thann
3.2.1. AGM Spectral Deconvolution Results
For Thann, red and white gypsum and calcite were clearly identified and mapped (Figure 6). In the VNIR, the iron feature was clearly identified for red gypsum while no absorptions were present for white gypsum and calcite. Note that here c1 could be estimated because there was no fall-off toward the UV due to GUV. In the SWIR, similar deconvolutions were logically obtained for red and white gypsum and the carbonate feature at 2330 nm was also clearly identified. Combining VNIR and SWIR results allows for separation between red and white gypsum.
3.2.2. Maps
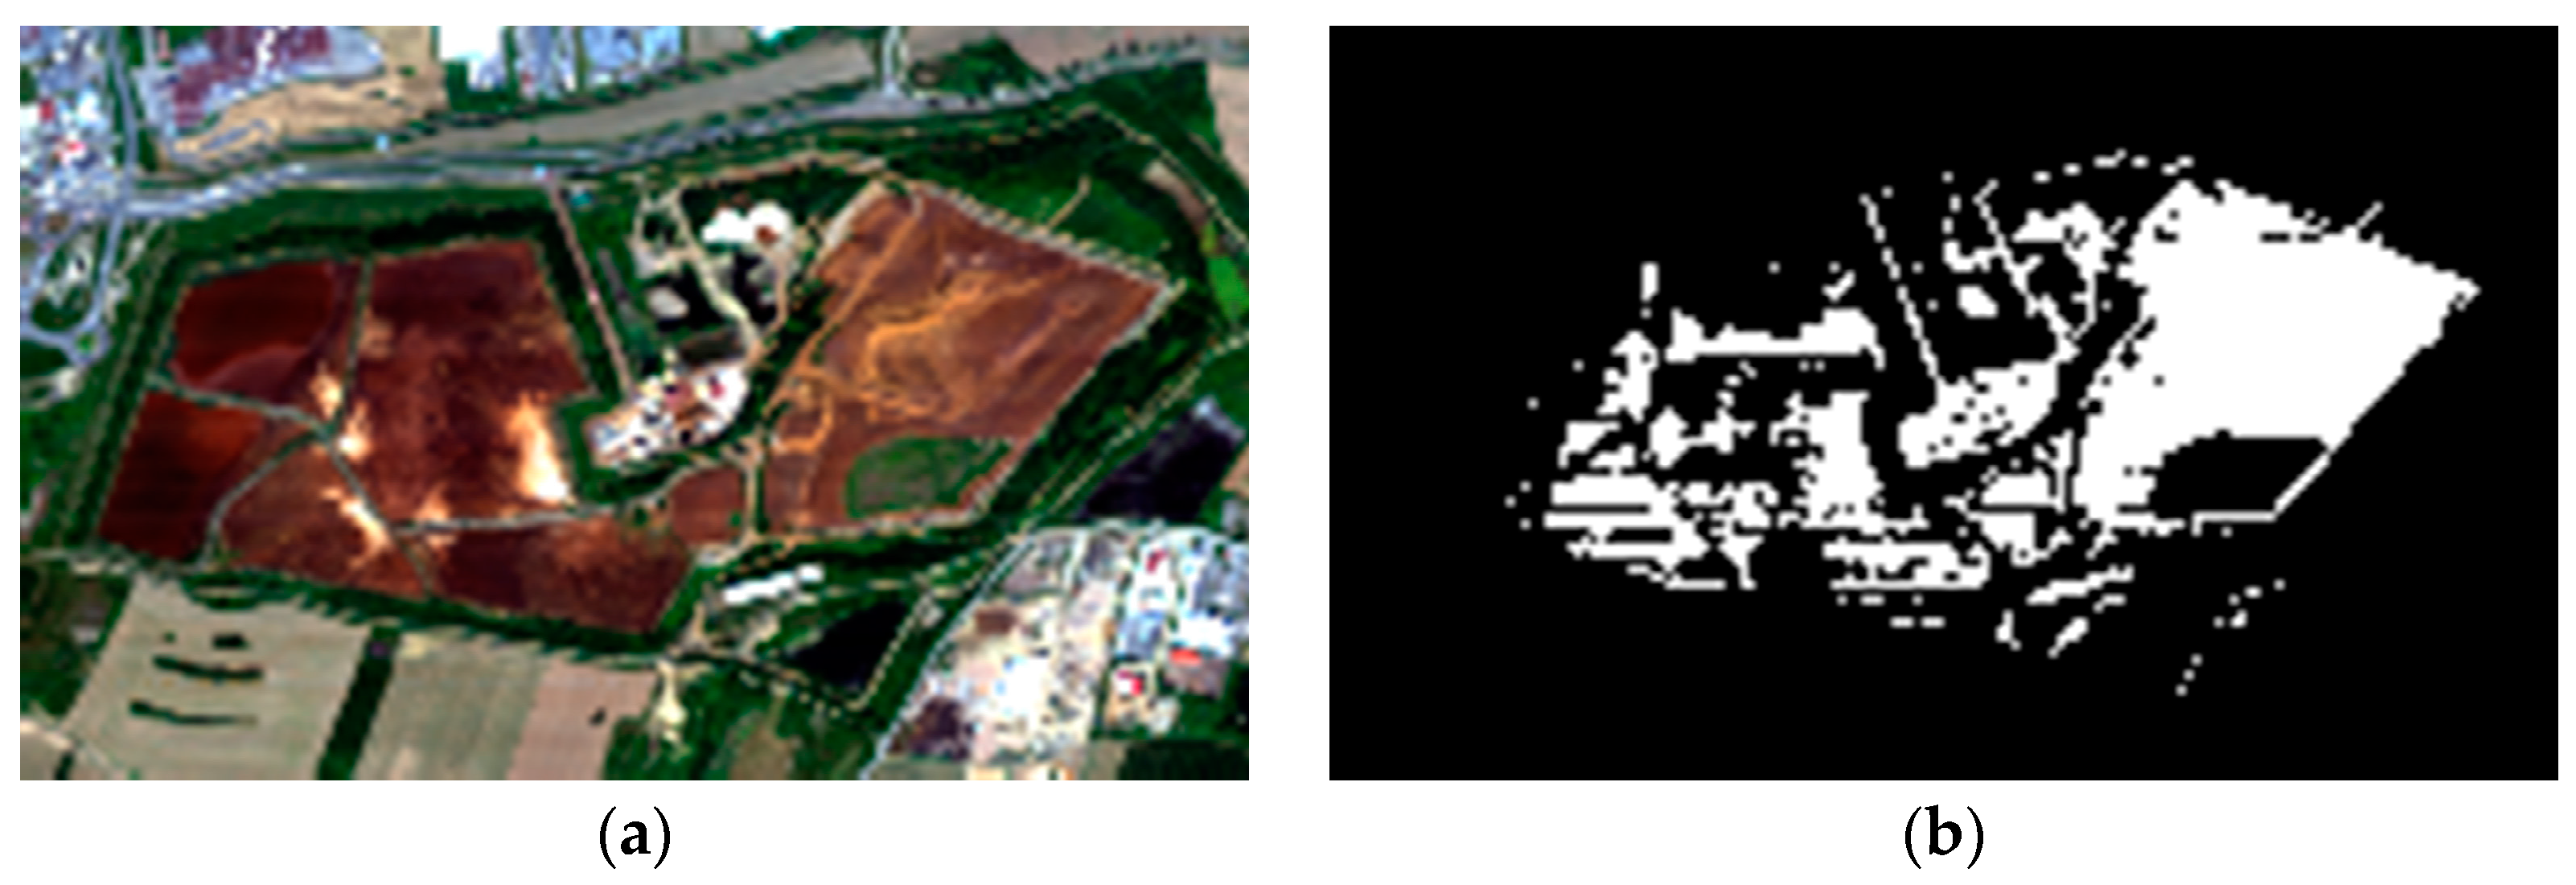
When applied to the APEX image, pixels containing red gypsum are well identified based on the iron absorption in the VNIR (red pixels, Figure 7c) and the ~1750 nm feature typical of gypsum in the SWIR (green pixels, Figure 7d). The white areas on the color composite (Figure 7a) are clearly separated into gypsum and carbonate based on their characteristic features in the SWIR (green pixels for gypsum versus blue pixels for carbonate, Figure 7d). Here again, combining VNIR and SWIR information and diagnostic band position detection leads to the identification and mapping of minerals of interest at this site despite some common features of the color composite images. The clear identification of red and white gypsum (sulfates) as well as carbonates (buffer) in the residues of the Thann site points to the probable use of sulfuric acid in the process. One can notice that this conclusion is also valid when comparing the two sites which both present some “white” and “red” constituents that could be confused based on the color composite but are clearly identified as different minerals thanks to their diagnostic absorption features.
4. Conclusions
Imaging spectroscopy allows for identification and mapping of minerals which can be used as markers for industrial processes. In this study, we have used the automatized Gaussian model, a physical approach based on spectral deconvolution which does not require any a priori knowledge for starting parameters and, therefore, is not site specific like most statistical approaches such as partial least-squares regression (PLSR). This approach also does not require an extensive spectral library of measurements as mineral identification after deconvolution is performed using the wavelength positions of the main characteristic absorption features. It has been tested with success to identify and map minerals of interest characteristic of two French industrial sites looking similar on standard color composites: bauxite, Bauxaline® and alumina for Gardanne, red and white gypsum and calcite for Thann. Despite the apparent similarities, the mineral markers identified and mapped with the AGM, validated by in situ observations, allow for a clear discrimination between the industrial processes of each site. The process in Gardanne is clearly identified from the residues, while only partially in Thann (no stockpile of product available). Moreover, this approach could also provide information on concentrations using the output absorption depth (Gaussian strength) and width (Gaussian full width at half maximum (FWHM)) and relating them to experimental results obtained in a controlled environment. Spectral deconvolution has also demonstrated being a powerful tool for separating overlapping features and, therefore, doe dealing with mineral mixtures. This is one of our main future objectives which include extension of the method to mining environments and testing the potential and accuracy of the outputs for quantitative estimations first by using spectral measurements in a controlled environment. The quality, accuracy and reliability of the results depend mostly on the reference table where the band positions are stored as well as the characteristics (spectral, radiometric, SNR) of the sensor used. A complete sensitivity analysis will allow us to quantify the performance of this algorithm more accurately.
Acknowledgments
The authors acknowledge the French Direction Générale de l’Armement for funding the campaign over Gardanne and the Flemish institute for technological research VITO for the acquisition of the APEX image over Thann. Altéo Environnement and Séché éco Services sites are thanked for their collaboration.
Conflicts of Interest
The authors declare no conflict of interest.
References
- Swayze, G.A.; Smith, K.S.; Clark, R.N.; Sutley, S.J.; Pearson, R.M.; Vance, J.S.; Hageman, P.L.; Briggs, P.H.; Meier, A.L.; Singleton, M.J.; et al. Using Imaging Spectroscopy to Map Acidic Mine Waste. Environ. Sci. Technol. 2000, 34, 47–54. [Google Scholar] [CrossRef]
- Mars, J.C.; Crowley, J.K. Mapping mine wastes and analyzing areas affected by selenium-rich water runoff in southeast Idaho using AVIRIS imagery and digital elevation data. Remote Sens. Environ. 2003, 84, 422–436. [Google Scholar] [CrossRef]
- Rockwell, B.W.; McDougal, R.R.; Gent, C.A. Remote Sensing for Environmental Site Screening and Watershed Evaluation in Utah Mine Lands—East Tintic Mountains, Oquirrh Mountains, and Tushar Mountains; U.S. Geological Survey Scientific Investigations Report 2004-5241; USGS: Denver, CO, USA, 2005. [Google Scholar]
- Zabcic, N.; Rivard, B.; Ong, C.; Mueller, A. Using airborne hyperspectral data to characterize the surface pH and mineralogy of pyrite mine tailings. Int. J. Appl. Earth Obs. Geoinf. 2014, 32, 152–162. [Google Scholar] [CrossRef]
- Asadzadeh, S.; de Souza Filho, C.R. A review on spectral processing methods for geological remote sensing. Int. J. Appl. Earth Obs. Geoinf. 2016, 47, 69–90. [Google Scholar] [CrossRef]
- Clark, R.N.; Swayze, G.A.; Livo, K.E.; Kokaly, R.F.; Sutley, S.J.; Dalton, J.B.; McDougal, R.R.; Gent, C.A. Imaging spectroscopy: Earth and planetary remote sensing with the USGS Tetracorder and expert systems. J. Geophys. Res. Planets 2003, 108, 5.1–5.44. [Google Scholar] [CrossRef]
- Sunshine, J.M.; Pieters, C.M.; Pratt, S.F. Deconvolution of Mineral Absorption Bands: An Improved Approach. J. Geophys. Res. Planets 1990, 95, 6955–6966. [Google Scholar] [CrossRef]
- Sunshine, J.M.; Pieters, C.M. Estimating modal abundances from the spectra of natural and laboratory pyroxene mixtures using the modified gaussian model. J. Geophys. Res. Planets 1993, 98, 9075–9087. [Google Scholar] [CrossRef]
- Brown, A. Spectral Curve Fitting for Automatic Hyperspectral Data Analysis. IEEE Trans. Geosci. Remote Sens. 2006, 44, 1601–1608. [Google Scholar] [CrossRef]
- Gallie, E.A.; Lyder, D.A.; Rivard, B.; Cloutis, E.A. Technical note: equivalence of modified gaussian model (mgm) in wavenumber and gaussian in wavelength for deconvolution of hyperspectral reflectance spectra. Int. J. Remote Sens. 2008, 29, 4089–4096. [Google Scholar] [CrossRef]
- Makarewicz, H.D.; Parente, M.; Bishop, J.L. Deconvolution of VNIR Spectra Using Modified Gaussian Modeling (MGM) with Automatic Parameter Initialization (API) Applied to CRISM. In Proceedings of the Workshop on Hyperspectral Image and Signal Processing: Evolution in Remote Sensing (WHISPERS), Grenoble, France, 26–28 August 2009; pp. 1–5. [Google Scholar]
- Bishop, J.L.; Gates, W.P.; Makarewicz, H.D.; McKeown, N.K.; Hiroi, T. Reflectance Spectroscopy of Beidellites and Their Importance for Mars. Clays Clay Miner. 2011, 59, 378–399. [Google Scholar] [CrossRef]
- Pompilio, L.; Pedrazzi, G.; Sgavetti, M.; Cloutis, E.A.; Craig, M.A.; Roush, T.L. Exponential Gaussian Approach for Spectral Modeling: The Ego Algorithm I. Band Saturation. Icarus 2009, 201, 781–794. [Google Scholar] [CrossRef]
- Pompilio, L.; Pedrazzi, G.; Cloutis, E.A.; Craig, M.A.; Roush, T.L. Exponential Gaussian Approach for Spectral Modelling: The EGO Algorithm II. Band Asymmetry. Icarus 2010, 208, 811–823. [Google Scholar] [CrossRef]
- Clark, R.N.; Roush, T.L. Reflectance spectroscopy: Quantitative analysis techniques for remote sensing applications. J. Geophys. Res. Solid Earth 1984, 89, 6329–6340. [Google Scholar] [CrossRef]
- Clénet, H.; Pinet, P.; Daydou, Y.; Heuripeau, F.; Rosemberg, C.; Baratoux, D.; Chevrel, S. A New Systematic Approach Using the Modified Gaussian Model: Insight for the Characterization of Chemical Composition of Olivines, Pyroxenes and Olivine–Pyroxene Mixtures. Icarus 2011, 213, 404–422. [Google Scholar] [CrossRef]
- Whiting, M.L.; Li, L.; Ustin, S.L. Predicting Water Content Using Gaussian Model on Soil Spectra. Remote Sens. Environ. 2004, 89, 535–552. [Google Scholar] [CrossRef]
- Verpoorter, C.; Kutser, T.; Lars, T. Automated Mapping of Water Bodies Using Landsat Multispectral Data. Limnol. Oceanogr. Methods 2012, 10, 1037–1050. [Google Scholar] [CrossRef]
- Verpoorter, C.; Carrère, V.; Combe, J.-P. Visible, near-infrared spectrometry for simultaneous assessment of geophysical sediment properties (water and grain size) using the spectral derivative-modified gaussian model. J. Geophys. Res. Earth Surf. 2014, 119, 2098–2122. [Google Scholar] [CrossRef]
- Brossard, M.; Marion, R.; Carrére, V. Deconvolution of SWIR reflectance spectra for automatic mineral identification in hyperspectral imaging. Remote Sens. Lett. 2016, 7, 581–590. [Google Scholar] [CrossRef]
- Hind, A.R.; Bhargava, S.K.; Grocott, S.C. The surface chemistry of Bayer process solids: A review. Colloids Surf. A Physicochem. Eng. Asp. 1999, 146, 359–374. [Google Scholar] [CrossRef]
- Jamialahmadi, M.; Muller-Steinhagen, H. Determining Silica Solubility in Bayer Process Liquor. (Research Summary). J. Miner. Met. Mater. Soc. 1998, 50, 44–49. [Google Scholar]
- Chevdov, D.; Ostap, S.; Le, T. Surface properties of red mud particles from potentiometric titration. Colloids Surf. 2001, 182, 131–141. [Google Scholar] [CrossRef]
- Palmer, S.J.; Frost, R.L. Characterisation of bauxite and seawater neutralised bauxite residue using XRD and vibrational spectroscopic techniques. J. Mater. Sci. 2008, 44, 55–63. [Google Scholar] [CrossRef]
- Gelencser, A.; Kovats, N.; Turoczi, B.; Rostasi, A.; Hoffer, A.; Imre, K.; Nyiro-Kosa, I.; Csakberenyi-Malasics, D.; Toth, A.; Czitrovszky, A.; et al. The Red Mud Accident in Ajka (Hungary): Characterization and Potential Health Effects of Fugitive Dust. Environ. Sci. Technol. 2011, 45, 1608–1615. [Google Scholar] [CrossRef] [PubMed]
- Varnavas, S.; Achilleopoulos, P. Factors controlling the vertical and spatial transport of metal-rich particulate matter in seawater at the outfall of bauxitic red mud toxic waste. Sci. Total Environ. 1995, 175, 199–205. [Google Scholar] [CrossRef]
- Mymrin, V.A.; Vazquez-Vaamonde, A.J. Red mud of aluminium production waste as basic component of new construction materials. Waste Manag. Res. 2001, 19, 465–469. [Google Scholar] [CrossRef] [PubMed]
- Pascucci, S.; Belviso, C.; Cavalli, R.M.; Palombo, A.; Pignatti, S.; Santini, F. Using imaging spectroscopy to map red mud dust waste: The Podgorica Aluminum Complex case study. Remote Sens. Environ. 2012, 123, 139–154. [Google Scholar] [CrossRef]
- Richter, R.; Schläpfer, D. ATCOR-4 User Guide; Version 7.0.3; DLR: Wessling, Germany; ReSe Applications: Wil, Switzerland, 2016. [Google Scholar]
- Bernstein, L.S.; Jin, X.; Gregor, B.; Adler-Golden, S. Quick Atmospheric Correction Code: Algorithm Description and Recent Upgrades. Opt. Eng. 2012, 51, 111719-1–111719-11. [Google Scholar] [CrossRef]
- Chabrillat, S.; Eisele, A.; Guillaso, S.; Rogaß, C.; Ben-Dor, E.; Kaufmann, H. HYSOMA: An easy-to-use software interface for soil mapping applications of hyperspectral imagery. In Proceedings of the EARSeL 7th SIG—Imaging Spectroscopy Workshop, Edinburgh, UK, 11–13 April 2011. [Google Scholar]
- Schlä, J.J. The Levenberg-Marquardt algorithm: implementation and theory. In Numerical Analysis; Lecture Notes in Mathematics; Springer: Berlin/Heidelberg, Germany, 1978; Volume 630, pp. 105–106. [Google Scholar]
- Pontual, S.; Merry, N.; Gamson, P. GMEX: Guides for Mineral Exploration: Spectral Interpretation Field Manual; AusSpec: Queenstown, New Zealand, 2010. [Google Scholar]
- Alteo. Products and Production. Available online: https://www.alteo-alumina.com/en/our-production-processes#Digestion%20of%20Bauxite (accessed on 18 January 2018).
- McArthur, L.; Greensill, C. Comparison of two NIR systems for quantifying kaolinite in weipa bauxites. Meas. Sci. Technol. 2007, 18, 3463–3470. [Google Scholar] [CrossRef]
Figure 1.
Localization and general view of Gardanne and Thann test sites.

Figure 2.
(a) Mangegarri waste storage area (Altéo); and (b) field spectra of the main materials. Mangegarri area extension is about 0.5 × 1.5 km2.
Figure 2.
(a) Mangegarri waste storage area (Altéo); and (b) field spectra of the main materials. Mangegarri area extension is about 0.5 × 1.5 km2.

Figure 3.
(a) Ochsenfeld waste storage area (Séché); and laboratory spectra of main materials: (b) red and white gypsum; (c) samples presenting a mixture of calcite and iron oxihydroxides in various proportions compared to red gypsum. The Ochsenfeld extension is about 0.5 × 1.0 km2.
Figure 3.
(a) Ochsenfeld waste storage area (Séché); and laboratory spectra of main materials: (b) red and white gypsum; (c) samples presenting a mixture of calcite and iron oxihydroxides in various proportions compared to red gypsum. The Ochsenfeld extension is about 0.5 × 1.0 km2.

Figure 4.
Results of automatized Gaussian model (AGM) deconvolution for representative image spectra. Left: visible and near-infrared (VNIR) (a) bauxite and (c) bauxaline®. Right: short-wavelength infrared (SWIR) (c) alumina and (d) bauxite.
Figure 4.
Results of automatized Gaussian model (AGM) deconvolution for representative image spectra. Left: visible and near-infrared (VNIR) (a) bauxite and (c) bauxaline®. Right: short-wavelength infrared (SWIR) (c) alumina and (d) bauxite.

Figure 5.
HySpex VNIR color composite (a,b) and masks used for the areas of interest (d,e). Map of bauxite and bauxaline® based on band positions in the VNIR (g,h). HySpex SWIR color composite (R–1060 nm; G–1250 nm; B–1590 nm) of the bauxite and alumina stockpile (c); and corresponding mask (f). Map of bauxite and alumina based on band positions in the SWIR (i).

Figure 6.
Results of AGM deconvolution for representative image spectra (VNIR and SWIR). Left: red gypsum (a) and (c); calcite (b); and white gypsum (d).
Figure 6.
Results of AGM deconvolution for representative image spectra (VNIR and SWIR). Left: red gypsum (a) and (c); calcite (b); and white gypsum (d).

Figure 7.
APEX VNIR color composite (a); and mask used for the area of interest (b). Map of red gypsum based on band positions in the VNIR (c). Map of red and white gypsum (green) and calcite (blue) based on band positions in the SWIR (d).
Figure 7.
APEX VNIR color composite (a); and mask used for the area of interest (b). Map of red gypsum based on band positions in the VNIR (c). Map of red and white gypsum (green) and calcite (blue) based on band positions in the SWIR (d).


© 2018 by the authors. Licensee MDPI, Basel, Switzerland. This article is an open access article distributed under the terms and conditions of the Creative Commons Attribution (CC BY) license (http://creativecommons.org/licenses/by/4.0/).
Share and Cite
MDPI and ACS Style
Marion, R.; Carrère, V. Mineral Mapping Using the Automatized Gaussian Model (AGM)—Application to Two Industrial French Sites at Gardanne and Thann. Remote Sens. 2018, 10, 146. https://0-doi-org.brum.beds.ac.uk/10.3390/rs10010146
AMA Style
Marion R, Carrère V. Mineral Mapping Using the Automatized Gaussian Model (AGM)—Application to Two Industrial French Sites at Gardanne and Thann. Remote Sensing. 2018; 10(1):146. https://0-doi-org.brum.beds.ac.uk/10.3390/rs10010146
Chicago/Turabian StyleMarion, Rodolphe, and Véronique Carrère. 2018. "Mineral Mapping Using the Automatized Gaussian Model (AGM)—Application to Two Industrial French Sites at Gardanne and Thann" Remote Sensing 10, no. 1: 146. https://0-doi-org.brum.beds.ac.uk/10.3390/rs10010146
Note that from the first issue of 2016, this journal uses article numbers instead of page numbers. See further details here.