Google Earth Engine Applications Since Inception: Usage, Trends, and Potential


1
School of Environmental and Rural Science, University of New England, Armidale, NSW 2351, Australia
2
School of Agricultural, Earth and Environmental Sciences, University of KwaZulu- Natal, P. Bag X01 Scottsville, Pietermaritzburg 3209, South Africa
*
Author to whom correspondence should be addressed.
Remote Sens. 2018, 10(10), 1509; https://0-doi-org.brum.beds.ac.uk/10.3390/rs10101509
Submission received: 30 July 2018
/
Revised: 4 September 2018
/
Accepted: 18 September 2018
/
Published: 20 September 2018
(This article belongs to the Collection Google Earth Engine Applications)
Abstract
:The Google Earth Engine (GEE) portal provides enhanced opportunities for undertaking earth observation studies. Established towards the end of 2010, it provides access to satellite and other ancillary data, cloud computing, and algorithms for processing large amounts of data with relative ease. However, the uptake and usage of the opportunity remains varied and unclear. This study was undertaken to investigate the usage patterns of the Google Earth Engine platform and whether researchers in developing countries were making use of the opportunity. Analysis of published literature showed that a total of 300 journal papers were published between 2011 and June 2017 that used GEE in their research, spread across 158 journals. The highest number of papers were in the journal Remote Sensing, followed by Remote Sensing of Environment. There were also a number of papers in premium journals such as Nature and Science. The application areas were quite varied, ranging from forest and vegetation studies to medical fields such as malaria. Landsat was the most widely used dataset; it is the biggest component of the GEE data portal, with data from the first to the current Landsat series available for use and download. Examination of data also showed that the usage was dominated by institutions based in developed nations, with study sites mainly in developed nations. There were very few studies originating from institutions based in less developed nations and those that targeted less developed nations, particularly in the African continent.
1. Introduction
The Google Earth Engine (GEE) is a web portal providing global time-series satellite imagery and vector data, cloud-based computing, and access to software and algorithms for processing such data [1]. The data repository is a collection of over 40 years of satellite imagery for the whole world, with many locations having two-week repeat data for the whole period, and a sizeable collection of daily and sub-daily data as well. The data available is from multiple satellites, such as the complete Landsat series; Moderate Resolution Imaging Spectrometer (MODIS); National Oceanographic and Atmospheric Administration Advanced very high resolution radiometer (NOAA AVHRR); Sentinel 1, 2, and 3; Advanced Land Observing Satellite (ALOS) etc. Table A1 gives a list of various satellite-based products, including raw and pre-processed bands, indices, composites, and elevation models that have worldwide coverage. It does not include other derived products, such as landcover and topographic features, that are available on the GEE platform. The table also does not include the datasets with the spatial coverage at national and regional extents. It also does not include most of the geophysical, demographic, and climate and weather data. The complete list can be obtained from the portal webpage (https://earthengine.google.com/datasets/).
While the initial setup included remote sensing data only, large amounts of vector, social, demographic, digital elevation models, and weather and climate data layers have now been added [2]. Most of the images have already been cleaned of cloud cover and have been mosaicked (by previous users) for quicker and easier processing; however, original imagery is available as well and the amount of original imagery far outweighs the amount of pre-build cloud-removed mosaics. In practice, images do not have the cloud pixels removed by default, and users have access to ancillary layers (e.g., Landsat Collection 1 Level-1 Quality Assessment Band) or algorithms (e.g., SimpleCloudScore, F-Mask) and decide when they use it in their scripts. All the raw imagery is available, along with cloud-cleared and mosaicked imagery. Some datasets have been pre-processed to convert raw digital numbers to top-of-the-atmosphere reflectance and even surface reflectance, rendering them suitable for further analysis without needing specialized software for solar and atmospheric corrections. Other ready-to-use computed products, such as Enhanced Vegetation Index (EVI) and Normalized Difference Vegetation Index (NDVI), are also available.
The programming interface allows users to create and run custom algorithms, and analysis is parallelized so that many processors are involved in any given computation, thus speeding up the process considerably. This enables global-scale analysis to be performed with considerable ease, as compared to desktop computing. One such example is the work by Hansen et al. [3] where the authors identified global-scale forest cover change between the years 2000 and 2012 using 654,178 Landsat 7 scenes (30 m spatial resolution), totaling 707 terabytes of data. The processing took 100 h on GEE, compared to approximately 1,000,000 h it would have taken on a standard desktop computer [4]. Images can be exported from Earth Engine in GeoTIFF or TFRecord format. GEE allows raw or processed images, map tiles, tables, and video to be exported from Earth Engine to a user’s Google Drive account, to Google Cloud Storage or to a new Earth Engine asset. Google cloud storage is a fee-based service for which one needs set up a project, enables billing for the project, and creates a storage bucket. Users are free to upload other datasets and decide whether to share the data they have uploaded and scripts they have written with others or not.
This plethora of multi-temporal data, with local to global coverage, presents researchers with an unprecedented opportunity to undertake research with minimal cost and equipment. The cloud computing power of GEE enables the processing of petabytes of image data, combined with other vector data, within the cloud environment and removes the need to store, process, and analyze the large volumes of satellite data on an office computer. There is now a reduced need for computers with fast processing speeds and large storage capacities. Users do not have to entirely depend on specialist remote sensing software, such as Environment for Visualizing Images (ENVI) and Earth Resources Data Analysis System (ERDAS) Imagine; however, they may still be needed for special functions that are not available on GEE (such as object-based image analysis). Satellite images do not need to be downloaded, which is a major boon for regions with slow internet speeds, but internet connection is still needed to use GEE.
Such a development presents great opportunities and is also a great levelling field for researchers. The availability of data sets and innovative data processing algorithms provided by GEE or shared by other users of GEE should help to improve our capability to process earth observation data to support management decisions, irrespective of where we reside. A researcher living in Zimbabwe has relatively similar opportunities as one living in Australia. All that is needed is a basic desktop computer and internet connectivity. The capability to import and upload data on the Earth Engine’s public data catalogue provides immense opportunities for data updating and sharing. Users can upload their own raster and vector data sets and even share scripts with other users for free, thereby promoting knowledge exchange. The data request forums and troubleshooting platforms makes data accessibility easier and provides fingertip assistance on processing. Given this background, the question that arises is whether researchers are making use of this opportunity, particularly those based in the less developed parts of the world? It is researchers in such environments who have been at a distinct disadvantage in utilizing earth observation data to its fullest capacity due to funding and infrastructure constraints [5]. This bridge has now been narrowed considerably, so one would expect researchers in such regions to take advantage of this noble innovation.
This research set out to investigate whether the availability of such large amounts of data at worldwide coverage, with free access (for research, education, and non-profit organizations) to data processing algorithms and cloud computing facilities, had led to increased research in less-developed nations, and whether researchers from these regions were embracing the opportunity. Research publications from 2010 (establishment of GEE) onwards were searched for using the keyword “Google Earth Engine” and all resulting publications were individually analyzed to record the origin of the principal author’s affiliated institution, the origins of the affiliated institutions of all authors, the primary study site, the scale of the study, the subject area, datasets used, and the number of papers for each year of publication. The data was used to investigate patterns, authorship origins, and whether there was a general take-up of opportunities in the less developed nations.
2. Materials and Methods
Google Scholar and Web of Science were used to search for all articles with the words “Google Earth Engine” or “GEE” anywhere in the article, except in the references section. All such articles were downloaded into Endnote (Clarivate Analytics, 1500 Spring Garden Philadelphia, PA 19130, USA) and duplicates were then removed. Conference papers, books and book chapters, audio-visual material, newspaper articles, reports, thesis, websites, and abstracts from other sources were also discarded. A key reason for this was that the full versions of these were generally not available to enable extractions of all required data. Patents and review papers in journals were also removed. The remaining papers (journal articles) were manually screened to identify the subject areas, study sites, the scale of the study (global, continental, regional, country, or sub-country), number of authors, origin of the principal author’s affiliated institution, the origins of the affiliated institutions of all authors, datasets used, and number of papers per year. The information about author’s affiliated institutions was obtained from the contact address on the manuscript. Where multiple addresses were given for an author, the first address was used. It should be clarified that this research was not about the origin of authors but where they were based when the research was conducted. The subject areas were quite varied, so they were grouped into 16 broad categories. Data was analyzed in Excel and ArcGIS software (ESRI, 380 New York Street Redlands, CA 92373-810, USA).
3. Results
The initial search resulted in 785 articles and, after screening for duplicates, 485 articles remained. Of these, there was one audiovisual material, five books, 24 book sections, 66 conference proceedings, two films or broadcasts, one newspaper article, 11 reports, 20 theses, one web page, one generic material, 49 manuscripts where GEE was only mentioned in the references or was not in English or was a review paper, and 304 were journal articles. From these 304 journal articles that had actually used GEE in their research, four were either technical responses to other GEE related papers or only mentioned GEE as a graphics interface from which other relevant data could not be extracted. Thus 300 papers remained that were actual research papers published in journals between January 2010 and June 2017, which were then subjected to detailed analysis. The 300 journal papers were published across 158 different journals, many of which had a single paper. The majority of the papers were in Remote Sensing (32, IF: 3.41), Remote Sensing of Environment (19, IF: 6.46), Science of Total Environment (8, IF: 4.61), PLoS ONE (8, IF: 2.77), IEEE Journal of Selected Topics in Applied Earth Observation (6, IF: 2.78), International Journal of Remote Sensing (5, IF: 1.72), and Remote Sensing Applications—Society and Environment (5, IF: NA). Applied Geography, Environmental Modelling and Software, Forest Ecology and Management, International Journal of Digital Earth, ISPRS Journal of Geoinformation, Science, and Malaria Journal had four papers each.
3.1. Publication Trend
The trend of publication using GEE increased slowly in the first few years but had gained pace in the last three years. The first paper using GEE was published in 2011, and a total of nine papers were published that year. This increased to 109 in 2016 and 90 for the first half of 2017 (Table 1).
3.2. Application Regions
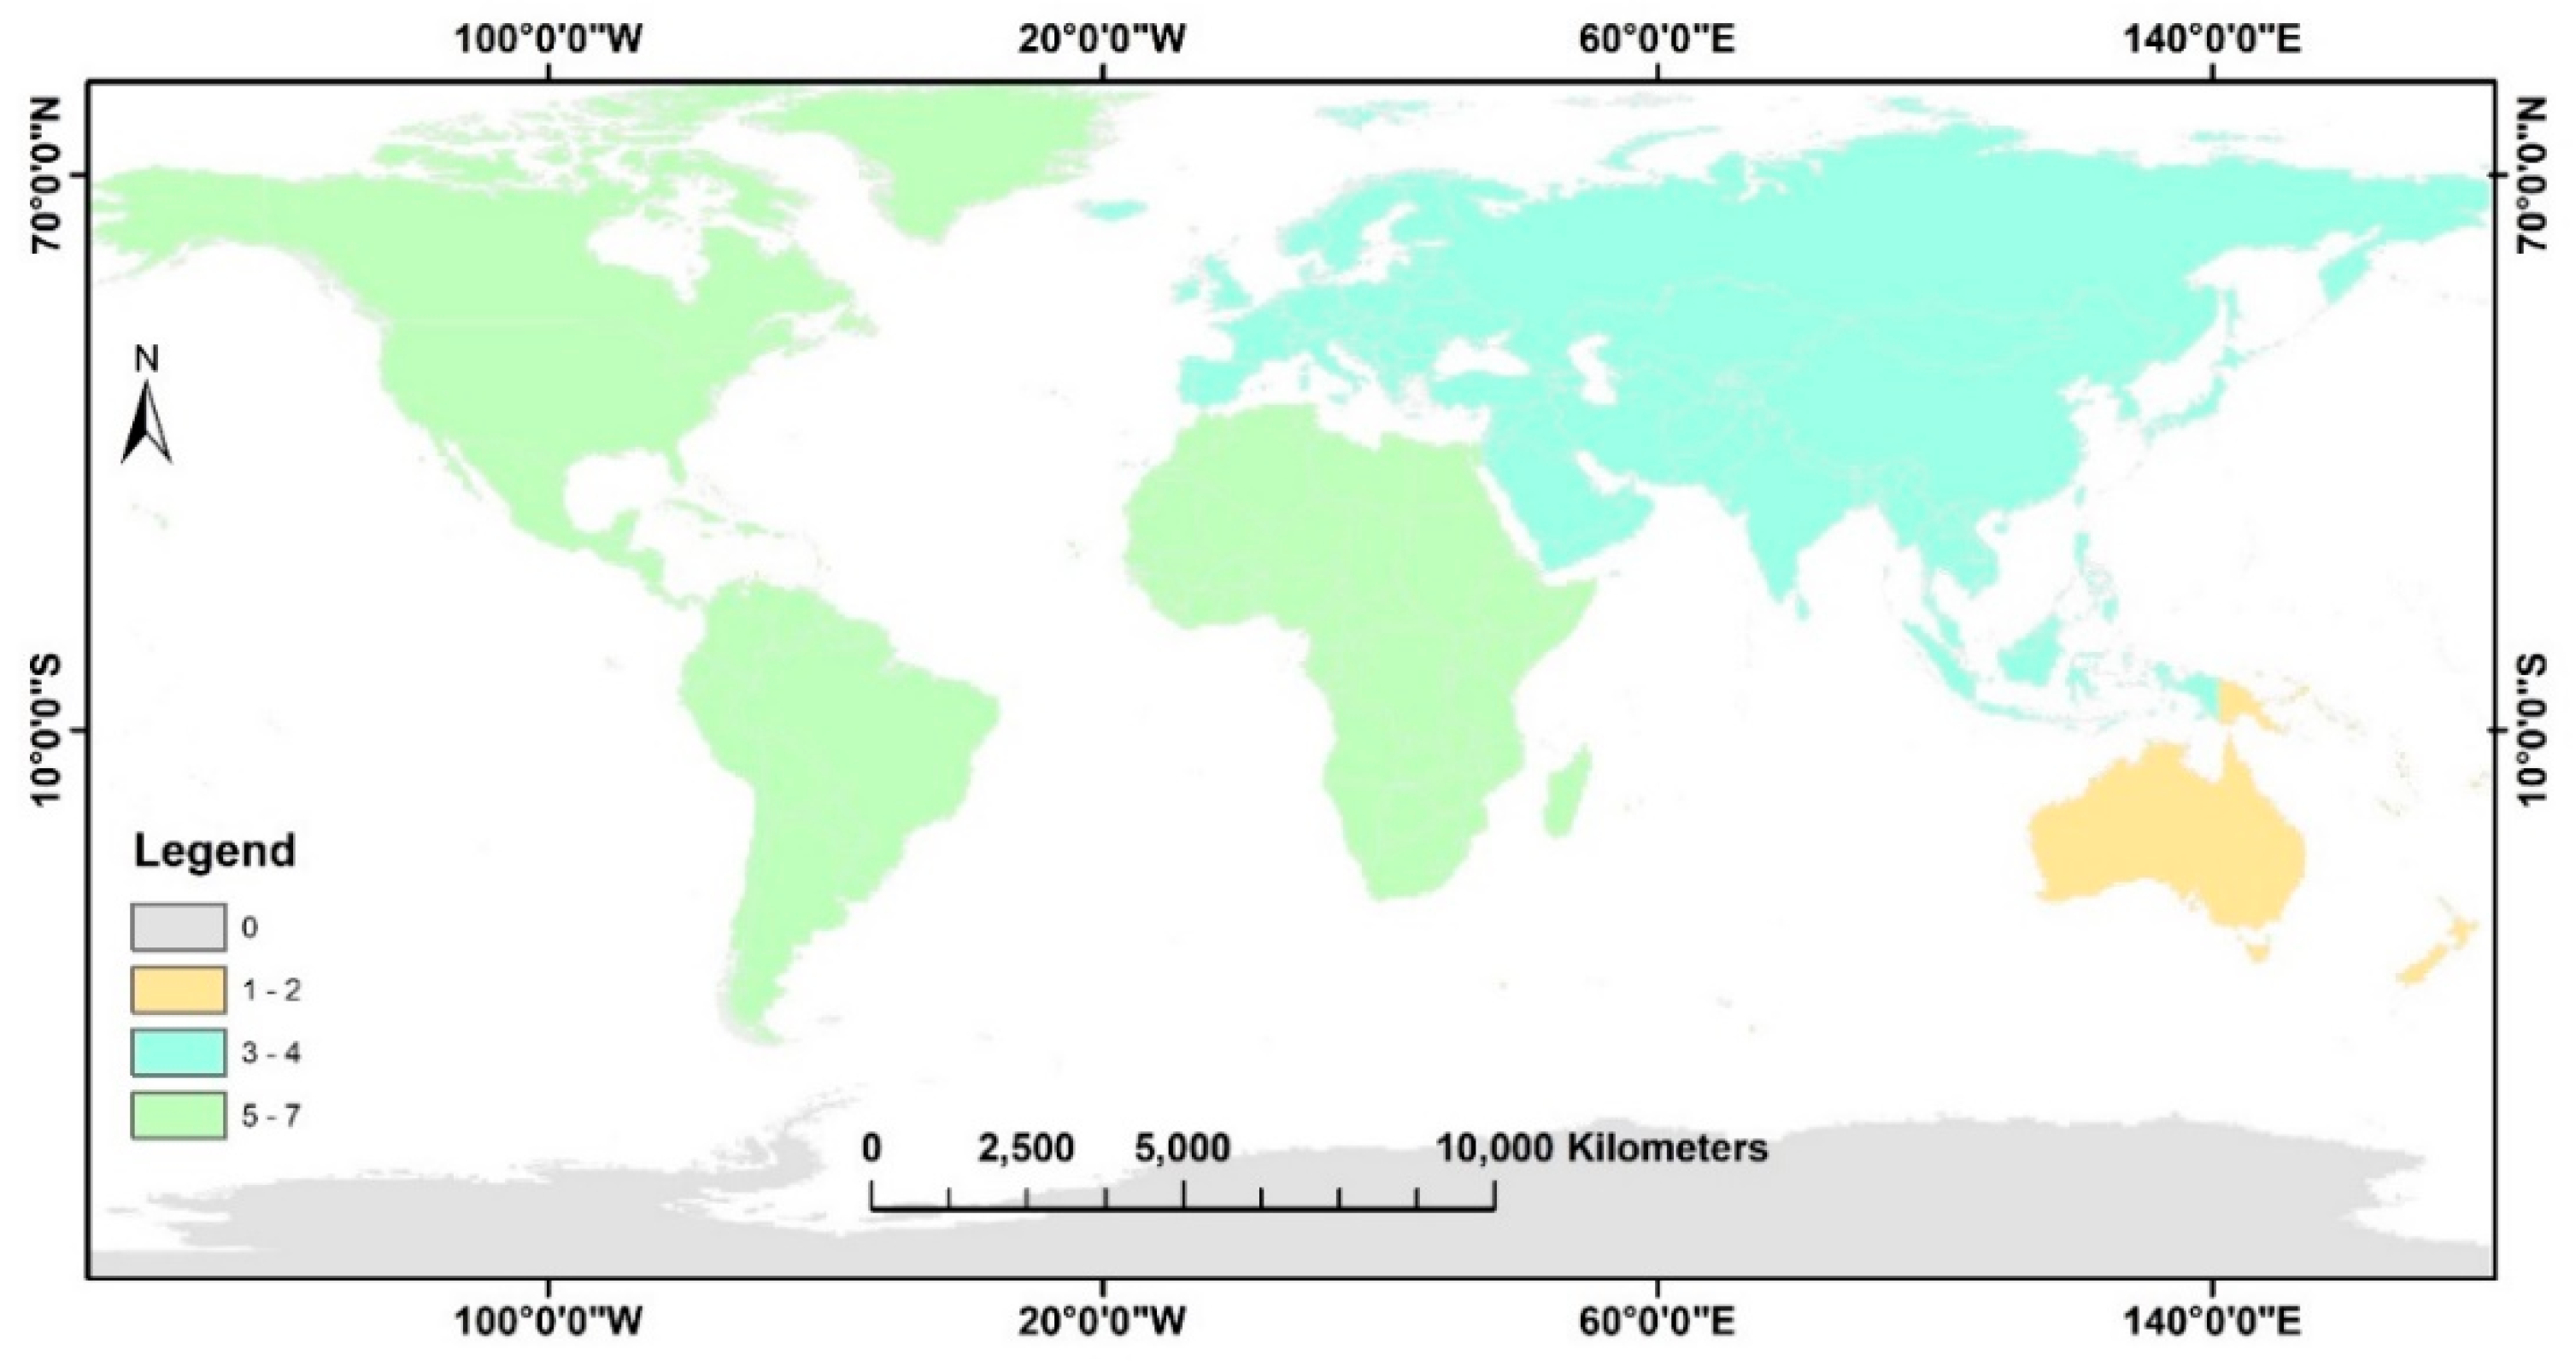
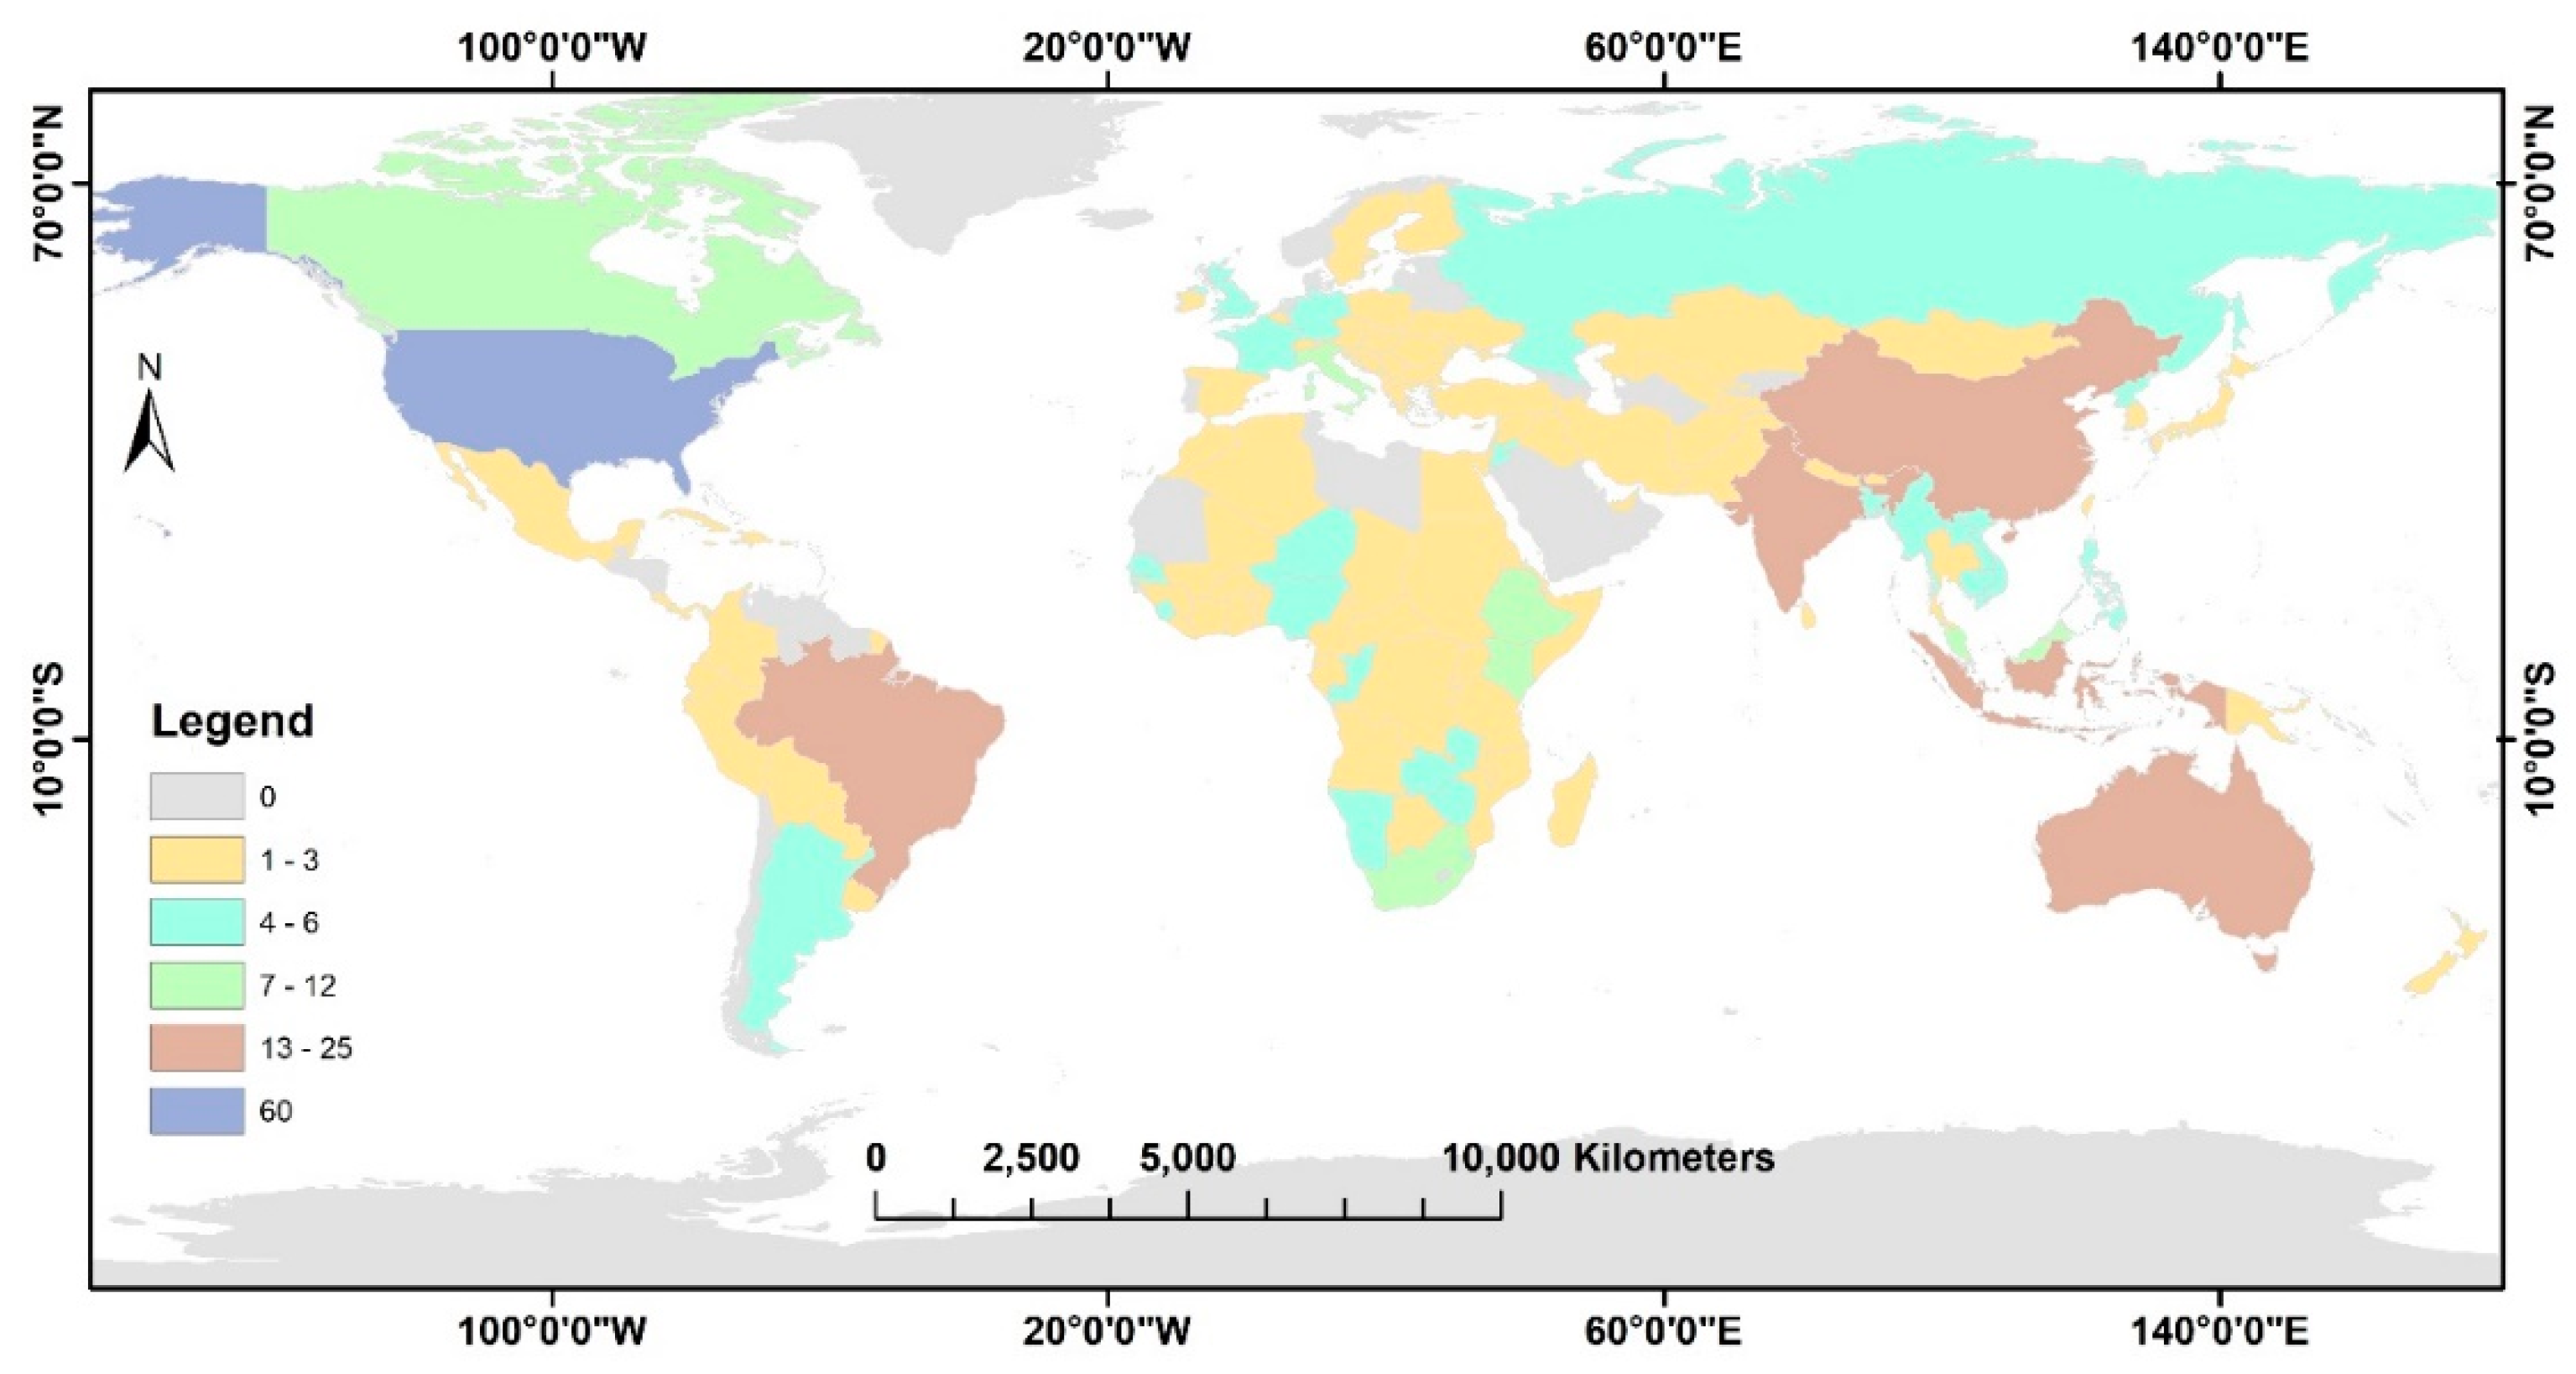
Fifty papers out of 300 (17%) covered the whole world as an application region, while there were 28 studies at a continental scale. Sixty-three studies were at the country scale and 139 at the sub-country scale. There were another 20 studies that were at variable scales or for extraterrestrial work. At the continental scale, most studies covered the American continent (seven for North America and another seven for South America), seven for Africa, three for Asia, three for Europe and one for Australia (Figure 1). The spatial distribution of the papers shows that at the country and sub-country level, the highest number of publications selected USA (60) as their application region, followed by China (24), Brazil (19), India (15), Indonesia (15), Australia (14), and Canada (11) (Figure 2, Table A2). A number of countries in the Middle East and Africa had no studies. Europe combined had 45 studies, with Italy having 7, Germany having 5, and U.K. having 4 (Appendix A Table A2).
3.3. Application Disciplines
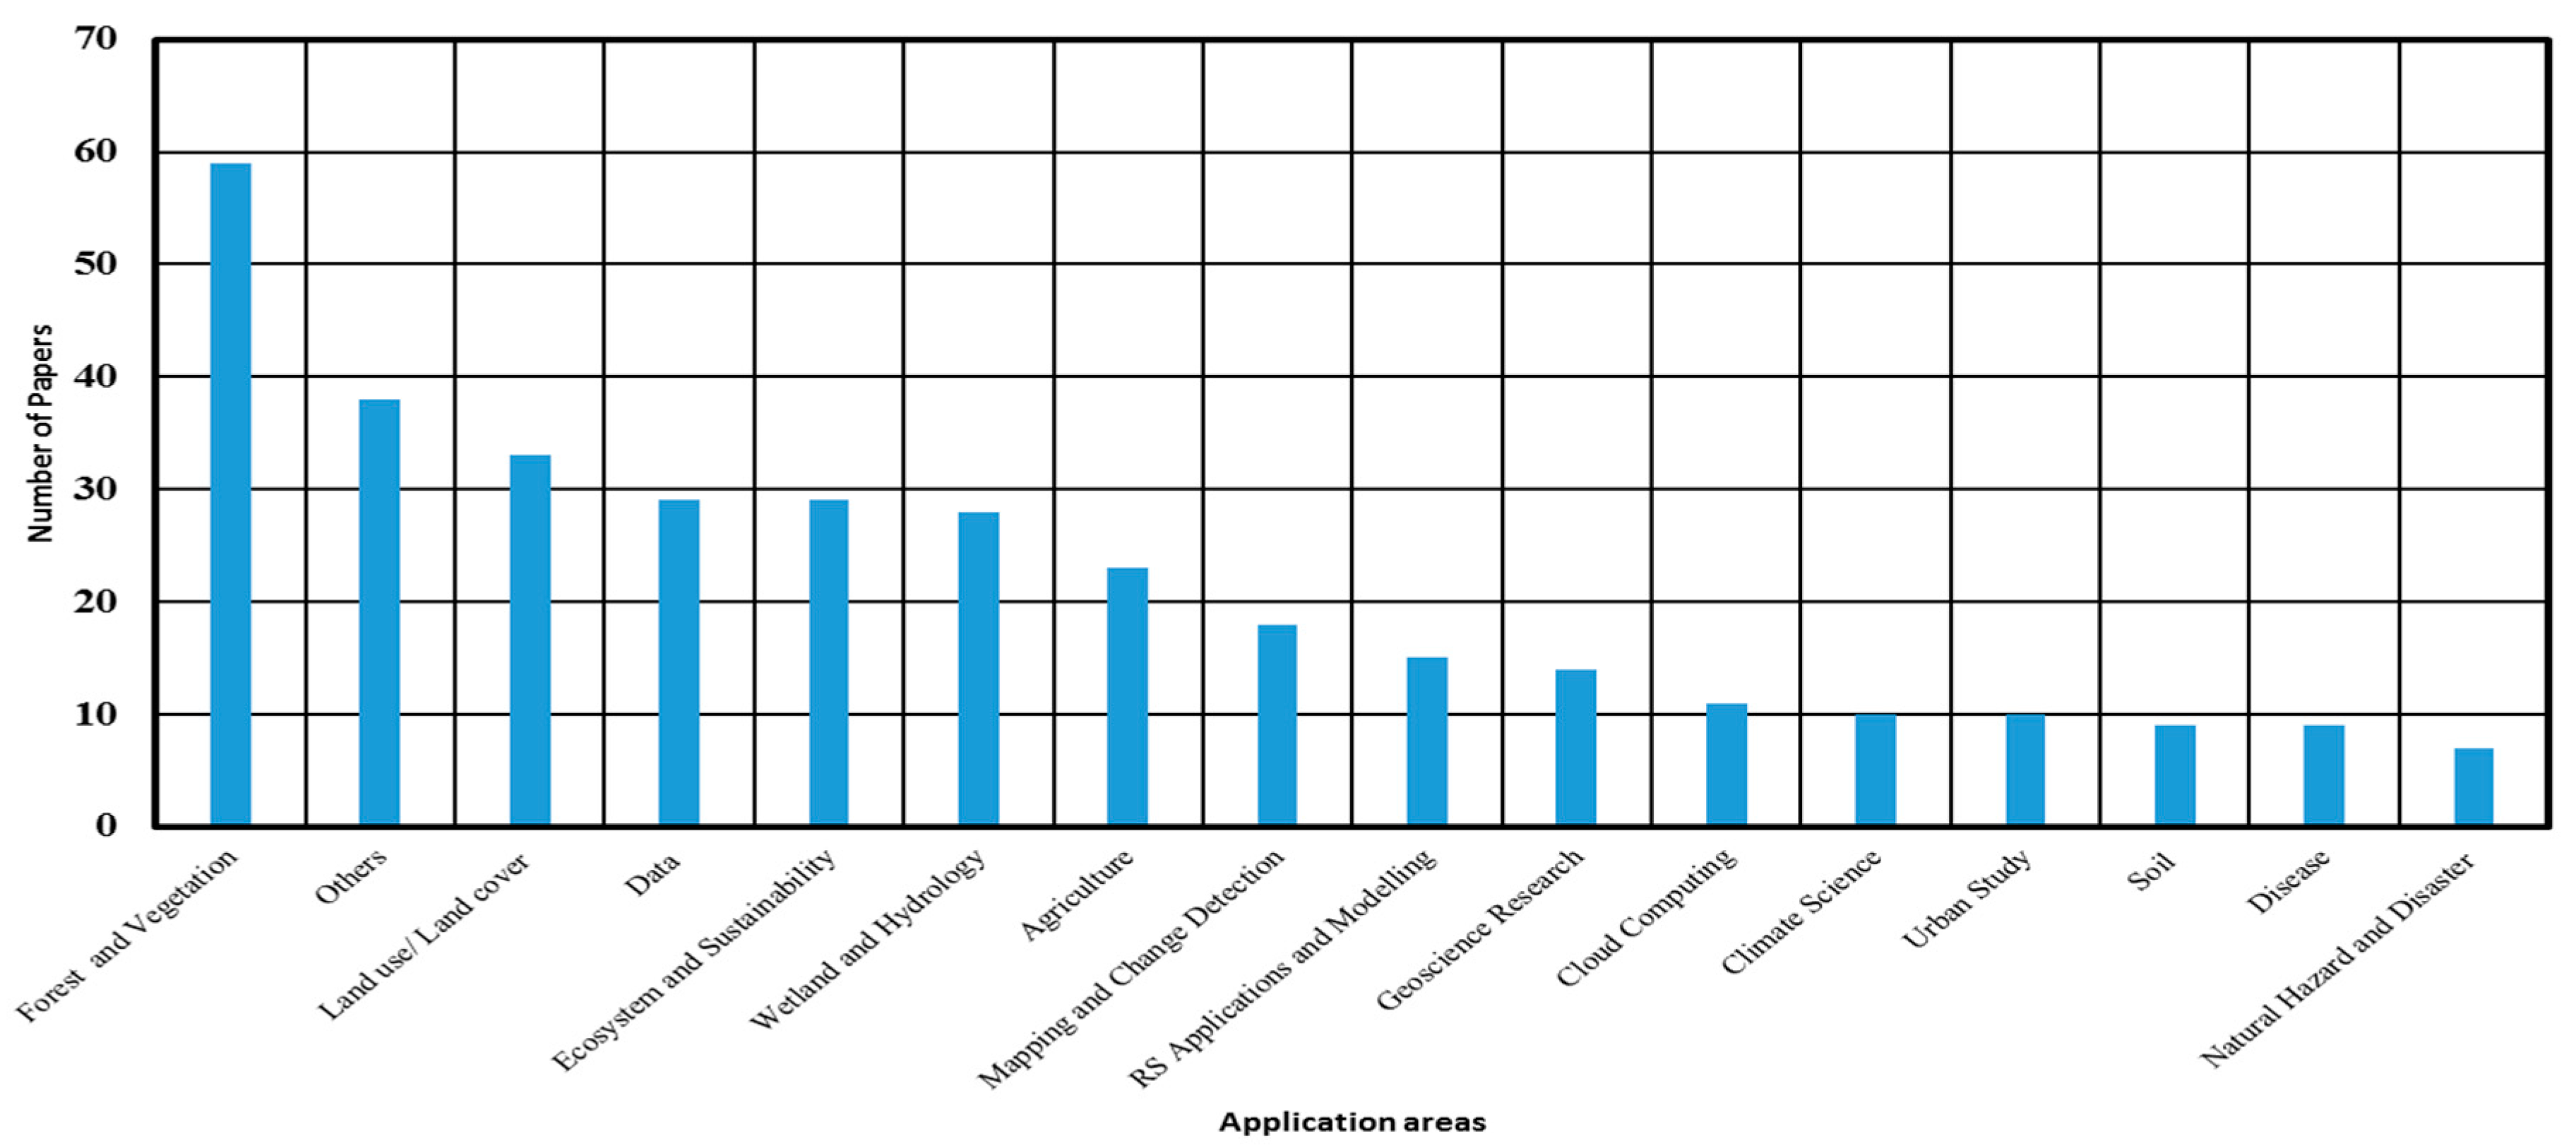
There was a wide variety of application areas, ranging from agriculture, forestry, and ecology to economics and medicine (diseases). These were broadly placed into 16 categories, as shown in Figure 3. The highest number of studies were in the forest and vegetation category (17%); followed by 10% in land use and land cover studies; 8% in ecosystem and sustainability, wetland and hydrology, and in data manipulation; 7% in agriculture; 5% in mapping and change detection; 4% in both remote sensing applications and modelling and geoscience research; 3% each in cloud computing, soil, disease, climate science, and urban studies; and 2% in natural hazard and disaster studies. In addition, 11% of application disciplines were incorporated in the “others” category as their numbers were too small to create their own classes. These consisted of applications in areas such as economics, air pollution, virtual environments, air temperature, and archaeology. Therefore, overall, a large portion of the studies were in the natural resources mapping and management domains.
3.4. Data Used in GEE Research
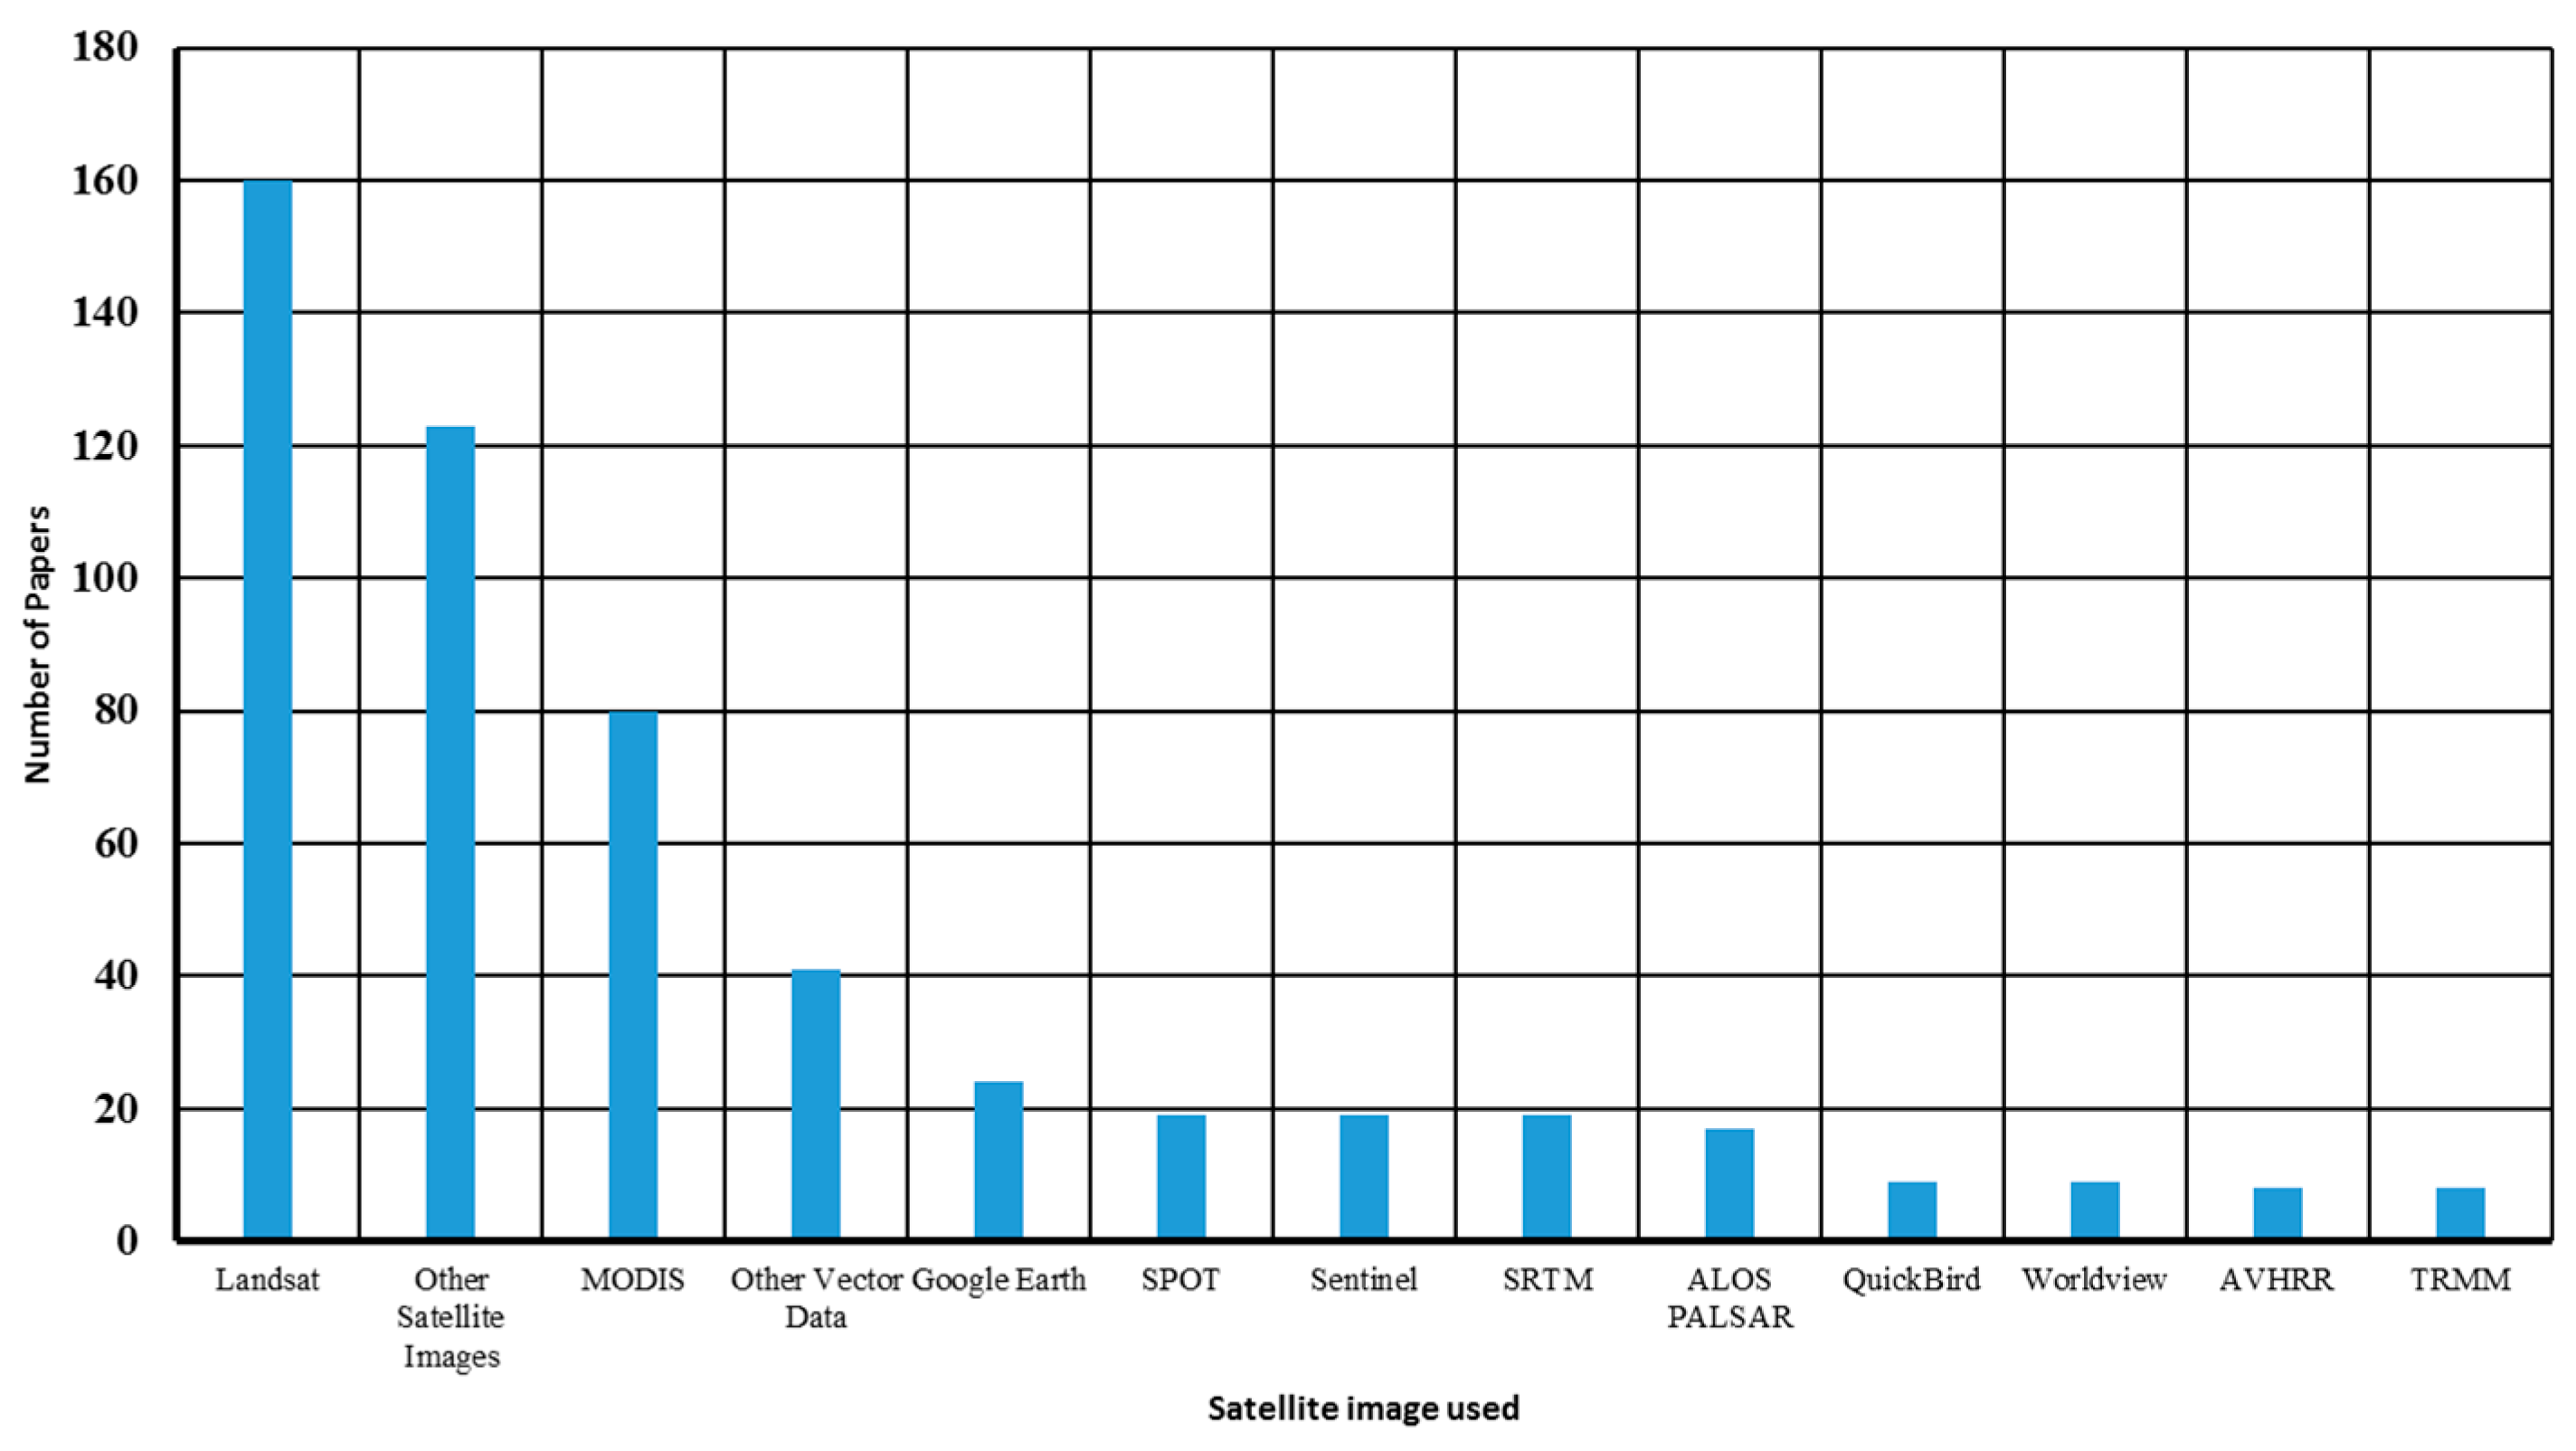
The majority of the work analyzed as part of this research used Landsat data (159) followed by MODIS (80). The other common datasets used were Google Earth (24), Satellite Probatoire d’Observation de la Terre (SPOT) (19), Sentinel (19), Shuttle Radar Topography Mission (SRTM) (18) and Advanced Land Observing Satellite (ALOS) Phased Array type L-band Synthetic Aperture Rada (PALSAR) (17) (Figure 4). Note that Google Earth data cannot be subjected to spectral analysis as with other remote sensing data, so it most probably was used for visualization or for manual identification of classes.
3.5. Authorship Patterns
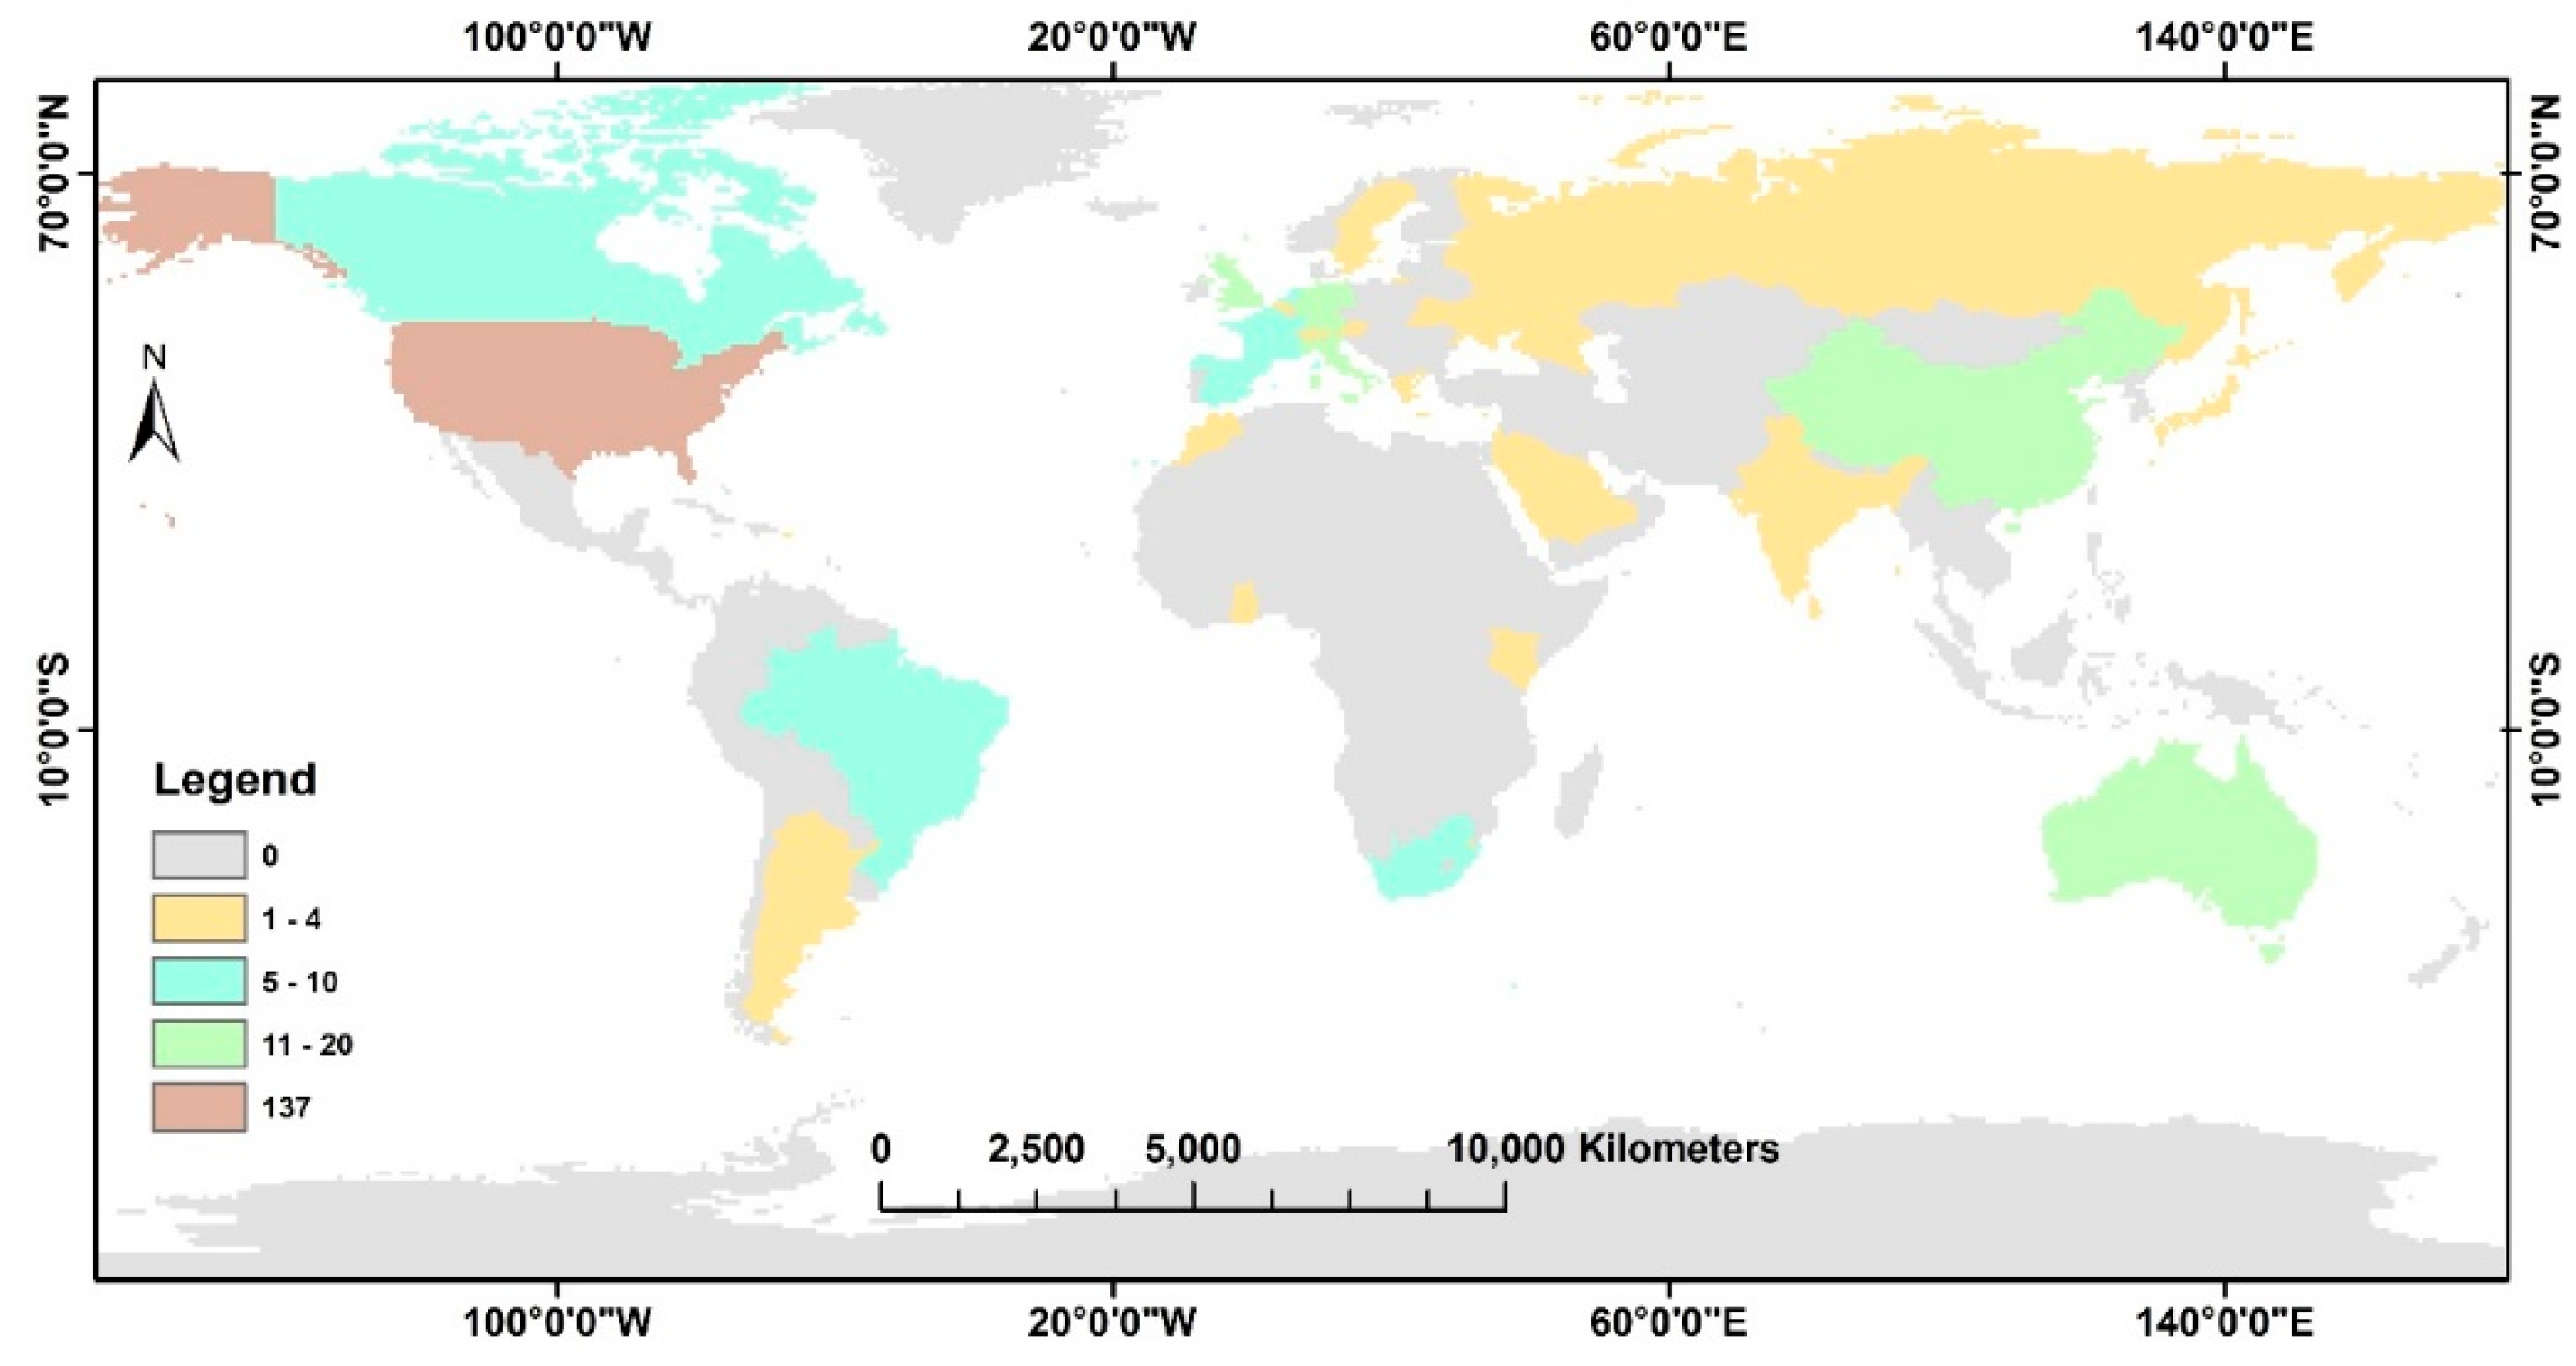
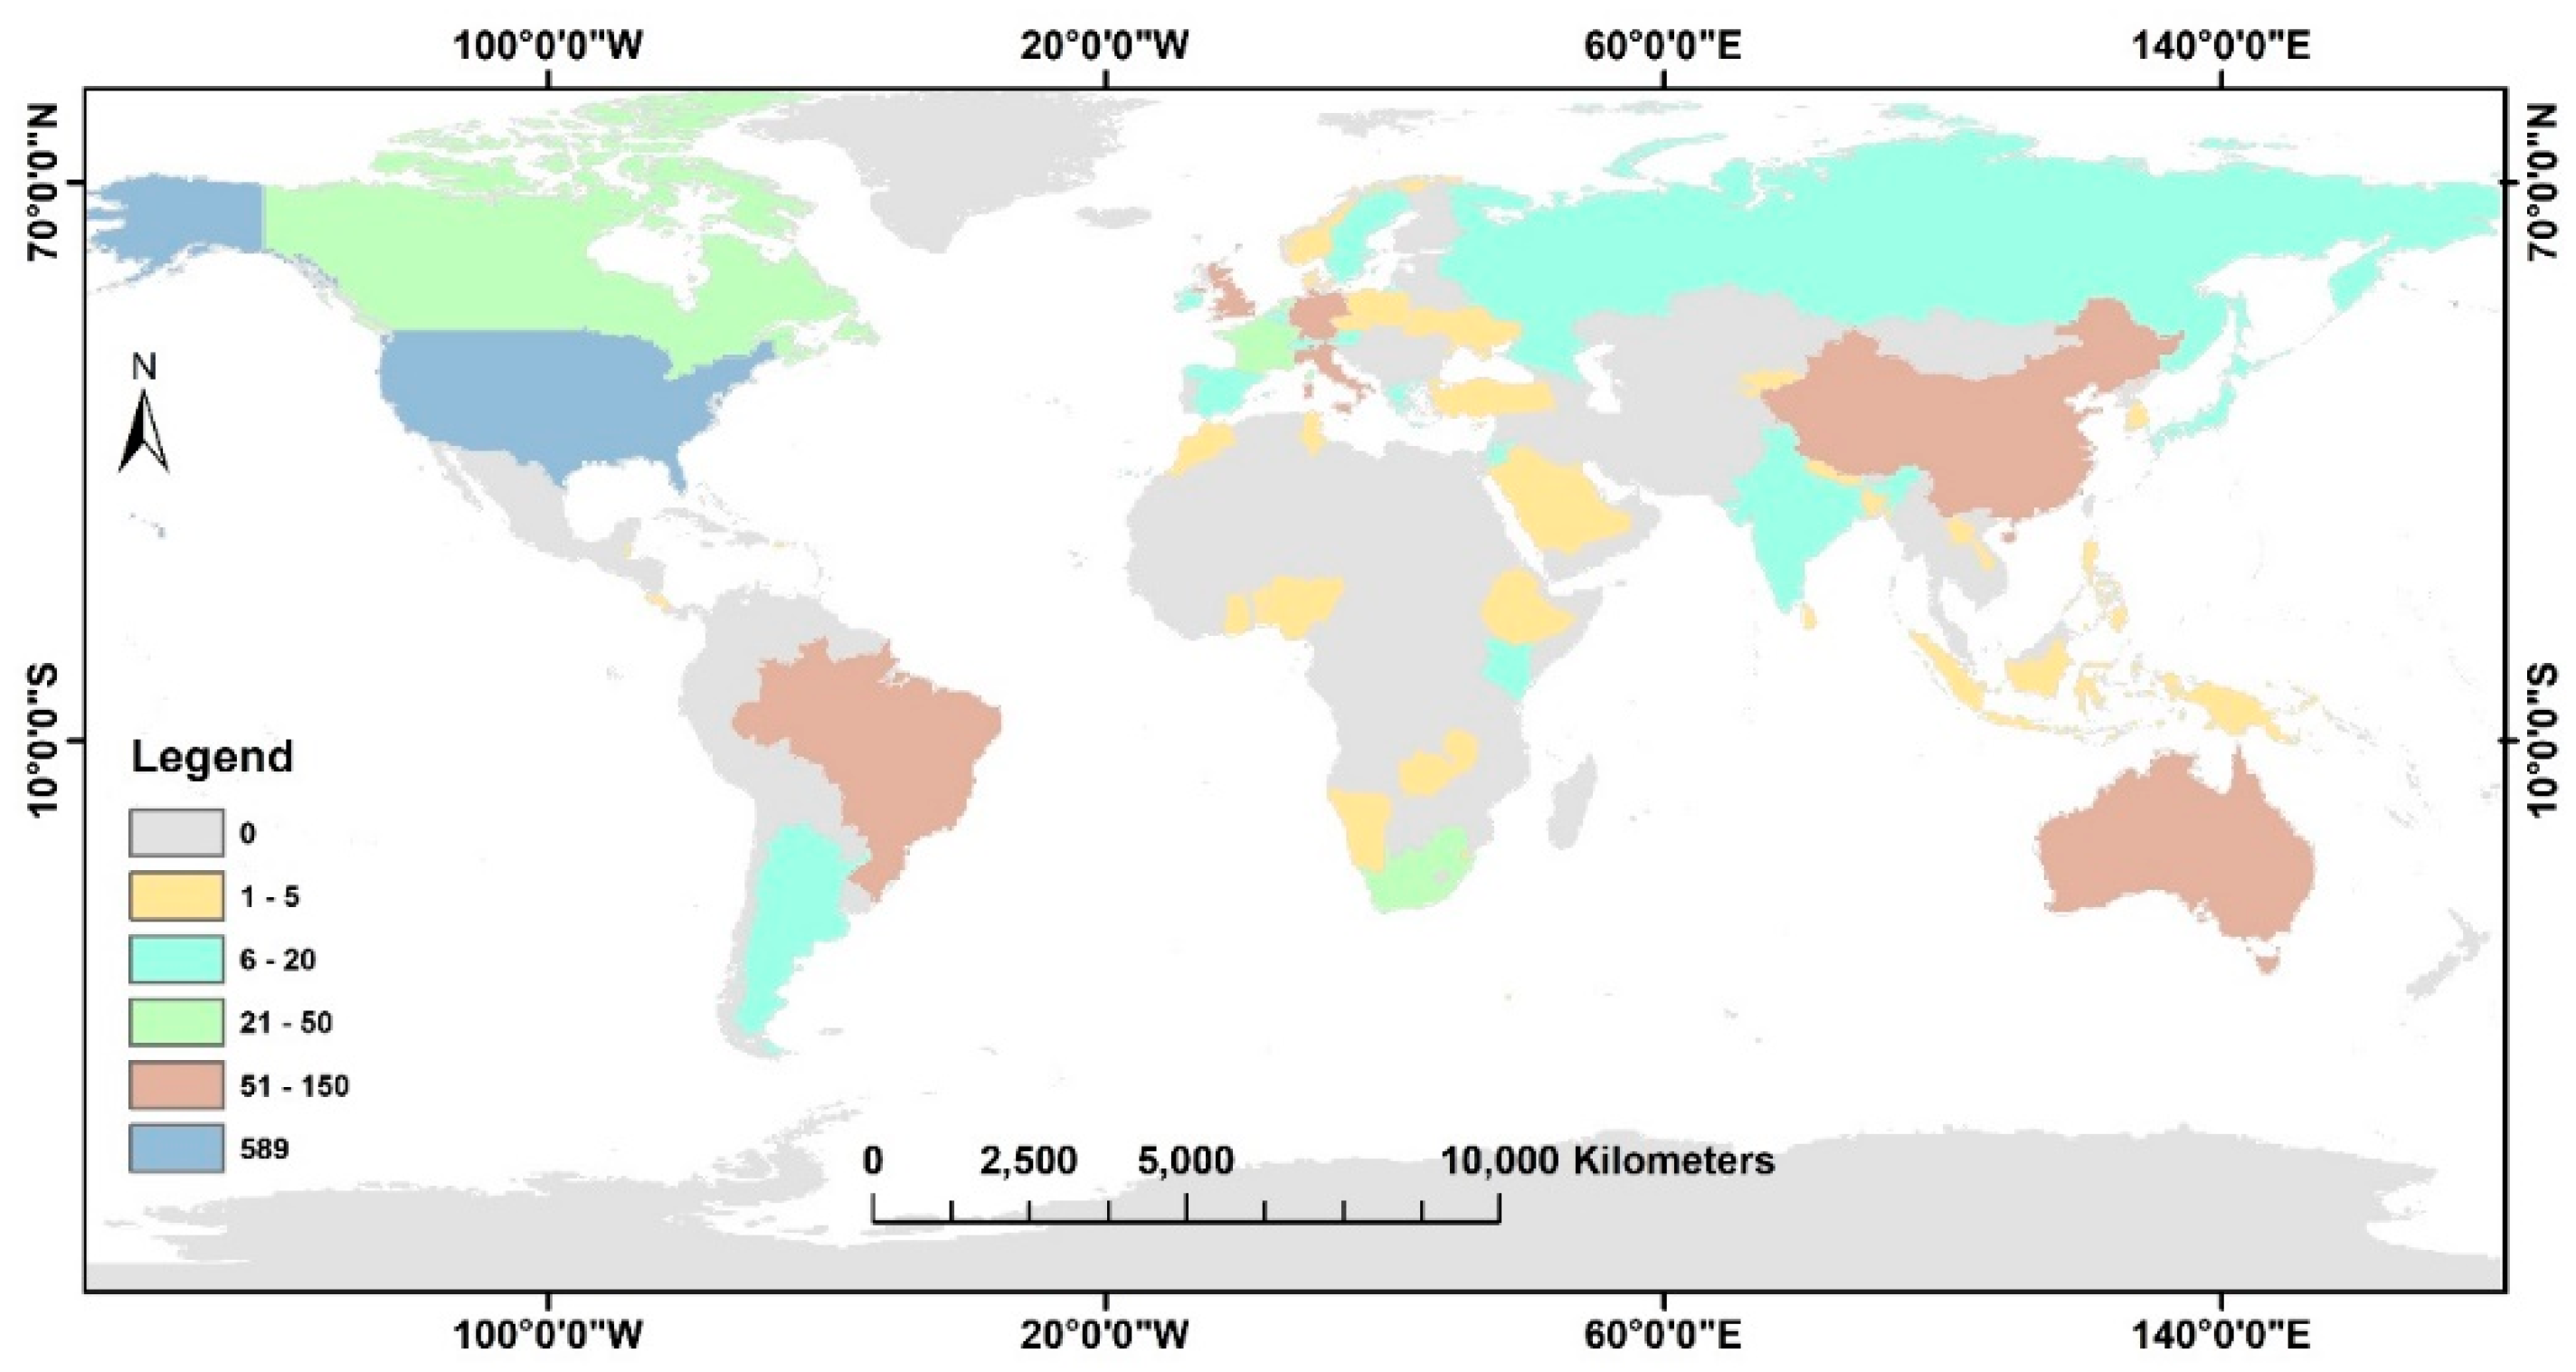
Of the 300 papers that were analyzed, 137 had the primary author based in the United States, followed by 20 in Italy, 18 in Germany, 16 in China, and 15 in the U.K. (Figure 5). Very few papers were from researchers based in less developed countries, particularly Africa. When taking into consideration all authors of the 300 manuscripts (1447 authors in total), the majority (589, or 41%) were based in the United States, followed by Italy (120), Australia (86), Germany (79), China (68), and the U.K. (65). Again, there were no or very few authors from institutions from less developed countries contributing to these researches (Figure 6, Appendix A Table A3).
4. Discussion
This paper has unpacked, among others, trends in use, areas of major use, major data sources being used, and authorship patterns of GEE. The results of the paper have shown that usage of GEE has been burgeoning over the years, with clear advantages of usage being shown in the number of publications. Researchers have highlighted the opportunities provided, including storage capacity, archival and processed data usage, as well as powerful processing capabilities engrained in the platform. A number of studies have taken advantage of easy accessibility to more than 40 years of free historical imagery and scientific data sets in order to develop large-scale and long-term monitoring applications [1].
The platform, through a dedicated high-performance computing infrastructure, provides computational capability for data preparation and allows systematic creation and training of many classifiers and algorithms [6,7,8,9]. For example, using machine learning algorithms, cloud computing allows for efficient testing of various base classifiers and combination, as well as training of the ensemble with a wide range of spectral, spatial, and temporal bands derived from very high spatial resolution satellite images [10].
This study has shown that there is variability in the application regions of GEE, with 17% applied at the global scale and the U.S.A. dominating at the country level. The 17% global application is a significant percentage, which is attributed to the processing as well as data storage capabilities of GEE [11]. To analyze data at a global scale requires more than 10 petabytes of data and efficient processing power, a strength engrained in GEE [11,12,13].
The authorship pattern also shows institutions from developed countries dominating the first author position with very few scholars from institutions based in less-developed counties. The wide application and dominant authorship in the U.S.A. and other developed countries clearly indicates the ease of accessibility to the technology as well as the capability to utilize the platform. There is also a wide use of data sets, such as Landsat, which are open source [13,14]. This is not a surprising result since an archive of such images are already available on the GEE platform and some are pre-processed (cloud-cleared, georeferenced, Top of atmosphere (TOA), and surface reflectance, etc.) for immediate application. This signals the importance of expanding the database to include higher-resolution datasets.
Variability in the application fields is also quite significant in this analysis. Most papers applied GEE in the field of vegetation and forest monitoring as well as landcover/use change mapping. This is commensurate with trends in remote sensing where most of the global research and journals target landcover and vegetation. There are few studies on disaster monitoring, disease, and soils. There could be an overlap between diseases category with vegetation and agriculture, where studies have been undertaken on disease infestation in vegetation and crops [15]. Natural disasters and geological applications require more publicity since the benefits of the platform are huge; however, it should be noted that natural disasters mapping needs to be processed in a more timely manner and the delay in the availability of images on GEE means that it is not an ideal platform for such an application. Having said that, however, users are still able to upload their own images on the platform and use GEEs massive processing power to deliver timely products.
While the development of GEE targeted poor countries as part of the REDD program for forest measurement and monitoring [16], results from this study have shown that institutions based in most developing countries are not using the facility effectively. Of serious concern is a lack of studies that have used GEE in Africa by Africa-based researchers. This could be attributed to a number of factors, which include data accessibility, technological skills to process the data, and opportunities for research. Due to the huge data sets involved, it is a technical and financial challenge to process the data using traditional local processing methods (e.g., image file download) and many researchers may not be aware that by using GEE, one does not have to download the datasets. A similar study on above ground biomass research showed that most satellite images, such as LiDAR and radar, are beyond the reach of many researchers in Africa due to the costs involved; thus, even with the availability of big data processing engines, the cost of data acquisition is a challenge, especially if such data is not available in the GEE repository [17]. The same pattern was also observed with crop health monitoring [18], where applications are limited to a few African countries, such as South Africa. In addition, most scientists in the application field do not have a background in programming. While the routines offered by GEE are relatively easier to follow, its application remains elusive until a proper graphical user interface (GUI), such as those found in ERDAS Imagine or ENVI, are fully developed. Therefore, the opportunity offered by the GEE platform falls short of being fully utilized in less-developed countries. However, GEE scripts can be made into web applications with a GUI and has the capability to increase usability and transferability. The development of Information Technology (IT) processing platforms, with user friendly GUI, should incorporate the size of the data, complexities, and analytical functions of the Big Data [19]. The study by Xiong et al. [20], undertaken to automate cropland mapping of continental Africa using GEE, shows the potential of the platforms application for the African continent.
The other problem is also a lack of awareness and poor data sharing networks in less developed countries. Of a few universities rapidly surveyed in South Africa through email questions to GIS departmental lecturers, very few apply GEE in teaching at undergraduate and post graduate levels, and neither is there widespread knowledge of its existence. In addition, the spatial data infrastructure in less developed countries is poorly networked for easy sharing of information [21,22]. This leads to disaggregated research silos with constricted cross-pollination of ideas and technology.
Overall, the Google Earth Engine goes a long way in providing realistic solutions to challenges of processing Big Data into usable information for addressing environmental concerns. It has been specifically designed to manage large volumes of data, a major bottleneck for researchers utilizing satellite images. GEE also has the advantage that many data layers are already available on the platform, with some already screened to remove cloud cover, converted to top-of-atmosphere reflectance, surface reflectance, and georeferenced. The platform also allows for the sharing of computer codes, so users do not have to be proficient in Javascript or Python coding, and there is a very active online community providing support. Given GEE’s speed, flexibility, and accessibility, there is tremendous opportunity for the research community to make use of this platform for earth observation studies. GEE provides an answer and opportunity for researchers based in developing countries who often complain about data accessibility, funding for computer hardware and software, and general lack of resources. Hopefully, there is a bigger uptake of this opportunity by researchers in such regions and more applications are developed to better manage our rapidly diminishing resources.
With regard to limitations, Salager-Meyer [23] highlighted the disparities and inequities that exist in the world of scholarly publishing and the results seen in this paper are perhaps a result of those issues. It is seen from this research that in many developing countries, the trend of publishing research output using GEE in most disciplines drops behind that for the developed nations. The absence of citations or publications does not mean that the researchers from developing countries do not engage with scientific research or they do not consider the visibility of their work. Gibbs [24] stated that the share of mainstream journal articles in developing countries is insignificant even though it comprises of 24.1% of the world’s scientists. There are many reasons for under-representation of publications from developing countries, such as financial restrictions [23], poor facilities (i.e., Internet access gap, infrastructure, inadequate laboratory equipment), lack of international collaboration, political legitimacy, limited technical support, and inadequate training [25,26,27]. Further, the language barrier on intercultural communication is the most frequent root cause for this problem as many researchers from developing countries do not speak English as their first language, which can pose a barrier for them to share their scientific findings [23]. Our study did not account for any of these issues.
It should also be noted that while this paper used the publication record as a proxy for “usage” of GEE, not everyone using GEE does it for scientific publication or is interested in sharing the findings with other academics. Many applications, such as the Global Forest Watch, are for operational use and are not captured in an analysis of publication data that is geared towards academia.
5. Conclusions
This research investigated the uptake and usage of the Google Earth Engine (GEE) platform, mainly in terms of the geographic location of users, the datasets used, and the broad fields of study. As one of the key goals of GEE is to provide a platform for planetary-scale geospatial analysis that is accessible for everyone, the central question of this manuscript is invaluable. Peer-reviewed literature was used for assessing the authorship patterns, the geographic scope of analysis, and major area of use. The results show that the use of GEE is dominated by developed countries, both in terms of user nationality (as given by institutional affiliation), and geographic application, while the applications of GEE in terms of subject matter are quite diverse. GEE provides substantial opportunities for earth observation and geospatial applications, and that it potentially eliminates some of the barriers, particularly in the developing world. However, this has yet to be fully realized, and opportunities exist to improve on this.
Overall, GEE has opened a new big data paradigm for storage and analysis of remotely sensed data at a scale that was not feasible using desktop processing machines. A more aggressive intervention approach could be taken to increase applications in developing countries. Similar to the European Space Agency (ESA) Thematic Exploitation Platforms (TEPs) initiated in 2014 (https://tep.eo.esa.int/about-tep), developing countries should also be involved in the Earth Observation Exploitation Platforms. The TEPS are an initiative by the ESA to create research and development interconnected themes around coastal, hydrology, urban, and food security, among others. Such initiatives provide platforms for collaboration and virtual work environments, including provision of access to earth observation data and tools, processors, and IT resources required using one coherent interface.
Author Contributions
L.K. conceptualized the idea, collected and analyzed data and wrote certain sections of the paper. O.M. conceptualized the idea, interpreted data, wrote certain sections and proof read the paper.
Funding
The paper was partly funded by the SARChI Chair in Land use Planning and Management.
Acknowledgements
The authors would like to thank Manoj Kumer Ghosh, Sadeeka Layomi Jayasinghe, Sushil Lamichhane and Cate MacGregor for help with database development and analysis.
Conflicts of Interest
“The authors declare no conflicts of interest”.
Appendix A

Table A1.
A summary of the main satellite imagery available in Google Earth Engine.
| Image Collection | Description | Data Availability (Time) | Resolution (Meters) | Revisit Interval (Days) | Provider |
|---|---|---|---|---|---|
| Sentinel-1 SAR GRD | C-band Synthetic Aperture Radar Ground Range Detected, log scaling | 3 October 2014–present | 10 | 3 | European Union/ESA/Copernicus |
| Sentinel-2 MSI | Multi Spectral Instrument, Level-1C | 23 June 2015–present | 10, 20, 60 | 5 | European Union/ESA/Copernicus |
| Sentinel-3 OLCI EFR | Ocean and Land Color Instrument Earth Observation Full Resolution | 18 October 2016–present | 300 | 2 | European Union/ESA/Copernicus |
| Landsat 1 MSS | Tier 1 and 2 (raw) | 23 July 1972–7 January 1978 | 30, 60 | 16 | USGS |
| Landsat 2 MSS | Tier 1 and 2 (raw) | 22 January 1975–26 February 1982 | 30, 60 | 16 | USGS |
| Landsat 3 MSS | Tier 1 and 2 (raw) | 5 March 1978–31 March 1983 | 30, 60 | 16 | USGS |
| Landsat 4 MSS | Tier 1 and 2 (raw) | 16 July 1982–14 December 1993 | 30, 60 | 16 | USGS |
| Landsat 4 TM | Tier 1 and 2 (raw, TOA reflectance, surface reflectance); 8 day, 32 day and annual composites (BAI, EVI, NDSI, NDVI, NDWI, Raw, TOA Reflectance), Annual greenest-pixel TOA Reflectance Composite | 22 August 1982–14 December 1993 | 30 | 16 | USGS |
| Landsat 5 MSS | Tier 1 and 2 (raw) | 1 March 1984–31 January 2013 | 30, 60 | 16 | USGS |
| Landsat 5 TM | Tier 1 and 2 (Raw, TOA reflectance, surface reflectance); 8 day, 32 day and annual composites (same as Landsat 4) | 1 January 1984–5 May 2012 | 30 | 16 | USGS |
| Landsat 7 | Tier 1 and 2 (Real time, Raw, TOA reflectance, surface reflectance); 8 day, 32 day and annual composites (same as Landsat 4) | 1 January 1999–present | 15, 30 | 16 | USGS |
| Landsat 8 | Tier 1 and 2 (Real time, Raw, TOA reflectance, surface reflectance); 8 day, 32 day and annual composites (same as Landsat 4) | 11 April 2013–present | 15, 30 | 16 | USGS |
| MODIS (Aqua and Terra) | Various bands, indices and composites | 24 February 2000–present | 250, 500, 1000 | 1 | NASA LP DAAC at the USGS EROS Center |
| DMSP OLS | Global Radiance-Calibrated Nighttime Lights Version 4, Defense Meteorological Program Operational Linescan System | 16 March 1996–July 2011 | ≈1 km (30 arc seconds) | NOAA | |
| DMSP OLS | Nighttime Lights Time Series Version 4, Defense Meteorological Program Operational Linescan System | 1 January 1992–1 January 2014 | ≈1 km (30 arc seconds) | NOAA | |
| NOAA AVHRR | Various bands, indices and composites | 24 June 1981–present | ≈1.09 km (Different products at different resolutions) | 1 | NOAA |
| ALOS/AVNIR-2 ORI | Orthorectified imagery from the Advanced Visible and Near Infrared Radiometer type 2 (AVNIR-2) sensor on-board the Advanced Land Observing Satellite (ALOS) “DAICHI”. | 26 April 2006–18 April 2011 | 10 | JAXA Earth Observation Research Center | |
| ALOS DSM | Global AW3D30 | 30 (1 arc second) | JAXA Earth Observation Research Center | ||
| SRTM | DEM 30m | 11 February 2000–22 February 2000 | 30 (1 arc second) | NASA/USGS/JPL-Caltech | |
| SRTM | DEM 90m version 4 | 11 February 2000–22 February 2000 | 90 | NASA/CGIAR | |
| ASTER | L1T Radiance | 4 March 2000–present | 15, 30, 90 | 5 | NASA LP DAAC at the USGS EROS Center |
| ASTER Global Emissivity Dataset | This product includes the mean emissivity and standard deviation for all five ASTER thermal infrared bands, mean land surface temperature (LST) and standard deviation, a re-sampled ASTER GDEM, land-water mask, mean Normalized Difference Vegetation Index (NDVI) and standard deviation, and observation count. | 1 January 2000–31 December 2008 | 100 | NASA | |
| TRMM 3B42 | 3-Hourly Precipitation Estimates | 1 January 1998–31 May 2018 | 0.25 arc degrees | NASA GSFC | |
| TRMM 3B43 | Monthly Precipitation Estimates | 1 January 1998–1 May 2018 | 0.25 arc degrees | NASA GSFC | |
| GPM Global Precipitation Measurement v5 | Data provided at 30 min cadence | 12 March 2014–present | 0.1 arc degrees | NASA PMM | |
| GSMaP Operational | Data provided at hourly cadence | 1 March 2014–present | 0.1 arc degrees | JAXA Earth Observation Research Center | |
| GSMaP Reanalysis | Data provided at hourly cadence | 1 March 2000–12 March 2014 | 0.1 arc degrees | JAXA Earth Observation Research Center | |
| CHIRPS Daily precipitation | Climate Hazards Group InfraRed Precipitation with Station Data (version 2.0 final) | 1 January 1981–31 July 2018 | 0.05 arc degrees | UCSB/CHG | |
| CHIRPS Pentad precipitation | Climate Hazards Group InfraRed Precipitation with Station Data (version 2.0 final) | 1 January 1981–26 July 2018 | 0.05 arc degrees | UCSB/CHG | |
| WorldClim V1 | Climatological and Bio variables | 1 January 1960–1 January 1991 | 30 arc seconds | University of California, Berkeley | |
| TerraClimate | Monthly Climate and Climatic Water Balance for Global Terrestrial Surfaces, University of Idaho | 1 January 1958–1 December 2017 | 2.5 arc minutes | 1 January 1958–1 December 2017 |
Abbreviations: European Space Agency (ESA), United States Geological Survey (USGS), TOA (Top of Atmosphere), Burn Area Index (BAI), Enhanced Vegetation index (EVI), Normalised Difference Snow index (NDSI), Normalised Difference Vegetation index (NDVI), Normalised Difference Water Index (NDWI), Moderate Resolution Imaging Spectrometer (MODIS), National Oceanographic and Atmospheric Administration Advanced very high resolution radiometer (NOAA AVHRR), The Defense Meteorological Program (DMSP) Operational Line-Scan System (OLS), Shuttle Radar Topography Mission (SRTM), Advanced Spaceborne Thermal Emission and Reflection Radiometer (ASTER), The Tropical Rainfall Measuring Mission (TRMM), Goddard Space Flight Center (GSFC). The Japan Aerospace Exploration Agency (JAXA).
Table A2.
Country-wise breakdown of application regions of GEE based on the 300 journal papers surveyed.
Table A2.
Country-wise breakdown of application regions of GEE based on the 300 journal papers surveyed.
| Study Area | No. of Papers | Study Area | No. of Papers | Study Area | No. of Papers | Study Area | No. of Papers |
|---|---|---|---|---|---|---|---|
| U.S.A. | 60 | Spain | 3 | South Sudan | 2 | Rwanda | 1 |
| China | 24 | Burkina Faso | 3 | Mauritania | 2 | Djibouti | 1 |
| Brazil | 19 | Nepal | 3 | Hong Kong | 1 | Mauritius | 1 |
| India | 15 | Thailand | 3 | Trinidad and Tobago | 1 | Seychelles | 1 |
| Indonesia | 15 | Greece | 3 | Botswana | 1 | Benin | 1 |
| Australia | 14 | Sierra Leone | 4 | Morocco | 1 | Ivory Coast | 1 |
| Canada | 11 | Peru | 3 | Sweden | 1 | Cape Verde | 1 |
| South Africa | 10 | Brunei | 3 | Uruguay | 1 | Gambia | 1 |
| Italy | 7 | Singapore | 3 | Panama | 1 | Guinea | 2 |
| Kenya | 7 | Tajikistan | 3 | Mongolia | 1 | Guinea-Bissau | 1 |
| Malaysia | 7 | Bolivia | 2 | Taiwan | 1 | Liberia | 2 |
| Vietnam | 6 | Mexico | 2 | East Timor | 1 | Togo | 2 |
| Myanmar | 6 | Poland | 2 | Finland | 1 | Albania | 1 |
| Russia | 6 | Turkey | 2 | Iraq | 1 | Austria | 1 |
| Bangladesh | 5 | Papua New Guinea | 2 | Iran | 1 | Bulgaria | 1 |
| Zambia | 5 | Ethiopia | 3 | Afghanistan | 1 | Croatia | 1 |
| Germany | 5 | Malawi | 2 | Tibet (China) | 1 | Czech Republic | 1 |
| Philippines | 5 | Japan | 2 | Scotland | 1 | Hungary | 1 |
| Nigeria | 6 | South Korea | 2 | New Zealand | 1 | Macedonia | 1 |
| Namibia | 5 | United Arab Emirates | 2 | Paraguay | 1 | Moldova | 1 |
| Jordan | 4 | Madagascar | 3 | Colombia | 1 | Montenegro | 1 |
| Argentina | 4 | Mozambique | 3 | Angola | 1 | Romania | 1 |
| Laos | 4 | Tanzania | 3 | French Guiana | 1 | Serbia | 1 |
| U.K. | 4 | Pakistan | 2 | Ecuador | 1 | Slovak Republic | 1 |
| Zimbabwe | 4 | Sri Lanka | 2 | Belize | 1 | Slovenia | 1 |
| Senegal | 4 | Bhutan | 2 | American Samoa | 1 | Switzerland | 1 |
| Swaziland | 4 | Kazakhstan | 2 | Vanuatu | 1 | Cyprus | 1 |
| North Korea | 4 | Gabon | 3 | Tonga | 1 | Lebanon | 1 |
| Cambodia | 4 | Syria | 2 | French Polynesia | 1 | Palestine | 1 |
| Niger | 4 | Puerto Rico | 2 | Cuba | 1 | Egypt | 1 |
| France | 4 | Bosnia and Herzegovina | 2 | Dominican Republic | 1 | Algeria | 1 |
| Israel | 3 | Ghana | 3 | Jamaica | 1 | Chad | 1 |
| Costa Rica | 3 | Somalia | 2 | Maldives | 1 | Cameroon | 2 |
| Ireland | 3 | Ukraine | 2 | Uzbekistan | 1 | Central African Republic | 2 |
| Democratic Republic of Congo | 4 | Haiti | 2 | Burundi | 2 | Cote d’Ivoire | 1 |
| Mali | 3 | Eritrea | 2 | Uganda | 2 | Equatorial Guinea | 1 |
Table A3.
Origin of affiliated institutions of all authors in the 300 GEE based research publications.
Table A3.
Origin of affiliated institutions of all authors in the 300 GEE based research publications.
| Country | No. of Authors | Country | No. of Authors | Country | No. of Authors | Country | No. of Authors |
|---|---|---|---|---|---|---|---|
| U.S.A. | 589 | Greece | 13 | Namibia | 4 | Philippines | 2 |
| Italy | 120 | Israel | 13 | Puerto Rico | 4 | Turkey | 2 |
| Australia | 86 | India | 12 | Saudi Arabia | 4 | Belize | 1 |
| Germany | 79 | Japan | 12 | Sri Lanka | 4 | Costa Rica | 1 |
| China | 68 | Singapore | 9 | Swaziland | 4 | Czech Republic | 1 |
| U.K. | 65 | Kenya | 8 | Ukraine | 4 | French Polynesia | 1 |
| Brazil | 58 | Russia | 8 | Benin | 3 | Kazakhstan | 1 |
| Netherland | 46 | Jordan | 7 | Denmark | 3 | Kuwait | 1 |
| Canada | 37 | Sweden | 7 | Hong Kong | 3 | Laos | 1 |
| France | 28 | Argentina | 6 | Indonesia | 3 | Nepal | 1 |
| South Africa | 24 | Ireland | 6 | Papua New Guinea | 3 | Nigeria | 1 |
| Belgium | 16 | Ghana | 5 | Trinidad and Tobago | 3 | Poland | 1 |
| Spain | 16 | Norway | 5 | Cyprus | 2 | South Korea | 1 |
| Switzerland | 16 | Zambia | 5 | Ethiopia | 2 | Tunisia | 1 |
| Austria | 15 | Bangladesh | 4 | Morocco | 2 |
References
- Gorelick, N.; Hancher, M.; Dixon, M.; Ilyushchenko, S.; Thau, D.; Moore, R. Google Earth Engine: Planetary-scale geospatial analysis for everyone. Remote. Sens. Environ. 2017, 202, 18–27. [Google Scholar] [CrossRef]
- Moore, R.; Parsons, E. Beyond SDI, bridging the power of cloud based computing resources to manage global environment issues. In Proceedings of the INSPIRE Conference, Edinburgh, UK, 27 June–1 July 2011. [Google Scholar]
- Hansen, M.; Potapov, P.; Moore, R.; Hancher, M.; Turubanova, S.; Tyukavina, D.; Stehman, S.; Goetz, S.; Loveland, T.; Kommareddy, A. Observing the forest and the trees: The first high resolution global maps of forest cover change. Science 2013, 342, 850–853. [Google Scholar] [CrossRef] [PubMed]
- Xiong, J. Cloud Computing for Scientific Research; Scientific Research Publishing Inc.: New York, NY, USA, 2018; p. 256. [Google Scholar]
- Shoko, C.; Mutanga, O.; Dube, T. Progress in the remote sensing of C3 and C4 grass species aboveground biomass over time and space. ISPRS J. Photogramm. Remote. Sens. 2016, 120, 13–24. [Google Scholar] [CrossRef]
- Gorelick, N. Google Earth Engine. In EGU General Assembly Conference Abstracts; American Geophysical Union: Vienna, Austria, 2013; p. 11997. [Google Scholar]
- Hansen, C.H. Google Earth Engine as a Platform for Making Remote Sensing of Water Resources a Reality for Monitoring Inland Waters. Available online: https://www.researchgate.net/profile/Carly_Hansen/publication/277021226_Google_Earth_Engine_as_a_Platform_for_Making_Remote_Sensing_of_Water_Resources_a_Reality_for_Monitoring_Inland_Waters/links/555f8c2a08ae9963a118b3e2.pdf (accessed on 18 July 2018).
- Huntington, J.L.; Hegewisch, K.C.; Daudert, B.; Morton, C.G.; Abatzoglou, J.T.; McEvoy, D.J.; Erickson, T. Climate Engine: Cloud Computing and Visualization of Climate and Remote Sensing Data for Advanced Natural Resource Monitoring and Process Understanding. Bull. Am. Meteorol. Soc. 2017. [Google Scholar] [CrossRef]
- Johnson, B.A.; Iizuka, K.; Bragais, M.A.; Endo, I.; Magcale-Macandog, D.B. Employing crowdsourced geographic data and multi-temporal/multi-sensor satellite imagery to monitor land cover change: A case study in an urbanizing region of the Philippines. Comput. Environ. Urban Syst. 2017, 64, 184–193. [Google Scholar] [CrossRef]
- Aguilar, R.; Zurita-Milla, R.; Izquierdo-Verdiguier, E.; de By, R.A. A Cloud-Based Multi-Temporal Ensemble Classifier to Map Smallholder Farming Systems. Remote. Sens. 2018, 10, 729. [Google Scholar] [CrossRef]
- Lemoine, G.; Léo, O. Crop mapping applications at scale: Using Google Earth Engine to enable global crop area and status monitoring using free and open data sources. In Proceedings of the 2015 IEEE International Geoscience and Remote Sensing Symposium (IGARSS), Milan, Italy, 26–31 July 2015; pp. 1496–1499. [Google Scholar]
- Horowitz, F.G. MODIS Daily Land Surface Temperature Estimates in Google Earth Engine as an Aid in Geothermal Energy Siting. In Proceedings of the World Geothermal Congress 2015, Melbourne, Australia, 19–25 April 2015. [Google Scholar]
- Huang, H.; Chen, Y.; Clinton, N.; Wang, J.; Wang, X.; Liu, C.; Gong, P.; Yang, J.; Bai, Y.; Zheng, Y. Mapping major land cover dynamics in Beijing using all Landsat images in Google Earth Engine. Remote. Sens. Environ. 2017. [Google Scholar] [CrossRef]
- Johansen, K.; Phinn, S.; Taylor, M. Mapping woody vegetation clearing in Queensland, Australia from landsat imagery using the Google Earth Engine. Remote. Sens. Appl. Soc. Environ. 2015, 1, 36–49. [Google Scholar] [CrossRef]
- Abdel-Rahman, E.M.; Mutanga, O.; Adam, E.; Ismail, R. Detecting Sirex noctilio grey-attacked and lightning-struck pine trees using airborne hyperspectral data, random forest and support vector machines classifiers. ISPRS J. Photogramm. Remote. Sens. 2014, 88, 48–59. [Google Scholar] [CrossRef]
- Moore, R.; Hansen, M. Google Earth Engine: A New Cloud-Computing Platform for Global-Scale Earth Observation Data and Analysis. Available online: http://adsabs.harvard.edu/abs/2011AGUFMIN43C..02M (accessed on 20 September 2019).
- Dube, T.; Mutanga, O.; Ismail, R. Quantifying aboveground biomass in African environments: A review of the trade-offs between sensor estimation accuracy and costs. Trop. Ecol. 2016, 57, 393–405. [Google Scholar]
- Mutanga, O.; Dube, T.; Omer, G. Remote Sensing of Crop Health for Food Security in Africa: Potentials and Constraints. Remote. Sens. Appl. Soc. Environ. 2017, 8, 231–238. [Google Scholar] [CrossRef]
- Cossu, R.; Petitdidier, M.; Linford, J.; Badoux, V.; Fusco, L.; Gotab, B.; Hluchy, L.; Lecca, G.; Murgia, F.; Plevier, C. A roadmap for a dedicated Earth Science Grid platform. Earth Sci. Inform. 2010, 3, 135–148. [Google Scholar] [CrossRef] [Green Version]
- Xiong, J.; Thenkabail, P.S.; Gumma, M.K.; Teluguntla, P.; Poehnelt, J.; Congalton, R.G.; Yadav, K.; Thau, D. Automated cropland mapping of continental Africa using Google Earth Engine cloud computing. ISPRS J. Photogramm. Remote. Sens. 2017, 126, 225–244. [Google Scholar] [CrossRef]
- Du Plessis, H.; Van Niekerk, A. A new GISc framework and competency set for curricula development at South African universities. S. Afr. J. Geomat. 2014, 3, 1–12. [Google Scholar]
- Maguire, D.J.; Longley, P.A. The emergence of geoportals and their role in spatial data infrastructures. Comput. Environ. Urban Syst. 2005, 29, 3–14. [Google Scholar] [CrossRef]
- Salager-Meyer, F. Scientific publishing in developing countries: Challenges for the future. J. Engl. Acad. Purp. 2008, 7, 121–132. [Google Scholar] [CrossRef]
- Gibbs, W.W. Lost science in the third world. Sci. Am. 1995, 273, 92–99. [Google Scholar] [CrossRef]
- Galvez, A.; Maqueda, M.; Martinez-Bueno, M.; Valdivia, E. Scientific Publication Trends and the Developing World: What can the volume and authorship of scientific articles tell us about scientific progress in various regions? Am. Sci. 2000, 88, 526–533. [Google Scholar]
- Krishna, V.; Waast, R.; Gaillard, J. Scientific Communities in the Developing World; Sage: Thousand Oaks, CA, USA, 1996. [Google Scholar]
- Duque, R.B.; Ynalvez, M.; Sooryamoorthy, R.; Mbatia, P.; Dzorgbo, D.-B.S.; Shrum, W. Collaboration paradox: Scientific productivity, the Internet, and problems of research in developing areas. Soc. Stud. Sci. 2005, 35, 755–785. [Google Scholar] [CrossRef]
Figure 1.
A breakdown of applications of GEE by continents. This figure includes those studies conducted at continental scales only. There were 50 such studies in total.
Figure 1.
A breakdown of applications of GEE by continents. This figure includes those studies conducted at continental scales only. There were 50 such studies in total.

Figure 2.
A breakdown of applications of GEE by country. If a study included several countries, then all those countries were included in the count each time. The countries in grey had no studies. This figure does not show the institution of the authors but the actual study sites.
Figure 2.
A breakdown of applications of GEE by country. If a study included several countries, then all those countries were included in the count each time. The countries in grey had no studies. This figure does not show the institution of the authors but the actual study sites.

Figure 3.
A broad categorization of application disciplines of GEE across the 300 papers surveyed in this research. There is always subjectivity involved in differentiating the “Forest and Vegetation” category and the “Landuse/Landcover” category. Together these two categories account for most of the GEE applications across the 300 papers surveyed.

Figure 4.
Satellite data source used in GEE research across the 300 papers surveyed. The “Other Satellite Imagery” category consisted of data such as IKONOS, Advanced Spaceborne Thermal Emission and Reflection Radiometer (ASTER), Medium Resolution Imaging Spectrometer (MERIS), Light Detection and ranging (LiDAR), Synthetic Aperture Radar (SAR), Proba, and Environmental Satellite (ENVISAT).

Figure 5.
Distribution of the first author’s affiliated institution (based on the address provided in the manuscript) for the 300 papers surveyed. Where multiple affiliations were provided by an author, only the first affiliation was considered.
Figure 5.
Distribution of the first author’s affiliated institution (based on the address provided in the manuscript) for the 300 papers surveyed. Where multiple affiliations were provided by an author, only the first affiliation was considered.

Figure 6.
Distribution of all authors’ affiliated institutions (based on the address provided in the manuscript) for the 300 papers surveyed. There were a total of 1447 authors across the 300 journal papers. Where multiple affiliations were provided by an author, only the first affiliation was considered.

Table 1.
Number of journal papers utilizing the GEE platform published each year since inception. Note that for 2017, the data is until 30 June.
Table 1.
Number of journal papers utilizing the GEE platform published each year since inception. Note that for 2017, the data is until 30 June.
| Year | Number of Papers |
|---|---|
| 2011 | 9 |
| 2012 | 10 |
| 2013 | 10 |
| 2014 | 25 |
| 2015 | 47 |
| 2016 | 109 |
| 2017 | 90 |
© 2018 by the authors. Licensee MDPI, Basel, Switzerland. This article is an open access article distributed under the terms and conditions of the Creative Commons Attribution (CC BY) license (http://creativecommons.org/licenses/by/4.0/).
Share and Cite
MDPI and ACS Style
Kumar, L.; Mutanga, O. Google Earth Engine Applications Since Inception: Usage, Trends, and Potential. Remote Sens. 2018, 10, 1509. https://0-doi-org.brum.beds.ac.uk/10.3390/rs10101509
AMA Style
Kumar L, Mutanga O. Google Earth Engine Applications Since Inception: Usage, Trends, and Potential. Remote Sensing. 2018; 10(10):1509. https://0-doi-org.brum.beds.ac.uk/10.3390/rs10101509
Chicago/Turabian StyleKumar, Lalit, and Onisimo Mutanga. 2018. "Google Earth Engine Applications Since Inception: Usage, Trends, and Potential" Remote Sensing 10, no. 10: 1509. https://0-doi-org.brum.beds.ac.uk/10.3390/rs10101509
Note that from the first issue of 2016, this journal uses article numbers instead of page numbers. See further details here.