Article

Evaluation of Collection-6 MODIS Land Surface Temperature Product Using Multi-Year Ground Measurements in an Arid Area of Northwest China

1
Key Laboratory of Western China’s Environmental Systems (Ministry of Education), Lanzhou University, College of Earth and Environmental Sciences, Lanzhou University, Lanzhou 730000, China
2
Faculty of Geo-Information Science and Earth Observation (ITC), University of Twente, 7500 AE Enschede, The Netherlands
3
School of Civil Engineering, Lanzhou University of Technology, Lanzhou 730050, China
*
Author to whom correspondence should be addressed.
Remote Sens. 2018, 10(11), 1852; https://0-doi-org.brum.beds.ac.uk/10.3390/rs10111852
Submission received: 19 September 2018 / Revised: 14 November 2018 / Accepted: 17 November 2018 / Published: 21 November 2018

Abstract

:
Moderate Resolution Imaging Spectroradiometer (MODIS) land surface temperature (LST) products are widely used in ecology, hydrology, vegetation monitoring, and global circulation models. Compared to the collection-5 (C5) LST products, the newly released collection-6 (C6) LST products have been refined over bare soil pixels. This study aims to evaluate the C6 MODIS 1-km LST product using multi-year in situ data covering barren surfaces. Evaluation using all in situ data shows that the MODIS C6 LSTs are underestimated with a root-mean-square error (RMSE) of 2.59 K for the site in the Gobi area, 3.05 K for the site in the sand desert area, and 2.86 K for the site in the desert steppe area at daytime. For nighttime LSTs, the RMSEs are 2.01 K, 2.88 K, and 1.80 K for the three sites, respectively. Both biases and RMSEs also show strong seasonal signals. Compared to the error of C5 1-km LSTs, the RMSE of C6 1-km LST product is smaller, especially for daytime LSTs, with a value of 2.24 K compared to 3.51 K. The large errors in the sand desert region are presumably due to the lack of global representativeness of the magnitude of emissivity adjustment and misclassification for the barren surface causing error in emissivities. It indicates that the accuracy of the MODIS C6 LST product might be further improved through emissivity adjustment with globally representative magnitude and accurate land cover classification. From this study, the MODIS C6 1-km LST product is recommended for applications.

Graphical Abstract

1. Introduction

Land surface temperature (LST) is a key parameter in the physics of land surface processes on regional and global scales [1]. The thermal infrared (TIR) instruments on board satellites are the main available operational systems to collect LST data that has been widely used in drought detection [2,3], evapotranspiration monitoring [4], radiation budget estimation [5,6], and land-atmosphere exchange simulation [7].
MOD11A1 (MYD11A1) and MOD11B1 (MYD11B1) are two standard daily LST products derived from the observations of the Moderate Resolution Imaging Spectroradiometer (MODIS) on board the Terra and Aqua satellites. These two LST products are retrieved separately by a generalized split-window (GSW) algorithm [8] and the day/night algorithm [9], which are available in their current collection of 4, 5, and 6 (or Version 4, 5, 6) starting from 2000 (for products from Terra observations) and 2002 (for products from Aqua observations), respectively. The impact of any version changes in LST products needs to be well characterized such that users can understand the impact of the changes on their studies [10]. The accuracy assessment of these products is also helpful for improving the generation of these products [11]. Consequently, validation of these products is important, and validation activities have been supported by the NASA’s Earth Observing System (EOS) project [12,13,14].
In terms of the unsatisfied accuracy of collection-5 (C5) LSTs in semi-arid and arid areas (e.g., the LST errors are greater than 2 K and up to 4.5 K) as reported in References [15,16], three refinements are performed in the V6.3.0 daily LST Product Generation Executive (PGE) 16 code and the derived products are labeled as collection-6 or version-6 (C6 or V6) [16]. The radiance-based validation on the C6 product showed that the LST error was generally less than 1 K, but 1.9 K in some cases in the desert of North Africa and even greater than 2 K in some other bare soil sites [16,17]. A cross-satellite comparison using the Advanced Spaceborne Thermal Emission Reflection Radiometer (ASTER) retrieved LST product showed that the errors of the C6 MODIS LST varied between 0.7 K and 2.3 K for bare soil surfaces over regions located in North/South America and Northern/Southern Africa [18]. However, the MODIS C5 LST product does not work well either in the Gobi or desert steppe, which are widely distributed in semi-arid and arid areas of Asia. Evaluation of the C6 LST products in these regions is not only important for promoting scientific research in the field of desertification, sustainability of ecosystems, and climate change in these areas, but also complements the validation work on the new version of the globally standard LST product around the world. Thus, the present study aims to evaluate the MODIS C6 1-km LST product using multi-year ground-based measurements at three sites located in an arid area of northwest China, where the sand desert, Gobi, and desert steppe are the main land cover types. With these materials and a temperature-based evaluation method (T-based method) described in Section 2, the accuracy of the new version MODIS LST product is reported in Section 3. The issues raised during the evaluation are discussed in Section 4. Finally, some conclusions are drawn in the last section.

2. Materials and Methods
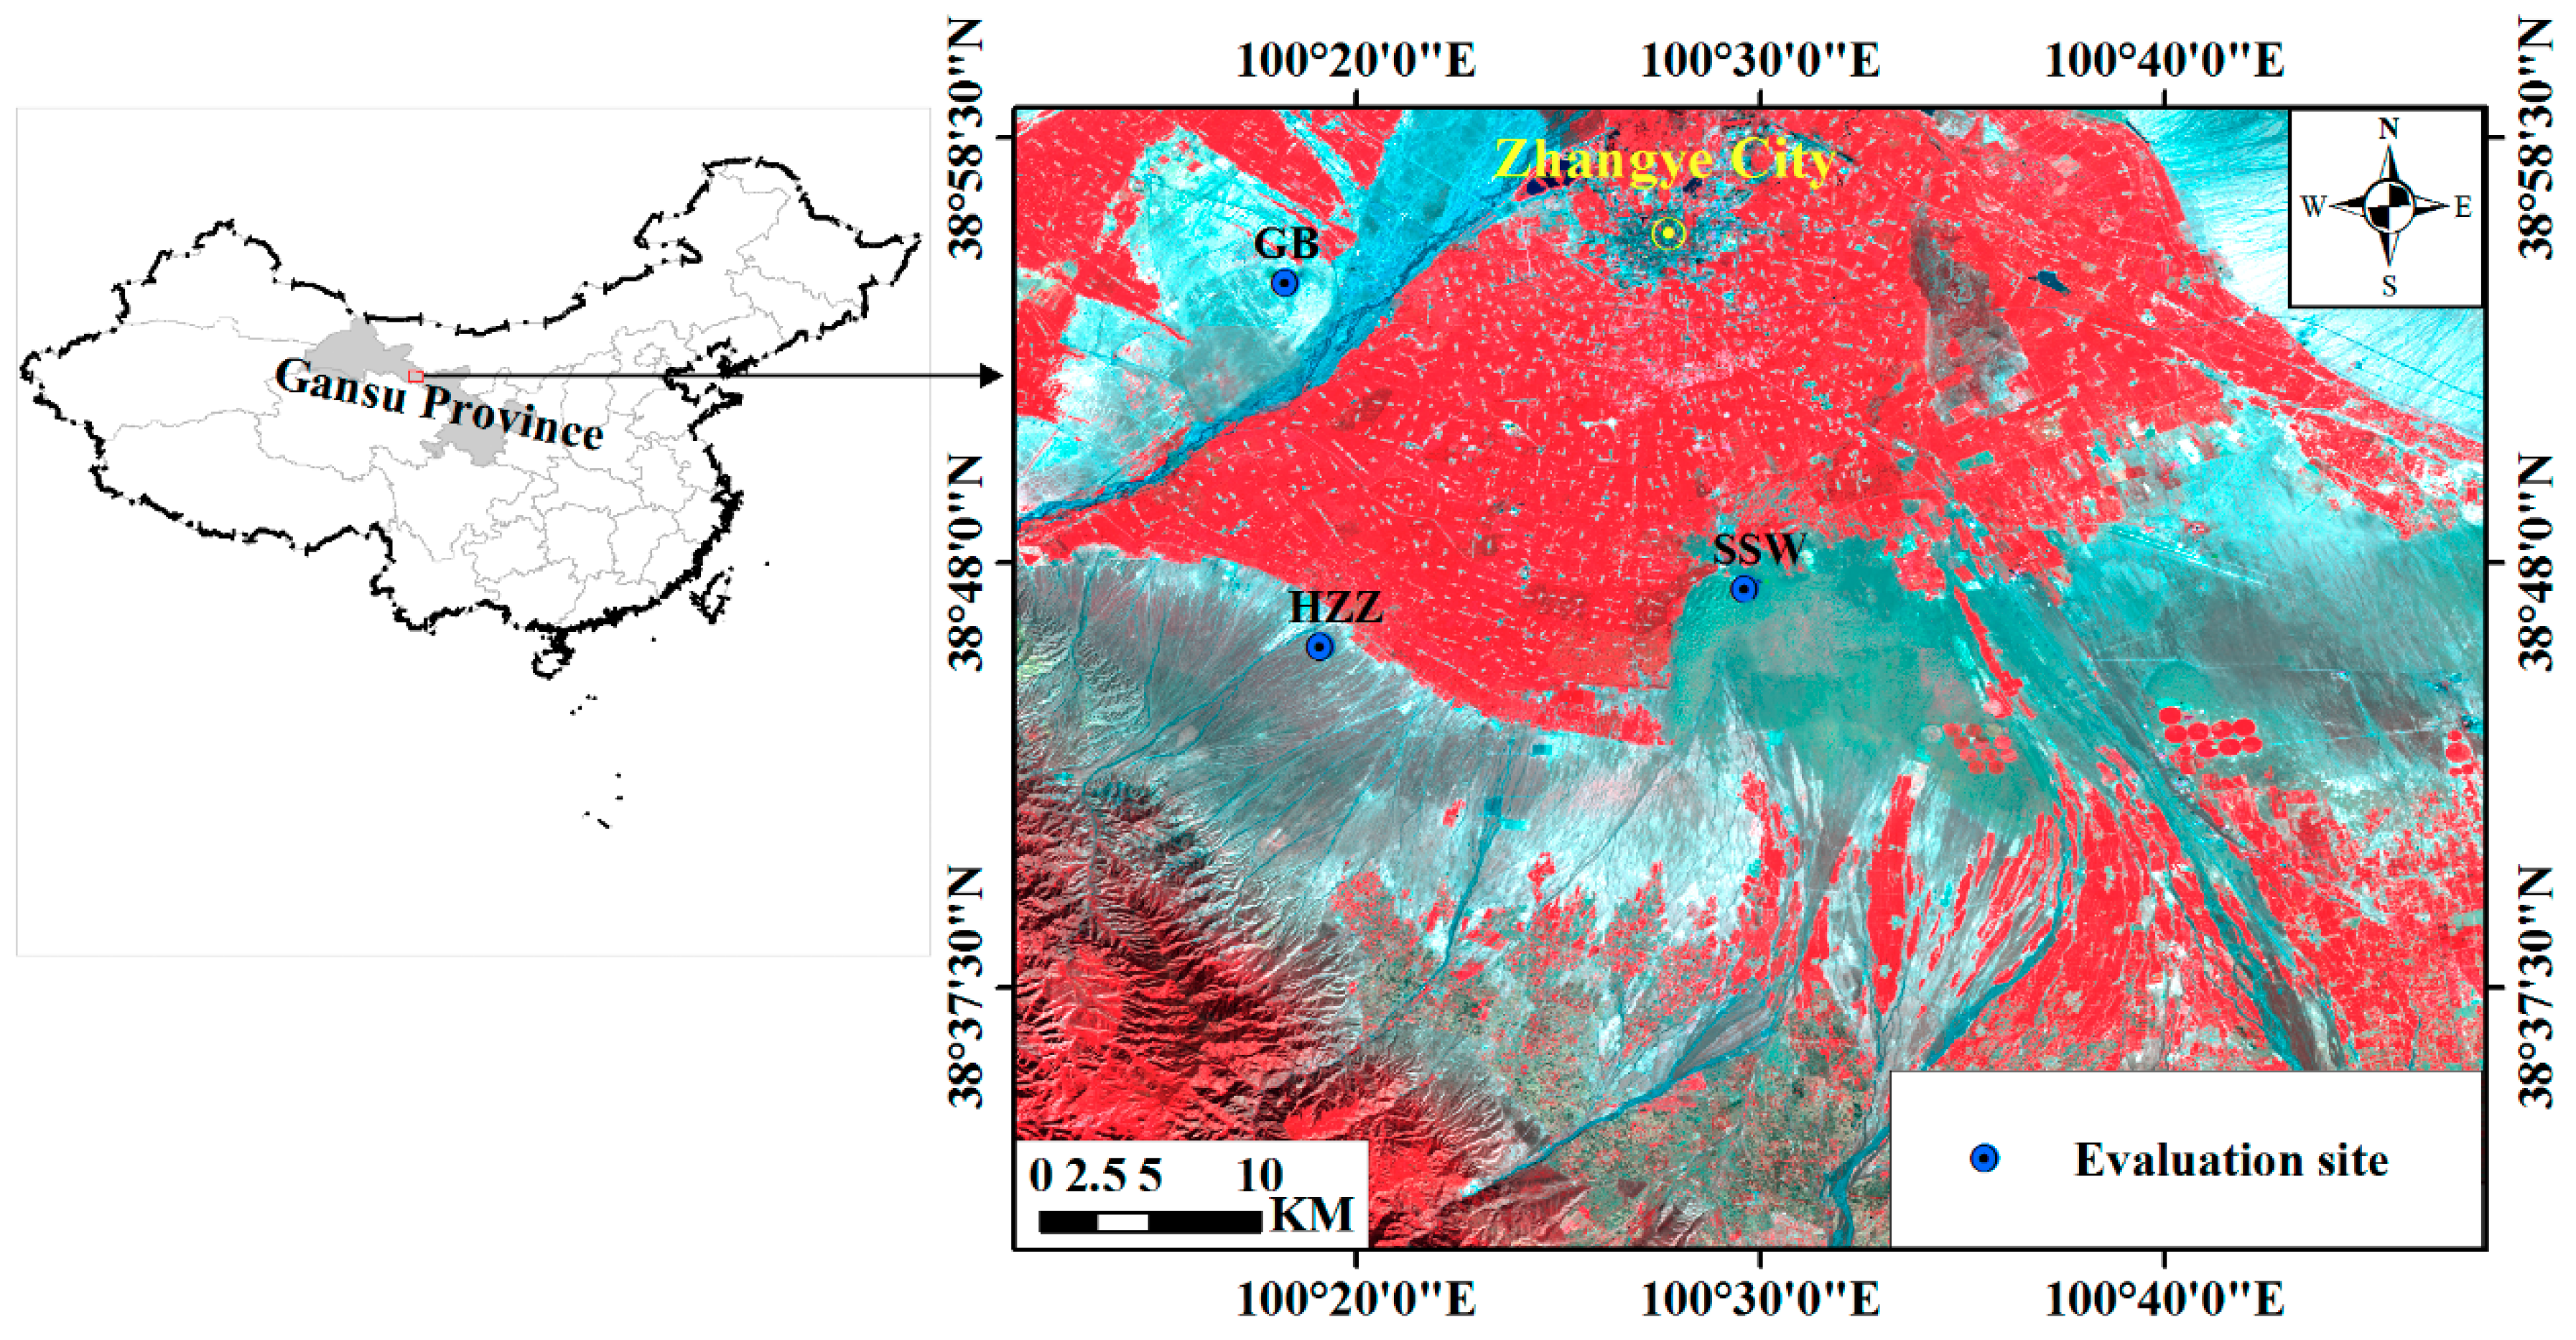
2.1. Study Area

The Heihe Watershed Allied Telemetry Experimental Research (HiWATER) is a watershed-scale eco-hydrological experiment conducted in the Heihe River Basin, an arid region in northwest China, as shown in Figure 1. The HiWATER experiment is designed to address the research questions concerning heterogeneity, scaling, uncertainty, and the water cycle at the watershed scale [19]. During the experiment, intensive and long-term observations were conducted in three key experimental areas, including the cold region experimental area in the mountain cryosphere of the upper reaches, the artificial oasis experimental area in the middle reaches, and the natural oasis experimental area downstream. Within each key experimental area, the foci experimental area, the experiment site, and the elementary sampling plot, were designed as hierarchically nested locations of multiscale ground observations [19].
In this study, multi-year ground observations from three sites collected by the HiWATER experiment were used for LST validation. The annual precipitation in this area is about 100–250 mm, and the annual potential evaporation is up to 1200–1800 mm. The sites are located in large flat areas around the oasis, as shown in Figure 1, covering three land cover types: Gobi, sand desert, and desert steppe, which are named as GB, SSW, and HZZ sites here, respectively, as shown in Table 1. The Gobi area is covered by small gravel, bare soil, and small Alhagi sparsifolia, which is a spiny, perennial subshrub. In the sand desert region, the ground surface is uniform with sand dunes that are approximately 10 to 20 m high and are covered sparsely with A. sparsifolia. The surface of the desert steppe consists of bare soil and sparse A. sparsifolia [15].

2.2. Data

2.2.1. Field Data

In the three sites, the Kipp and Zonen CNR1 net radiometers were placed at a height of 6 m (GB and SSW sites) or 2.5 m (HZZ site) above the ground to measure four radiation components (i.e., downwelling shortwave radiation, upwelling shortwave radiation, downwelling longwave radiation, and upwelling longwave radiation). Other meteorological instruments were also mounted on an automatic weather station (AWS) to measure air temperature, humidity, precipitation, and wind speed. The measurements covered the period from 22 July 2012 to 12 April 2015 at the GB site, from 8 June 2012 to 11 April 2015 at the SSW site, and from 4 June 2012 to 31 December 2016, were used in this study [20]. The data of the GB and SSW sites were sampled every 10 min, and measurements of the HZZ site were sampled every 30 min. Correspondingly, the ground-truth LST was estimated from the upwelling and downwelling longwave radiation using Equation (1):
T s = [ F ( 1 ε b ) F ε b σ ] 1 / 4
where T s is the LST, F and F are the surface upwelling longwave radiation and the atmospheric downwelling longwave radiation at the surface, respectively. σ is the Stefan–Boltzmann’s constant (5.67 × 10⁻⁸ Wm−2K−4). ε b is the broadband emissivity (BBE). In Reference [21], a model to produce BBE from ASTER narrowband emissivities was proposed with good accuracy (R2 = 0.983 and root mean square (RMS) of 0.005) [21].
ε b = 0.197 + 0.025 ε 10 + 0.057 ε 11 + 0.237 ε 12 + 0.333 ε 13 + 0.146 ε 14
where ε 10 ε 14 are the five ASTER narrowband emissivities.
During the HiWATER campaign, twelve ASTER images over the artificial oasis experimental area were collected from May to September of 2012, as listed in Table 2. The land surface temperature and emissivity were derived from the ASTER images by using the temperature emissivity separation (TES) algorithm [22] with a combination of the water vapor scaling (WVS) atmospheric correction method [23]. Previous studies have demonstrated that the TES method can recover temperature to within ±1.5 K and emissivities to within ±0.015 [24,25,26]. The ASTER land surface emissivities (LSEs) of the study area in HiWATER have been used for broadband emissivity calculation, and research of the effect of soil moisture on emissivity by References [15,27], respectively. Therefore, the ASTER LSEs derived from these 12 images are able to be used to calculate the BBE of every site by using Equation (2). Since the three sites have a low fraction of vegetation cover with little change, and the surface structure is rarely influenced by human activity, soil moisture can be considered as the unique parameter attributing to the emissivity variation [27], e.g., the increase of soil moisture caused by precipitation. According to the soil moisture measured by sensor CS616, Campbell, the GB and SSW sites were more arid than the HZZ site. In the HZZ site, the soil moisture was less than 0.3 m3/m3 between 2012 and 2016, and occasionally reached 0.4 m3/m3, which caused an increase of 0.03 for the BBE [27]. An error propagation analysis on Equation (1) showed that an error of 0.03 in BBE leads to an error in the derived LST of less than 0.5 K. In addition, the 12 images cover the rainy season, and the derived emissivities referred to both dry and wet soil conditions, hence they were representative during the study period. Consequently, the BBEs were derived from the ASTER LSEs by using Equation (2), and the values are 0.955 ± 0.007, 0.927 ± 0.008, and 0.968 ± 0.005 for GB, SSW, and HZZ sites, respectively. In Table 2, the standard deviation (SD) values of LSTs within 11 × 11 ASTER pixels (i.e., ~1 km) at the three sites are listed, and vary around 1 K. As per the analysis in Reference [15], the three barren surface sites have a relatively high thermal homogeneity in the daytime. At nighttime, the spatial variation of LST should be smaller. Therefore, the ground-based LSTs at these sites are representative in a MODIS 1-km pixel and can be used for validation on the MODIS 1-km LST product by using the direct temperature-based (T-based) method.

2.2.2. MODIS LST Products

The MODIS LST products are created as a sequence of products beginning with a swath and progressing to daily, eight-day, and monthly global gridded products by spatial and temporal transformation. The MOD11A1 (MYD11A1) product is a Level-3 daily standard MODIS LST/LSE product with a spatial resolution of 1 km (the exact grid size is 0.928 km), sinusoidally gridded from the Level-2 swath product (MOD11_L2/MYD11_L2), which is the result of the generalized split-window LST algorithm [8]. MOD11B1 (MYD11B1) is a daily Level-3 LST/LSE product in a sinusoidal projection with a spatial resolution of 6 km (accurately 5.56 km) for C6 (the same resolution as the C5 product but with a resolution of 5 km for C4 and 4.1, which is accurately 4.63 km) [28]. The product is generated by the day/night LST algorithm from pairs of daytime and nighttime observations in seven MODIS TIR bands (bands 20, 22, 23, 29, and 31–33) [9]. The average of the MOD11A1 product in a period of eight days produces the eight-day LST product MOD11A2. Other daily, eight-day, and monthly global LST products are in a geographic projection at the 0.25° spatial resolution of the climate modeling grid cells. All these products are derived from the MOD11A1 and MOD11B1 daily LST products, and their accuracy depends on the accuracy of these two products. Due to the large spatial resolution of the MOD11B1 product, it cannot be validated directly using the in situ measurements. Therefore, only the new version MOD11A1 and MYD11A1 LSTs were validated in this study.

2.3. Methods

According to the best practice protocol for validating LST products [29], the results of LST product validation were reported quantitatively by using the mean error (Bias), the standard deviation (SD), and the root-mean-square error (RMSE). Here, the SD represents the standard deviation of the difference between the MODIS product and the reference data (i.e., in situ data). They were calculated using the following equations:
B i a s = 1 n i = 1 n ( D M O D I S D R e f ) i
S D = i = 1 n ( D I F i B i a s ) 2 n 1
R M S E = 1 n i = 1 n ( D M O D I S D R e f ) i 2
where D M O D I S is the MODIS product, D R e f is the reference data (i.e., in situ data), D I F i denotes the difference between the MODIS product and the in situ data, n is the number of samples.

3. Results

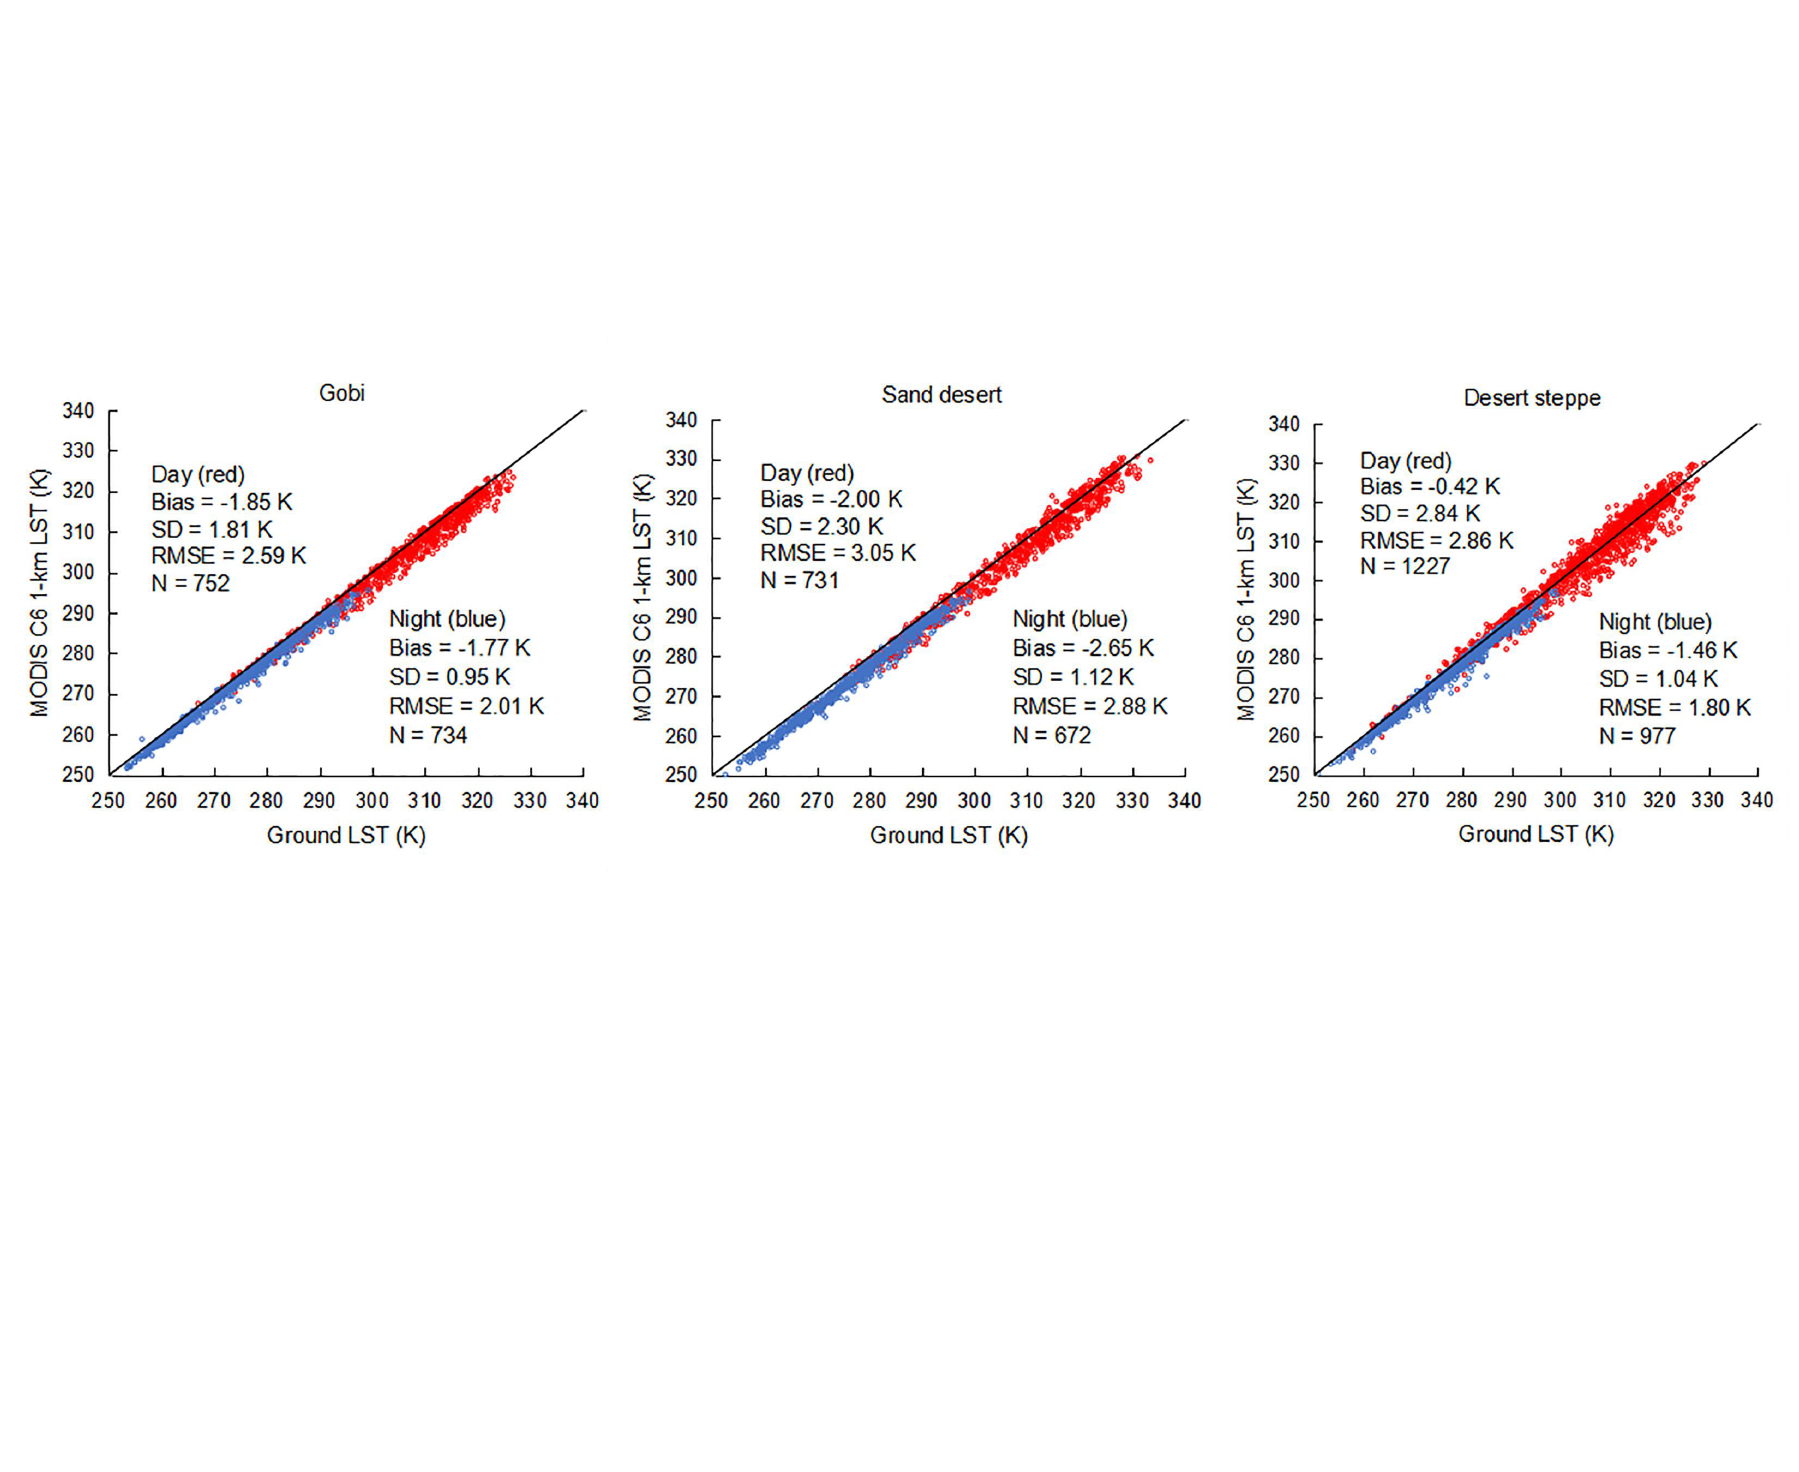
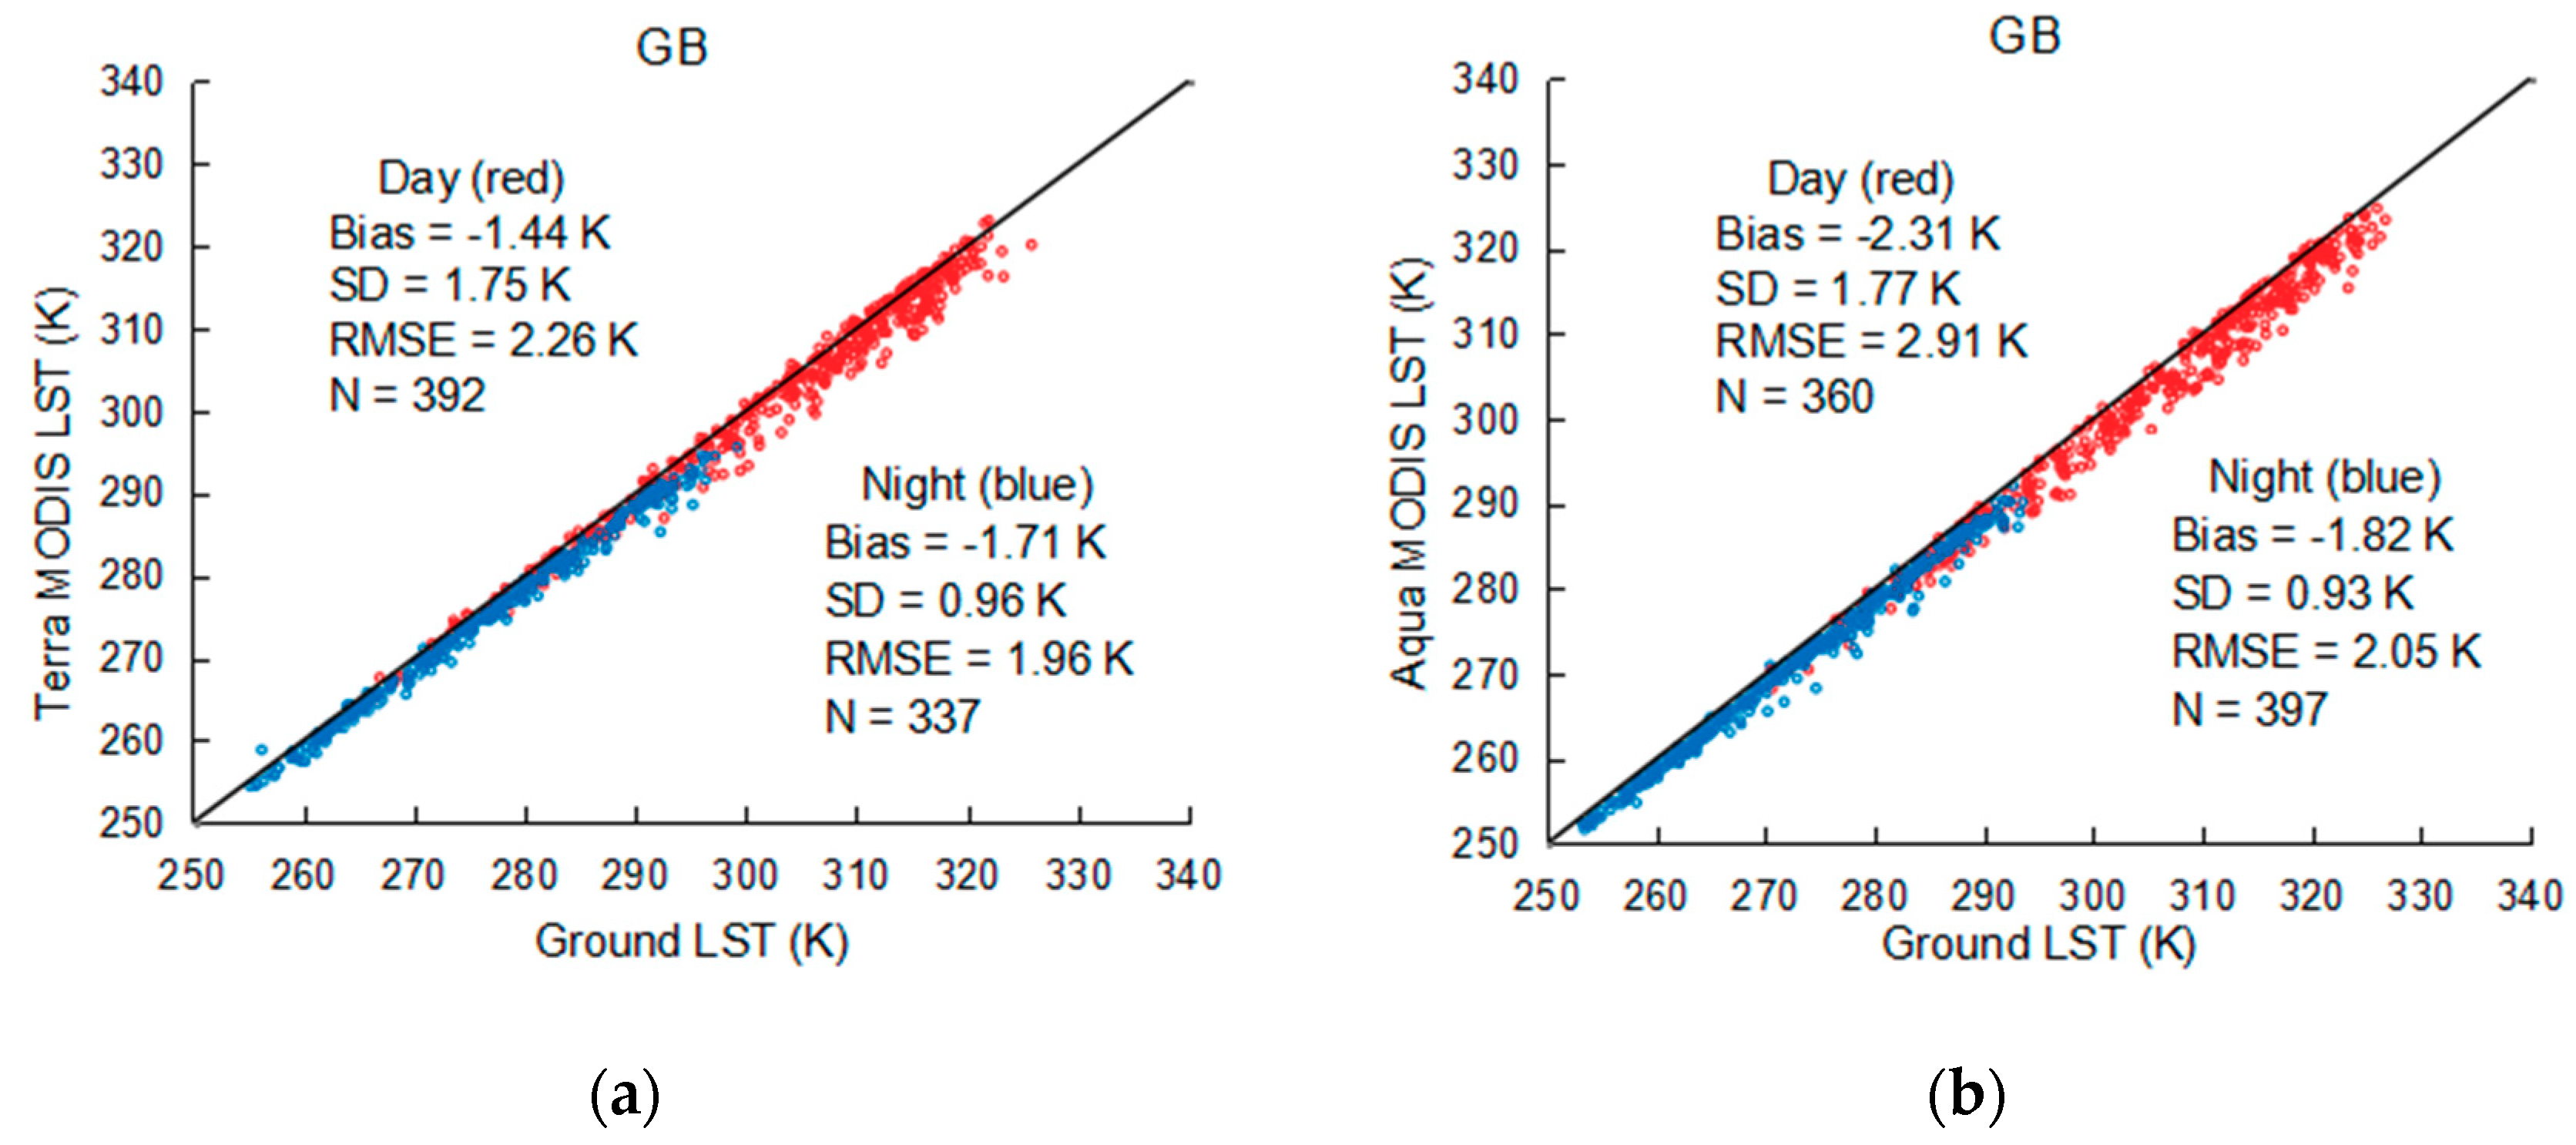
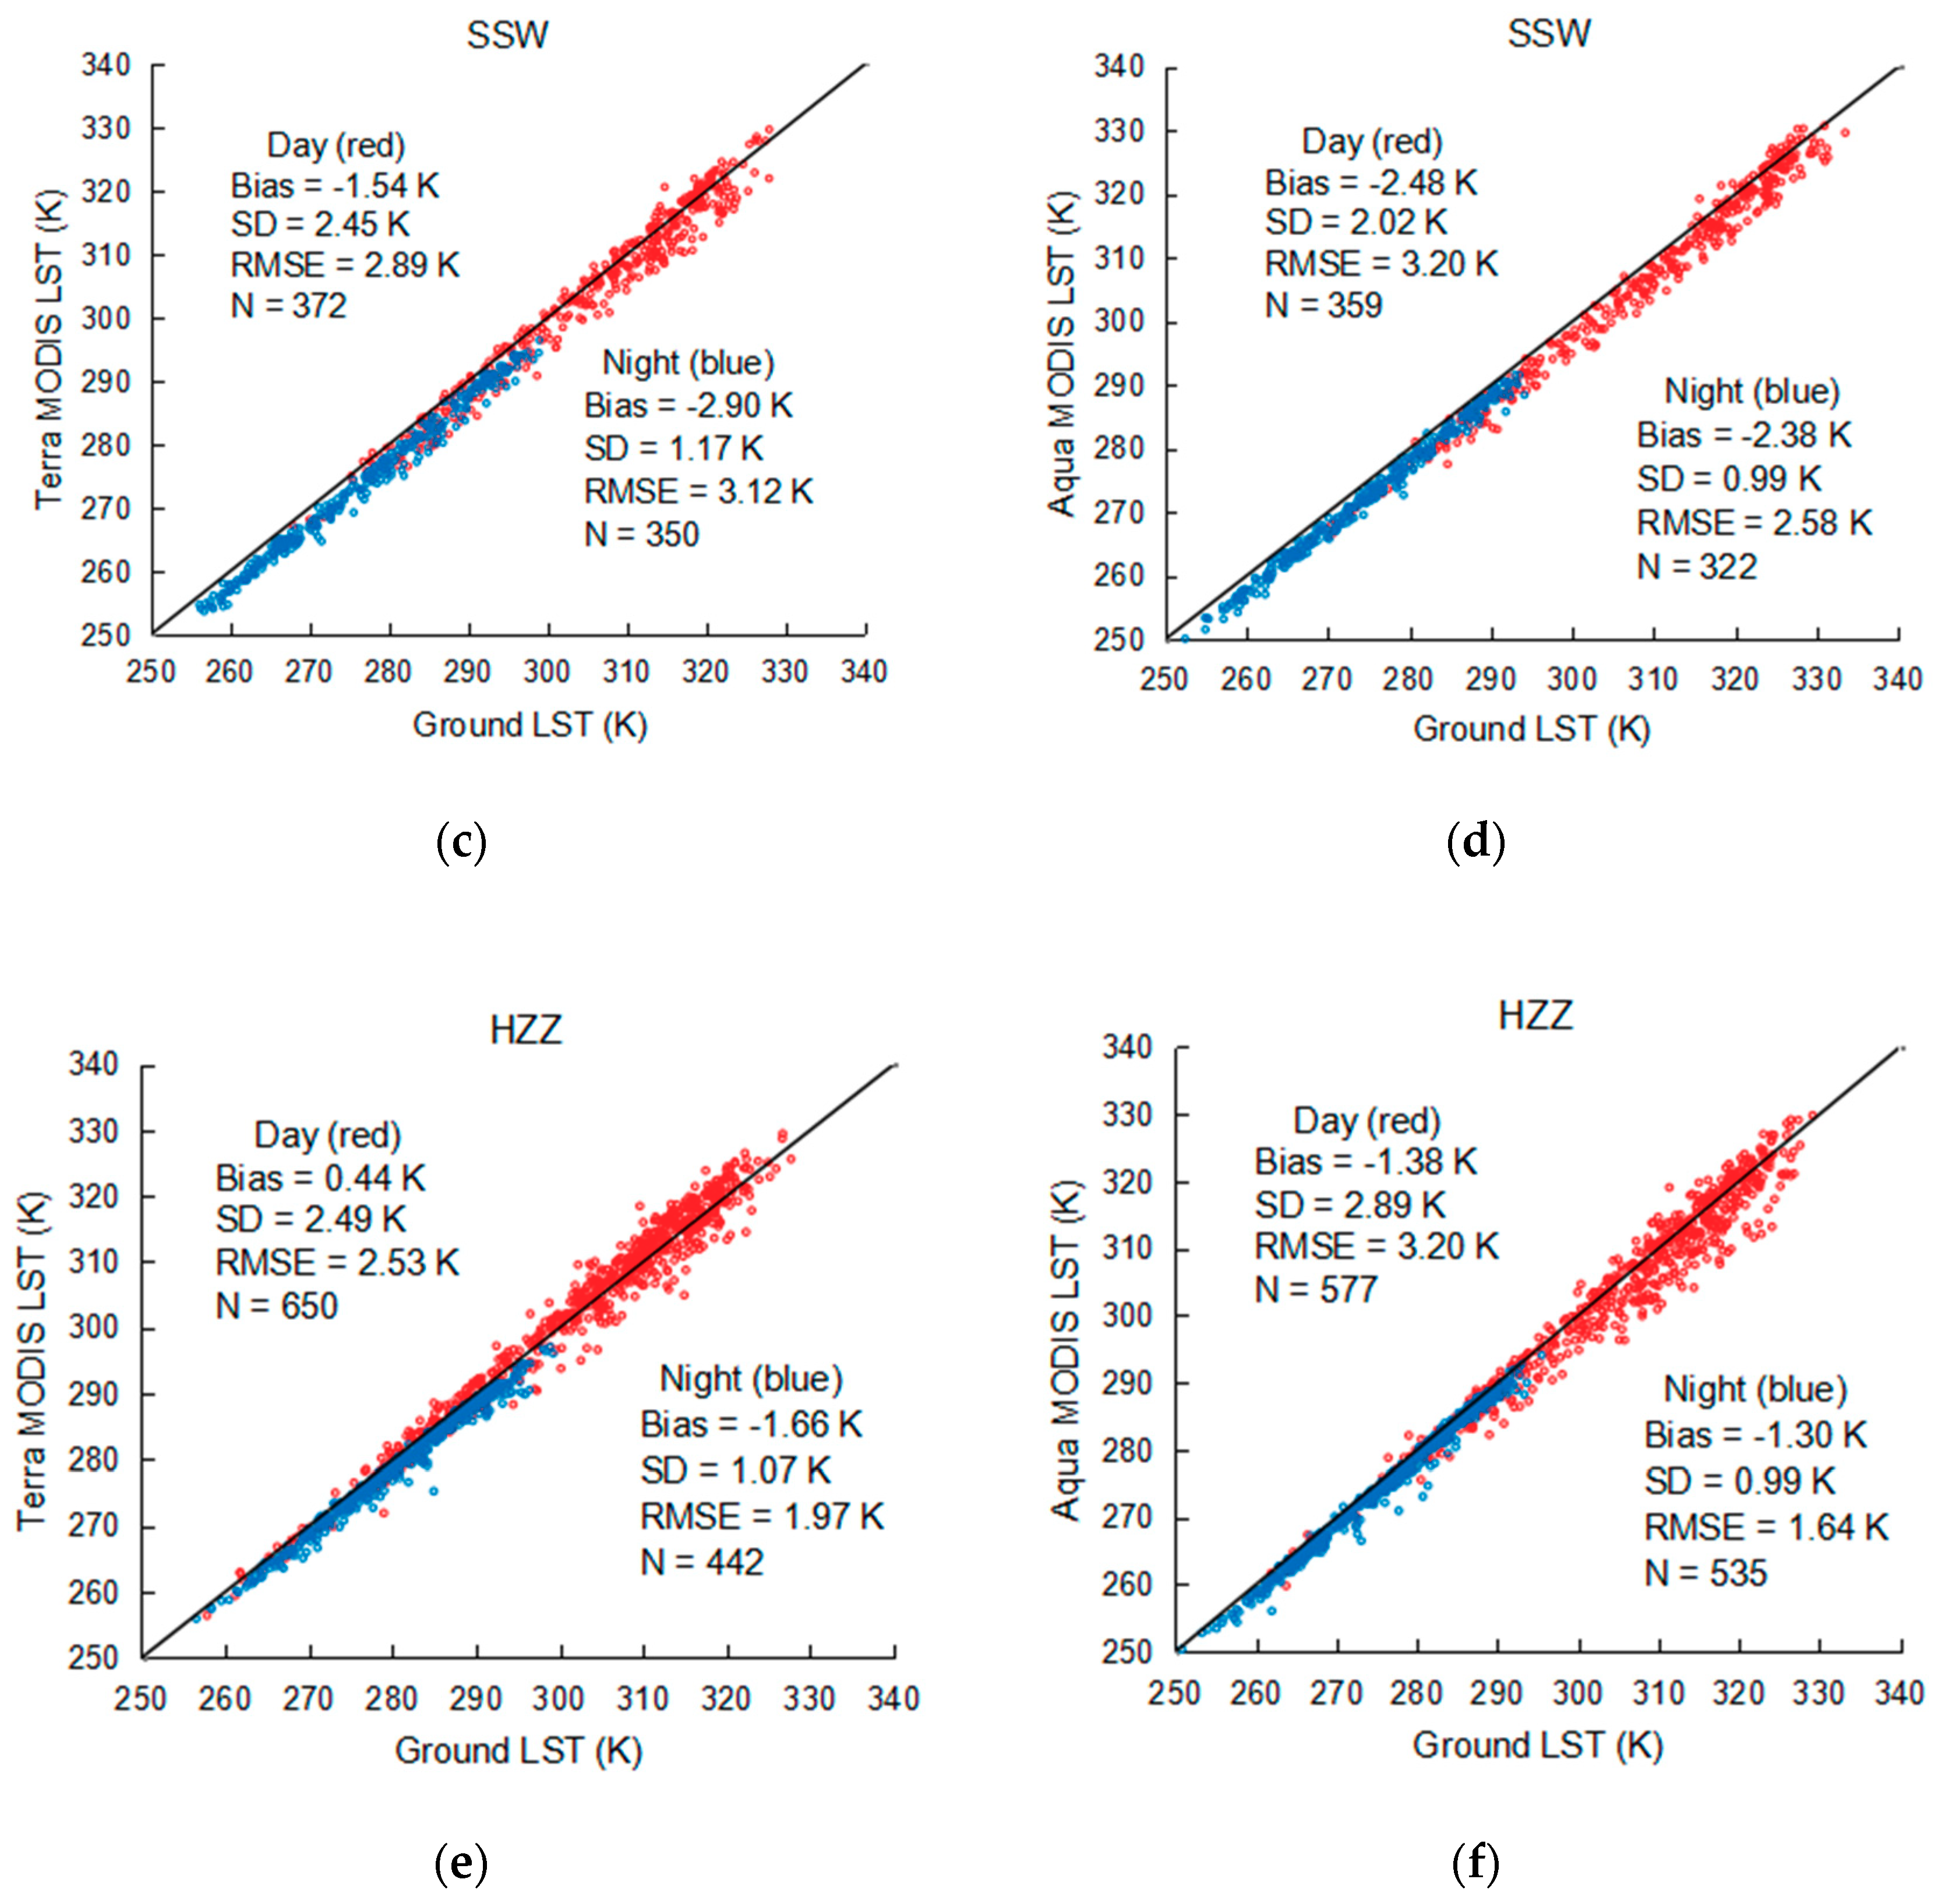
3.1. General Statistics

Figure 2 displays the scatterplots of MODIS LST derived from Terra observations and Aqua observations versus the ground LST between 2012 and 2015 (from 2012 to 2016 for the HZZ site) at the three sites. For daytime LST from Terra MODIS, the bias values are negative indicating an underestimation of the LST for the GB and SSW sites. For the HZZ site, it shows a small positive bias (0.44 K) representing a slight overestimation of the LST for the desert steppe surface. The RMSEs vary from 2.26 K (GB site) to 2.89 K (SSW site). For nighttime Terra MODIS LST, it is underestimated for all sites, and the RMSEs are smaller than those of the daytime LST, except for the SSW site with a large RMSE of 3.12 K. For LST from Aqua MODIS, the daytime values are underestimated for all sites, and the RMSEs are greater than those of the Terra MODIS LST (RMSEs of 2.91 K, 3.20 K, and 3.20 K for Aqua MODIS LST versus RMSEs of 2.26 K, 2.89 K, and 2.53 K for Terra MODIS LST at the GB, SSW, and HZZ sites, respectively). The nighttime LSTs are underestimated for all sites with RMSEs varying from 1.64 K (HZZ) to 2.58 K (SSW), which are less than the RMSEs of daytime LSTs. In general, the MODIS C6 1-km LST has a bias of −1.85 K and a RMSE of 2.59 K at daytime in the GB site, and a bias of −1.77 K and a RMSE of 2.01 K at nighttime. In the SSW site, the new version LST is underestimated by 2 K with a RMSE of 3.05 K at daytime, and the bias and RMSE are −2.65 K and 2.88 K at nighttime, respectively. In the HZZ site, the RMSE of MODIS LST at daytime is 2.86 K with a slight underestimation (Bias = −0.42 K), and the nighttime LST has a bias of −1.46 K and a RMSE of 1.80 K.

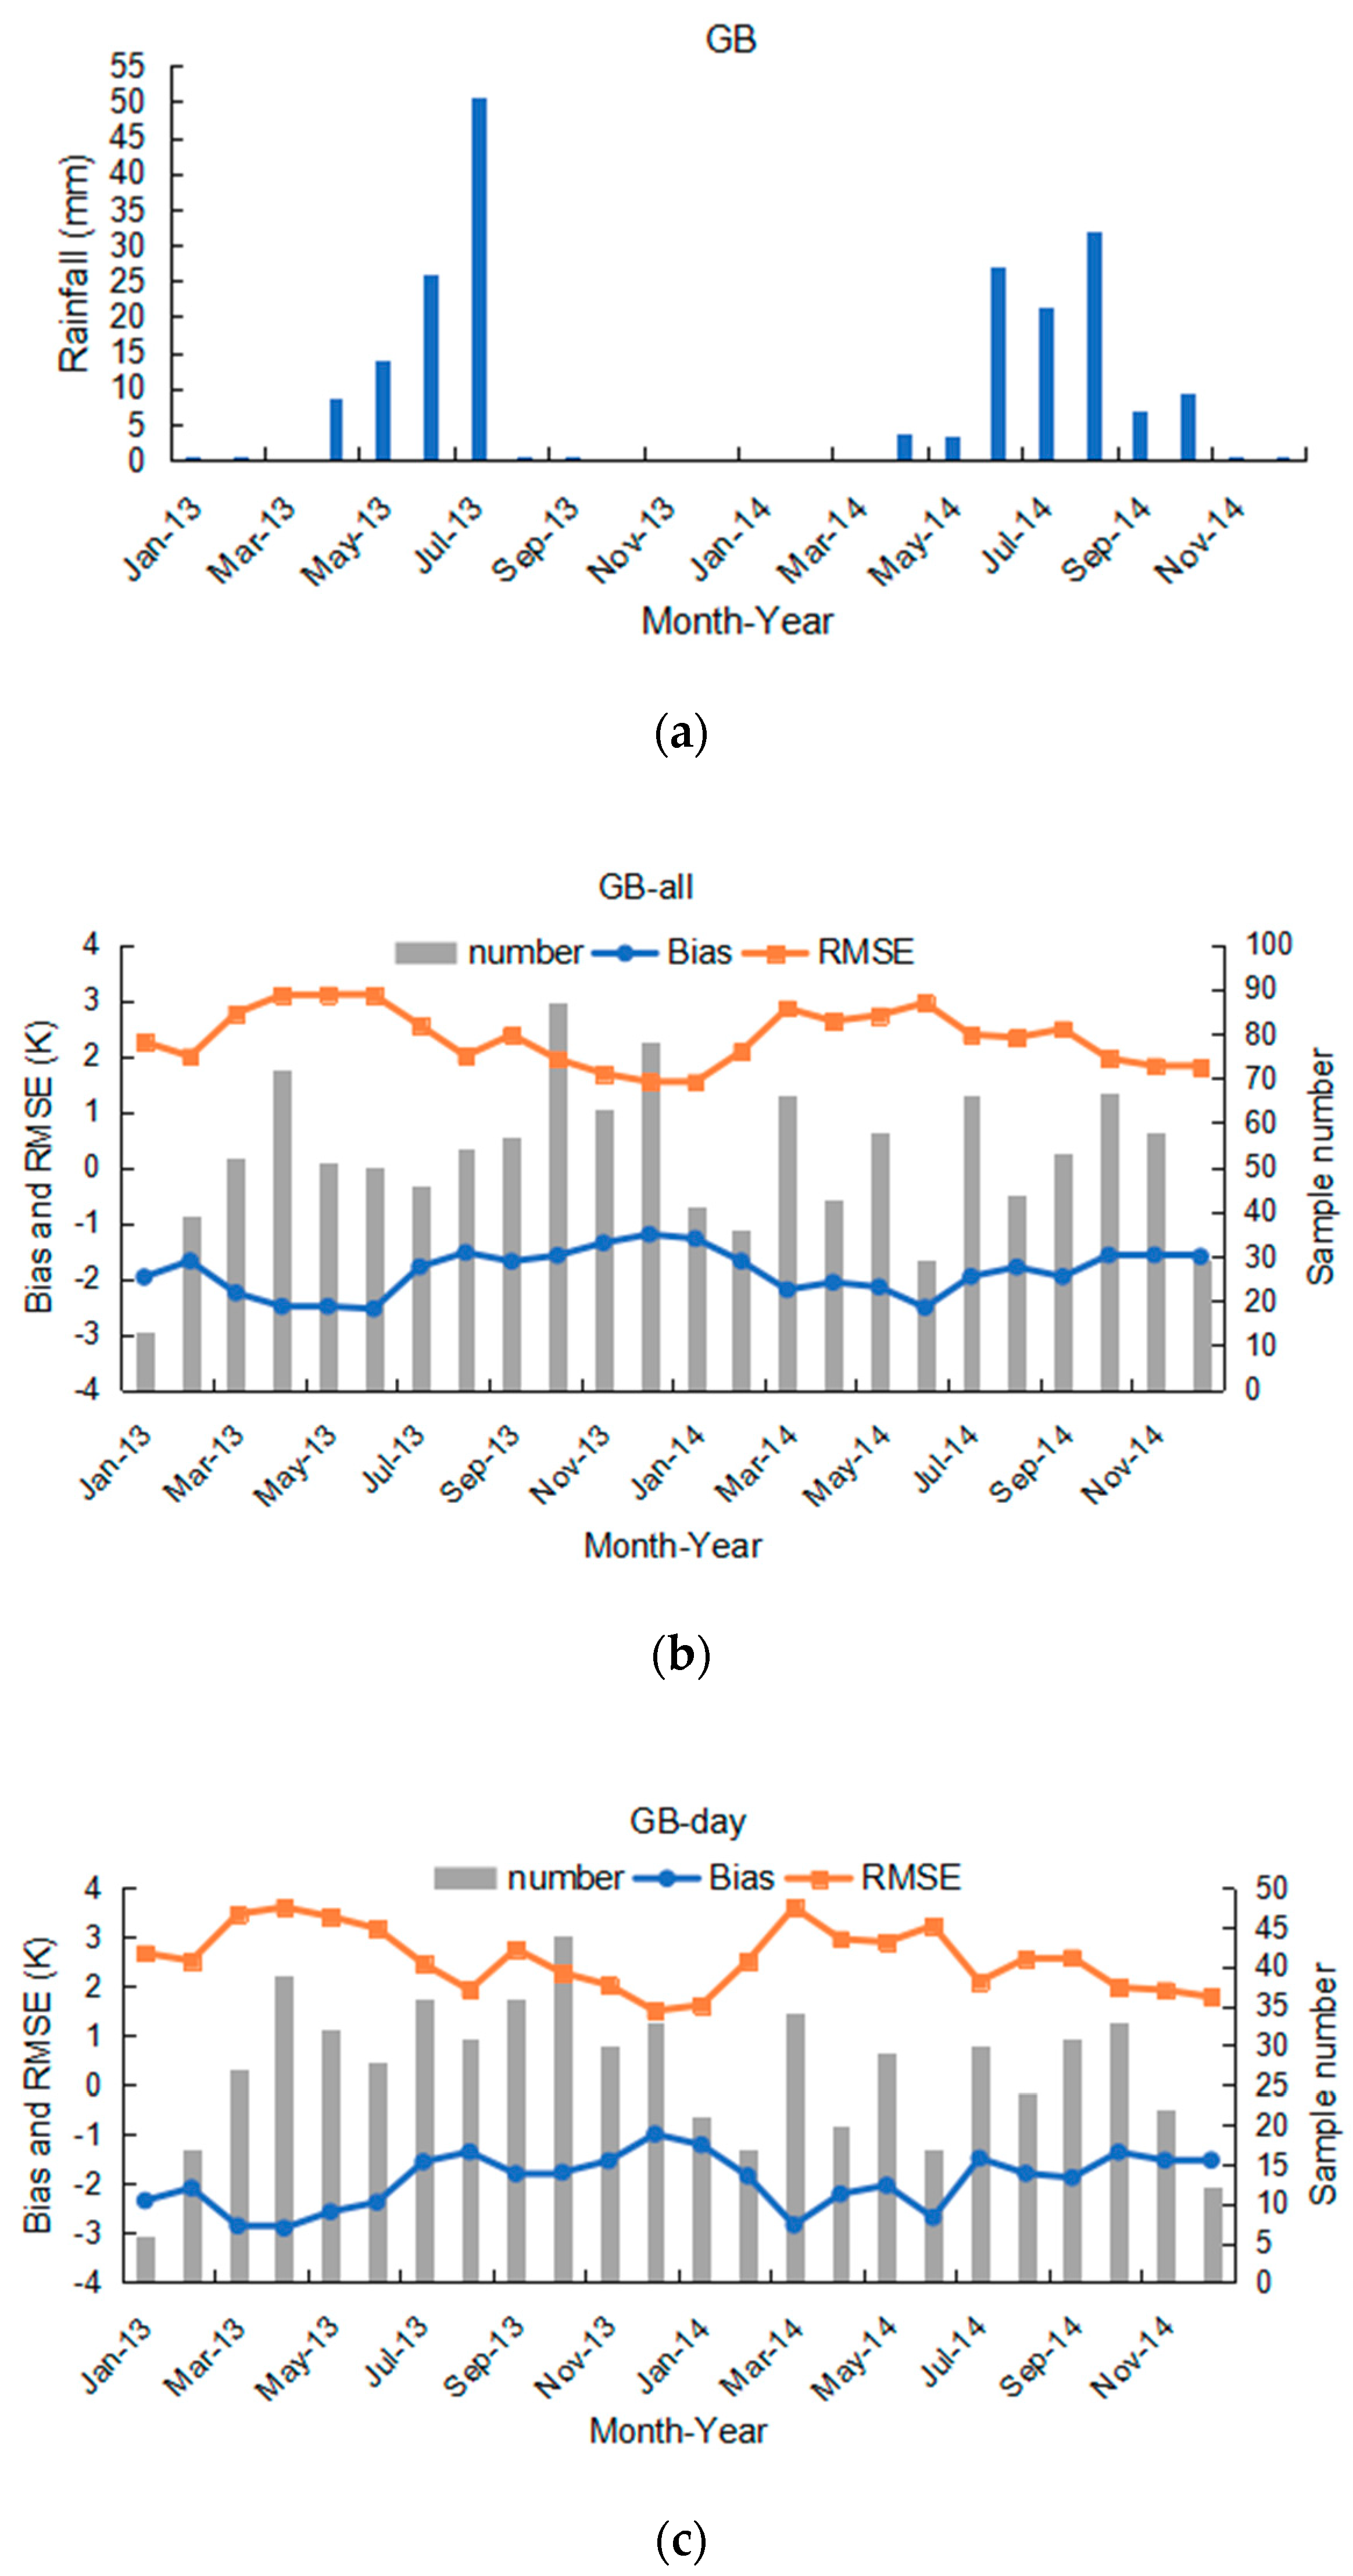
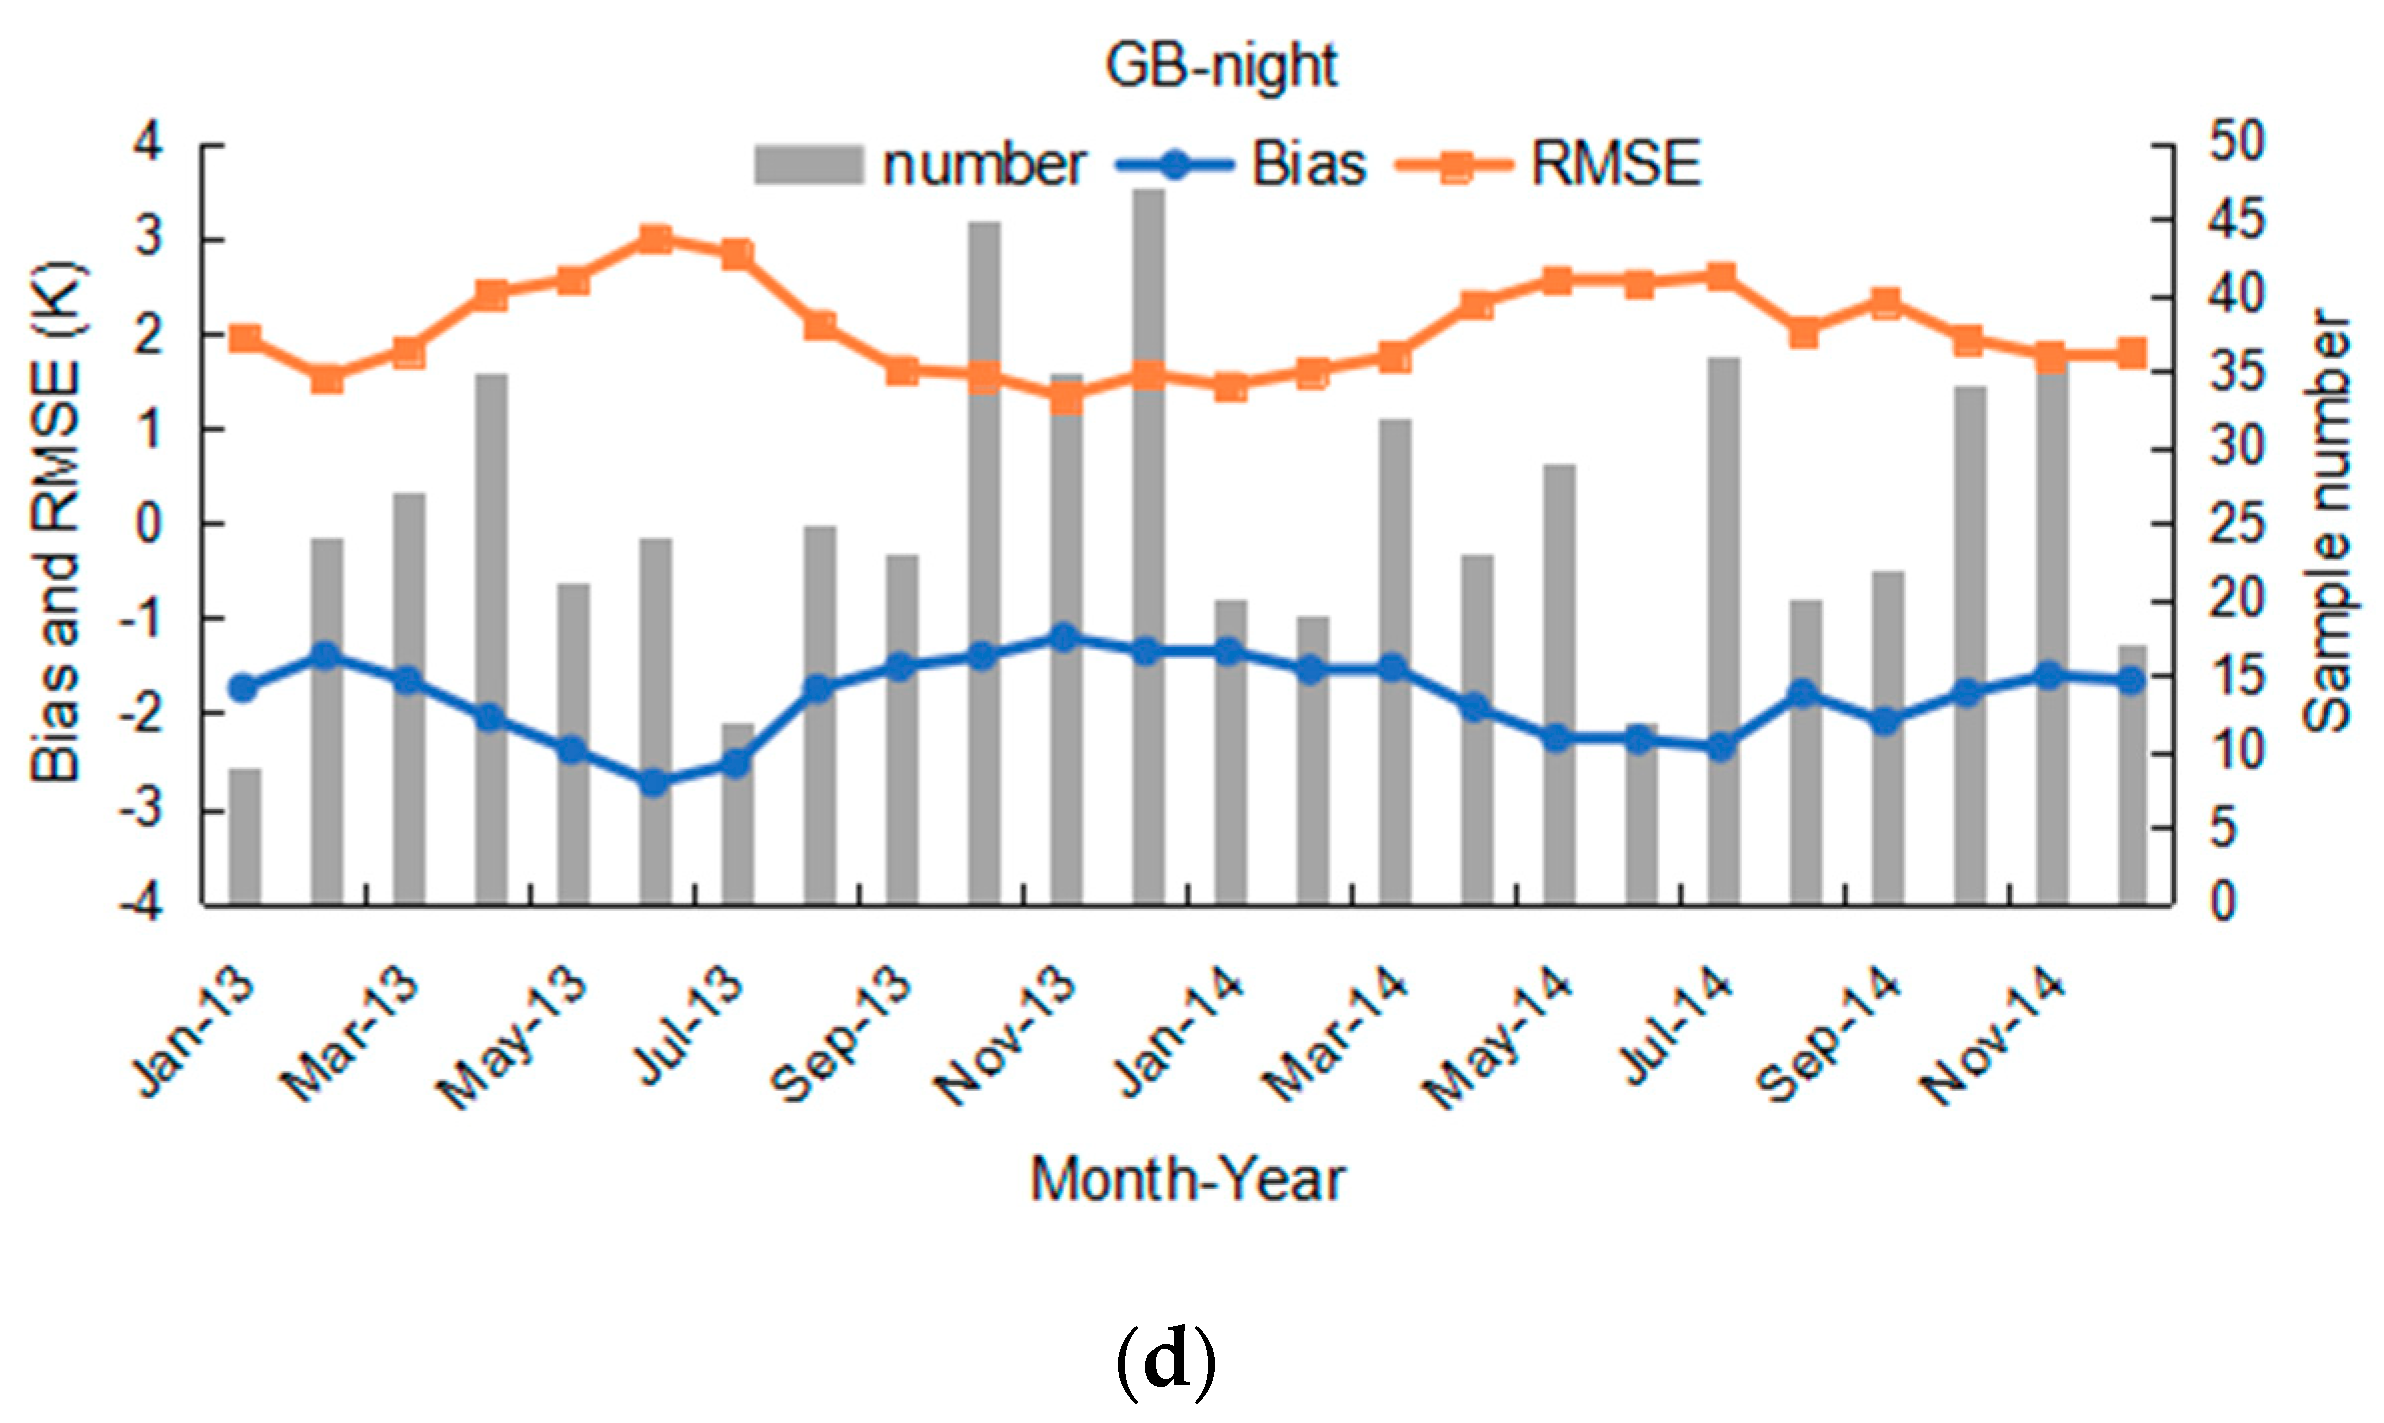
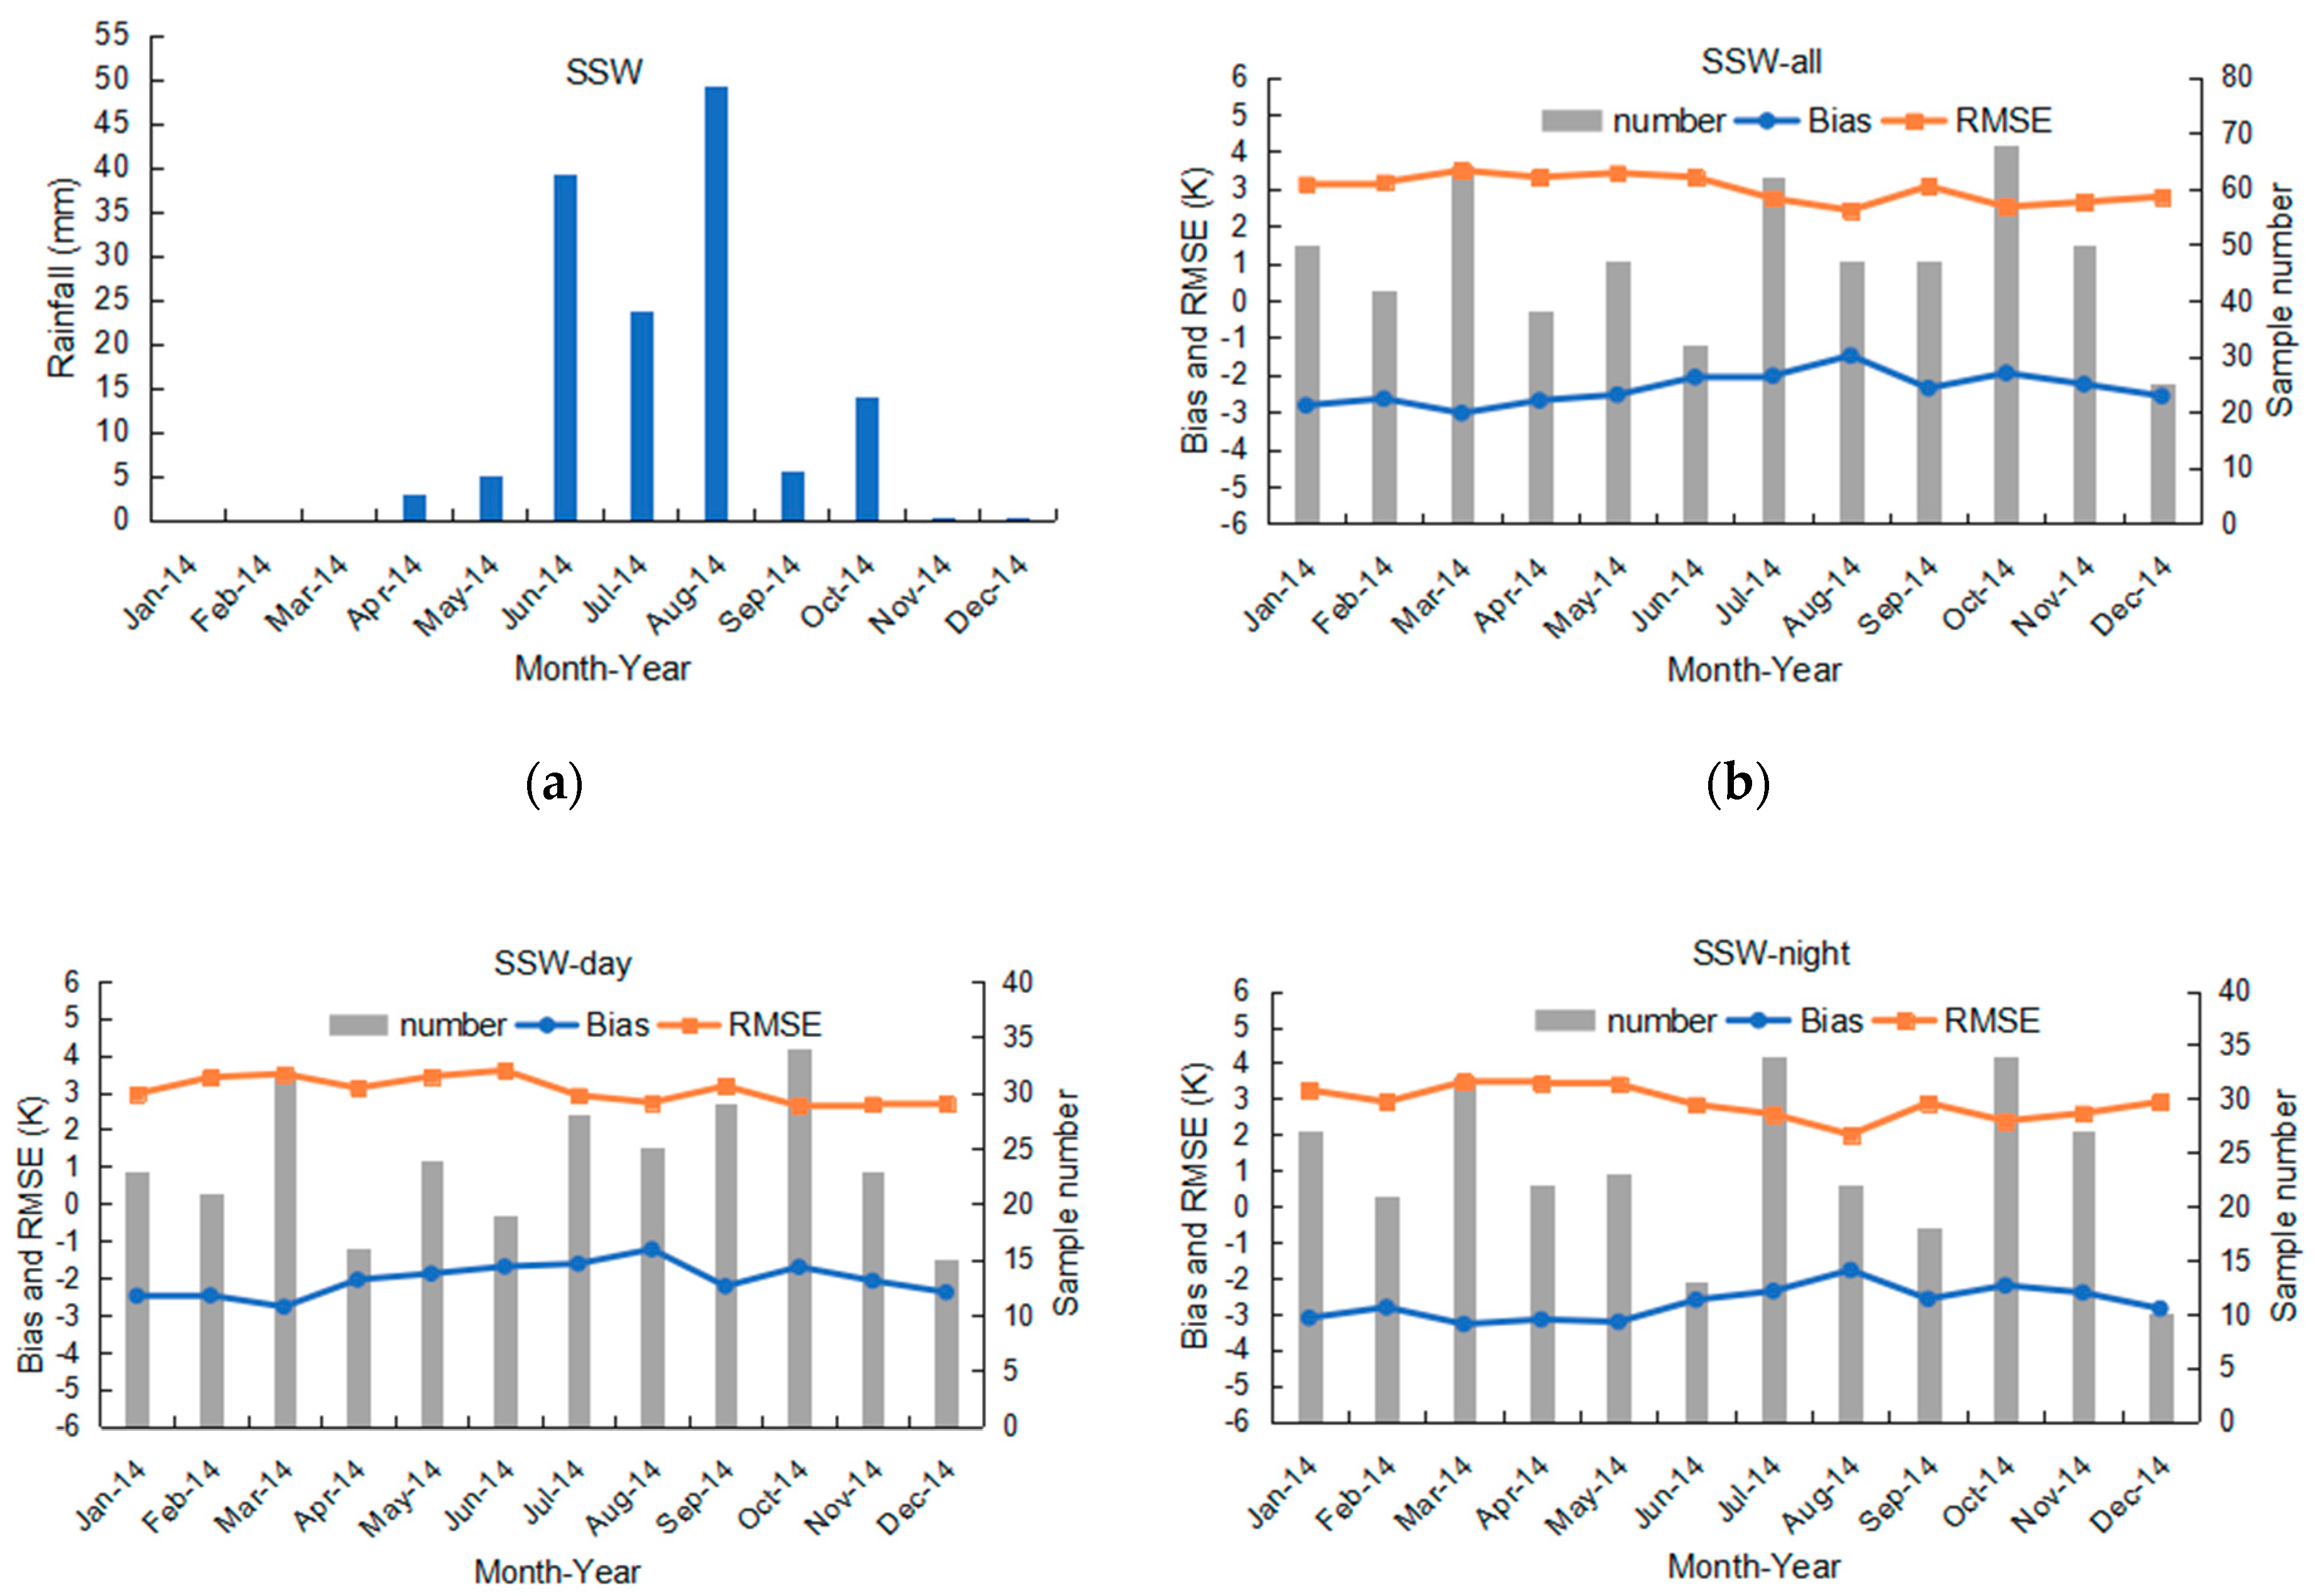
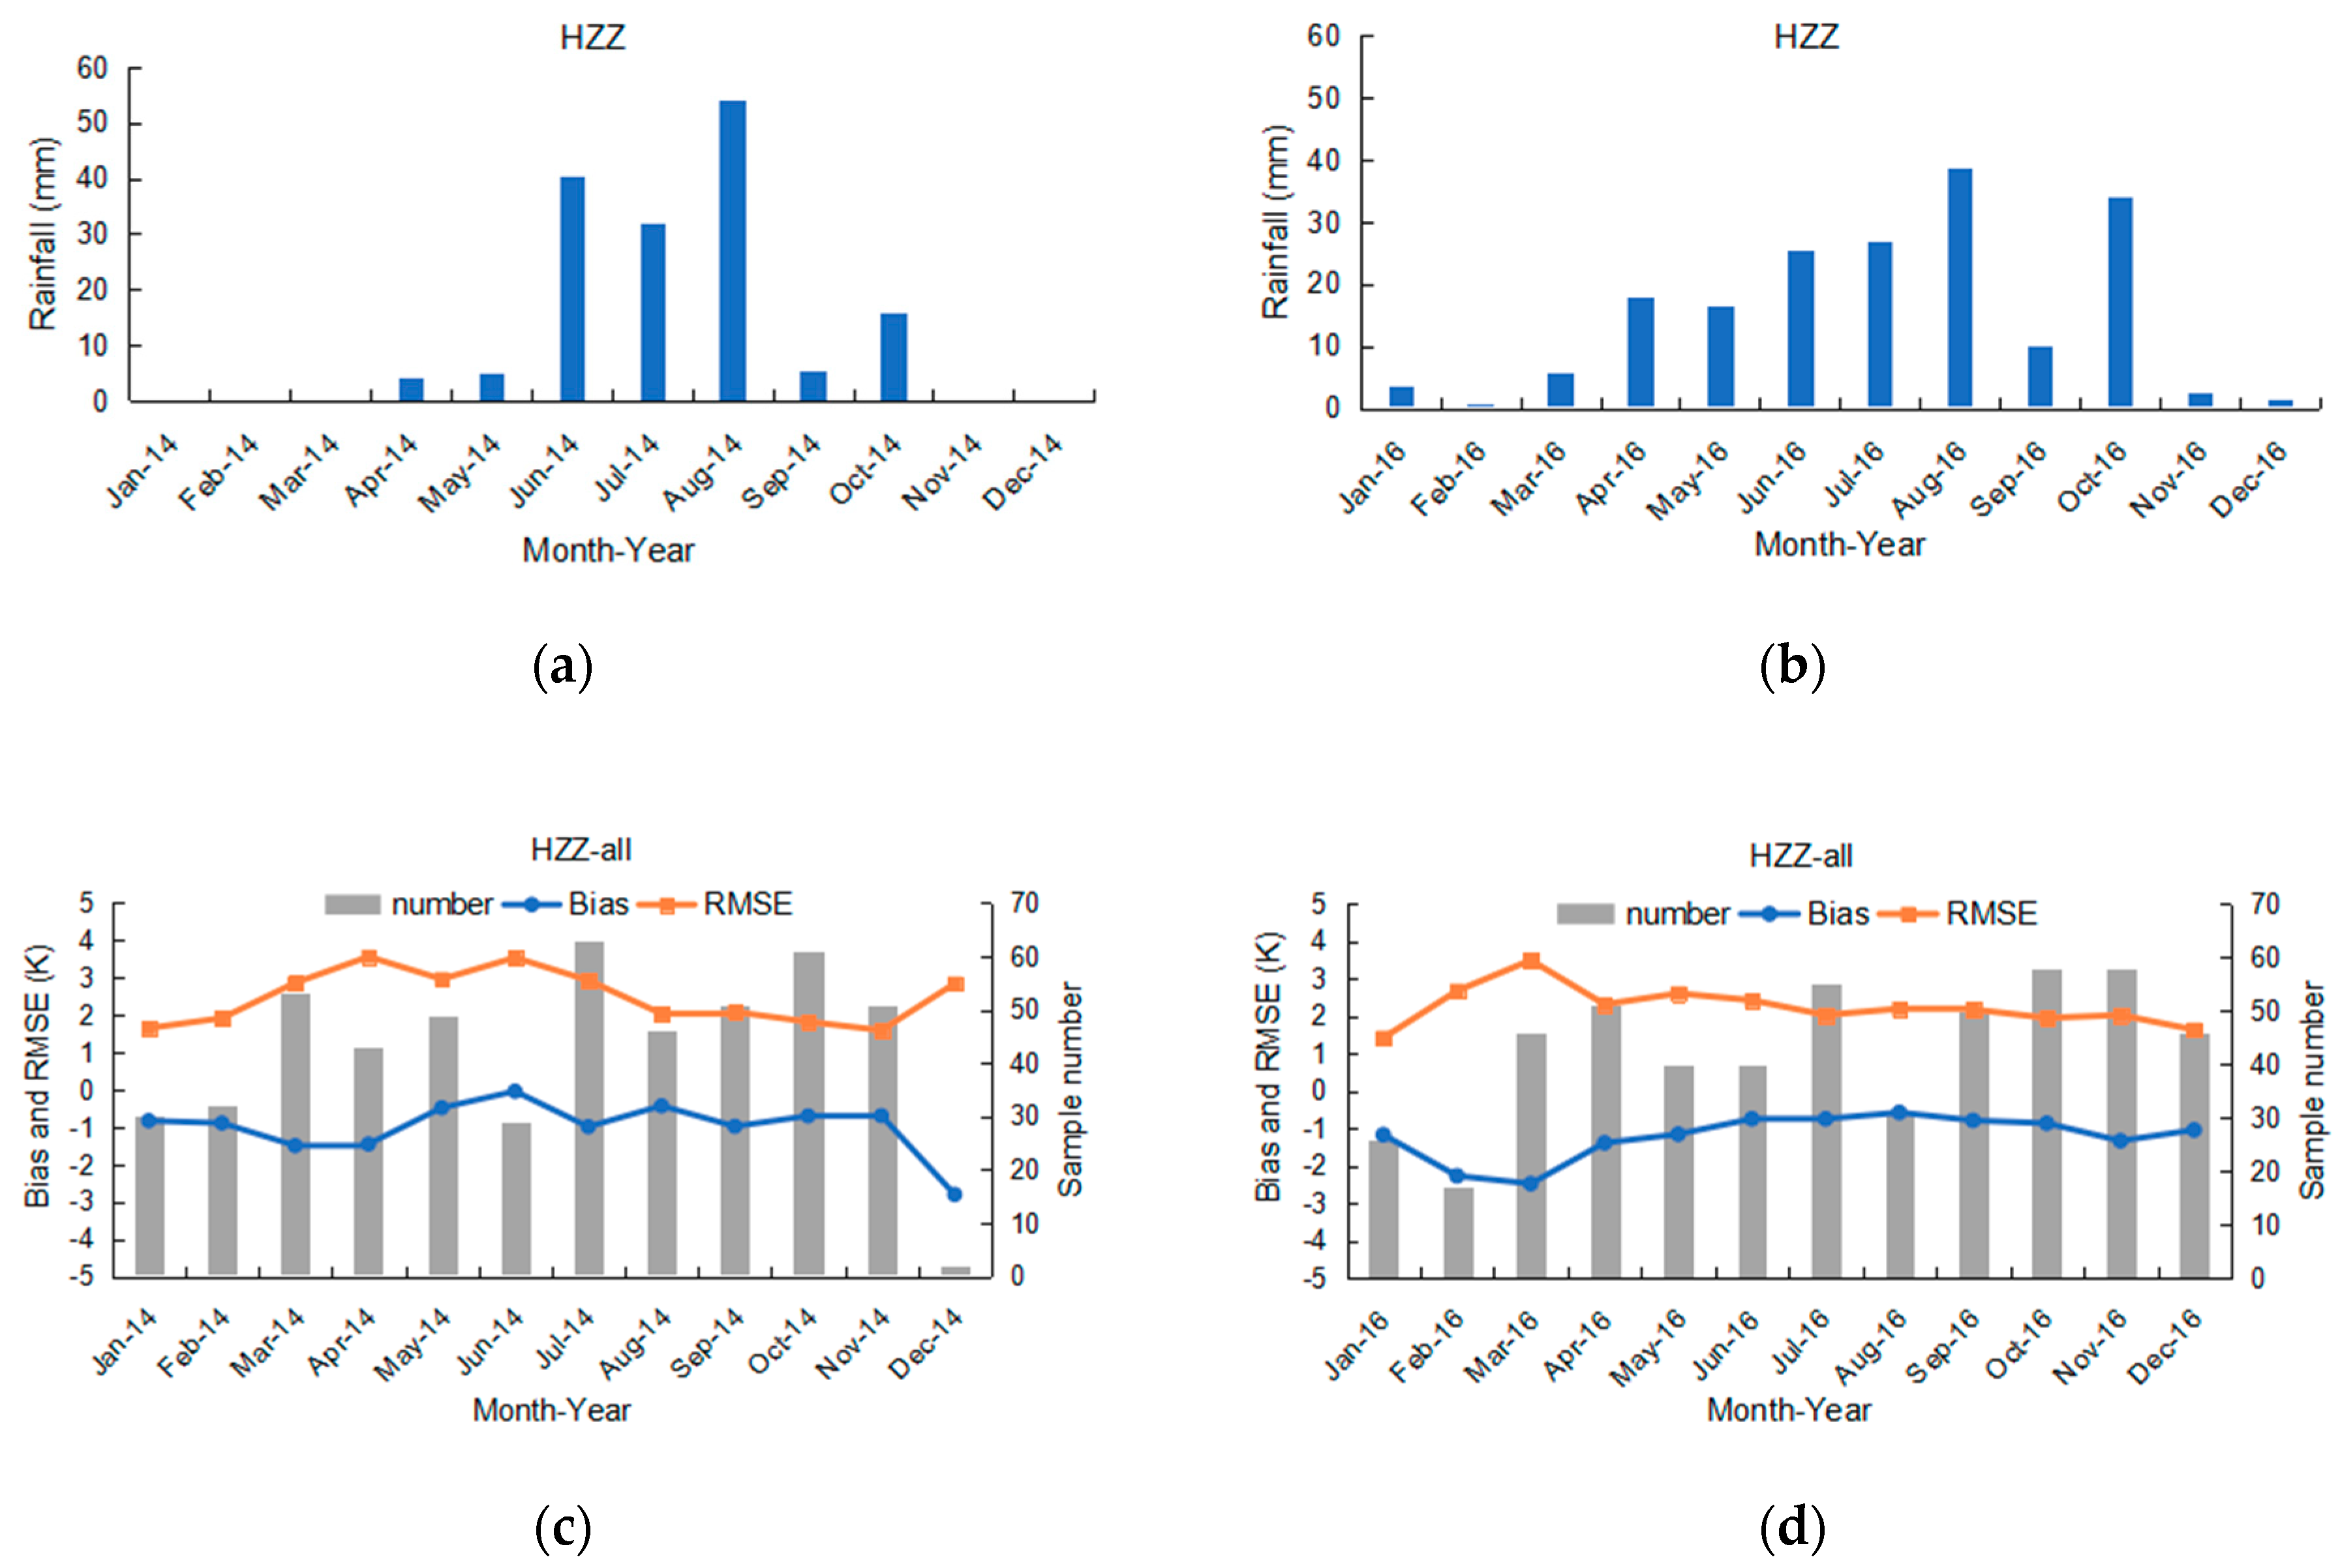
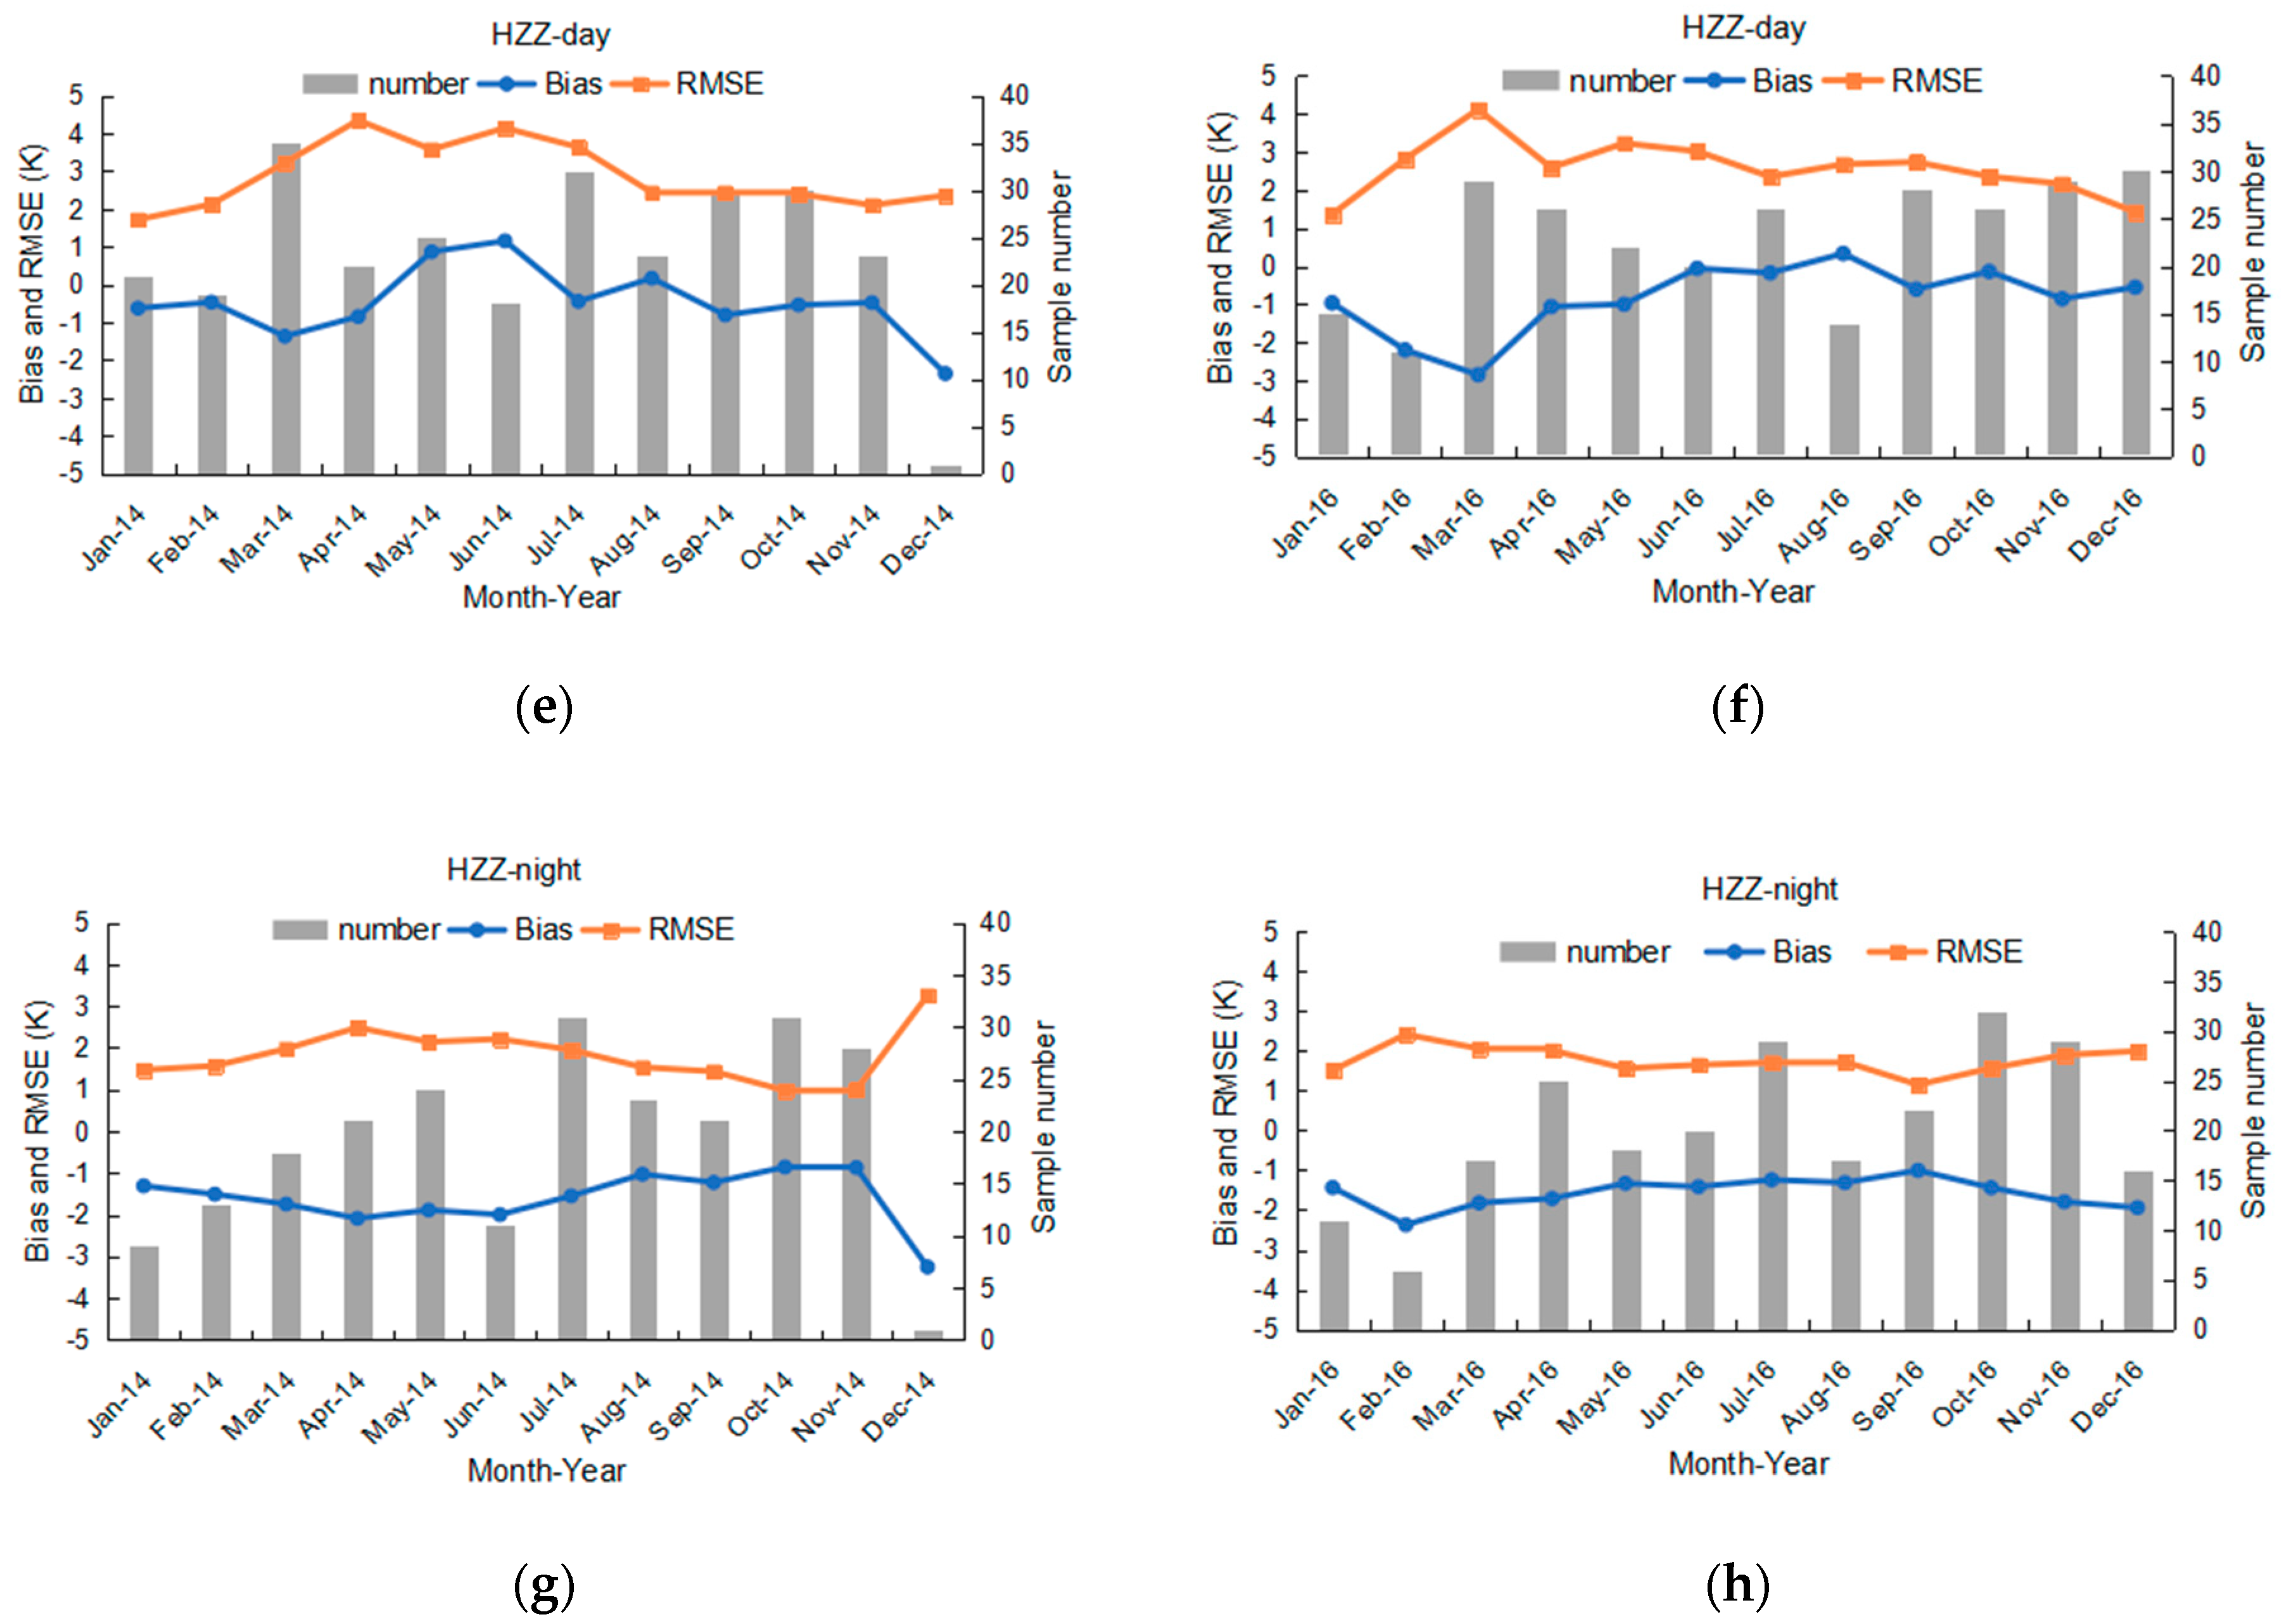
3.2. Seasonal Analysis

Seasonal changes in the vegetation and soil moisture may affect the emissivity. In addition, the predominance of given weather conditions may also affect the quality of the atmospheric correction. These would cause seasonal changes in the quality of LST. Therefore, it is necessary to validate the results for each season separately. Figure 3 shows the monthly rainfall as well as the monthly statistics of MODIS LST versus ground-based LST at the GB site between 2013 and 2014. Figure 3b shows the results for all data including daytime and nighttime. It indicates that both bias and RMSE are largest in spring (from March to May), which represents the driest season during a year, with mean bias and RMSE of −2.42 K and 2.99 K in 2013, and −2.14 K and 2.74 K in 2014, respectively. The errors keep decreasing in the following seasons, i.e., mean bias and RMSE of −1.96 K and 2.55 K in the summer of 2013 (−2.09 K and 2.55 K in the summer of 2014), mean bias and RMSE of −1.55 K and 2.00 K in the autumn of 2013 (−1.71 K and 2.09 K in the autumn of 2014). In winter (from December 2013 to February 2014), the mean bias and RMSE are −1.39 K and 1.71 K, respectively, which are the smallest of the years. Figure 3c,d show monthly biases and RMSEs for the daytime LSTs and nighttime LSTs, respectively. Corresponding to the rainfall pattern shown in Figure 3a, the bias and RMSE of daytime data in 2013 and those of nighttime data in 2014 are decreasing with an increase of rainfall.
For the SSW site, rainfall from most days of 2013 is missing value, which is unsuitable for analysis on seasonal validation results. Therefore, data from the entire year of 2014 are used here. Figure 4 shows the monthly rainfall and statistics of MODIS LST versus ground-based LST in 2014 for the SSW site. Before the rainy season, i.e., from January to May, the bias varies between −2.54 K and −3.04 K with RMSE from 3.11 K to 3.42 K for all MODIS LSTs, as shown in Figure 4b. During the rainy season (from June to October), it seems that both bias and RMSE decrease with an increase of rainfall, especially in August when the RMSE decreased to 2.41 K, corresponding to the highest rainfall of the year (49.3 mm).
For the HZZ site, records show the annual accumulated precipitation kept increasing from 130 mm in 2013 (with exclusion of March due to missing values) to 184.4 mm in 2016. Though the rainfall record in March of 2013 is missing value, it has little impact on the annual accumulated precipitation since this month belongs to the middle of the dry season. Due to the missing values of all records in the entire March of 2013, the data in 2014, which are complete, and the data in 2016 were selected for comparison. Figure 5a shows the monthly rainfall in 2014, and the rainy season began in June till October. Correspondingly, the monthly bias and RMSE of MODIS LST clearly vary seasonally, with strong negative mean bias in spring (−1.15 K), and RMSE being 3.13 K, as shown in Figure 5c. In the rainy season (from June to October), the mean bias and RMSE of MODIS LST are −0.63 K and 2.48 K, respectively. In summer, the mean bias and RMSE are −0.49 K and 2.83 K, smaller than the errors in spring, as shown in Figure 5c. Compared to 2014, 2016 was a wet year, and the rainy season began in April with the monthly accumulated rainfall of 18.1 mm. As shown in Figure 5d, the mean bias and RMSE are −0.89 K and 2.25 K, respectively, in the rainy season (from April to October). The mean RMSE is smaller than the one in 2014 (2.48 K). Figure 5f,h show the monthly bias and RMSE of MODIS LST at daytime and nighttime, respectively. Compared to the errors in 2014 (values in December are not taken into account due to the small sample number in 2014), the errors in 2016 appear smaller, i.e., mean RMSE at daytime is 2.67 K in 2016 versus 2.92 K in 2014. As a result, the annual mean RMSE of 2016 is smaller than that of 2014 (2.31 K in 2016 versus 2.45 K in 2014), indicating that in a wet year the error of MODIS LST is smaller than that of a dry year.

3.3. Comparison on Accuracy of MODIS C6 and C5 LST Products

Li et al. [15] evaluated both MOD11A1 and MYD11A1 C5 LST products using ground-based measurements of the rainy season in 2012 at four barren surface sites in the study area, three of which are the same as those in the present study. To make an assessment on the refinements of the C6 LST product, validation results of both version products in the rainy season in 2012 are compared in this study. In Reference [15], the ground-based LSTs in the HZZ site were derived from radiometric temperatures measured by the SI-111 radiometer and the downwelling radiance measured by the SI-111 radiometer located in the site (i.e., JCHM site also being covered by desert steppe in Reference [15]) with 30 km from the HZZ site. Unfortunately, there are only measurements in 2012 available for the JCHM site. In terms of the distance between these two sites and the availability of multi-year up-/downwelling longwave radiations in the HZZ site, the products of both versions in the HZZ site were validated by using the LSTs derived from the up- and downwelling longwave radiations here. The validation results of the Terra/Aqua MODIS C6 and C5 1-km LSTs are summarized in Table 3 and Table 4, respectively. It shows that the daytime LSTs are underestimated except for the HZZ site in which the LSTs from Terra are overestimated, and both bias and RMSEs of LSTs from Aqua MODIS in the GB and SSW sites are larger than the errors of LSTs from Terra MODIS, which are consistent with the general statistics in Section 3.1. Compared to the errors of the C5 product, the RMSEs of the C6 daytime LSTs from Terra MODIS decrease by 0.45 K, 1.02 K, and 0.74 K at the GB site, SSW site, and HZZ site, respectively. For the Aqua C6 daytime LSTs, the RMSEs decrease by 1.51 K, 0.74 K, and 1.55 K in the GB, SSW, and HZZ sites, respectively, compared to the errors of the Aqua C5 daytime LSTs. Compared to errors of the nighttime C5 LST, the RMSEs of the nighttime Terra C6 LST are smaller for the SSW and HZZ sites, and the RMSE is decreased by as much as 1.10 K for the SSW site. For Aqua C6 nighttime LSTs, the RMSEs are a little larger for all sites than the nighttime C5 LST product. These comparisons demonstrate that the refined GSW algorithm works well for improving the accuracy of daytime LST products but is weak in improvement of the accuracy of the nighttime LSTs sometimes.

4. Discussion

In this study, the accuracy of the MODIS C6 1-km LST product was evaluated using multi-year ground-based measurements in the sites with land cover types of sand desert, desert steppe, and Gobi. The results showed that the total error of daytime LSTs was 2.59 K in the Gobi area, 3.05 K in the sand desert area, and 2.86 K in the desert steppe region. For the nighttime LST product, the total error was 2.01 K, 2.88 K, and 1.80 K in Gobi, sand desert, and desert steppe regions, respectively. A seasonal validation showed that the error of MODIS LSTs was larger in spring than in other seasons, and in the rainy season, the accuracy of MODIS LSTs was higher than that in the driest season. Comparing with the errors of the MODIS C5 1-km LST product reported in Reference [15], the accuracy of the C6 1-km LST product was higher, especially for daytime LSTs; the error of which was decreased by 0.45 K to 1.55 K. This demonstrated that the refinements proposed by Reference [16] performed well in improving the accuracy of the MODIS 1-km LST product in pixels with a barren surface.
In spite of the significant improvement, the accuracy of the new version LST product is still greater than 2 K in some cases, which was also reported by other studies [17]. In generation of the C6 1-km LST product, a prototype emissivity adjustment model was developed. However, the magnitude of emissivity adjustment (i.e., ±0.0063) was determined by the reflectance spectra of 15 soil and sand samples in north Africa, which were not representative globally. According to the model, the adjustment of band 31 emissivity (em31) by −0.006 resulted in a change of −0.012 in the difference (em31–em32) [16]. However, for the sand desert region in this study, the difference between MODIS bands 31 and 32 emissivities derived from spectral adjusted ASTER LSEs using a regression approach in Reference [30] was −0.0148 ± 0.0011, which was larger than −0.012, but the difference (em31–em32) of MOD11A1 C6 LSEs was −0.0069 ± 0.0007. Moreover, the land cover types as defined by the MCD12Q1 product were analyzed over a subzone of the sand desert area of 5 × 6 1-km pixels. We found that 60% of the area was classified as grassland by the MCD12Q1 product, which is contradictory to the information obtained from References [15,27]. Therefore, the uncertainty in C6 1-km LSEs due to the emissivity adjustment and misclassification further induced large errors in the LST product in the SSW site. This implied that the accuracy of MODIS C6 LST products could be further improved by refining the emissivity adjustment model and land cover classification.
The error of MODIS C6 LST is higher in the driest season (i.e., spring) than other seasons. In the GSW algorithm, the MODIS LSEs were derived from fixed values based on a limited number of land cover types and do not fully encompass the natural variation in LSE [31]. Over bare soil surfaces, the MODIS LSE is always overestimated [10,18]. Compared to the spectral adjusted ASTER LSEs using a regression approach in Reference [30], the MODIS C6 LSEs were overestimated with biases of 0.0143, 0.0178, and 0.0129, for the GB, SSW, and HZZ sites. However, in the rainy season, the increased soil moisture caused by the rainfall may lead to a surface emissivity increase [27] and be closer to the MODIS LSE values, therefore, the errors of the derived MODIS LST decrease.
It is difficult to evaluate LST at a 1 km or larger pixel scale with in situ data [32] due to the large spatial variation in LSTs and the difficulty in finding suitable homogeneous validation sites. Therefore, large homogeneous lakes, fully vegetated croplands, grasslands, silt playas, and sand dunes are ideal sites for LST validation [12,13,26,33,34]. In this study, the MODIS C6 1-km LST product was evaluated using ground-based measurements collected from the sites in the sand desert, desert steppe, and Gobi, with a large area. For these sites, the standard deviation of ASTER LSTs within 11 × 11 pixels (i.e., ~1 km) showed average values of 1.11 K (SSW), 0.69 K (HZZ), and 1.01 K (GB), respectively [15], which were considered the spatial uncertainties associated with the use of in situ LSTs to evaluate the satellite LST product. Compared to the uncertainty below 1 K for an ideal homogeneous validation site [32], the variations in LSTs would have an impact on the daytime evaluation results at the SSW site and the GB site. Additionally, the ground-based LSTs were converted from up- and downwelling longwave radiation measurements, in which the broadband emissivity was derived from the five ASTER narrowband emissivities. Therefore, errors of ASTER LSEs would cause uncertainty in the derived ground-truth LSTs. It has been reported that the emissivities derived from the TES algorithm were within ±0.015 [24,25,26]. In Reference [21], it was demonstrated that Equation (2) produced BBE from ASTER narrowband LSEs with R2 of 0.983 and a root mean square (RMS) of 0.005. The BBE derived from the 12 ASTER images in this study showed that the values varied temporally within 0.955 ± 0.007, 0.927 ± 0.008, and 0.968 ± 0.005 for the GB, SSW, and HZZ sites, respectively. Taking the model error, the ASTER LSE error, and the temporal variation of BBE into account, the total uncertainty of BBE would be 0.017 in the GB site, 0.018 in the SSW site, and 0.017 in the HZZ site. Correspondingly, with an error propagation analysis on Equation (1), the errors of BBE would cause an uncertainty of the ground-truth LSTs within 0.31 ± 0.15 K in the GB site, 0.36 ± 0.17 K in the SSW site, and 0.27 ± 0.15 K in the HZZ site. Then, the uncertainty of evaluation using ground-based LSTs included the spatial uncertainty ( E S p a t i a l ) and the errors of the ground-truth LSTs ( E L S T ), and could be calculated by E = E L S T 2 + E S p a t i a l 2 [35]. Therefore, the uncertainty in the validation using ground-based measurements was 1.06 K for the GB site, 1.17 K for the SSW site, and 0.74 K for the HZZ site, which is worth noting.
This study used the temperature-based method for evaluating MODIS LST products. This method provides a direct evaluation of the radiometric quality of the satellite instrument and the ability of the LST retrieval algorithm to correct atmospheric and emissivity effects [33]. In addition, the radiance-based (R-based) method is an alternative for assessing the accuracy of LSTs retrieved from satellite observations. Without the need for rigorous ground measurements that the T-based method requires, the R-based method uses a radiative transfer model to estimate the true LST with requirements of air temperature, relative humidity profiles, and emissivity data as inputs [36]. Due to its applicability to both day and night data and its potential use on a global scale over more sites than the T-based method, the R-based method has been successfully applied to MODIS LST products and the AIRS (Atmospheric Infrared Sounder) LST product in previous studies [32,33,36,37]. The strongest limitation of the R-based method is the need for accurate atmospheric profiles. Errors in water vapor and air temperature profiles, and thus in radiative transfer model simulations and in surface emissivity would result in uncertainties from ±0.4 K to ±1 K for the R-based ground LST, which is similar to the uncertainties of the in situ LST in the T-based method [34]. On the other hand, the R-based method is regarded as an uncertainty analysis tool to assess the long-term accuracy and stability of LST products rather than a true validation in the ‘classic sense’ since it is not based on in situ LST measurements [36]. Therefore, both the T-based method and R-based method are able to be used simultaneously [33,34]. Since the refinements of the C6 MODIS LST/LSE products were proposed, the C6 Level-2 LST product has been validated using the R-based method [16,17], demonstrating that the LST error was generally less than 1 K, but 1.9 K in some cases in the desert of North Africa and even greater than 2 K in some other bare soil sites. As a supplement of the R-based method validation, this study conducted a T-based validation on the C6 MODIS LST products. This study not only verified that the C6 1-km LST product had higher accuracy than the C5 1-km LST product, which was consistent with the results in Reference [18], but also reported the specific accuracy of the C6 1-km LST product versus the ground-based measurements in the barren surfaces. All these studies will be helpful for facilitating the use of the MODIS LST products in various applications.
In this study, measurements of only three sites were used for evaluation, and each site represented one surface type. It was not able to demonstrate the total accuracy of a global LST product. However, these sites were located in the Heihe River basin which was a typical inland river basin. Inland river basins occupy approximately 11.4% of world’s land area [19]. All of the features and extremes of inland river basins can be found in this basin. The sand desert, desert steppe, and Gobi are typical land surfaces for inland river basins. Therefore, the three sites in this study are representative of an arid area. Of course, validation of the products should not, and would not, be finalized in one study. For a global product, it is expected to be evaluated against measurements from more sites with various land surface features in the future due to the heterogeneity of the earth’s surface.

5. Conclusions

Using multi-year ground-based measurements in regions with land cover types of sand desert, desert steppe, and Gobi, this study conducted a T-based validation on the newly released MODIS C6 1km LST product. It demonstrated that the total error of daytime LSTs was 2.59 K and 2.86 K for the sites in the Gobi and desert steppe area, respectively. For the nighttime LSTs, the total error was 2.01 K and 1.80 K for the sites in the Gobi and desert steppe area, respectively. For the site in the sand desert region, the error was the largest for both daytime (3.05 K) and nighttime LSTs (2.88 K). The large error was caused by the lack of global representativeness in the magnitude of emissivity adjustment and the error in emissivities due to misclassification for the barren surface pixels. Therefore, globally representative magnitudes of emissivity adjustments and accurate land cover classifications would further improve the accuracy of C6 LST products. It was also verified that, in the rainy season, the accuracy of the MODIS LST was higher than that in the driest season—spring, and the accuracy of the MODIS C6 1-km LST product was higher than that of the C5 1-km LST product in pixels with barren surfaces, especially for daytime LSTs, the error of which was decreased by 0.45 K to 1.55 K. From this study, we recommend the MODIS C6 1-km LST product for applications.

Author Contributions

L.L., T.Z., and T.W. conceived the study; L.L. analyzed the data and wrote the manuscript; X.Z. made some figures for this paper. All authors contributed to editing of the manuscript.

Funding

This work was supported by the National Natural Science Foundation of China (Grant 41401372), the National Key Scientific Research Project (Grant 2013CBA01802), and the National Natural Science Foundation of China (Grant 91325202).

Acknowledgments

The authors thank three anonymous reviewers for their helpful comments and suggestions that have significantly improved this article. The Terra/Aqua MODIS Land Surface Temperature/Emissivity Daily L3 Global 1km SIN Grid products were acquired from the Level-1 and Atmosphere Archive & Distribution System (LAADS) Distributed Active Archive Center (DAAC), located in the Goddard Space Flight Center in Greenbelt, Maryland (https://ladsweb.nascom.nasa.gov/). The in situ data and ASTER LST/LSE data used in this paper were provided by the Heihe Plan Science Data Center, National Natural Science Foundation of China (http://www.heihedata.org).

Conflicts of Interest

The authors declare no conflict of interest.

References

  1. Morillas, L.; García, M.; Nieto, H.; Villagarcia, L.; Sandholt, I.; Gonzalez-Dugo, M.P.; Zarco-Tejada, P.J.; Domingo, F. Using radiometric surface temperature for surface energy flux estimation in Mediterranean drylands from a two-source perspective. Remote Sens. Environ. 2013, 136, 234–246. [Google Scholar] [CrossRef] [Green Version]
  2. Sandholt, I.; Rasmussen, K.; Andersen, J. A simple interpretation of the surface temperature/vegetation index space for assessment of surface moisture status. Remote Sens. Environ. 2002, 79, 213–224. [Google Scholar] [CrossRef]
  3. Karnieli, A.; Agam, N.; Pinker, R.T.; Anderson, M.; Imhoff, M.L.; Gutman, G.G. Use of NDVI and land surface temperature for drought assessment: Merits and limitations. J. Clim. 2010, 23, 618–663. [Google Scholar] [CrossRef]
  4. Li, Z.; Tang, R.; Wan, Z.; Bi, Y.; Zhou, C.; Tang, B.; Yan, G.; Zhang, X. A review of current methodologies for regional evapotranspiration estimation from remotely sensed data. Sensors 2009, 9, 3801–3853. [Google Scholar] [CrossRef] [PubMed]
  5. Long, D.; Gao, Y.; Singh, V.P. Estimation of daily average net radiation from MODIS data and DEM over the Baiyangdian watershed in North China for clear sky days. J. Hydrol. 2010, 388, 217–233. [Google Scholar] [CrossRef]
  6. Wang, K.; Liang, S. Evaluation of ASTER and MODIS land surface temperature and emissivity products using long-term surface longwave radiation observations at SURFRAD sites. Remote Sens. Environ. 2009, 113, 1556–1565. [Google Scholar] [CrossRef]
  7. Rodell, M.; Houser, P.R.; Jambor, U.; Gottschalck, J.; Mitchell, K.; Meng, C.; Arsenault, K.; Cosgrove, B.; Radakovich, J.; Bosilovich, M.; et al. The global land data assimilation system. Bull. Am. Meteorol. Soc. 2004, 85, 381–394. [Google Scholar] [CrossRef]
  8. Wan, Z.; Dozier, J. A generalized split-window algorithm for retrieving land-surface temperature from space. IEEE Trans. Geosci. Remote Sens. 1996, 34, 892–905. [Google Scholar] [CrossRef]
  9. Wan, Z.; Li, Z.L. A physics-based algorithm for retrieving land-surface emissivity and temperature from EOS/MODIS data. IEEE Trans. Geosci. Remote Sens. 1997, 35, 980–996. [Google Scholar] [CrossRef]
  10. Hulley, G.C.; Hook, S.J. Intercomparison of versions 4, 4.1 and 5 of the MODIS Land Surface Temperature and Emissivity products and validation with laboratory measurements of sand samples from the Namib desert, Namibia. Remote Sens. Environ. 2009, 113, 1313–1318. [Google Scholar] [CrossRef]
  11. Liang, S.L.; Fang, H.L.; Chen, M.Z.; Shuey, C.J.; Walthall, C.; Daughtry, C.; Morisette, J.; Schaaf, C.; Strahler, A. Validating MODIS land surface reflectance and albedo products: Methods and preliminary results. Remote Sens. Environ. 2002, 83, 149–162. [Google Scholar] [CrossRef]
  12. Wan, Z.M.; Zhang, Y.L.; Zhang, Q.C.; Li, Z.L. Validation of the land-surface temperature products retrieved from Terra Moderate Resolution Imaging Spectroradiometer data. Remote Sens. Environ. 2002, 83, 163–180. [Google Scholar] [CrossRef] [Green Version]
  13. Wan, Z.M.; Zhang, Y.L.; Zhang, Q.C.; Li, Z.L. Quality assessment and validation of the MODIS global land surface temperature. Int. J. Remote Sens. 2004, 25, 261–274. [Google Scholar] [CrossRef]
  14. Wang, K.; Wan, Z.; Wang, P.; Sparrow, M.; Liu, J.; Haginoya, S. Evaluation and improvement of the MODIS land surface temperature/emissivity products using ground-based measurements at a semi-desert site on the western Tibetan Plateau. Int. J. Remote Sens. 2007, 28, 2549–2565. [Google Scholar] [CrossRef]
  15. Li, H.; Sun, D.L.; Yu, Y.Y.; Wang, H.Y.; Liu, Y.L.; Liu, Q.H.; Du, Y.M.; Wang, H.S.; Cao, B. Evaluation of the VIIRS and MODIS LST products in an arid area of Northwest China. Remote Sens. Environ. 2014, 142, 111–121. [Google Scholar] [CrossRef]
  16. Wan, Z. New refinements and validation of the collection-6 MODIS land-surface temperature/emissivity product. Remote Sens. Environ. 2014, 140, 36–45. [Google Scholar] [CrossRef]
  17. Duan, S.; Li, Z.; Wu, H.; Leng, P.; Gao, M.; Wang, C. Radiance-based validation of land surface temperature products derived from Collection 6 MODIS thermal infrared data. Int. J. Appl. Earth Obs. Geoinf. 2018, 70, 84–92. [Google Scholar] [CrossRef]
  18. Duan, S.B.; Li, Z.L.; Cheng, J.; Leng, P. Cross-satellite comparison of operational land surface temperature products derived from MODIS and ASTER data over bare soil surfaces. ISPRS J. Photogramm. Remote Sens. 2017, 126, 1–10. [Google Scholar] [CrossRef]
  19. Li, X.; Cheng, G.D.; Liu, S.M.; Xiao, Q.; Ma, M.G.; Jin, R.; Che, T.; Liu, Q.H.; Wang, W.Z.; Qi, Y.; et al. Heihe Watershed Allied Telemetry Experimental Research (HIWATER): Scientific objectives and experimental design. Bull. Am. Meteorol. Soc. 2013, 94, 1145–1160. [Google Scholar] [CrossRef]
  20. Heihe Plan Science Data Center. Available online: http://www.heihedata.org (accessed on 20 November 2018).
  21. Cheng, J.; Liang, S.; Yao, Y.; Zhang, X. Estimating the optimal broadband emissivity spectral range for calculating surface longwave net radiation. IEEE Geosci. Remote Sens. Lett. 2013, 10, 401–405. [Google Scholar] [CrossRef]
  22. Gillespie, A.R.; Rokugawa, S.; Matsunaga, T.; Cothern, J.S.; Hook, S.; Kahle, A.B. A temperature and emissivity separation algorithm for Advanced Spaceborne Thernal Emission and Reflection Radiometer (ASTER) images. IEEE Trans. Geosci. Remote Sens. 1998, 36, 1113–1126. [Google Scholar] [CrossRef]
  23. Tonooka, H. Accurate atmospheric correction of ASTER thermal infrared imagery using the WVS method. IEEE Trans. Geosci. Remote Sens. 2005, 43, 2778–2792. [Google Scholar] [CrossRef]
  24. Hulley, G.C.; Hook, S.J.; Baldridge, A.M. ASTER land surface emissivity database of California and Nevada. Geophys. Res. Lett. 2008, 35, L13401. [Google Scholar] [CrossRef]
  25. Sabol, D.E.; Gillespie, A.R.; Abbott, E.; Yamada, G. Field validation of the ASTER temperature-emissivity separation algorithm. Remote Sens. Environ. 2009, 113, 2328–2344. [Google Scholar] [CrossRef]
  26. Schmugge, T.; Ogawa, K.; French, A.N.; Hsu, A.; Ritchie, J.C.; Rango, A. ASTER observations of surface temperature and emissivity over New Mexico test sites. In AGU Fall Meeting Abstracts; Abstract Id. H21H-01; Eos Transactions American Geophysical Union: Washington, DC, USA, 2003; Volume 84. [Google Scholar]
  27. Wang, H.S.; Xiao, Q.; Li, H.; Du, Y.M.; Liu, Q.H. Investigating the impact of soil moisture on thermal infrared emissivity using ASTER data. IEEE Geosci. Remote Sens. Lett. 2015, 12, 294–298. [Google Scholar] [CrossRef]
  28. Wan, Z. Collection-6 MODIS Land Surface Temperature Products Users’ Guide. 2013. Available online: https://lpdaac.usgs.gov/sites/default/files/public/product_documentation/mod11_user_guide.pdf (accessed on 6 December 2016).
  29. Guillevic, P.; Göttsche, F.; Nickeson, J.; Hulley, G.; Ghent, D.; Yu, Y.; Trigo, I.; Hook, S.; Sobrino, J.A.; Remedios, J.; et al. Land surface temperature product validation best practice protocol. In Best Practice for Satellite-Devied Land Product Validation; Version 1.1; Guillevic, P., Göttsche, F., Nickeson, J., Román, M., Eds.; Land Product Validation Subgroup (WGCV/CEOS): Maryland, USA, 2018; p. 58. [Google Scholar]
  30. Hulley, G.; Malakar, N.; Freepartner, R. Moderate Resolution Imaging Spectroradiometer (MODIS) Land Surface Temperature and Emissivity Product (MxD21) Algorithm Theoretical Basis Document Collection-6. JPL Publication 12-17; 2016. Available online: https://modis.gsfc.nasa.gov/data/atbd/atbd_mod21.pdf (accessed on 29 June 2017).
  31. Guillevic, P.C.; Biard, J.C.; Hulley, G.C.; Privette, J.L.; Hook, S.J.; Olioso, A.; Göttsche, F.M.; Radocinski, R.; Román, M.O.; Yu, Y.; et al. Validation of land surface temperature products derived from the visible infrared imaging radiometers suite (VIIRS) using ground-based and heritage satellite measurements. Remote Sens. Environ. 2014, 154, 19–37. [Google Scholar] [CrossRef]
  32. Wan, Z. New refinements and validation of the MODIS Land-Surface Temperaure/Emissivity products. Remote Sens. Environ. 2008, 112, 59–74. [Google Scholar] [CrossRef]
  33. Coll, C.; Wan, Z.; Galve, J.M. Temperature-based and radiance-based validations of the V5 MODIS land surface temperature product. J. Geophys. Res. 2009, 114, D20102. [Google Scholar] [CrossRef]
  34. Niclòs, R.; Galve, J.M.; Valiente, J.A.; Estrela, M.J.; Coll, C. Accuracy assessment of land surface temperature retrievals from MSG2-SEVIRI data. Remote Sens. Environ. 2011, 115, 2126–2140. [Google Scholar] [CrossRef]
  35. Freitas, S.C.; Trigo, I.F.; Bioucas-Dias, J.M.; Göttsche, F.M. Quantifying the uncertainty of land surface temperature retrievals from SEVIRI/Meteosat. IEEE Trans. Geosci. Remote Sens. 2010, 48, 523–534. [Google Scholar] [CrossRef]
  36. Hulley, G.C.; Hook, S.J. A radiance-based method for estimating uncertainties in the Atmospheric Infrared Sounder (AIRS) land surface temperature product. J. Geophys. Res. 2012, 117, D20117. [Google Scholar] [CrossRef]
  37. Wan, Z.M.; Li, Z.L. Radiance-based validation of the V5 MODIS land-surface temperature product. Int. J. Remote Sens. 2008, 29, 5373–5395. [Google Scholar] [CrossRef]
Figure 1. Spatial distribution of the three ground sites. The background is an Advanced Spaceborne Thermal Emission Reflection Radiometer (ASTER) false-color visible near-infrared (VNIR) image captured on 3 September 2012.
Remotesensing 10 01852 g001
Figure 2. Scatterplots between Moderate Resolution Imaging Spectroradiometer (MODIS) collection-6 (C6) LSTs and ground measurements for daytime and nighttime at the three sites, i.e., Terra MODIS LSTs versus ground measurements at (a) GB site, (c) SSW site, and (e) HZZ site; Aqua MODIS LSTs versus ground measurements at (b) GB site, (d) SSW site, and (f) HZZ site.
Remotesensing 10 01852 g002aRemotesensing 10 01852 g002b
Figure 3. Monthly statistics of rainfall and MODIS LST between 2013 and 2014 at the GB site, subplots include (a) rainfall, (b) all (daytime and nighttime) LSTs, (c) daytime LSTs, (d) nighttime LSTs. Monthly bias (blue dots) and root-mean-square error (RMSE) (orange squares) refer to the left y-axis, the number of samples (grey bars) to the right y-axis.
Remotesensing 10 01852 g003aRemotesensing 10 01852 g003b
Figure 4. Monthly statistics of rainfall and MODIS LST in 2014 at the SSW site, subplots include (a) rainfall, (b) all (daytime and nighttime) LSTs, (c) daytime LSTs, (d) nighttime LSTs.
Remotesensing 10 01852 g004
Figure 5. Monthly statistics of rainfall and MODIS LST in 2014 and 2016 at the HZZ site, subplots include (a) rainfall, (c) all (daytime and nighttime) LSTs, (e) daytime LSTs, (g) nighttime LSTs in 2014; and (b) rainfall, (d) all (daytime and nighttime) LSTs, (f) daytime LSTs, (h) nighttime LSTs in 2016.
Remotesensing 10 01852 g005aRemotesensing 10 01852 g005b
Table 1. Descriptions of the three study sites.
Site CodeLatitude
Longitude
Elevation (m)Land CoverInstrumentTime Period
(Day/Month/Year)
GB38.9150 N
100.3042 E
1567GobiCNR1 net radiometers22/07/2012–12/04/2015
SSW38.7892 N
100.4933 E
1555Sand duneCNR1 net radiometers08/06/2012–11/04/2015
HZZ38.7652 N
100.3186 E
1735Desert steppeCNR1 net radiometers04/06/2012–31/12/2016
Table 2. Dates and overpass times of ASTER images and standard deviation (SD) of 11 × 11 ASTER land surface temperature (LST) pixels at three sites.
CaseDateOverpass Time (UTC)SD of LST (K)
GBSSWHZZ
130/05/201204:190.821.370.58
215/06/201204:190.870.850.70
324/06/201204:130.771.030.64
410/07/201204:131.121.440.81
502/08/201204:191.351.820.70
611/08/201204:131.241.480.87
718/08/201204:190.630.640.78
827/08/201204:131.040.990.51
903/09/201204:191.131.080.40
1012/09/201204:191.091.011.07
1119/09/201204:191.110.770.63
1228/09/201204:131.000.860.54
Table 3. Summary of the evaluation results of MODIS C5 and C6 1-km LST products obtained from the Terra satellite at three sites.
StatisticsGB SiteSSW SiteHZZ SiteAll
C6C5C6C5C6C5C6C5
DayBias (K)−0.64−0.91−0.16−1.061.712.720.300.25
SD (K)1.121.491.742.561.811.741.561.93
RMSE (K)1.281.731.732.752.483.221.832.57
N393842585754138150
NightBias (K)−1.54−1.23−1.91−2.66−1.40−1.38−1.62−1.76
SD (K)0.400.840.791.731.021.310.741.29
RMSE (K)1.591.482.063.161.721.891.792.18
N282732384738107103
Table 4. Summary of the evaluation results of MODIS C5 and C6 1-km LST products obtained from the Aqua satellite at three sites.
StatisticsGB SiteSSW SiteHZZ SiteAll
C6C5C6C5C6C5C6C5
DayBias (K)−2.05−3.07−0.99−1.31−0.02−0.71−1.02−1.70
SD (K)1.122.331.872.542.353.831.782.9
RMSE (K)2.323.832.092.832.313.862.243.51
N20293148334584122
NightBias (K)−1.42−1.02−2.12−1.78−0.91−0.37−1.48−1.06
SD (K)0.530.761.241.680.590.930.791.12
RMSE (K)1.511.272.452.441.080.991.681.57
N16342745305073129

