Assessing the Effects of Land-Use Types in Surface Urban Heat Islands for Developing Comfortable Living in Hanoi City

 ,
,  ,
,
Abstract
:
1. Introduction
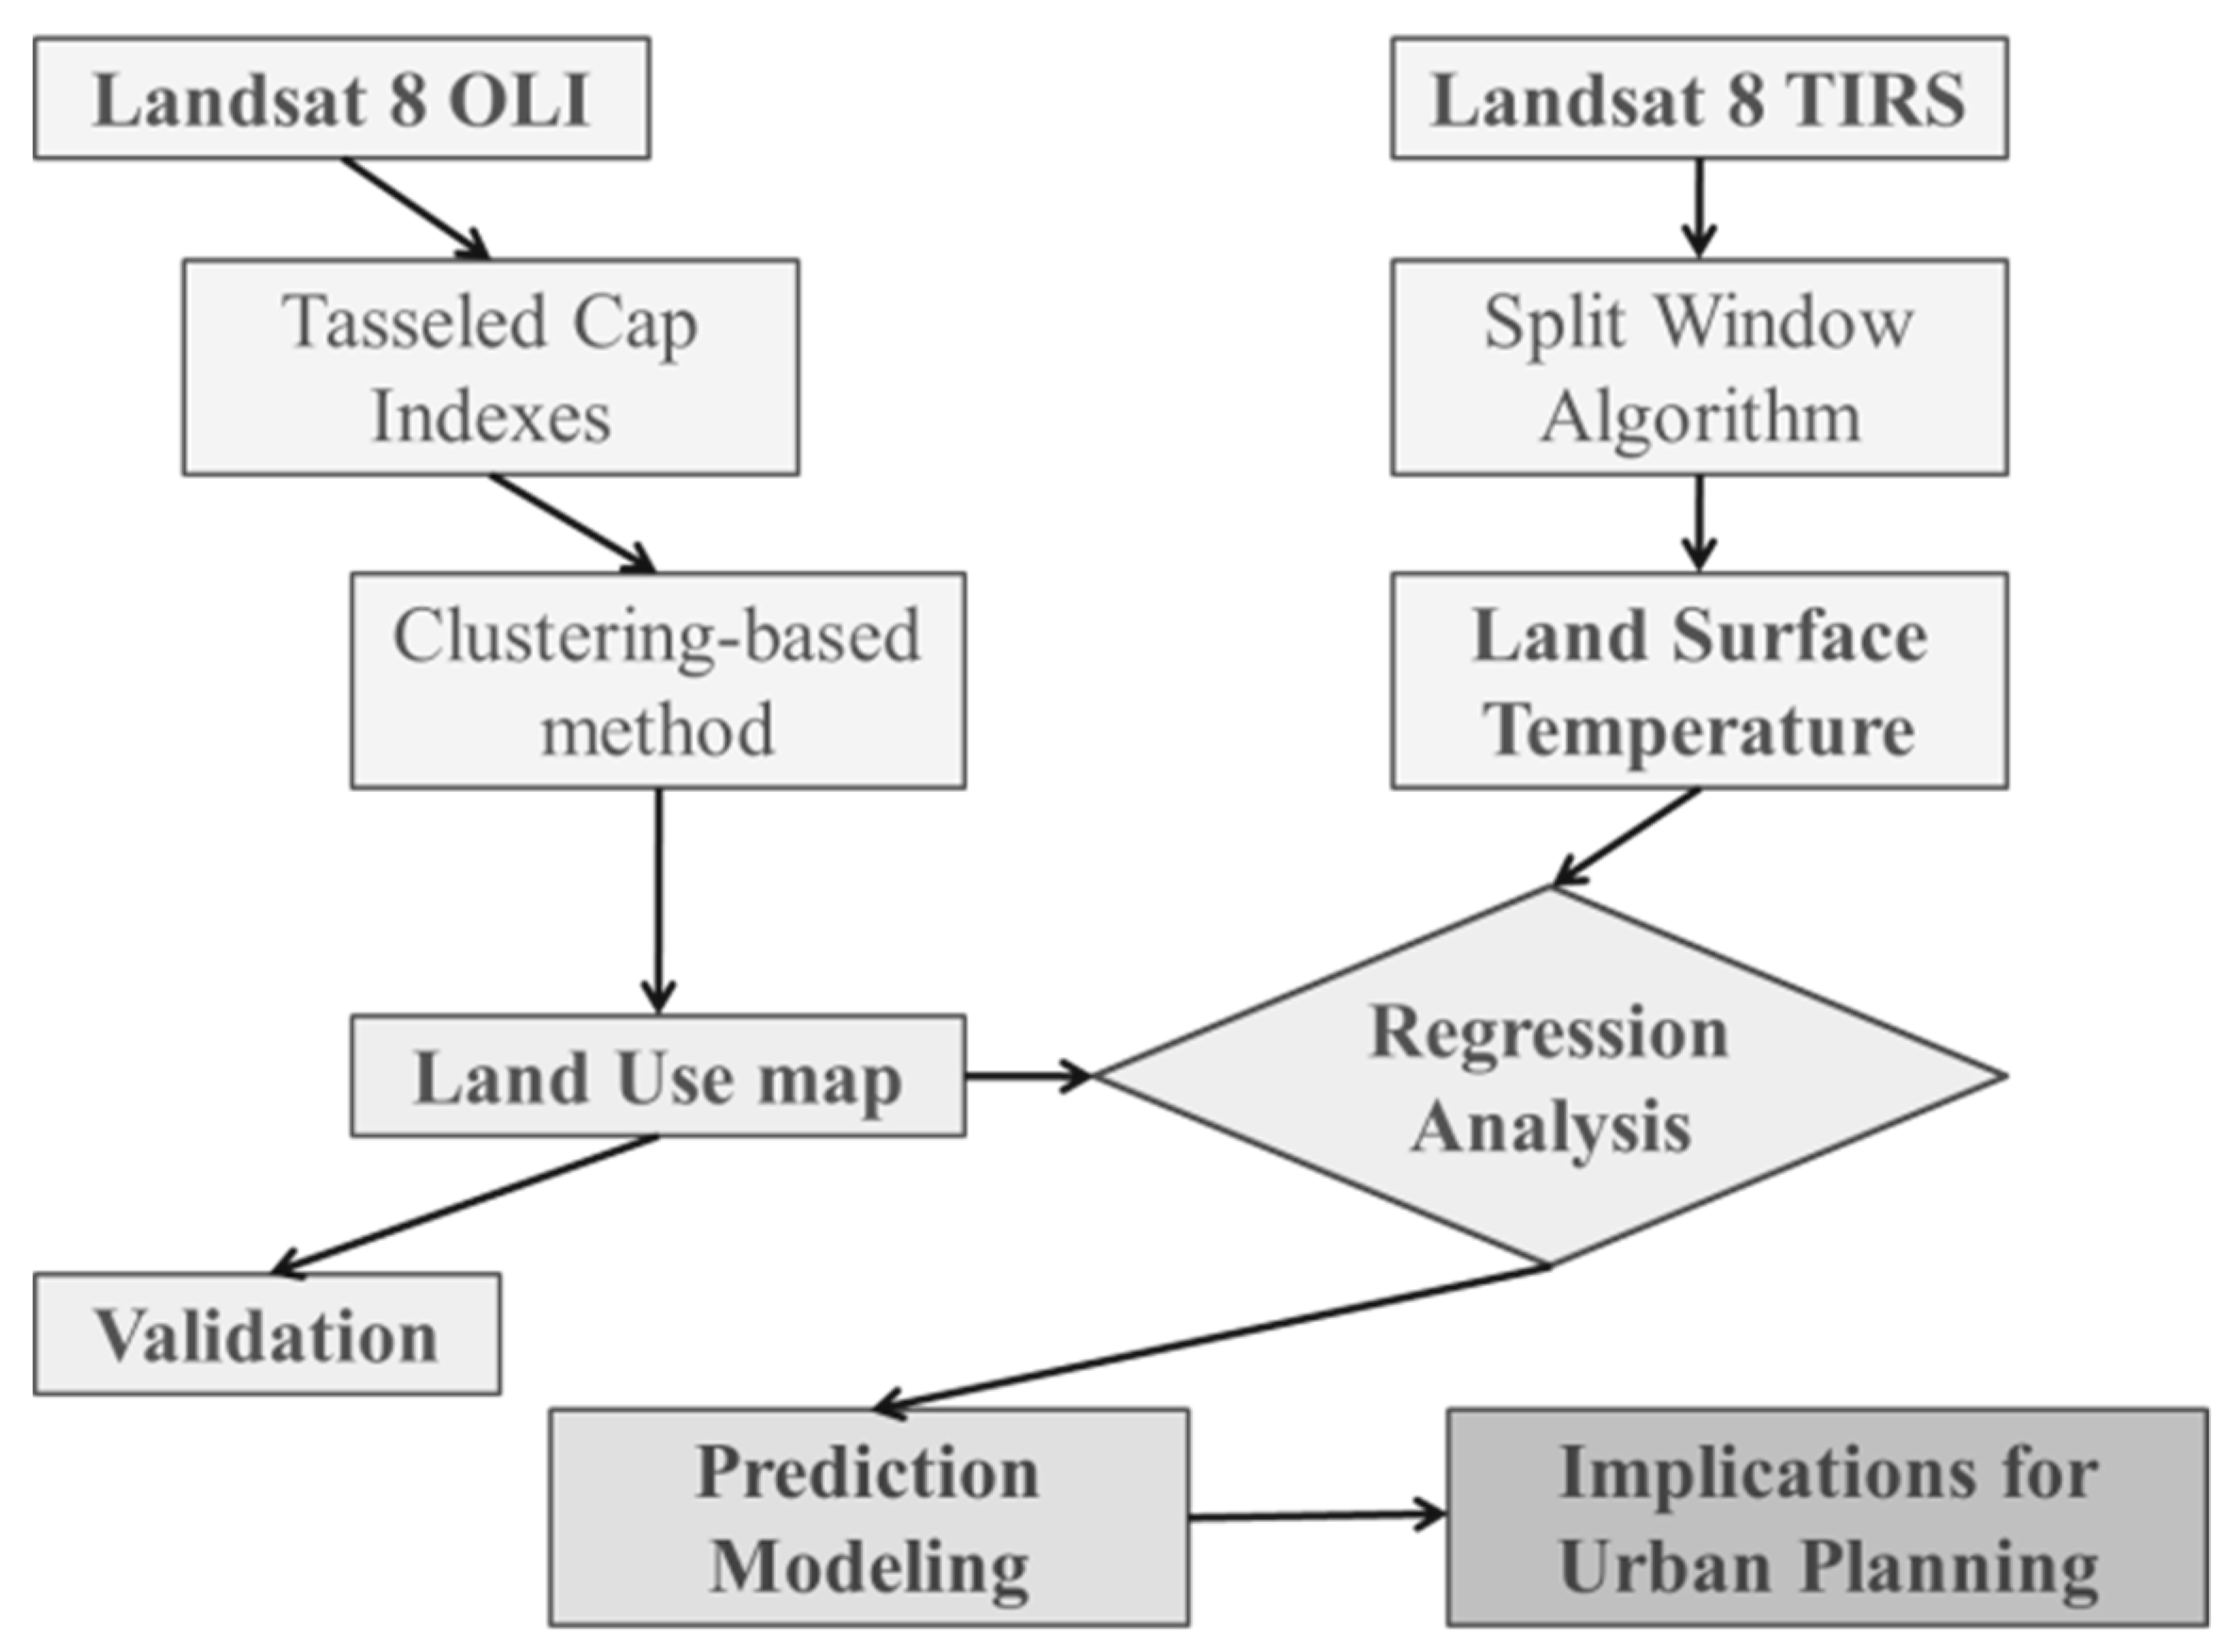
2. Methodology
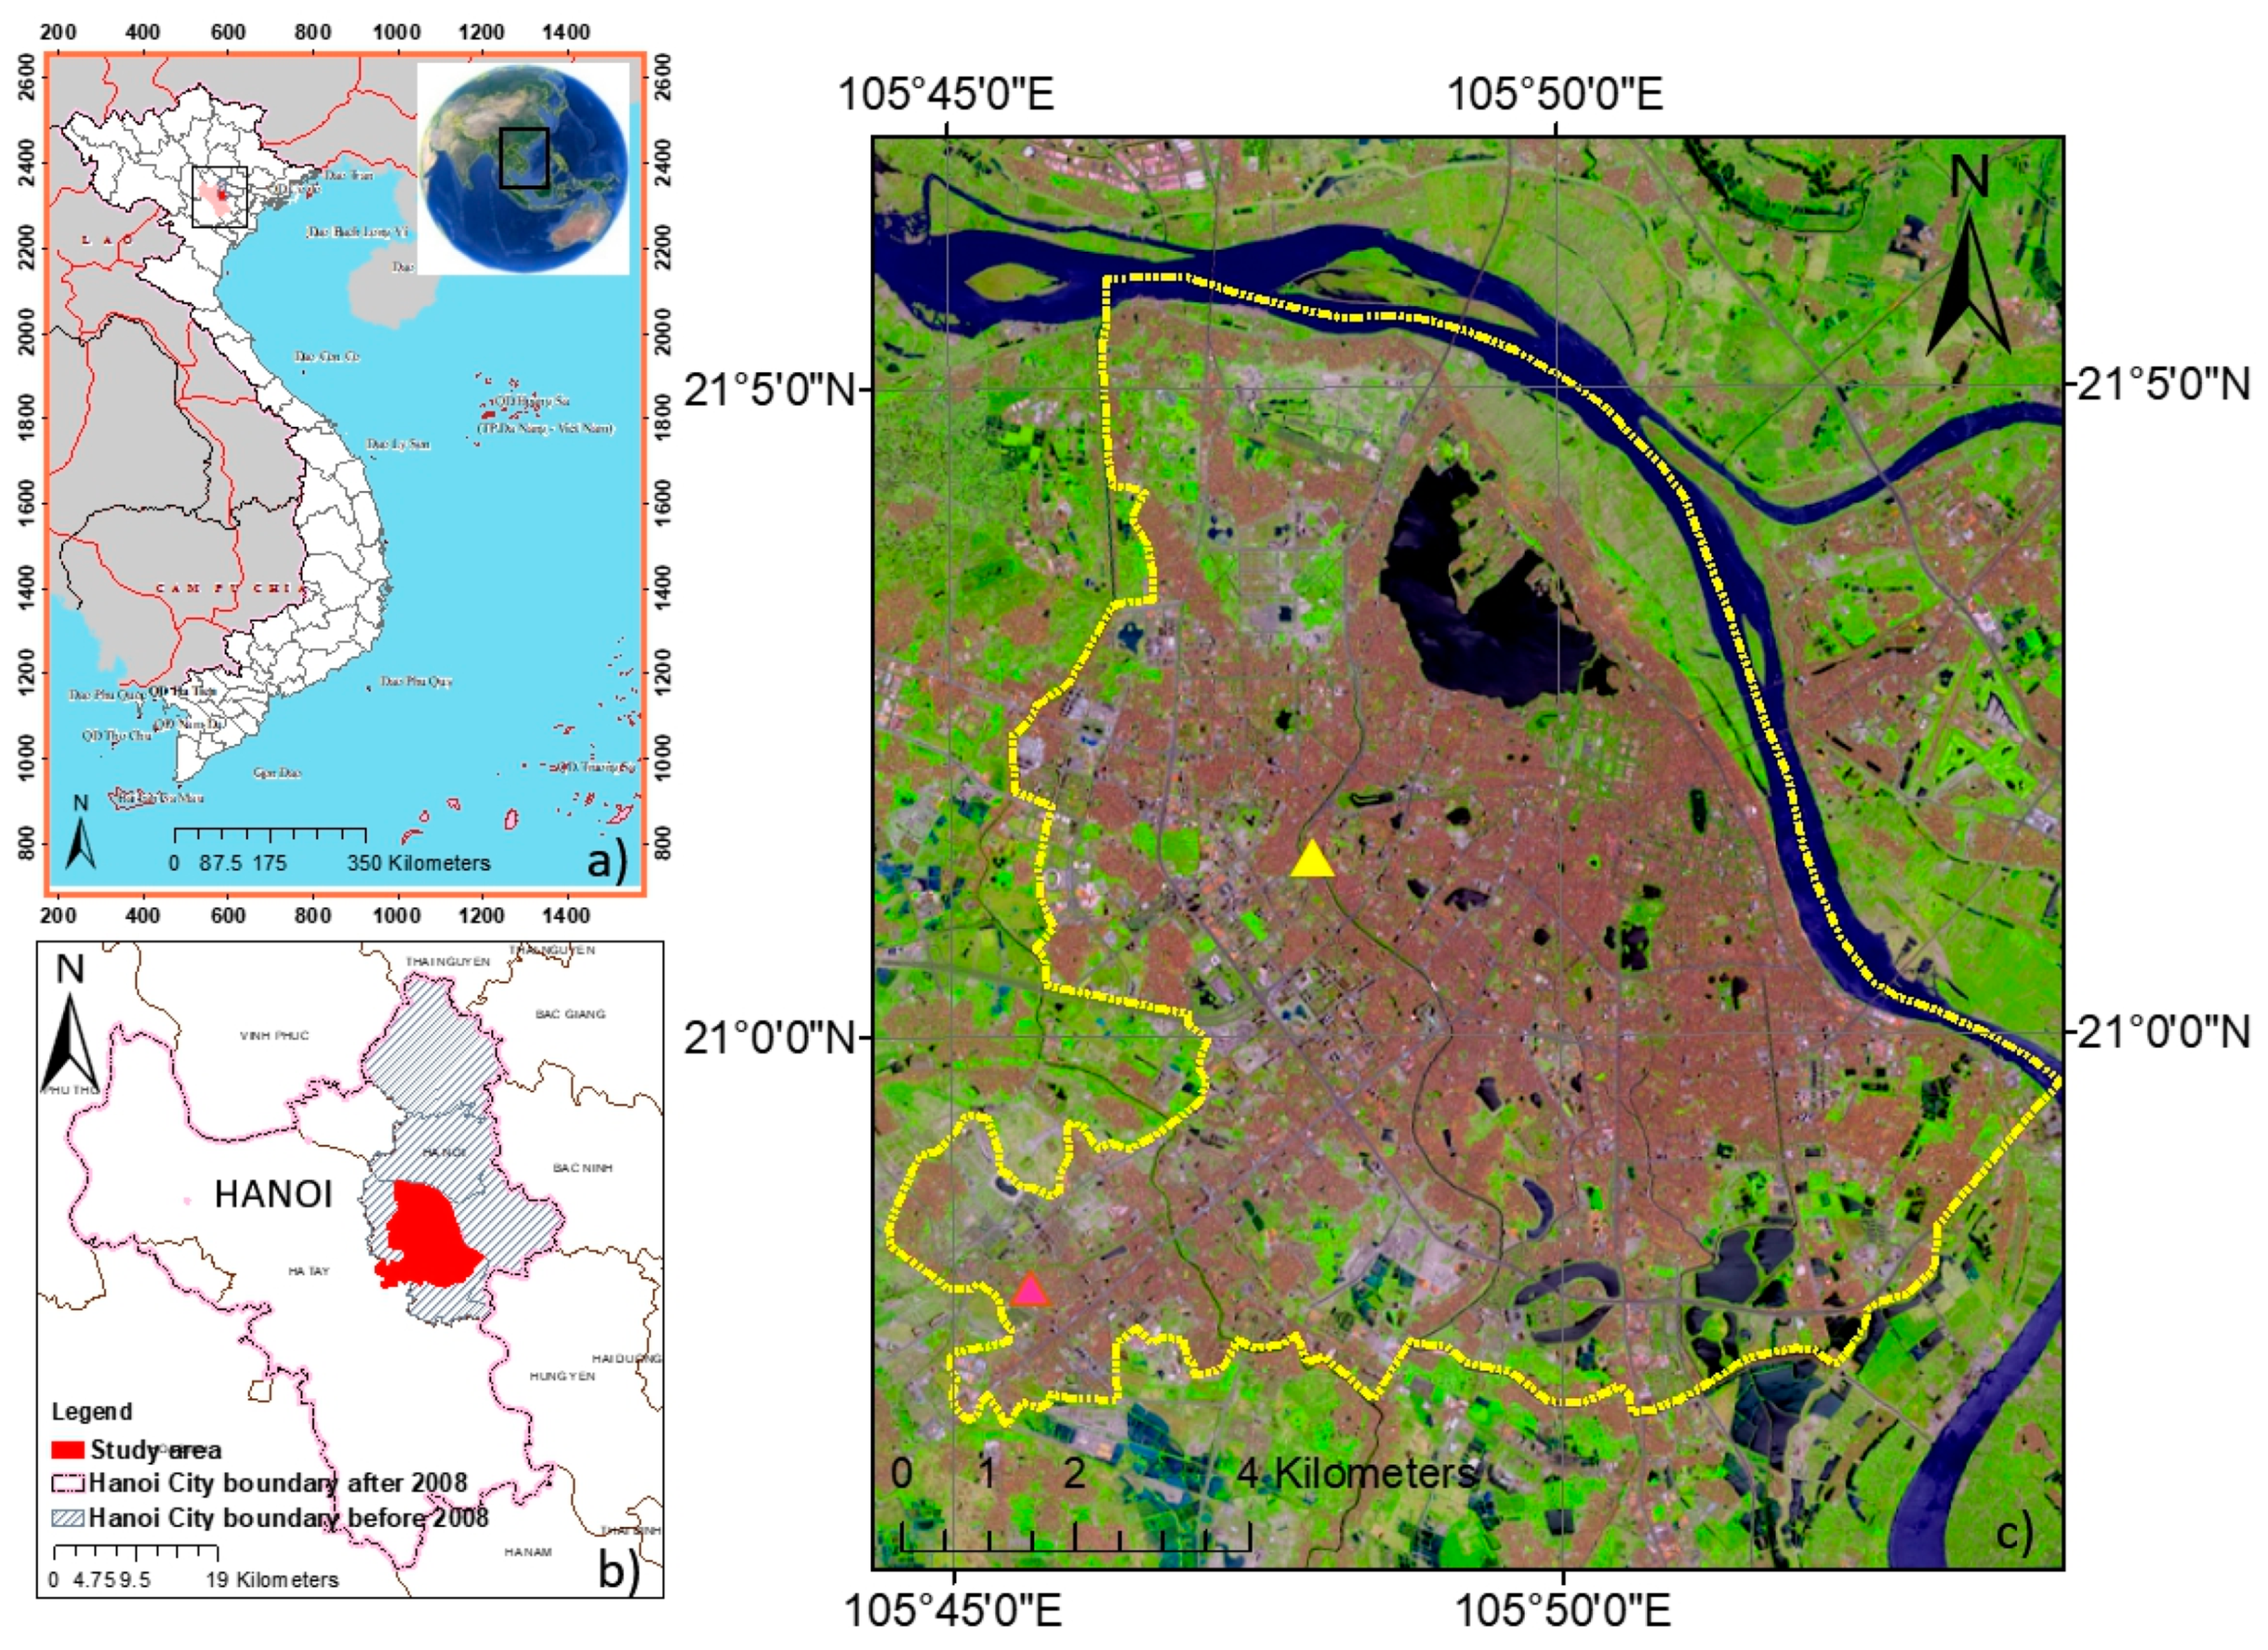
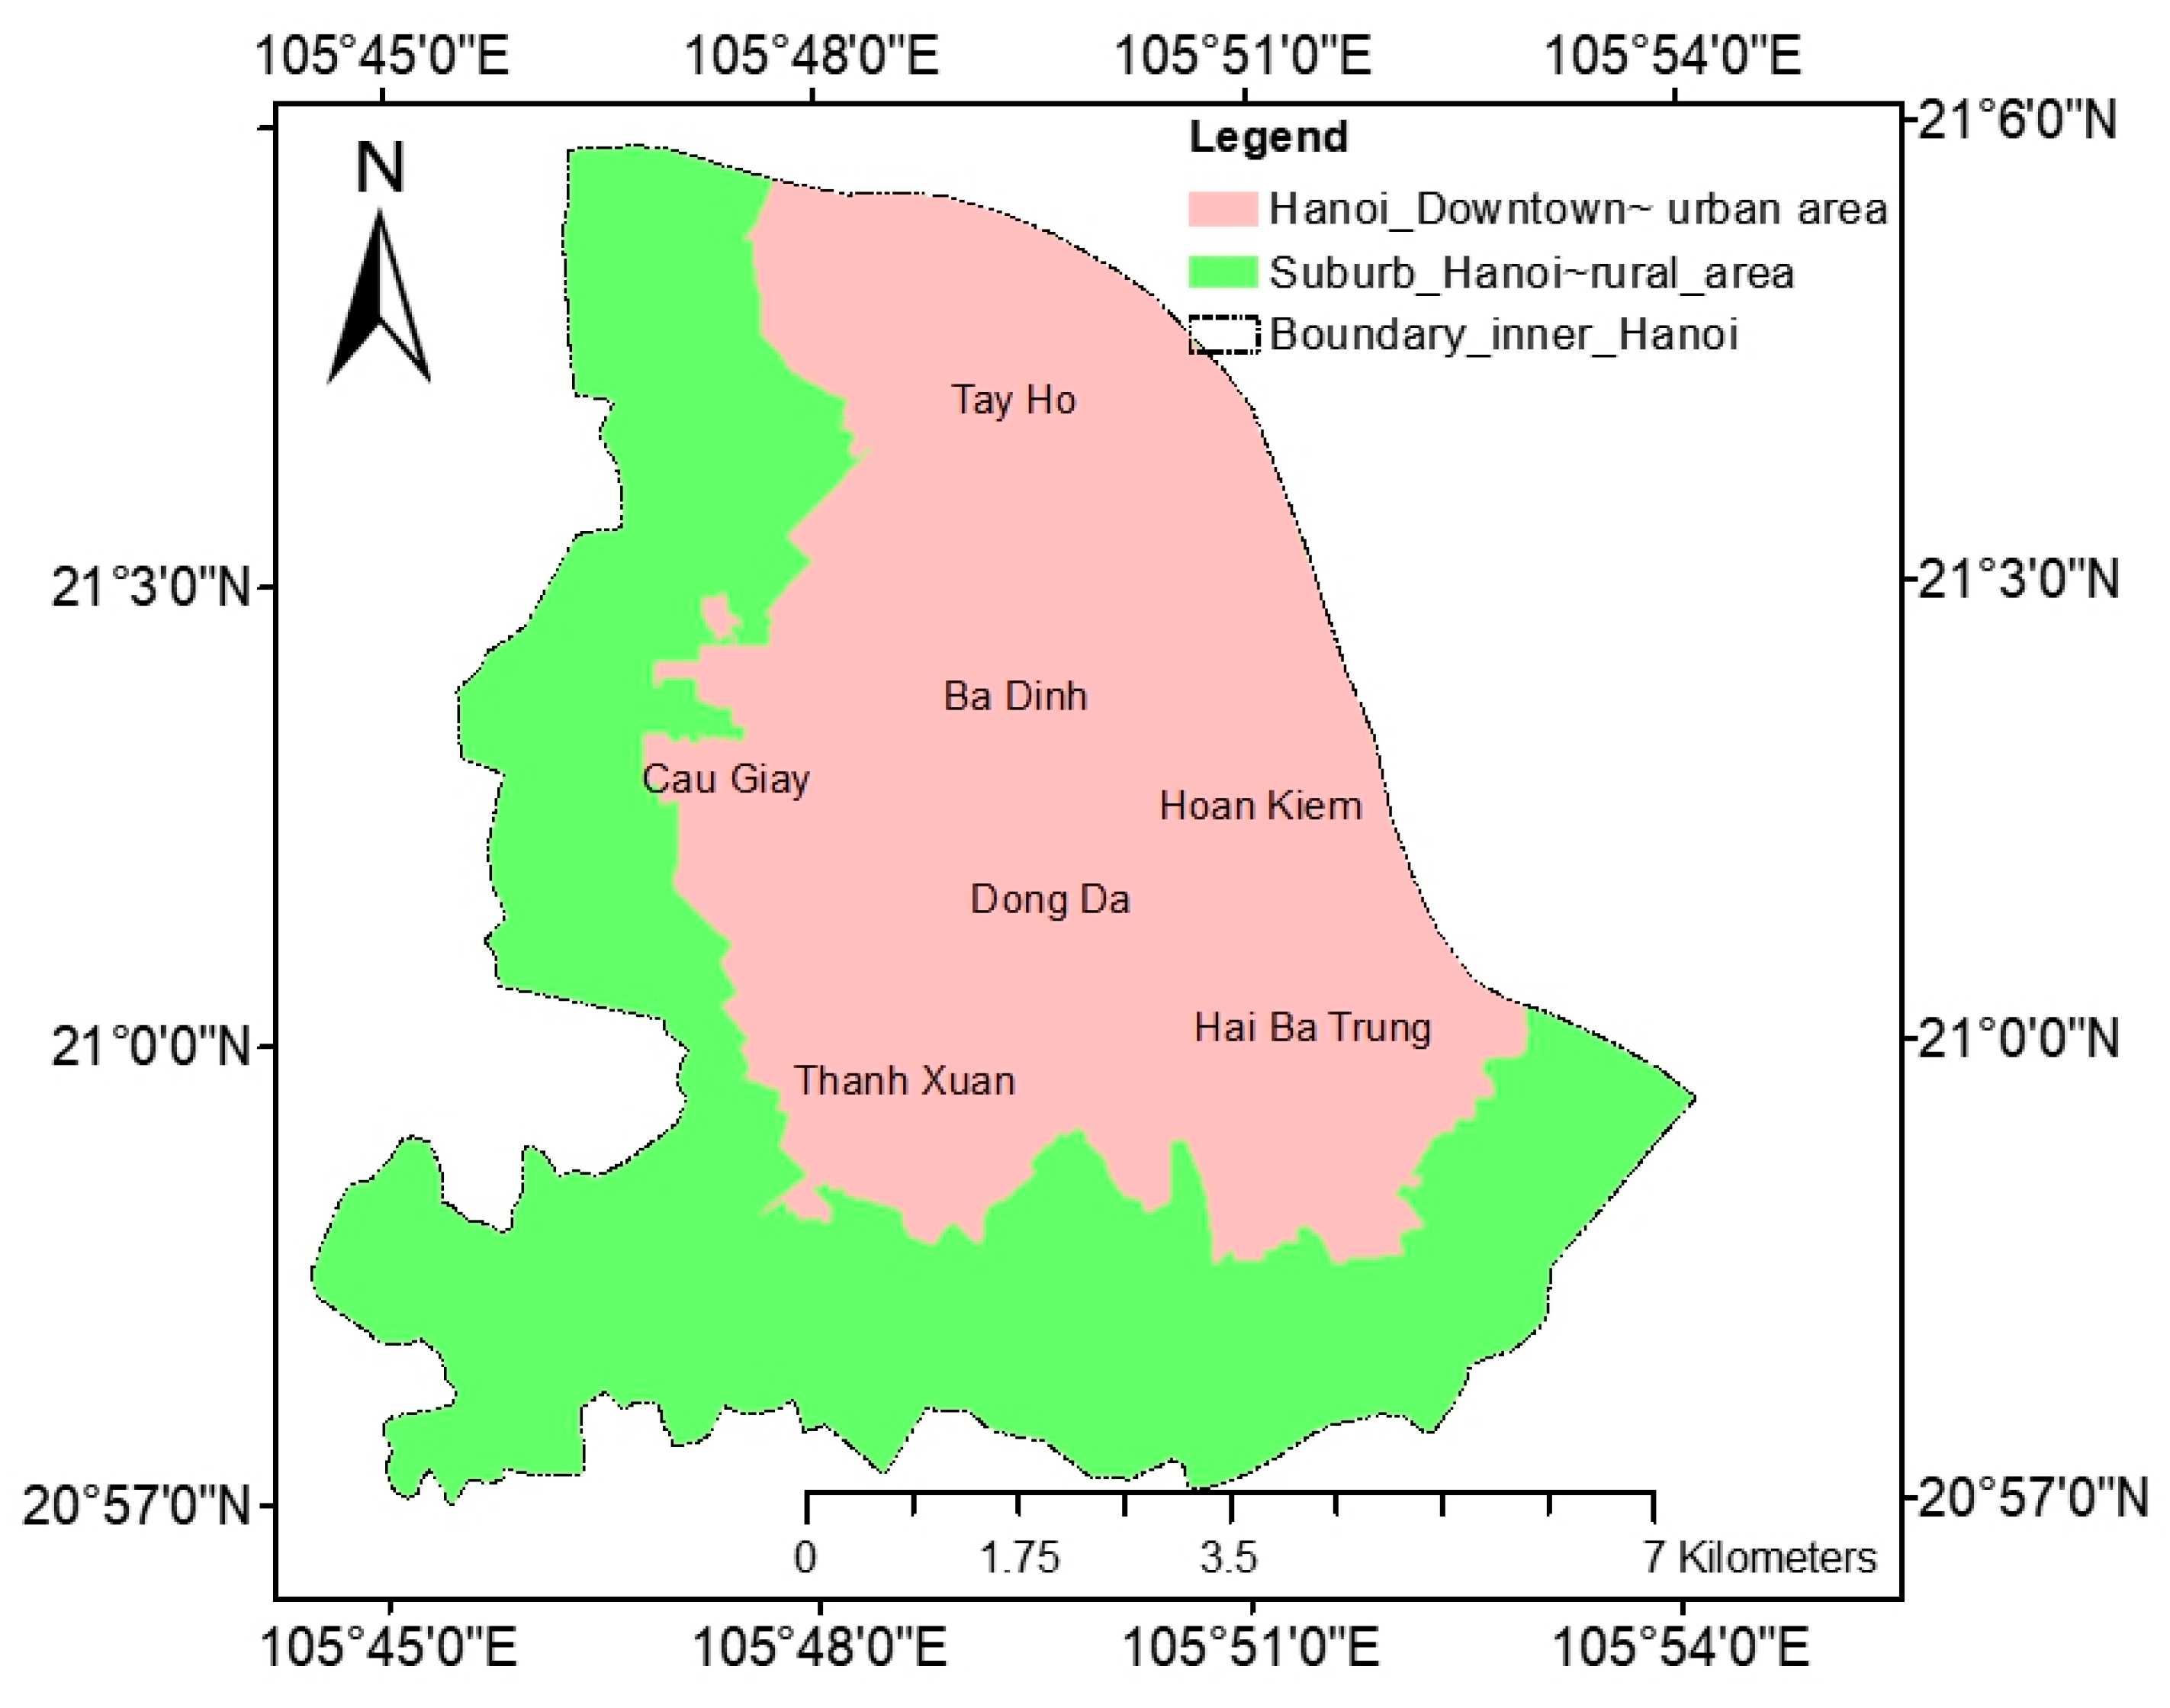
2.1. Study Area
2.2. Air Temperature Data
2.3. Acquisition and Pre-Processing of Satellite Data
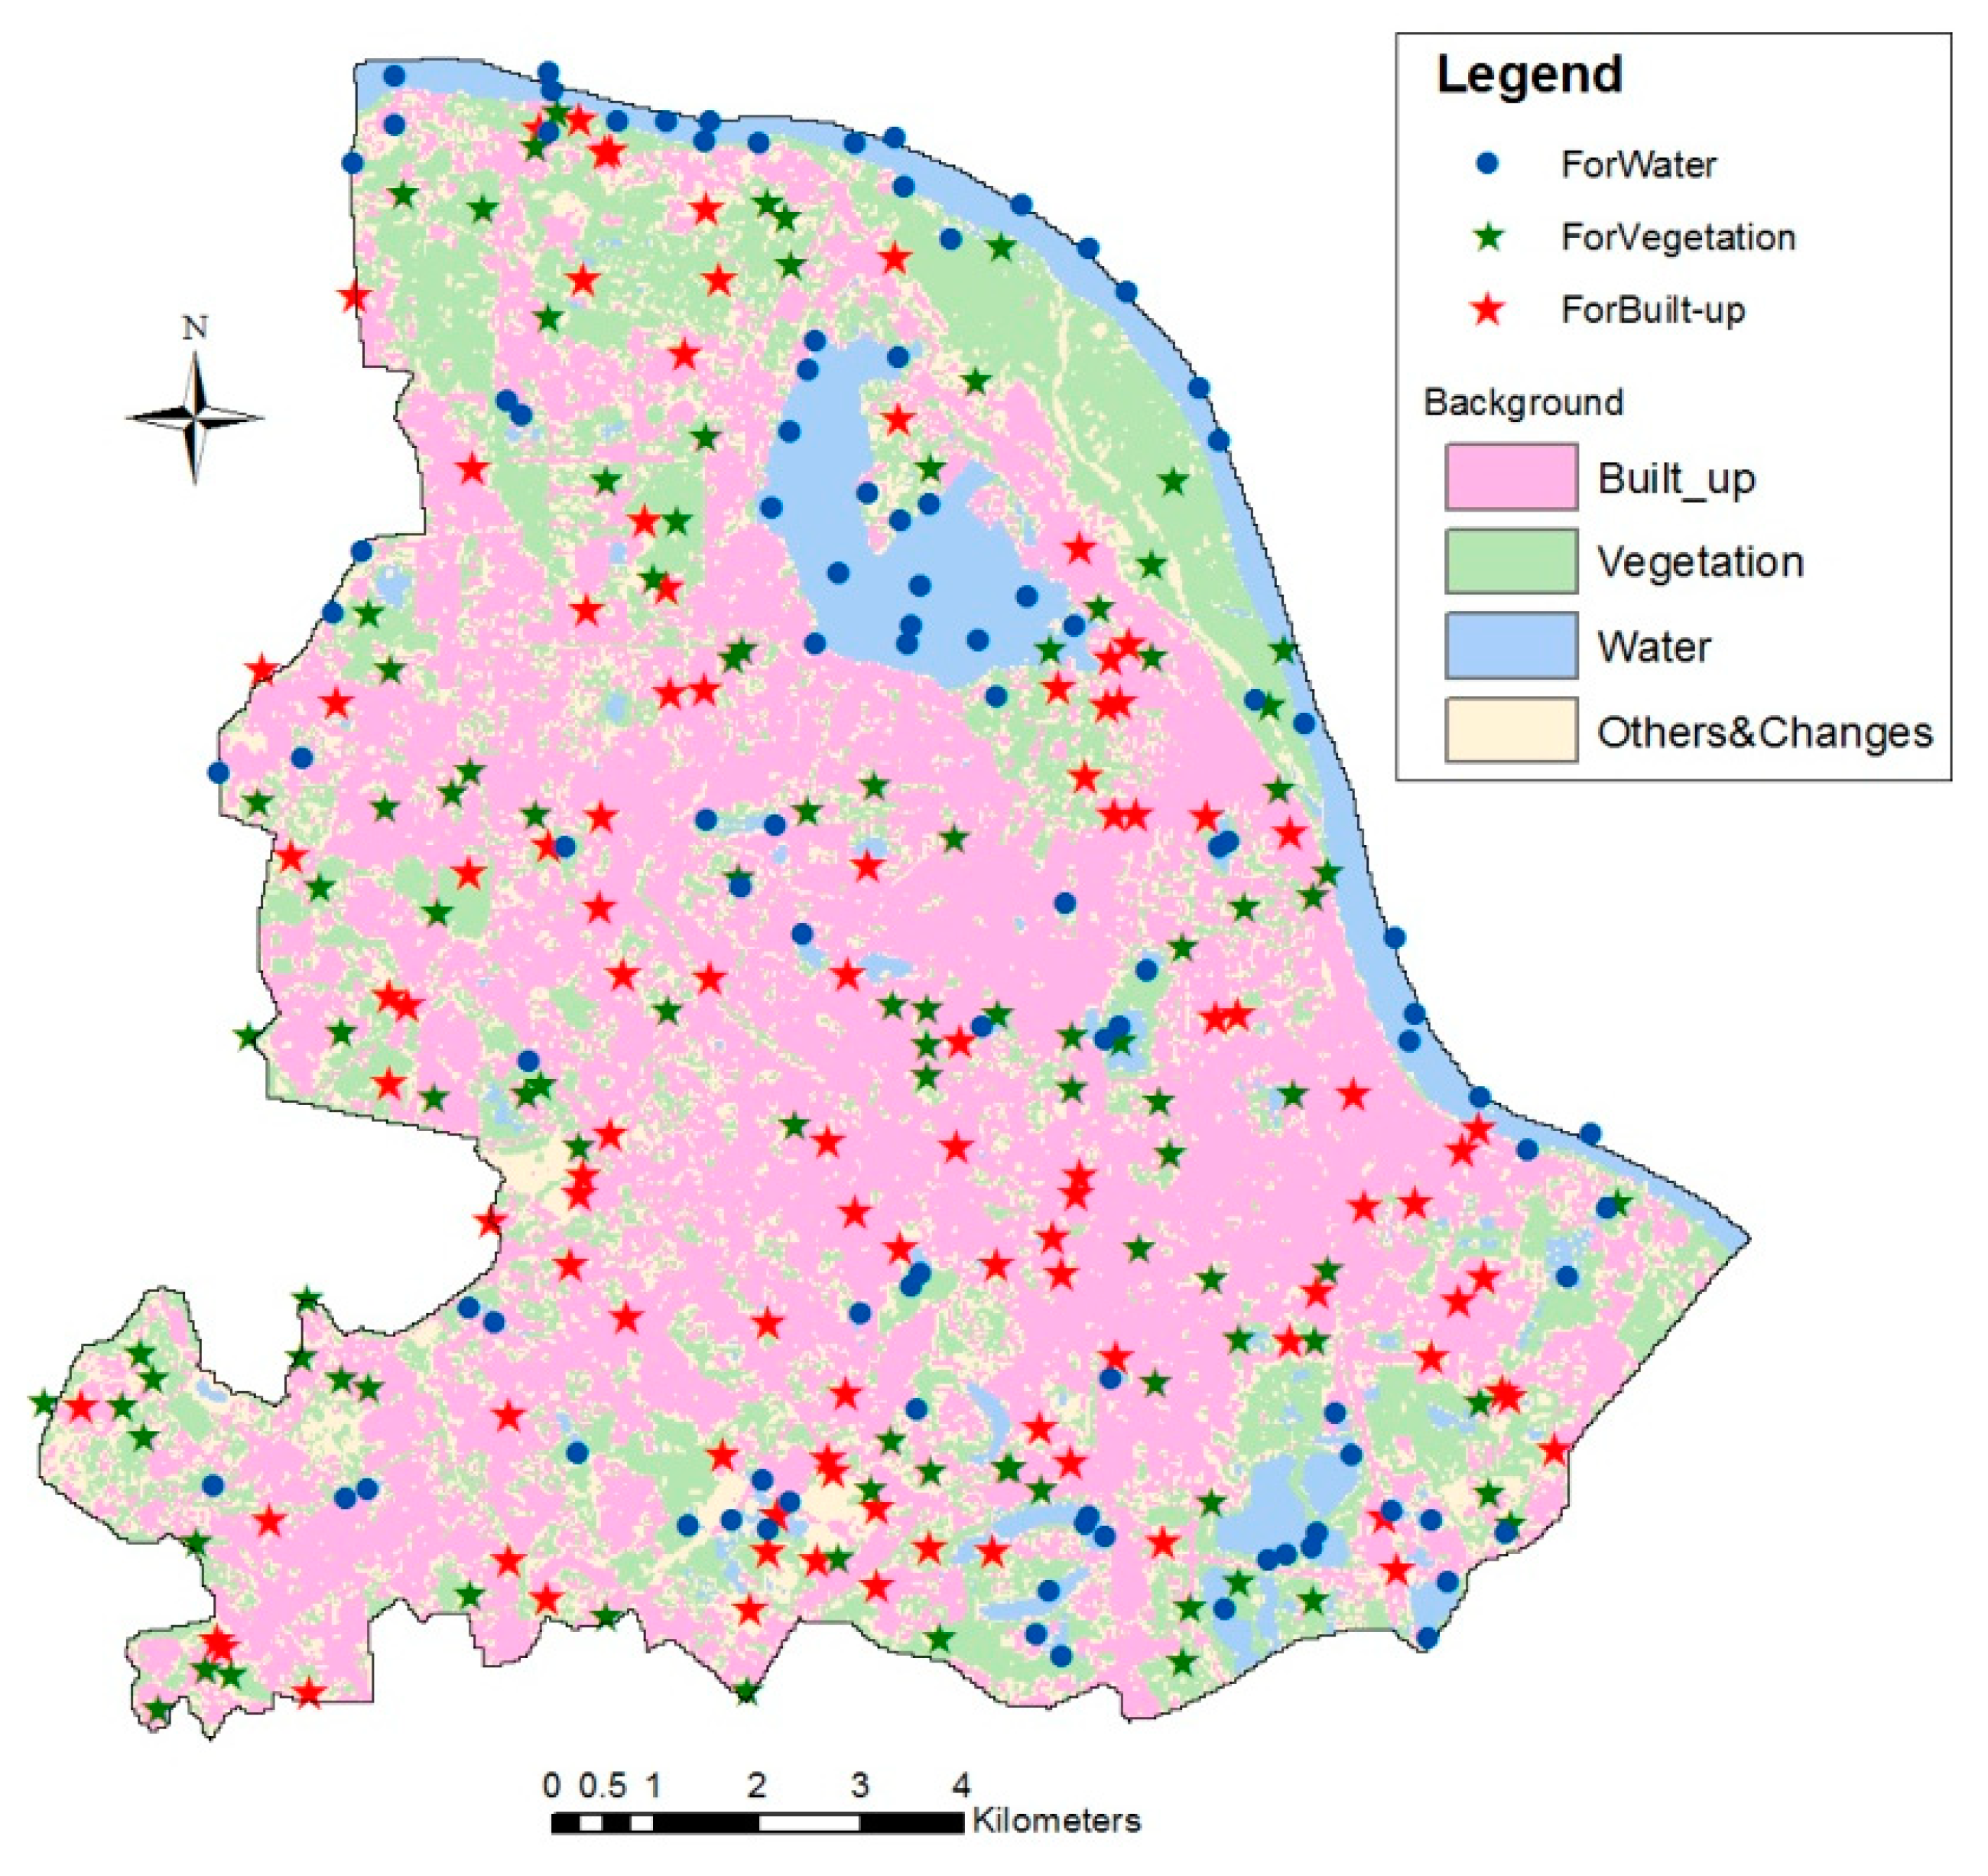
2.4. Land-Use Mapping and Validation
2.5. Mapping of Land Surface Temperature
2.6. Preparation of Statistical Datasets
2.7. Regression Analysis, Modeling, and Validation
3. Results and Discussion
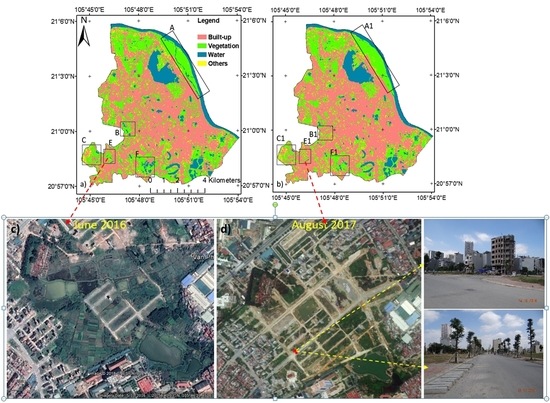
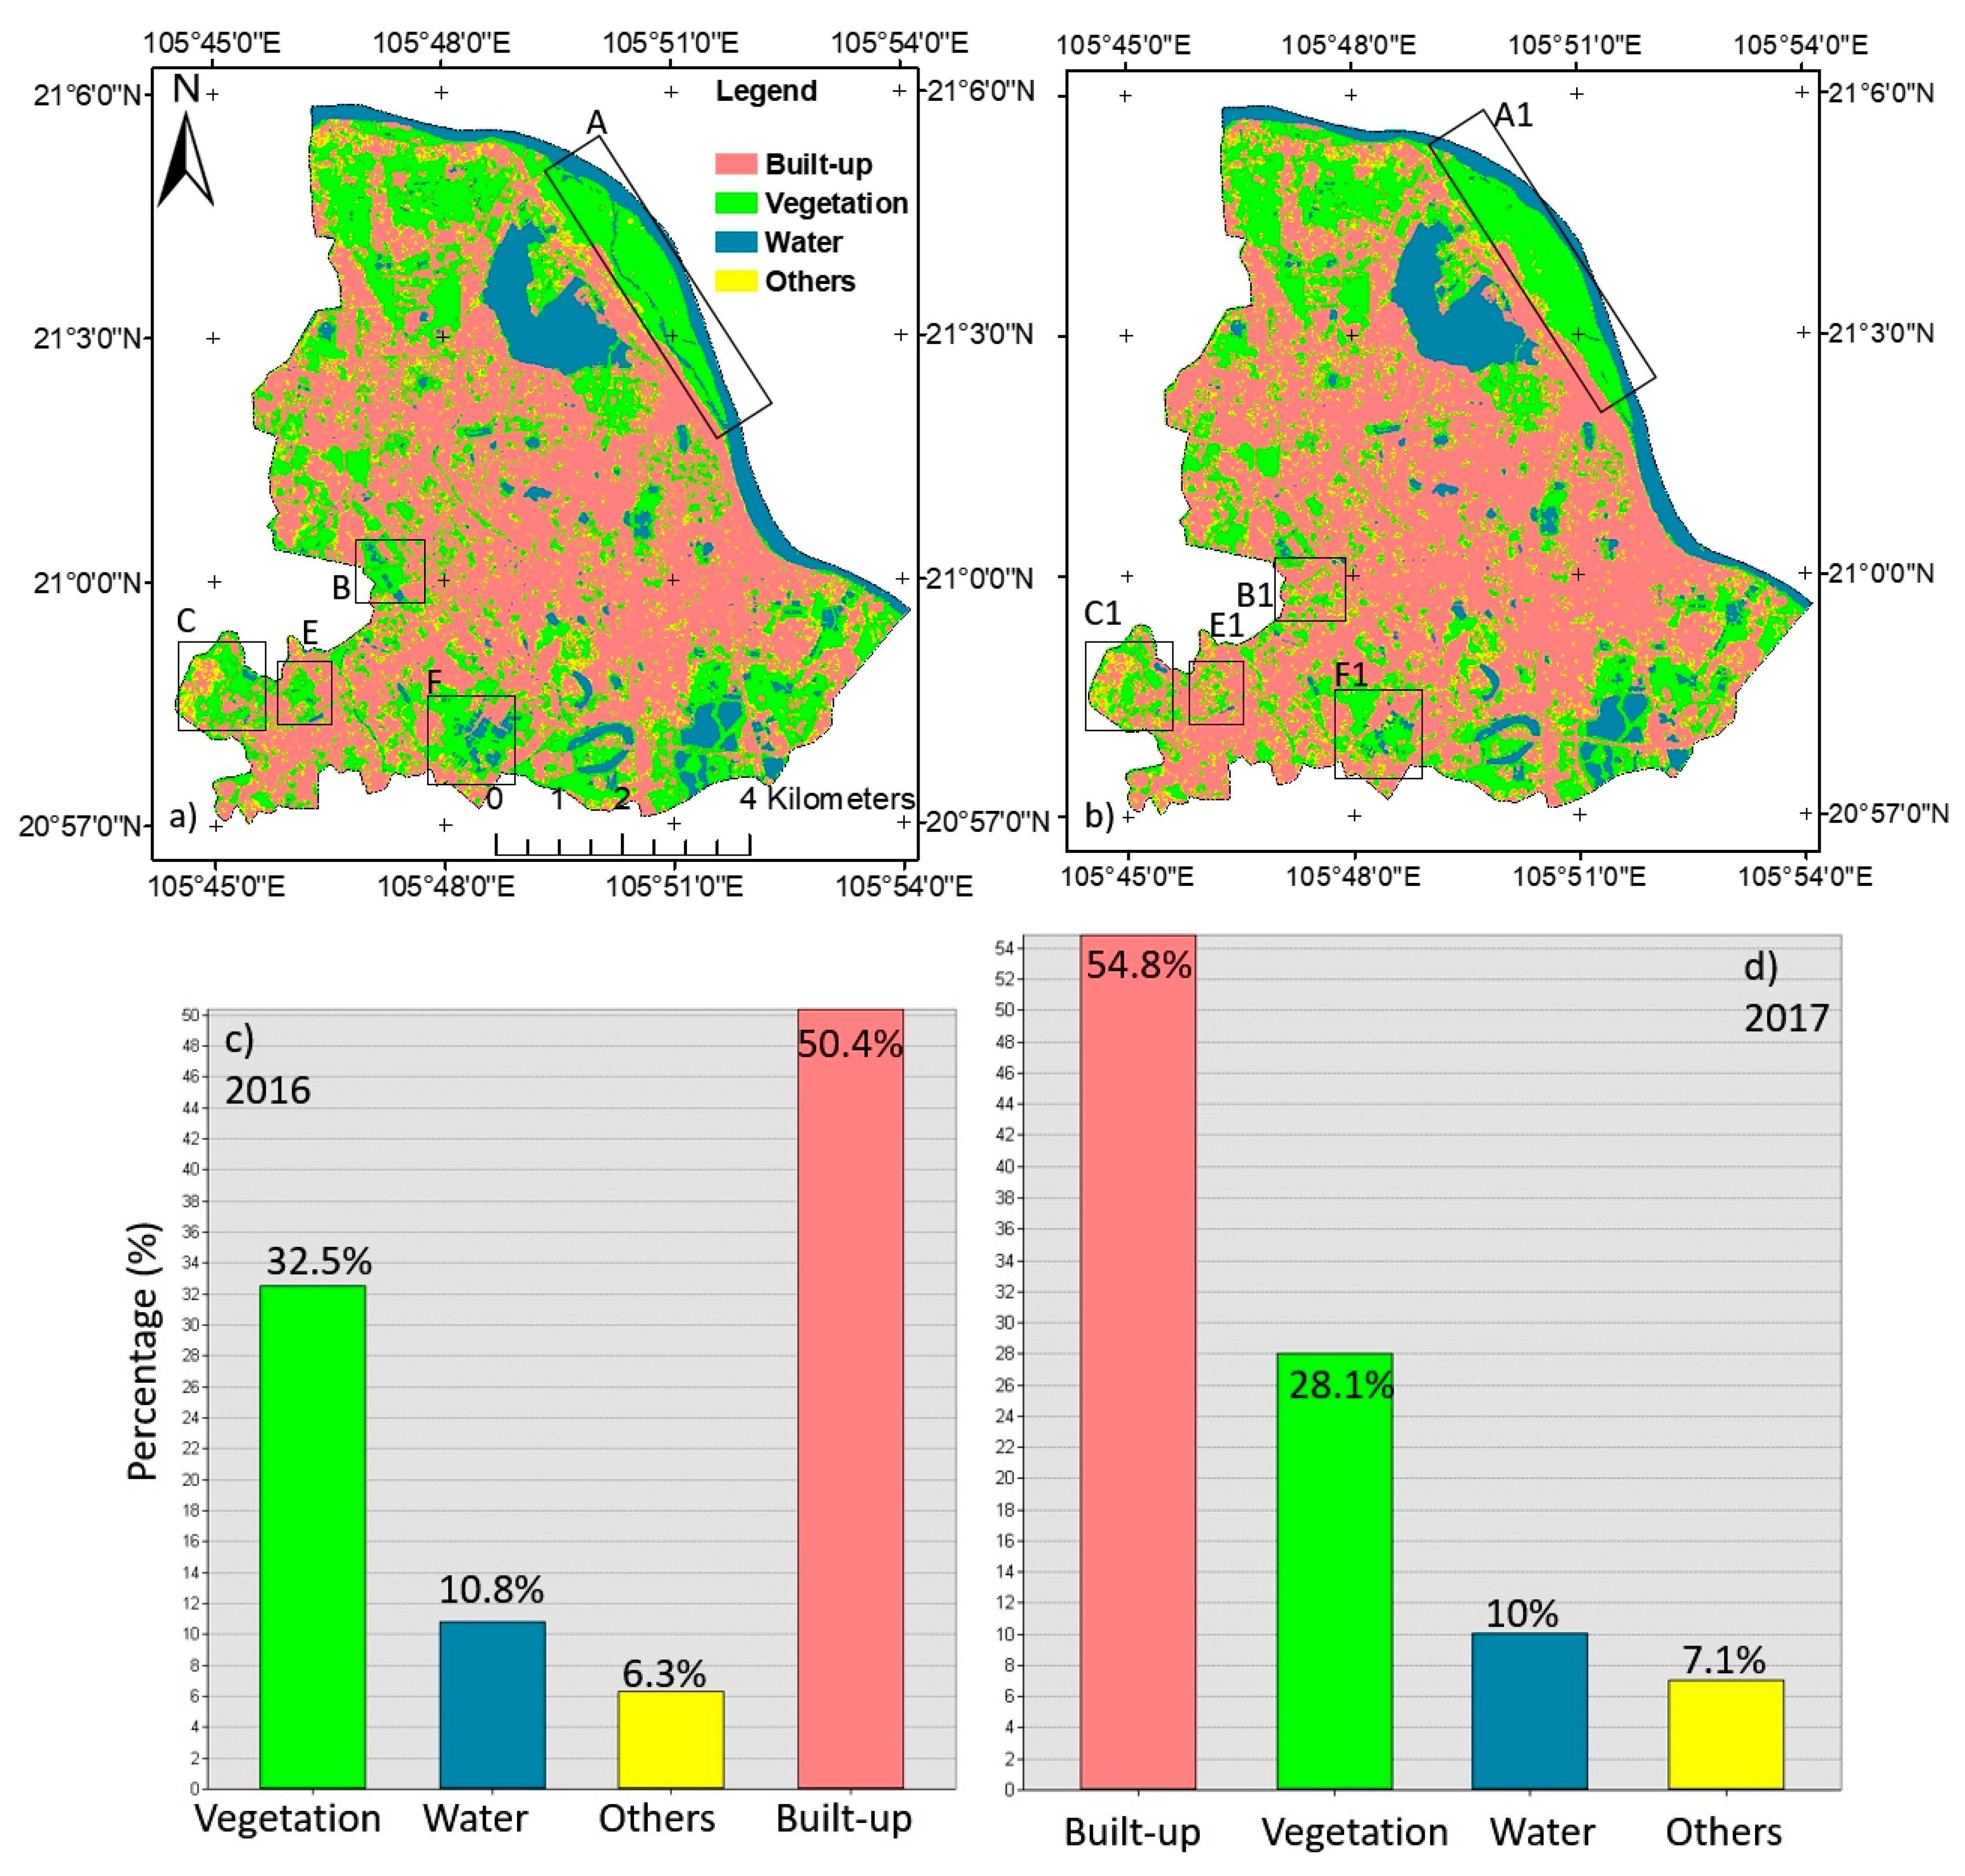
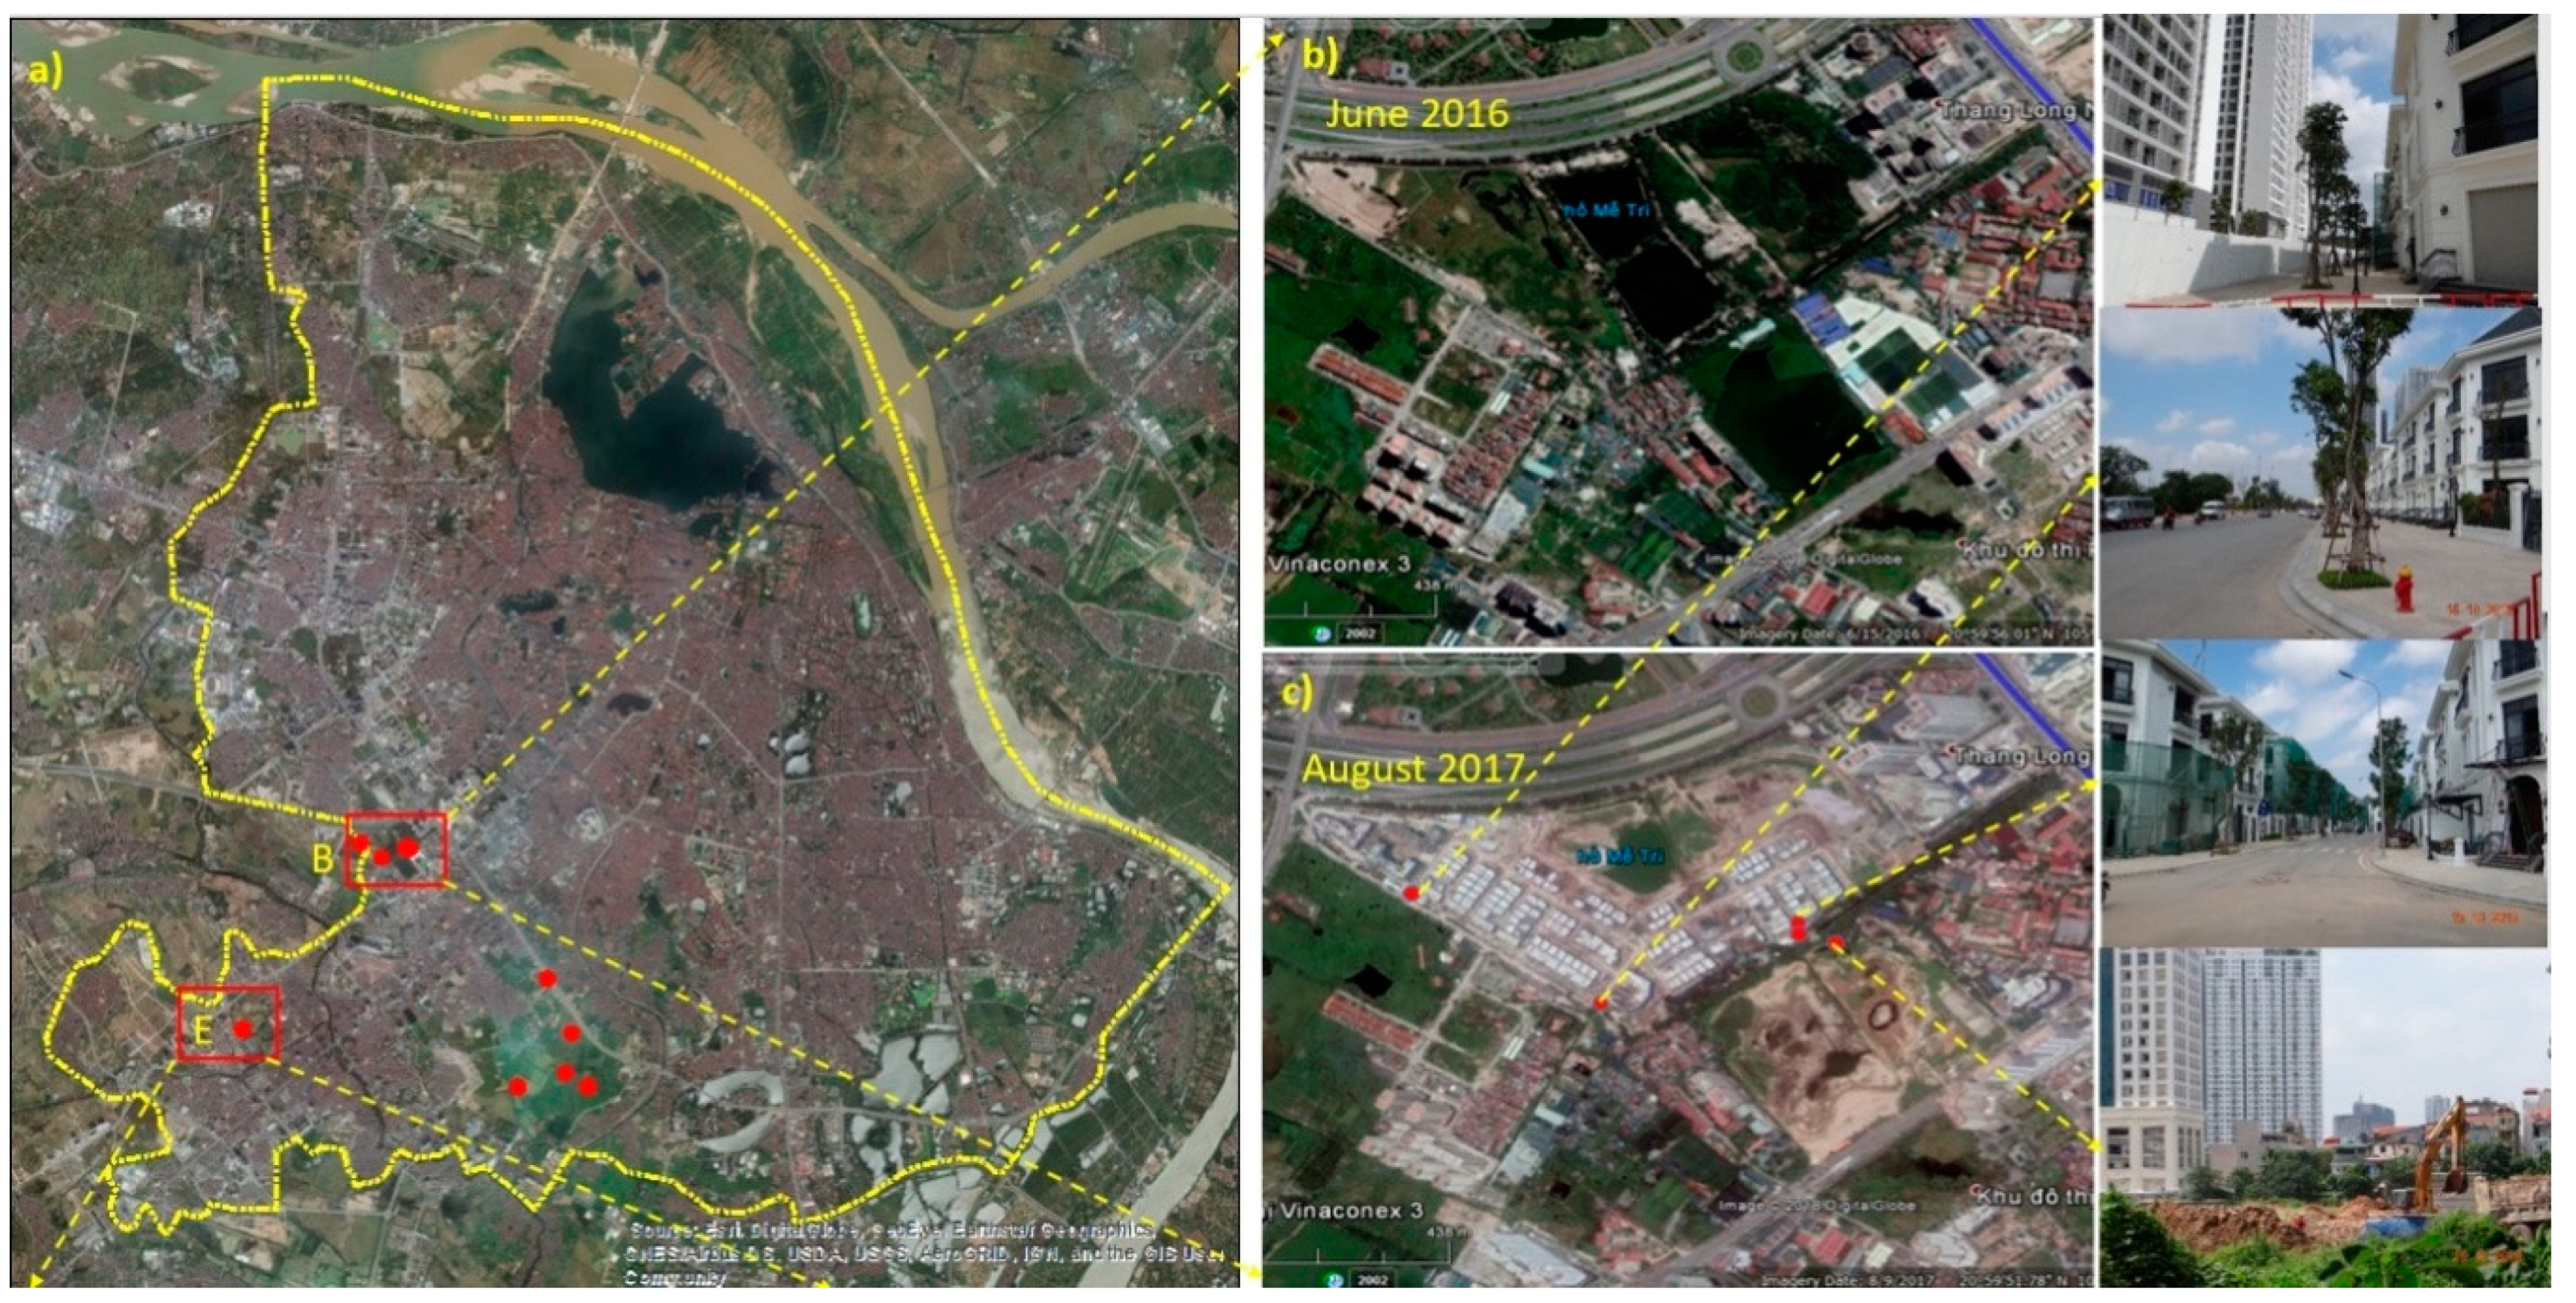
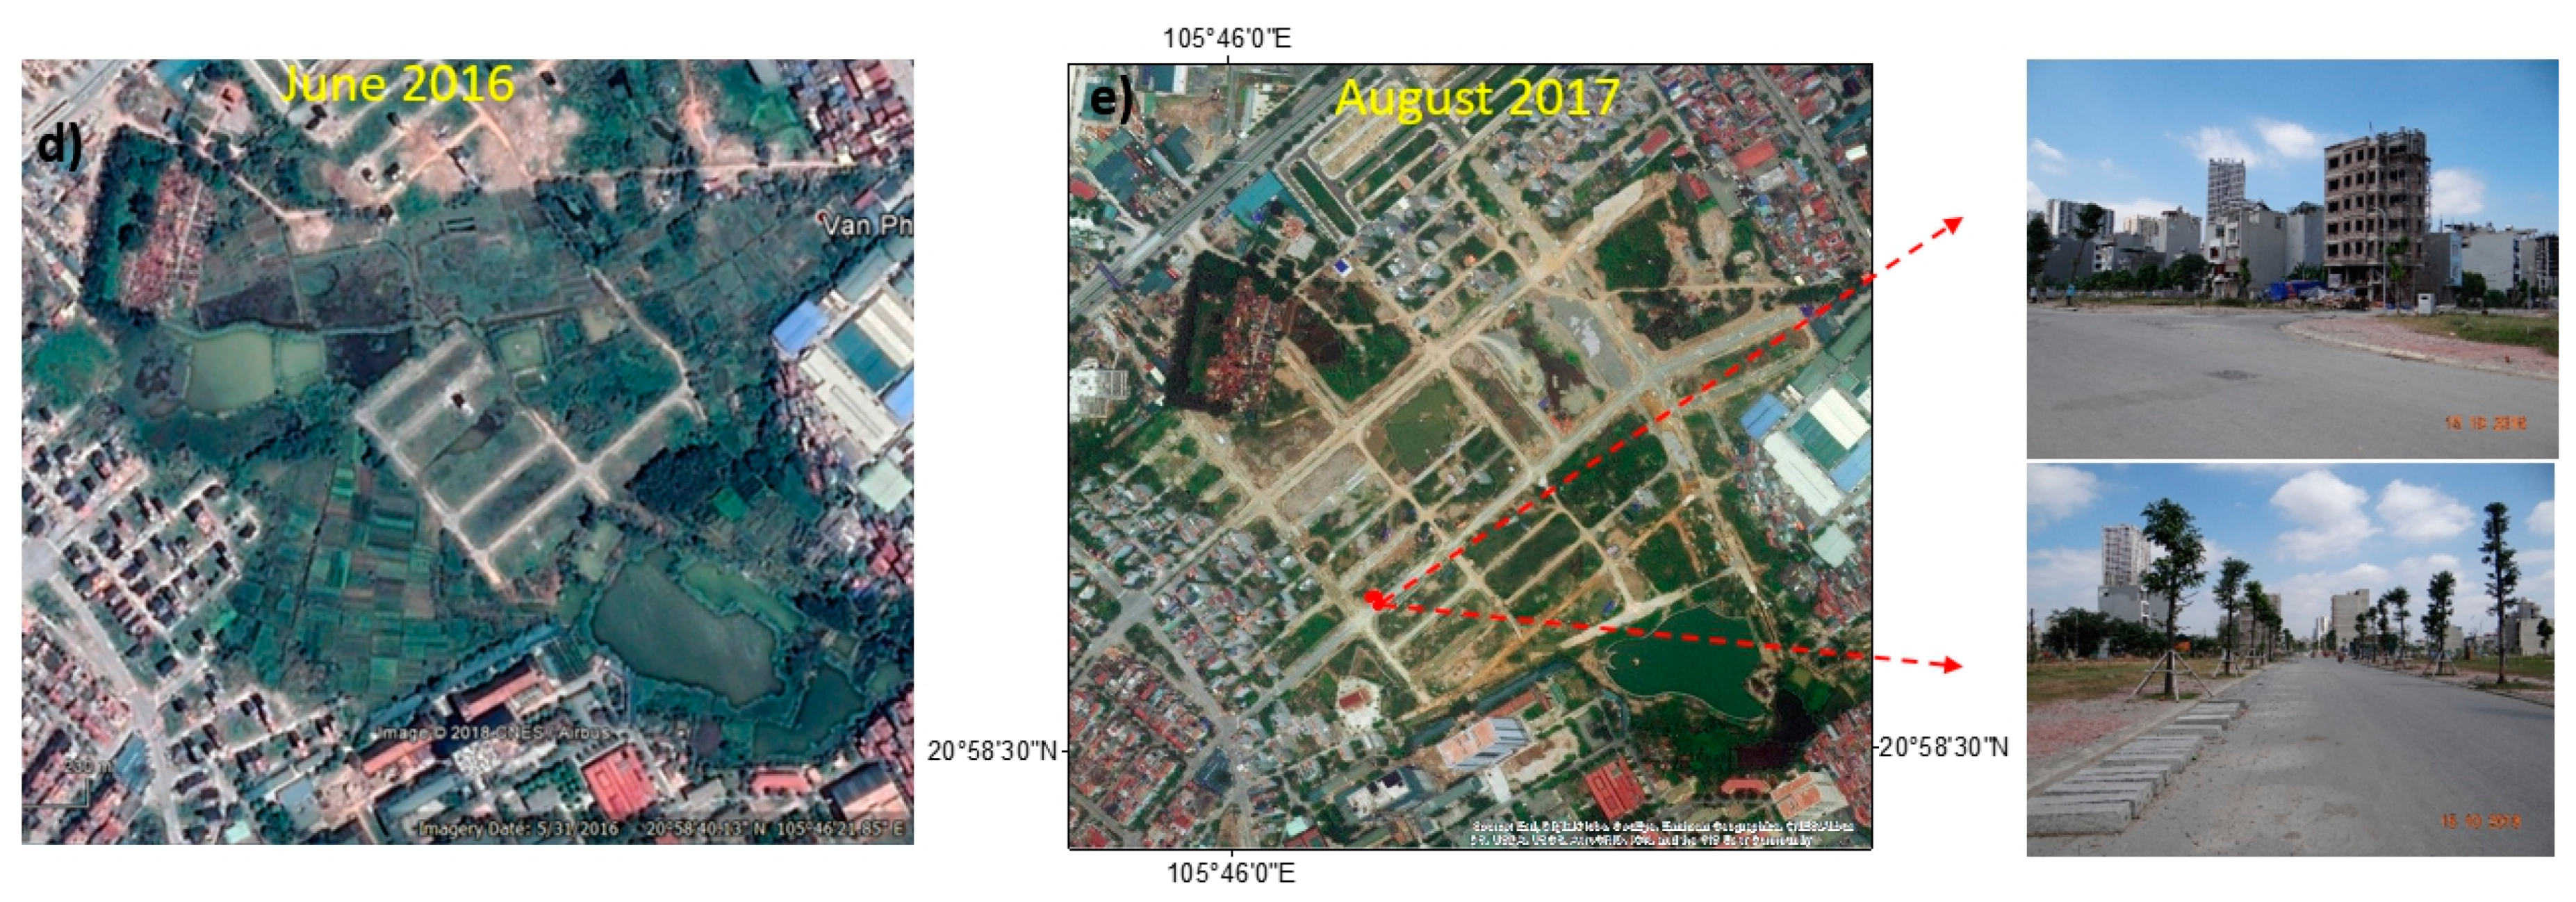
3.1. Land Use Maps, Land Use Changes, and Validation Results
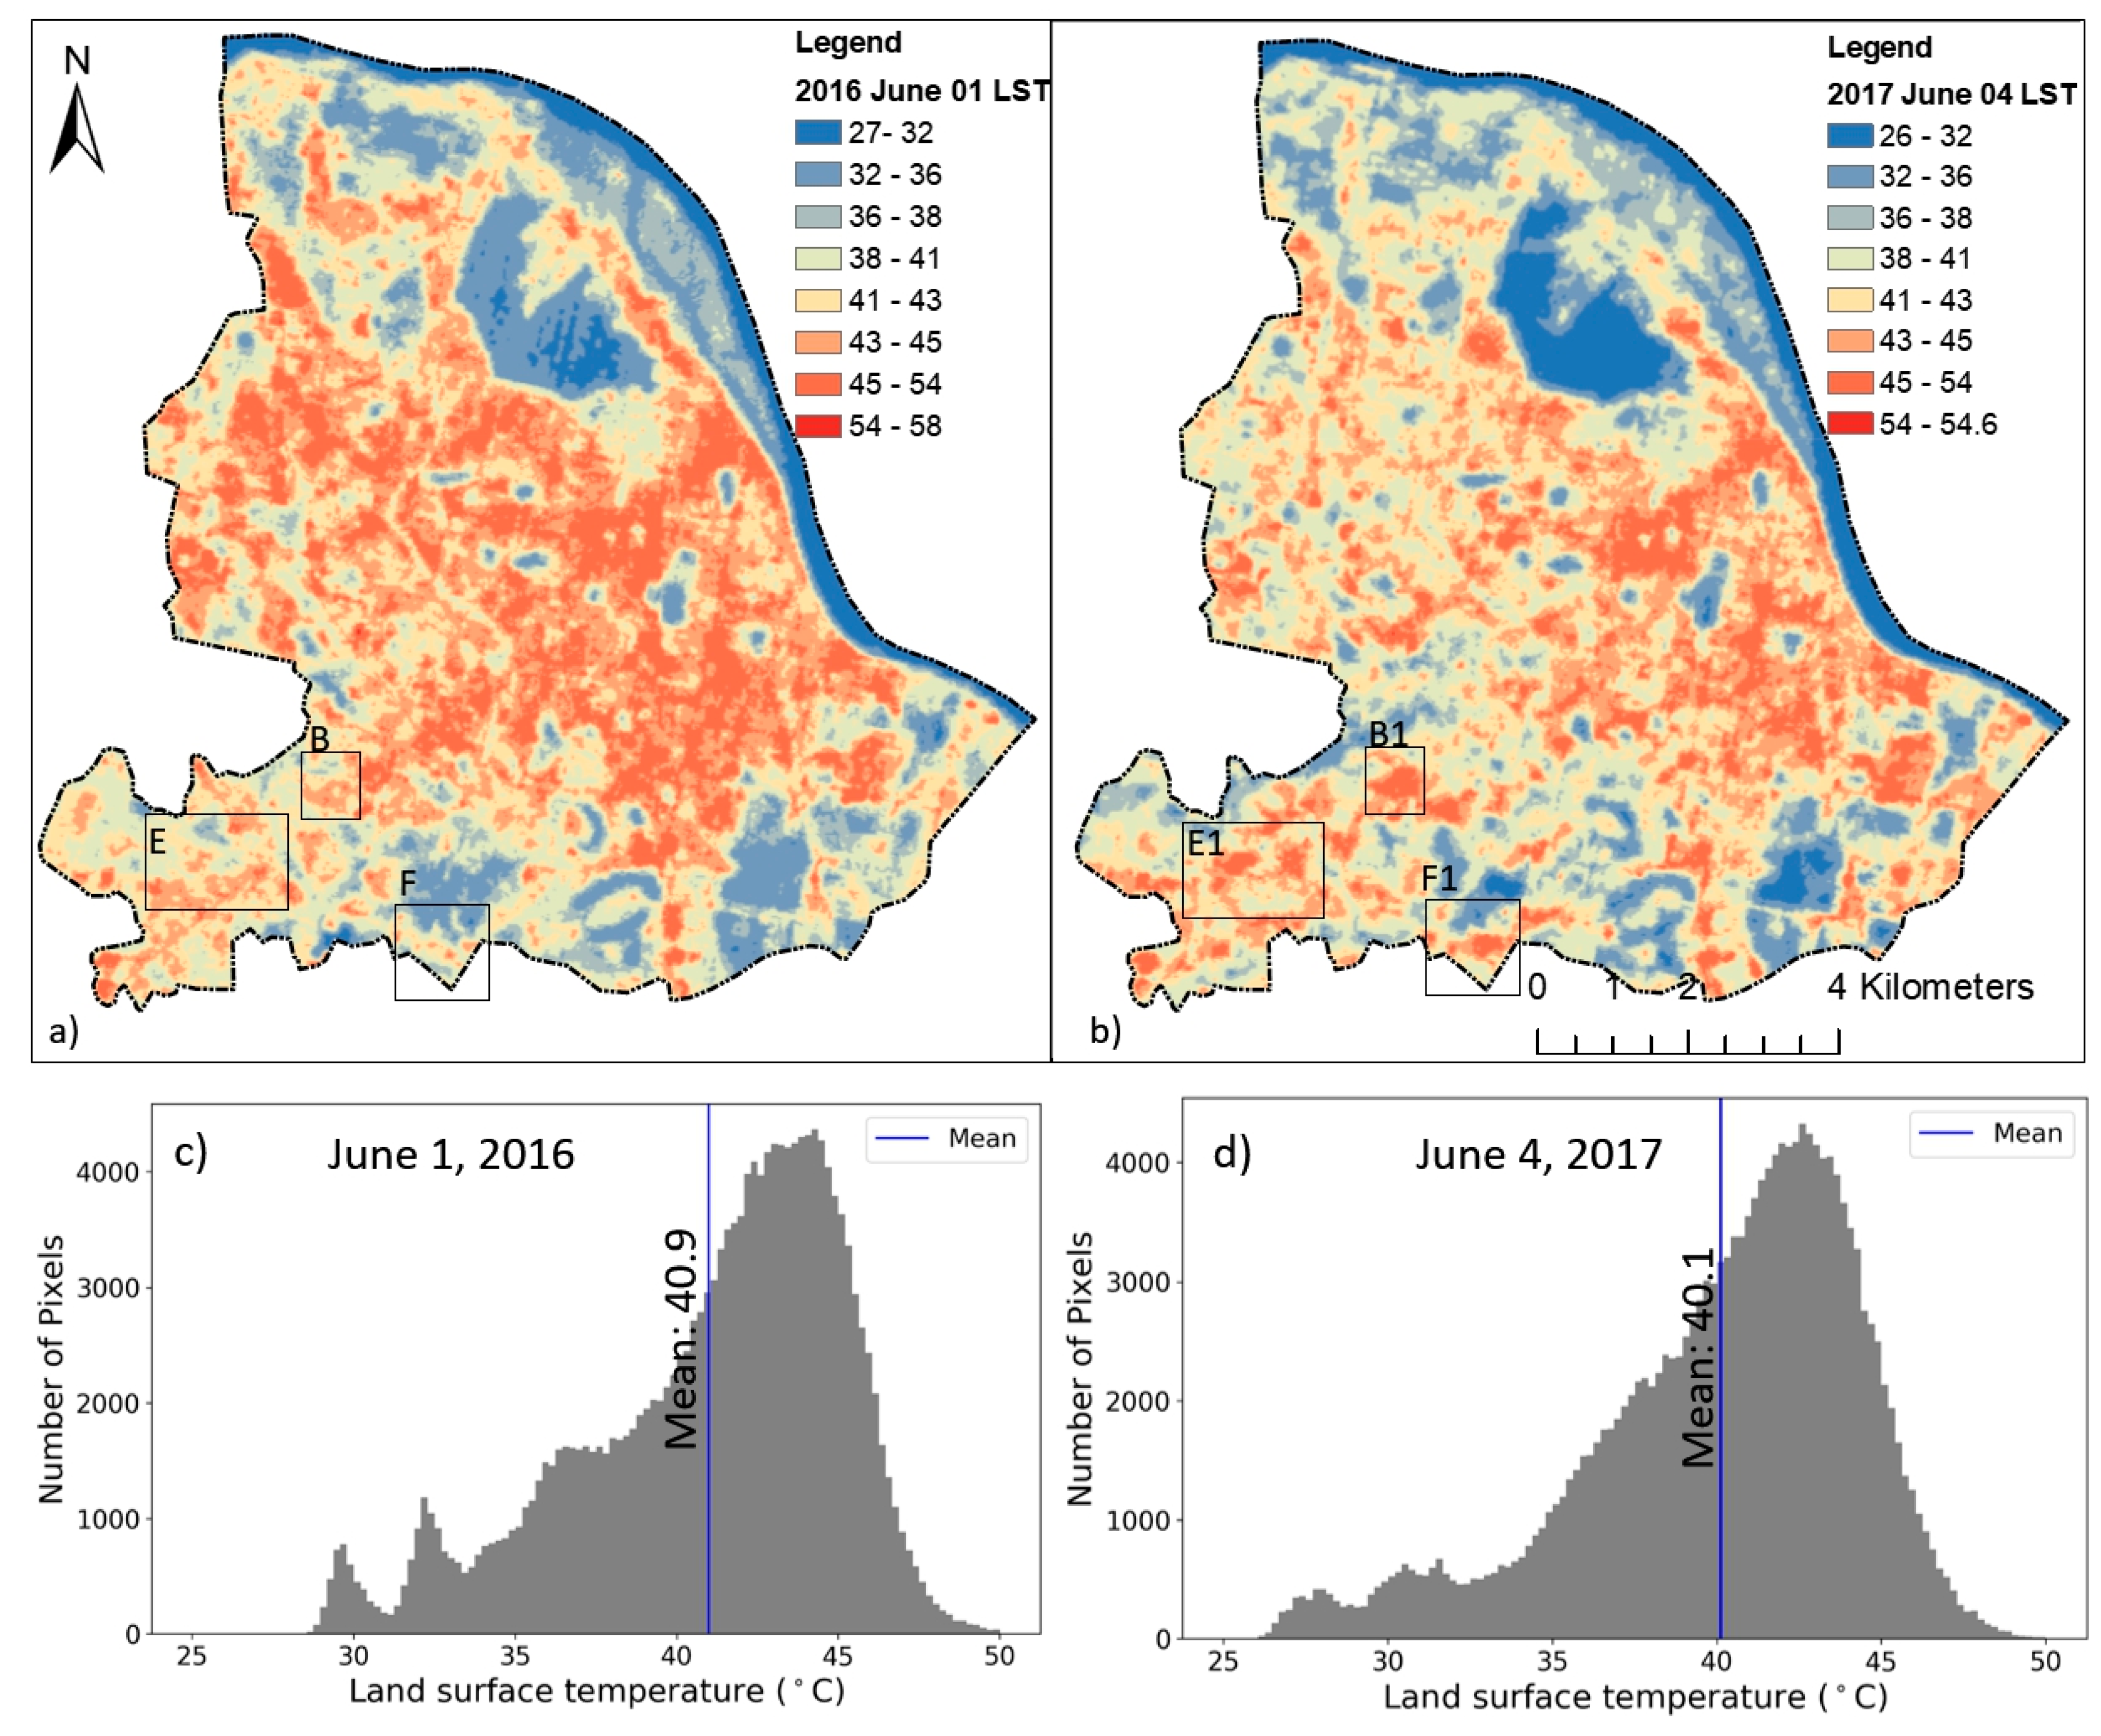
3.2. Land Surface Temperature Maps
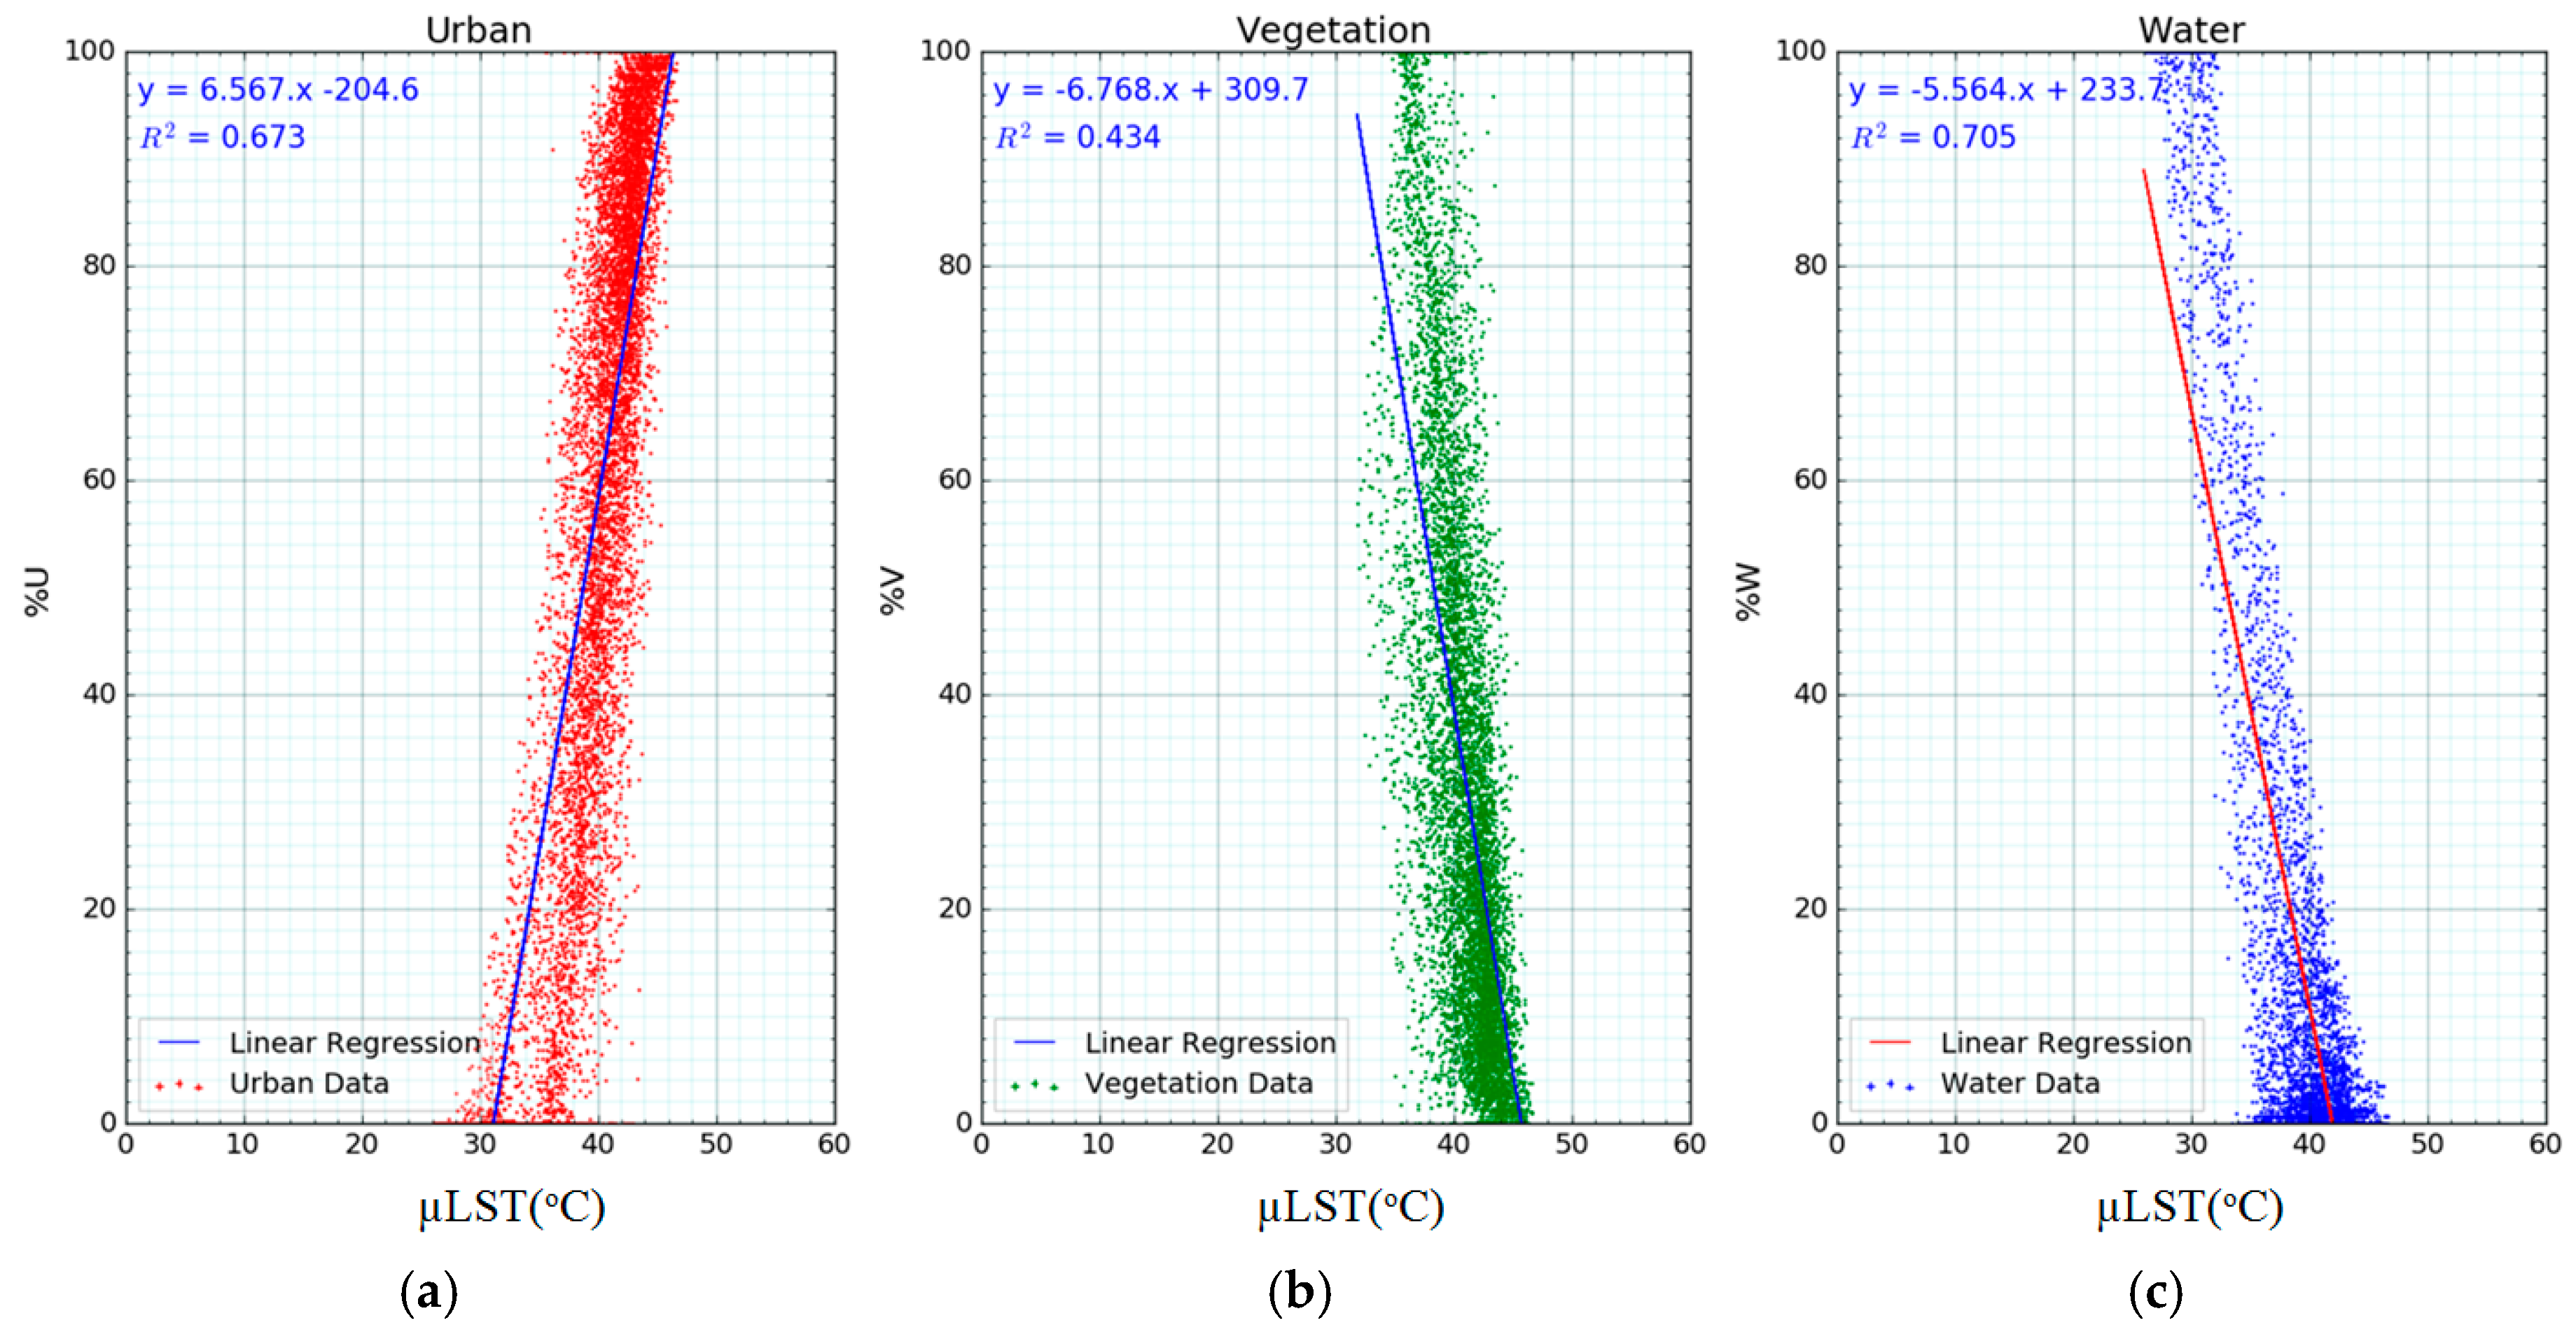
3.3. Individual Land Use Coverage versus LST
3.4. Land-Use Composition–Driven Prediction of LST
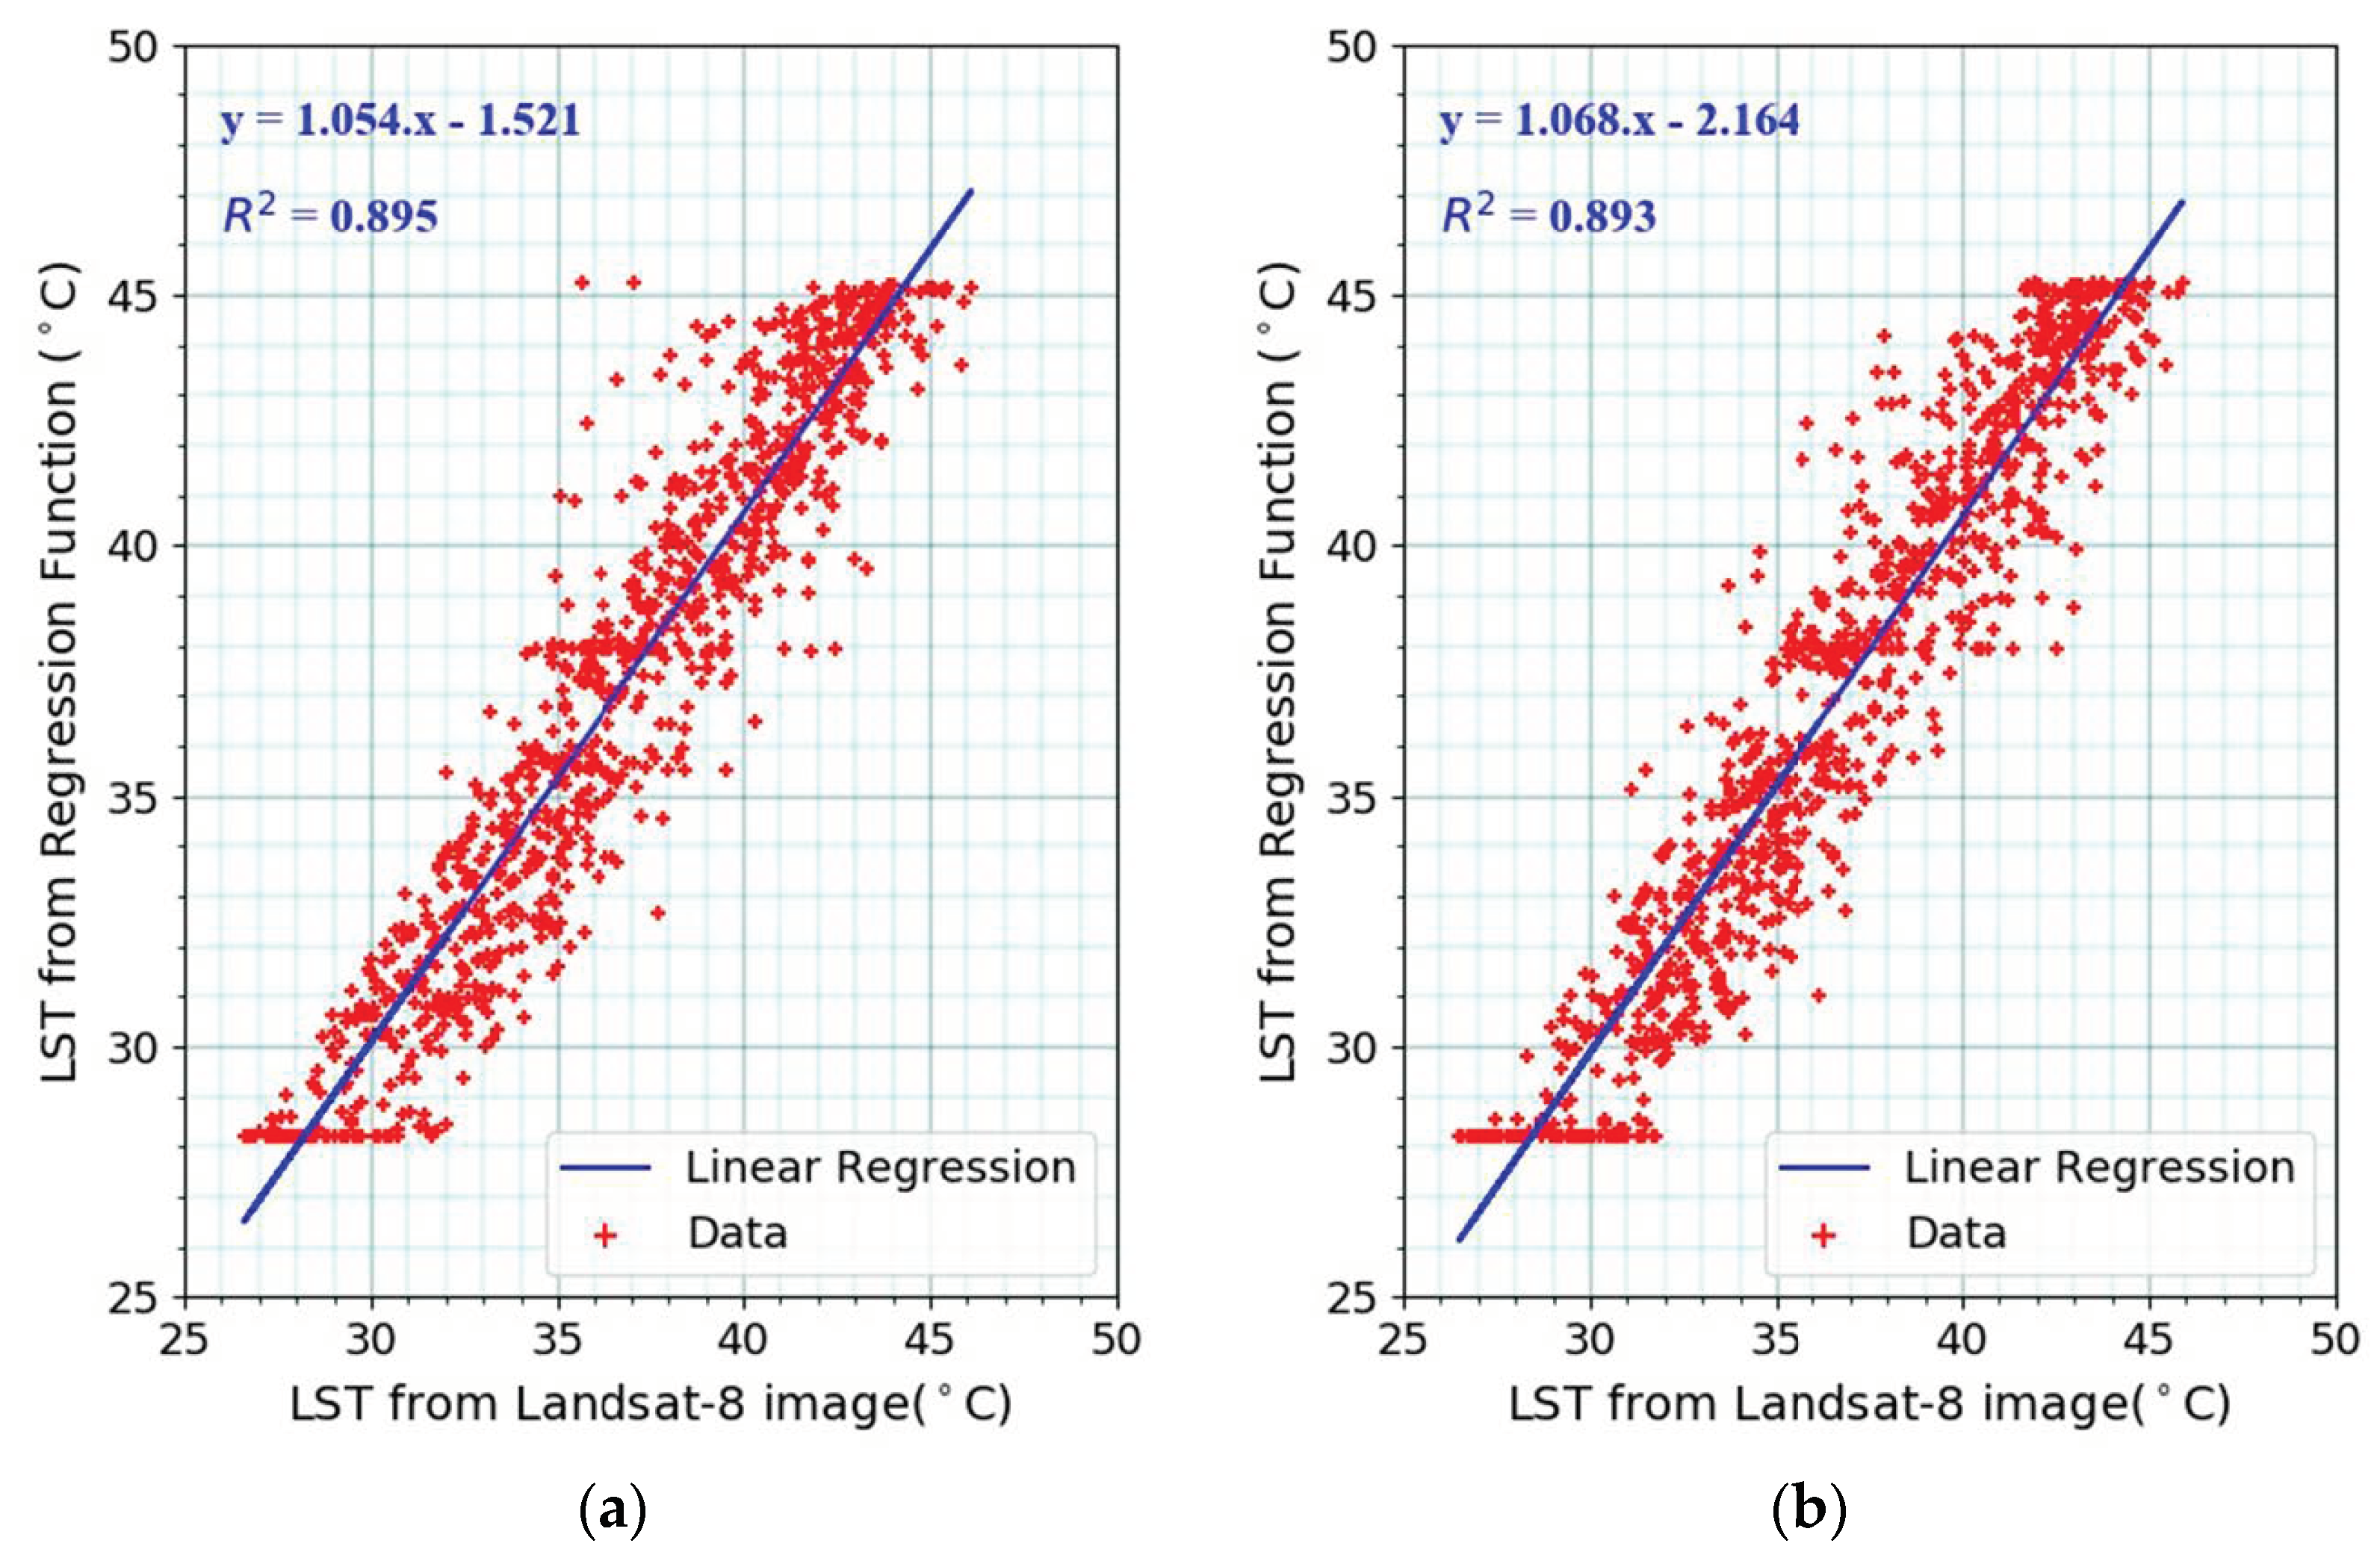
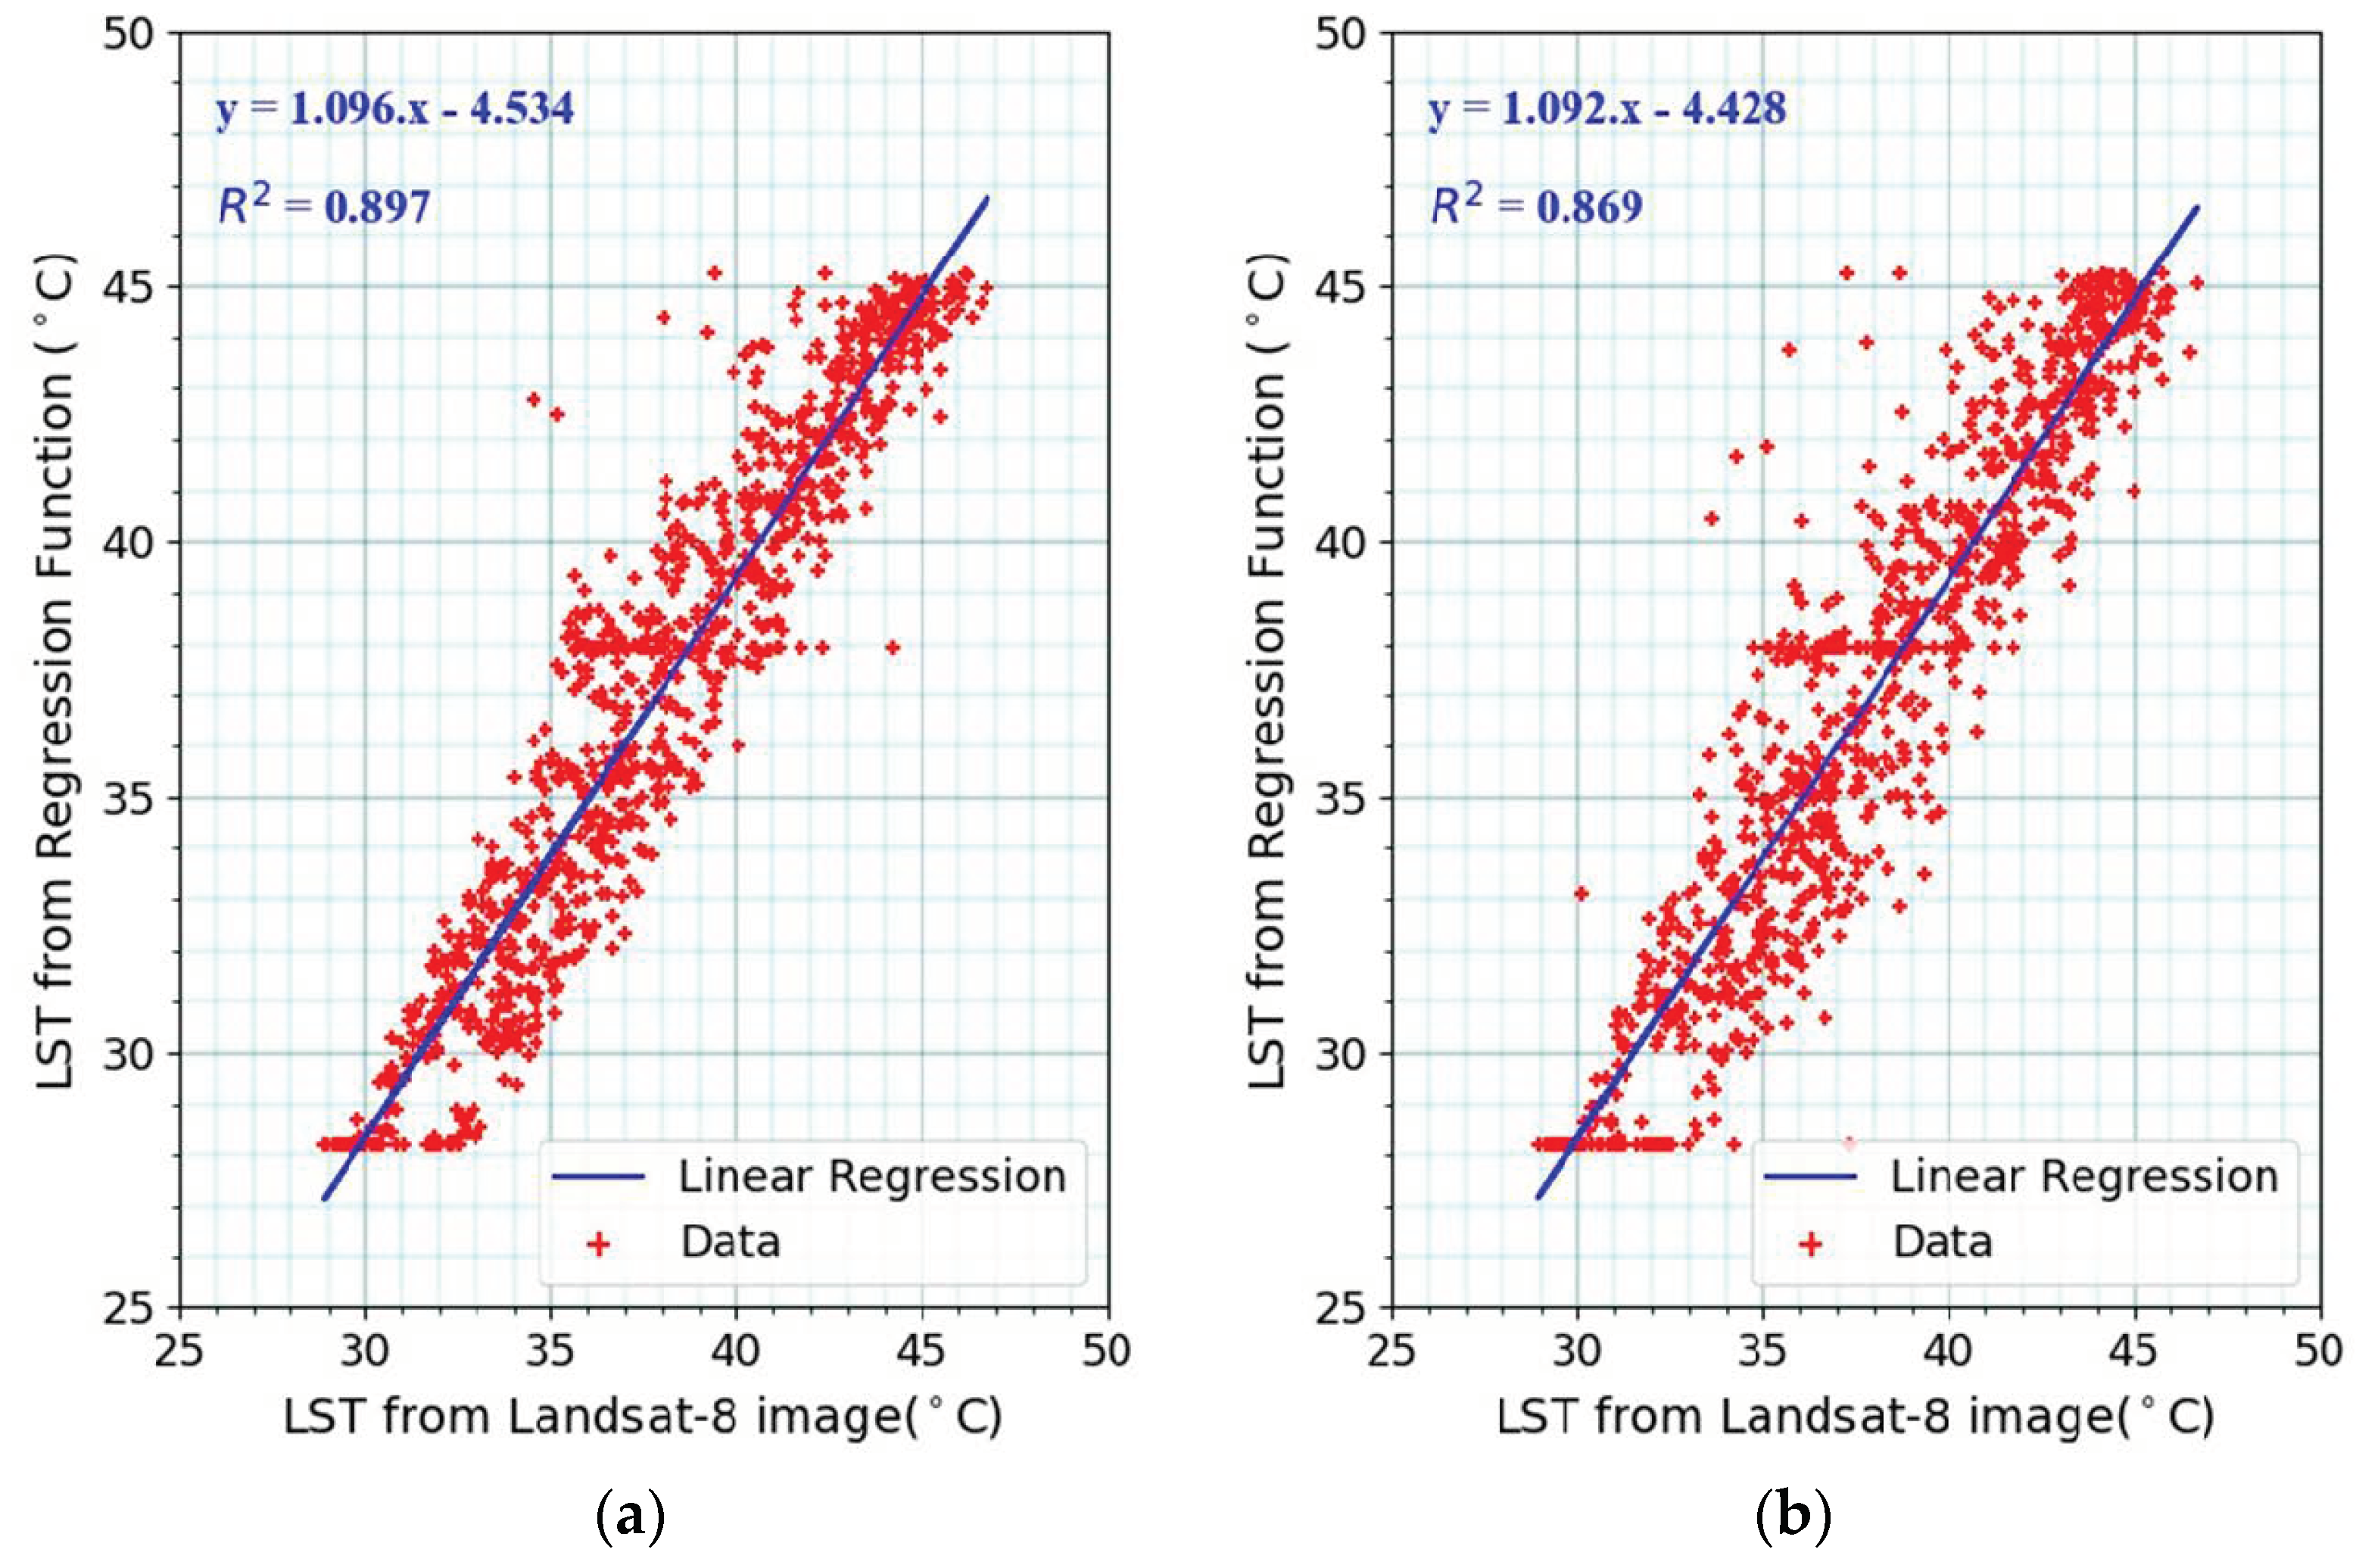
3.5. Validation of the Land-Use Driven Model
4. Discussion
5. Conclusion
Author Contributions
Funding
Acknowledgments
Conflicts of Interest
References
- Howard, L. The Climate of London Deduced from Meteorological Observations Made in the Metropolis and at Various Places around It (Electronic Resource); Harvey and Darton: London, UK, 1833. [Google Scholar]
- Bornstein, R.D. Observations of the Urban Heat Island Effect in New York City. J. Appl. Meteorol. 1968, 7, 575–582. [Google Scholar] [CrossRef] [Green Version]
- Ackerman, B. Temporal March of the Chicago Heat Island. J. Clim. Appl. Meteorol. 1985, 24, 547–554. [Google Scholar] [CrossRef] [Green Version]
- Saitoh, T.S.; Shimada, T.; Hoshi, H. Modeling and simulation of the Tokyo urban heat island. Atmos. Environ. 1996, 30, 3431–3442. [Google Scholar] [CrossRef]
- Kato, S.; Yamaguchi, Y. Analysis of urban heat-island effect using ASTER and ETM+ Data: Separation of anthropogenic heat discharge and natural heat radiation from sensible heat flux. Remote Sens. Environ. 2005, 99, 44–54. [Google Scholar] [CrossRef]
- Kim, H.H. Urban heat island. Int. J. Remote Sens. 1992, 13, 2319–2336. [Google Scholar] [CrossRef]
- Lin, C.Y.; Chen, W.-C.; Liu, S.C.; Liou, Y.A.; Liu, G.R.; Lin, T.H. Numerical study of the impact of urbanization on the precipitation over Taiwan. Atmos. Environ. 2008, 42, 2934–2947. [Google Scholar] [CrossRef]
- Kar, S.K.; Liou, Y.A.; Ha, K.J. Characteristics of cloud-to-ground lightning activity over Seoul, South Korea in relation to urban effect. Ann. Geophys. 2007, 25, 2113–2118. [Google Scholar] [CrossRef]
- Kar, S.K.; Liou, Y.A. Analysis of cloud-to-ground lightning and its relation with surface pollutants over Taipei, Taiwan. Ann. Geophys. 2014, 32, 1085–1092. [Google Scholar] [CrossRef] [Green Version]
- Kar, S.K.; Liou, Y.A.; Ha, K.J. Aerosol effects on the enhancement of cloud-to-ground lightning over major urban areas of South Korea cloud-to-ground lightning over major urban areas of South Korea. Atmos. Res. 2009, 92, 80–87. [Google Scholar] [CrossRef]
- Kar, S.K.; Liou, Y.A. Enhancement of cloud-to-ground Lightning activity over Taipei, Taiwan in relation to urbanization. Atmos. Res. 2014, 147–148, 111–120. [Google Scholar] [CrossRef]
- Lin, C.Y.; Chen, F.; Huang, J.C.; Chen, W.C.; Liou, Y.A.; Chen, W.N. Urban heat island effect and its impact on boundary layer development and land-sea circulation over Northern Taiwan. Atmos. Environ. 2008, 42, 5639–5649. [Google Scholar] [CrossRef]
- Weng, Q.; Lu, D.; Schubring, J. Estimation of land surface temperature-vegetation abundance relationship for urban heat island studies. Remote Sens. Environ. 2004, 89, 467–483. [Google Scholar] [CrossRef]
- Chen, X.-L.; Zhao, H.-M.; Li, P.-X.; Yin, Z.-Y. Remote sensing image-based analysis of the relationship between urban heat island and land use/cover changes. Remote Sens. Environ. 2006, 104, 133–146. [Google Scholar] [CrossRef]
- Kotharkar, R.; Surawar, M. Land Use, Land Cover, and Population Density Impact on the Formation of Canopy Urban Heat Islands through Traverse Survey in the Nagpur Urban Area, India. J. Urban Plan. Dev. 2016, 142, 04015003. [Google Scholar] [CrossRef]
- Yuan, F.; Bauer, M.E. Comparison of impervious surface area and normalized difference vegetation index as indicators of surface urban heat island effects in Landsat imagery. Remote Sens. Environ. 2007, 106, 375–386. [Google Scholar] [CrossRef]
- Oke, T.R.; Maxwell, G.B. Urban heat island dynamics in Montreal and Vancouver. Atmos. Environ. 1975, 9, 191–200. [Google Scholar] [CrossRef]
- Miao, S.; Chen, F.; LeMone, M.A.; Tewari, M.; Li, Q.; Wang, Y. An Observational and Modeling Study of Characteristics of Urban Heat Island and Boundary Layer Structures in Beijing. J. Appl. Meteorol. Clim. 2009, 48, 484–501. [Google Scholar] [CrossRef]
- Estoque, R.C.; Murayama, Y.; Myint, S.W. Effects of landscape composition and pattern on land surface temperature: An urban heat island study in the megacities of Southeast Asia. Sci. Total Environ. 2017, 577, 349–359. [Google Scholar] [CrossRef]
- Singh, P.; Kikon, N.; Verma, P. Impact of land use change and urbanization on urban heat island in Lucknow city, Central India. A remote sensing based estimate. Sustain. Cities Soc. 2017, 32, 100–114. [Google Scholar] [CrossRef]
- Schwarz, N.; Schlink, U.; Franck, U.; Großmann, K. Relationship of land surface and air temperatures and its implications for quantifying urban heat island indicators—An application for the city of Leipzig (Germany). Ecol. Indic. 2012, 18, 693–704. [Google Scholar] [CrossRef]
- Dihkan, M.; Karsli, F.; Guneroglu, A.; Guneroglu, N. Evaluation of surface urban heat island (SUHI) effect on coastal zone: The case of Istanbul Megacity. Ocean Coast. Manag. 2015, 118, 309–316. [Google Scholar] [CrossRef]
- Haashemi, S.; Weng, Q.; Darvishi, A.; Alavipanah, S. Seasonal Variations of the Surface Urban Heat Island in a Semi-Arid City. Remote Sens. 2016, 8, 352. [Google Scholar] [CrossRef]
- Meng, Q.; Zhang, L.; Sun, Z.; Meng, F.; Wang, L.; Sun, Y. Characterizing spatial and temporal trends of surface urban heat island effect in an urban main built-up area: A 12-year case study in Beijing, China. Remote Sens. Environ. 2018, 204, 826–837. [Google Scholar] [CrossRef]
- Gallo, K.; Hale, R.; Tarpley, D.; Yu, Y. Evaluation of the Relationship between Air and Land Surface Temperature under Clear- and Cloudy-Sky Conditions. J. Appl. Meteorol. Clim. 2011, 50, 767–775. [Google Scholar] [CrossRef]
- Mutiibwa, D.; Strachan, S.; Albright, T. Land Surface Temperature and Surface Air Temperature in Complex Terrain. IEEE J. Sel. Top. Appl. Earth Obs. Remote Sens. 2015, 8, 4762–4774. [Google Scholar] [CrossRef]
- Deilami, K.; Kamruzzaman, Md.; Liu, Y. Urban heat island effect: A systematic review of spatio-tempoal factors, data, methods, and mitigation measures. Int. J. Appl. Earth Obs. Geoinf. 2018, 67, 30–42. [Google Scholar] [CrossRef]
- Lai, J.; Zhan, W.; Huang, F.; Quan, J.; Hu, L.; Gao, L.; Ju, W. Does quality control matter? Surface urban heat island intensity variations estimated by satellite-derived land surface temperature products. ISPRS J. Photogramm. Remote Sens. 2018, 139, 212–227. [Google Scholar] [CrossRef]
- Li, H.; Zhou, Y.; Li, X.; Meng, L.; Wang, X.; Wu, S.; Sodoudi, S. A new method to quantify surface urban heat island intensity. Sci. Total Environ. 2018, 624, 262–272. [Google Scholar] [CrossRef]
- Nam, T.H.H.; Kubota, T.; Trihamdani, A.R. Impact of Urban Heat Island under the Hanoi Master Plan 2030 on Cooling Loads in Residential Buildings. Int. J. Built Environ. Sustain. 2015, 2, 48–61. [Google Scholar] [CrossRef]
- Trihamdani, A.R.; Lee, H.S.; Kubota, T.; Phuong, T.T.T. Configuration of Green Spaces for Urban Heat Island Mitigation and Future Building Energy Conservation in Hanoi Master Plan 2030. Buildings 2015, 5, 933–947. [Google Scholar] [CrossRef] [Green Version]
- Baig, M.H.A.; Zhang, L.; Shuai, T.; Tong, Q. Derivation of a tasselled cap transformation based on Landsat 8 at-satellite reflectance. Remote Sens. Lett. 2014, 5, 423–431. [Google Scholar] [CrossRef]
- Wang, Y. and E. Lentilucci. A Practical Approach to Landsat 8 TIRS Stray Light Correction Using Multi-Sensor Measurements. Remote Sens. 2018, 10, 589. [Google Scholar] [CrossRef]
- García-Santos, V.; Cuxart, J.; Martínez-Villagrasa, D.; Jiménez, M.A.; Simó, G. Comparison of Three Methods for Estimating Land Surface Temperature from Landsat 8-TIRS Sensor Data. Remote Sens. 2018, 10, 1450. [Google Scholar] [CrossRef]
- Sobrino, J.A.; Raissouni, N. Toward remote sensing methods for land cover dynamic monitoring: Application to Morocco. Int. J. Remote Sens. 2000, 21, 353–366. [Google Scholar] [CrossRef]
- Jimenez-Munoz, J.C.; Sobrino, J.A.; Skokovic, D.; Mattar, C.; Cristobal, J. Land Surface Temperature Retrieval Methods from Landsat-8 Thermal Infrared Sensor Data. IEEE Geosci. Remote Sens. Lett. 2014, 11, 1840–1843. [Google Scholar] [CrossRef]
- Yu, X.; Guo, X.; Wu, Z. Land Surface Temperature Retrieval from Landsat 8 TIRS—Comparison between Radiative Transfer Equation-Based Method, Split Window Algorithm and Single Channel Method. Remote Sens. 2014, 6, 9829–9852. [Google Scholar] [CrossRef] [Green Version]
- NASA’s Atmospheric Correction Parameter Calculator. Available online: http://atmcorr.gsfc.nasa.gov/ (accessed on 5 December 2018).
- European Green Capital Report: Green Urban Spaces with Integration of Sustainable Land Use. Available online: http://ec.europa.eu/environment/europeangreencapital/wp-content/uploads/2016/12/Indicator-3-Green-urban-areas_Nijmegen-2018-revised.pdf (accessed on 11 November 2018).
- VOV News: Vietnam Records Hottest Day So Far This Year in Capital of Hanoi. Available online: http://english.vov.vn/society/vietnam-records-hottest-day-so-far-this-year-in-capital-of-hanoi-350997.vov (accessed on 21 April 2018).
- Nguyen, D.-Q.; Renwick, J.; McGregor, J. Variations of surface temperature and rainfall in Vietnam from 1971 to 2010: Variations of surface temperature and rainfall in Vietnam. Int. J. Clim. 2014, 34, 249–264. [Google Scholar] [CrossRef]
- Zhou, D.; Bonafoni, S.; Zhang, L.; Wang, R. Remote sensing of the urban heat island effect in a highly populated urban agglomeration area in East China. Sci. Total Environ. 2018, 628–629, 415–429. [Google Scholar] [CrossRef] [PubMed]
- Solecki, W.D.; Rosenzweig, C.; Parshall, L.; Pope, G.; Clark, M.; Cox, J.; Wiencke, M. Mitigation of the heat island effect in urban New Jersey. Environ. Hazards 2005, 6, 39–49. [Google Scholar] [CrossRef]
- Rotem-Mindali, O.; Michael, Y.; Helman, D.; Lensky, I.M. The role of local land-use on the urban heat island effect of Tel Aviv as assessed from satellite remote sensing. Appl. Geogr. 2015, 56, 145–153. [Google Scholar] [CrossRef]
- Kardinal Jusuf, S.; Wong, N.H.; Hagen, E.; Anggoro, R.; Hong, Y. The influence of land use on the urban heat island in Singapore. Habitat Int. 2007, 31, 232–242. [Google Scholar] [CrossRef]
- Tang, J.; Di, L.; Xiao, J.; Lu, D.; Zhou, Y. Impacts of land use and socioeconomic patterns on urban heat Island. Int. J. Remote Sens. 2017, 38, 3445–3465. [Google Scholar] [CrossRef]
- Lin, P.; Lau, S.S.Y.; Qin, H.; Gou, Z. Effects of urban planning indicators on urban heat island: A case study of pocket parks in high-rise high-density environment. Landsc. Urban Plan. 2017, 168, 48–60. [Google Scholar] [CrossRef]
- Keeratikasikorn, C.; Bonafoni, S. Urban Heat Island Analysis over the Land Use Zoning Plan of Bangkok by Means of Landsat 8 Imagery. Remote Sens. 2018, 10, 440. [Google Scholar] [CrossRef]
- Nastran, M.; Kobal, M.; Eler, K. Urban heat islands in relation to green land use in European cities. Urban For. Urban Green. 2018. [Google Scholar] [CrossRef]
- Nguyen, A.K.; Liou, Y.-A.; Li, M.H.; Tran, T.A. Zoning eco-environmental vulnerability for environmental management and protection. Ecol. Indic. 2016, 69, 100–117. [Google Scholar] [CrossRef]
- Liou, Y.-A.; Nguyen, A.K.; Li, M.H. Assessing spatiotemporal eco-environmental vulnerability by Landsat data. Ecol. Indic. 2017, 80, 52–65. [Google Scholar] [CrossRef]


| Year Station | Month | Max | In Day | |||||||||||
|---|---|---|---|---|---|---|---|---|---|---|---|---|---|---|
| 1 | 2 | 3 | 4 | 5 | 6 | 7 | 8 | 9 | 10 | 11 | 12 | |||
| 2016_Lang | 29.7 | 33.3 | 26.9 | 34.1 | 36.9 | 40.4 | 39.2 | 37.5 | 36.3 | 34.3 | 32.2 | 29.5 | 40.4 | 2nd |
| 2017_Lang | 27.9 | 28.8 | 30.5 | 35.3 | 35.0 | 41.8 | 38.9 | 37.6 | 36.7 | 33.6 | 33.6 | 25.9 | 41.8 | 4th |
| 2016_Ha Dong | 30.5 | 33.0 | 26.8 | 32.7 | 36.7 | 39.3 | 38.5 | 37.4 | 36.1 | 34.0 | 32.0 | 29.5 | 39.3 | 2nd |
| 2017_Ha Dong | 27.5 | 29.2 | 29.8 | 35.7 | 35.5 | 42.5 | 38.2 | 37.0 | 36.0 | 33.3 | 33.0 | 25.8 | 42.5 | 4th |
| Tasseled Cap Indexes | Landsat 8 Bands | |||||
|---|---|---|---|---|---|---|
| Blue (Band 2) | Green (Band 3) | Red (Band 4) | NIR (Band 5) | SWIR 1 (Band 6) | SWIR 2 (Band 7) | |
| Brightness | 0.3029 | 0.2786 | 0.4733 | 0.5599 | 0.508 | 0.1872 |
| Greenness | −0.2941 | −0.243 | −0.5424 | 0.7276 | 0.0713 | −0.1608 |
| Wetness | 0.1511 | 0.1973 | 0.3283 | 0.3407 | −0.7117 | −0.4559 |
| Classified | Reference Data | Total (Pixels) | User’s Accuracy | |||
|---|---|---|---|---|---|---|
| Built-up | Vegetation | Water | Others | |||
| 1. Built-up | 108 | 3 | 2 | 1 | 114 | 95% |
| 2. Vegetation | 5 | 95 | 2 | 0 | 102 | 93% |
| 3. Water | 4 | 1 | 62 | 0 | 67 | 93% |
| 4. Others | 2 | 3 | 1 | 11 | 17 | 65% |
| Total (pixels) | 119 | 102 | 67 | 12 | 300 | |
| Producer’s accuracy | 91% | 93% | 93% | 92% | ||
| Overall accuracy: 92% | Kappa coefficient: 0.88 | |||||
| Classified | Reference Data | Total (Pixels) | User’s Accuracy | |||
|---|---|---|---|---|---|---|
| Built-up | Vegetation | Water | Others | |||
| 1. Built-up | 112 | 3 | 2 | 1 | 118 | 95% |
| 2. Vegetation | 5 | 94 | 1 | 0 | 100 | 94% |
| 3. Water | 4 | 1 | 62 | 0 | 67 | 93% |
| 4. Others | 2 | 2 | 0 | 11 | 15 | 73% |
| Total (pixels) | 123 | 100 | 65 | 12 | 300 | |
| Producer’s accuracy | 91% | 94% | 95% | 92% | ||
| Overall accuracy: 93% | Kappa coefficient: 0.90 | |||||
| Land-Use Types | Area in 2016 (ha) | Area in 2017 (ha) | Changed Area (ha) (%) |
|---|---|---|---|
| Built-up | 8060 | 8778 | 718 (8.9%) |
| Vegetation | 5067 | 4516 | −551 (−10.9%) |
| Water | 1726 | 1605 | −121 (−7.0%) |
| Others | 1149 | 1103 | −46 (−4.0%) |
| Total | 16,002 | 16,002 | 0 |
| Land-Use Types in 2016 (ha) | Land-Use Types in 2017 (ha) | ||||
|---|---|---|---|---|---|
| Built-up | Vegetation | Water | Others | Total | |
| Built-up | 7937 | 27 | 22 | 74 | 8060 |
| Vegetation | 618 | 4051 | 41 | 357 | 5067 |
| Water | 86 | 87 | 1535 | 18 | 1726 |
| Others | 137 | 351 | 7 | 654 | 1149 |
| Total | 8778 | 4516 | 1605 | 1103 | 16,002 |
| Zones | Number of Pixels | MEAN LST (°C) | Difference of LST (°C) | |
|---|---|---|---|---|
| June 2016 | June 2017 | |||
| B-B1 | 800 | 43.4 | 44.3 | 0.9 |
| E-E1 | 2386 | 40.9 | 41.7 | 0.8 |
| F-F1 | 1791 | 38.3 | 40.8 | 2.5 |
| Areas | Mean LST (°C)/STD 2016 | Mean LST (°C)/STD 2017 | Number of Pixels |
|---|---|---|---|
| Urban | 41.20/4.7 | 40.03/4.8 | 95463 |
| Suburban | 40.67/3.5 | 40.24/3.6 | 81792 |
| LST anomaly (urban-suburban) | 0.53 | −0.21 |
| Built-up | Vegetation | Water | Others | |
|---|---|---|---|---|
| LULC in suburban area 2016 (km2) | 33.22 | 28.95 | 5.59 | 6.01 |
| LULC in suburban area 2017 | 37.50 | 24.93 | 4.73 | 6.61 |
| Change LULC in suburban (2017–2016) | 4.28 | −4.01 | −0.86 | 0.59 |
| LULC in urban area 2016 (km2) | 47.29 | 22.90 | 11.65 | 4.07 |
| LULC in urban area 2017 | 50.18 | 19.77 | 11.30 | 4.66 |
| Change LULC in urban area (2017–2016) | 2.89 | −3.13 | −0.35 | 0.59 |
| Land-Use Composition | LST (°C) | ||
|---|---|---|---|
| %U | %W | %V | |
| 100 | 0 | 0 | 45.23 |
| 0 | 0 | 100 | 37.91 |
| 0 | 100 | 0 | 28.24 |
| 80 | 10 | 10 | 42.80 |
| 60 | 20 | 20 | 40.37 |
© 2018 by the authors. Licensee MDPI, Basel, Switzerland. This article is an open access article distributed under the terms and conditions of the Creative Commons Attribution (CC BY) license (http://creativecommons.org/licenses/by/4.0/).
Share and Cite
Thanh Hoan, N.; Liou, Y.-A.; Nguyen, K.-A.; Sharma, R.C.; Tran, D.-P.; Liou, C.-L.; Cham, D.D. Assessing the Effects of Land-Use Types in Surface Urban Heat Islands for Developing Comfortable Living in Hanoi City. Remote Sens. 2018, 10, 1965. https://0-doi-org.brum.beds.ac.uk/10.3390/rs10121965
Thanh Hoan N, Liou Y-A, Nguyen K-A, Sharma RC, Tran D-P, Liou C-L, Cham DD. Assessing the Effects of Land-Use Types in Surface Urban Heat Islands for Developing Comfortable Living in Hanoi City. Remote Sensing. 2018; 10(12):1965. https://0-doi-org.brum.beds.ac.uk/10.3390/rs10121965
Chicago/Turabian StyleThanh Hoan, Nguyen, Yuei-An Liou, Kim-Anh Nguyen, Ram C. Sharma, Duy-Phien Tran, Chia-Ling Liou, and Dao Dinh Cham. 2018. "Assessing the Effects of Land-Use Types in Surface Urban Heat Islands for Developing Comfortable Living in Hanoi City" Remote Sensing 10, no. 12: 1965. https://0-doi-org.brum.beds.ac.uk/10.3390/rs10121965