A Region Merging Segmentation with Local Scale Parameters: Applications to Spectral and Elevation Data


Remote Sensing Laboratory, National Technical University of Athens, Iroon Polytechneiou 9, 15780 Zografou, Greece
*
Author to whom correspondence should be addressed.
Remote Sens. 2018, 10(12), 2024; https://0-doi-org.brum.beds.ac.uk/10.3390/rs10122024
Submission received: 26 September 2018
/
Revised: 7 December 2018
/
Accepted: 11 December 2018
/
Published: 12 December 2018
(This article belongs to the Special Issue Pattern Analysis and Recognition in Remote Sensing)
Abstract
:Region merging is the most effective method for the segmentation of remote sensing data. The quality and the size of the resulted image objects is controlled by a global heterogeneity threshold, termed as the scale parameter. However, the multidimensional nature of the visible features in a scene defies the use of an even optimum single global scale parameter. In this study, a novel region merging segmentation method is proposed, where a local scale parameter is defined for each image object by its internal and external heterogeneity measures (i.e., local variance and Moran’s I). This method allows image objects with low internal and external heterogeneity to be further merged with higher scale parameter values, since they are more likely to be a part of an adjacent object, than objects with high internal and external heterogeneity. The proposed method was applied in spectral and elevation data and its results were evaluated visually and with supervised and unsupervised evaluation methods. The comparison with multi-resolution segmentation (MRS) showed that the proposed region merging method can produce improved segmentation results in terms of maximizing intra-object homogeneity and inter-object heterogeneity as well as in the delimitation of specific target objects, present in spectral and elevation data. The unsupervised evaluation results of the (1) Côte d’Azur, (2) Manchester, and (3) Szada images from the SZTAKI-INRIA building detection dataset showed that the proposed method (overall goodness, OGf (1): 0.7375, (2): 0.7923, (3): 0.7967) performs better than MRS (OGf (1): 0.7224, (2): 0.7648, (3): 0.7823). The higher values of OGf indicate their ability to produce segmentation results with reduced over-segmentation effects and without the need of presegmented input data, in contrast to the objective heterogeneity and relative homogeneity (OHRH) hybrid segmentation method (OGf (1): 0.5864, (2): 0.5151, (3): 0.6983).
1. Introduction
Object-based image analysis (OBIA) has been gaining prominence as an alternative solution to traditional pixel-based methods. Blaschke et al. [1] confirmed that OBIA is the new paradigm shift in the analysis of high spatial resolution remote sensing images. They discussed the limitations of pixel-based methods and defined the core concepts and advantages of OBIA. The basic processing units of OBIA are spatially continuous, disjoint, and homogeneous (in one or more dimensions of a feature space) regions, called segments or image objects. The use of image objects as the basic analysis unit can improve the classification of remote sensing data by incorporating semantics (i.e., integration of expert knowledge) and hierarchical networks. Furthermore, the ability of OBIA to reduce the spectral variance within image objects can moderate the ‘salt and pepper’ noise compared with pixel-based methods and produce more visually consistent results [1].
Image segmentation of remote sensing data is an important step in the OBIA workflow. Hay and Castilla [2] pointed out that its objective is not the extraction of semantic objects, but the extraction of primitive image objects, which are internally homogeneous and externally heterogeneous from their neighboring objects. Within OBIA, the transformation of image objects to representations of semantic objects is a complex procedure, which includes iterative loops of classification and processing using both their internal features and their mutual relationships [2]. Therefore, the quality of image objects is essential for their correct processing and classification.
A variety of image segmentation methods has been developed. According to Schiewe [3], these methods can be grouped into three categories: Edge-based, region-based, and hybrid segmentation methods. The edge-based segmentation methods are designed to detect discontinuities between the objects and thus determine the boundaries between adjacent objects. In contrast, region-based methods are designed to detect neighboring pixels that have similar digital values and thus belong to the same object. In hybrid methods, the basic idea is to merge pre-existing objects determined with the help of any segmentation technique. This study will focus on a specific type of region-based methods termed as region merging.
Meinel and Neubert [4] compared several segmentation methods and concluded that region merging is the most effective image segmentation method for the analysis of high-resolution remote sensing images. A characteristic region-merging method and probably the most widely used one within the OBIA domain is multi-resolution segmentation (MRS) [5], which is available in the eCognition® software package. The basic procedure in MRS and most region merging segmentation methods is the merging of smaller objects into larger ones during a local optimization procedure that minimizes the average heterogeneity of image objects. The average size and the number of objects are controlled by a global heterogeneity threshold, termed as the scale parameter (SP) [5]. Remote sensing data can be segmented at many different segmentation scales by changing the SP. Given the multidimensional nature of the visible features in a scene, region merging methods can produce multiscale segmentations by setting different SP values. Smaller values of SP will produce smaller homogeneous objects, while larger values will produce larger and more heterogeneous objects.
Kim et al. [6] investigated the effect of scale on segmentation and classification quality. They concluded that the average size of image objects critically impacts on image classification accuracy and the selection of an optimum SP value is a crucial decision in segmenting remote sensing data. Usually, a trial-and-error strategy is used to select the optimum SP value, which can create image objects with sizes similar to the average size of the target objects. In the last decade, several supervised and unsupervised methods for the automated identification of the optimum SP value have been developed. In supervised methods, the optimum SP value is the one that can create image objects similar to reference target objects. In unsupervised methods, internal and external heterogeneity measures are computed for multiple segmentation results. The best segmentation result created by the relevant optimum SP is composed of image objects that satisfy the condition of maximizing internal homogeneity and external heterogeneity. Espindola et al. [7] measured the intra-object homogeneity using the weight variance of the objects and the inter-object homogeneity using the global Moran’s I. The two values were normalized and combined to define the optimal SP for the segmentation. However, the scenes usually consist of different types of visible features that vary in size and the use of an even optimum single SP will possibly split some features into multiple objects (i.e., over-segmentation) and/or merge them together with other neighboring features in a single object (i.e., under-segmentation). In this context, Liu et al. [8] reviewed the state-of-the-art methods for the identification of SP and concluded that multiscale segmentation strategies are preferable than single scale segmentations. However, Liu et al. [8] pointed out that the objective and automated selection and combination of multiple optimum SPs for the segmentation of remote sensing data is a key and urgent scientific problem that needs to be resolved first. Aside from multiscale segmentation strategies, several local post-segmentation optimization methods [9,10] have been proposed, which try to further improve the quality of segmentation and reduce over- and under-segmentation problems. Johnson and Xie [9] identified with global statistical heterogeneity measures the optimal SP for MRS segmentation. Once the segmentation process was performed, the over- and under-segmented objects were identified with local intra-object and inter-object heterogeneity statistics and were further refined by appropriate splitting and merging. This post-segmentation refinement strategy was effective in terms of improving segmentation quality because it moderated under- and over-segmentation problems. However, the additional steps for the identification of inappropriate objects and the subsequent splitting and merging steps require tuning by the user and pose this method as less objective [11].
An alternative solution to cope with scene complexity could be a segmentation approach, which incorporates the local intra-object and inter-object heterogeneity measures within the merging process. Such solutions have been adopted to two hybrid segmentation methods [11,12]. Yang et al. [11] developed a hybrid segmentation method, where the initial objects derived by an edge-based segmentation method were merged with local spectral angle thresholds. These thresholds were adjusted according to the internal heterogeneity of each object. On the other hand, Wang et al. [12] proposed the consideration of both inter- and intra-object heterogeneity in the computation of the merging costs in the region merging step of a hybrid segmentation method. Even though these studies showed promising results, Wang et al. [12] noted that the quality of the final segmentation result depends on the quality of the initial objects obtained from the previous edge-based segmentation step. Thus, hybrid-based methods require the critical parameterization of two segmentation steps, in contrast to region merging methods, which require only one. Therefore, the main research question that this study tries to answer is how efficient is the incorporation of local heterogeneity measures within the merging process of a pure region merging segmentation method (i.e., without the requirement of presegmented input data).
This study describes a novel region merging method that employs local SP values defined by both the internal and external heterogeneity of each object. This method allows objects, which are homogeneous and similar to their neighbors, to have a higher SP value than heterogeneous and distinguishable from their neighbors’ objects, since they are more likely to be part of their adjacent objects. The purpose of this segmentation method is the creation of image objects, which are the basic units for further classification and refinement procedures in the OBIA workflow. Therefore, the proposed method must have some important properties in order to be efficient: (1) It can produce objects that satisfy the condition of maximizing internal homogeneity and external heterogeneity; (2) it can create various scale segmentations, in order to delimit multiscale objects in a flexible and adaptive way; and (3) it can handle various types of remote sensing data (e.g., spectral, elevation data). The quality assessment of the proposed method was performed through the comparison with other well-known and state-of-the-art image segmentation methods, like MRS [5] and the hybrid-based method of Wang et al. [12], which also incorporates the intra-object and inter-object heterogeneity statistical measures within the merging process. The segmentation methods were applied to two remote sensing applications with spectral and elevation datasets. Additionally, the SZTAKI-INRIA benchmark dataset [13] was employed for this assessment.
2. Materials and Methods
2.1. Overview
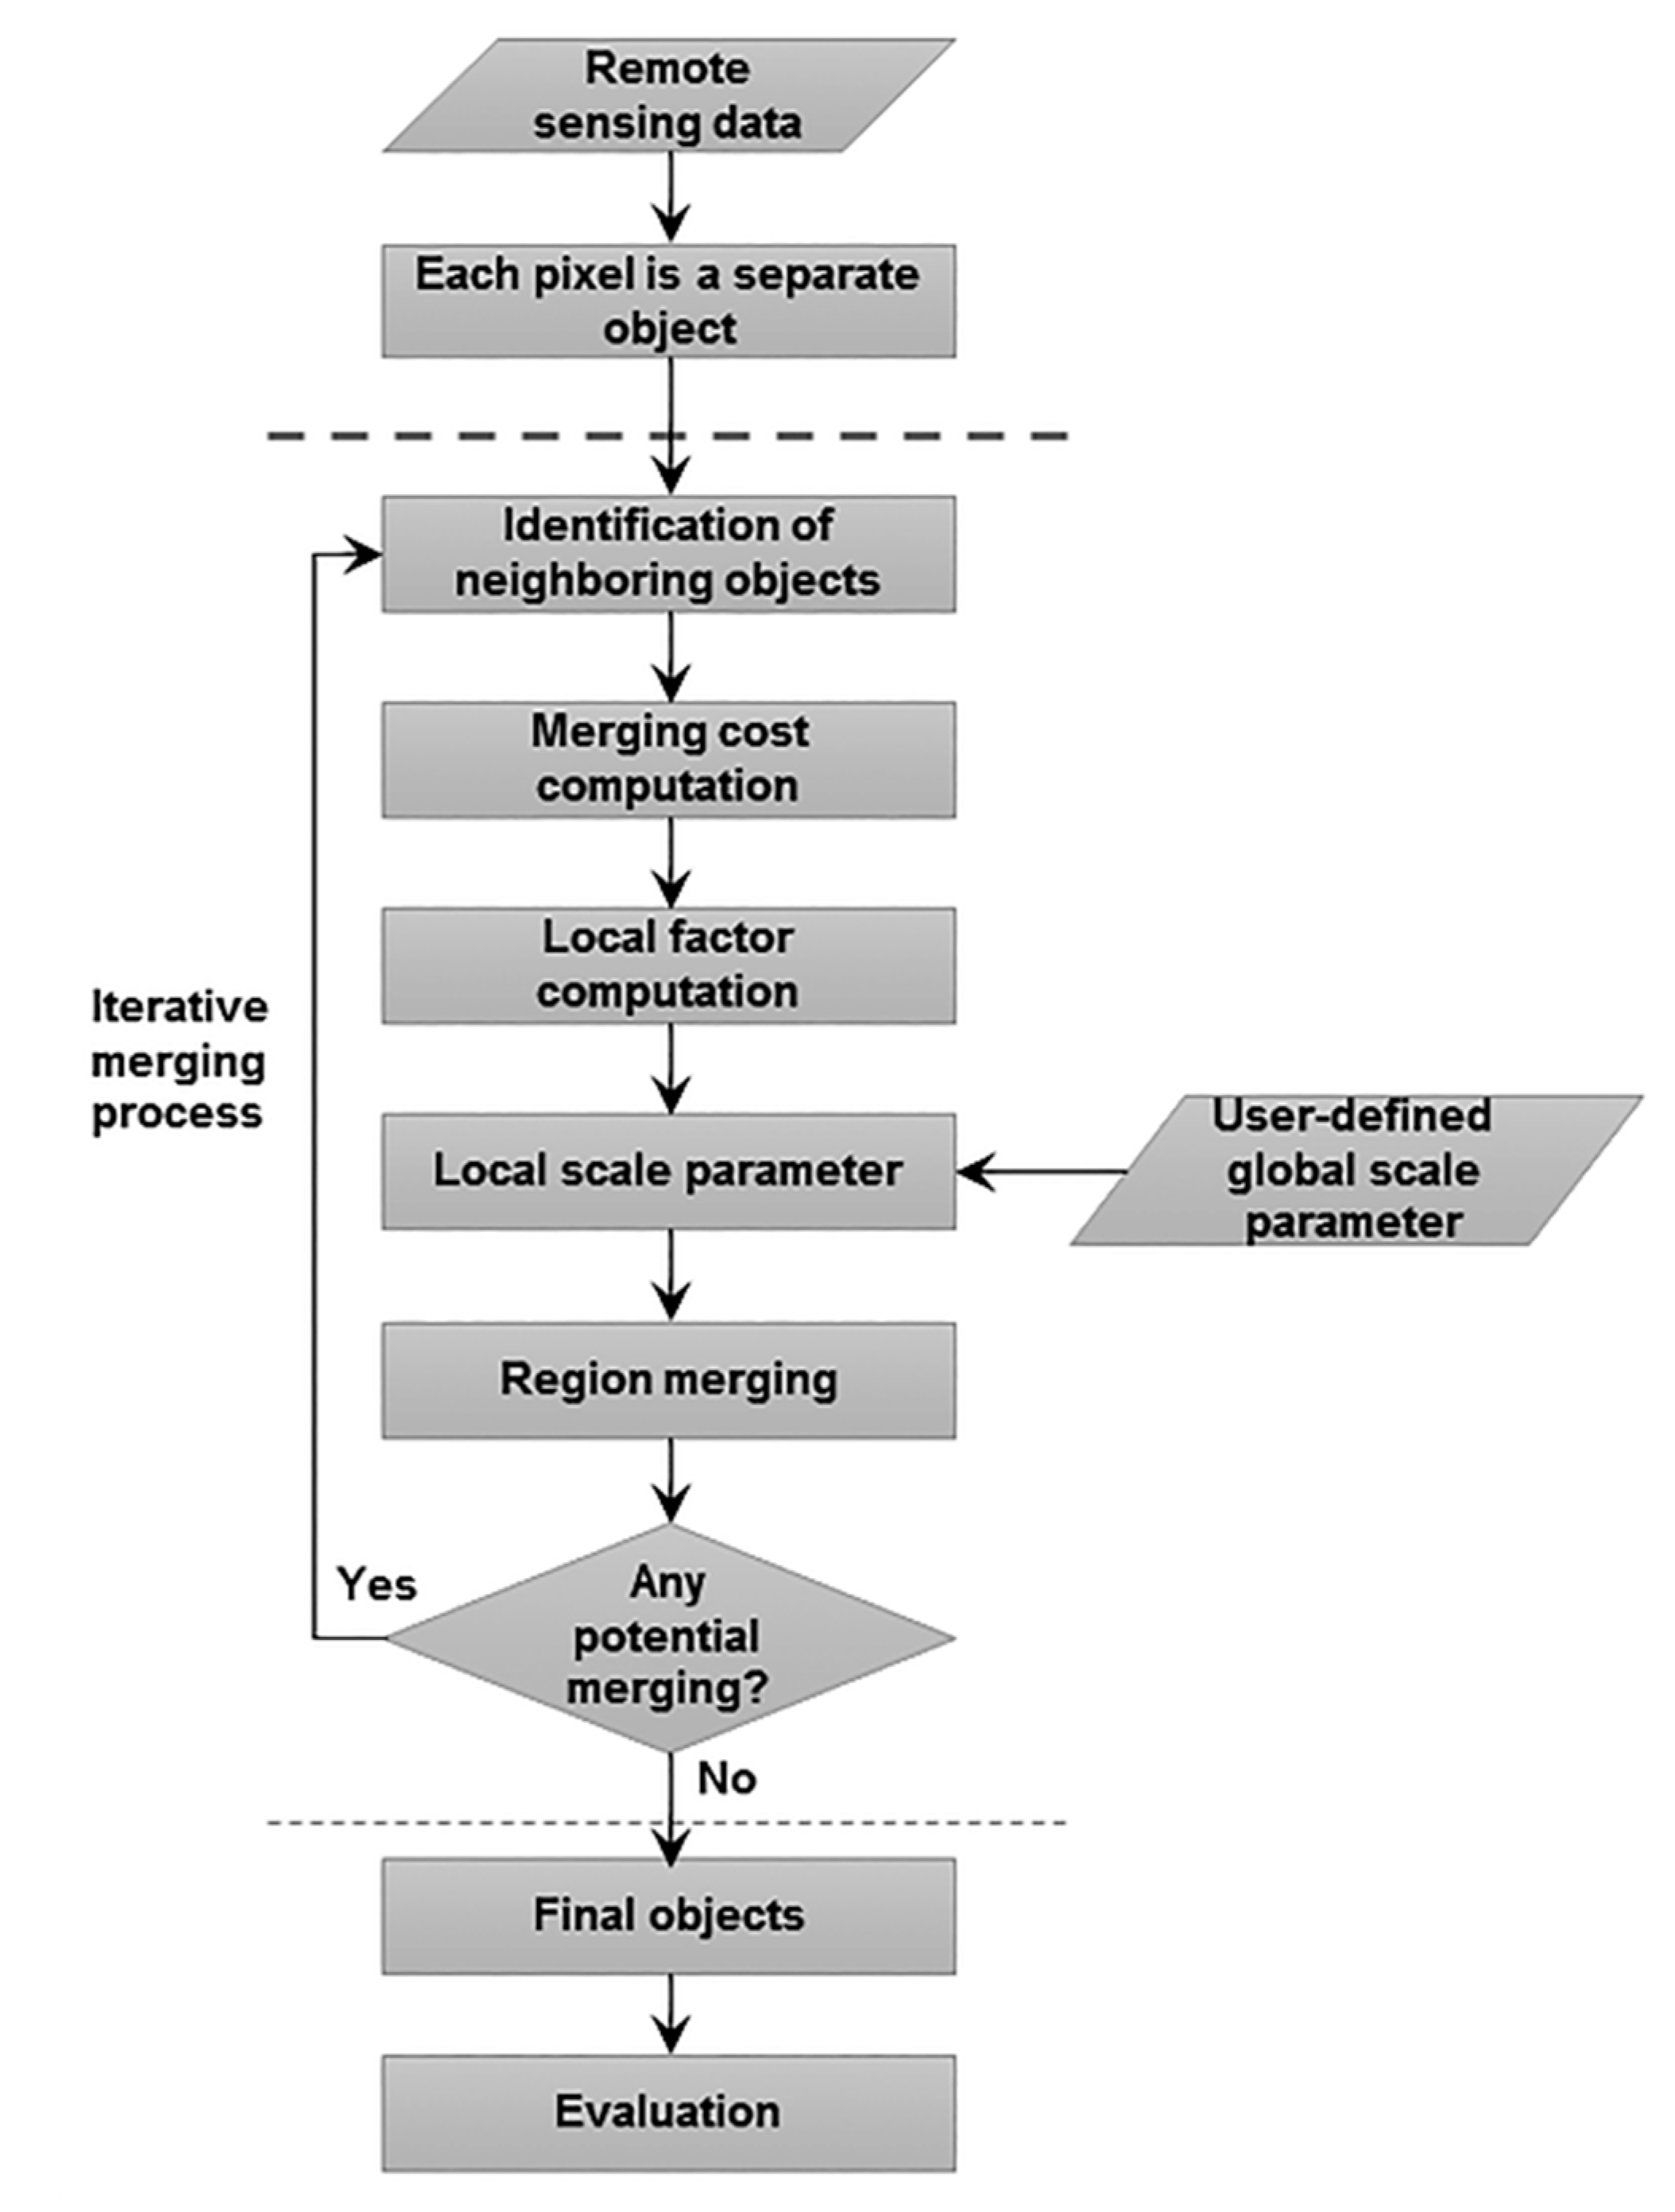
The proposed region merging method attempts to maximize the intra-object homogeneity and the inter-object heterogeneity of image objects with the inclusion of dynamically defined local SPs (SPlocal). The process of the proposed region merging segmentation method is illustrated in Figure 1 and can be summarized as follows. The process starts with each pixel forming one image object (i.e., each pixel is labelled as a separate object) with four edges (i.e., four- neighbor connectivity). Then, the neighboring objects are identified and the merging costs of adjacent object pairs are computed (Section 2.2.1). The merging cost (MC) is based on local homogeneity criteria, describing the spectral similarity of neighboring image objects. Furthermore, the inter- and intra-object heterogeneity measures are computed for each object, in order to define its SPlocal (Section 2.2.2). At each iteration, all existing objects are evaluated, in order to determine whether they have to be merged or not. Two adjacent objects, A and B, are merged if they fulfil the local mutual best fitting criterion (Section 2.2.3). The procedure stops when the MC between all objects exceeds their SPlocal and there are no more possible merges. The segmentation results were compared with the results of a widely used region merging segmentation method (Section 2.3) and were evaluated with supervised (Section 2.4) and unsupervised segmentation evaluation methods (Section 2.5). All results were generated in raster format (BIL) with a unique value for each object. Then, a raster-to-vector conversion was carried out using ESRI ArcMap. The main components of the segmentation algorithm are described in detail in the following sections.
2.2. Segmentation
2.2.1. Merging Cost (MC)
The identification of spatially adjacent objects is required in order to compute the MC for each potential merge of pairs of adjacent objects. In this method, the four nearest neighboring objects were considered to be spatially adjacent to other objects, since it was found that the four-neighbor connectivity produces better results than the eight-neighbor connectivity [14]. Then, the MC for each pair of adjacent objects was computed according to the spectral-based part of the MC proposed by Baatz and Schäpe [5]. The MC of two adjacent image objects (object 1 and 2) is defined by the change of spectral heterogeneity, Δh, in a virtual merge (Equation (1)):
where c is the band and wc is the weight of each band. nobj_1 and nobj_2 are the area in pixels of objects 1 and 2. hc,obj_1 and hc,obj_2 are the standard deviation of each band pixel values of objects 1 and 2. hc,merge is the standard deviation of the resulted object after the merging of objects 1 and 2. The objects are merged only when the homogeneity criterion is fulfilled according to Equation (2):
2.2.2. Local Scale Parameter (SPlocal) Definition
Local inter- and intra-object heterogeneity measures can assess local over- and under-segmentation effects [9]. Low values of local heterogeneity measures indicate that the object under study and its neighbor(s) are likely to be parts of the same target object. Therefore, these objects should be merged again. On the contrary, objects with high values of intra- and inter-object heterogeneity contain more than one type of feature because they are internally heterogeneous, and they should not be merged again since they are very different from their neighbors. In order to obtain augmented segmentation results with maximized internal homogeneity and external heterogeneity and reduced over- and under-segmentation bias, it is important to establish local SPs defined by the internal and external heterogeneity of each object.
The user only specifies a single global scale parameter (SPglobal) and a local heterogeneity-dependent scale parameter (SPlocal) is automatically computed for each object as follows. The first step in every iteration of the merging process is the computation of the internal and external heterogeneity statistics of each object. Local variance (local Var) was used as the internal heterogeneity measure. Local Moran’s I [15] is the decomposed form of global Moran’s I and measures the heterogeneity between object i and its neighboring objects, j, according to Equation (3):
where yi and yj are the mean values of objects i and j, and is the mean value of the scene. Only neighboring objects were considered for calculations, so wij is computed according to Equation (4):
where Li,total is the border length of object i, and Lij is the shared border length of object i and one of its neighboring objects, j. The wij values range between 0 and 1, where 1 expresses objects i enclosed to a single object, j, and 0 indicates that object j is not spatially adjacent to object i. Local I values close to 0 and negative values indicate objects with high external heterogeneity (i.e., different to their neighbors), and positive values indicate objects with low external heterogeneity (i.e., similar to their neighbors).
Second, the local Var and I values were computed for all bands and were averaged across all bands using the Equation (5):
where Xaverage is the average value of local Var or I, wc is the weight of each band, and Xc is the value of local Var or I for band c. In order to allow for the intra-object and inter-object heterogeneity measures to be considered equally, both were normalized to a similar range (0–1) according to Equation (6):
where Xmin and Xmax are the minimum and maximum value of local Varaverage or Iaverage. In each iteration of the region merging process, the Xmin and Xmax were updated when a smaller minimum and/or larger maximum value was computed. After normalization, the normalized values of objects with low local Var and I values were relatively close to 0, while the normalized values of objects with high values of these measures were close to 1.
Until this point, the approach is similar to the methodology part of Johnson and Xie [9] for the identification of over- and under-segmented objects. However, the approach of Johnson and Xie [9] is a post-refinement procedure for the enhancement of the quality of existing segmentation results, while the presented approach is a region merging segmentation. Therefore, the last step of this approach was differentiated to correspond with the objective of this study. Johnson and Xie [9] employed the heterogeneity index, H, which combines the normalized local Var and I. The final derived objects from the segmentation were classified according to the H value and were further refined by splitting and merging. On the other hand, the strategy of this study is to define during the region merging process the SPlocal of each growing object by adjusting the SPglobal with a local factor, LF, defined by the internal and external homogeneity of the object. According to the homogeneity criterion in Equation (1), the use of H as the LF to adjust the SPglobal will treat under-segmented and over-segmented objects the same way, given that H ranges from −1 to 1 and the SPlocal and MC are positive values. A further rescaling step would be required to adjust H values to a more appropriate range. In order to avoid further processing steps, the normalized local Var and I values were combined for the definition of the LF for each object according to the Equation (7):
where Varnorm is the normalized local Var and Inorm is the normalized local Moran’s I. LF values range from 0 to 2. Values close to 2 indicate objects, which are quite internally homogenous and very similar to their neighbors. This high degree of internal and external homogeneity indicates that the object and its neighbor(s) are likely to be parts of the same ground feature. Thus, these objects must be further merged. Values close to 0 indicate objects, which are less homogeneous internally and more different from their neighbors. These properties agree with the widely-accepted definition of what constitutes a good segmentation and further merging of these objects is not required. The LF of each object was multiplied with the user-defined SPglobal in order to define the SPlocal according to Equation (8):
According to the above, the objects with low internal (i.e., low local Var and Varnorm values) and external heterogeneity (i.e., high local I and Inorm values) will have a larger SPlocal value than objects with high internal (i.e., high local Var and Varnorm values) and external heterogeneity (i.e., low local I and Inorm values). Note that when an object is smaller than the real feature in the scene, its internal and external heterogeneity are low and its SPlocal is high. As the iterative region merging process continues and the object approximates the size of the real feature, its internal and external heterogeneity are increasing [16]. Therefore, its SPlocal will reach its lower value and the object will not be further merged. In cases of multi-scale segmentation strategies, the increase in size of an image object, which is considered to be a component of a larger one (e.g., a tree as part of a forest), will decrease its internal and external heterogeneity [17]. The decrease will stop when the image object matches its correspondent at a higher level of organization (i.e., forest), above which the heterogeneity measures will start to decrease again [16]. Thus, the process is inherently convergent, meaning that it automatically converges towards a final segmentation, since the SPlocal value decreases, when the object reaches the size of the target real feature.
2.2.3. Merging Order
An arbitrary object, A, can be merged with several neighboring objects, B, which fulfil the homogeneity criterion (Section 2.2.1). Baatz and Schäpe [5] and Lassalle et al. [18] described four different heuristics to choose the adjacent object to be merged with object A by considering further constraints concerning the neighborhood and similarity. In the simplest case of the fitting heuristic, object A is merged randomly with one of its adjacent objects if the homogeneity criterion is fulfilled. In the case of the best fitting, object A is merged with the neighboring object, which fulfils the homogeneity criterion and has the smallest MC compared to all possible merges of A with any other adjacent object (i.e., the homogeneity criterion is fulfilled best). In local mutual best fitting, object A is merged with its neighboring object, B, only if the homogeneity criterion is fulfilled best for both objects A and B. In the global mutual best fitting heuristic, only the pair of adjacent objects in the whole image, which fulfils the homogeneity criterion best, is merged at each iteration.
The fitting and best fitting heuristics require a visiting order strategy, which affects the segmentation quality [5]. The visiting order in global mutual best fitting is implicitly given by the heuristic, while in local mutual best fitting, the objects will always be merged with the same order regardless of the visiting order [18]. Both global and local mutual best fitting heuristics produce segmentations of the same quality [5], but the local mutual best fitting has a smaller computational cost [19]. Thus, the local mutual best fitting heuristic was used in the proposed region merging segmentation.
2.3. Segmentation Comparison
Due to the absence of existing region merging methods with local SPs, we compared our proposed method (Local) with two methods employing a global SP. First, a modified version of our region merging method (Global) was implemented by setting the LF to 1 for all objects, thereby limiting the SPlocal values at a single global value. Furthermore, both methods were compared to MRS [5], which is one of the most efficient and popular region merging segmentation methods employed in object-based analysis of remote sensing data. All three methods were applied to spectral and elevation data at multiple scales by varying the SPglobal from 10 to 100 in increments of 10. All bands were used and their relative weights were set to 1. In MRS, the shape and compactness parameters, which control the weights of the shape information in the computation of the merging cost, were set at their default values (shape = 0.1, compactness = 0.5). The results of each segmentation method were evaluated with supervised methods and unsupervised methods, which are described in the following sections.
2.4. Supervised Evaluation
The supervised evaluation methods identify the optimal segmentation results, which can approximate best the reference objects. A variety of arithmetic or geometric dissimilarity metrics can indicate the spatial agreement between reference objects and the respective (overlapping) image objects [20].
The area proportions between image objects, Si, and reference objects, Rj, with a mutual spatial overlap threshold of 50% were used to estimate five area-based measures: Area fit index (AFI), quality rate (QR), over segmentation, under segmentation, and the combination of the last two measures (D) [20]. A numerically-based measure, the miss rate (MR), was also used in the assessment. MR relates the total number of reference objects, NRj, to the number of undetected reference objects, NRmissed (i.e., objects without a corresponding object), and is denoted as:
A good quality segmentation is reached, when the overall differences of all criteria between the segmentation results and the associated reference objects are as low as possible. Except for AFI, the value range for all measures is from 0 to 1. The closer the value is to 0, the better is the spatial match between reference objects and their overlapping segments. Only AFI can reach negative values, when the reference objects are under-segmented [21].
2.5. Unsupervised Evaluation
A segmentation result is considered optimal when the average global intra-object homogeneity and inter-object heterogeneity are maximized [7]. The global Moran’s I value indicates the overall inter-object heterogeneity, whereas the mean weighted variance measures the average degree of intra-object homogeneity. The global Moran’s I is computed according to Equation (10):
where n is the total number of objects, yi is the mean value of object i, y is the mean value of the scene, and wij is the weight that defines the spatial adjacency of objects i and j. The value of wij was computed according to Equation (4). Global Moran’s I values range from −1 to 1. Values close to 0 and negative values indicate high inter-object heterogeneity, which is desirable for a segmentation. The mean intra-object homogeneity (wVar) was computed using the following Equation (11):
where vi is the variance of the pixel values within object i, and ai is the area in pixels of object i. The lower the value, the more homogeneous objects are in terms of the measured property. Espindola et al. [7] successfully utilized a combination of these measures to identify optimal region-growing segmentations in a multi-scale analysis. This method was also employed here to find the optimum segmentation scales and assess statistically the quality of segmentation results.
According to Espindola et al. [7], the global internal and external heterogeneity measures were rescaled to a range (0–1) in order to be considered equally. The minimum wVar and MI values were rescaled to 1, while the maximum values of these measures were rescaled to 0. The normalized values were combined for each band using the formula in Equation (12):
The S values for each band were averaged to identify the best single-scale segmentation. The optimal segmentation was identified as the one with the highest average S value, because at this segmentation, there is the lowest combined wVar and MI value. An alternative combination method is the F-measure (F), which is often used for classification accuracy assessment. Zhang et al. [22] used F to combine precision- and recall-based metrics representing the degree of over-segmentation and under-segmentation, respectively, and it was found to be more sensitive to excessive under-segmentation or over-segmentation. Furthermore, F was used by Johnson et al. [23] to compute the overall goodness, OGf, according to the following Equation (13):
where a is a weight that controls the relative weights of wVarnorm and MInorm. OGf values range from 0 to 1 and higher values indicate a higher segmentation quality. In this study, both measures were considered to have the same weights, i.e., a = 1.
3. Results
The effectiveness of the segmentation methods with local and global SP values is presented here by comparing their optimum segmentation results as indicated by supervised and unsupervised segmentation evaluation methods. The segmentation evaluation results are available as supplementary online material.
3.1. Remote Sensing Applications
The proposed segmentation method was employed in two remote sensing applications, including urban geo-object recognition (i.e., building delimitation) with spectral data (Section 3.1.1) and impact crater delimitation with elevation data (Section 3.1.2).
3.1.1. Building Delimitation from Spectral Data
Image segmentation of spectral remote sensing images is a mandatory processing step within OBIA workflows for building detection [24,25]. For this study, a 1 m color (RGB) digital aerial image of Boston, Massachusetts, USA and its reference building dataset were obtained from a publicly available dataset for building detection [26]. The study area is a 500 × 500 m subset of a typical urban area, which contains many different types of land cover within a small area (buildings, roads, trees, grassland).
3.1.2. Impact Crater Delimitation from Elevation Data
OBIA has shown promising results in landform classification from digital elevation models (DEMs) [27,28]. Even though image segmentation methods were designed for use with remotely sensed spectral data, several researchers [29,30,31,32] have proven that they can also be used with DEMs. Van Niekerk [33] compared several approaches and found that the multiresolution segmentation (MRS) algorithm is the most sensitive to morphological discontinuities in DEMs and is able to create objects with maximum internal homogeneity and are distinguishable from their neighbors.
The number of OBIA applications in the analysis of DEMs and their derivatives has increased in the last decade. Eisank et al. [34] showed that the efficient delimitation of landforms depends on the image segmentation algorithm, the parameterization of the segmentation, and the DEM derivatives, which are the input in the segmentation process. In order to avoid the effects of DEM derivatives, a landform mapping application, which requires only the segmentation of the DEM, is preferable for the evaluation.
A characteristic and simple object-based landform mapping approach was proposed by Vamshi et al. [35]. They showed that OBIA is efficient for the detection of lunar impact craters by segmenting only the high resolution DEM available from National Aeronautics and Space Administration (NASA) Lunar Reconnaissance Orbiter (LRO) mission [36]. Their method was based on an iterative process of segmenting the DEM into objects with SPs of decreasing value so that impact craters of different sizes can be detected. In each iteration, the resulting image objects were classified to impact craters according to shape and morphometric criteria.
In this study, a 2500 × 2500 m subset of the 5 m resolution DEM representing the topography of Mare Imbrium was employed for the evaluation of the segmentation. The same DEM was used also in the study of Vamshi et al. [35] and is available on the NASA website (http://ode.rsl.wustl.edu/moon/indexMapSearch.aspx). The performance of our segmentation method in impact crater detection was evaluated by comparing the detected impact craters with the reference impact craters, created manually by Vamshi et al. [35].
3.2. Building Delimitation from Spectral Data
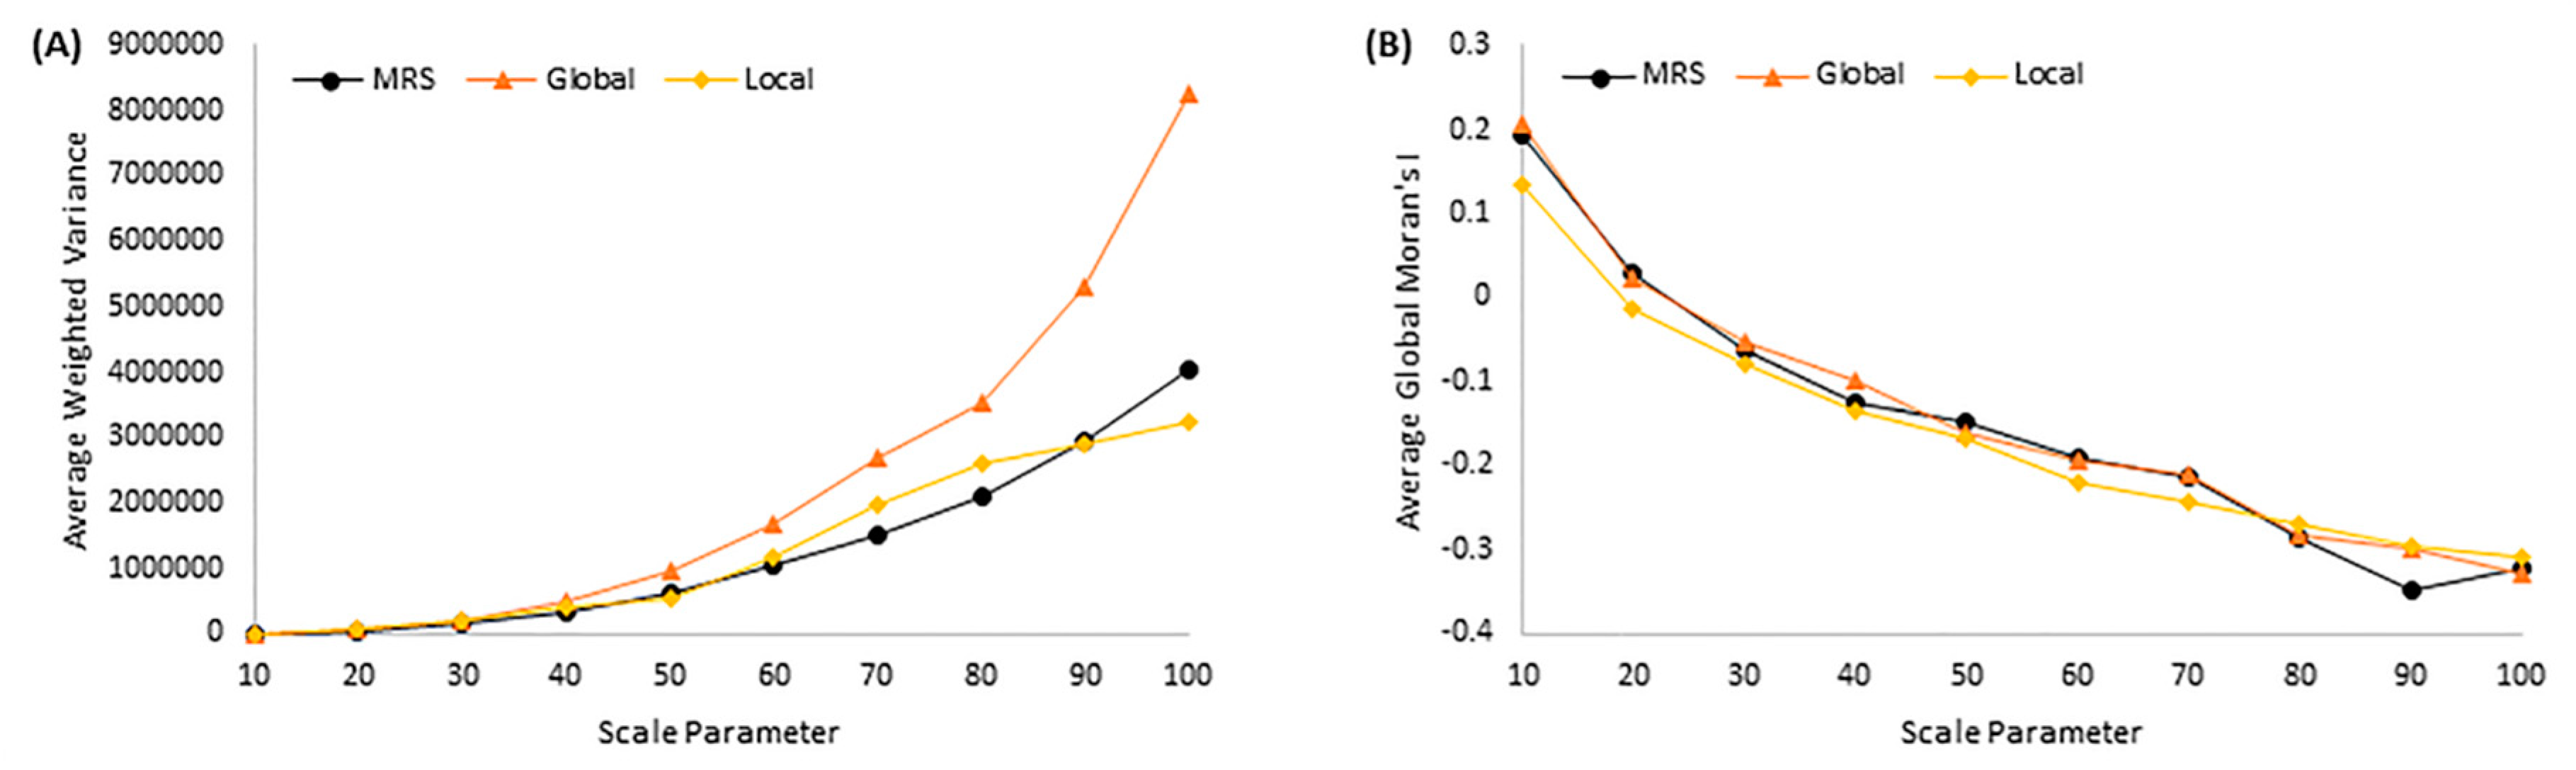
Based on the unsupervised evaluation method, the best segmentations for MRS, Global, and Local were obtained by setting the SPglobal at 60, 50, and 50, respectively. According to the diagrams in Figure 2, the three-band average wVar of the best segmentation from the Local (wVar = 555,247.79 and MI = −0.1661) was lower than those from the best segmentations from MRS (wVar = 1,038,643.19 and MI = −0.1900) and Global (wVar = 971633.24 and MI = −0.1615). The diagrams in Figure 2 show that the Global produced results with higher average wVar values in comparison to results from Local and MRS. The Local method appears to produce objects with similar average wVar and apparently lower MI values than the MRS for most scale parameter values. MRS and Global appear to produce segmentation results with similar MI values. The best segmentation results of the three methods indicated by the unsupervised evaluation are demonstrated in Figure 3b–d.
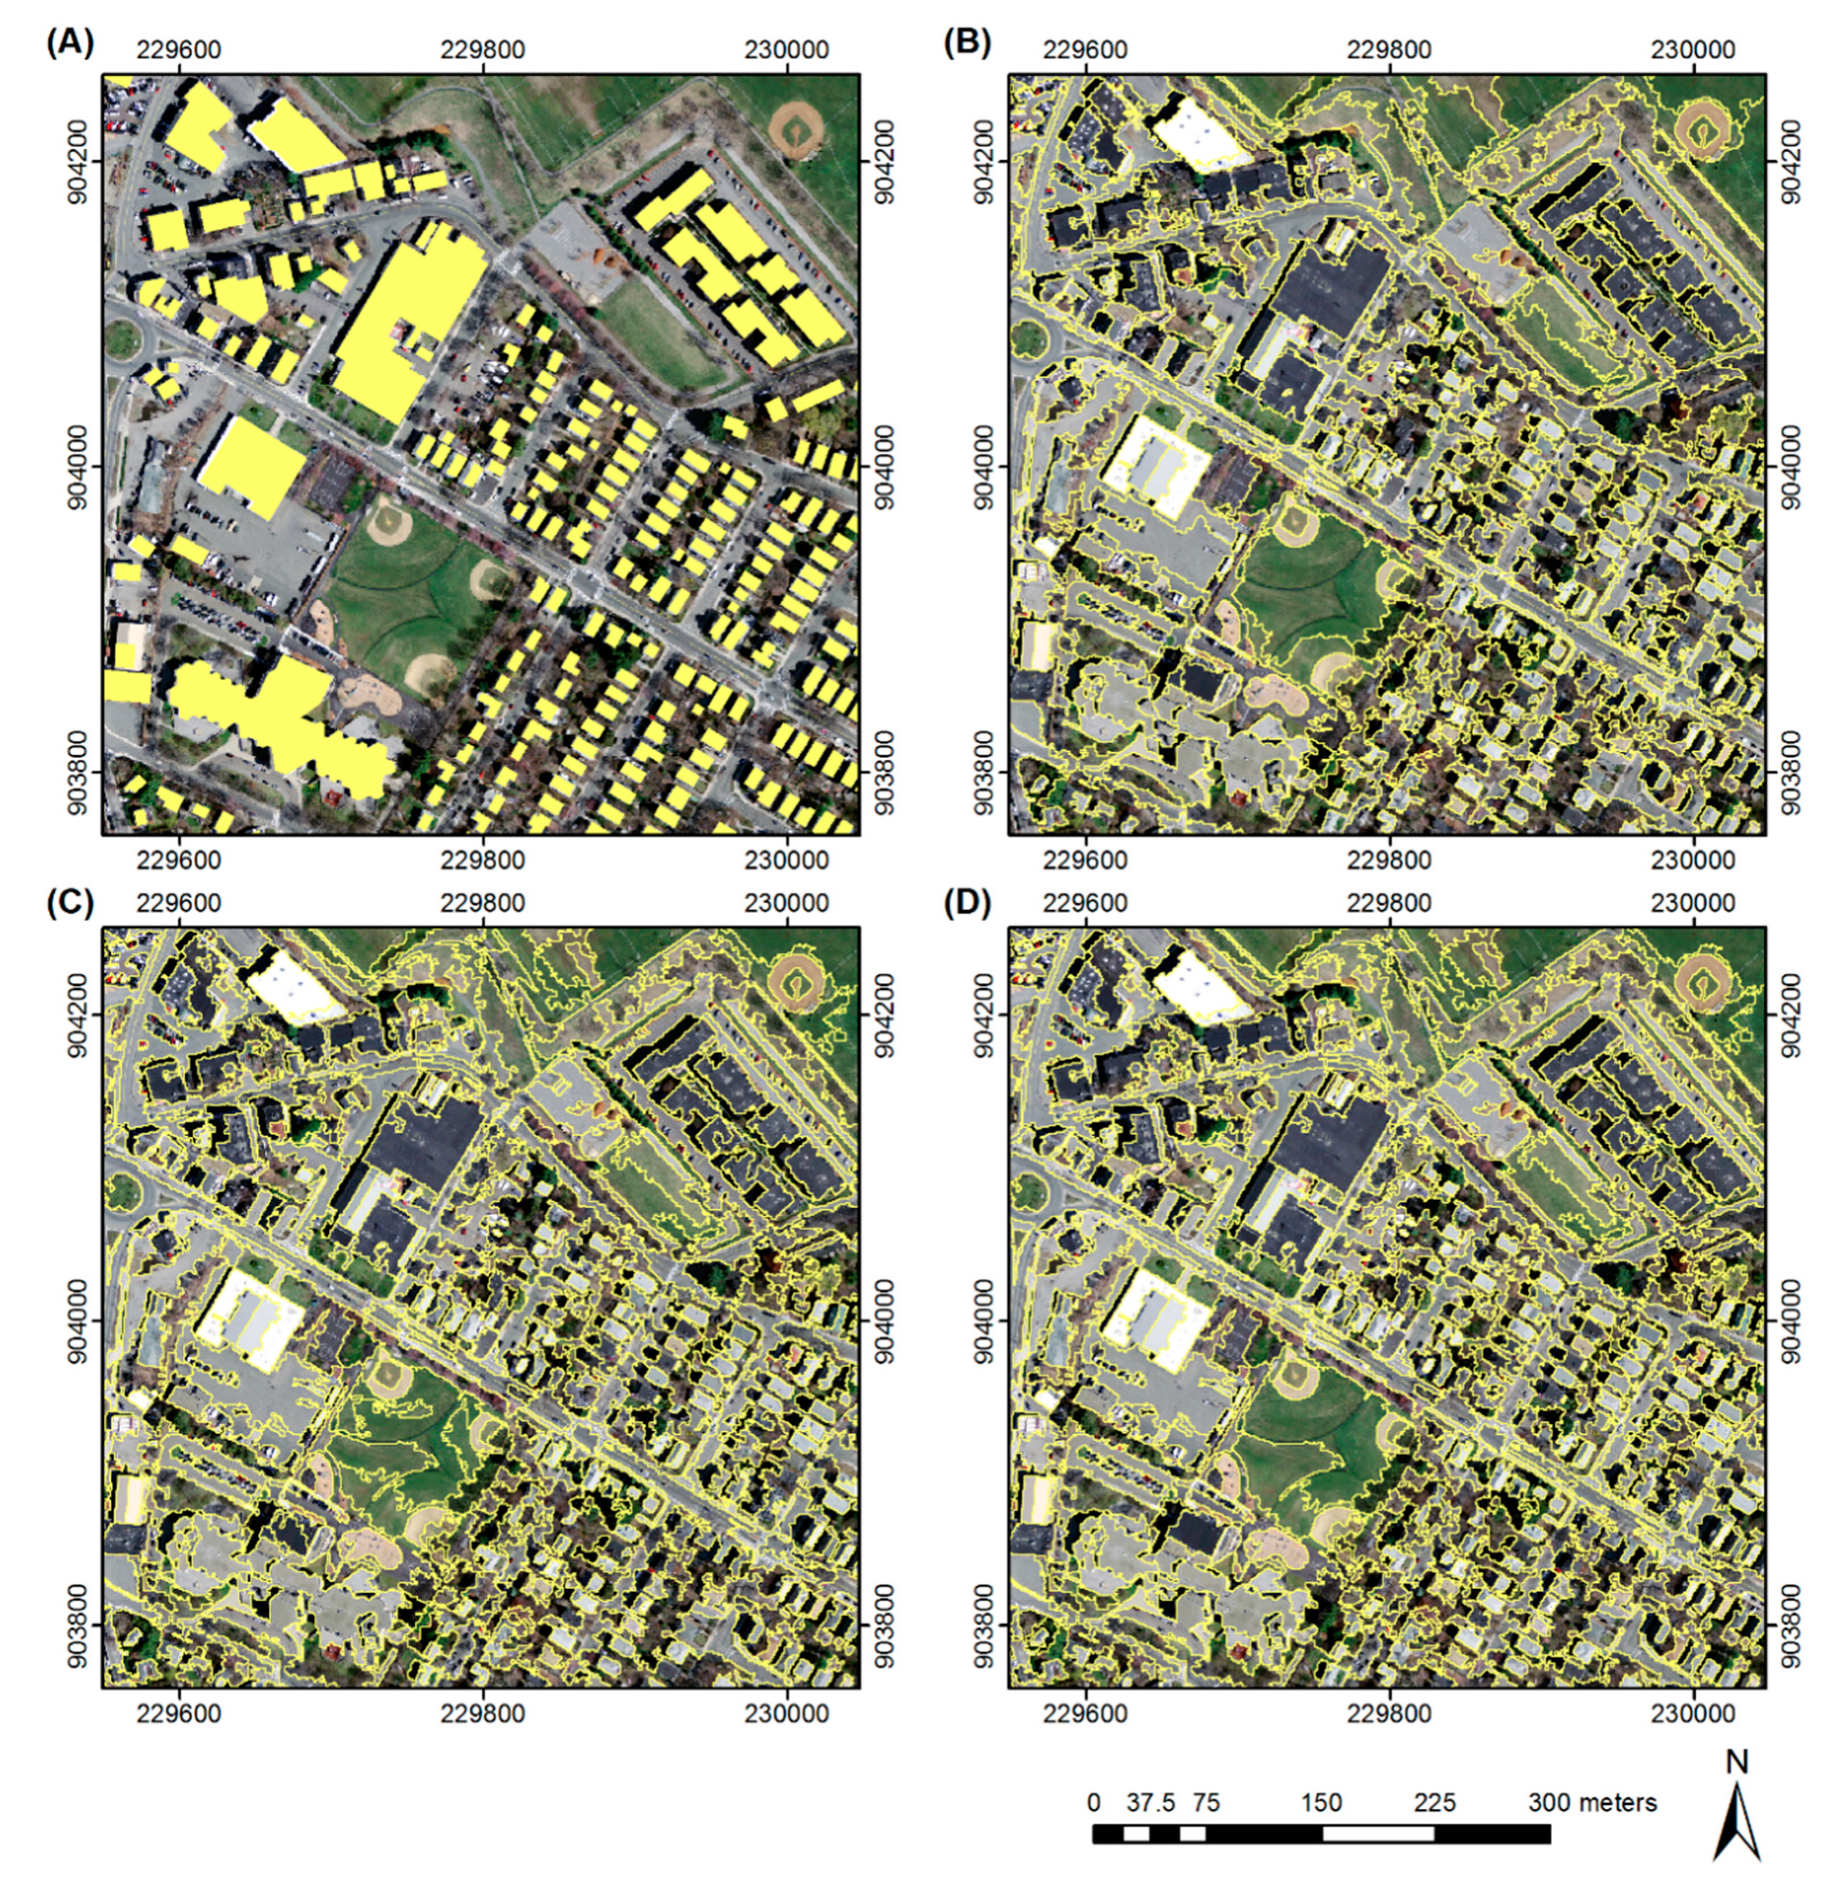
The visual results in Figure 3 show that the results of all methods do not have obvious differences in the delineation of building objects. This fact is proven by the relatively similar performance of the three methods based on the five area-based measures (Figure 4). The superiority of the proposed Local can also be identified by observing the results locally and particularly in areas covered with grassland (Figure 3). Both Local and MRS showed a greater performance in segmenting grassland areas as single objects compared to the Global method, which showed over-segmentation effects. Indicatively, the MRS was able to delineate the playground in the middle of Figure 3B. The Local method was able to capture the spectral discontinuities inside the playground area in Figure 3D, while the Global method over-segmented the playground area (Figure 3C).
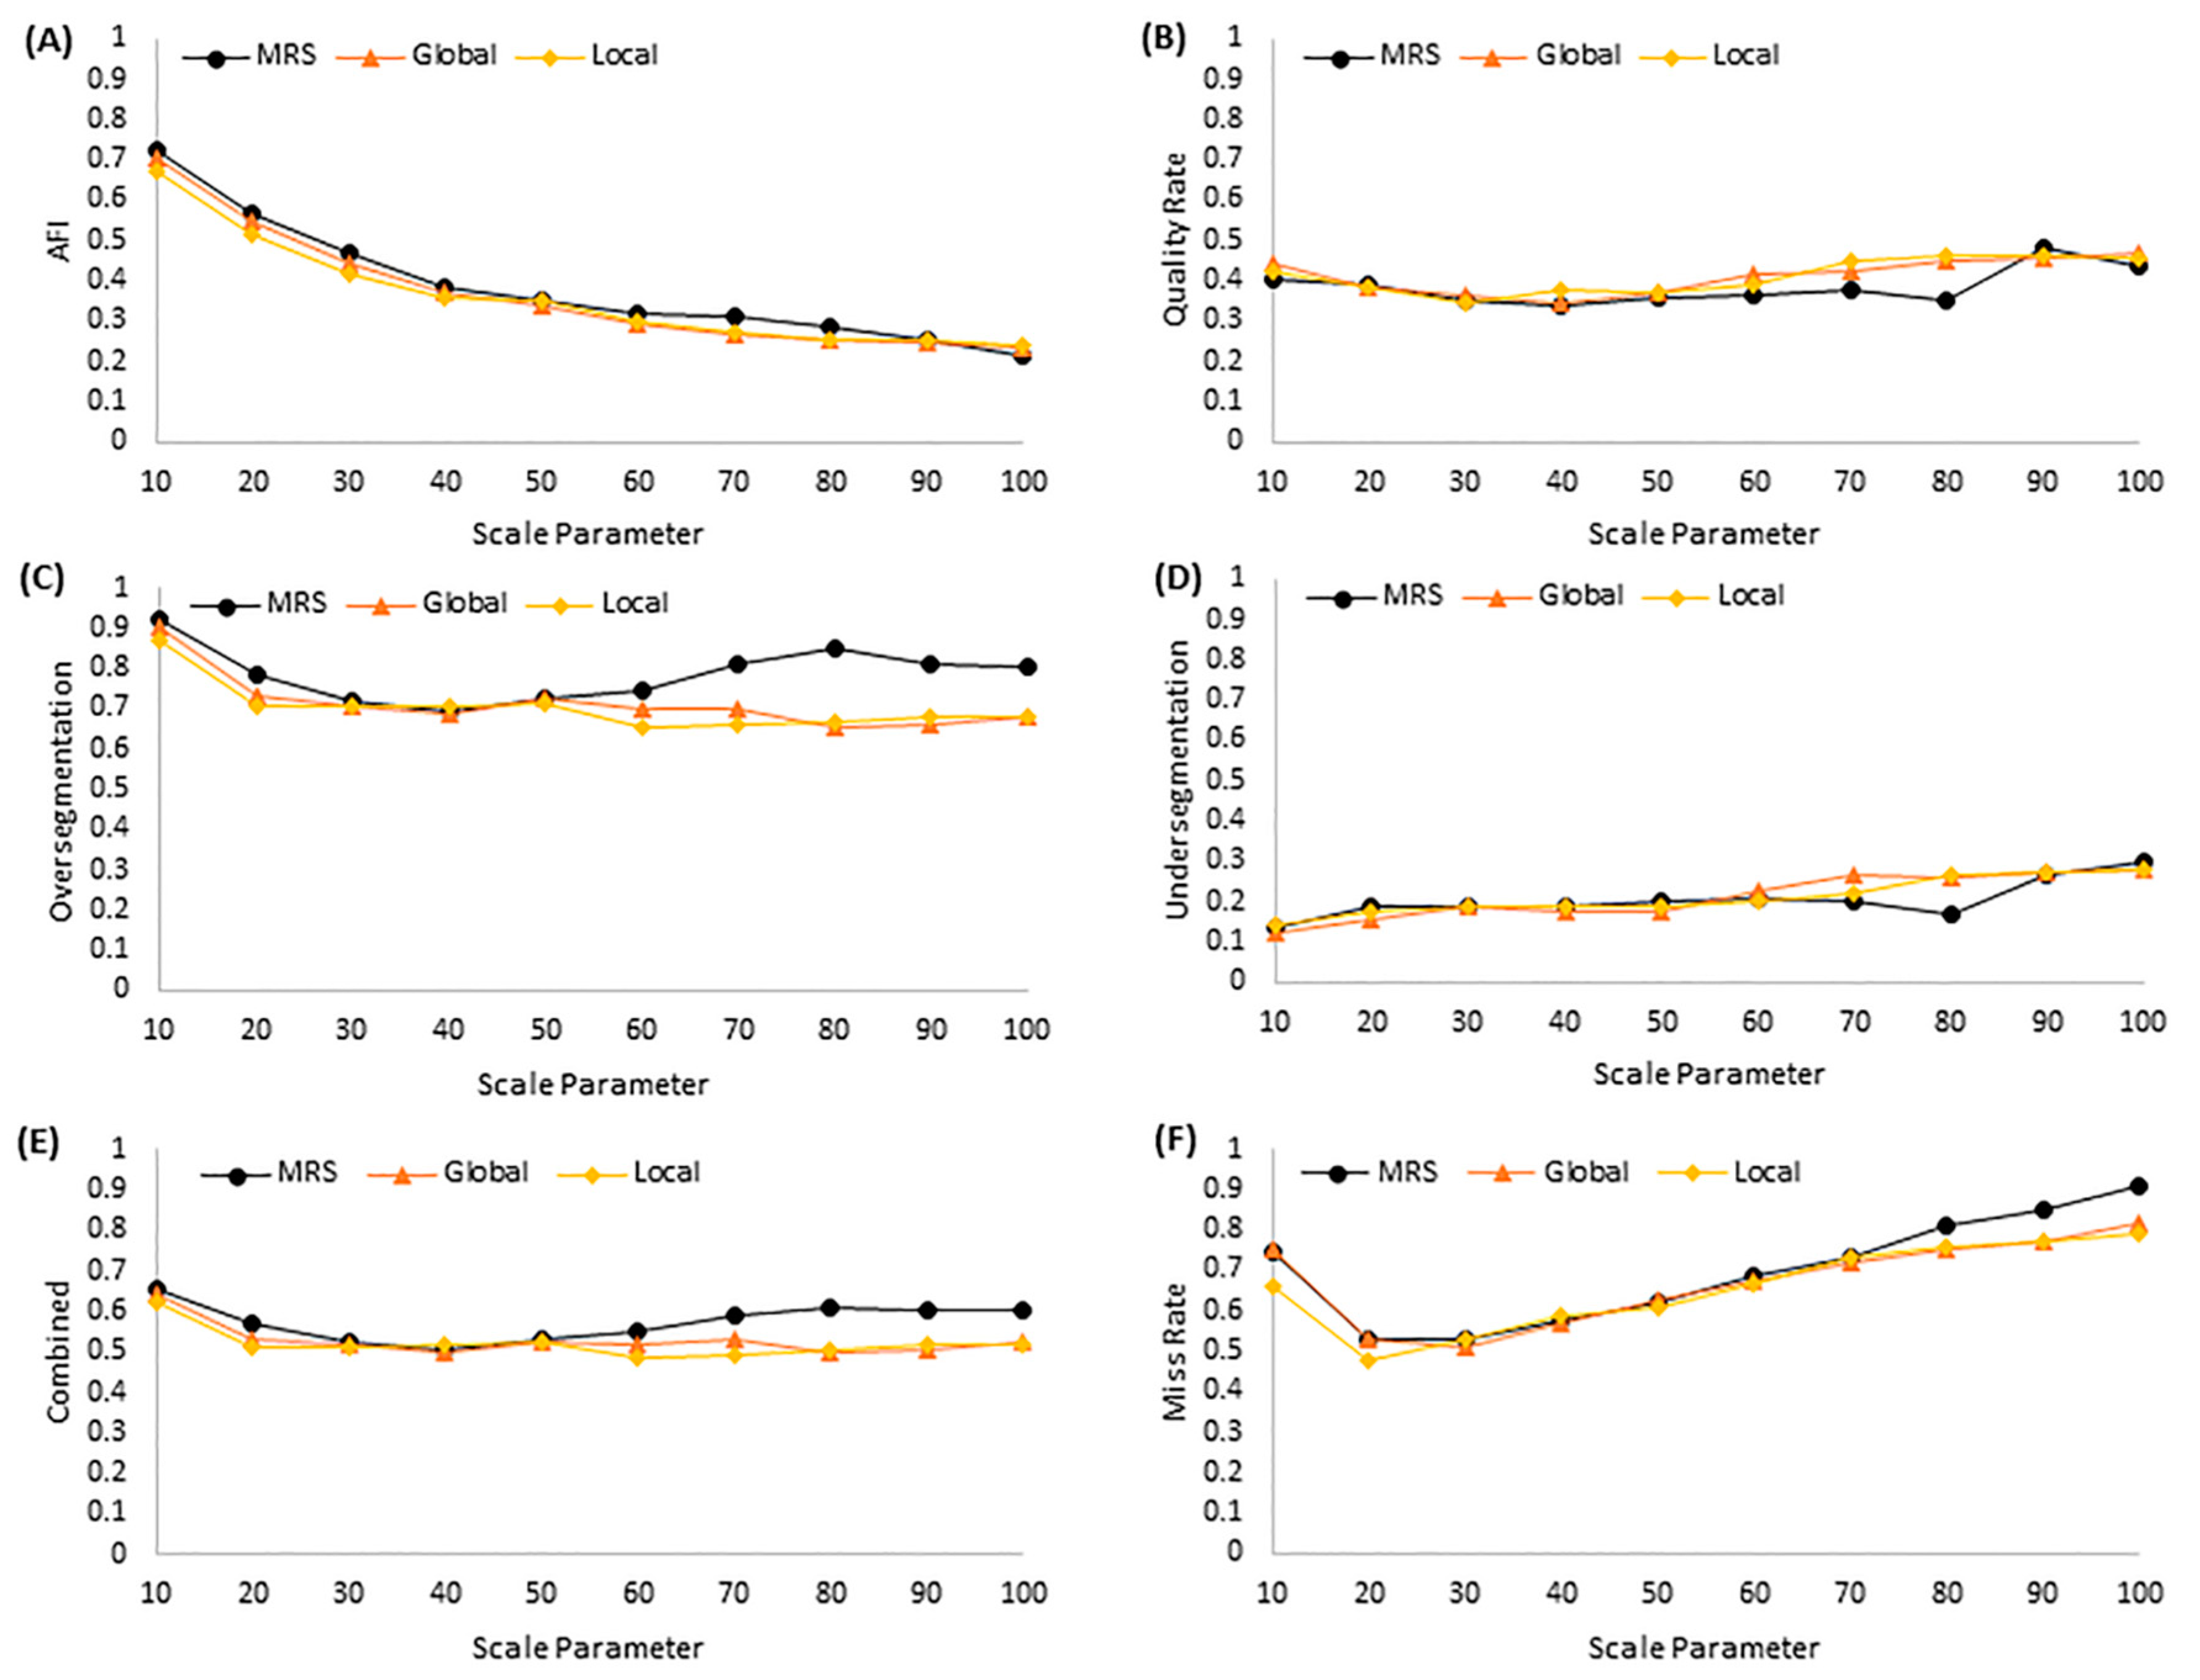
The supervised evaluation results of the three segmentations produced by MRS, Global, and Local are presented in Figure 4. The different discrepancy measures indicated different SPglobal values as best for building delimitation. The performance of MRS and Local are similar in terms of the six indicators. Comparing Local with MRS and Global, the AFI value of Local results is approximately 5% lower than that of MRS results and 0.3% lower than the Global results. Accordingly, the Local results achieved the lowest over segmentation and combined over- and under-segmentation value than both the MRS and Global results. The MR value of the best result from Local was slightly lower (0.4778) than those from the other two methods (MRS = 0.5270 and Global = 0.5073). This fact indicates that the Local can delimit more reference building objects than the other two methods.
3.3. Impact Crater Delimitation from Elevation Data
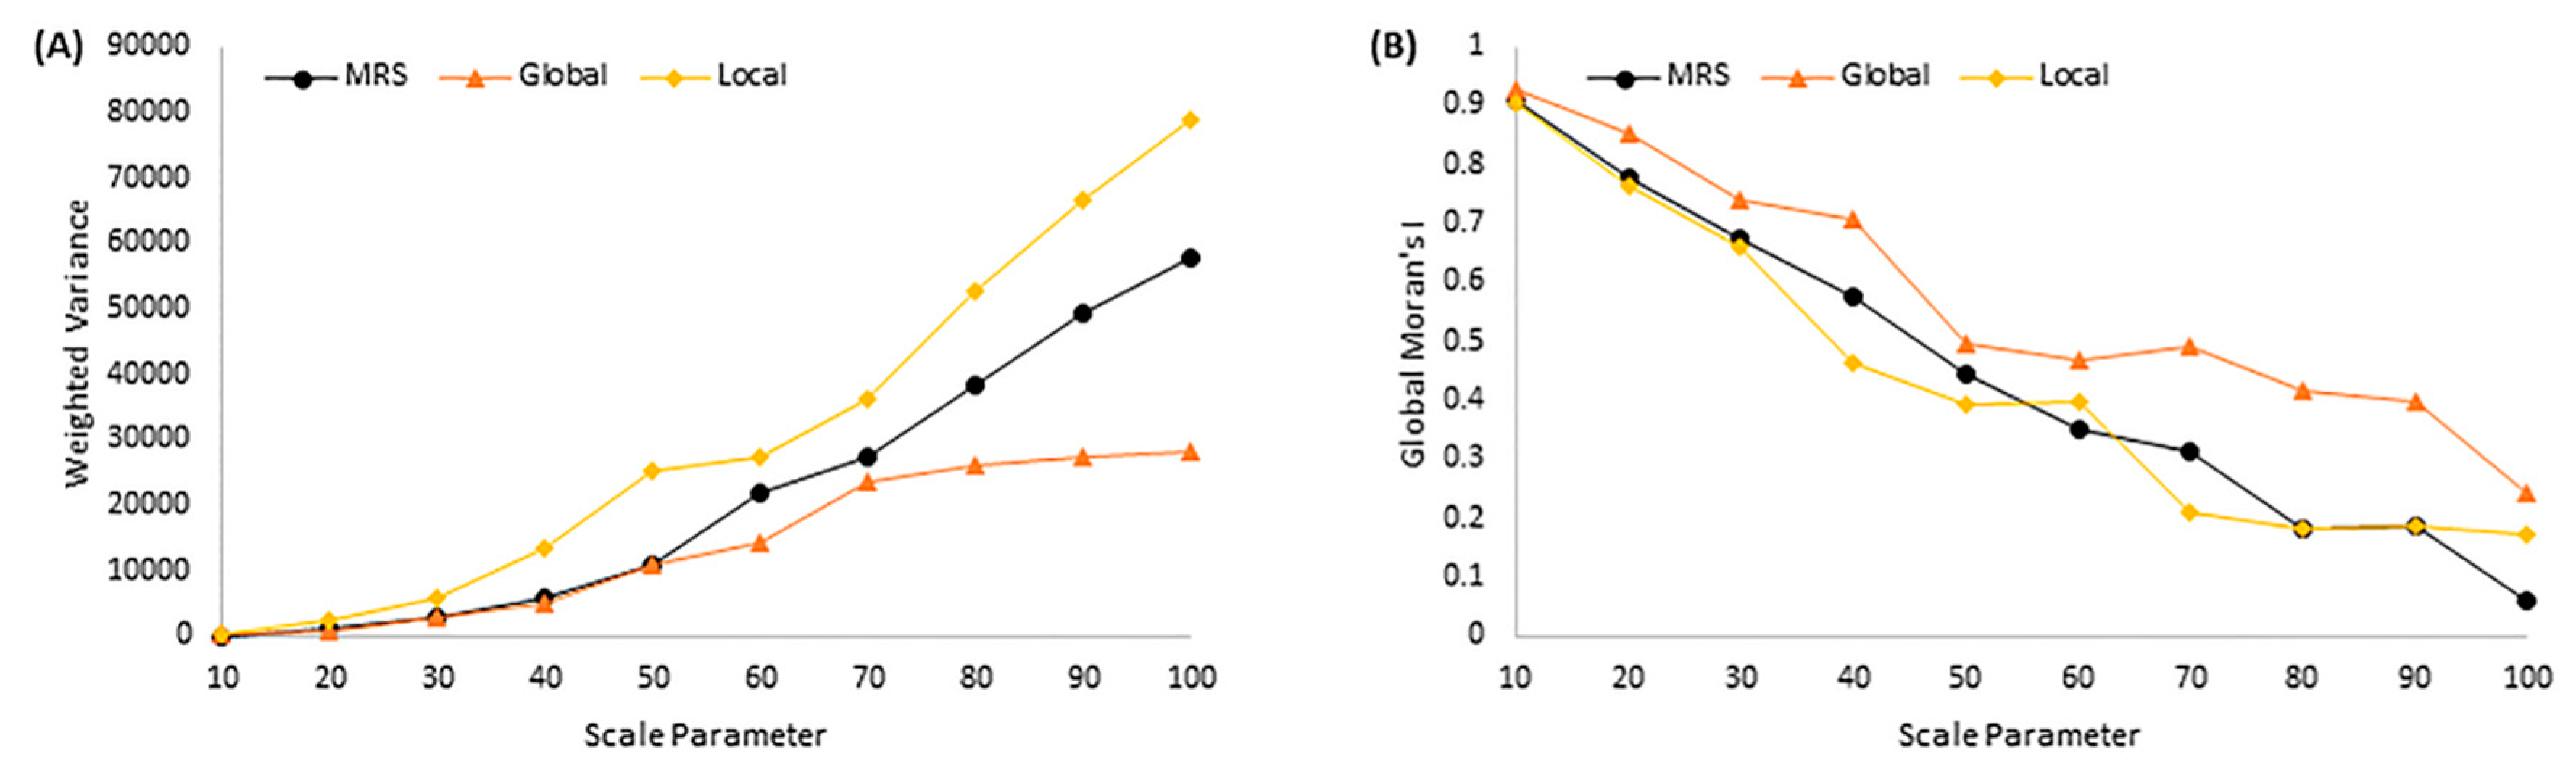
According to the unsupervised evaluation method, the optimum scale parameter value for MRS and the Global was set to 50, while for the Local, it was set to 40. The diagrams (Figure 5) for wVar and Moran’s I show that the Local outperforms the other two methods to produce multiscale segmentation results with lower Moran’s I values. The average wVar and Moran’s I values of the best segmentation results produced from the three methods were nearly similar (Local: wVar = 13,629.50 and MI = 0.4633, Global: wVar = 10,846.80 and MI = 0.4956, MRS: wVar = 10,968.11 and MI = 0.4463).
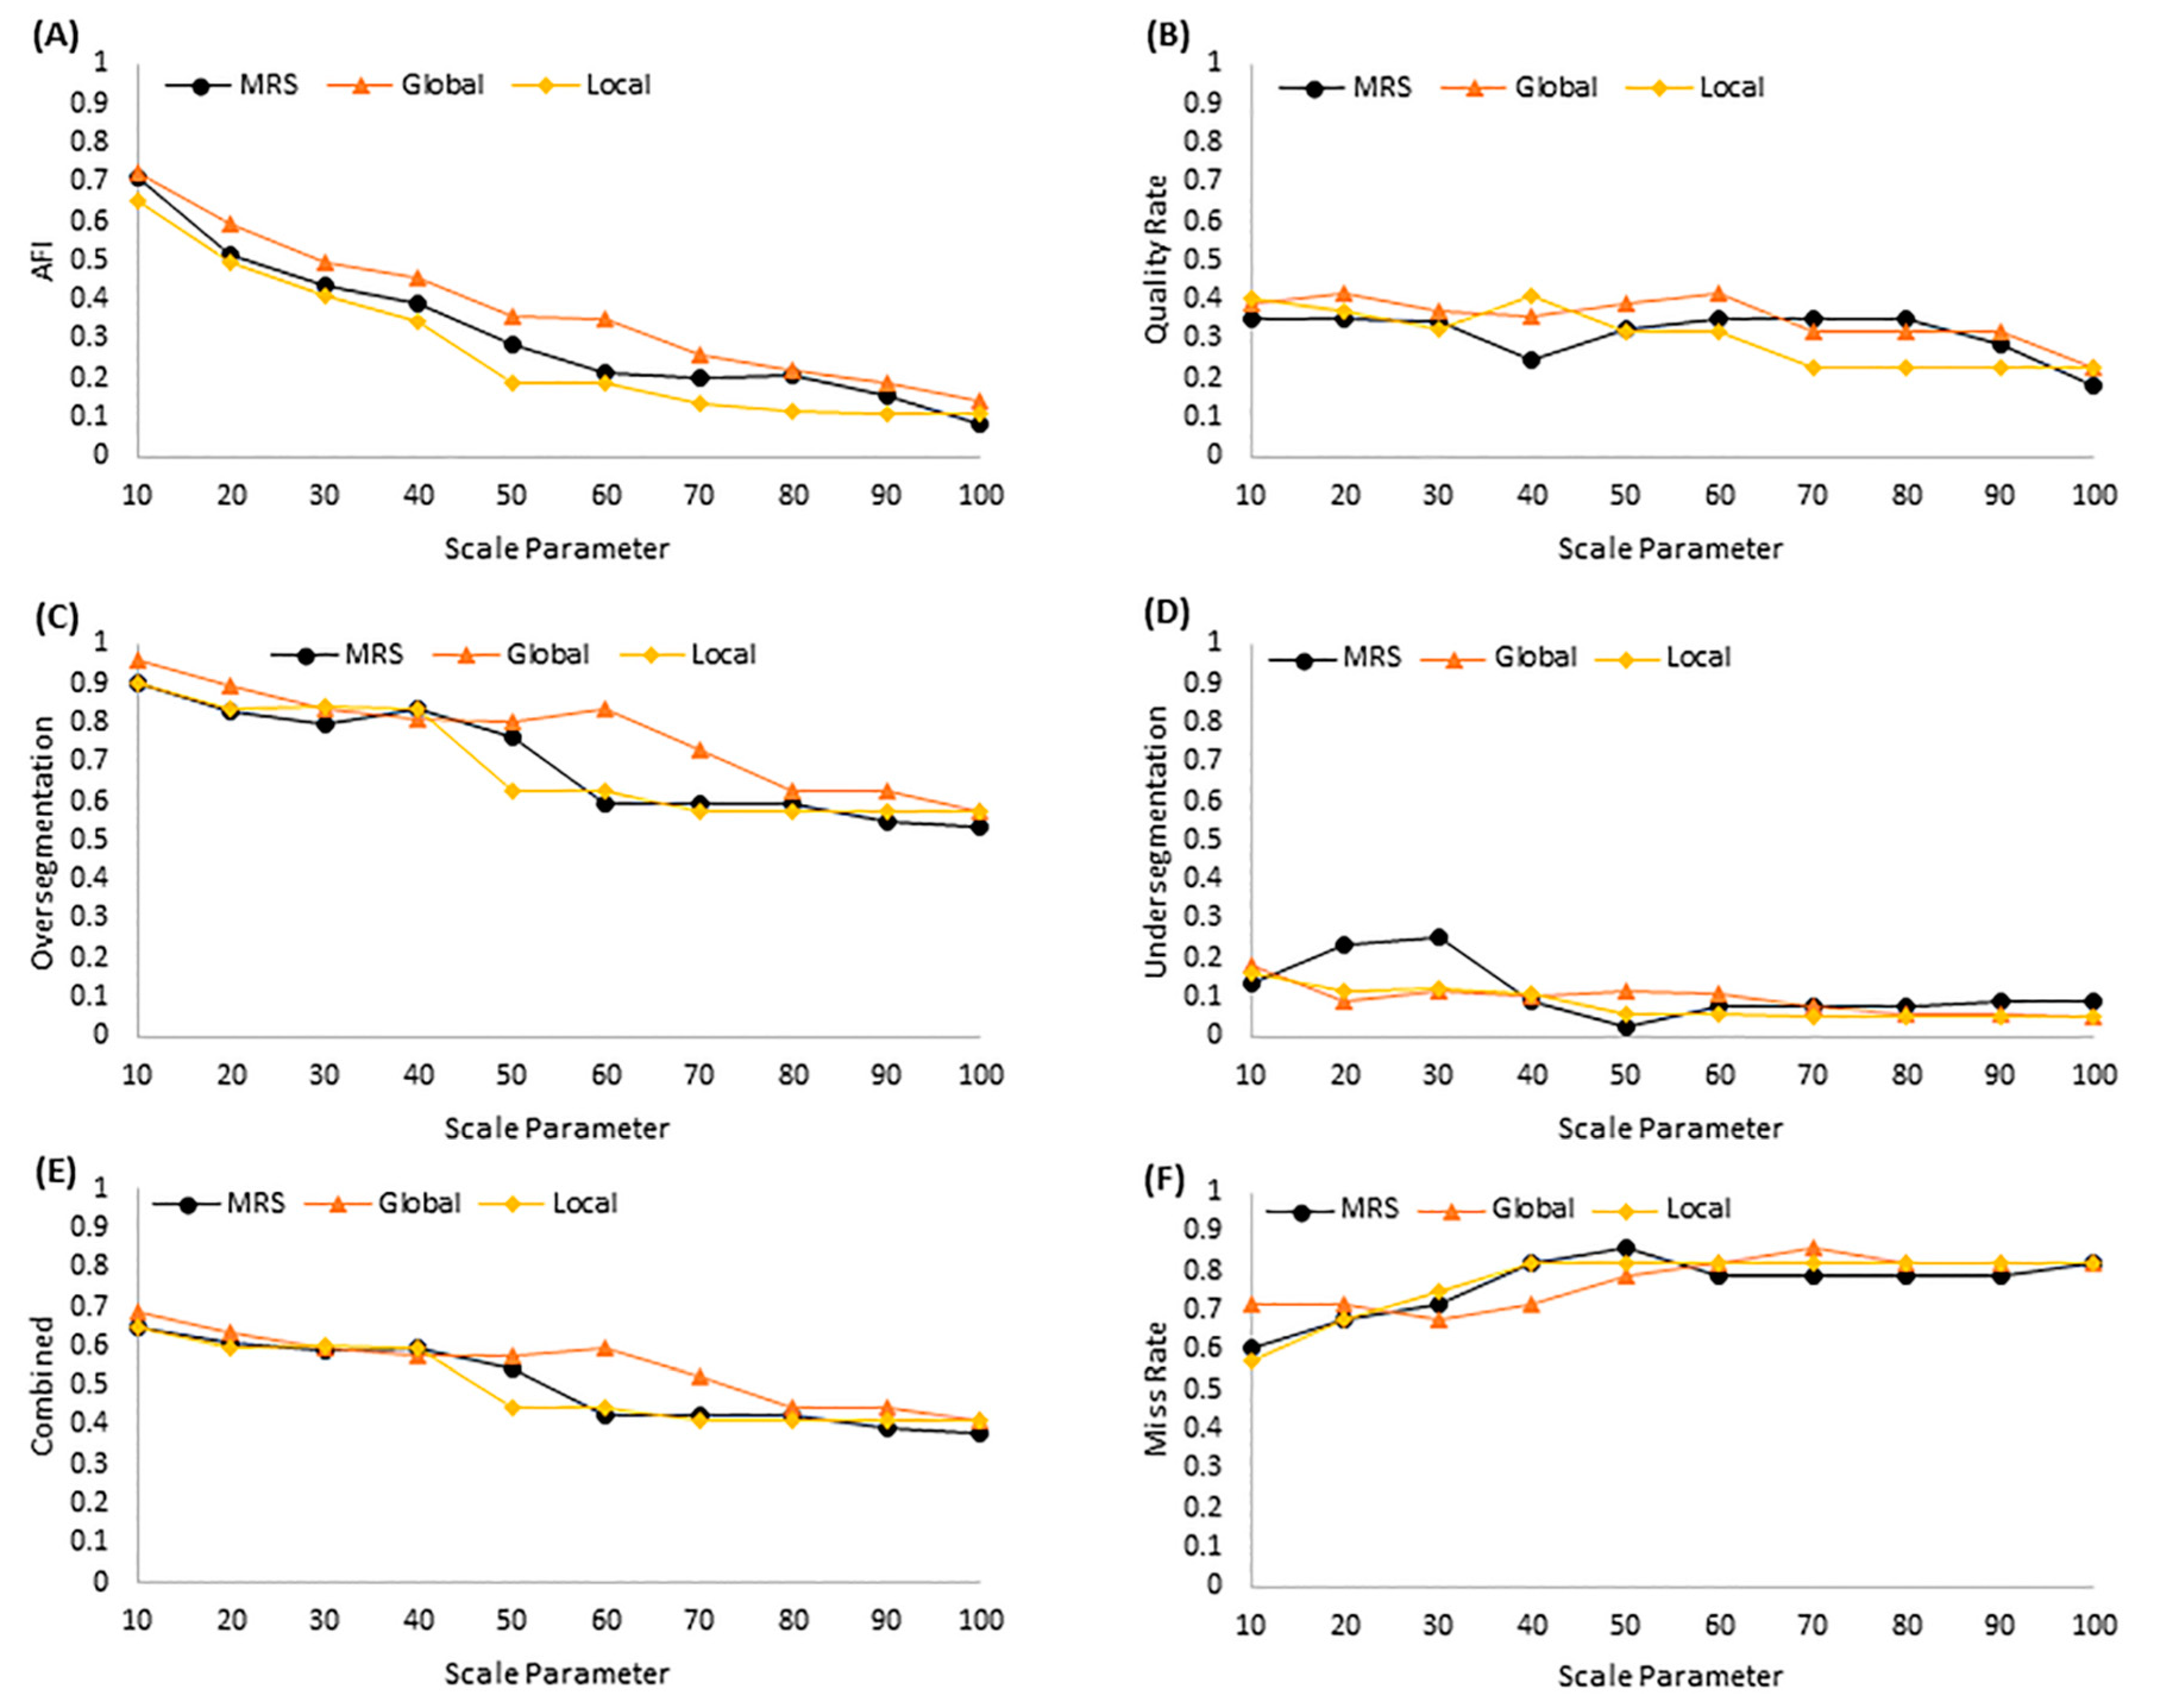
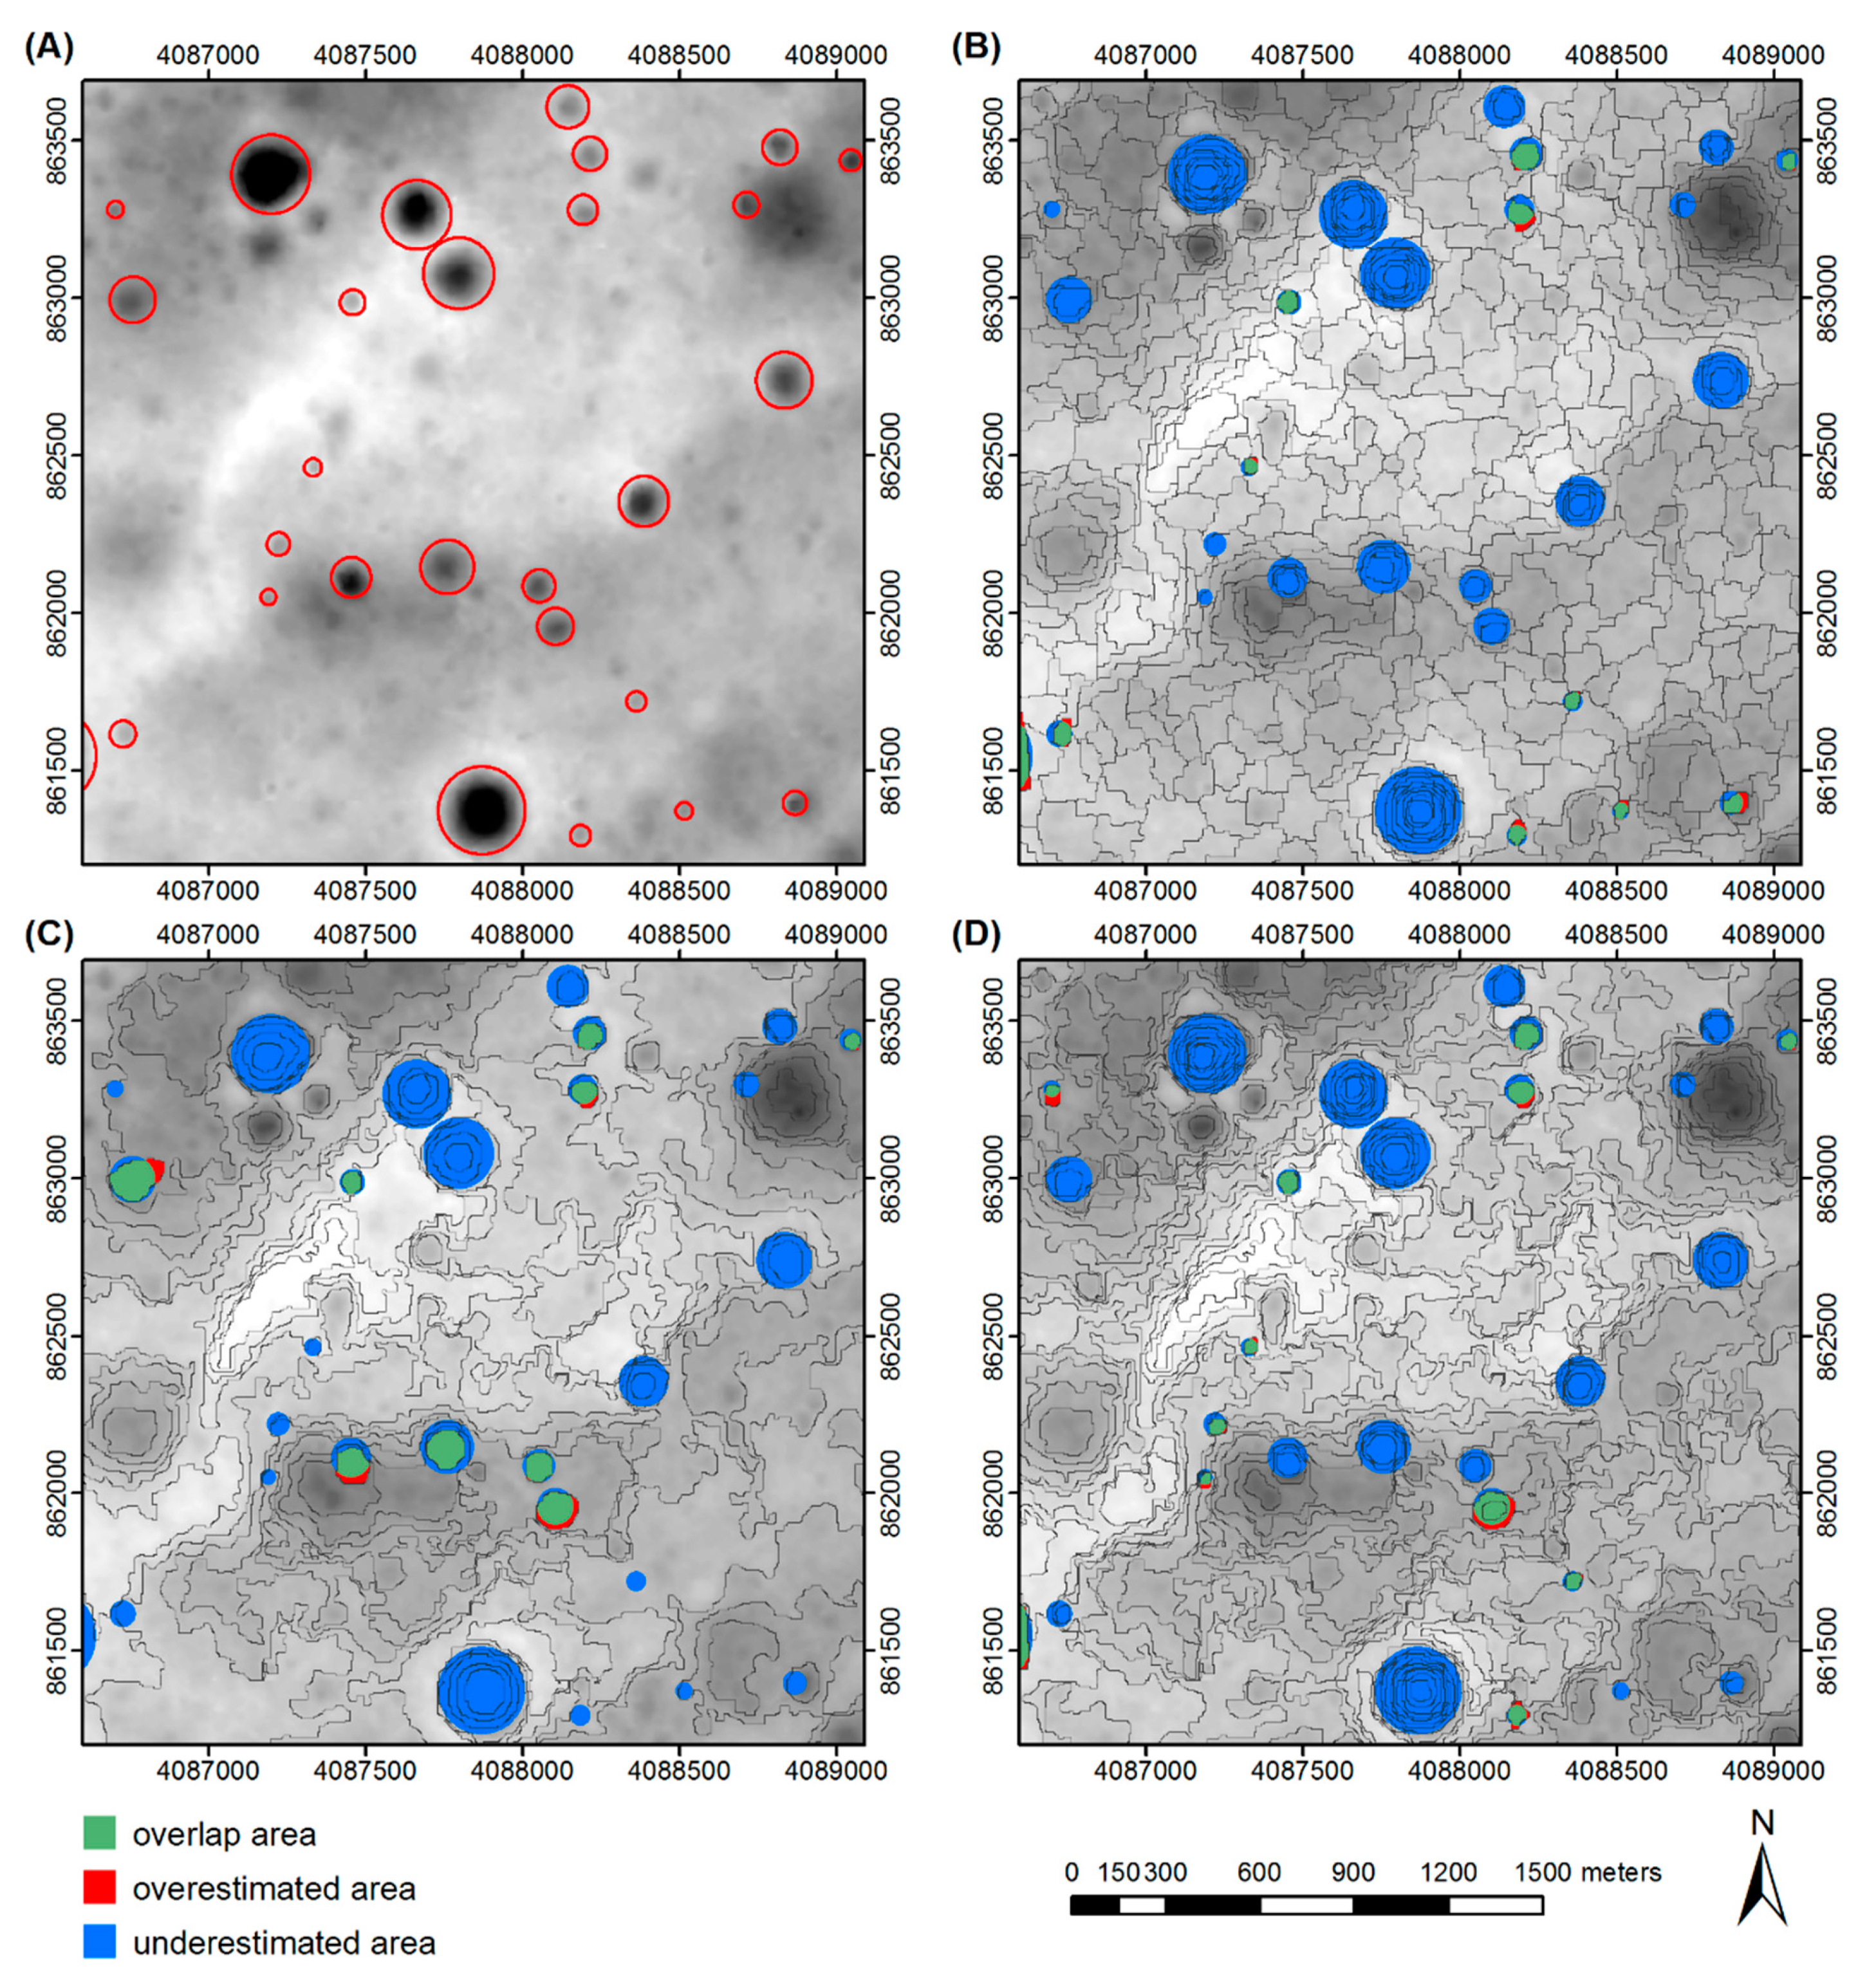
The area-based dissimilarity measures for the three segmentation approaches indicated different optimum SPglobal values (Figure 6). All area-based measures confirmed the greater efficiency of the Local than the other two methods. Indicatively, the AFI values of the Local results are approximately 14% lower than that of the MRS results and 31% lower than the Global results. The best segmentation result as indicated by the MR was obtained with the Local when the SPglobal was set to 10 (MR = 0.5714). The Local has a lower value of MR than the MRS (MR = 0.6071) and the Global (MR = 0.6785). Figure 7 illustrates the best segmentation results according to MR for the three segmentation methods. According to Figure 7, the proposed method and the MRS delineated 12 and 11 impact craters, respectively, while the Global managed to delineated only 9. This caused the high degree of under-estimated areas (blue in Figure 7) in the intersection maps of all segmentation methods. On the contrary, the proportion of over-estimated areas (red in Figure 7) was relatively small for MRS, Local, and Global, compared to their under-estimated areas. Nevertheless, all segmentation methods appear promising because the overlap area (green in Figure 7) shows that delimited craters match with the reference craters quite well.
3.4. Comparison with a Relative Hybrid Segmentation Method
At this point, it is necessary to compare the performance of the proposed Local method with the hybrid segmentation (objective heterogeneity and relative homogeneity-OHRH) method of Wang et al. [12], which incorporates also the intra-object and inter-object heterogeneity statistical measures within the merging process. The Local, the Global, and the MRS method were applied for the segmentation of the SZTAKI-INRIA building detection dataset [13], which is available from their website (http://web.eee.sztaki.hu/remotesensing/building_benchmark.html). This dataset contains nine aerial and satellite images of Budapest and Szada in Hungary, Manchester in United Kingdom, Bodensee in Germany, Normandy, and Côte d’Azur in France. Following Wang et al. [12], only the images from the regions of Côte d’Azur, Manchester, and Szada were tested with the three segmentation methods. The segmentation settings for all methods remained the same as before (Section 2.3).
The best segmentation results according to OGf are shown in Figure 8 for visual comparison, where only the MRS and Local results are illustrated. The unsupervised evaluation results according to OGf for the three region merging segmentation methods are shown in Table 1. Furthermore, the OGf values that came up from the evaluation of the OHRH method of Wang et al. [12] and full Lambda-schedule algorithm (FLSA) of Robinson et al. [37] are also provided in Table 1. Additionally, the comparison with the relevant results from OHRH [12] and FLSA [37] showed that the MRS and the Local methods can produce segmentation results with reduced over-segmentation effects, which is also evident from their higher OGf values.
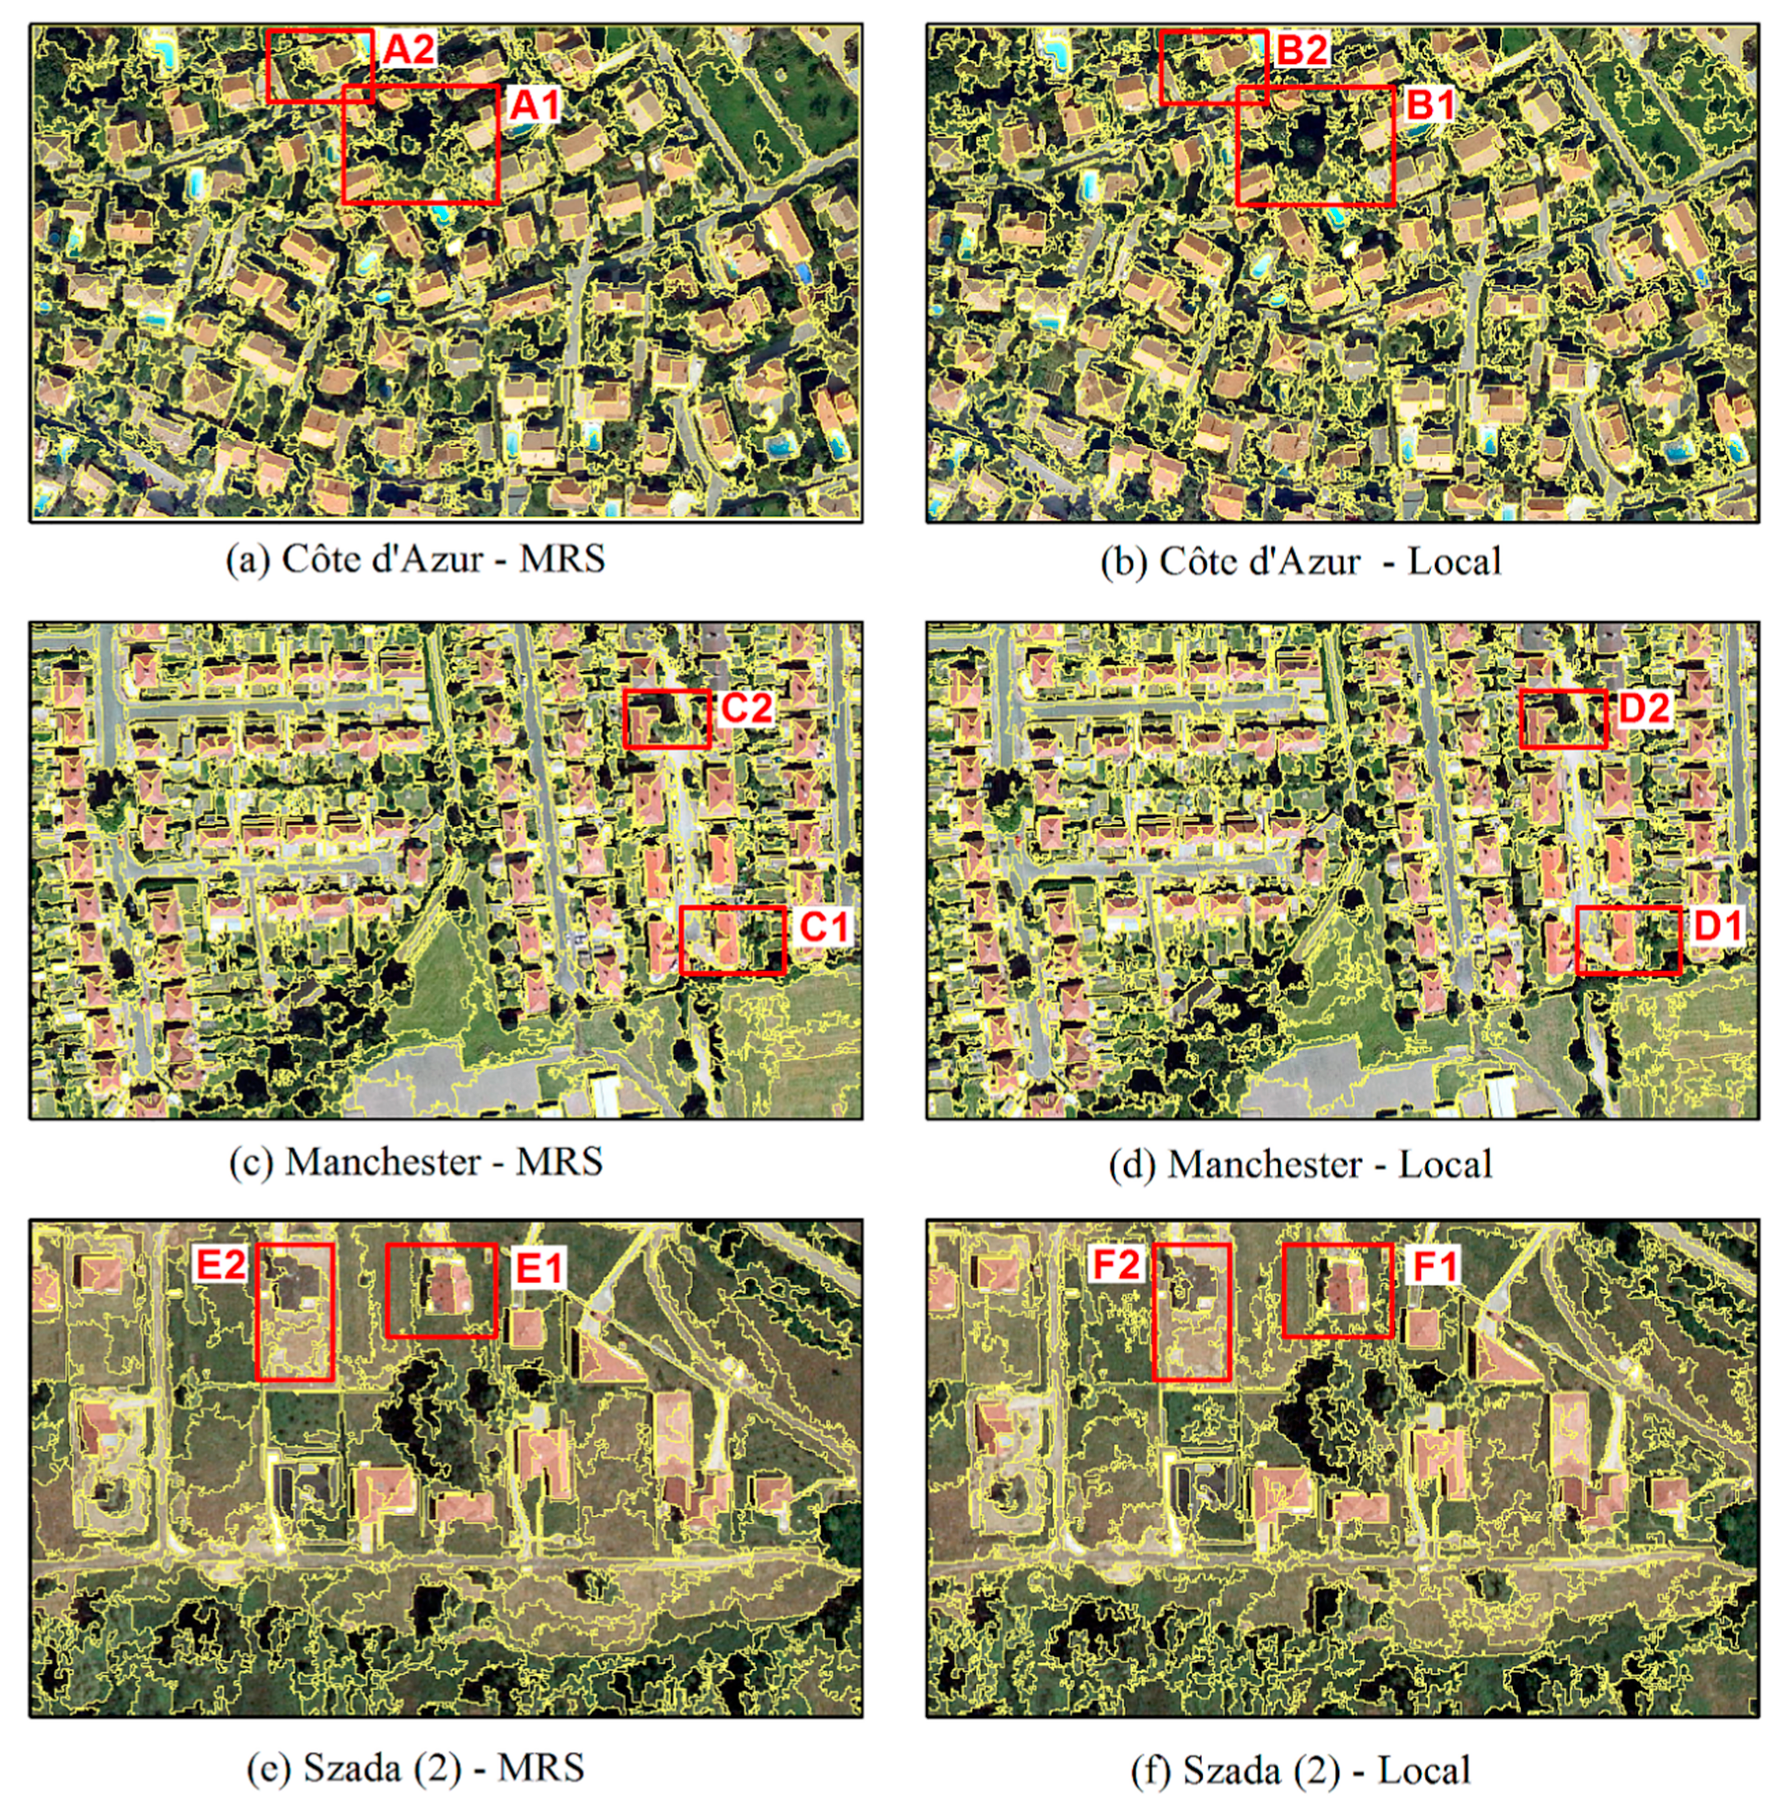
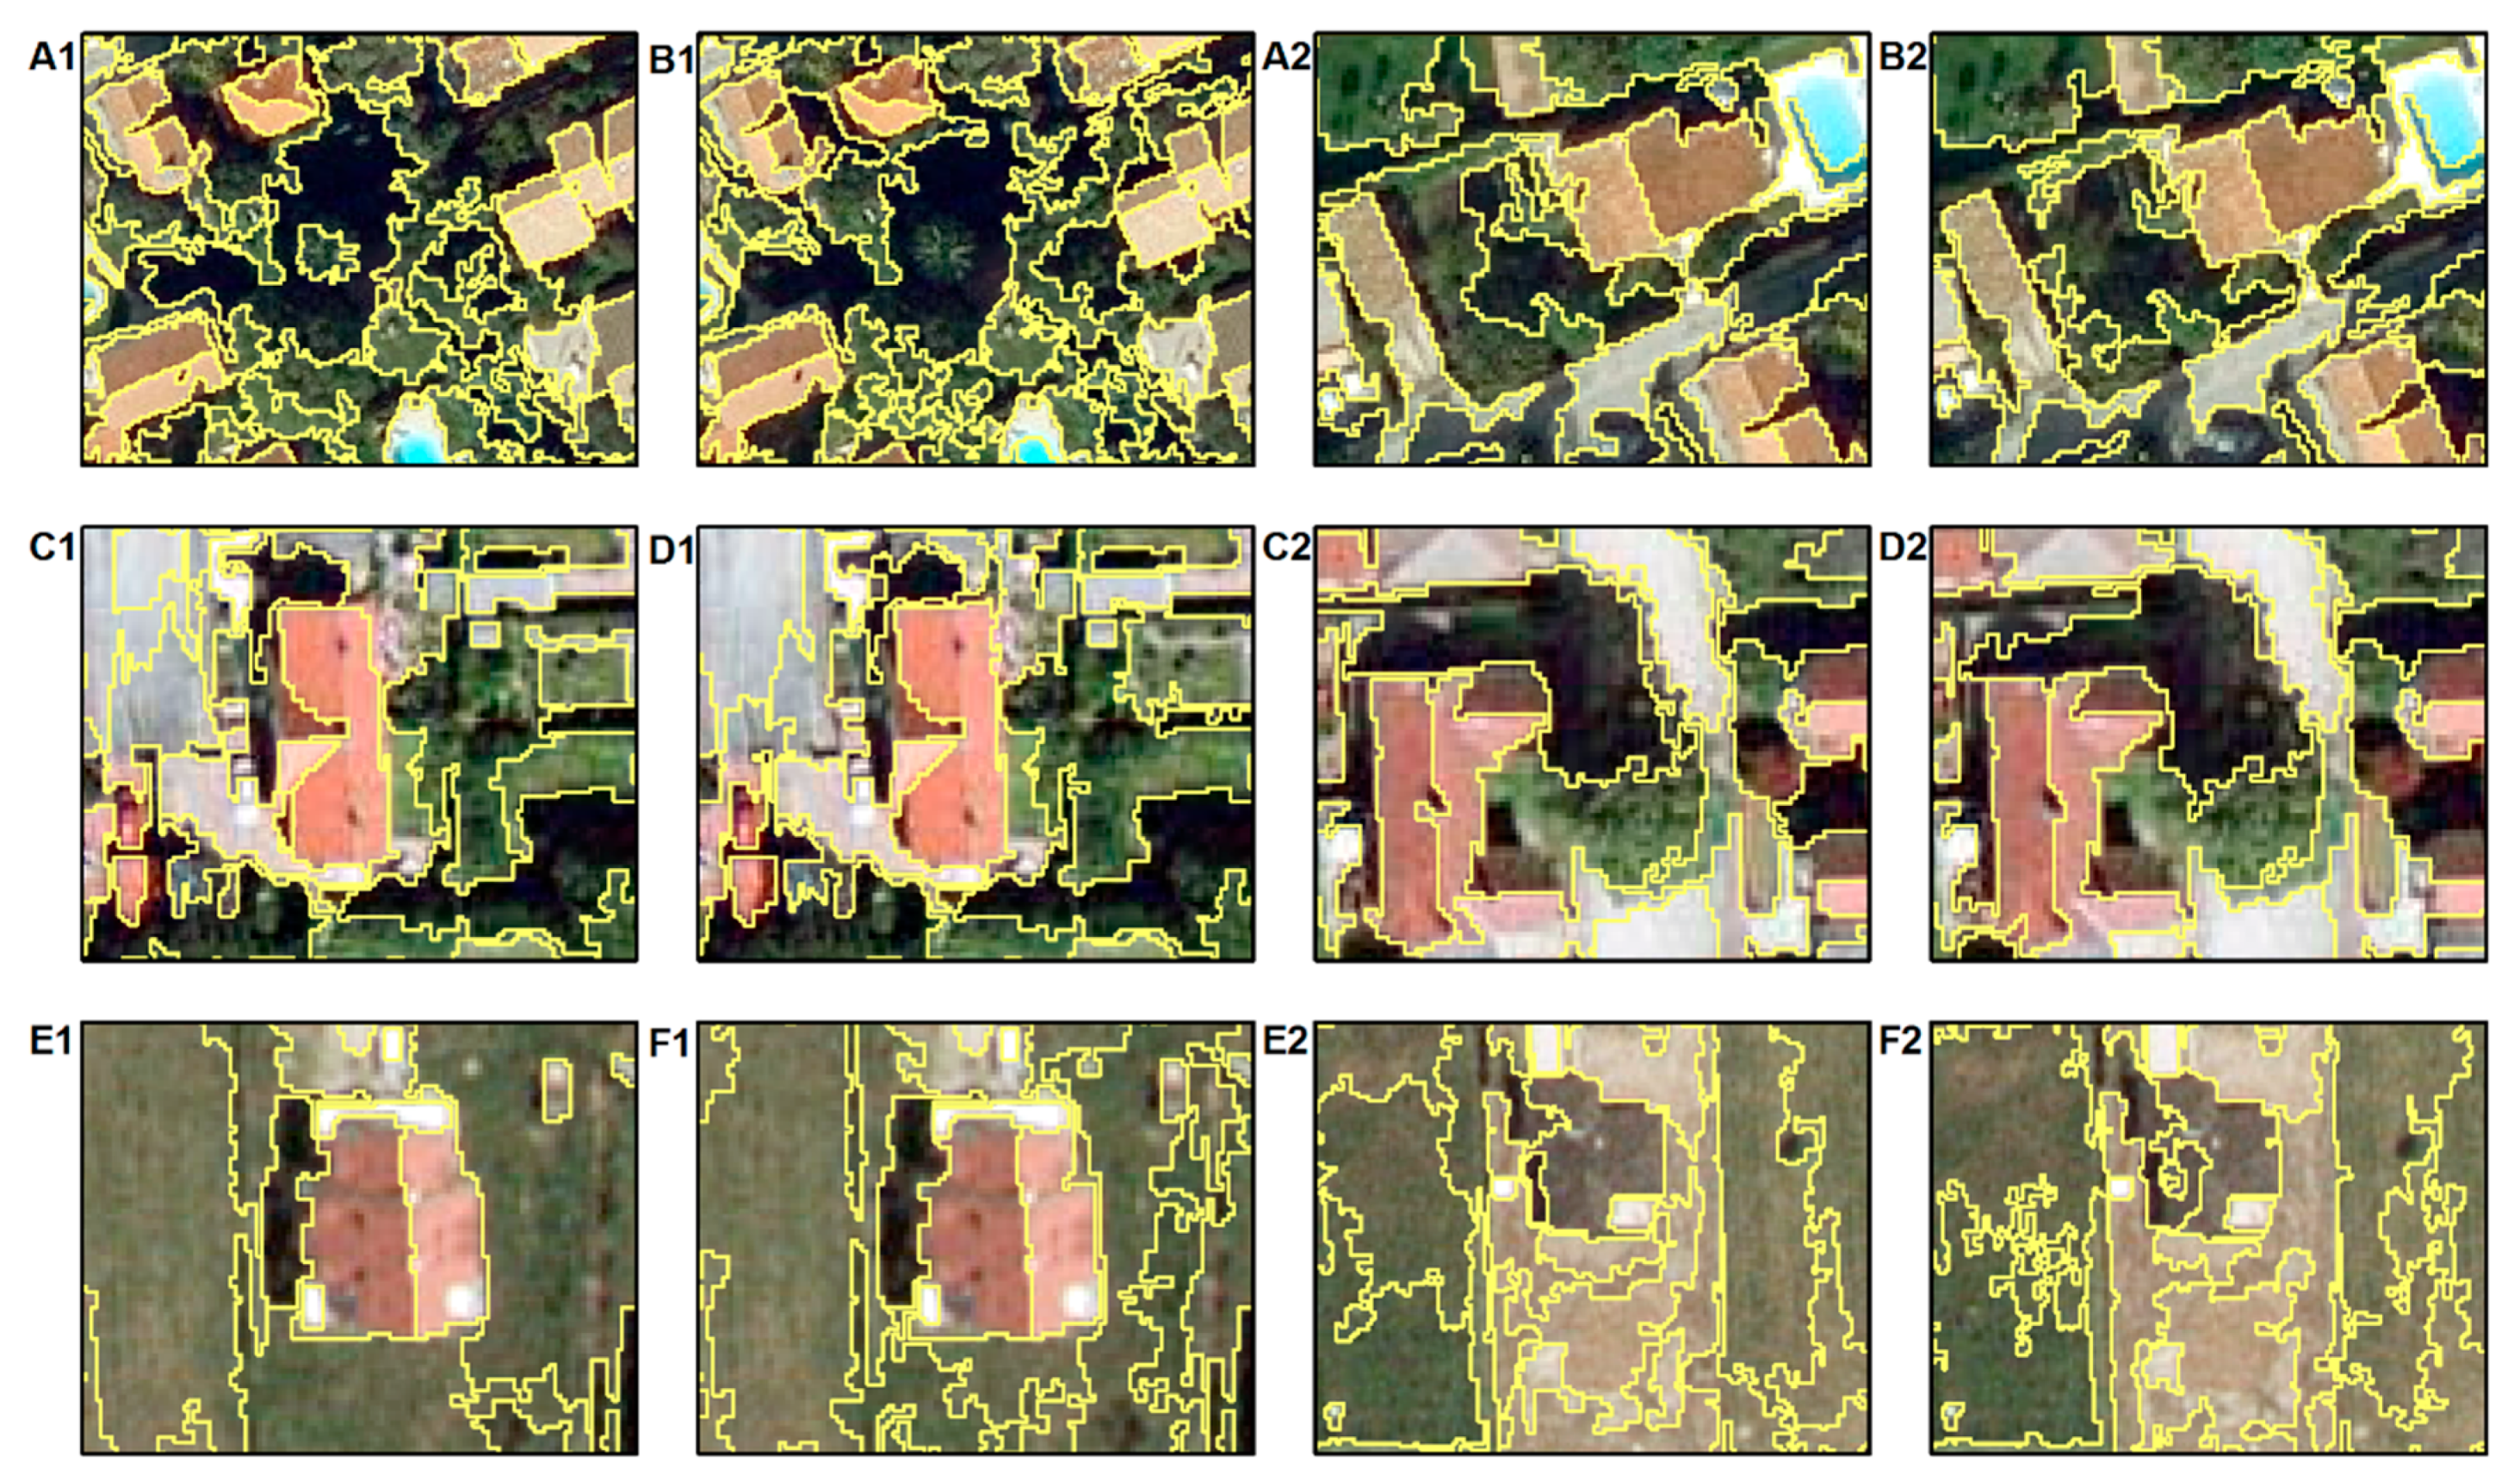
According to Figure 8, the segmentation results produced from MRS and Local do not show obvious differences. In order to validate the efficiency of the Local method, the same two subsets (Figure 9) from each image selected by Wang et al. [12] were examined visually in this study. The superiority of the Local method in segmenting tree clusters compared to the MRS method is evident in most cases. In subset B1 (Figure 8 and Figure 9), the Local method produced a segment, which captures as a whole the tree cluster. On the contrary, MRS over-segmented the same tree cluster in subset A1 (Figure 8 and Figure 9). Both, the MRS and the Local methods showed similar performances in the segmentation of buildings. However, MRS failed to distinguish several rooftops from their surrounding trees. Specifically, the shaded parts of the rooftops on the upper left side of subset A1 and the lower right side of subset B2 (Figure 8 and Figure 9) were merged with their adjacent tree clusters.
4. Discussion
In this study, we proposed a novel region merging segmentation method with local SP values, defined by local intra- and inter-object heterogeneity measures. The proposed method has been proven to be able to: (1) Produce objects, which are internally homogeneous and distinguishable from their neighboring objects; (2) it can create various scale segmentations and delineate more reference objects than other region merging segmentation methods with global SP values; and (3) it can handle both spectral and elevation data.
There are studies assessing the efficiency of various region- merging and growing segmentation methods with spectral data [4,38]. Almost all existing region-merging and region-growing methods have been compared in these studies and they have shown that the MRS is the most efficient one. For this reason, it was decided to compare the results of the proposed segmentation method only with the results produced from the MRS. Additionally, MRS is also the most efficient method for the segmentation of elevation data, because it can perform best for the detection of morphological discontinuities according to Van Niekerk [33].
The assessment of the segmentation results with the unsupervised segmentation evaluation method showed that the proposed method with local SPs outperformed the MRS and the Global in the production of objects with maximized average internal homogeneity and external heterogeneity. In the case of the segmentation of elevation data with the Local method, the average external heterogeneity is maximized with a larger rate than the MRS segmentation. This fact proves that the Local method, which incorporated local intra- and inter-segment heterogeneity measures within the definition of local SP is more sensitive to morphological discontinuities in DEMs than segmentation methods with Global SP, like MRS.
The visual difference among the results from the segmentation of the spectral data with the Local, Global, and MRS segmentation methods is not significant, and the differences are mainly reflected locally as shown in Figure 3, Figure 8, and Figure 9. The proposed Local method is more efficient in segmenting tree clusters and grassland areas as one object in comparison to MRS, while the performance of both methods in the building delimitation is visually similar. This is the reason why the supervised evaluation results for the three methods are almost similar in the case of building delimitation with spectral data. In the case of impact crater delimitation, the area-based and the arithmetic dissimilarity measures for the results produced by the Local method were lower than the measures of the other two methods. Indicatively, the MR values of the results from the Local method for both applications were the lowest among the three methods. The ability of the Local method to capture more reference objects and in combination with the use of multiscale optimization methods, in order to select optimum segmentation scales, could help towards the development of more efficient classification methods with a reduced error of omission [39].
The unsupervised evaluation of the segmentation results for the SZTAKI-INRIA building detection dataset [13] showed that the proposed Local method outperformed the FLSA of Robinson et al. [37] and the hybrid OHRH of Wang et al. [12]. Both FLSA and OHRH methods showed increased over-segmentation in contrast to Local and MRS methods. The superiority of Local and MRS over FLSA and OHRH proves that the use of Baatz and Schäpe criterion [5] as MC is more efficient than the FLSA criterion [37] and the OHRH criterion [12] for the segmentation of high resolution remote sensing images.
Another desirable property of the proposed method is its ability to segment efficiently remote sensing data without the need of initial image objects acquired from a presegmentation step, like hybrid methods. Wang et al. [12] have shown that the quality of the initial segments is critical for the performance of hybrid segmentation methods. The fact that the proposed Local method outperformed the hybrid OHRH method of Wang et al. [12] answers the question of how efficient is the incorporation of local heterogeneity measures within the merging process of a pure region merging segmentation method without the need of initial objects.
The proposed Local region-merging method followed a methodology, which is similar to the one employed by Johnson and Xie [9] for the post-segmentation refinement of under- and over-segmented objects derived from segmentations with optimal settings. However, the Local method incorporated within the merging process the local heterogeneity measures used by Johnson and Xie [9] to characterize the under-segmented and over-segmented objects. This fact enabled the automated and objective characterization and refinement of the objects during merging process. In the Johnson and Xie [9] approach, the identification and refinement of under-segmented and over-segmented objects require manual tuning by the user and pose their method as less objective.
Image segmentation is the first step of the OBIA workflow and is concerned with the generation of image objects from the remote sensing data. Image objects are the analysis unit for the subsequent classification steps and their quality affects the quality of the final classification results. Therefore, the development of segmentation methods that produce improved segmentation results can facilitate object-based classification approaches. The proposed Local method with local SPs was able to provide better segmentation results in terms of statistical measures and reference object detection. Thus, our proposed method has the potential to be applied to object-based approaches that employ multi-band spectral or elevation remote sensing data.
5. Conclusions
The purpose of this study was the development and evaluation of a region merging segmentation with local scale parameter values, defined by local intra- and inter-segment homogeneity measures. In order to show the effectiveness of the proposed method, a high spatial resolution remote sensing spectral and elevation dataset were employed to perform the experiments. Several supervised and unsupervised segmentation evaluation approaches were selected to perform the segmentation quality assessment and to compare the efficiency of the proposed method with other segmentation methods, including the well-known region merging MRS and the hybrid OHRH, which requires presegmented input data.
The proposed method was proven to be able to (1) produce internally homogeneous objects that were distinguishable from their neighbors and (2) to delineate more reference objects than the popular MRS method and the OHRH. Therefore, the incorporation of local heterogeneity measures within the merging process of a pure region merging segmentation method, which does not require presegmented input data, is considered more efficient than its relevant OHRH hybrid method. Furthermore, the Baatz and Schäpe criterion was proven to be a more efficient MC for region merging segmentations than the OHRH and FLSA criteria. The application of the proposed segmentation method to two different remote sensing applications and data demonstrated its potential to the creation of suitable image objects, which can be analyzed efficiently within the OBIA workflow.
Supplementary Materials
All Figures and experimental data are available online at https://www.mdpi.com/2072-4292/10/12/2024/s1.
Author Contributions
M.D. conceived the idea of the study, designed it and conducted the experiments. All authors contributed equally, analyzed the data, and prepared the manuscript.
Funding
This research received no external funding.
Acknowledgments
The authors would like to thank Csaba Benedek for providing the SZTAKI-INRIA building detection dataset and Tapas Martha for providing the impact crater reference dataset.
Conflicts of Interest
The authors declare no conflict of interest.
References
- Blaschke, T.; Hay, G.J.; Kelly, M.; Lang, S.; Hofmann, P.; Addink, E.; Feitosa, R.Q.; Meer, F.V.D.; Werff, H.V.D.; Coillie, F.V. Geographic object-based image analysis—Towards a new paradigm. ISPRS J. Photogramm. Remote Sens. 2014, 87, 180–191. [Google Scholar] [CrossRef] [PubMed]
- Hay, G.J.; Castilla, G. Geographic Object-Based Image Analysis (GEOBIA): A new name for a new discipline. In Object-Based Image Analysis—Spatial Concepts for Knowledge-Driven Remote Sensing Applications; Blaschke, T., Lang, S., Hay, G., Eds.; Springer: Heidelberg/Berlin, Germany; New York, NY, USA, 2008; pp. 75–89. [Google Scholar]
- Schiewe, J. Segmentation of high-resolution remotely sensed data-concepts, applications and problems. Int. Arch. Photogramm. Remote Sens. Spat. Inf. Sci. 2002, 4, 380–385. [Google Scholar]
- Meinel, G.; Neubert, M. A Comparison of segmentation programs for high resolution remote sensing data. Int. Arch. Photogramm. Remote Sens. Spat. Inf. Sci. 2004, 35, 1097–1102. [Google Scholar]
- Baatz, M.; Schäpe, A. Multiresolution Segmentation—An Optimization Approach for High Quality Multi-Scale Image Segmentation. In Angewandte Geographische Informations-Verarbeitung; Strobl, J., Blaschke, T., Griesebner, G., Eds.; Wichmanm Verlag: Karlsruhe, Germany, 2000; pp. 12–23. [Google Scholar]
- Kim, M.; Warner, T.A.; Madden, M.; Atkinson, D.S. Multi-scale GEOBIA with very high spatial resolution digital aerial imagery: Scale, texture and image objects. Int. J. Remote Sens. 2011, 32, 2825–2850. [Google Scholar] [CrossRef]
- Espindola, G.M.; Camara, G.; Reis, I.A.; Bins, L.S.; Monteiro, A.M. Parameter selection for region-growing image segmentation algorithms using spatial autocorrelation. Int. J. Remote Sens. 2006, 27, 3035–3040. [Google Scholar] [CrossRef]
- Liu, J.; Du, M.; Mao, Z. Scale computation on high spatial resolution remotely sensed imagery multi-scale segmentation. Int. J. Remote Sens. 2017, 38, 5186–5214. [Google Scholar] [CrossRef]
- Johnson, B.; Xie, Z. Unsupervised image segmentation evaluation and refinement using a multi-scale approach. ISPRS J. Photogramm. Remote Sens. 2011, 66, 473–483. [Google Scholar] [CrossRef]
- Chen, J.; Deng, M.; Mei, X.M.; Chen, T.Q.; Shao, Q.B.; Hong, L. Optimal segmentation of a high-resolution remote-sensing image guided by area and boundary. Int. J. Remote Sens. 2014, 35, 6914–6939. [Google Scholar] [CrossRef]
- Yang, J.; He, Y.H.; Caspersen, J. Region merging using local spectral angle thresholds: A more accurate method for hybrid segmentation of remote sensing images. Remote Sens. Environ. 2017, 190, 137–148. [Google Scholar] [CrossRef]
- Wang, Y.; Meng, Q.; Qi, Q.; Yang, J.; Liu, Y. Region merging considering within- and between-segment heterogeneity: An improved hybrid remote-sensing image segmentation method. Remote Sens. 2018, 10, 781. [Google Scholar] [CrossRef]
- Benedek, C.; Descombes, X.; Zerubia, J. Building Development Monitoring in Multitemporal Remotely Sensed Image Pairs with Stochastic Birth-Death Dynamics. IEEE Trans. Pattern Anal. Mach. Intell. 2012, 34, 33–50. [Google Scholar] [CrossRef] [PubMed] [Green Version]
- Tilton, J.C.; Tarabalka, Y.; Montesano, P.M.; Gofman, E. Best merge region-growing segmentation with integrated nonadjacent region object aggregation. IEEE Trans. Geosci. Remote 2012, 50, 4454–4467. [Google Scholar] [CrossRef]
- Anselin, L. Local indicators of spatial association: LISA. Geogr. Anal. 1995, 27, 93–115. [Google Scholar] [CrossRef]
- Drăguţ, L.; Tiede, D.; Levick, S. ESP: A tool to estimate scale parameters for multiresolution image segmentation of remotely sensed data. Int. J. Geogr. Inf. Sci. 2010, 24, 859–871. [Google Scholar] [CrossRef]
- Woodcock, C.; Strahler, A. The factor of scale in remote sensing. Remote Sens. Environ. 1987, 21, 311–332. [Google Scholar] [CrossRef]
- Lassalle, P.; Inglada, J.; Michel, J.; Grizonnet, M. A scalable tile-based framework for region-merging segmentation. IEEE Trans. Geosci. Remote 2015, 53, 5473–5485. [Google Scholar] [CrossRef]
- Zhang, X.L.; Xiao, P.F.; Feng, X.Z.; Wang, J.G.; Wang, Z. Hybrid region merging method for segmentation of high-resolution remote sensing images. ISPRS J. Photogramm. 2014, 98, 19–28. [Google Scholar] [CrossRef]
- Clinton, N.; Holt, A.; Scarborough, J.; Yan, L.; Gong, P. Accuracy assessment measures for object-based image segmentation goodness. Photogramm. Eng. Remote Sens. 2010, 76, 289–299. [Google Scholar] [CrossRef]
- Lucieer, A.; Stein, A. Existential uncertainty of spatial objects segmented from satellite sensor imagery. IEEE Trans. Geosci. Remote 2002, 40, 2518–2521. [Google Scholar] [CrossRef]
- Zhang, X.; Feng, X.; Xiao, P.; He, G.; Zhu, L. Segmentation quality evaluation using region-based precision and recall measures for remote sensing images. ISPRS J. Photogramm. Remote Sens. 2015, 102, 73–84. [Google Scholar] [CrossRef]
- Johnson, B.A.; Bragais, M.; Endo, I.; Magcale-Macandog, D.B.; Macandog, P.B.M. Image segmentationparameter optimization considering within- and between-segment heterogeneity at multiple scale levels: Test case for mapping residential areas using landsat imagery. ISPRS Int. J. Geo-Inf. 2015, 4, 2292–2305. [Google Scholar] [CrossRef]
- Tsai, Y.H.; Stow, D.; Weeks, J. Comparison of Object-Based Image Analysis approaches to mapping new buildings in Accra, Ghana Using multi-temporal QuickBird satellite imagery. Remote Sens. 2011, 3, 2707–2726. [Google Scholar] [CrossRef]
- Doxani, G.; Karantzalos, K.; Tsakiri-Strati, M. Object-based building change detection from a single multispectral image and pre-existing geospatial information. Photogramm. Eng. Remote Sens. 2015, 81, 481–489. [Google Scholar] [CrossRef]
- Mnih, V. Machine Learning for Aerial Image Labeling. Ph.D. Thesis, University of Toronto, Toronto, ON, Canada, 2013. [Google Scholar]
- Drăguţ, L.; Blaschke, T. Automated classification of landform elements using object-based image analysis. Geomorphology 2006, 81, 330–344. [Google Scholar] [CrossRef]
- Van Asselen, S.; Seijmonsbergen, A.C. Expert-driven semi-automated geomorphological mapping for a mountainous area using a laser DTM. Geomorphology 2006, 78, 309–320. [Google Scholar] [CrossRef]
- Miliaresis, G.C.; Argialas, D.P. Segmentation of physiographic features from the global digital elevation model/GTOPO30. Comput. Geosci. 1999, 25, 715–728. [Google Scholar] [CrossRef]
- MacMillan, R.A.; Pettapiece, W.W.; Nolan, S.C.; Goddard, T.W. A generic procedure for automatically segmenting landforms into landform elements using DEMs, heuristic rules and fuzzy logic. Fuzzy Sets Syst. 2000, 113, 81–109. [Google Scholar] [CrossRef]
- Miliaresis, G.C. Geomorphometric mapping of Zagros Ranges at regional scale. Comput. Geosci. 2001, 27, 775–786. [Google Scholar] [CrossRef]
- Blaschke, T.; Strobl, J. Defining landscape units through integrated morphometric characteristics. In Landscape Modelling: Digital Techniques for Landscape Architecture; Buhmann, E., Ervin, S., Eds.; Wichmann-Verlag: Heidelberg, Germany, 2003; pp. 104–113. [Google Scholar]
- Van Niekerk, A. A comparison of land unit delineation techniques for land evaluation in the Western Cape, South Africa. Land Use Policy 2010, 27, 937–945. [Google Scholar] [CrossRef] [Green Version]
- Eisank, C.; Smith, M.; Hillier, J. Assessment of multiresolution segmentation for delimiting drumlins in digital elevation models. Geomorphology 2014, 214, 452–464. [Google Scholar] [CrossRef] [Green Version]
- Vamshi, G.T.; Martha, T.R.; Kumar, K.V. An object-based classification method for automatic detection of lunar impact craters from topographic data. Adv. Space Res. 2016, 57, 1978–1988. [Google Scholar] [CrossRef]
- Robinson, M.S.; Brylow, S.M.; Tschimmel, M.; Humm, D.; Lawrence, S.J.; Thomas, P.C.; Denevi, B.W.; Bowman-Cisneros, E.; Zerr, J.; Caplinger, M.A.; et al. Lunar Reconnaissance Orbiter Camera (LROC) instrument overview. Space Sci. Rev. 2010, 150, 81–124. [Google Scholar] [CrossRef]
- Robinson, D.J.; Redding, N.J.; Crisp, D.J. Implementation of a Fast Algorithm for Segmenting SAR Imagery; DSTO-TR-1242; Defence Science Technology Organisation: Fairbairn, Australia, 2002.
- Neubert, M.; Herold, H.; Meinel, G. Assessing image segmentation quality—Concepts, methods and application. In Object-based Image Analysis—Spatial Concepts for Knowledge-Driven Remote Sensing Applications; Blaschke, T., Lang, S., Hay, G., Eds.; Springer: Heidelberg/Berlin, Germany; New York, NY, USA, 2008; pp. 769–784. [Google Scholar]
- Congalton, R.G. A review of assessing the accuracy of classifications of remotely sensed data. Remote Sens. Environ. 1991, 37, 35–46. [Google Scholar] [CrossRef]
Figure 1.
Region merging with local scale parameters workflow.

Figure 2.
The performance of the three segmentation methods according to the three-band average (A) weighted variance (wVar) and (B) Moran’s I values.
Figure 2.
The performance of the three segmentation methods according to the three-band average (A) weighted variance (wVar) and (B) Moran’s I values.

Figure 3.
(A) The spectral data overlapped by the reference building dataset. The segmentation results for building delimitation from spectral data produced by three methods: (B) MRS (SPglobal = 60), (C) region merging with global SP (SPglobal = 50), and (D) region merging with local SPs (SPglobal = 50)), using the optimum SPglobal indicated by the unsupervised evaluation.

Figure 4.
The supervised evaluation results for the segmentations of spectral data produced from three segmentation methods (MRS, Global, and Local) according to the discrepancy measures: (A) Area fit index; (B) quality rate; (C) over segmentation; (D) under segmentation; (E) combined over and under-segmentation; and (F) miss Rate.

Figure 5.
The performance of the three segmentation methods according to the three-band average (A) weighted variance (wVar) and (B) Moran’s I values.
Figure 5.
The performance of the three segmentation methods according to the three-band average (A) weighted variance (wVar) and (B) Moran’s I values.

Figure 6.
The supervised evaluation results for the segmentations of elevation data produced from three segmentation methods (MRS, Global, and Local) according to the discrepancy measures: (A) Area fit index; (B) quality rate; (C) over segmentation; (D) under segmentation; (E) combined over and under-segmentation; and (F) miss Rate.

Figure 7.
(A) Reference impact crater polygons overlapping the 5 m DEM (in red). (B–D): The intersection maps with classified areas of overlap, over- and under-estimation of objects produced by (B) MRS (SPglobal = 10), (C) Global (SPglobal = 30), and (D) Local (SPglobal = 10).
Figure 7.
(A) Reference impact crater polygons overlapping the 5 m DEM (in red). (B–D): The intersection maps with classified areas of overlap, over- and under-estimation of objects produced by (B) MRS (SPglobal = 10), (C) Global (SPglobal = 30), and (D) Local (SPglobal = 10).

Figure 8.
The segmentation results produced by MRS and Local using the SZDAKI-INRIA building detection dataset.
Figure 8.
The segmentation results produced by MRS and Local using the SZDAKI-INRIA building detection dataset.

Figure 9.
Subsets of segmentations in Figure 8, where the first and third columns illustrate the MRS results and the other columns the Local results.
Figure 9.
Subsets of segmentations in Figure 8, where the first and third columns illustrate the MRS results and the other columns the Local results.


Table 1.
The unsupervised evaluation results for the best segmentations of the SZTAKI-INRIA building detection dataset produced by MRS, Global, Local, OHRH, and FLSA methods.
Table 1.
The unsupervised evaluation results for the best segmentations of the SZTAKI-INRIA building detection dataset produced by MRS, Global, Local, OHRH, and FLSA methods.
| Image | OGf | ||||
|---|---|---|---|---|---|
| MRS | Global | Local | OHRH 1 | FLSA 1 | |
| Côte d’Azur | 0.7224 | 0.7674 | 0.7375 | 0.5864 | 0.5902 |
| Manchester | 0.7648 | 0.7780 | 0.7923 | 0.5151 | 0.5012 |
| Szada | 0.7823 | 0.7996 | 0.7967 | 0.6983 | 0.6794 |
1 Evaluation results from Wang et al. [12].
© 2018 by the authors. Licensee MDPI, Basel, Switzerland. This article is an open access article distributed under the terms and conditions of the Creative Commons Attribution (CC BY) license (http://creativecommons.org/licenses/by/4.0/).
Share and Cite
MDPI and ACS Style
Dekavalla, M.; Argialas, D. A Region Merging Segmentation with Local Scale Parameters: Applications to Spectral and Elevation Data. Remote Sens. 2018, 10, 2024. https://0-doi-org.brum.beds.ac.uk/10.3390/rs10122024
AMA Style
Dekavalla M, Argialas D. A Region Merging Segmentation with Local Scale Parameters: Applications to Spectral and Elevation Data. Remote Sensing. 2018; 10(12):2024. https://0-doi-org.brum.beds.ac.uk/10.3390/rs10122024
Chicago/Turabian StyleDekavalla, Maria, and Demetre Argialas. 2018. "A Region Merging Segmentation with Local Scale Parameters: Applications to Spectral and Elevation Data" Remote Sensing 10, no. 12: 2024. https://0-doi-org.brum.beds.ac.uk/10.3390/rs10122024
Note that from the first issue of 2016, this journal uses article numbers instead of page numbers. See further details here.