1. Introduction
The current NDACC (Network for the Detection of Atmospheric Composition Change) mandatory gases are O
3, HCl, HF, ClONO
2, HNO
3, N
2O, CH
4, CO, C
2H
6, and HCN, which have been observed globally for more than 20 years and are extensively used in atmospheric physics and chemistry [
1,
2,
3,
4,
5,
6,
7,
8,
9,
10]. Within the NDACC network, the solar spectra are acquired with similar instruments and are then processed with dedicated algorithms [
11], which ensures consistent results between different FTIR (Fourier transform infrared) sites. However, the instrumental line shape (ILS) of the FTIR spectrometers may drift slowly due to mechanical degradation over time or may change abruptly because of operator intervention [
12]. Moreover, Sun et al. (2017) found that the ILS status is dependent on the optical settings, because the mechanical errors between different field stops may be inconsistent [
13]. The routine observation may change the entrance field stop size if incident radiation changes, which may introduce inconsistency into ILS. All of these misalignments will result in biases if not properly characterized.
Depending on the degrees of freedom (DOFs) of the retrievals, the total columns of certain NDACC gases, like O
3, CH
4, CO, and N
2O, can be divided into multiple independent partial columns [
8,
9,
14]. In certain circumstances, such as validation of chemical model simulations or satellite observations or source/sink/trend estimations, the partial column is more useful than the total column because it is only integrated over the most relevant layers and eliminates the influence from the layers below and/or above [
8]. Vigouroux et al. (2008, 2015) divided the O
3 measurements at eight NDACC FTIR stations, namely, Ny-Ålesund (79°N), Thule (77°N), Kiruna (68°N), Harestua (60°N), Jungfraujoch (47°N), Izaña (28°N), Wollongong (34°S), and Lauder (45°S), into four independent partial columns, one in the troposphere and three in the stratosphere up to about 45 km. These O
3 partial columns were validated with the coincident Sondes or LIDAR data and were then used for the investigation of O
3 trends and variabilities [
8,
15]. Zhou et al. (2018) studied the atmospheric CO and CH
4 variability with the partial column times series measured with FTIR spectrometers at two sites (St Denis and Maïdo) on Reunion Island (21°S) in the Indian Ocean. Meanwhile, these partial column times series were compared to the in situ measurements, the GEOS-Chem model simulations, and the Michelson Interferometer for Passive Atmospheric Sounding (MIPAS) satellite measurements [
16]. García et al., (2018) used the NDACC FTIR measurements made between 2007 and 2017 in subtropical Izaña (28°N), the mid-latitude station of Karlsruhe (49°N) and the Kiruna polar site (68°N) for the validation of the IASI (Infrared Atmospheric Sounding Interferometer) CH
4 and N
2O partial column products [
17].
Sun et al (2018) investigated the influence of ILS degradation on the total column of all current NDACC mandatory gases and deduced the range of ILS deviations that can be acceptable [
18]. However, these deductions do not apply to the partial column that is integrated over each independent layer because the sensitivity of the profiles of all NDACC gases to ILS degradation is not constant at different altitudes (
Figures S1 and S2). This altitude-dependent sensitivity influences the partial columns differently. Accurate knowledge of this influence is beneficial to minimize the time-to-time and site-to-site biases, which can minimize the propagation error in either the validation of chemical model simulations or satellite observations or source/sink/trend estimations [
19]. Currently, the influence of ILS degradation on the partial columns of the NDACC gases is still not fully quantified.
This paper investigates the influence of ILS degradation on the partial columns of O3, CO, CH4, and N2O derived from high-resolution FTIR spectrometry and deduces the range of the ILS degradation corresponding to the acceptable uncertainties of O3, CO, CH4, and N2O results.
2. Theoretical Analysis
2.1. The Influence of ILS Degradation
The measured spectra were the Fourier transform of the interferogram recorded by the FTIR instrument. The ILS is the Fourier transform of the weighting applied to the interferogram. This weighting consists of two parts: an artificially applied part to change the spectrum and an unavoidable part which is due to the fact that the interferogram is finite in length (box car function), the divergence of the beam is non-zero (due to the non-zero entrance aperture), and several other effects which are due to misalignment ([
20], Chapter 9).
We used the latest version of the SFIT4 (version 0.9.4.4) algorithm to perform profile retrieval [
1]. The basic principle of SFIT4 is the use of an Optimal Estimation Method (OEM) to fit the calculated-to-measured spectra with an iterative Gauss–Newton scheme [
21]. The SFIT4 includes a nonlinear least-squares spectral fitting subroutine that iteratively generates forward-modelled spectra until the best fit to the measured spectrum is achieved. This iteration process can be expressed as
where
and
are the calculated and measured spectra at the n spectral point, respectively;
is the atmospheric top layer spectrum;
is the atmospheric transmittance spectrum; C is the continuum level; S is the continuum tilt across a window;
is the spectral frequency drift;
is the center frequency of the chosen spectral window;
is the instrument line shape function;
is the offset at zero path difference; m is the number of spectral sampling points; and
is called fitting residuals. The
is related to the absorption cross section
by
where k refers to the k-th absorber and
is its concentration. According to Rodgers (2000), the optimal estimation solution for profile x, the DOF d
s, and the total error T
err with the iterative Gauss−Newton scheme can be expressed as
where F(x
i) is the forward model calculation; S
a is the a priori covariance matrix; x
a is the a priori state vector; S
ε is the measurement noise error covariance matrix; K
i is the Jacobian matrix which links the measurement vector y to the state vector x
i:
; E
s is the smoothing error calculated via Equation (7); E
m is the measurement error calculated via Equation (8); and E
b is the forward model parameter error calculated via Equation (9) ([
21], Chapter 3).
For a perfectly aligned spectrometer, the ILS might be close to the theoretical limit, and the measured spectra can be well reproduced by the synthetic spectra calculated with an ideal ILS. However, if an FTIR spectrometer is subject to misalignment, the resulting ILS degradation could affect the calculated spectra and therefore cause the retrieval to reach convergence with the wrong atmospheric status. The xa and Sa are independent of the ILS because they are a priori parameters. The Sε and Sb depend on the ILS, since the ILS is part of the forward model calculation and can introduce correlations among the different spectral points, causing non-diagonal matrices of Sε and Sb. The Jacobians also depend on the ILS because they represent the sensitivity of the spectra to the atmospheric status, and the analyzed spectra depend on the ILS.
If we assume that the number of iterations is j, and S
ε, S
b, and K
b turn into
,
, and
, respectively, when using an error ILS, the resulting biases for x, the DOFs, and the total error can be expressed as
where
,
, and
are calculated via Equations (7)–(9) using
,
, and
. In the partial profiles of the DOFs and error calculation, the elements of the corresponding matrices are set to zero for the altitudes outside of the concerned partial layer boundaries. The partial column between altitudes z
1 and z
2 is calculated by integrating profile x by Equation (14), where A
m is the air-mass profile derived from the FTIR retrievals:
2.2. The Influence of Reference Selection
In this study, the fractional difference (%D) is defined by Equation (15):
where X represents either the partial column, partial DOFs, or partial error deduced with a degraded ILS. X
ref is the same as X but is deduced with a nominal ideal ILS. We used the results with an ideal ILS as the reference. If the ILS of the actual measurements deviates from ideal conditions, it will cause an offset to both X and X
ref. Assuming the offset is Δ, then Equation (15) turns into Equation (16). The NDACC network regularly performs cell measurements to diagnose misalignment of the spectrometer and to realign the instrument when indicated [
11]. For a perfectly aligned spectrometer, (X
ref – Δ) is close to X
ref, and thus, the influence of ideal condition selection as the reference is of secondary significance (%D ≈
).
3. Experiment Description
3.1. Experimental Scheme
We used the program ALIGN60 to simulate ILS degradation in a high resolution FTIR spectrometer. The ALIGN60 is a raytracing model for FTIR spectrometers following the classical Michelson design, assuming one fixed and one movable arm, and using cube corners instead of plane mirrors. It calculates the resulting phase distortions in the recombined beam and from these deduces the variable intensity observed by the detector. The ALIGN60 takes into account the lateral shear error of the movable retro-reflector as a function of the OPD (optical path difference), a decenter of the field stop with respect to the optical axis, an unsharp boundary line, or deformation of the field stop image (possibly caused by a defocused collimator), and vignetting effects with increasing OPD. It can generate trustworthy results with respect to all types of misalignment [
22,
23,
24]. The ILS degradation can be regarded as positive modulation efficiency (ME) degradation if its amplitude is larger than unity or negative ME degradation if it is less than unity [
22,
23,
24]. Sun et al. (2018) compared the influences of typical types of ILS degradation (denoted as ILS a to j in
Table 1 in Sun et al. (2018)) on the total columns of all NDACC gases, and found that, for positive ME, the ILS j generally causes the maximal influence, and for negative ME, the ILS i causes the maximal influence [
18]. The ILS i, as a consequence of cosine and sine bending of the moveable arm, causes a chordal increase in misalignment within the first half of OPD and causes a chordal decrease in misalignment within the second half of OPD. The ILS j, as a consequence of constant shear plus cosine and sine bending of the movable arm, causes a chordal decrease in misalignment within the first half of OPD and causes a chordal increase in misalignment within the second half of OPD. This study selected ILS i and j to represent negative and positive ME, respectively, to investigate the influence of ILS degradation on partial columns of O
3, CO, CH
4, and N
2O.
By perturbing the input parameters included into the ALIGN60, we simulated seven levels of ILS i (ranging from −4% to −28% as shown in
Figure S3) and ILS j (ranging from 4% to 28% as shown in
Figure S4). We then incorporated them into the SFIT forward model in sequence and calculated the fractional difference (D%) in the partial column, partial error, and partial DOFs of each gas relative to the retrieval with an ideal ILS. We first performed a case study by selecting only one typical spectrum for each gas, and then we evaluated the consistency of the resulting deduction with one year of measurements.
Table 1 reports the characteristics of the spectra used in the case study. The spectra were randomly selected from routine measurements in clear sky on February 16, 2016. The spectra used in the consistency evaluation were from August 2015 to August 2016, and spanned a large range of gas concentrations, solar zenith angles (SZAs), atmospheric humidity, surface pressures, temperatures, wind speeds, and wind directions (
Figure S5). All actual ILS degradations of the FTIR spectrometer within the selected period were less than 2% and can be regarded as ideal. The tropopause height for Hefei derived from the National Centers for Environmental Protection (NCEP) database was 15.1 km with a standard deviation (1σ) of 1.1 km.
3.2. Retrieval Strategy
The retrieval settings for O
3, CO, CH
4, and N
2O followed the NDACC standard conventions [
25]. All spectroscopic line parameters were adopted from HITRAN 2008 [
1]. A priori profiles of all gases except H
2O were from a dedicated WACCM (Whole Atmosphere Community Climate Model) run. A priori profiles of pressure, temperature and H
2O were interpolated from the National Centers for Environmental Protection and National Center for Atmospheric Research (NCEP/NCAR) reanalysis [
25]. We assumed S
ε to be diagonal, and set its diagonal elements to the inverse square of the signal-to-noise ratio (SNR) of the fitted spectra and its non-diagonal elements to zero. For all gases, the diagonal elements of S
a were set to the standard deviation of a dedicated WACCM run from 1980 to 2020, and its non-diagonal elements were set to zero.
We defined the layers by summing up the diagonal entries of the averaging kernel matrix from the surface up to higher altitudes. Whenever 1.0 was reached a new layer was started; i.e., for each layer the DOFs were at least 1.0. This has been used in several previous studies in order to get a product that is mainly determined by the measurements and only weakly affected by the a priori information [
8,
15,
19].
Table 2 summarizes typical total DOFs and the sensitivity ranges (the sensitivity is larger than 0.5) of the retrieved O
3, CO, CH
4, and N
2O profiles in Hefei, China. The partial DOFs and altitude ranges obtained at each partial layer are also added in
Table 2. The retrieved profiles of O
3, CO, CH
4, and N
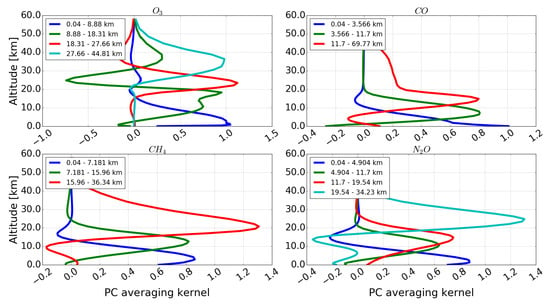
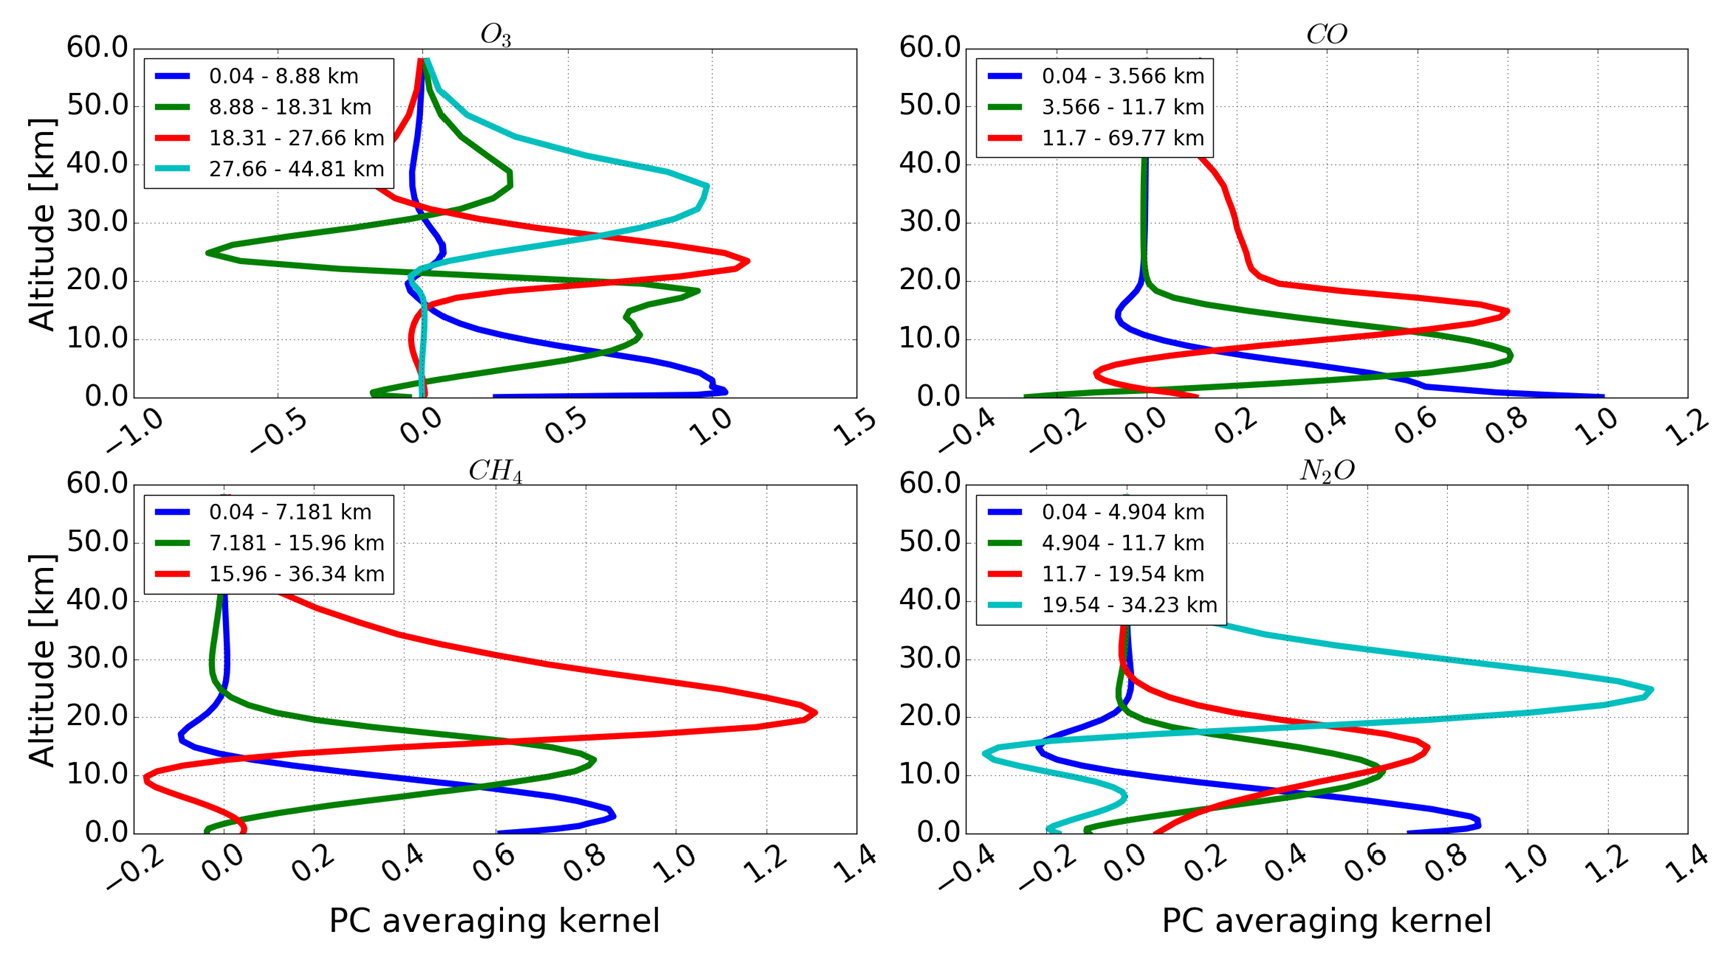
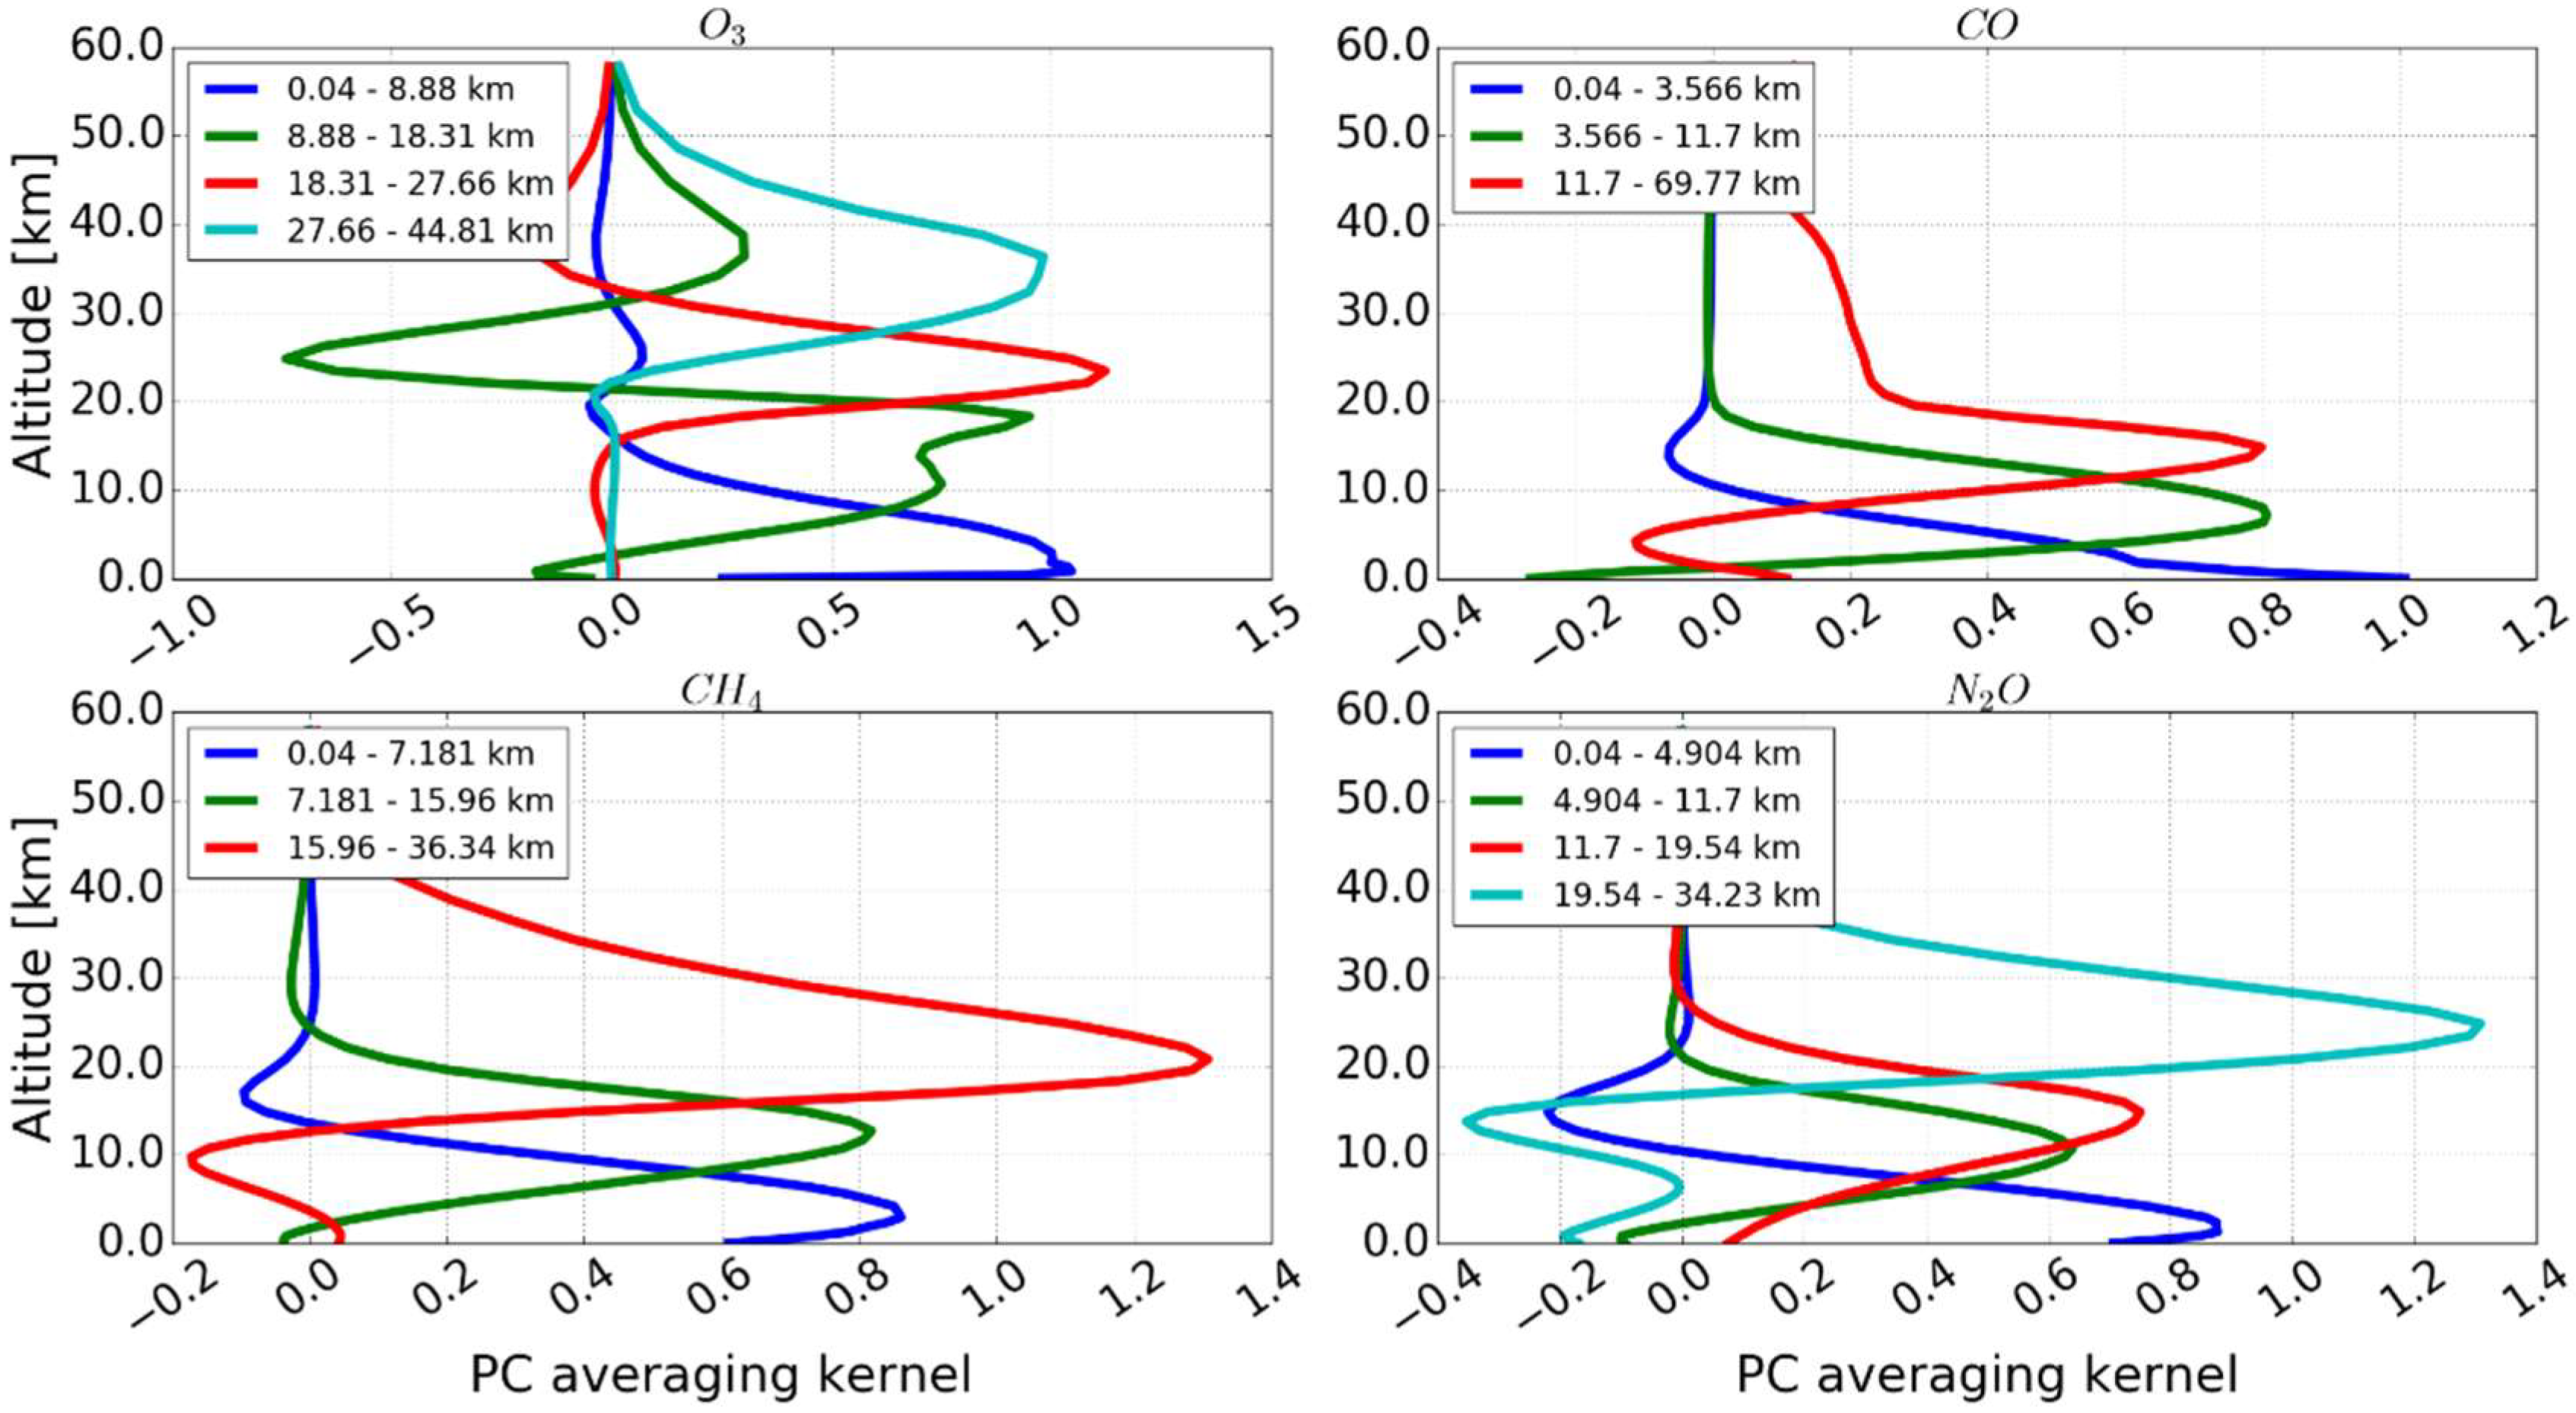
2O were separated into four, three, three, and four partial layers, respectively. The thus defined layers were independent on the basis of the resolution of the averaging kernels, as can be seen in
Figure 1, where the partial column averaging kernels (PAVKs) of the four gases are given. Their PAVKs were resolved at their FWHM (Full Width at Half Maximum), where the averaging kernels peaked at the right altitude; i.e., at the middle of the chosen layer ranges.
4. Sensitivity Study
Figure 2,
Figure 3,
Figure 4 and
Figure 5 show the sensitivities of the partial column, partial error, and partial DOFs at each partial layer for O
3, CO, CH
4, and N
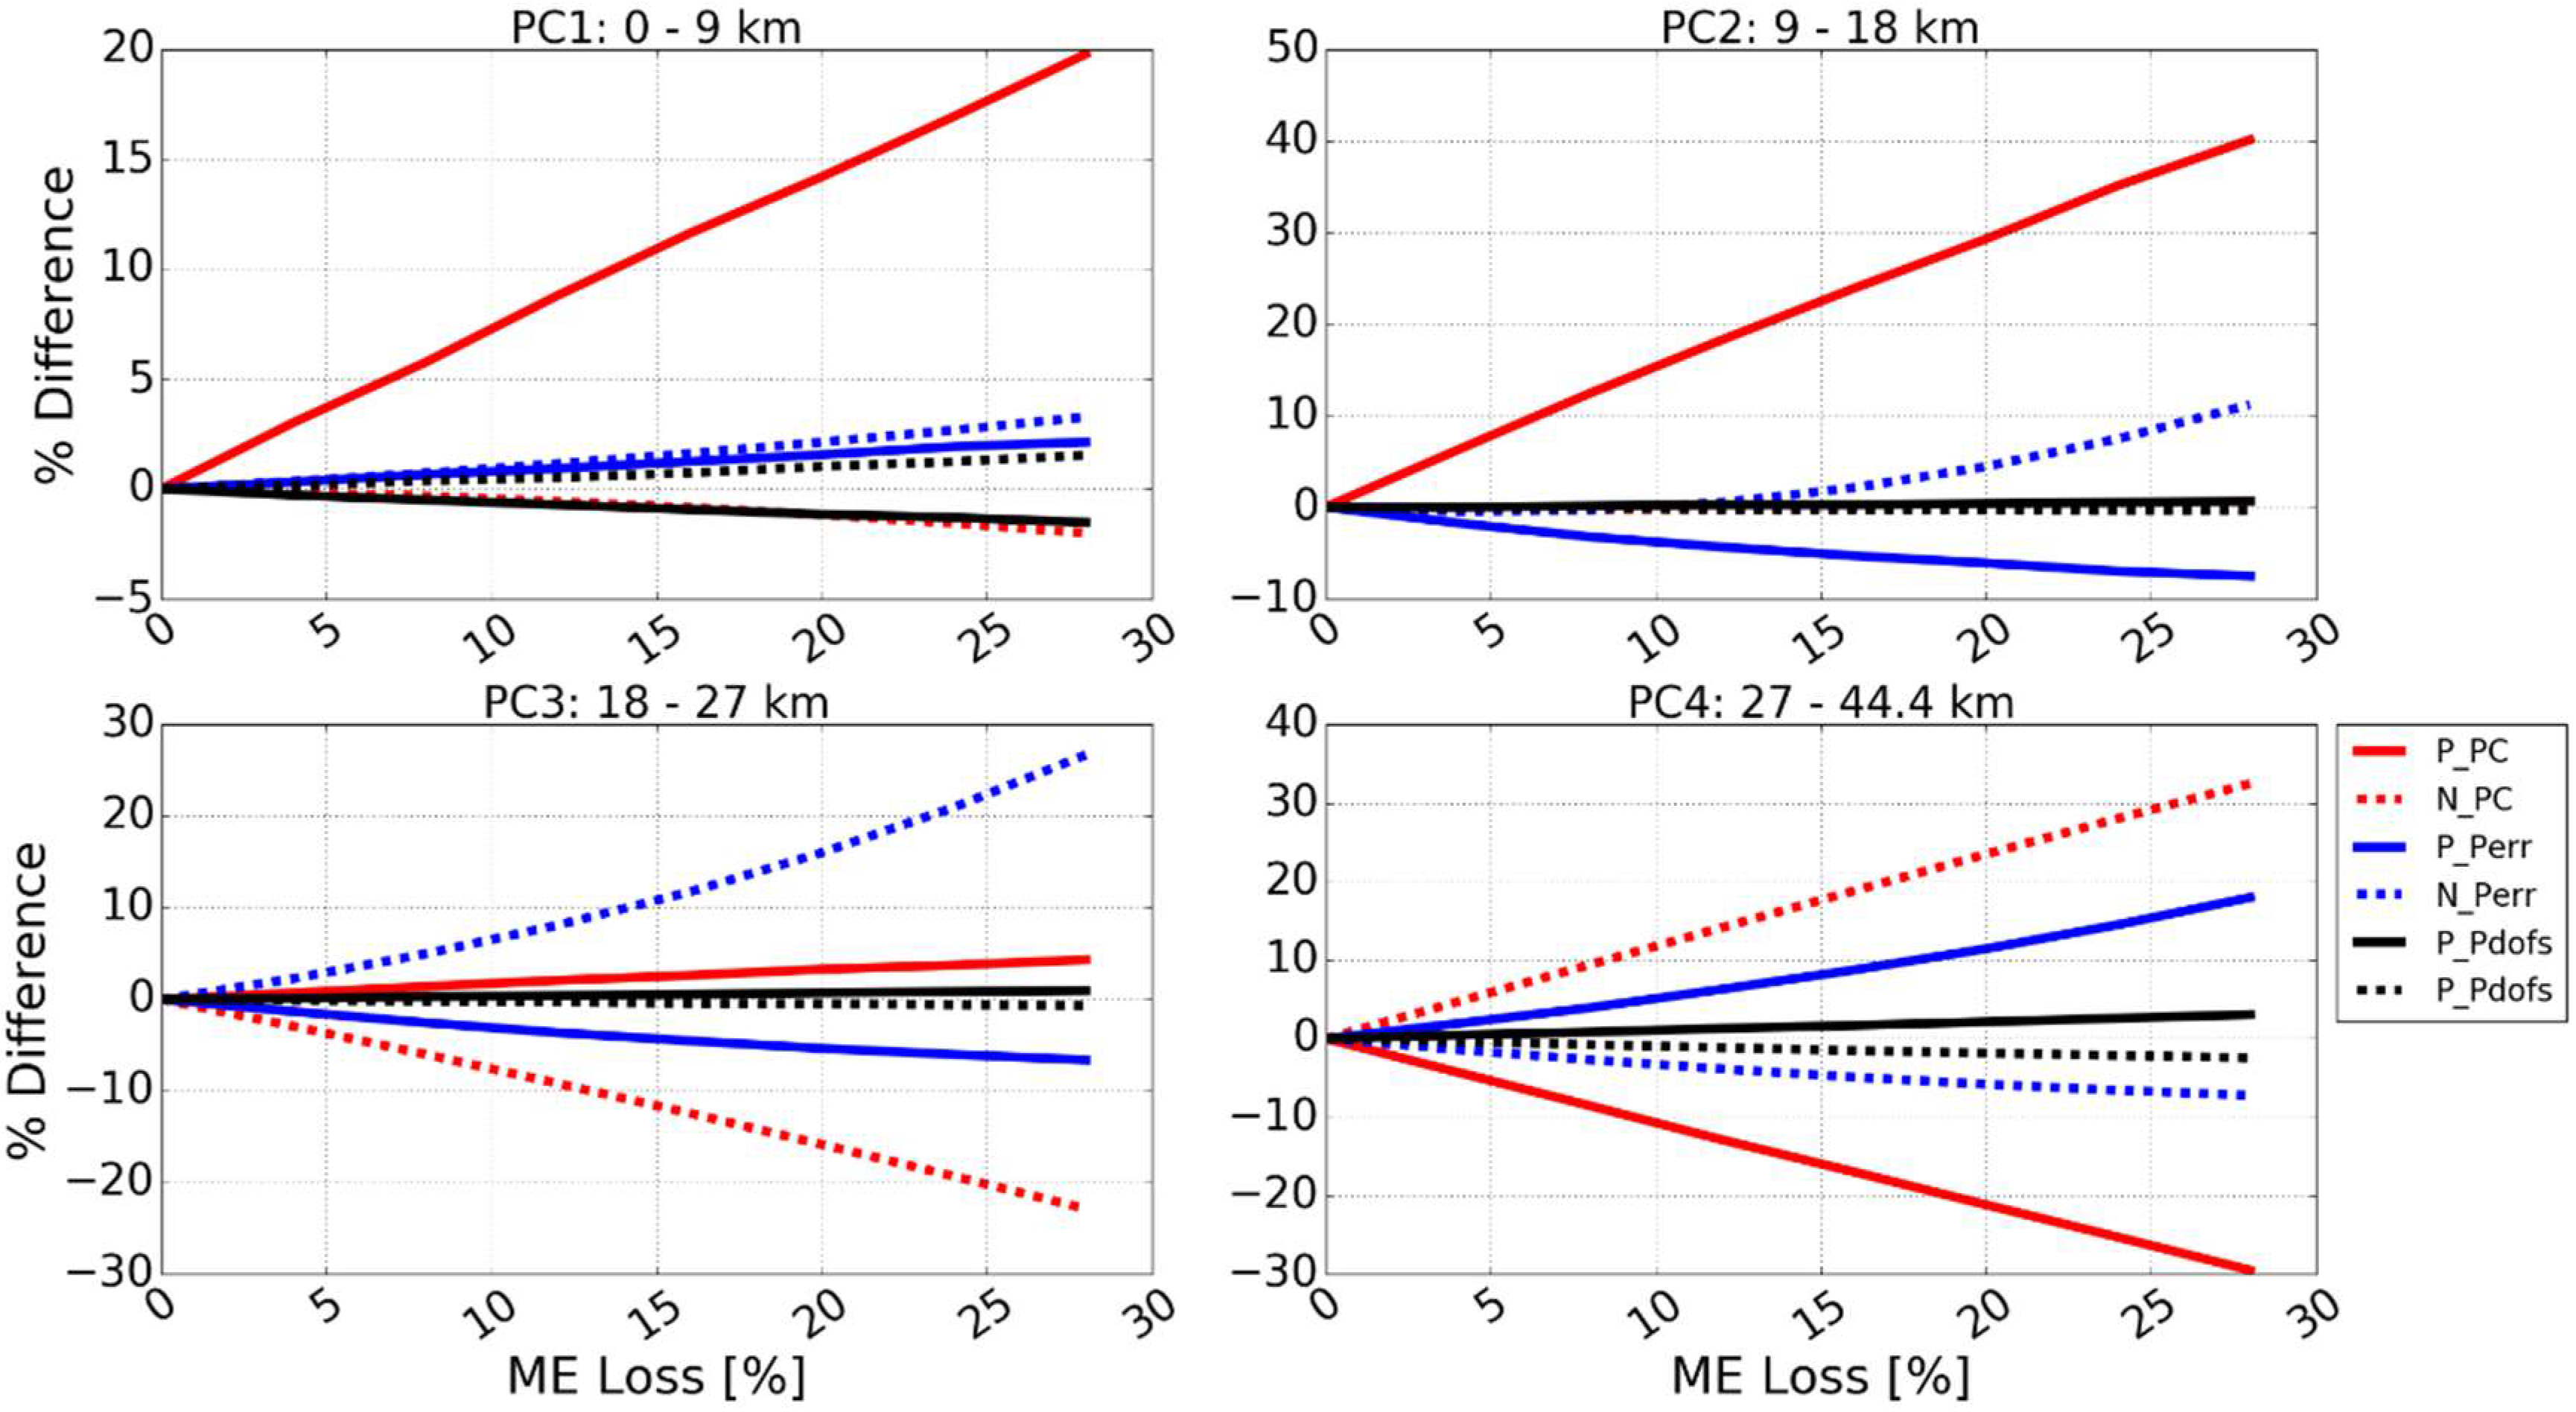
2O with respect to different levels of ILS degradation, respectively. The partial column, partial error, and partial DOFs were calculated via Equations (5), (6), and (14), respectively, by setting the elements of the corresponding matrices to zero for the altitudes outside of the concerned partial column boundaries. The fractional differences in the partial column, partial error, and partial DOFs were calculated via Equation (15).
4.1. O3
PC1 (0–9 km) and most PC2 (9–18 km) are in the troposphere, and PC3 (18–27 km) and PC4 (27–44.4 km) are in the stratosphere. Generally, for all partial layers, the partial column is more sensitive to ILS degradation than the partial error and partial DOFs. Positive ME causes an overestimated partial column at PC1, PC2, and PC3 and causes an underestimated partial column at PC4. In contrast, negative ME causes an underestimated partial column at PC1, PC2, and PC3, and causes an overestimated partial column at PC4. For the tropospheric PC1 and PC2, the influence of positive ME on the partial column is generally larger than that of negative ME, while for the stratospheric PC3 and PC4, the influence of negative ME on the partial column is generally larger than that of positive ME.
For typical positive ME degradation (10%), the partial columns at PC1, PC2, PC3, and PC4 changed by 7.2%, 15.3%, 1.7%, and −10.6%, respectively, while for typical negative ME degradation (−10%), the partial columns at PC1, PC2, PC3, and PC4 changed by −0.44%, −0.21%, −7.55%, 3%, and 11.8%, respectively.
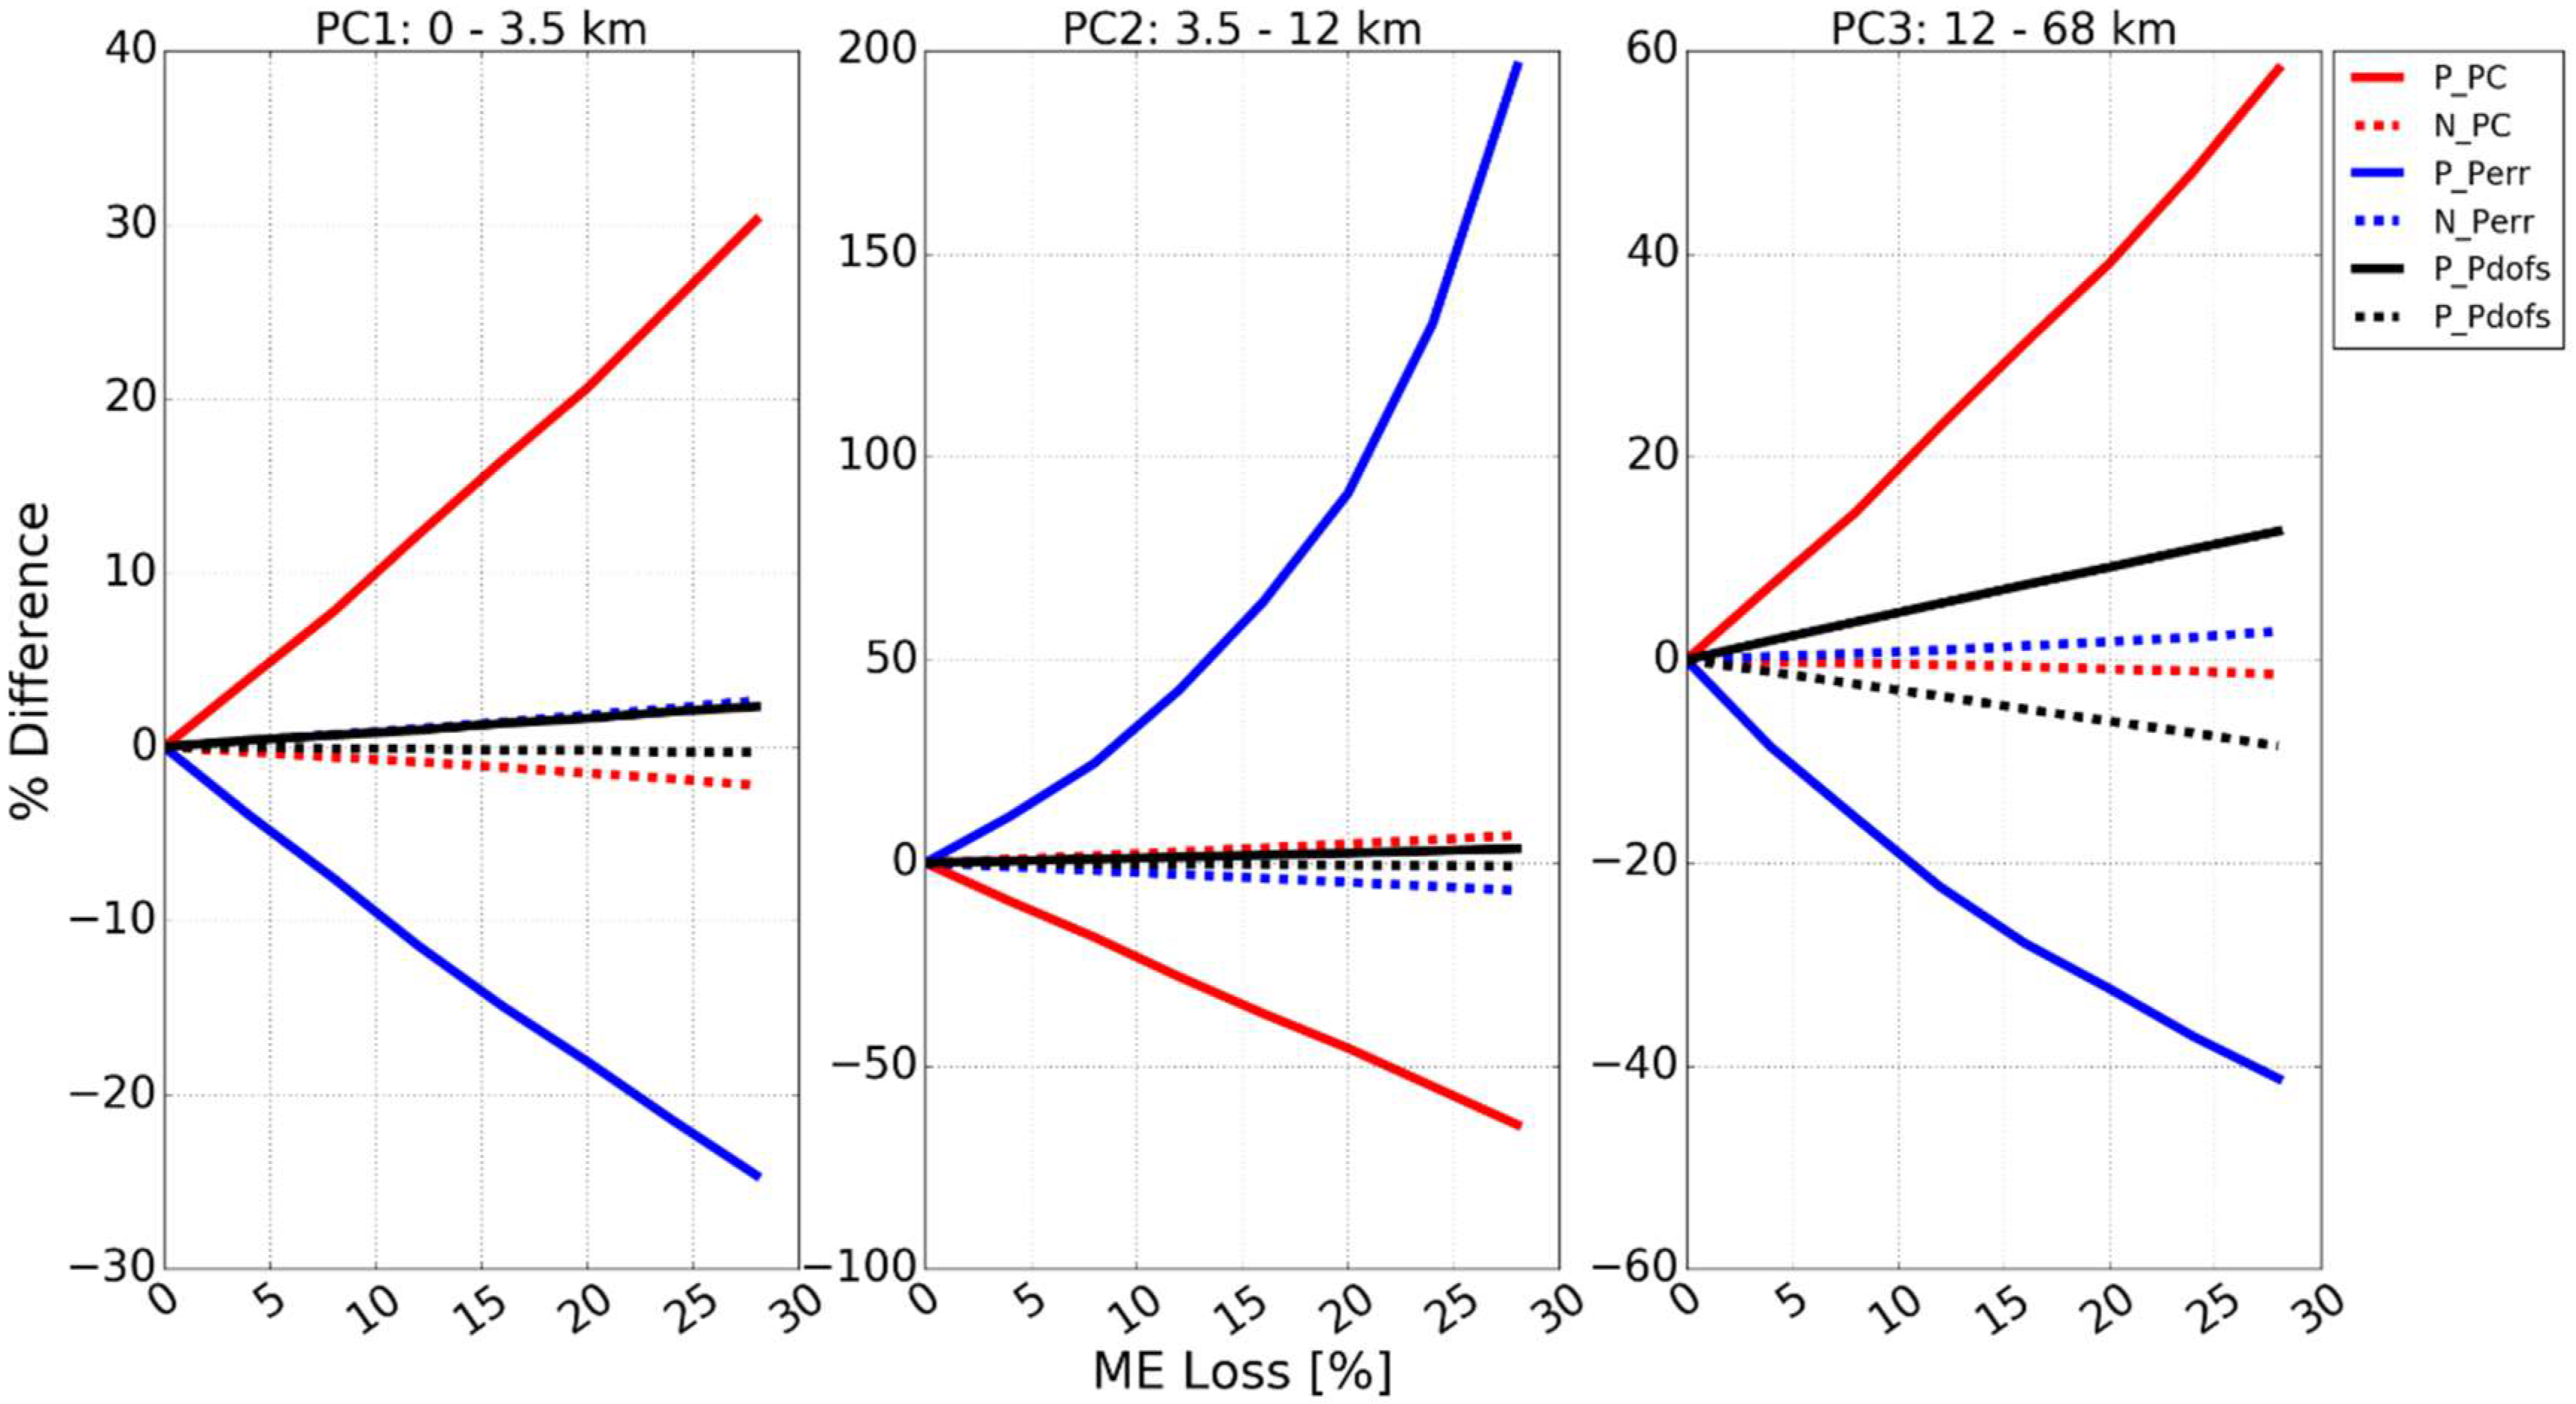
4.2. CO
PC1 (0–3.5 km) and PC2 (3.5–12 km) are in the troposphere, and most PC3 (12–68 km) is in the stratosphere. Generally, for all partial layers, the partial column, partial error and partial DOFs are more sensitive to positive ME degradation than negative ME degradation. Positive ME causes an overestimated partial column at PC1 and PC3 and causes an underestimated partial column at PC2. In contrast, negative ME causes an underestimated partial column at PC1 and PC3 and causes an overestimated partial column at PC2. The influence of ILS degradation on the partial error at each partial layer is opposite to that on the partial column. For all partial layers, positive ME overestimated partial DOFs and negative ME underestimated partial DOFs.
For typical positive ME degradation (10%), the partial columns at PC1, PC2, and PC3 changed by 10.0%, −23.2%, and 18.8%, respectively, while for typical negative ME degradation (−10%), the partial columns at PC1, PC2, and PC3 changed by −0.72%, 2.26%, and −0.41%, respectively.
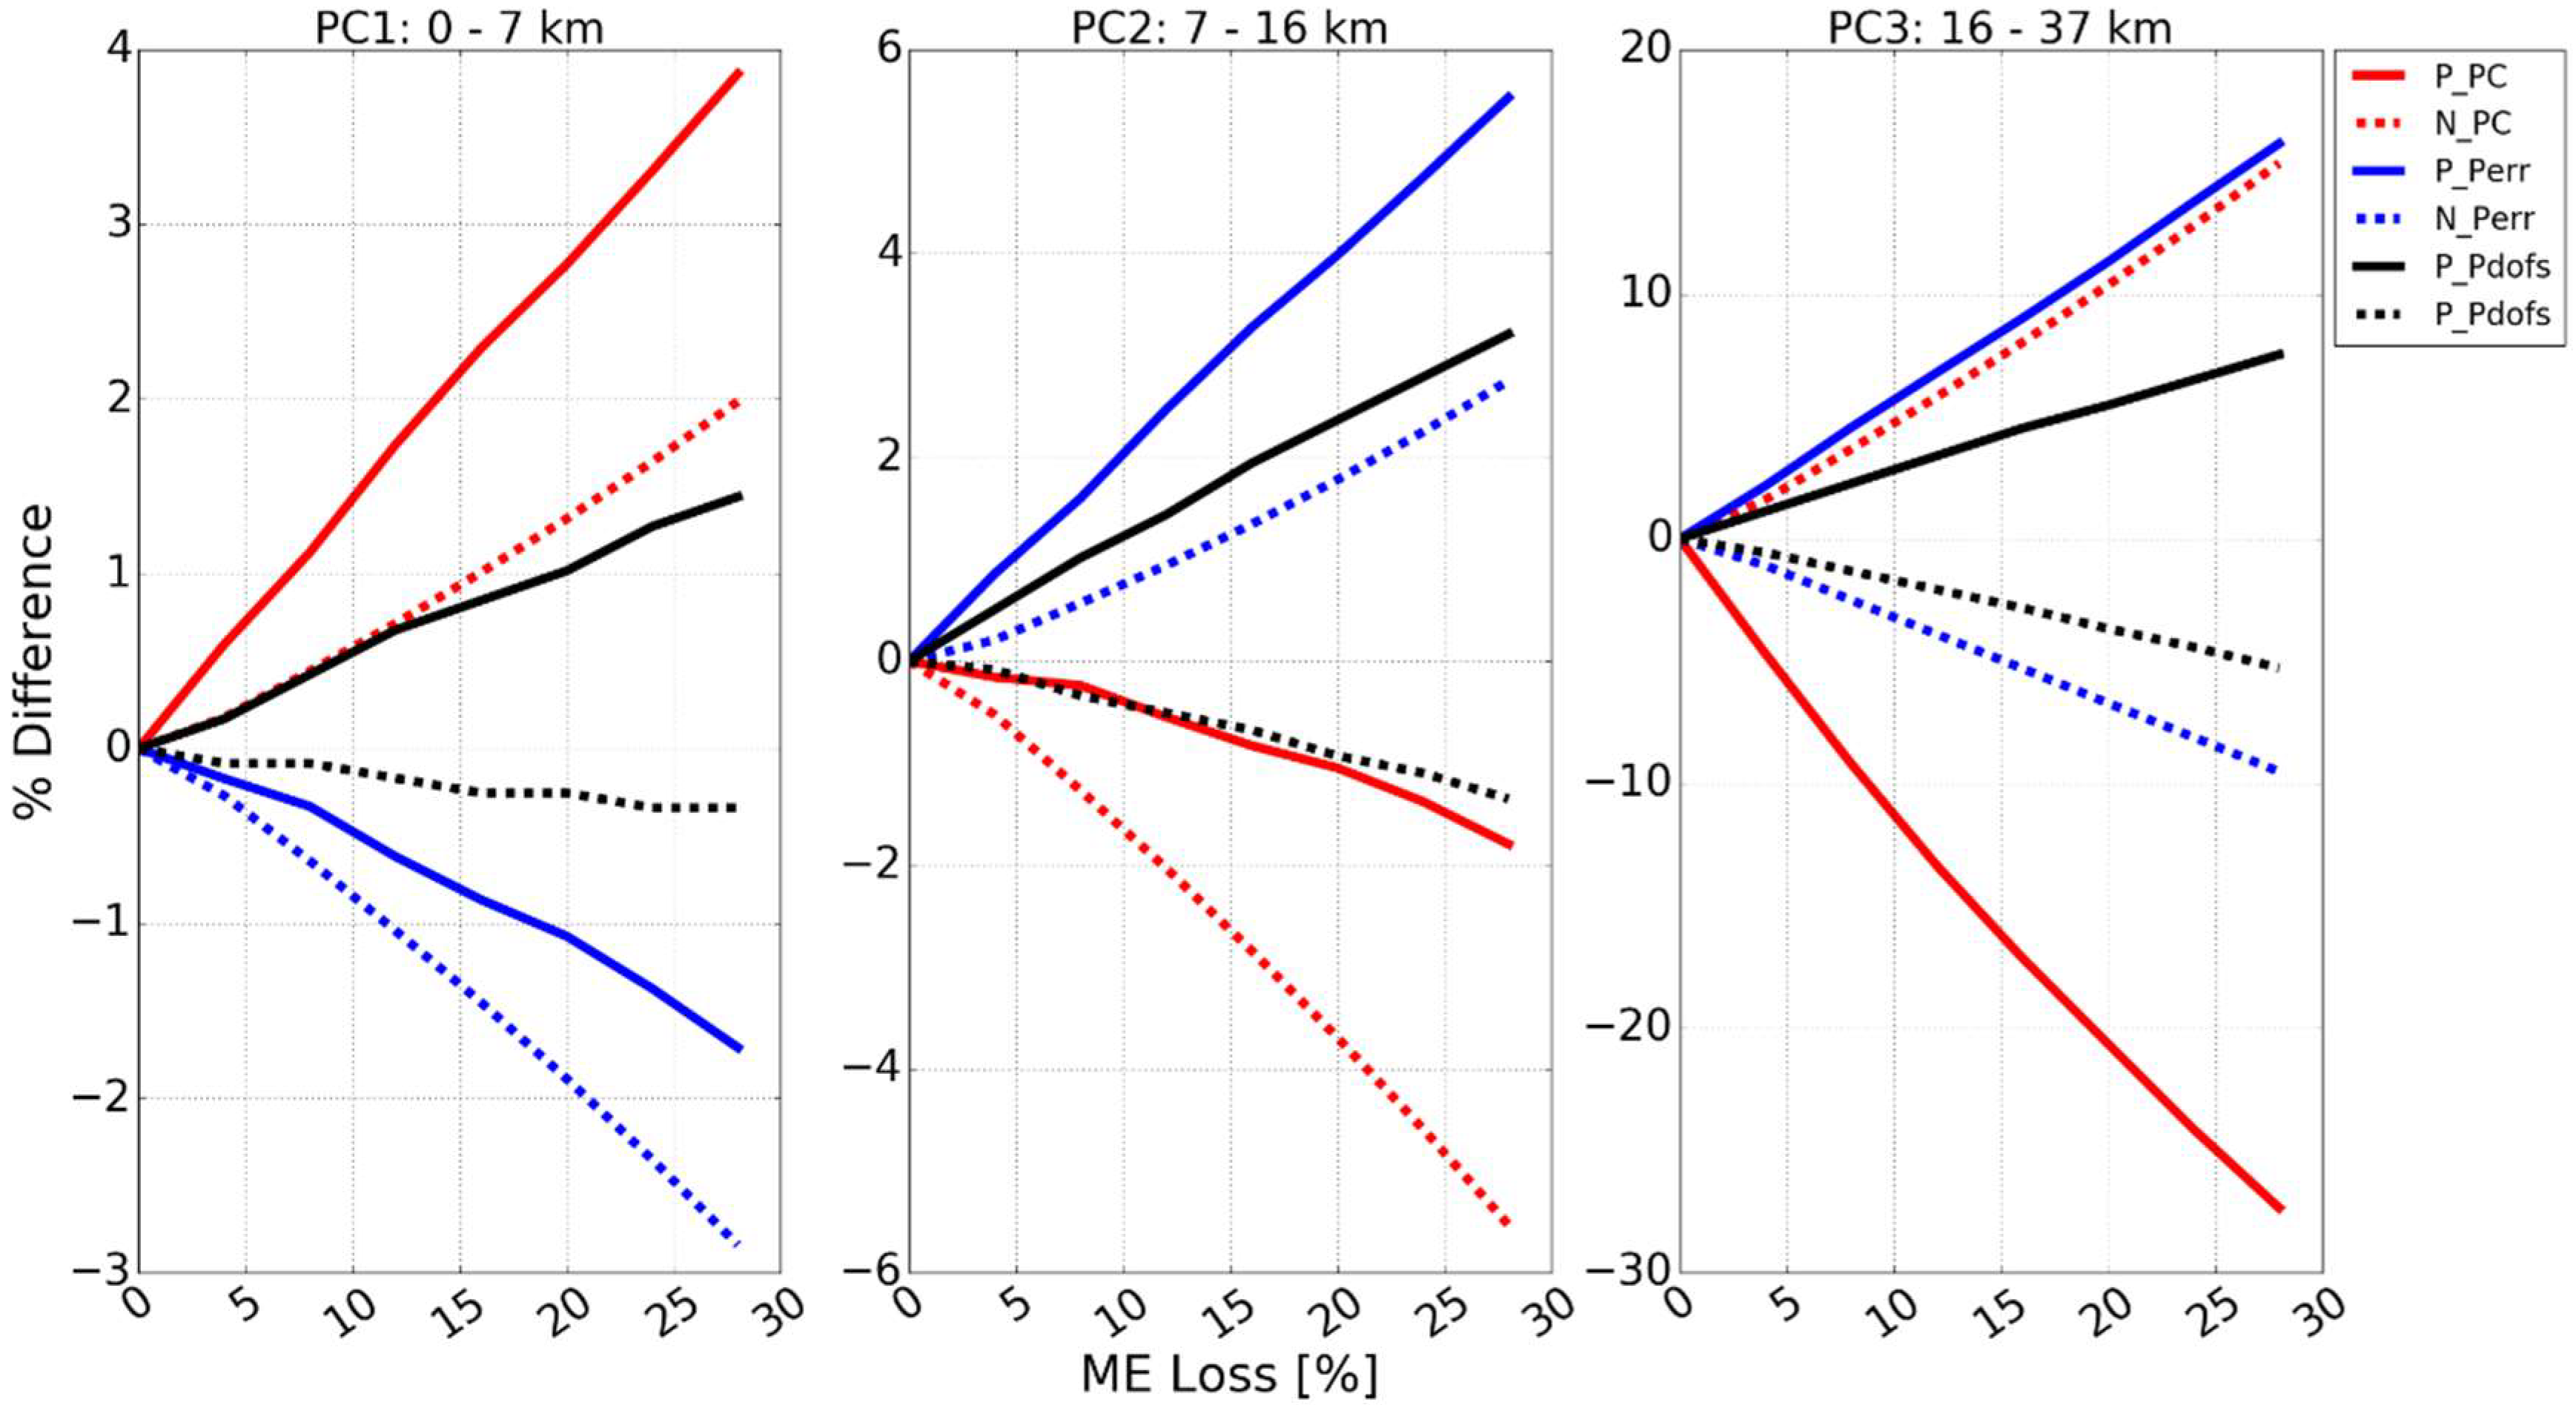
4.3. CH4
PC1 (0–7 km) and PC2 (7–16 km) are in the troposphere, and PC3 (16–37 km) is in the stratosphere. The partial column, partial error, and partial DOFs at PC3 are more sensitive to ILS degradation than those at PC1 and PC2. The ILS degradation has opposite influences on the partial column and partial error. Both positive and negative ME degradation cause overestimated partial columns at PC1 and cause underestimated partial columns at PC2. In contrast, at PC3, negative ME degradation overestimates the partial column but positive ME degradation underestimates the partial column. For all partial layers, positive ME overestimates partial DOFs and negative ME underestimates partial DOFs.
For typical positive ME degradation (10%), the partial columns at PC1, PC2, and PC3 changed by 1.4%, −0.39%, and −11.3%, respectively, while for typical negative ME degradation (−10%), the partial columns at PC1, PC2, and PC3 changed by 0.51%, −1.65%, and 4.7%, respectively.
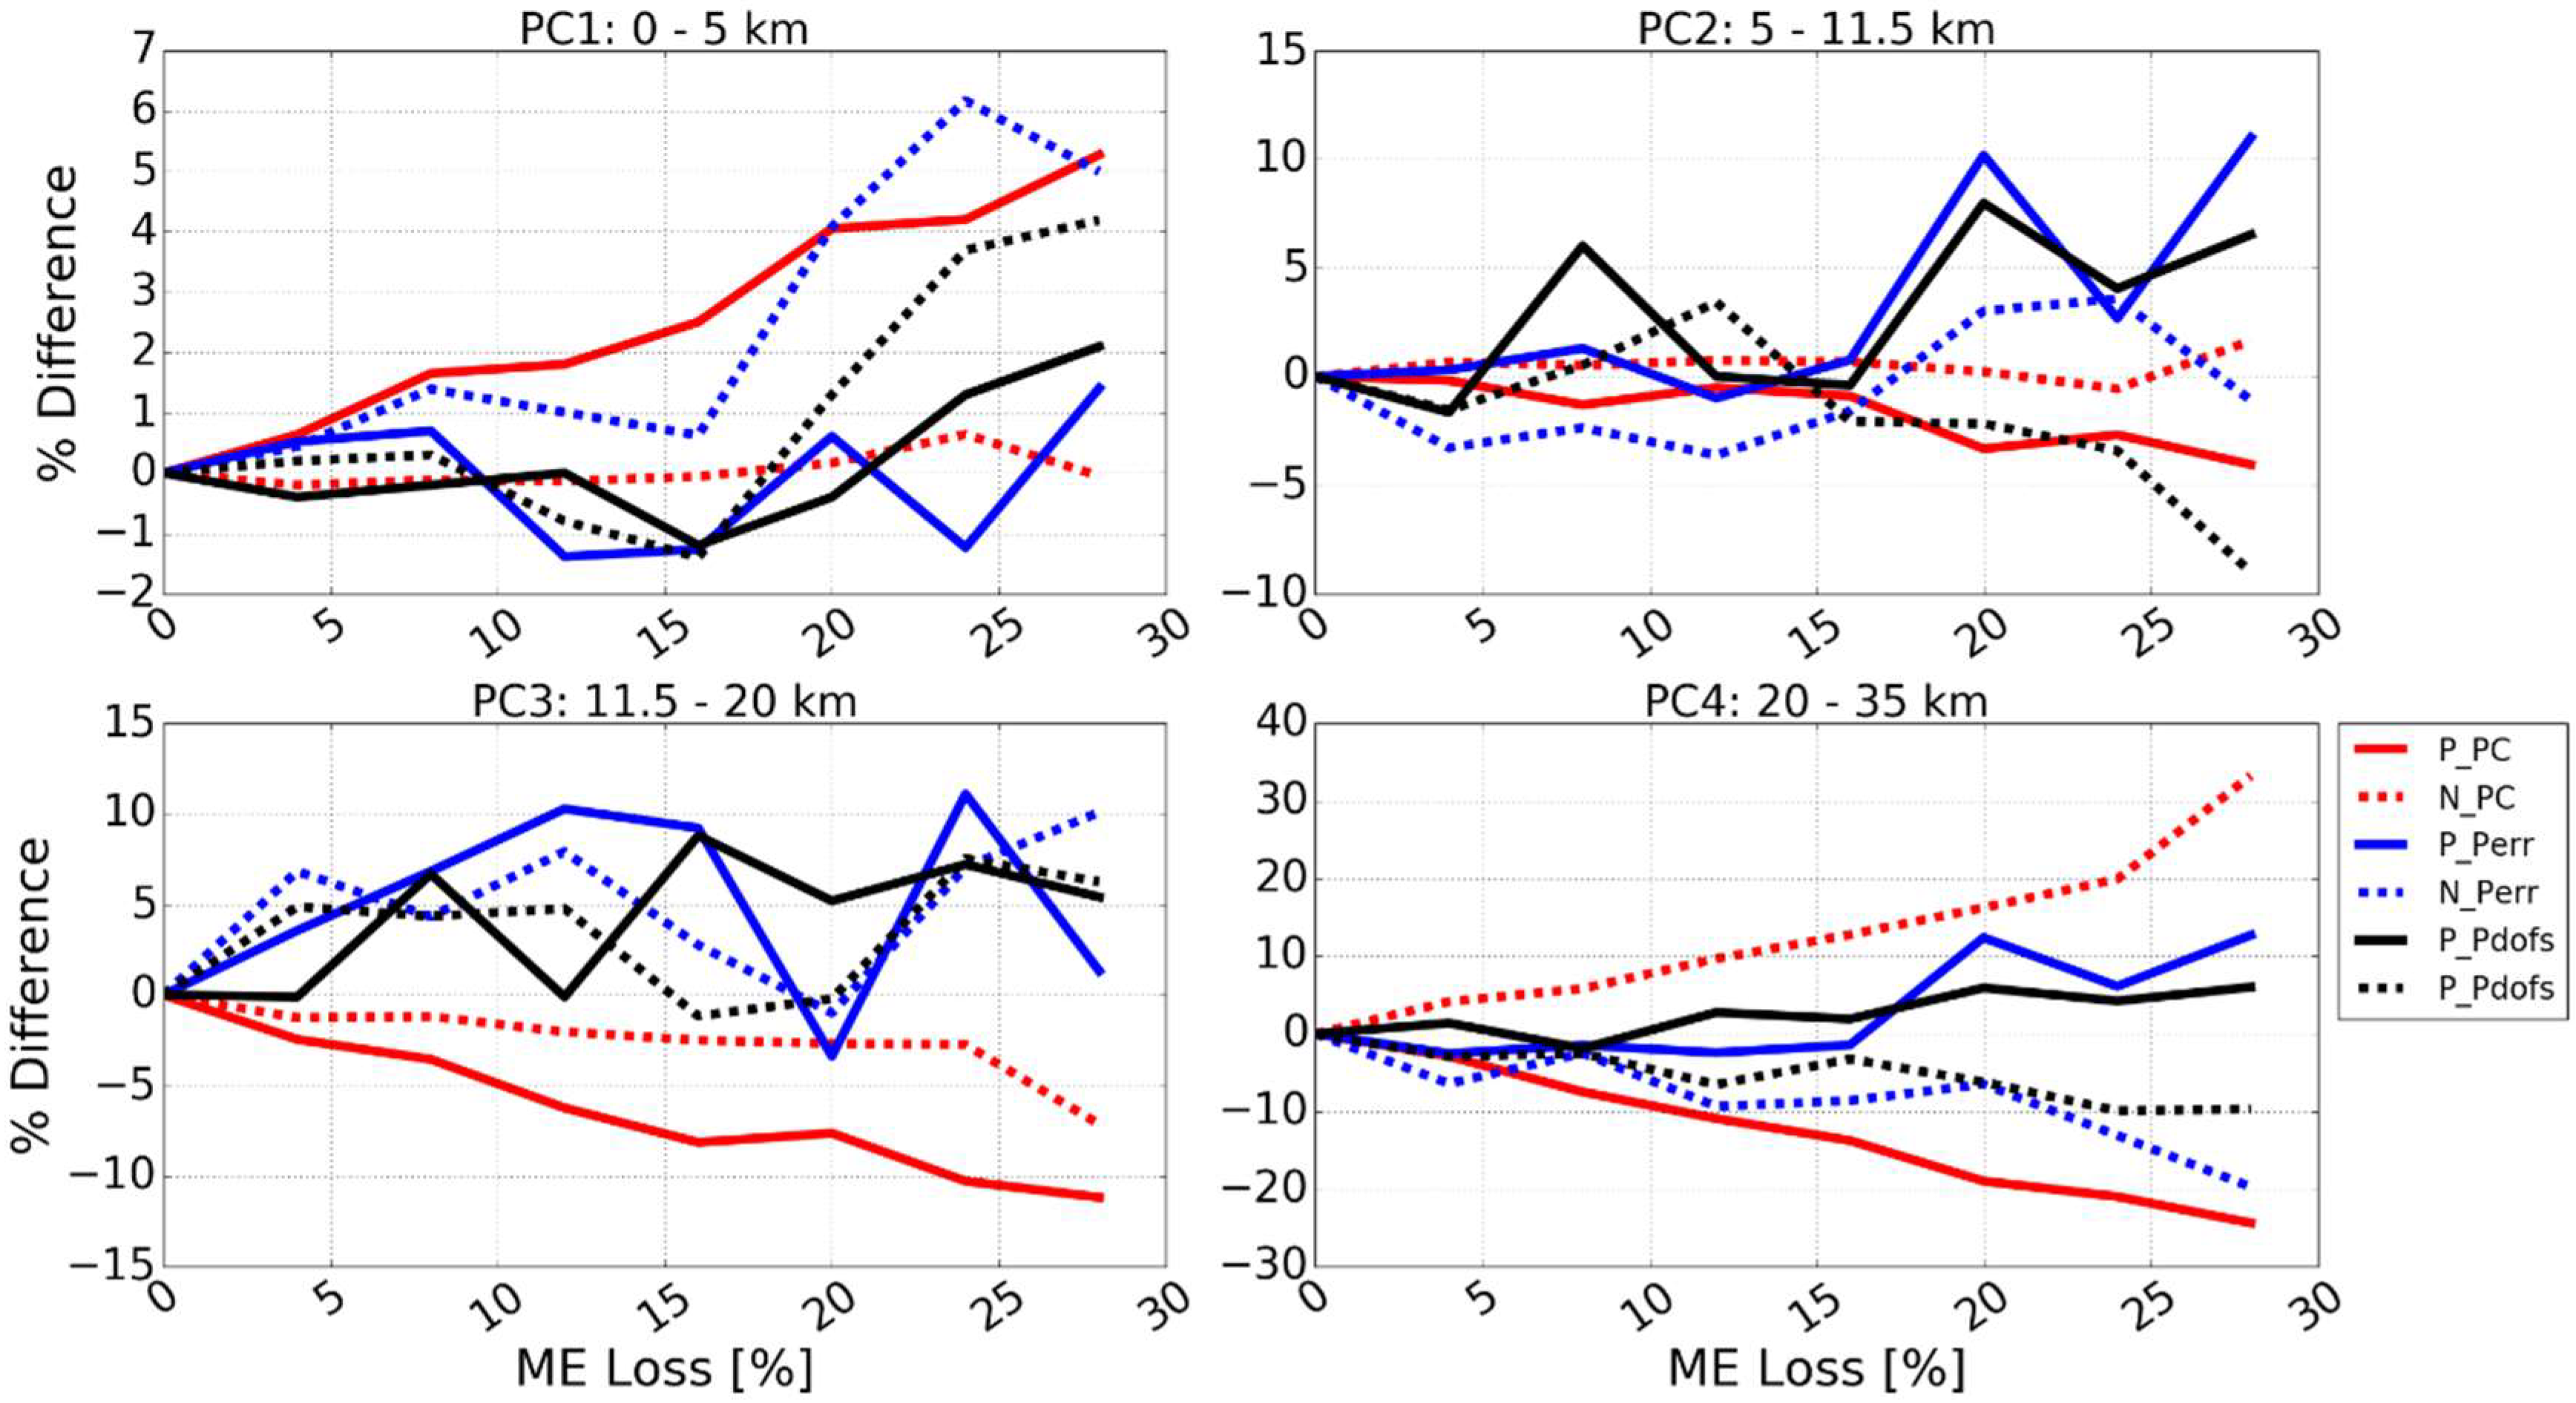
4.4. N2O
PC1 (0–5 km) and most PC2 (5–11.5 km) are in the troposphere, PC3 (11.5–20 km) is a mixture of troposphere and stratosphere, and PC4 (20–35 km) is in the stratosphere. The partial columns at PC3 and PC4 are more sensitive to ILS degradation than those at PC1 and PC2. For PC1, PC2, and PC3, the influence of positive ME on the partial column is generally larger than that of negative ME. At PC4, the positive and negative ME show comparable influences on the partial column. Positive ME causes an overestimated partial column at PC1 and causes an underestimated partial column at all other partial layers. The influence of negative ME on the partial columns at PC1 and PC2 is typically less than 1%, regardless of ILS degradation, while negative ME degradation underestimates the partial column at PC3 and overestimates the partial column at PC4. The changes in partial error and partial DOFs do not vary monotonously with ILS degradation.
For typical positive ME degradation (10%), the partial columns at PC1, PC2, PC3, and PC4 changed by 1.73%, −0.9%, −5%, and −9.2%, respectively, while for typical negative ME degradation (−10%), the partial columns at PC1, PC2, PC3, and PC4 changed by −0.11%, 0.65%, −1.6%, and 7.9%, respectively.
5. Consistency Evaluation
The simulated ILS i with an ME amplitude of −4% and ILS j with an ME amplitude of 4% were incorporated in the spectra from August 2015 to August 2016 and then the results were compared to those deduced with an ideal ILS. The variability (mean ± standard deviation) of fractional differences in partial column, partial error, and partial DOFs calculated with −4% of ILS i and 4% of ILS j were used to evaluate the consistency of the influences of negative and positive ME degradations.
With respect to positive ME degradation,
Figures S6–S9 show the variability of fractional differences in the partial column, partial error, and partial DOFs for O
3, CO, CH
4, and N
2O as a function of SZA, respectively.
Figures S10–S13 are the same as
Figures S6–S9 but for negative ME degradation. The resulting statistics are summarized in
Table 3. Generally, for both positive and negative ME degradation, the variability of the partial column, partial error, and partial DOFs at each partial layer for O
3 and CO is larger than that for CH
4 and N
2O.
For O3, the variability of the partial column, partial error, and partial DOFs at each partial layer are comparable. The variability of these quantities at PC1 and PC2 is larger than that at PC3 and PC4. With 4% of ILS degradation, the variability of fractional difference in the partial column at PC1, PC2, PC3, and PC4 was shown to be 3.3 ± 13.2%, 5.2 ± 21.1%, 0.7 ± 9.7%, and −3.2 ± 8.5%, respectively. With −4% of ILS degradation, the variability at PC1, PC2, PC3, and PC4 was shown to be 0.92 ± 13.0%, −3.3 ± 23.4%, −1.7 ± 9.4%, and 2.6 ± 9.1%, respectively.
For CO, the partial column and partial error show larger variability at each partial layer than the partial DOFs. Large variability of the partial column for CO is observed at all partial layers. With 4% of ILS degradation, the variability of the fractional difference in the partial column at PC1, PC2, and PC3 was shown to be −3.9 ± 41.2%, 3.7 ± 23.5%, and 3.4 ± 37.8%, respectively. With −4% of ILS degradation, the variability at PC1, PC2, and PC3 was shown to be −4.2 ± 38.7%, 3.3 ± 25.7%, and 6.5 ± 36.5%, respectively.
For CH4, the partial column, partial error, and partial DOFs at each partial layer show good consistency over SZA. With 4% of ILS degradation, the variability of fractional difference in the partial column at PC1, PC2, and PC3 was shown to be 0.5 ± 0.1%, −0.6 ± 0.1%, and 3.8 ± 0.3%, respectively. With −4% of ILS degradation, the variability at PC1, PC2, and PC3 was shown to be 0.1 ± 0.04%, −0.4 ± 0.1%, and 1.4 ± 0.2%, respectively.
For N2O, the partial column at each partial layer shows good consistency over SZA. The partial error and partial DOFs show lager variability at each partial layer than the partial column. With 4% of ILS degradation, the variability of the fractional difference in the partial column at PC1, PC2, PC3, and PC4 was shown to be 0.6 ± 0.8%, −0.4 ± 1.8%, −1.9 ± 3.1%, and −5.2 ± 4.1%, respectively. With −4% of ILS degradation, the variability at PC1, PC2, PC3, and PC4 was shown to be 0.03 ± 0.2%, 0.1 ± 1.1%, −0.5 ± 1.4%, and 3.4 ± 2.0%, respectively.
6. Discussion and Recommendations
The influence of ILS degradation on the partial quantities of O
3, CO, CH
4, and N
2O is generally larger than that on the total quantities presented in Sun et al. (2018) [
18]. The influence of ILS degradation on the partial quantities of all gases is altitude and gas species dependent, and the level of the influence varies across ILS degradation levels. Positive and negative ILS degradation generally have opposite influences on partial quantities. The influence of ILS degradation on partial quantities of O
3 and CO is larger than that on CH
4 and N
2O. For all gases, the partial columns in the troposphere are more sensitive to positive ILS degradation than negative ILS degradation. Generally, the partial columns in the stratosphere are more sensitive to ILS degradation than those in the troposphere.
The sensitivity curves of O3, CO, and CH4 are smoother than that of N2O, because ILS degradation alters the Sε, Sb, and Jacobian matrices of these gases in different ways. For O3, CO, and CH4, ILS degradation does not alter the number of iterations, and the sensitivity varies monotonously across ILS degradation levels, while for N2O, the number of iterations is occasionally altered, and the sensitivity is also altered.
The fact that the influence of ILS degradation on the partial quantities is altitude and gas species dependent can be explained by Equation (17) which shows how the ILS affects the calculated spectra in the forward model calculation.
where S
k, L
k, and M
k refer to the absorption intensity, the ideal line shape, and the molecular mass for the k-th absorber, respectively. Typically, L
k can be expressed by a Voigt function as a consequence of translational effects and collisional effects.
and
refer to the pressure and temperature at altitude
, respectively. The absorption intensity, molecular mass, and fitting frequency are gas dependent, and the line shape, pressure, and temperature are altitude dependent. The influence of ILS degradation on partial quantities is thus altitude and gas species dependent. Specifically, the absorption line shape in the stratosphere is narrower than that in the troposphere, and stratospheric quantities are more sensitive to ILS degradation.
For all gases, we set the acceptable fractional difference in the partial column as 2% and assumed a proportional variability at each partial layer. The permitted maximum ILS degradation for each gas at each partial layer is recommended in
Table 4 as:
For O
3 and CO, a precise ILS should be used because the variability in ILS degradation influence at each partial layer is very large. We recommend the incorporation of the measured ILS in partial column retrieval. One option is to use the output of routine cell measurements with LINEFIT code [
11].
For CH4, the influence of positive ILS degradation at PC2 (7–16 km) and negative ILS degradation at PC1 (0–7 km) can be regarded as negligible. The maximum positive ILS degradations at PC1 (0–7 km) and PC3 (16–37 km) should be less than 13% and 1.5%, respectively. The maximum negative ILS degradation at PC2 (7–16 km) and PC3 (16–37 km) should be less than 12% and 4.5%, respectively.
For N2O, the maximum positive ILS degradation at PC1 (0–5 km), PC2 (5–11.5 km), PC3 (11.5–20 km) and PC4 (20–35 km) should be less than 6%, 4%, 1.5%, and 1.5%, respectively. The influence of negative ILS degradation at PC1 (0–5km) and PC2 (5–11.5 km) can be regarded as negligible. The maximum negative ILS degradation at PC3 (11.5–20 km) and PC4 (20–35 km) should be less than 2% and 1.5%, respectively.
7. Conclusions
We assessed the influence of instrumental line shape (ILS) degradation on the partial columns of O3, CO, CH4, and N2O derived from high-resolution FTIR spectrometry. The sensitivities of the partial column, partial error, and partial DOFs (degrees of freedom) with respect to different levels of ILS degradation for O3, CO, CH4, and N2O were first investigated, and then the consistency of the resulting deductions was evaluated with one year of measurements. Finally, the maximum ILS deviations allowable for limiting the influence within 2% were deduced.
The influence of ILS degradation on partial quantities is altitude and gas species dependent. The influence of ILS degradation on the partial columns of O3 and CO is larger than that for CH4 and N2O. For all gases, the partial columns in the stratosphere are more sensitive to ILS degradation than those in the troposphere. In order to limit the fractional difference in the partial column within 2%, it is recommended that a precise ILS deduced from cell measurements is used for O3 and CO; for CH4, the influence of positive ME (modulation efficiency) degradation at PC2 (7–16 km) and negative ME degradation at PC1 (0–7 km) can be regarded as negligible. The maximum positive ME degradation at PC1 (0–7 km) and PC3 (16–37 km) should be less than 13% and 1.5%, respectively. The maximum negative ME degradation at PC2 (7–16 km) and PC3 (16–37 km) should be less than 12% and 4.5%, respectively; for N2O, the maximum positive ME degradation at PC1 (0–5 km), PC2 (5–11.5 km), PC3 (11.5–20 km) and PC4 (20–35 km) should be less than 6%, 4%, 1.5%, and 1.5%, respectively. The influence of negative ME degradation at PC1 (0–5 km) and PC2 (5–11.5 km) can be regarded as negligible. The maximum negative ME degradation at PC3 (11.5–20 km) and PC4 (20–35 km) should be less than 2% and 1.5%, respectively.
Our results provide improved knowledge of the ILS degradation in ground-based FTIR measurements, which is important for the quantification of measurement uncertainties and minimization of the bias of inter-comparisons between different measurement platforms. This is especially useful for the validation of satellite observations, the data assimilation of chemical model simulations, and the quantification of the source/sink/trend from FTS measurements.
Supplementary Materials
The following are available online at
https://0-www-mdpi-com.brum.beds.ac.uk/2072-4292/10/12/2041/s1, Figure S1: Sensitivity of profile with respect to positive modulation efficiency (ME) deviation for current NDACC mandatory gases; Figure S2: The same as Figure S1 but for negative ME deviation; Figure S3: Simulated negative ME deviations along with optical path difference (OPD); Figure S4: Simulated positive ME deviations along with OPD; Figure S5: The meteorological data and solar zenith angles (SZAs) record at Hefei, China; Figure S6: Variability of fractional difference in partial column, partial error, and partial DOFs of O
3 at each partial layer as a function of SZA from August 2015 to August 2016 where ILS j with a maximum ME deviation of 4% is used; Figure S7: The same as Figure S6 but for CO; Figure S8: The same as Figure S6 but for CH
4; Figure S9: The same as Figure S6 but for N
2O; Figure S10: The same as S6 but for a maximum ME deviation of −4%; Figure S11: The same as S7 but for a maximum ME deviation of −4%; Figure S12: The same as S8 but for a maximum ME deviation of −4%; Figure S13: The same as S9 but for a maximum ME deviation of−4%.
Author Contributions
Conceptualization, Y.S.; Methodology, Y.S.; Software, W.W.; Formal Analysis, Q.H.; Investigation, C.S.; Data Curation, Y.S.; Writing-Original Draft Preparation, Y.S.; Writing-Review & Editing, K.C.; Supervision, C.L.; Project Administration, J.L.; Funding Acquisition, C.L.
Funding
This work is jointly supported by the National High Technology Research and Development Program of China (No. 2016YFC0200800, No.2018YFC0213104, No. 2017YFC0210002, No. 2016YFC0203302, No. 2018YFC0213201), the National Science Foundation of China (No. 41605018, No.41877309, No. 41503105, No.41775025, No. 41575021, No. 51778596, No. 91544212, No. 41722501, No. 51778596), Anhui Province Natural Science Foundation of China (No. 1608085MD79), Outstanding Youth Science Foundation (No. 41722501), and the National High-Resolution Earth Observation Project of China (No.05-Y20A16-9001-15/17-2).
Acknowledgments
The ALIGN60 software was provided by Frank Hase, Karlsruhe Institute of Technology (KIT), Institute for Meteorology and Climate Research (IMK-ASF), Germany. The processing environment of SFIT4 and some plot programs were provided by National Center for Atmospheric Research (NCAR), Boulder, Colorado, USA. The NDACC networks are acknowledged for supplying the SFIT software and advice. Many especial thanks go to Mathias Palm and Justus Notholt for their contributions, and Institute of Environmental Physics, University of Bremen for hosting me during my scholar visit at Bremen, during which I developed some of the ideas presented in this study.
Conflicts of Interest
The authors declare no conflict of interest.
References
- Network for the Detection of Atmospheric Composition Change. Available online: http://www.ndacc.org/ (accessed on 23 November 2018).
- Kurylo, M.J. Network for the detection of stratospheric change (NDSC). SPIE Proc. 1991, 1491, 168–174. [Google Scholar]
- Notholt, J.; Neuber, R.; Schrems, O.; Clarmann, T.V. Stratospheric trace gas concentrations in the Arctic polar night derived by FTIR-spectroscopy with the moon as IR light source. Geophys. Res. Lett. 1993, 20, 2059–2062. [Google Scholar] [CrossRef]
- Notholt, J.; Toon, G.C.; Stordal, F.; Solberg, S.; Schmidbauer, N.; Meier, A.; Becker, E.; Sen, B. Seasonal variations of Atmospheric trace gases in the high Arctic at 79°N. J. Geophys. Res. 1997, 102, 12855–12861. [Google Scholar] [CrossRef]
- Notholt, J.; Toon, G.C.; Rinsland, C.P.; Pougatchev, N.; Jones, N.B.; Conner, B.J.; Weller, R.; Gautrois, M.; Schrems, O. Latitudinal variations of trace gas concentrations in the free troposphere measured by solar absorption spectroscopy during a ship cruise. J. Geophys. Res. 2000, 105, 1337–1349. [Google Scholar] [CrossRef] [Green Version]
- Schneider, M.; Redondas, A.; Hase, F.; Guirado, C.; Blumenstock, T.; Cuevas, E. Comparison of ground-based Brewer and FTIR total column O3 monitoring techniques. Atmos. Chem. Phys. 2008, 8, 5535–5550. [Google Scholar] [CrossRef] [Green Version]
- Hannigan, J.; Coffey, M. Semiautonomous FTS observation system for remote sensing of stratospheric and tropospheric gases. J. Atmos. Ocean. Technol. 2009, 26, 1814–1824. [Google Scholar] [CrossRef]
- Vigouroux, C.; De Mazière, M.; Demoulin, P.; Servais, C.; Hase, F.; Blumenstock, T.; Kramer, I.; Schneider, M.; Mellqvist, J.; Strandberg, A.; et al. Evaluation of Tropospheric and Stratospheric Ozone Trends over Western Europe from Ground-Based FTIR Network Observations. Atmos. Chem. Phys. 2008, 8, 6865–6886. Available online: http://www.atmos-chem-phys.net/8/6865/2008/ (accessed on 23 November 2018). [CrossRef]
- Kohlhepp, R.; Barthlott, S.; Blumenstock, T.; Hase, H.; Kaiser, I.; Raffalski, U.; Ruhnke, R. Trends of HCl, ClONO2, and HF column abundances from ground-based FTIR measurements in Kiruna (Sweden) in comparison with KASIMA model calculations. Atmos. Chem. Phys. 2011, 11, 4669–4677. Available online: www.atmos-chem-phys.net/11/4669/2011/ (accessed on 23 November 2018). [CrossRef]
- Dammers, E.; Vigouroux, C.; Palm, M.; Mahieu, E.; Warneke, T.; Smale, D.; Langerock, B.; Franco, B.; Van Damme, M.; Schaap, M.; et al. Retrieval of ammonia from ground-based FTIR solar spectra. Atmos. Chem. Phys. 2015, 15, 12789–12803. [Google Scholar] [CrossRef] [Green Version]
- Hase, F. Improved instrumental line shape monitoring for the ground-based, high-resolution FTIR spectrometers of the Network for the Detection of Atmospheric Composition Change. Atmos. Meas. Tech. 2012, 5, 603–610. [Google Scholar] [CrossRef] [Green Version]
- Hase, F.; Drouin, B.J.; Roehl, C.M.; Toon, G.C.; Wennberg, P.O.; Wunch, D.; Blumenstock, T.; Desmet, F.; Feist, D.G.; Heikkinen, P.; et al. Calibration of sealed HCl cells used for TCCON instrumental line shape monitoring. Atmos. Meas. Tech. 2013, 6, 3527–3537. [Google Scholar] [CrossRef] [Green Version]
- Sun, Y.; Palm, M.; Weinzierl, C.; Petri, C.; Notholt, J.; Wang, Y.; Liu, C. Technical note: Sensitivity of instrumental line shape monitoring for the ground-based high-resolution FTIR spectrometer with respect to different optical attenuators. Atmos. Meas. Tech. 2017, 10, 989–997. [Google Scholar] [CrossRef]
- Notholt, J.; Kuang, Z.; Rinsland, C.P.; Toon, G.C.; Rex, M.; Jones, N.; Albrecht, T.; Deckelmann, H.; Krieg, J.; Weinzierl, C.; et al. Enhanced upper tropical tropospheric COS: Impact on the stratospheric aerosol layer. Science 2003, 300, 307–310. [Google Scholar] [CrossRef] [PubMed]
- Vigouroux, C.; Blumenstock, T.; Coffey, M.; Errera, Q.; García, O.; Jones, N.B.; Hannigan, J.W.; Hase, F.; Liley, B.; Mahieu, E.; et al. Trends of ozone total columns and vertical distribution from FTIR observations at eight NDACC stations around the globe. Atmos. Chem. Phys. 2015, 15, 2915–2933. [Google Scholar] [CrossRef] [Green Version]
- Zhou, M.; Langerock, B.; Vigouroux, C.; Sha, M.K.; Ramonet, M.; Delmotte, M.; Mahieu, E.; Bader, W.; Hermans, C.; Kumps, N.; et al. Atmospheric CO and CH4 time series and seasonal variations on Reunion Island from ground-based in situ and FTIR (NDACC and TCCON) measurements. Atmos. Chem. Phys. 2018, 18, 13881–13901. [Google Scholar] [CrossRef]
- García, O.E.; Schneider, M.; Ertl, B.; Sepúlveda, E.; Borger, C.; Diekmann, C.; Wiegele, A.; Hase, F.; Barthlott, S.; Blumenstock, T.; et al. The MUSICA IASI CH4 and N2O products and their comparison to HIPPO, GAW and NDACC FTIR references. Atmos. Meas. Tech. 2018, 11, 4171–4215. [Google Scholar] [CrossRef]
- Sun, Y.; Palm, M.; Liu, C.; Hase, F.; Griffith, D.; Weinzierl, C.; Petri, C.; Wang, W.; Notholt, J. The influence of instrumental line shape degradation on NDACC gas retrievals: Total column and profile. Atmos. Meas. Tech. 2018, 11, 2879–2896. [Google Scholar] [CrossRef]
- Sun, Y.; Liu, C.; Palm, M.; Vigouroux, C.; Notholt, J.; Hu, Q.; Jones, N.; Wang, W.; Su, W.; Zhang, W.; et al. Ozone seasonal evolution and photochemical production regime in the polluted troposphere in eastern China derived from high-resolution Fourier transform spectrometry (FTS) observations. Atmos. Chem. Phys. 2018, 18, 14569–14583. [Google Scholar] [CrossRef]
- Davis, S.P.; Abrams, M.C.; Brault, J.W. Fourier Transform Spectrometry; Academic Press: Cambridge, MA, USA, 2001; ISBN 0-12-042510-6. [Google Scholar]
- Rodgers, C.D. Inverse Methods for Atmospheric Sounding: Theory and Practice, Series on Atmospheric, Oceanic and Planetary Physics; World Scientific Publishing Co.: Singapore, 2000; Volume 2. [Google Scholar]
- Duchatelet, P.; Demoulin, P.; Hase, F.; Ruhnke, R.; Feng, W.; Chipperfield, M.P.; Bernath, P.F.; Boone, C.D.; Walker, K.A.; Mahieu, E. Hydrogen fluoride total and partial column time series above the Jungfraujoch from long term FTIR measurements: Impact of the line shape model, characterization of the error budget and seasonal cycle, and comparison with satellite and model data. J. Geophys. Res. 2010, 115. [Google Scholar] [CrossRef]
- Hase, F.; Blumenstock, T.; Paton-Walsh, C. Analysis of the instrumental line shape of high-resolution Fourier transform IR spectrometers with gas cell measurements and new retrieval software. Appl. Opt. 1999, 38, 3417–3422. [Google Scholar] [CrossRef] [PubMed]
- Palm, M.; Melsheimer, C.; Noël, S.; Heise, S.; Notholt, J.; Burrows, J.; Schrems, O. Integrated water vapor above Ny Alesund, Spitsbergen: A multisensor intercomparison. Atmos. Chem. Phys. 2010, 10, 1215–1226. [Google Scholar] [CrossRef]
- NDACC Infrared Working Group. Available online: https://www2.acom.ucar.edu/irwg/links (accessed on 23 November 2018).
© 2018 by the authors. Licensee MDPI, Basel, Switzerland. This article is an open access article distributed under the terms and conditions of the Creative Commons Attribution (CC BY) license (http://creativecommons.org/licenses/by/4.0/).


