A Remote Sensing Approach for Mapping the Development of Ancient Water Management in the Near East


1
School of Archaeology and Ancient History, University of Leicester, Leicester LE1 7RH, UK
2
Department of Geography, Durham University, Durham DH1 3LE, UK
*
Author to whom correspondence should be addressed.
Remote Sens. 2018, 10(12), 2042; https://0-doi-org.brum.beds.ac.uk/10.3390/rs10122042
Submission received: 14 November 2018
/
Revised: 7 December 2018
/
Accepted: 10 December 2018
/
Published: 14 December 2018
(This article belongs to the Special Issue 2nd Edition Advances in Remote Sensing for Archaeological Heritage)
Abstract
:We present a novel approach that uses remote sensing to record and reconstruct traces of ancient water management throughout the whole region of Northern Mesopotamia, an area where modern agriculture and warfare has had a severe impact on the survival of archaeological remains and their visibility in modern satellite imagery. However, analysis and interpretation of declassified stereoscopic spy satellite data from the 1960s and early 1970s revealed traces of ancient water management systems. We processed satellite imagery to facilitate image interpretation and used photogrammetry to reconstruct hydraulic pathways. Our results represent the first comprehensive map of water management features across the entirety of Northern Mesopotamia for the period ca. 1200 BC to AD 1500. In particular, this shows that irrigation was widespread throughout the region in the Early Islamic period, including within the zone traditionally regarded as “rain-fed”. However, we found that a high proportion of the ancient canal systems had been damaged or destroyed by 20th century changes to agricultural practices and land use. Given this, there is an urgent need to record these rapidly vanishing water management systems that were an integral part of the ancient agricultural landscape and that underpinned powerful states.

1. Introduction
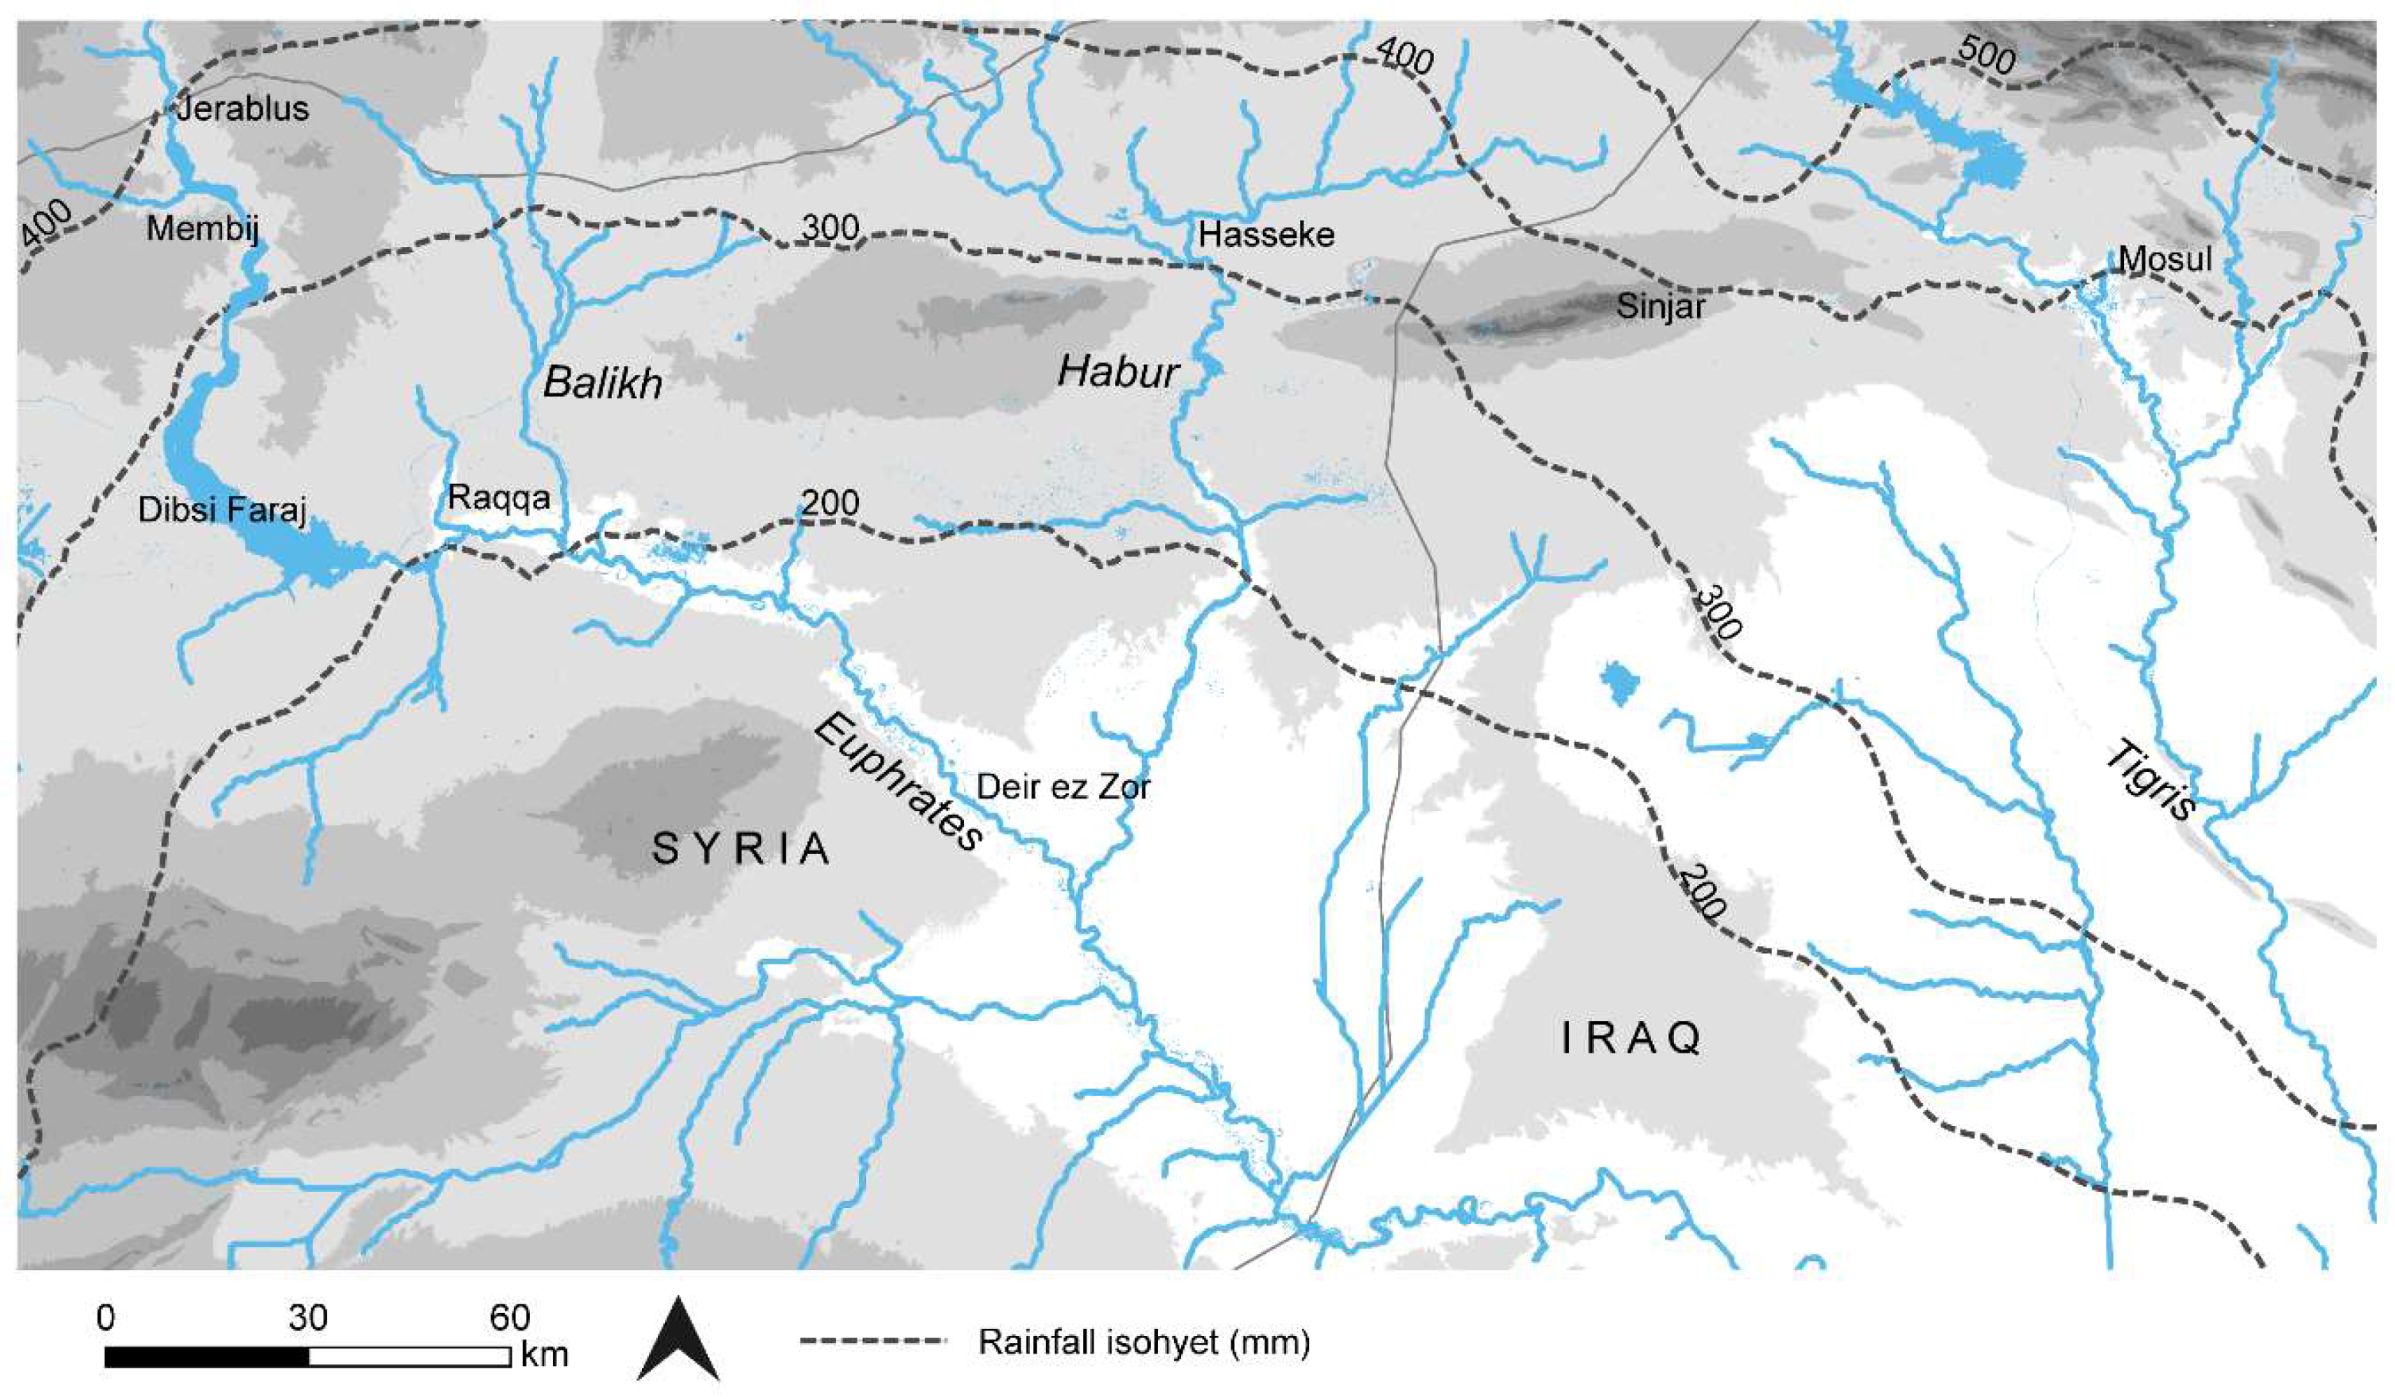
This research used satellite remote sensing to examine the spread, scale, and distribution of ancient water management systems throughout Northern Mesopotamia, an area of approximately 100,000 km2 between the Euphrates and the Tigris rivers in northern Syria and Iraq (see Figure 1). Wilkinson and Rayne [1] have hypothesised that powerful ancient empires transformed the environment using irrigation systems and created “hydraulic landscapes” structured around water management. To test this hypothesis, we aimed to (1) measure the extent to which the density of water management features increased at the time of the later territorial empires (from ca. 1200 BC to AD 1500, Table 1), and (2) identify if there was a peak in any particular period.
To achieve this, comprehensive regional-scale evidence was needed, best provided by satellite data (Table 2). Many ancient irrigation systems can be large-scale features flowing over significant extents. If we mapped these across their full reaches, it was possible to understand how they functioned and how they were designed, revealing information about past agricultural practices.
Unfortunately, recent conflict continues to limit access to Syria and Iraq, and warfare-related damage to archaeology has been high-profile. In addition, ongoing intensification of modern agriculture and urbanisation have had a severe impact on the landscape and its archaeology. This has particularly affected ancient irrigation systems, which are usually collocated with modern agriculture. The construction of new irrigation systems and fields since the 1970s has caused older layouts to be levelled. Large areas of land have been inundated by modern dams, which removed some historic large canals that flowed alongside the Euphrates near Tell Fray and Dibsi Faraj (see References [1,2]). The historical bird’s-eye view offered by declassified cold war (1960s–1970s) satellite imagery enabled the layout and function of these complex hydraulic features to be interpreted. Contextualising this mapped evidence with the archaeological and historical evidence for dating and function allows the political and economic implications of past water management to be understood.
The Assyrian empire was responsible for some of the first large-scale water features known in Northern Mesopotamia, in particular the Neo-Assyrians, who were active in northern Iraq in around 1600–1200 BC. Neo-Assyrian deportation and resettlement programs brought previously marginal agricultural lands into cultivation [5]. Their waterworks, often consisting of large-scale canals and inscriptions decorated with state propaganda, are well known (e.g., References [6,7,8]).
The empires and states that followed (e.g., the Hellenistic, Roman, Umayyad, and Abbasid states) were also able to control large areas of the Northern Mesopotamian landscape, supporting their economies with agriculture and trade. Well-dated water management features of this period are known, including a canal in the Balikh [9] and rock-cut water conduits in the Jerablus area [2,10]. Throughout the time of the later empires (from ca. 2nd millennium BC), and especially by the Early Islamic period (ca. 8th century AD), water management technology was widespread [1,2,11], including alongside the difficult-to-control Euphrates [12,13,14] as well as intensive cultivation in tributaries such as the Balikh and the Habur [1,11,15,16]. Increased uptake of water management technology at this time may have been related to specific Early Islamic policies of bringing more land into cultivation [17] (pp. 181–182).
The environmental context in which irrigated agriculture was developed in Northern Mesopotamia is significant. Rain-fed cultivation (roughly, where rainfall is at least 200–250 mm on average per year, see Reference [18]) is technically possible in the north, meaning that irrigation is not necessary for successful agriculture, although precipitation is variable, making reliance on it risky. Northern Mesopotamia receives sufficient rainfall for the growth of vegetation in non-irrigated areas, although the steppe is sparsely vegetated. However, irrigable areas with perennial water sources are as attractive to present-day cultivators as they were in the past, so land cover in these zones tends to be intensive arable cultivation of crops including wheat, cotton, and fruit [19]. The rain-fed north is in contrast to southern Iraq, which Wittfogel [20] used to illustrate his theory of “oriental despotism”. He proposed that the development of irrigation in southern Iraq led to a need for bureaucracy, which in turn drove the development of the state [20]. Ancient Mesopotamian irrigation was traditionally viewed in the context of this theory and this much drier region, where rain-fed cultivation was not possible. Salinization as a result of irrigation may also have been a particular problem in the south [21].Throughout Mesopotamia, soil has been degraded due to human activity [22]. Principally, however, the only soils really suitable for arable cultivation are the moisture-retaining alluvial river valleys [23].
Proxy evidence has indicated that there were increased trends toward aridity from around 2000 BC in Syria [24] (p. 1011), and that rainfall amounts may have been similar to today’s throughout the time of the later territorial empires [25] (p. 166). Increased dryness has been suggested for the medieval period in the eastern Mediterranean, a symptom of the “Medieval Climate Anomaly” (MCA), and has been linked to historical economic processes [26]. Some regions may have been as warm as the 20th century at this time [27] (p. 386). The results of our research correspond with this, revealing extensive irrigation in the rain-fed zone during the time of the later territorial empires, especially in the medieval period.
Archaeological and historical research has identified traces of former canal systems in the rain-fed zone of northern Syria and Iraq. Many of the studies have focused on specific features or have taken a historical approach. For example, Dalley used Assyrian documents and art to understand water management features in the Neo-Assyrian heartland around cities such as Nineveh and Nimrud [7] (p. 53). Kamash described historical and archaeological evidence of irrigation features throughout the region, with a focus on the Roman period [28,29]. In some cases, single sections in individual canals were excavated [12], providing chronological evidence, although scientifically dated examples such as these are still relatively scarce.
Increasingly, archaeologists are using remote sensing to record features relatively quickly and cheaply in the Near East, including satellite imagery [30] and aerial photography [31]. This often allows examination of areas where fieldwork is not possible due to conflict [30]. A few studies have used image interpretation methods to study water management in the Near East. Ur [8] and Altaweel [32] examined Neo-Assyrian canals in Northern Iraq. Aerial photographs were examined for the Habur [33] and parts of the Balikh (Wilkinson personal communication. 2010).
These reviews represent scattered studies. A regional-scale and long-term view of the entire landscape does not exist, which makes it impossible to understand the development of water management activity throughout Northern Mesopotamia over time. The present study addressed this gap, generating a map of ancient irrigation systems across northern Syria and Iraq and revealing particularly dense irrigation in the Balikh Valley of Syria. The existing literature and detailed archaeological and historical implications of this research have been discussed in additional publications [1,11,15,16]. This paper outlines our methodology, which used remote sensing to map the ancient landscape, and presents the key results.
2. Materials and Methods
2.1. Satellite Imagery
A range of satellite image data were used to address our objectives (Table 2). The best method of recording water features across a huge region quickly and inexpensively was found to be systematic interpretation of historical and (relatively) high spatial resolution satellite images (CORONA). The satellite images could then be understood by combining them with evidence from ground surveys, excavations, and historical accounts. However, while fieldwork data provided important details such as dating material, the area that could be investigated was limited by time and budget constraints. Water features, especially large-scale reticulated canal systems, can extend for many kilometres. Moreover, they are often complex features consisting of connected and branching channels performing different functions (abstraction, transport, irrigation, drainage). They are usually represented by very faint and ephemeral earthworks and soil marks, which are difficult to identify on the ground but which are clear linear features in satellite images and some elevation models.
A retrogressive analysis of Landsat images (from 1985–2017) was used to understand the extent to which the study area has changed. Landsat images corrected to top of atmosphere (TOA) reflectance were obtained using Google Earth Engine (GEE) by filtering the image catalogue by location, date range, and cloud cover (less than 10%). Cloud masks were applied. The median values of all pixels in the area of interest over time-steps of two years were composited to make each mosaic (see Supplementary Materials for script and Gorelick et al. [34] for explanation of GEE). The composites were visualised as false-colour composites using the near-infrared band as a way of highlighting vegetation (including irrigated areas).
Modern high-resolution images were examined (e.g., via Google Earth), but most ancient irrigation features had been destroyed by the time these images were produced. To view Northern Mesopotamia before modern agriculture had changed it, CORONA images were used. Because the CORONA imagery is panchromatic, spectral analysis was not possible using this data. The remains of ancient irrigation systems are generally too small to be identified using freely available multispectral imagery such as Landsat. The applicability of high-resolution multispectral satellite imagery (e.g., WorldView, IKONOS) was very limited, because the archaeological remains of ancient canals had been mostly destroyed by modern agriculture before this type of data became available.
The CORONA project operated for United States (US) intelligence purposes and was the first satellite mission to take systematic pictures of the earth’s surface. In 1995, the US government declassified an archive of reconnaissance photography from over 100 separate low earth orbit missions from 1960 to 1972. The camera systems on the CORONA programme evolved through time, and since February 1962 the KH-4, KH-4A, and KH-4B included modifications to the design to allow calibration and measurements to be made from stereoscopic imagery.
The ground resolution of CORONA imagery varied with each mission depending on the altitude of the satellite and its orbit characteristics. KH-4B imagery achieved a spatial resolution of 2 m. The wide frame of CORONA images combined with their relatively high spatial resolution makes them useful for identifying archaeological features. Most importantly, however, they show a view of the landscape shortly before it was irreversibly changed by modern agriculture and urban expansion. Given these properties, they have been increasingly used to map archaeological remains (e.g., Reference [30]).
We were able to obtain orthorectified CORONA KH-4B imagery for the entire study region of northern Syria and Iraq through collaboration with the Fragile Crescent Project (FCP) [35], from the USGS and through the CORONA Atlas of the Middle East [36]. We processed some images photogrammetrically (outlined below in Section 2.2). This involved placing control points, generating tie points, and performing triangulation using ERDAS LPS version 10.1.
2.2. Hydraulic Context and Terrain Extraction
The design of any water management system is influenced by the existing topography. Knowing the steepness of canals and the gradient of the landscape through which they flow allows us to analyse how they functioned and where they abstracted water from, as well as to further confirm their interpretation as water features. While in the past archaeologists have undertaken slow and laborious surveys from the ground to obtain the measurements of short segments of canals as well as the topography of the land, remotely sensed elevation data offers faster ways to model much larger areas in 3D. Given this, we used the SRTM DEM to model the landscape of Northern Mesopotamia. For a few selected areas in the Balikh Valley, we used CORONA photogrammetry to model the morphology of specific canals at higher resolution and as they were at the time the CORONA images were collected. These canals have since been damaged or obliterated completely by modern agriculture.
The SRTM DEM (collected in 2000) was created from interferometric radar data and has vertical accuracy of approximately 9 m [37], with versions available in 90 m and 30 m spatial resolutions. SRTM was used extensively in this study to measure the hydraulic properties of ancient water management features, despite its relatively coarse spatial resolution, in the absence of freely available higher resolution DEMs.
However, 3D information extractable by photogrammetry from CORONA images is of particular value, allowing high-resolution DEMs to be generated for case studies. The satellite KH-4B was equipped with two panoramic cameras, in forward and aft positions on the satellite. Although these were intended for manual stereoscopic interpretation, we can now produce digital DEMs using these “stereopairs” by calculating the degree of parallax between conjugate points in each image using dedicated software (in this case the ERDAS photogrammetry toolbox). Of the CORONA satellites, KH-4B offers the best image quality and an overlap of 10% in the flight direction [38]. In order to determine the dimensions (x, y, z) of points in the two images making up a stereopair, the relative orientation of the camera needs to be established from specific parameters of camera rotation and base line direction (exterior orientation) [39], as well as the ground coordinates of at least 3 points [40]. In the case of CORONA images, some of these parameters have to be calculated because they were not released as part of the declassification process along with the images (Table 3 lists known parameters). This information is needed to determine the geometric relationship between the ground, the image, and the sensor.
Archaeologists working in the Near East have found CORONA stereopairs to be of value for recording the distinctive shape of Bronze Age Tell sites and settlements, for example Galiatsatos et al.’s [43] models of archaeological settlements. Casana and Cothren [44] also used photogrammetry to reconstruct several Tell sites. Due to distortions across the panoramic frames, they found that better results could be obtained by subsetting the frames into smaller areas [44].
Although many archaeological studies using historical imagery have relied on manual stereoscopy, for this project we focused on producing automatically extracted terrain models using photogrammetry software. Once a camera model and DEM extraction method were set up, then these were applied to subsets of multiple areas of interest. The orientation of the camera was established from parameters of rotation (exterior orientation) and interior orientation (e.g., focal length, principal point). This information was used to perform collinearity, which describes the relationship between the ground and image coordinates and the camera [39].
In this case, a stereopair dating to 4 November 1968, was used. Three sample areas in the Balikh were subsetted and processed using the software ERDAS LPS Version 10.1. While not all exterior and interior orientation parameters were known, a nonmetric camera model could be applied using the known details of flying height, focal length, and scanned pixel size (see Table 3). Sufficient control points were placed in order to mitigate against the lack of known orientation parameters and to estimate the exterior orientation parameters (coordinates of the principal point and the rotation angles) through the process of space resection. Good ground control points, for example differential GPS points, were not available for this project due to the security situation in Syria. In 2010, we were not permitted to use GPS during fieldwork and were not able to return for future field seasons due to the war that broke out in 2011. However, DEMS could be generated from CORONA without field-based ground control, as Galiatsatos et al. demonstrated [43]. Instead, x and y coordinates were collected from other sources, including rectified CORONA images, modern satellite imagery, and Google Earth, and z coordinates were obtained from SRTM DEM, with as many as 87 control points obtainable in this way, for example for the DEM of the Nahr al Abbara system (Table 4).
Triangulation was performed in 10 iterations using a bundle block adjustment with a least squares solution applied to the tie points and orientation information. The triangulation results of each point were examined in order to determine accuracy (Table 4). Control point values were calculated by the software following the bundle block adjustment and calculation of estimated orientation parameters. The standard deviation of the control point residuals (the difference between the original points and the calculated values) are listed in Table 4 (mX, mY, mZ). The root mean square error (RMSE) is a global indicator of the quality of the DEM based on the image coordinate residuals (e.g., see Reference [43].)
Some erroneous control and tie points were identified through this process and removed, improving the RMSE. Overall, these were considered to be within thresholds sufficient for the purposes of our research. Standard deviations were between 2 and 7 for the control points of all DEMs. The highest error was in the vertical of the Sahlan-Hammam canal. Low contrast for this part of the stereopair made placing points difficult. Values for individual control and tie points are set out in the Supplementary Materials. A sum of squared differences (SSD) correlation algorithm was applied to the subsetted CORONA stereopairs in order to measure parallax and extract DEMs. The SSD algorithm (Equation (1)) uses a moving window technique to examine every location in both the images, searching for correlation between the templates and the images. DEMs with grid cell sizes of about 10 m were produced.
SSD (e.g., [45] (p. 45)), f is the image and t is the search template.
2.3. Interpretation Criteria
The study region measured approximately 100,000 km2. In order to view and interpret CORONA imagery for this whole area efficiently, it was divided into transects. Features that could be recognised as pre-1970s water management channels through interpretation of the CORONA imagery were recorded based on selected criteria that we describe here (see Figure 2).
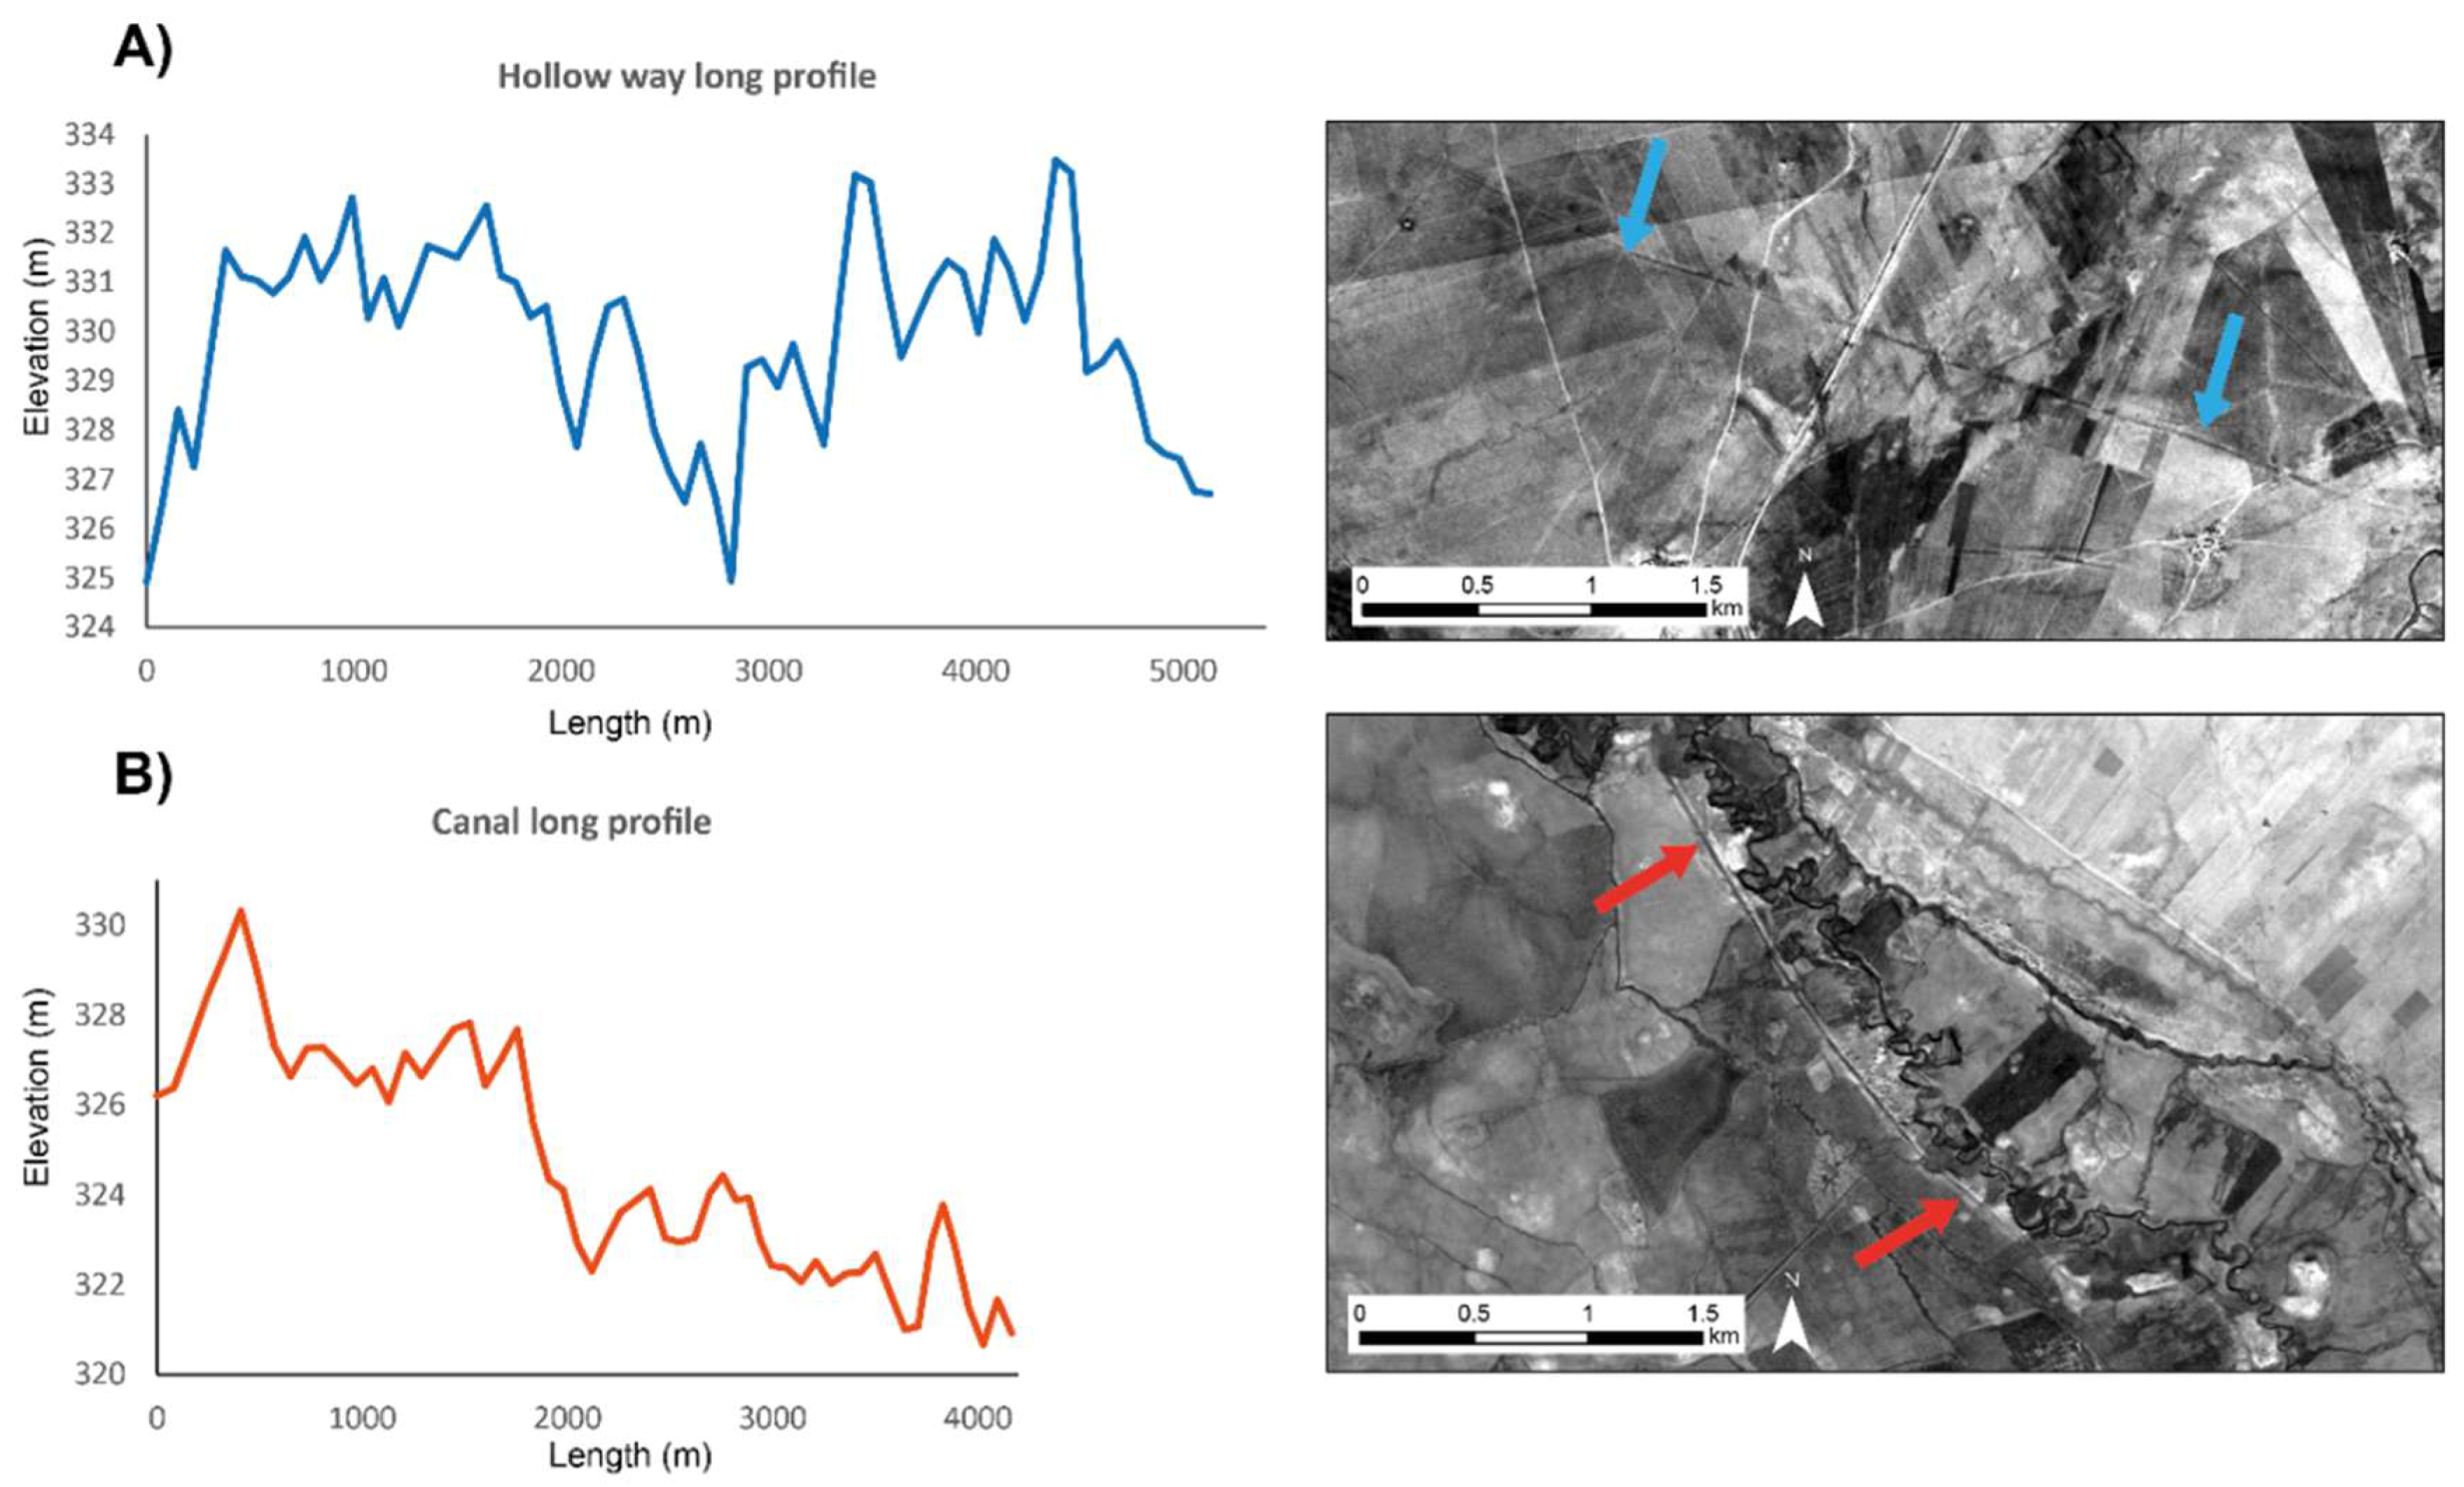
The trace (overall pathway), form (relative sinuosity), and embankment of canals varied depending on their context. Figure 2 shows pre-modern canals that were generally linear but not always completely straight. Some had prominent upcast banks as a result of their construction and maintenance (Figure 2A). In some cases, their gradient caused them to flow along a linear but sinuous trace (Figure 2C). Scholars have debated whether hollow ways (ancient tracks) and canals can be distinguished (e.g., Reference [46]): However, in most cases, ancient canals flowed downhill, following the contours of the landscape, while hollow ways did not need to conform to this (Figure 3), so landscape gradient derived from the SRTM DEM was used as a variable to assist interpretation. Known ancient irrigation systems consisting of reticulated canal networks tended to function by gravity flow. Where gravity-fed irrigation was possible, it is unlikely that the expense and difficulty of water lifting (e.g., pre-diesel pump) would have been preferred. Other water features such as qanats and tunnels were also recorded (e.g., Figure 2D). These are visible as a line of “dots” representing upcast soil surrounding maintenance and air shafts. It could be difficult to distinguish between groundwater-collecting qanats and tunnels that transported water from perennial watercourses and springs unless the abstraction point was clear.
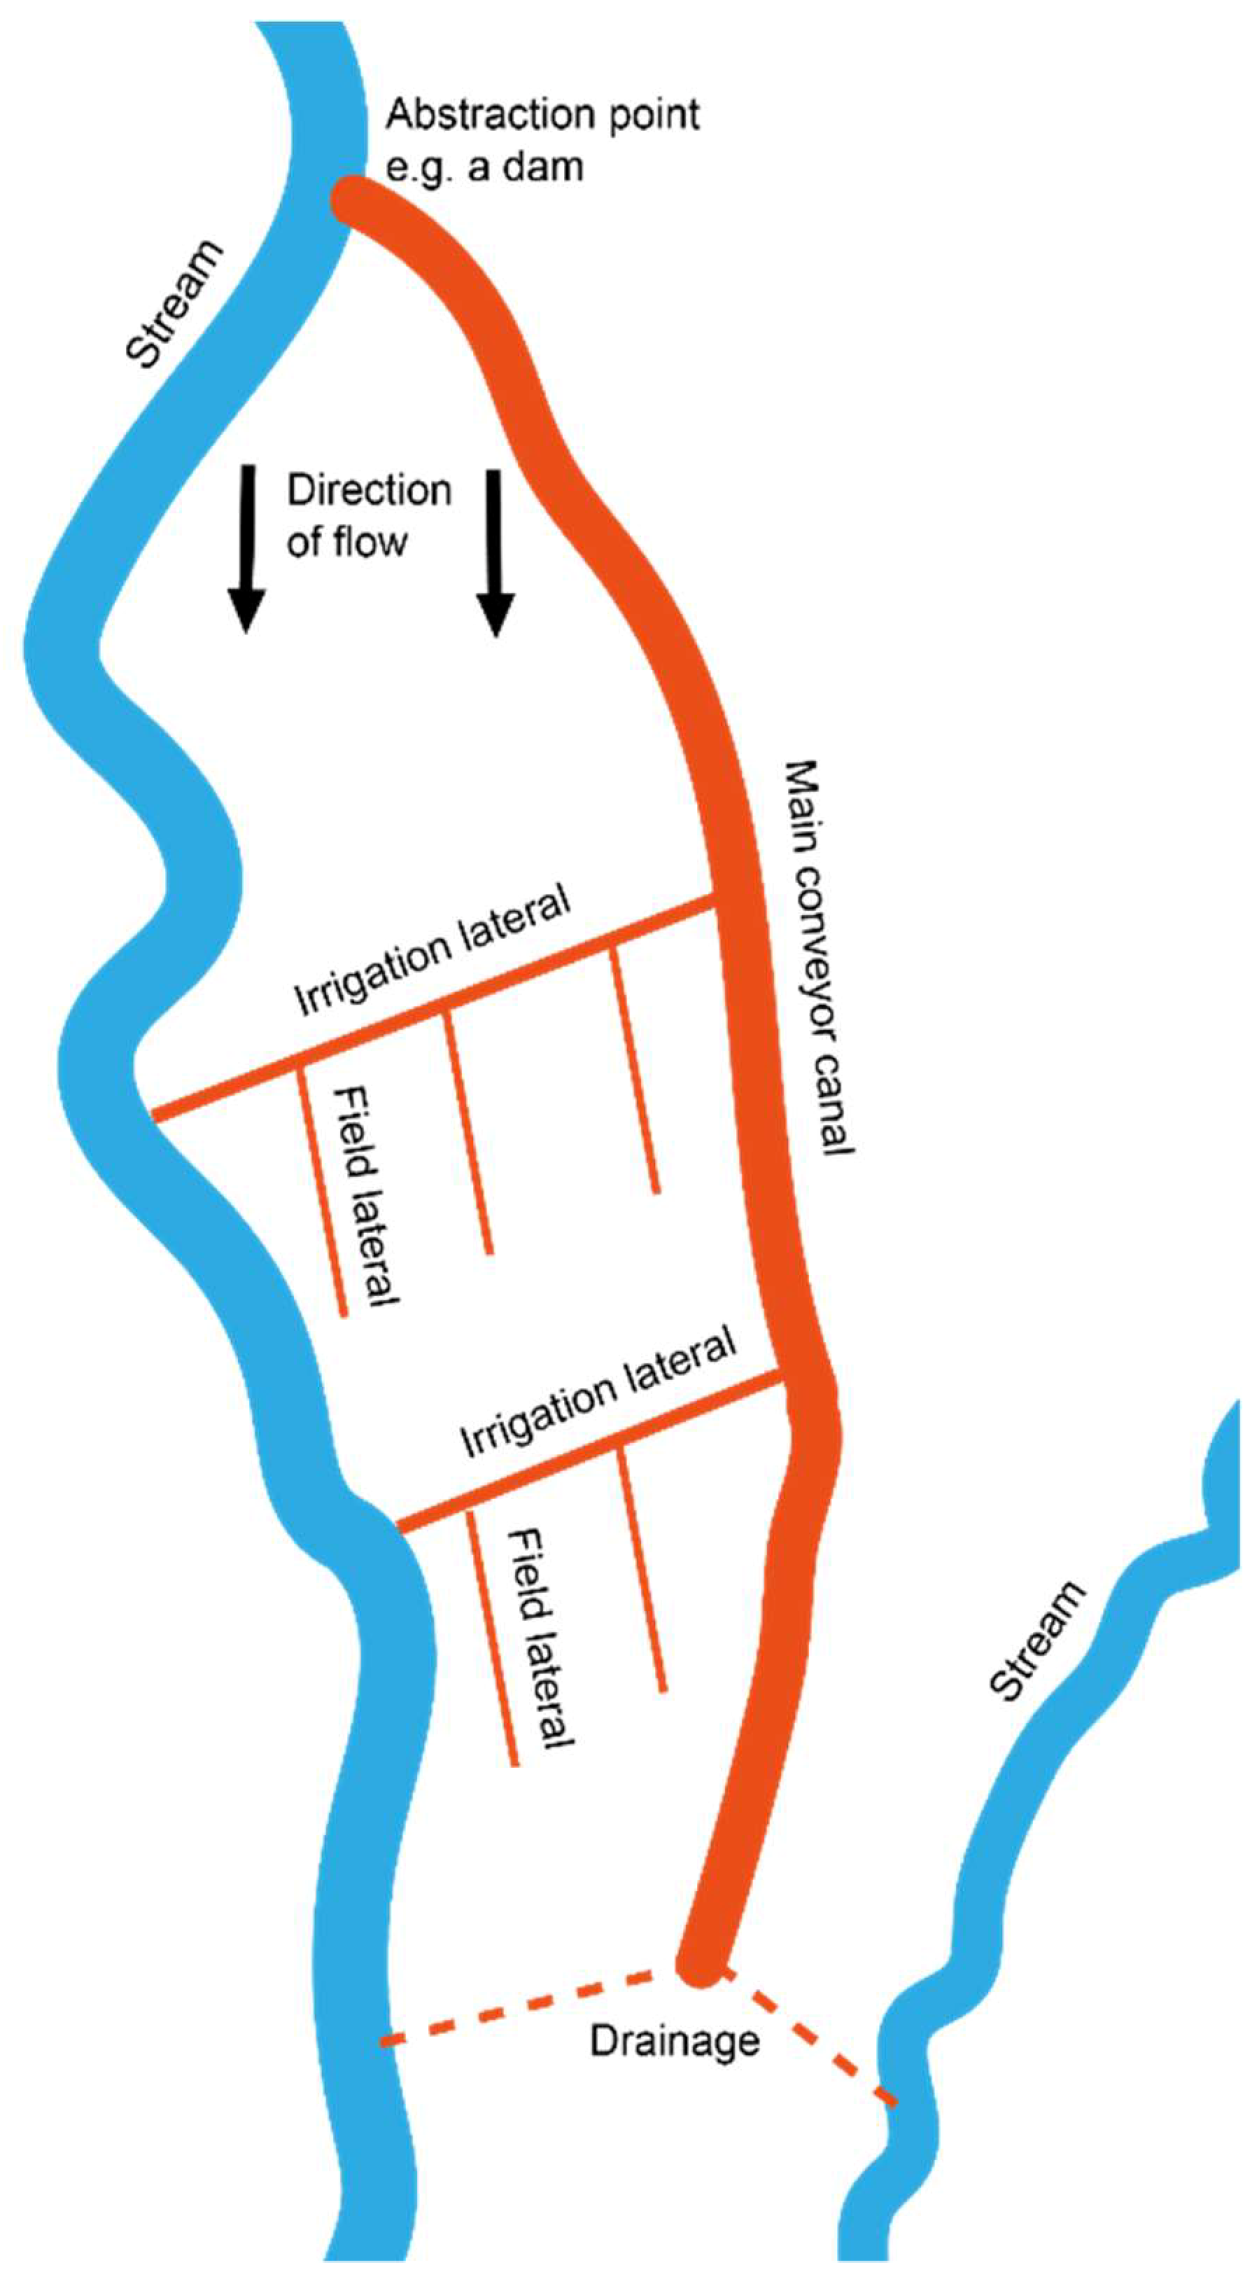
In order to understand how ancient irrigation systems functioned, the different segments of a system should be recorded. As Figure 4 shows a reticulated canal system consisted of an abstraction point, a main transport/conveyor channel, offtakes (irrigation laterals and field laterals), and drains. Many archaeological studies have recorded and examined the main channels of ancient canal systems, but not much research has investigated all parts of the system, including the laterals that delivered water into the fields. We have found that in some cases these can be identified through an analysis of imagery and DEMs. The early Islamic Nahr al Abbara in the Balikh Valley north of Raqqa in Syria is a good example of a well-preserved reticulated layout as it was at the time of CORONA [1,11,15,16], which has been visited in the field [9].
However, in many cases only a main canal remained visible in the imagery: Smaller distributaries do not usually leave traces. This includes prominent canals alongside the Euphrates and in northern Iraq [15,16]. Even the abstraction point tends to be unclear, although it can be projected based on the relative levels of the river and fields [15]. Often, only the tunnel part of qanats and tunnel irrigation systems have survived, without the lateral channels that delivered the water directly to the fields and crops.
2.4. Archaeological Survey and Dating Evidence
Contextualising the evidence with data from archaeological surveys allowed us to link the water management features with dating material in order to understand their chronology, for example the work done by Wilkinson to investigate the canals in the Balikh (e.g., Reference [9] and unpublished data). The significance of the dated canals was then examined further by reference to historical sources [47].
Fieldwork was undertaken at the outset of this project in 2010 in Syria. We conducted walk-along surveys of selected irrigation features and of specific locations along others. Canals in the Jerablus and Raqqa areas were visited and recorded, with some new features identified [2,48,49]. Given the difficulty of undertaking further fieldwork in the Middle East at present, data were sought from existing published and unpublished surveys and excavations. These included Wilkinson’s work in the Balikh [9] and Dibsi Faraj [12], surveys undertaken by Ur [8] and Altaweel [32] in northern Iraq, and others throughout Northern Mesopotamia (see References [15,16] for more detailed literature reviews).
In a few cases, excavation of sections across canal beds had provided organic material from within the fill of canals, allowing the dates of their construction and use to be obtained. Remains from a section of the Sahlan-Hammam canal excavated by Wilkinson gave an uncalibrated date of 1380 + 70 BP (Beta-78543), which is around 570 AD [9] (p. 71), placing it within the period of the later empires. Similarly, an Early Islamic date was obtained through excavation of a prominent canal on a terrace of the Euphrates, which was associated with the Early Islamic site of Dibsi Faraj [12].
At some locations, surface surveys alongside the remains of ancient canals yielded dating information. The Nahr al Abbara in the Balikh was dated to the Early Islamic period in this way [9]. Other canals, such as the system in the southwest of the Balikh Valley, could be more tentatively dated by association with known Islamic features north of Raqqa [15]. The features that could be dated to the period of the later empires through excavation, survey, or historical evidence, and by association, were plotted on a map (Figure 5).
3. Results
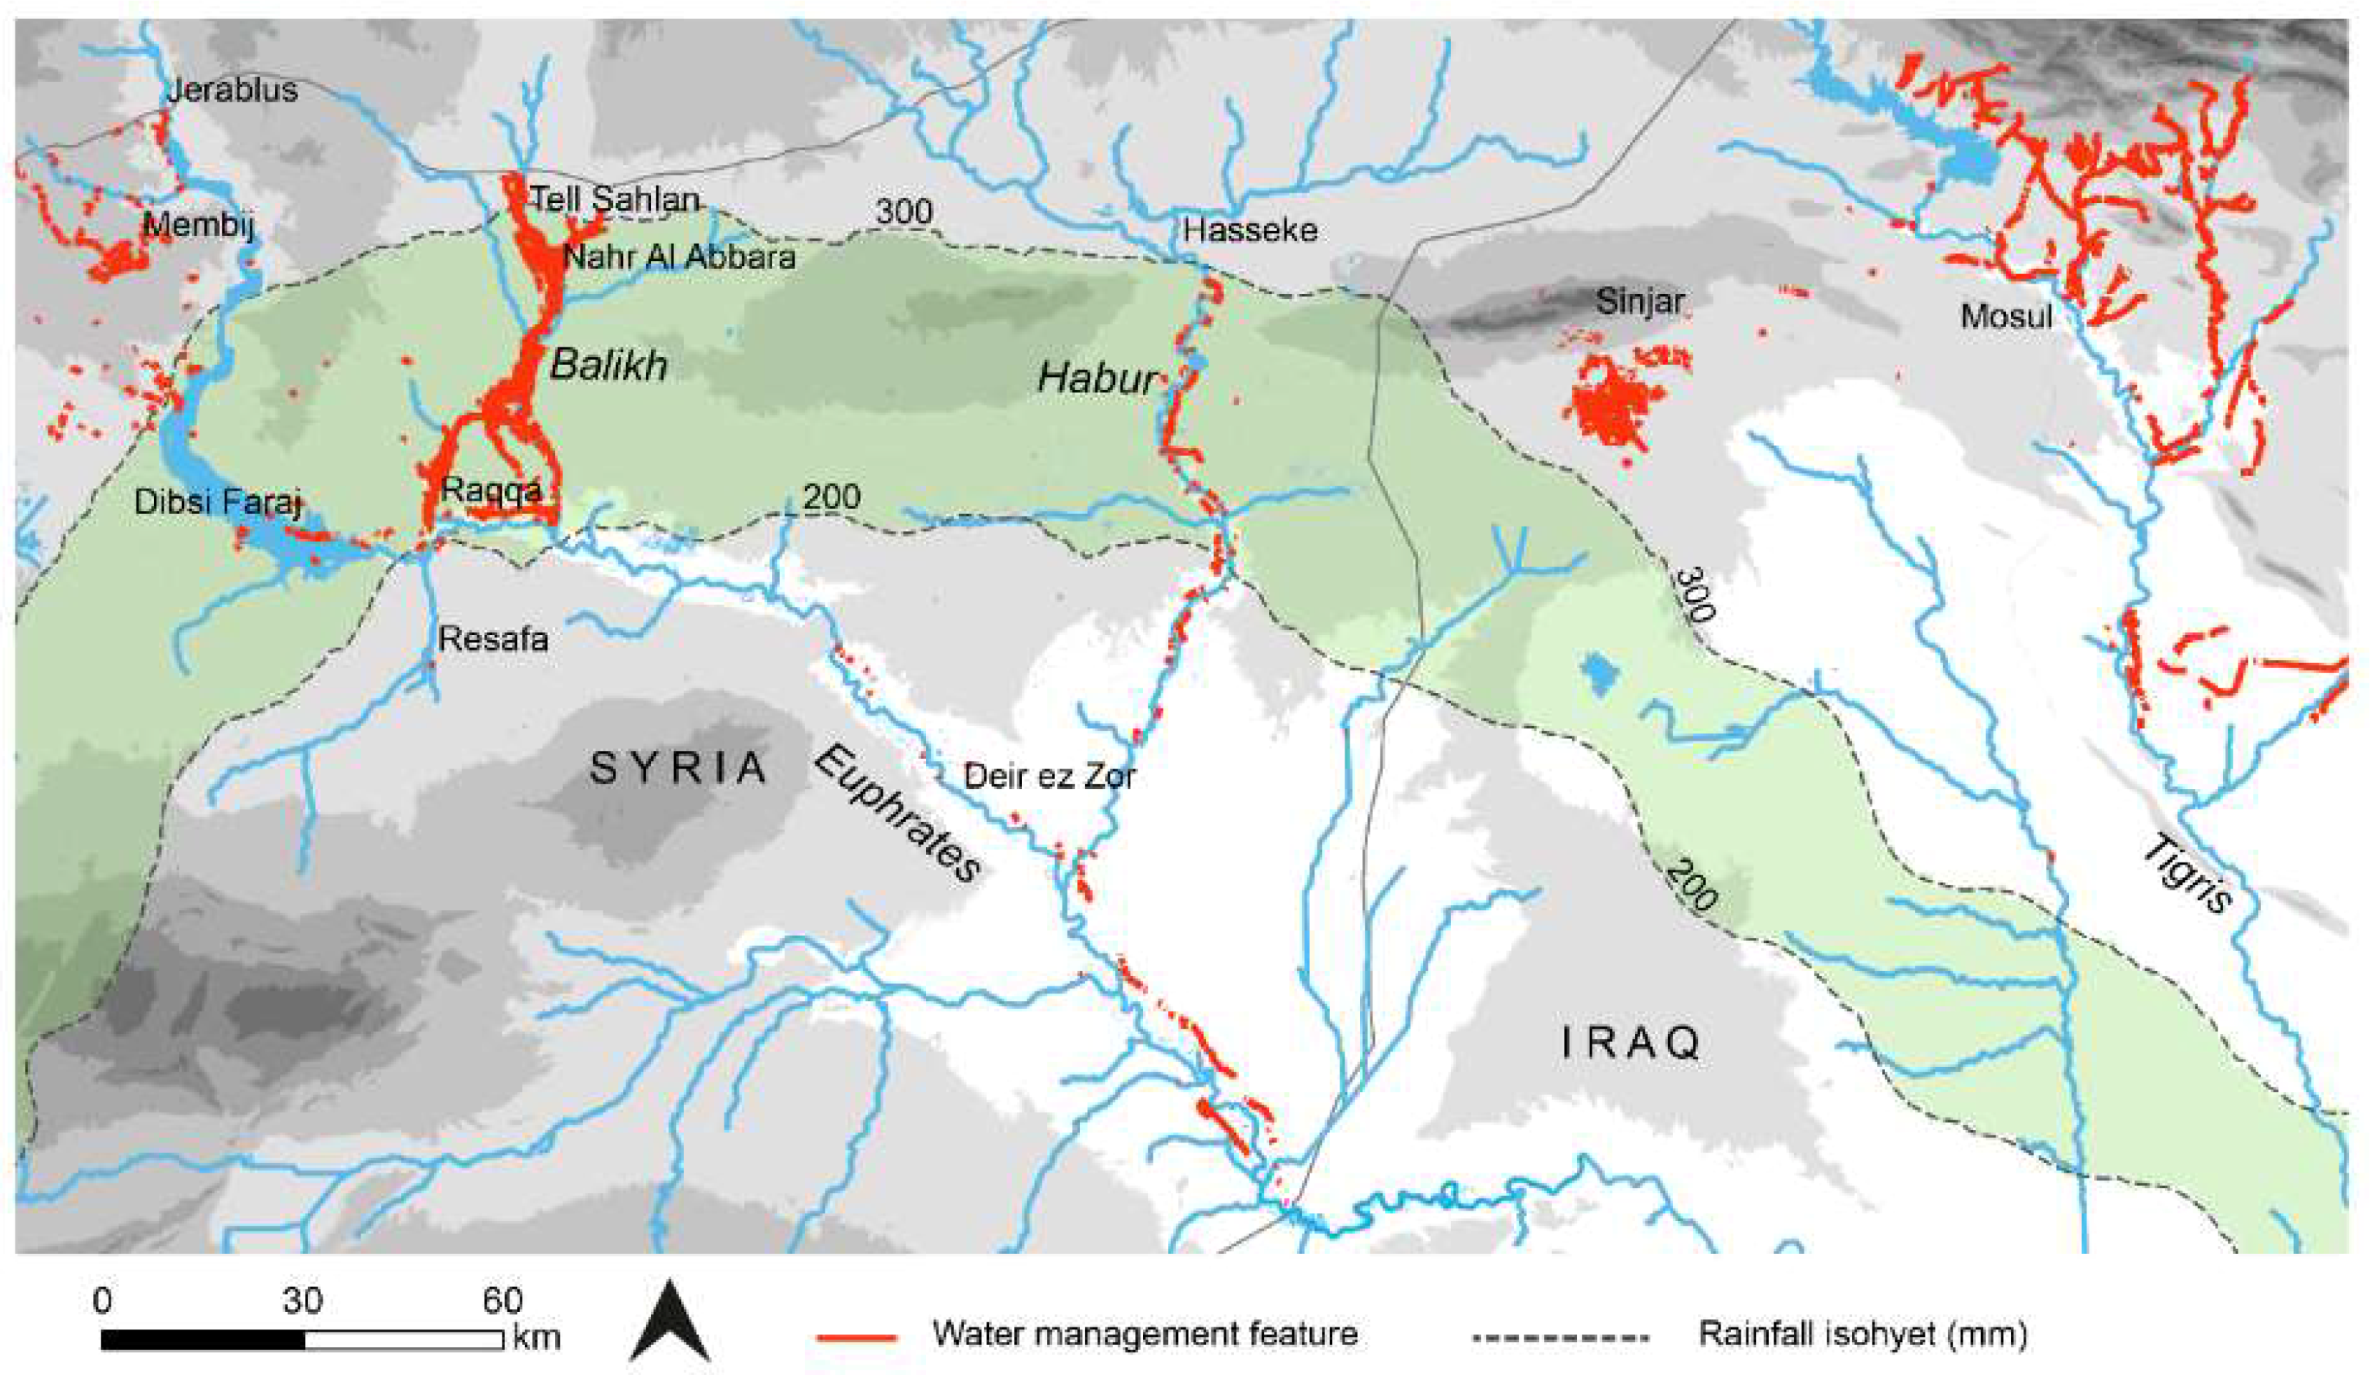
Figure 5 shows the results of applying our methodology to an area of over 100,000 km2. A comprehensive map of irrigation at the time of the later empires did not exist prior to this study. The image interpretation exercise using CORONA proved to be the only practical way of mapping ancient water management across the entirety of Northern Mesopotamia and revealed over 2900 km of canals and qanats. Canals already known in archaeological and historical sources were located, for example the Nahr Maslama at Dibsi Faraj [12], and mapped using the CORONA in order to place them within their wider regional context. The present study also identified previously unknown features, such as a tunnel at Raqqa [15,16]. By utilising elevation data (SRTM and CORONA DEMs), as well as archaeological and historical records, the context of this map of water management could be recognised. The combined image, elevation, and archaeological data allowed distinct irrigation systems with chronological associations to be understood (Table 5), separating these out from channels or linear features of unknown date and context.
Although anthropogenic processes, natural erosion and deposition activity of the river have removed much of this water management evidence, the surviving traces show that canals were constructed alongside the Euphrates from at least Dibsi Faraj down to Mari and in the northern reaches of the Tigris and its tributaries. Irrigation was also recorded by the tributaries of the Euphrates, the Sajur, Habur, and particularly the Balikh. Qanats extended the range of cultivable lands in Syria and Iraq.
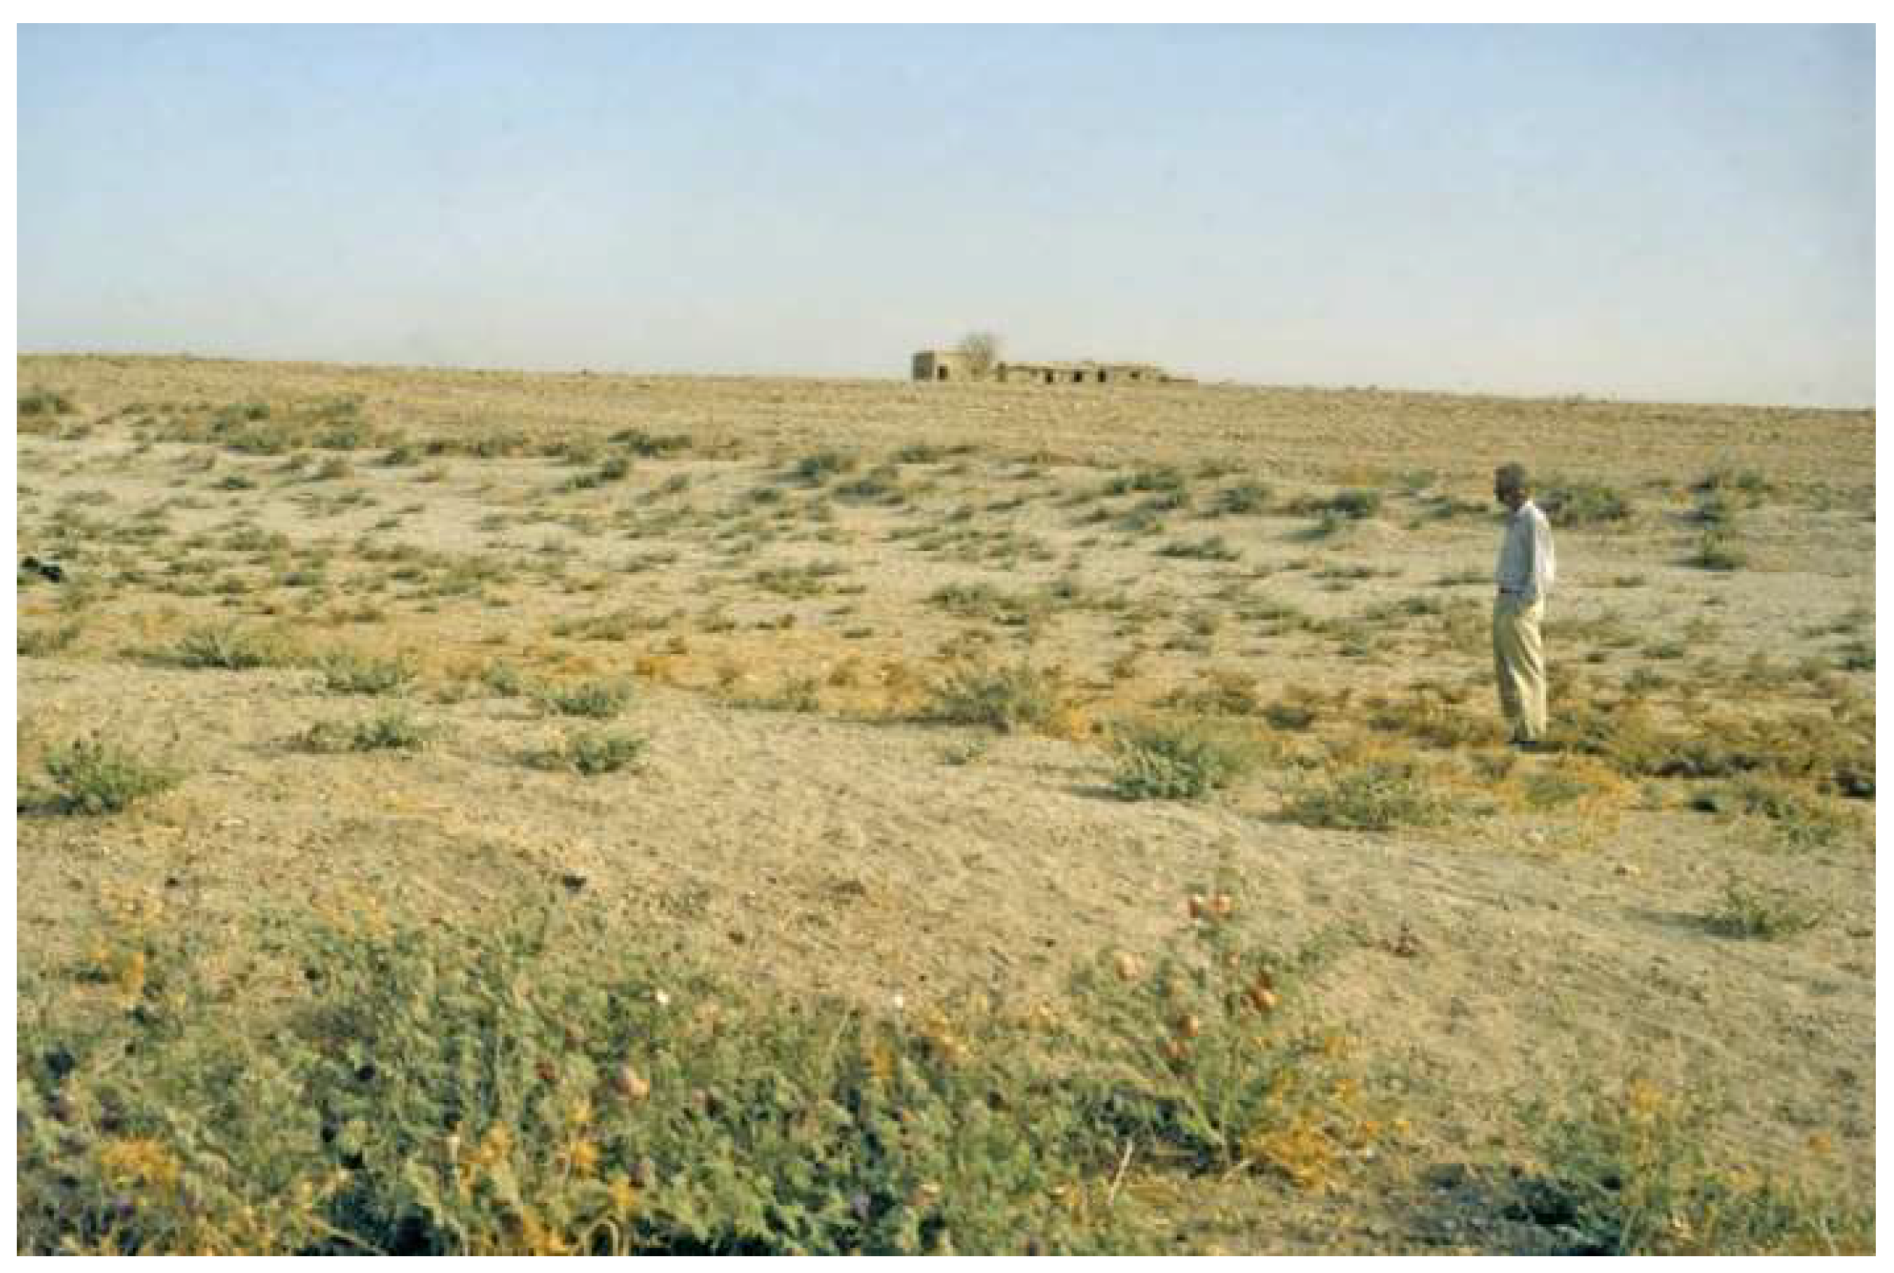
We mapped pre-Islamic water management features in Northern Mesopotamia, including rock-cut conduits near Jerablus (investigated during fieldwork, see References [16,48]) and Hellenistic qanats around Membij (dated by a historical source, see Reference [54]). Although some of the traces of large embanked channels alongside the Euphrates have been attributed to the pre-Islamic era (e.g., Reference [14]), it can be argued the technology capable of facilitating this may not have been widely applied until the medieval period [55] (p. 115). Tributaries such as the Balikh and the Habur were easier to irrigate from, attested by a likely Assyrian origin for canals alongside the Habur [33] and some Hellenistic–late Roman canals in the Balikh dated through excavation, radiocarbon dating, surface survey, and association with dated sites (e.g., the Sahlan-Hammam canal, Figure 6; References [9,11]). The Neo-Assyrian canals in northern Iraq are already well-known, although it is important to note some of the canals in northern Iraq have been attributed to the Early Islamic period (see References [8,32]).
Early Islamic canals were constructed and maintained alongside the Euphrates, for example the large embanked canals of the Nahr Maslama, Nahr Dawrin, and Nahr Sa’id, which are referred to in Islamic texts (see Reference [15,16]). The canals alongside the Habur may also have been used into the Early Islamic period, and a possible connection to the Nahr Dawrin has been proposed [15,16,56].
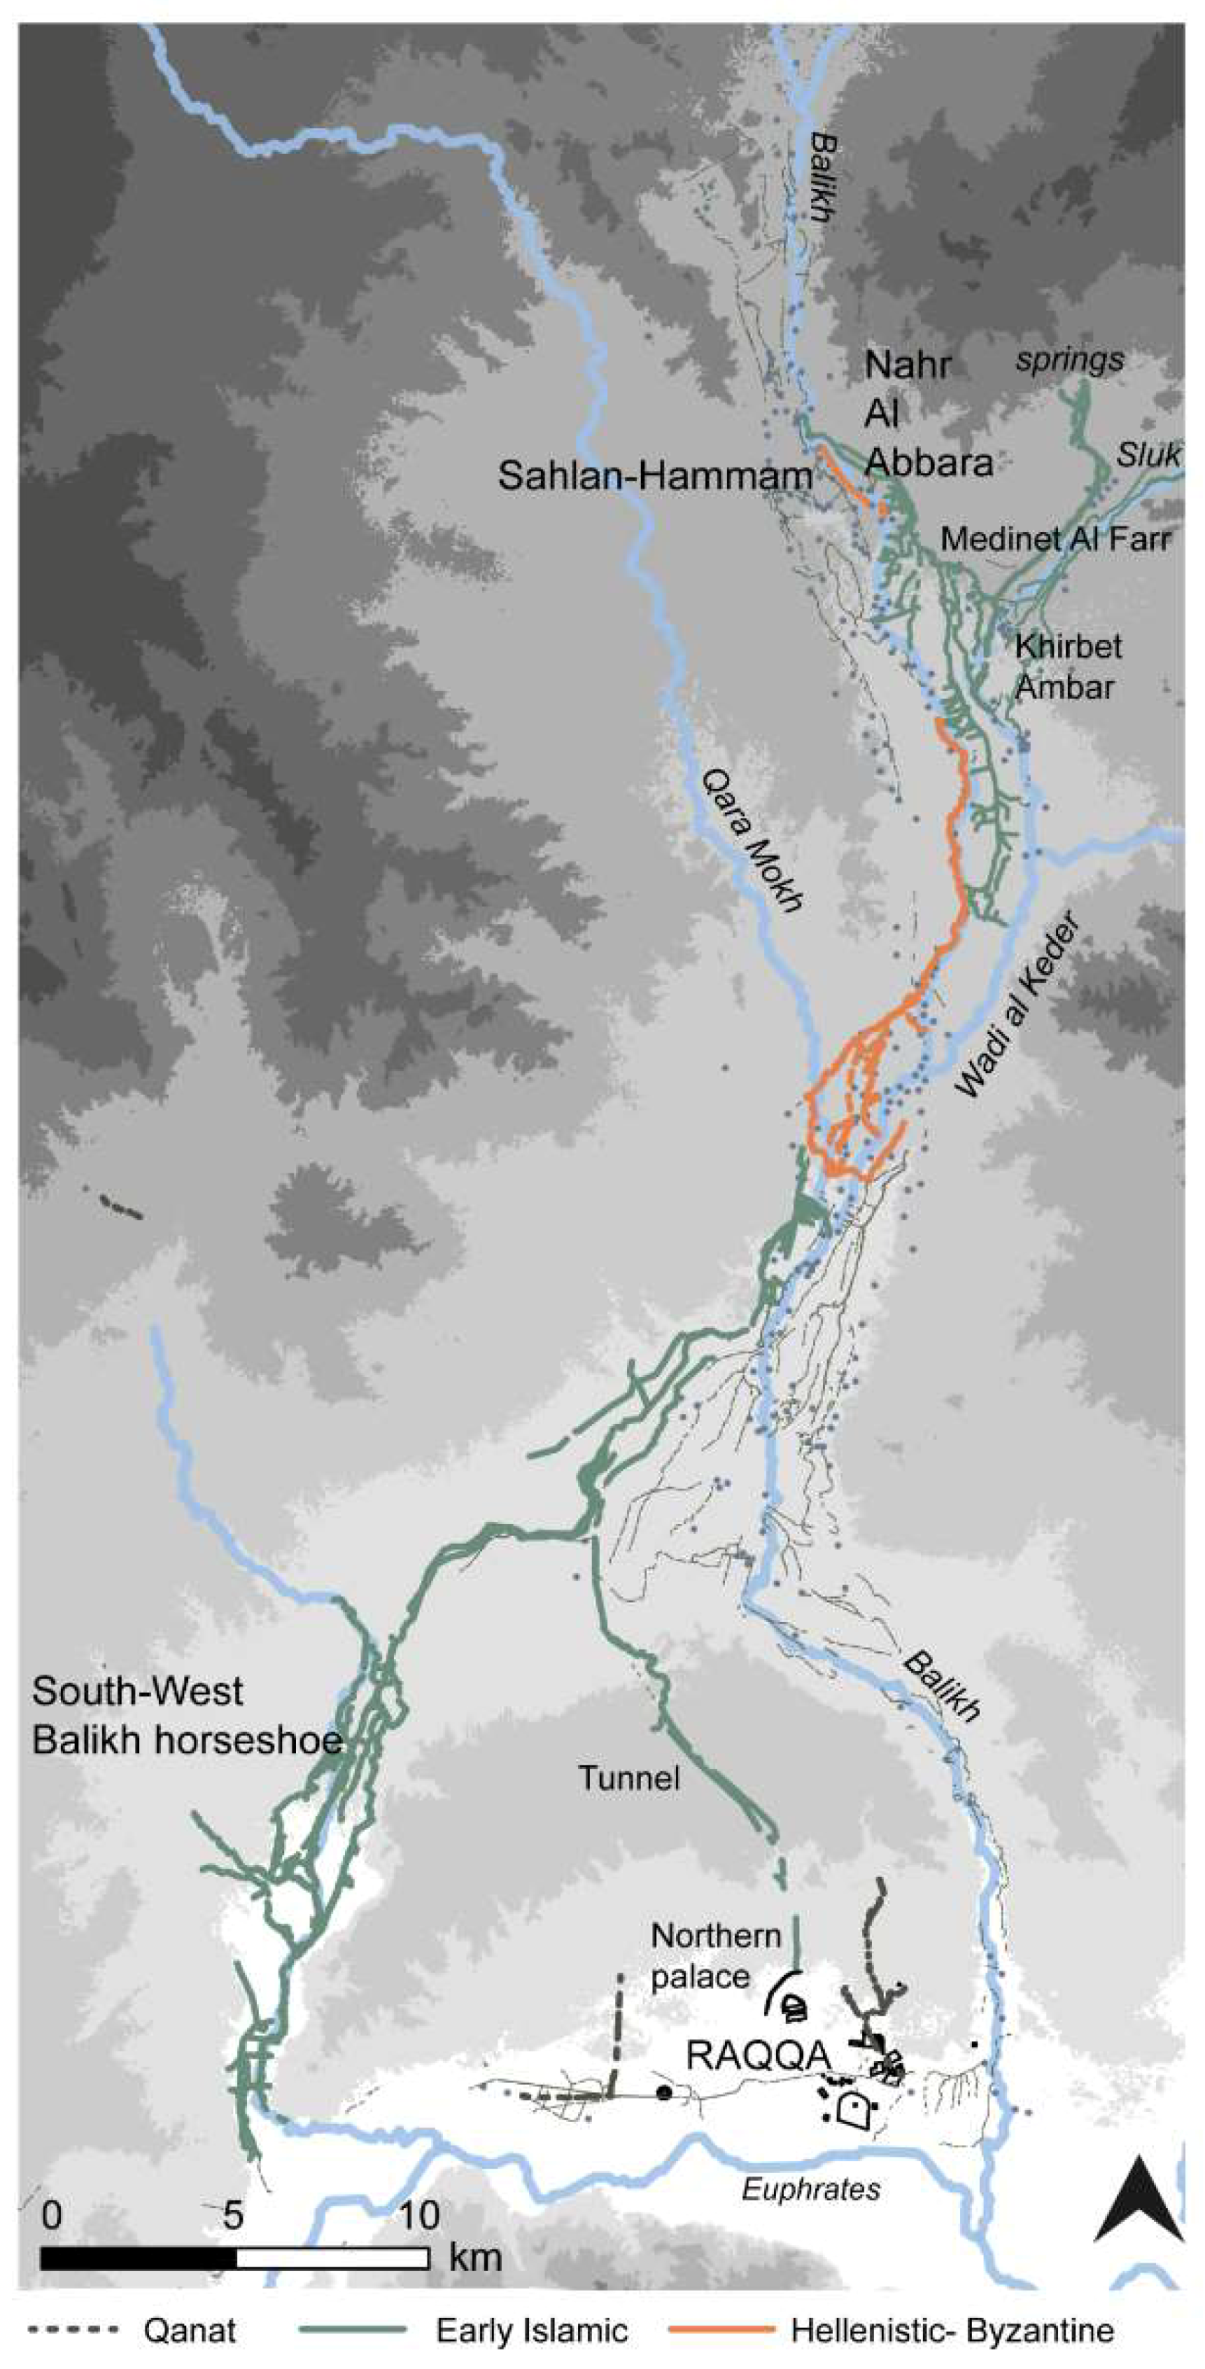
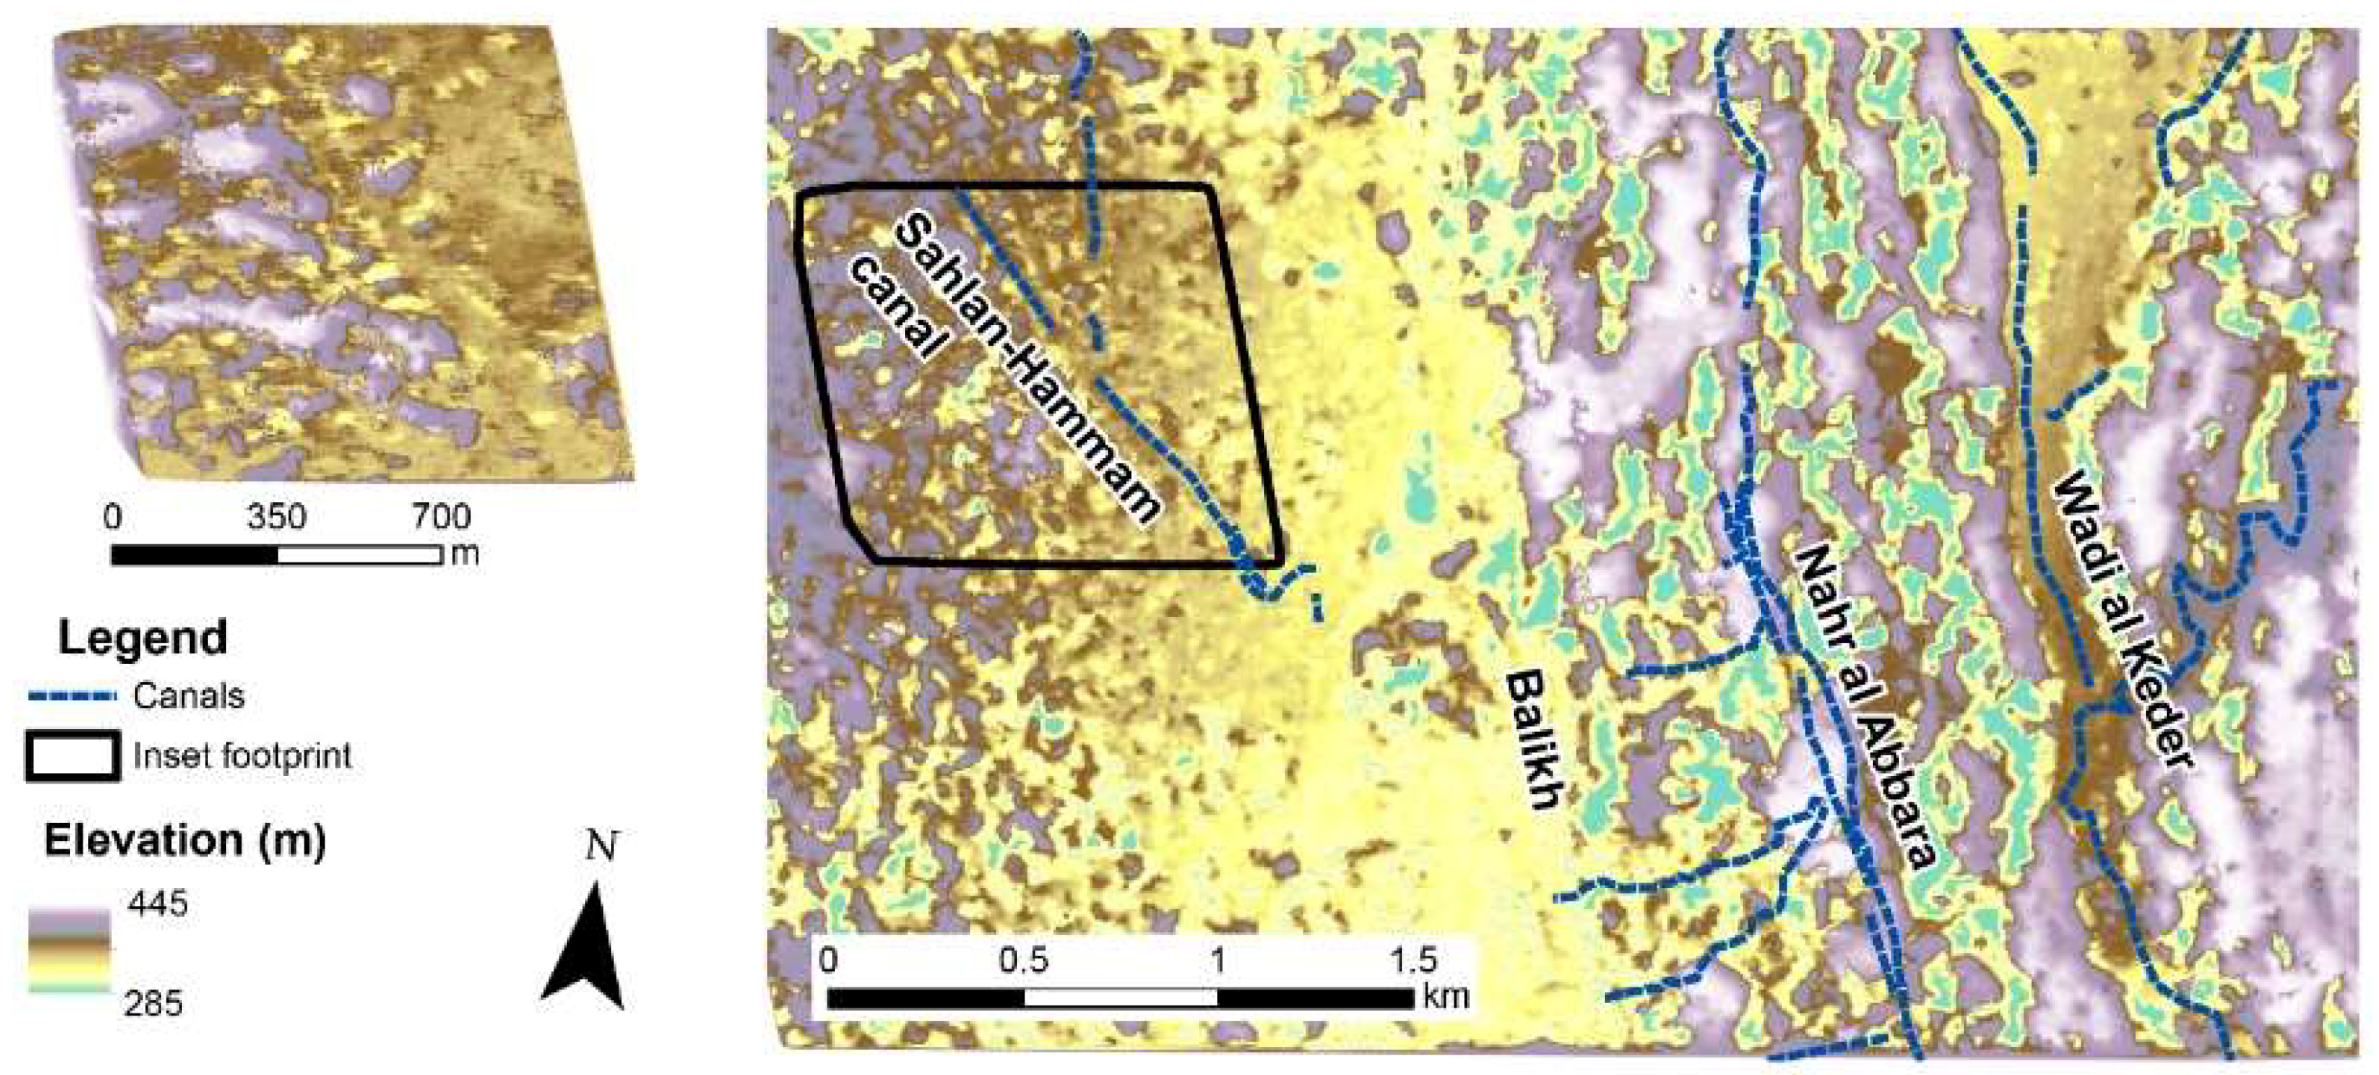
Especially in the Balikh, the analysis of systems that were reasonably preserved at the time of the CORONA images showed a high degree of sophistication and represented hydrological knowledge before the modern era (see Figure 7 and Figure 8). The Nahr Al Abbara, dated through surface survey [9], abstracted water to the north near Tell Sahlan, which it transported in a main canal for over 15 km (see Figure 7 and Figure 8). Traces of an earlier phase of canal on the same alignment could be identified in places using the CORONA imagery (see [2], Figure 6. 38). Water was delivered to fields via laterals branching off the main channel at fairly regular intervals. During a surface survey, Wilkinson [9] (p. 68) recorded large stone blocks that may have functioned as part of sluice structures. As the SRTM DEM confirmed, the overall gradient of the landscape of the Balikh is very flat, but the Nahr Al Abbara system mitigated against it by running the main canal at a low gradient (approximately 0.1%) along a slight and somewhat narrow ridge (see [11] Figure 6). The CORONA DEM (Figure 9) allowed this to be visualised at higher resolution. The main canal could flow for a greater distance, but at the same time the offtakes could attain a slightly steeper gradient (approximately 0.5%). The system also incorporated drainage provision into the Balikh and into the fairly wide basin of a seasonal runoff stream to the east, the Wadi al Keder, and may have been associated with a complex layout of spring water channels and drainage systems (see [11] Figures 7 and 8). There are several Early Islamic settlements nearby, including Medinet al Farr and Khirbet Ambar, which are known through historical sources and archaeological investigations [57,58]. It is likely that these sites were involved in the administration of irrigation in the area.
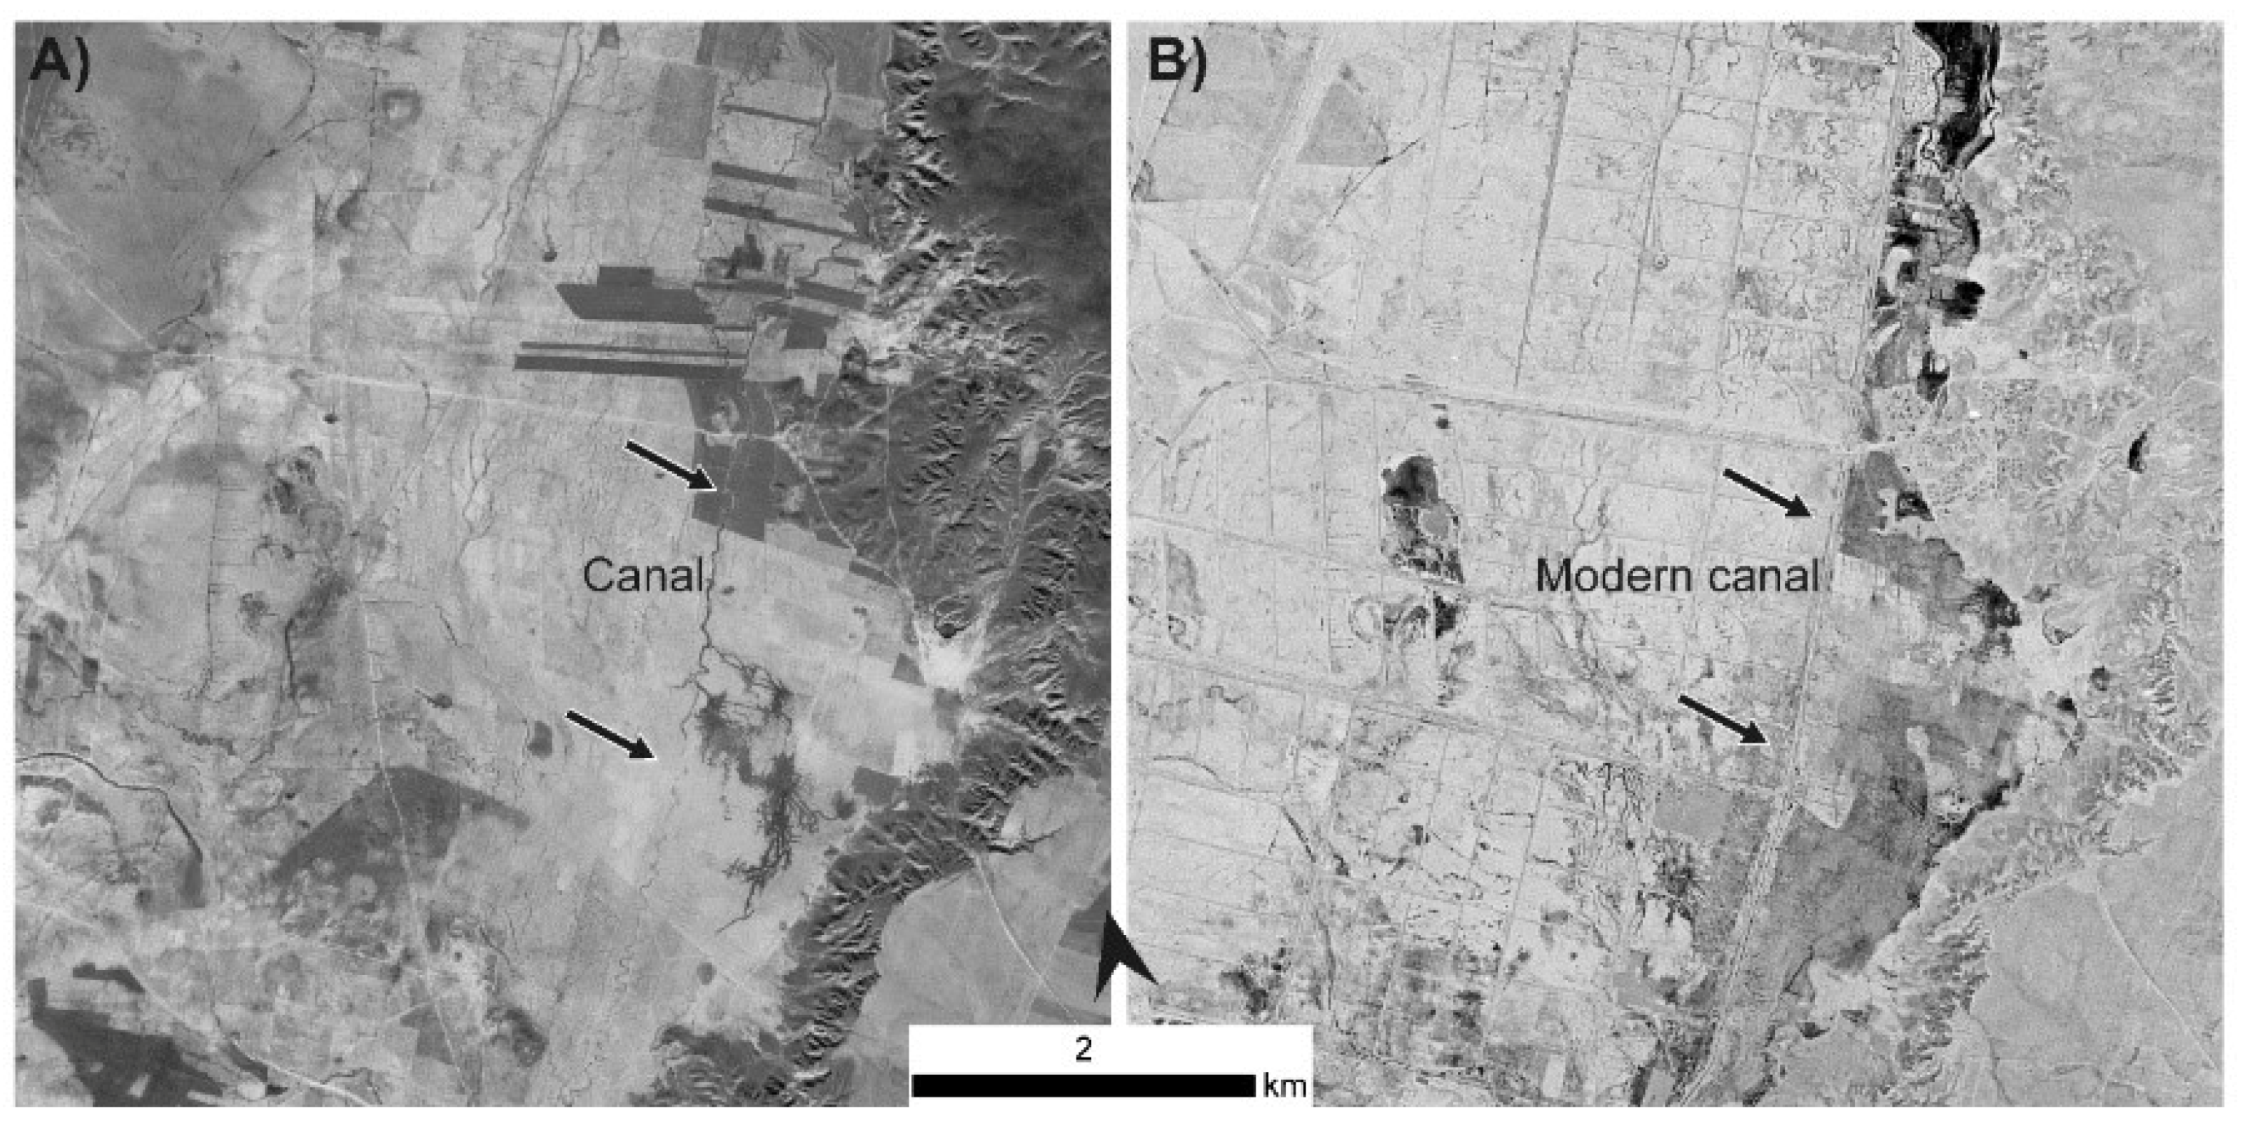
An extensive set of canals in the southwest horseshoe of the Balikh Valley may also be Early Islamic based on a connection with known sites (Figure 10A, see Reference [11]). Most significantly, in the south, the CORONA images showed several water management features associated with the Early Islamic city of Raqqa, which was particularly prominent as a capital city during the Abbasid era, with palaces and an industrial area. The city itself and its immediate hinterland appears to have been watered by qanats, with a northern palace complex supplied by a tunnel stemming from the Qara Mokh stream as well as the Balikh [11,15,16].
Overall historical sources present a picture of intensive irrigated cultivation in Northern Mesopotamia in the Early Islamic period [47]. Even away from the main perennial water sources, qanats extended the cultivable area. The CORONA images revealed an area of dense qanat irrigation radiating from the town of Sinjar in Iraq, which may be medieval in date [59] (discussed in more detail in Reference [16]).
4. Discussion
This research revealed an intensification of irrigation in most of the cultivable areas of Early Islamic Northern Mesopotamia, particularly in the Balikh Valley. The transformation of the environment that we observed fits the concept of “hydraulic landscapes”. Historical accounts and archaeological excavations have indicated that Raqqa was temporarily the centre of the Abbasid empire and a significant industrial town (e.g., see Reference [60]), which may offer an explanation for the intensification of water management features at this time. In addition, medieval irrigation in the Balikh may have been a response to deliberate policies of bringing marginal land into cultivation [17], policies that explain the increased application of water management technology throughout Northern Mesopotamia in the Early Islamic period. This is an area where irrigation was not necessary, but where employing it would have increased the reliability and quantity of agricultural yields, developing and supporting powerful and demanding imperial economies. Many existing hydraulic landscapes were maintained and developed, while new ones were created in response to incentives.
This intensive use of the landscape must have declined, because until the later 20th century cultivation in Northern Mesopotamia was largely reported to be reliant on rainfall [61] (p. 137). This transition followed the Early Islamic period. By the 15th century, the ancient water systems of Mesopotamia were falling into disrepair, possibly due to plague and the depredations of the Mongols, with subsequent depopulation and upheaval (e.g., see References [15,16,62]). In many areas, agriculture did not seem to have intensified again until the 2nd half of the 20th century, although traces of the ancient irrigation systems remained embedded in the landscape until very recently (see travellers’ accounts of abandoned canals, e.g., [63,64]).
More recently, however, modern agricultural strategies in the Middle East have completely transformed the landscape, replacing ancient man-made hydraulic pathways with large-scale dams and canal systems and pumping from individual wells. Many ancient irrigation systems have been abandoned and destroyed to make way for new irrigation schemes. A remote sensing methodology using interpretation from CORONA images dating from the period 1967–1972 proved to be a very effective strategy for recording ancient water management and for mapping its spread and distribution.
When CORONA images (1968 and 1972) were compared (Figure 10), the initial construction of the modern field and irrigation systems in the 1970s Balikh is apparent. This highlights the timeliness of the 1960s images, which represent the last record of most of the ancient canal systems presented in Figure 5 and Figure 7.
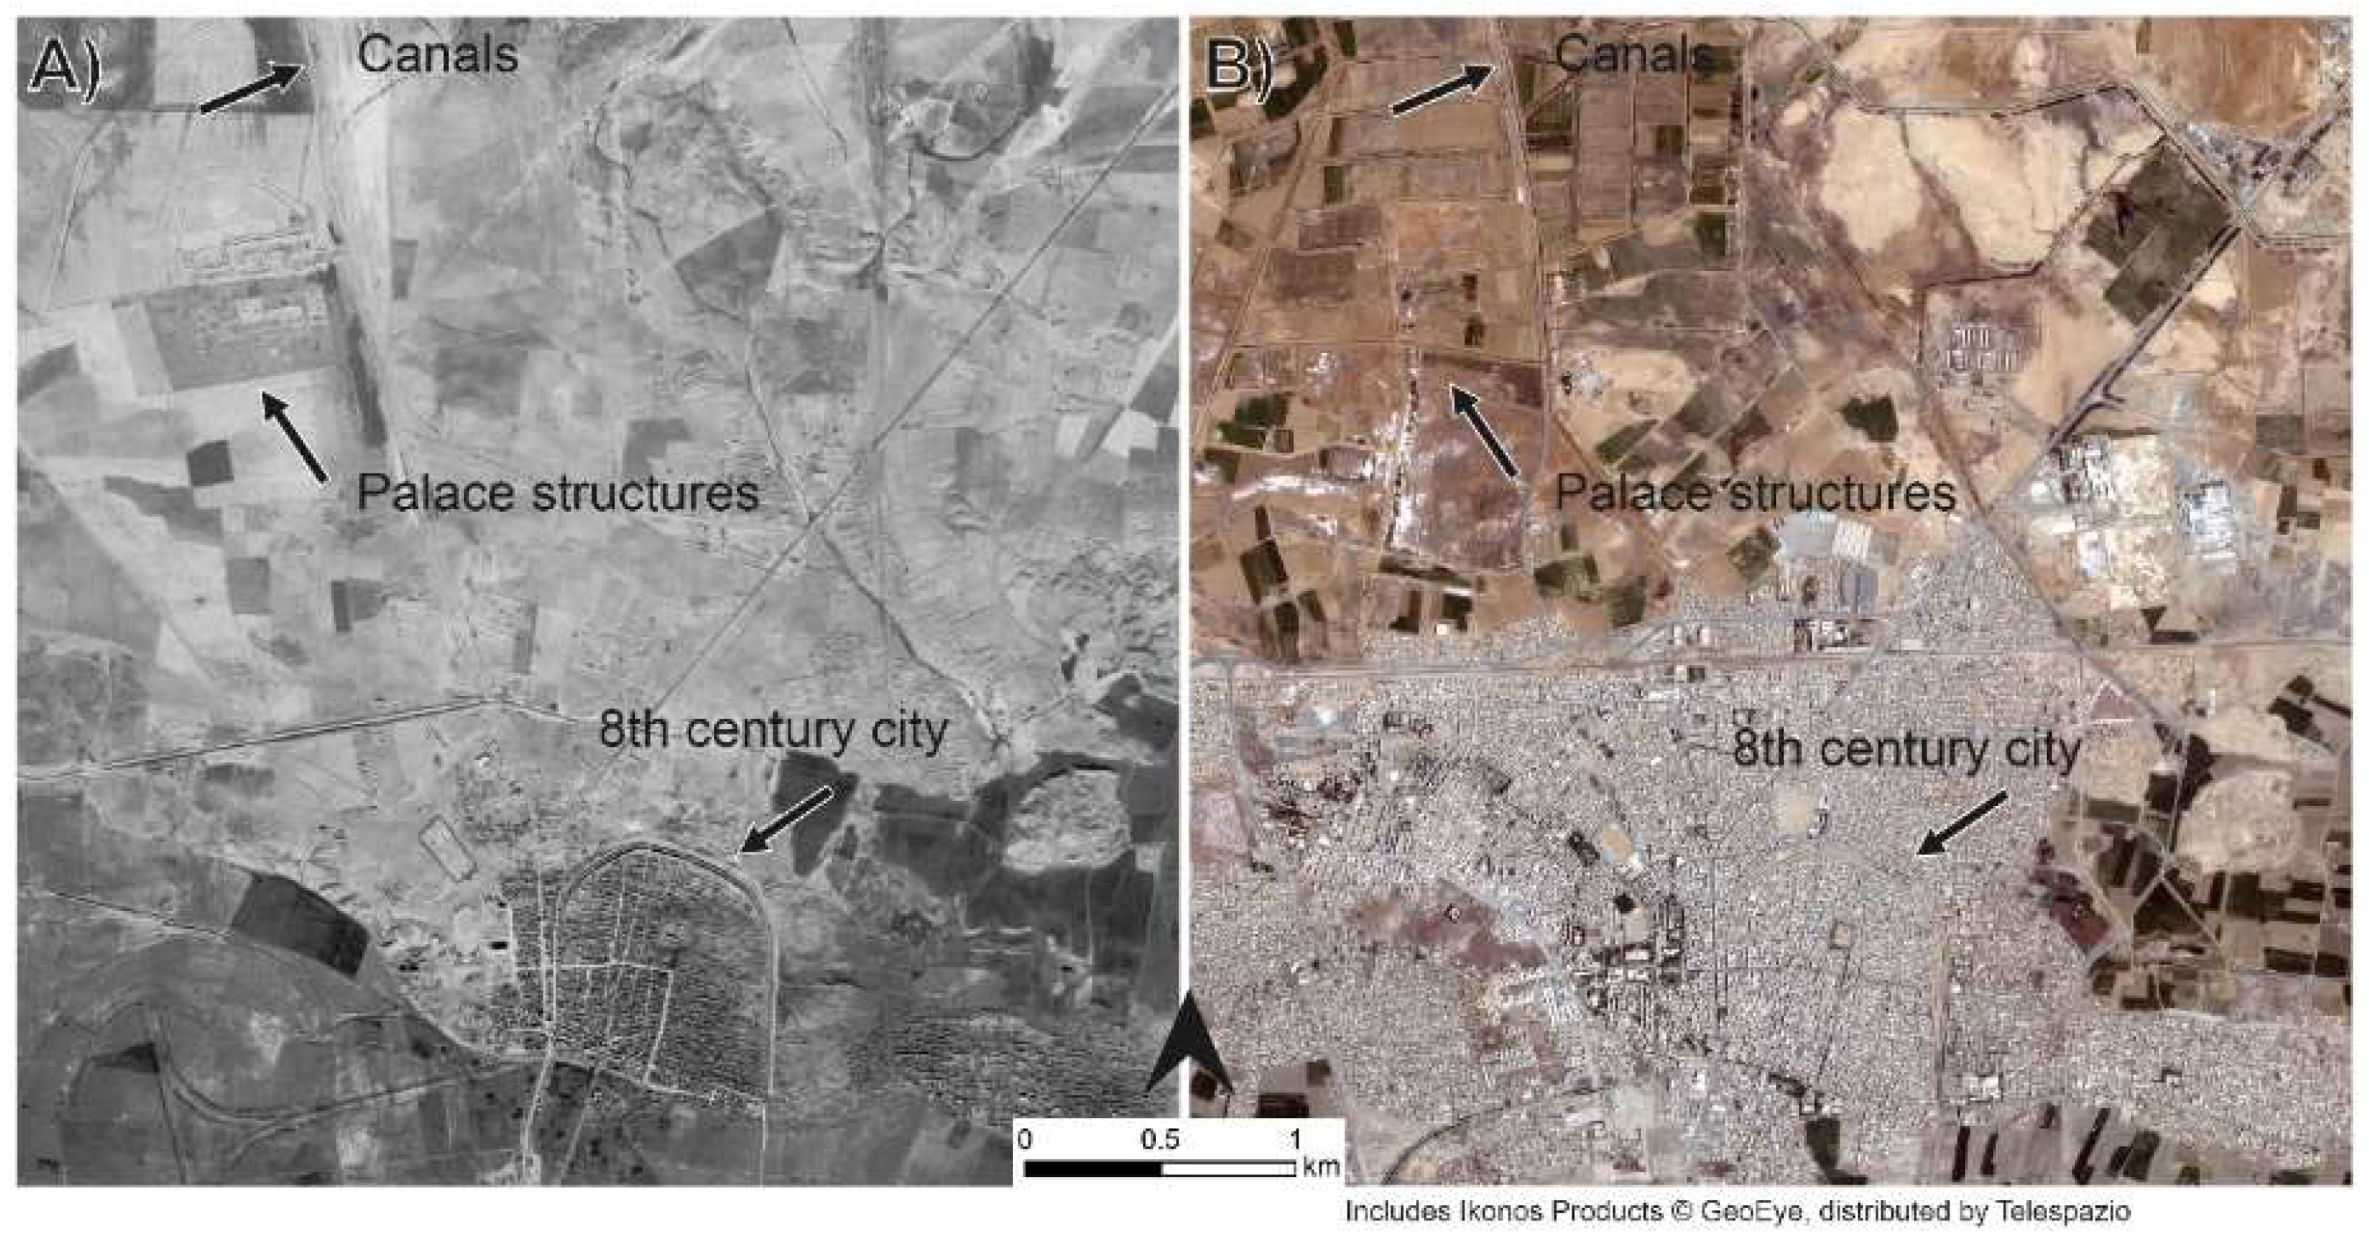
While modern imagery such as IKONOS has been available for the study area since about 2000 (Table 1), these images postdate major land use change that led to the destruction of most of the ancient canals, and therefore CORONA images are the only way of recording now-destroyed canal systems. Figure 11 shows how changes around the city of Raqqa between the 1960s and 2000s meant that much of Early Islamic Raqqa and its environs (visible in the CORONA, Figure 11A) had already been destroyed by the time the IKONOS image (Figure 11B) was collected.
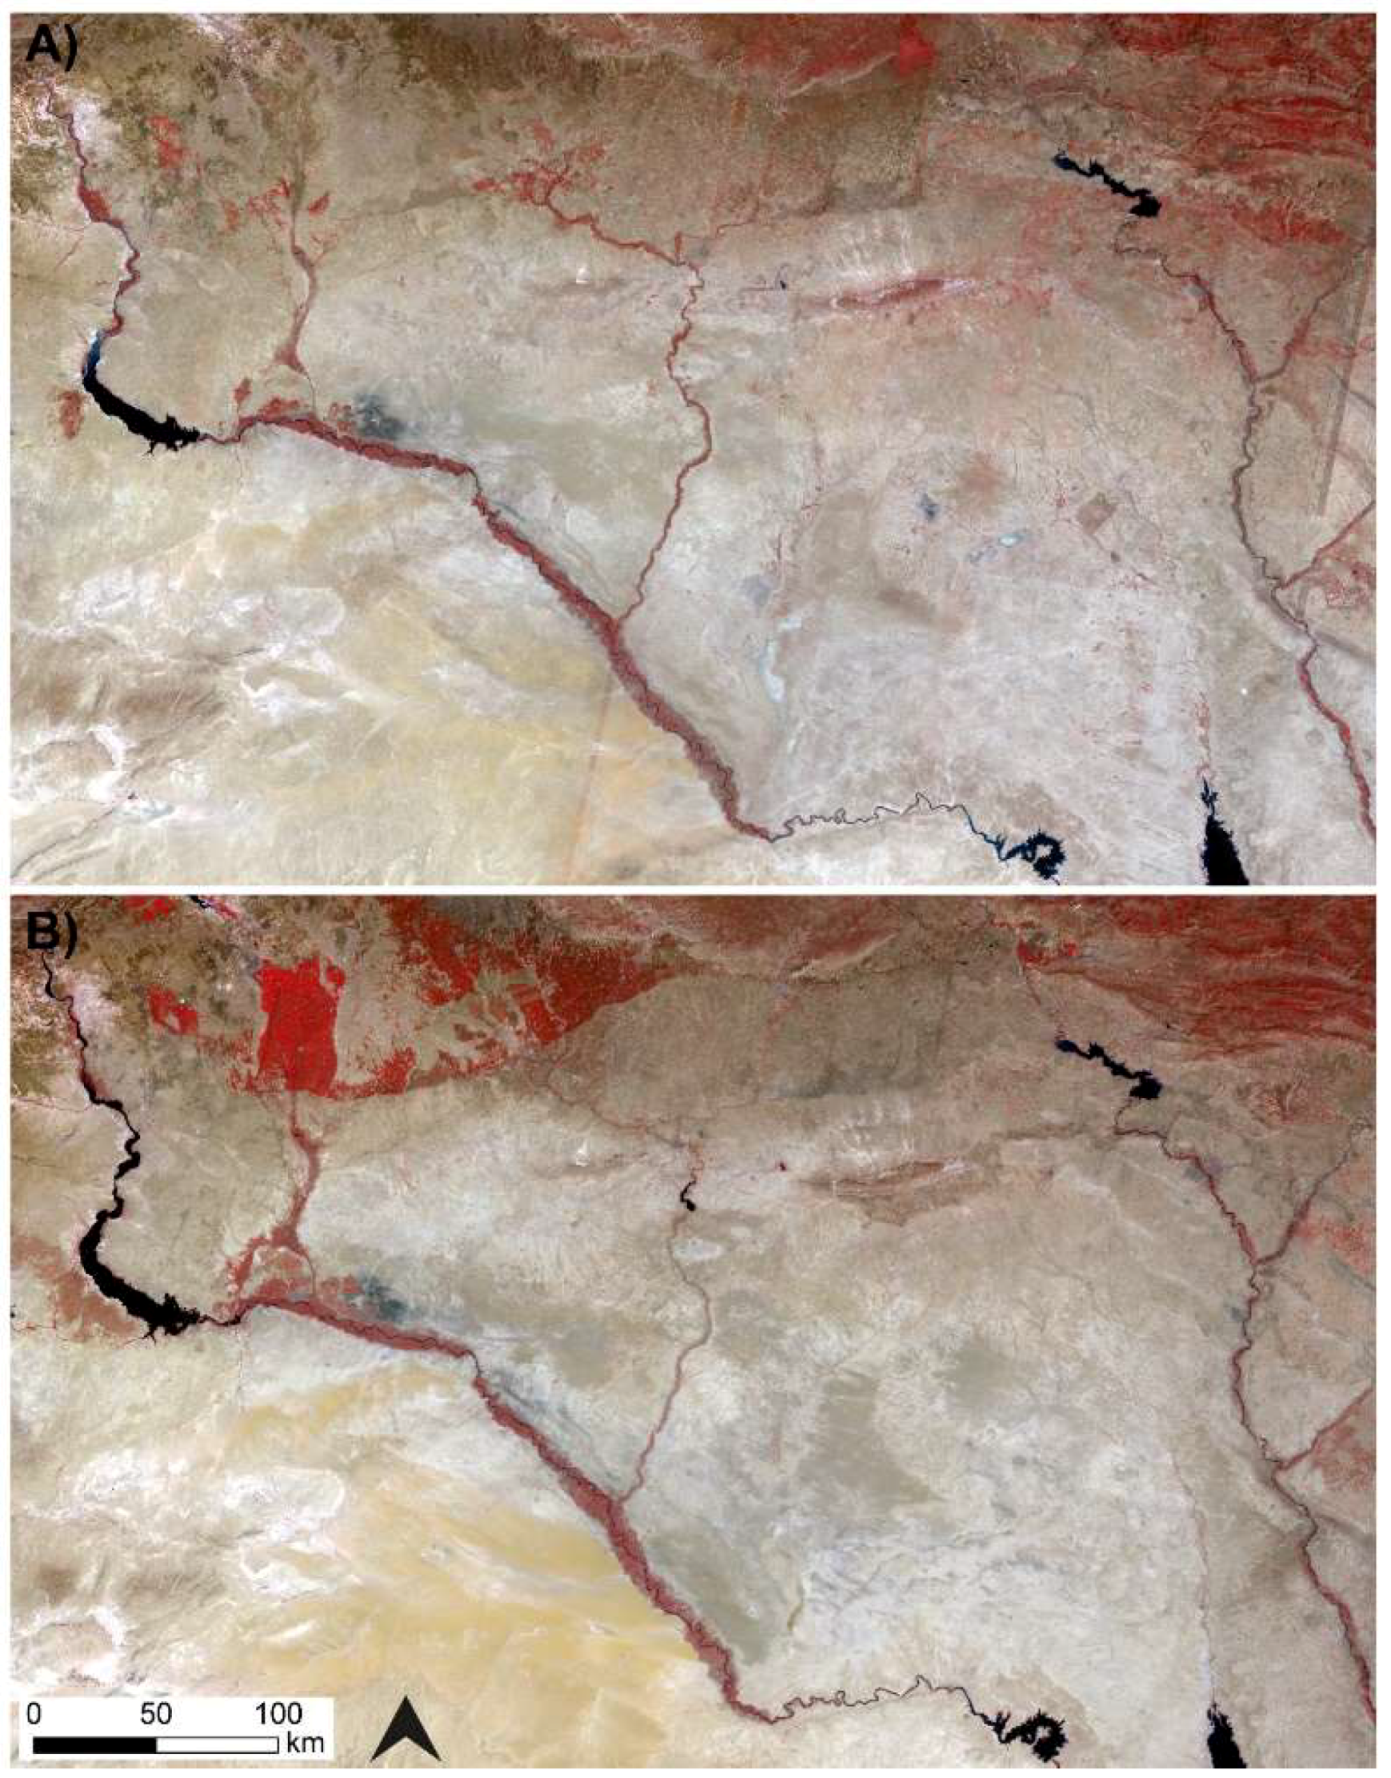
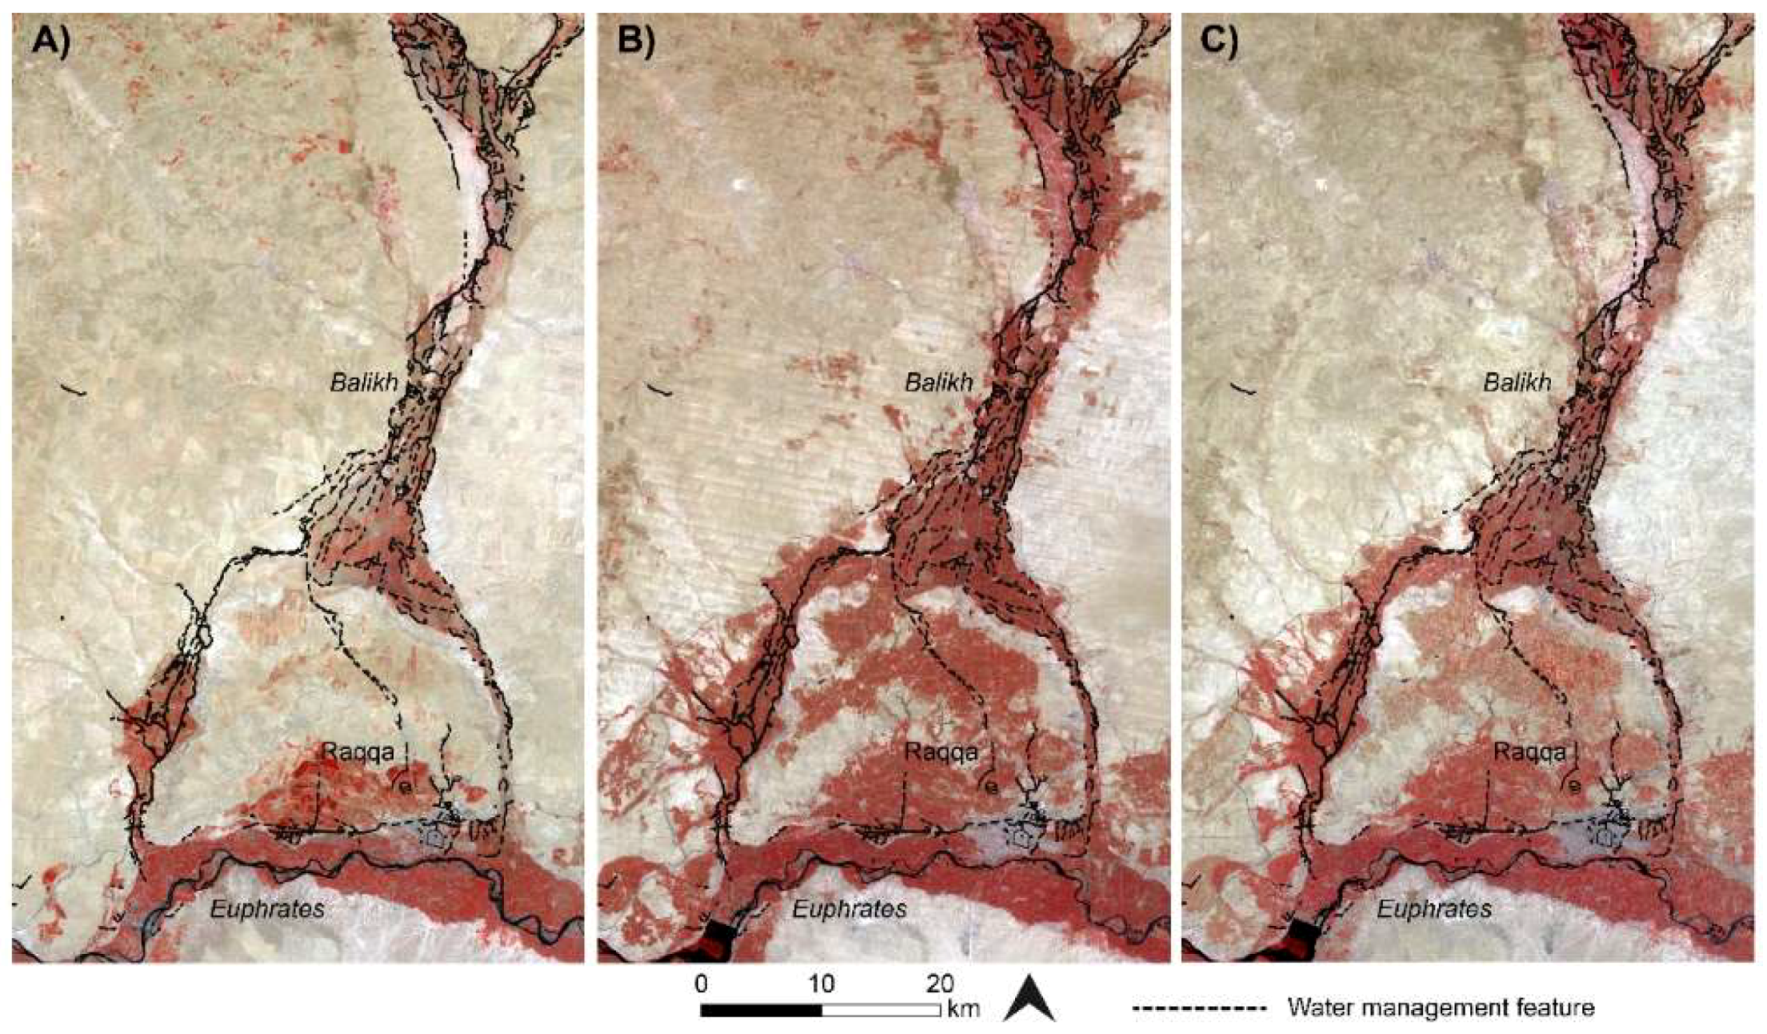
The Landsat sequence shows the intensification of agriculture underway from the 1980s (Figure 12 and Figure 13). In Syria, this was part of a programme involving construction of the Tabqa dam in 1966, 30 km upstream of Raqqa [61]. Figure 13 highlights the Balikh, where we identified many ancient canal networks that corresponded neatly to the areas of modern irrigated agriculture highlighted by using a false colour visualisation. By the 21st century, modern agriculture had expanded throughout the valley, including new fields and irrigation networks in the south, the area known as the “horseshoe”, where several ancient canals supplied Early Islamic palaces and urban areas around Raqqa. Recent disruption to irrigation infrastructure has been reported in the region due to the current conflict in Syria [19,65], which is demonstrated by a slight reduction in the vegetated area between the 2010–2011 and 2016–2017 Landsat composites.
Figure 12 shows a Landsat false colour composite of a large part of the Euphrates river in Syria in 1985 and 1986 and again in 2016 and 2017, with Lake Assad in the top left and the Balikh and Habur tributaries joining from the north. Figure 13 zooms in on the Syrian Balikh. The red colours in the Landsat images seen in Figure 12 and Figure 13 show the distribution of modern productive agricultural land, where changes shown in both figures reflect the intensification of agriculture, the effect of which has been to remove traces of ancient water features. The Landsat images emphasise the particular importance of the Balikh, which represents a large area of agricultural production within the whole Euphrates valley. The Turkey–Syria border can be clearly seen in the imagery (Figure 12) because of the contrast in water available for irrigation: this serves as a reminder of the importance of the geopolitics of water resources in the region from ancient times right up to the present day.
There are some caveats to a methodology that relies principally on image interpretation. Whether or not water management features can be identified depends on a number of factors, including image quality and timing and natural conditions. We identified rock-cut conduits and tunnels alongside dry streams in the Jerablus region during a survey in 2010 [48] that were not visible in the CORONA (1967 and 1972) and modern imagery. There may well be other ancient irrigation features throughout northern Syria and Iraq that have not yet been identified. However, many of the features we identified in the CORONA images were no longer visible on the ground, having been destroyed to make way for modern agriculture. This included the Nahr al Abbara canal system in the Balikh.
Working with CORONA was difficult due to the panoramic and historical nature of the data. The panoramic frames were distorted (e.g., see Reference [41] (p. 228); Reference [66]), especially toward the edges, and some image acquisition parameters were not available, making constructing an accurate camera model challenging. The quality and time of collection of different images was variable. Some higher resolution modern imagery was examined, for example IKONOS imagery covering the area around Raqqa in the southern Balikh. However, it was found that recent landscape changes had destroyed much of the archaeology (see Figure 11). The CORONA data were often of the best time period, consistency of image quality (spatial and radiometric), and availability for large area coverage, making it ideal for recording ancient water management features. In fact, we were able to obtain CORONA imagery for our entire 100,000 km2 study area.
5. Conclusions
Declassified CORONA satellite images from the 1960s and early 1970s are used to identify and reconstruct ancient hydraulic landscapes over large geographic areas. The CORONA KH-4B camera has stereoscopic capability which helps to identify and interpret water management features. When the CORONA images were analysed in conjunction with modern satellite imagery, DEMs, and contextual information from archaeological and historical surveys, the trajectory of the development of irrigation technology becomes clear.
This study mapped water management features from the period ca. 1200 BC to AD 1500 across the entirety of Northern Mesopotamia for the first time (Figure 5). Irrigation increased in density throughout the region, including within the zone traditionally regarded as “rain-fed”, and revealed a peak in the Early Islamic era. Environmental considerations for understanding why and where irrigation was undertaken during the period of the later empires also helped us to contextualise the results. An average rainfall of 200–250 mm a year is often interpreted as the limit of rain-fed cultivation for modern and ancient agriculture (e.g., see References [18,67,68]) and depicted as an isohyet line. However, an analysis of modern rain gauge data indicates that much of the area encompassed by ancient irrigation (receiving approximately 100–400 mm per year) experiences high variability today (20–40%, see Reference [2] (p. 158)), which makes irrigation necessary to mitigate against irregular rainfall [65] (p. 5). If rainfall was similarly variable during the period of the later empires, (e.g., at the time of the MCA), our data suggests that they were investing in large-scale irrigation in a region where rain-fed cultivation was technically possible, but where it was risky due to the variability of precipitation. Unlike in Southern Mesopotamia, irrigation was not absolutely necessary for agriculture in Northern Mesopotamia but the construction of water management features was a way to ensure access to water in order to mitigate against disruptions to food supply.
It is unlikely to be a coincidence that irrigation activity was intensified during the era of the first true territorial empires, when these powerful entities exerted and contested political control over the landscape. It is apparent that from the Neo-Assyrian period and by the Early Islamic period, most of the perennial water courses in Northern Mesopotamia were used as sources of irrigation water and that available groundwater was utilised. The water management systems that we recorded included many reticulated and sophisticated systems that supported powerful states, represented by traces of prominent channels alongside the main rivers, dense networks of irrigation in the tributaries, and significant groundwater exploitation using qanats. Many canals and parts of canal systems would have been missed if examined through fieldwork alone. Through interpretation of satellite images, this study was able to locate and map some previously unknown or understudied systems, such as numerous qanats in the Sinjar Plain of Iraq [15,16], the qanat at Dibsi Faraj in Syria [1], and the real complexity of irrigation in the Balikh Valley in Syria [1,11,15,16]. The combination of remote sensing, archived data, and fieldwork enabled further chronological and historical contextualisation of these remains.
If fieldwork should become possible in the near future, this reconstruction of ancient water management in Northern Mesopotamia would benefit from ground sample testing using scientific dating techniques such as optically stimulated luminescence (OSL) (e.g., see Reference [69]). The use of unmanned aerial vehicles (UAVs), dGPS, and newer high-resolution DEMs, such as TanDEM-X, would provide improved control data for photogrammetric processing of CORONA. Several significant areas of relict channels require further investigation (for example, qanats around Membij and Sinjar, see References [15,16]), which itself might enable increased protection of this archaeological resource. Due to the current risk of looting and vandalism to archaeological sites in Mesopotamia, it is not possible to make the GIS database of canal locations publically available, but these can be provided to verified heritage professionals via the EAMENA database if requested [70].
Conflict in Syria and Iraq has led to an ongoing humanitarian crisis and has impacted severely on cultural heritage, with deliberate destruction of many monumental sites, including some of the Islamic remains in Raqqa. Satellite imagery is being extensively used to highlight the destruction of archaeology in the Middle East during conflict [71], although its efficacy as a solution to stopping the destruction is unclear. Media reports often draw attention to damage to large, monumental sites, while the routine destruction of ancient canals by modern agricultural and urban development is frequently overlooked. Water management features may not be a particular target for vandalism, but longer-term land use changes have wiped out many of their traces from the landscape, making CORONA the last record of the intensive hydraulic landscapes of the ancient empires.
Supplementary Materials
The following are available online at https://0-www-mdpi-com.brum.beds.ac.uk/2072-4292/10/12/2042/s1: CORONA DEM triangulation reports; Landsat comparisons. SRTM, CORONA and Landsat data available from the U.S. Geological Survey.
Author Contributions
Conceptualization, L.R. and D.D.; formal analysis, L.R.; funding acquisition, D.D.; investigation, L.R.; methodology, L.R. and D.D.; project administration, L.R.; supervision, D.D.; visualization, L.R.; writing—original draft, L.R.; writing—review and editing, L.R. and D.D.
Funding
This PhD research was funded by the Faculty of Social Sciences and Health, Durham University.
Acknowledgments
We would particularly like to acknowledge the role of the late Tony Wilkinson in supervising, supporting, and encouraging this research and for providing information about his surveys in the Balikh Valley.
Conflicts of Interest
The authors declare no conflicts of interest. The funders had no role in the design of the study; in the collection, analyses, or interpretation of data; in the writing of the manuscript; or in the decision to publish the results.
References
- Wilkinson, T.J.; Rayne, L. Hydraulic Landscapes and Imperial Power in the near East. Water Hist. 2010, 2, 115–144. [Google Scholar] [CrossRef]
- Rayne, L. Water and Territorial Empires: The Application of Remote Sensing Techniques to Ancient Imperial Water Management in Northern Mesopotamia. Ph.D. Thesis, University of Durham, Durham, UK, 2014. [Google Scholar]
- Schneider, U.; Becker, A.; Meyer-Christoffer, M.; Ziese, B. Global Precipitation Analysis Products of the Gpcc. Available online: http://www.cgd.ucar.edu/cas/catalog/surface/precip/gpcc.html (accessed on 14 December 2018).
- Wilkinson, T.J. Archaeological Landscapes of the near East; University of Arizona Press: Tucson, AZ, USA, 2003. [Google Scholar]
- Oded, B. Mass Deportations and Deportees in the Neo-Assyrian Empire; L. Reichert: Depew, NY, USA, 1979. [Google Scholar]
- Jacobsen, T.; Lloyd, S. Sennacherib’s Aqueduct at Jerwan; University of Chicago Press: Chicago, IL, USA, 1955. [Google Scholar]
- Dalley, S. Nineveh, Babylon and the Hanging Gardens: Cuneiform and Classical Sources Reconciled. Iraq 1994, 56, 45–58. [Google Scholar] [CrossRef]
- Ur, J. Sennacherib’s Northern Assyrian Canals: New Insights from Satellite Imagery and Aerial Photography. Iraq 2005, 67, 317–345. [Google Scholar] [CrossRef]
- Wilkinson, T.J. Water and Human Settlement in the Balikh Valley, Syria: Investigations from 1992–1995. J. Field Archaeol. 1998, 25, 63–87. [Google Scholar]
- Wilkinson, T.J.; Peltenburg, E.; McCarthy, A.; Wilkinson, E.B.; Brown, M. Archaeology in the Land of Carchemisch: Landscape Surveys in the Area of Jerablus Tahtani, 2006. Levant 2007, 39, 213–247. [Google Scholar] [CrossRef]
- Rayne, L. Imperial Water Systems and Human Niche Construction in the Balikh Valley. Water Hist. 2015, 7, 419–440. [Google Scholar] [CrossRef]
- Harper, R.P.; Wilkinson, T.J. Excavations at Dibsi Faraj, Northern Syria, 1972–1974: A Preliminary Note on the Site and Its Monuments with an Appendix. Dumbarton Oaks Papers 1975, 29, 319–338. [Google Scholar] [CrossRef]
- Berthier, S.; D’Hont, O. Ressources Hydriques Et Peuplement Sur Le Moyen Euphrate, Viième-Xix Ème Siècle. In Proceedings of the RURALIA 2003, Lyon, France, 17 September 2003. [Google Scholar]
- Geyer, B.; Monchambert, J.Y. La Basse Vallée De L’euphrate Syrien Du Néolithique À L’avènement De L’islam: Géographie, Archéologie Et Histoire; IFAPO: Paris, France, 2003. [Google Scholar]
- Rayne, L. Early Islamic Water Management in Northern Mesopotamia. In Economic Integration and Social Change in the Islamic World System, 800–1000 Ce: The Geography and Infrastructure of Trade in Early Islam; Bessard, F., Kennedy, H., Eds.; Oxford University Press: Oxford, UK, in press.
- Rayne, L. Early Islamic Water Management in the Hinterland of Raqqa. In New Agendas in Remote Sensing and Landscape Archaeology in the Near East: Studies in Honor of T J Wilkinson; Altaweel, M., Lawrence, D., Philip, G., Eds.; Oriental Institute of the University of Chicago: Chicago, IL, USA, in press.
- Kennedy, H.N. The Feeding of the Five Hundred Thousand: Cities and Agriculture in Early Islamic Mesopotamia. Iraq 2011, 73, 177–199. [Google Scholar] [CrossRef]
- Perrin de Brichambaut, G.; Wallén, C.C. Fao/Unesco/Wmo Interagency Project on Agroclimatology 1962, Draft General Report on a Study of Agroclimatology in Semi-Arid and Arid Zones of the Near East; FAO: Rome, Italy, 1962. [Google Scholar]
- Counting the Cost: Agriculture in Syria after Six Years of Crisis. Available online: http://www.fao.org/emergencies/resources/documents/resources-detail/en/c/878213/ (accessed on 11 November 2018).
- Wittfogel, K. Oriental Despotism: A Comparative Study of Total Power; Yale University Press: New Haven, CT, USA; London, UK, 1957. [Google Scholar]
- Christensen, P. The Decline of Iranshahr: Irrigation and Environments in the History of the Middle East, 500 Bc to Ad 1500; Museum Tusculanum Press: Copenhagen, Denmark, 1993. [Google Scholar]
- Fisher, W.B. The Middle East: A Physical, Social and Regional Geography, 7th ed.; Completely Revised and Reset. ed.; Methuen: London, UK, 1978. [Google Scholar]
- Jewitt, T.N. Soils of Arid Lands. In Arid Lands: A Gographical Appraisal; Hills, E.S., Ed.; Methuen and Co. Ltd.: London, UK, 1966. [Google Scholar]
- Riehl, S.; Bryson, R.; Pustovoytov, K. Changing Growing Conditions for Crops During the near Eastern Bronze Age (3000–1200 Bc): The Stable Carbon Isotope Evidence. J. Archaeol. Sci. 2008, 35, 1011–1022. [Google Scholar] [CrossRef]
- Bar-Matthews, M.; Ayalon, A.; Kaufman, A. Late Quaternary Paleoclimate in the Eastern Mediterranean Region from Stable Isotope Analysis of Speleothems at Soreq Cave, Israel. Quat. Res. 1997, 47, 155–168. [Google Scholar] [CrossRef]
- Xoplaki, E.; Fleitmann, D.; Luterbacher, J.; Wagner, S.; Haldon, J.F.; Zorita, E.; Telelis, I.; Toreti, A.; Izdebski, A. The Medieval Climate Anomaly and Byzantium: A Review of the Evidence on Climatic Fluctuations, Economic Performance and Societal Change. Quat. Sci. Rev. 2016, 136, 229–252. [Google Scholar] [CrossRef]
- IPCC. Climate Change 2013: The Physical Science Basis. Contribution of Working Group I to the Fifth Assessment Report of the Intergovernmental Panel on Climate Change; Stocker, T.F., Qin, D., Plattner, G.-K., Tignor, M., Allen, S.K., Boschung, J., Nauels, A., Xia, Y., Bex, V., Midgley, P.M., Eds.; Cambridge University Press: Cambridge, UK, 2013. [Google Scholar]
- Kamash, Z. Archaeologies of Water in the Roman near East, 63 Bc-Ad 636; Piscataway Gorgias Press: Piscataway, NJ, USA, 2010. [Google Scholar]
- Kamash, Z. Water Supply and Management in the Near East 63 Bc-Ad 636. Ph.D. Thesis, University of Oxford, Oxford, UK, 2007. [Google Scholar]
- Philip, G.; Donoghue, D.N.M.; Beck, A.; Galiatsatos, N. Corona Satellite Photography: An Archaeological Application from the Middle East. Antiquity 2002, 76, 109–118. [Google Scholar] [CrossRef]
- David, K.; Bewley, R. Aerial Archaeology in Jordan. Antiquity 2009, 83, 69–81. [Google Scholar]
- Altaweel, M. The Imperial Landscape of Ashur: Settlement and Land Use in the Assyrian Heartland; OrientVerlag: Heidelberg, Germany, 2008. [Google Scholar]
- Van Liere, W.J.; Lauffray, J. Nouvelle Prospection Archaeologique Dans La Haute Jazireh Syrienne. Les Annals Archaeologiques De Syrie 1954–1955, 4, 129–148. [Google Scholar]
- Gorelick, N.; Hancher, M.; Dixon, M.; Ilyushchenko, S.; Thau, D.; Moore, R. Google Earth Engine: Planetary-Scale Geospatial Analysis for Everyone. Remote Sens. Environ. 2017, 202, 18–27. [Google Scholar] [CrossRef]
- Galiatsatos, N.; Wilkinson, T.J.; Donoghue, D.N.M.; Philip, G. The Fragile Crescent Project (Fcp): Analysis of Settlement Landscapes Using Satellite Imagery. Available online: http://dro.dur.ac.uk/6909/ (accessed on 18 December 2018).
- Casana, J.; Cothren, J. The Corona Atlas Project: Orthorectification of Corona Satellite Imagery and Regional-Scale Archaeological Exploration in the near East. In Mapping Archaeological Landscapes from Space; Comer, D.C., Harrower, M.J., Eds.; Springer: Berlin, Germany, 2013. [Google Scholar]
- Farr, T.G.; Rosen, P.A.; Caro, E.; Crippen, R.; Duren, R.; Hensley, S.; Kobrick, M.; Paller, M.; Rodriguez, E.; Roth, L. The Shuttle Radar Topography Mission. Rev. Geophys. 2007, 45. [Google Scholar] [CrossRef] [Green Version]
- Schmidt, M.; Goossens, R.; Menz, G.; Altmaier, A.; Devriendt, D. The Use of Corona Satellite Images for Generating a High Resolution Digital Elevation Model. Paper Presented at the IEEE 2001 International Geoscience and Remote Sensing Symposium, Sydney, NSW, Australia, 9–13 July 2001. [Google Scholar]
- Mugnier, C.J.; Forstner, W.; Wrobel, B.; Paderes, F.; Munjy, R. The Mathematics of Photogrammetry. In Manual of Photogrammetry; McGlone, J.C., Ed.; American Society of Photogrammetry and Remote Sensing: Bethseda, MD, USA, 2004; pp. 181–316. [Google Scholar]
- Wong, K.W. Basic Mathematics of Photogrammetry. In Manual of Photogrammetry; Slama, C.C., Ed.; American Society of Photogrammetry: Falls Church, VA, USA, 1980; pp. 37–101. [Google Scholar]
- Altmaier, A.; Kany, C. Digital Surface Model Generation from Corona Satellite Images. ISPRS J. Photogramm. Remote Sens. 2002, 56, 221–235. [Google Scholar] [CrossRef]
- USGS. Declassified Satellite Imagery—1. Available online: https://lta.cr.usgs.gov/declass_1 (accessed on 18 December 2018).
- Galiatsatos, N.; Donoghue, D.N.M.; Philip, G. High Resolution Elevation Data Derived from Stereoscopic Corona Imagery with Minimal Ground Control. Photogramm. Eng. Remote Sens. 2007, 73, 1093–1106. [Google Scholar] [CrossRef]
- Casana, J.; Cothren, J. Stereo Analysis, Dem Extraction and Orthorectification of Corona Satellite Imagery: Archaeological Applications from the near East. Antiquity 2008, 82, 732–749. [Google Scholar] [CrossRef]
- Boyle, R.; Thomas, R.C. Computer Vision: A First Course; Blackwell Scientific Publications, Ltd.: Hoboken, NJ, USA, 1988. [Google Scholar]
- Ur, J.; Wilkinson, T.J. Settlement and Economic Landscapes of Tell Beydar and Its Hinterland; Brepols: Turnhout, Belgium, 2008. [Google Scholar]
- Le Strange, G. The Lands of the Eastern Caliphate: Mesopotamia, Persia, and Central Asia, from the Moslem Conquest to the Time of Timur; Cambridge University Press: Cambridge, UK, 1905. [Google Scholar]
- Peltenburg, E.; Wilkinson, T.J.; Wilkinson, E.B. Carchemish in Context; Oxbow Books: Oxford, UK, 2016. [Google Scholar]
- Wilkinson, E.B.; Wilkinson, T.J.; Peltenburg, E. Revisiting Carchemish: The Land of Carchemish Project in Syria, 2009 and 2010. Antiquity Bull. 2011, 85, 329–332. [Google Scholar]
- Ur, J.; de Jong, L.; Giraud, J.; Osborne, J.F.; MacGinnis, J. Ancient Cities and Landscapes in the Kurdistan Region of Iraq: The Erbil Plain Archaeological Survey 2012 Season. Iraq 2013, 75, 89–118. [Google Scholar] [CrossRef]
- Ur, J. Tell Hamoukar Volume 1: Urbanism and Cultural Landscapes in Northeastern Syria. The Tell Hamoukar Survey, 1999–2001; The Oriental Institute of the University of Chicago: Chicago, IL, USA, 2010. [Google Scholar]
- Bounni, A. Campaign and Exhibition from the Euphrates in Syria. Annu. Am. Schools Orient. Res. 1977, 44, 1–4. [Google Scholar]
- Ergenzinger, P.J.; Kühne, H. Ein Regionales Bewässerungssystem Am Habur. In Die Rezente Umwelt Von Tell Sheikh Hamad Und Daten Zur Umweltrekonstruktion Der Assyrischen Stadt Dur-Katlimmu.: Berichte Aus Der Ausgrabungen Tell Sheikh Hamad/Dur-Katlimmu; Dietrich Reimer Verlag: Berlin, Germany, 1991. [Google Scholar]
- Lightfoot, J.L. Lucian on the Syrian Goddess; Oxford University Press: Oxford, UK, 2003. [Google Scholar]
- Van Liere, W.J.; Lauffray, J. Capitals and Citadels of Bronze-Iron Syria in Their Relationship to Land and Water. Les Annales Archaeol. De Syrie 1963, 13, 107–122. [Google Scholar]
- Berthier, S. Peuplement Rural Et Aménagements Hydroagricoles Dans La Moyenne Vallée De L’euphrate, Fin Viie-Xixe Siècle: Région De Deir Ez Zōr-Abu Kemāl, Syrie: Mission Mésopotamie Syrienne, Archéologie Islamique, 1986–1989; Institut Français d’Études Arabes de Damas: Paris, France, 2001. [Google Scholar]
- Heidemann, S. The Agricultural Hinterland of Baghdad, Al-Raqqa and Samarra: Settlement Patterns in the Diyar Mudar. In Le Proche-Orient de Justinien aux Abbasides. Peuplement et Dynamiques Spatiales; Actes du colloque: Paris, France, 2011. [Google Scholar]
- Bartl, K. Frühislamische Besiedlung Im Balīḫ-Tal, Nordsyrien; Reimer: Berlin, Germany, 1994. [Google Scholar]
- Fuccaro, N. Aspects of the Social and Political History of the Yazidi Enclave of Jabal Sinjar (Iraq) under the British Mandate, 1919–1932; Durham University: Durham, UK, 1994. [Google Scholar]
- Henderson, J.; Challis, K.; O’Hara, S.; McLoughlin, S.; Gardner, A.; Priestnall, G. Experiment and Innovation: Early Islamic Industry at Al-Raqqa, Syria. Antiquity 2005, 79, 130–145. [Google Scholar] [CrossRef]
- Beaumont, P. Agricultural and Environmental Changes in the Upper Euphrates Catchment of Turkey and Syria and Their Political and Economic Implications. Appl. Geogr. 1996, 16, 137–157. [Google Scholar] [CrossRef]
- Dols, M.W. The Second Plague Pandemic and Its Recurrences in the Middle East: 1347–1894. J. Econ. Soc. Hist. Orient/Jo. L’hist. Econ. Soc. l’Orient 1979, 22, 162–189. [Google Scholar] [CrossRef]
- Bell, G. Amurath to Amurath; Macmillan and Co. Ltd.: London, UK, 1924. [Google Scholar]
- Sykes, M. Journeys in North Mesopotamia. Geogr. J. 1907, 30, 237–254. [Google Scholar] [CrossRef]
- Tull, K. Agriculture in Syria. In K4D Helpdesk Report 133; Institute of Development Studies: Brighton, UK, 2017. [Google Scholar]
- Sohn, H.G.; Kim, G.H.; Yom, J.H. Mathematical Modelling of Historical Reconnaissance Corona Kh-4b Imagery. Photogramm. Record 2004, 19, 51–66. [Google Scholar] [CrossRef]
- Wilkinson, T.J. The Structure and Dynamics of Dry-Farming States in Upper Mesopotamia. Curr. Anthropol. 1994, 35, 483–520. [Google Scholar] [CrossRef]
- Jas, R.M. Rainfall and Agriculture in Northern Mesopotamia; Nederlands Historisch-Archaeologische Instituut te Istanbul: Istanbul, Turkey, 2000. [Google Scholar]
- Bailiff, I.K.; Gerrard, C.M.; Gutiérrez, A.; Snape-Kennedy, L.M.; Wilkinson, K.N. Luminescence Dating of Irrigation Systems: Application to a Qanat in Aragón, Spain. Quat. Geochronol. 2015, 30, 452–459. [Google Scholar] [CrossRef]
- EAMENA. Eamena Database. Available online: http://eamena.arch.ox.ac.uk/resources/database-2/ (accessed on 4 December 2018).
- Bjørgo, E.; Boccardi, G.; Cunliffe, E.; Fiol, M.; Jellison, T.; Pederson, W.; Saslow, C. Satellite-Based Damage Assessment to Cultural Heritage Sites in Syria. UNITAR/UNOSAT, 2014. Available online: http://www. unitar. org/unosat/chs-syria (accessed on 1 October 2017).
Figure 1.
Northern Mesopotamia and interpolated average rainfall isohyets (interpolated from gridded rain gauge data from GPCC (Global Precipitation Climatology Centre) see [3]). The terrain is derived from the SRTM DEM (Shuttle Radar Topography Mission Digital Elevation Model).
Figure 1.
Northern Mesopotamia and interpolated average rainfall isohyets (interpolated from gridded rain gauge data from GPCC (Global Precipitation Climatology Centre) see [3]). The terrain is derived from the SRTM DEM (Shuttle Radar Topography Mission Digital Elevation Model).

Figure 2.
Examples of water management features that could be identified using CORONA: (A) Straight trace and form, prominent upcast banks; (B) mostly straight trace and form, low banks; (C) straight trace, meandering/sinuous form; (D) qanat channels represented by series of shafts in a linear arrangement.

Figure 3.
Long profile graphs using SRTM elevation and CORONA images. Hollow ways (A) did not need to conform to the gradient of the landscape, while canals (B) flowed clearly downhill.
Figure 3.
Long profile graphs using SRTM elevation and CORONA images. Hollow ways (A) did not need to conform to the gradient of the landscape, while canals (B) flowed clearly downhill.

Figure 4.
Irrigation systems comprised a series of canals enabling abstraction, transport of water, and drainage. Storage of water could also be incorporated into these systems.
Figure 4.
Irrigation systems comprised a series of canals enabling abstraction, transport of water, and drainage. Storage of water could also be incorporated into these systems.

Figure 5.
Ancient water management features/systems throughout northern Mesopotamia [1,2,8,11,15,16,50,51]. Although the zone represented by the 200–300 mm isohyets technically could support rain-fed agriculture, precipitation was highly variable.

Figure 6.
The eroded and infilled remains of the Sahlan-Hammam canal in the 1990s, when Tony Wilkinson visited. Tony provides scale.
Figure 6.
The eroded and infilled remains of the Sahlan-Hammam canal in the 1990s, when Tony Wilkinson visited. Tony provides scale.

Figure 7.
Irrigation systems in the Balikh Valley.

Figure 8.
The channel of the Nahr al Abbara canal system is marked with arrows (1968 CORONA image).

Figure 9.
10 m spatial resolution DEM constructed using a CORONA stereopair.

Figure 10.
(A) Relict canals in the southwest Balikh Valley in 1968, which were (B) destroyed and replaced with a new irrigation system in 1972 (CORONA images).
Figure 10.
(A) Relict canals in the southwest Balikh Valley in 1968, which were (B) destroyed and replaced with a new irrigation system in 1972 (CORONA images).

Figure 11.
(A) CORONA image (May 1968) showing Early Islamic features of Raqqa, including the 8th century AD walled city, palace structures to the north of this, and canals. (B) IKONOS image (27 March 2000) showing that most of the medieval features were destroyed by modern buildings, fields, and roads.

Figure 12.
False colour Landsat composites showing the intensification of agriculture in Northern Mesopotamia over the past 40 years. (A) Landsat 5 composite, 1985–1986; (B) Landsat 8 composite, 2016–2017. Images downloaded and mosaicked using Google Earth Engine.
Figure 12.
False colour Landsat composites showing the intensification of agriculture in Northern Mesopotamia over the past 40 years. (A) Landsat 5 composite, 1985–1986; (B) Landsat 8 composite, 2016–2017. Images downloaded and mosaicked using Google Earth Engine.

Figure 13.
Landsat composites showing the expansion of modern irrigation in the Balikh. (A) Landsat 5, 1985–1986; (B) Landsat 7, 2010–2011; (C) Landsat 8, 2016–2017. Images downloaded and mosaicked using Google Earth Engine and visualised as false colour composites.
Figure 13.
Landsat composites showing the expansion of modern irrigation in the Balikh. (A) Landsat 5, 1985–1986; (B) Landsat 7, 2010–2011; (C) Landsat 8, 2016–2017. Images downloaded and mosaicked using Google Earth Engine and visualised as false colour composites.


Table 1.
Timeline of empires active in Northern Mesopotamia (after [4].)
Table 1.
Timeline of empires active in Northern Mesopotamia (after [4].)
| Dates | Empire | Era |
|---|---|---|
| BC 1750 | Bronze Age | |
| 1200 | Middle Assyrian | |
| 1000 | ||
| 800 | Neo-Assyrian | Iron Age |
| 600 | Babylonian, Persian | |
| 400 | Hellenistic, Seleucid | Classical |
| 200 | Hellenistic, Parthian | |
| 0 | Roman, Parthian | |
| 200 AD | ||
| 400 | Byzantine | Late Antique |
| 600 | ||
| 800 | Early Islamic | Medieval |
| 1000 |
Table 2.
Spaceborne data used in this study.
| Dataset | Date Range | Spatial Resolution (m) | Coverage | Function |
|---|---|---|---|---|
| CORONA KH-4B | 1967–1972 | 1.8–2.7 | 100% | Image interpretation of now-destroyed landscapes. |
| Landsat | 1985–2017 | 15–30 | 100% | To facilitate understanding of where and when the pre-modern hydraulic landscapes were destroyed. |
| IKONOS | 2000 | 0.8–3 | 3 tiles | Image interpretation of some surviving features. |
| Google Earth imagery, various sensors | 1999–2018 | ~0.3–3 | 100% | Image interpretation of some surviving features. |
| SRTM DEM | 2000 | 30–90 | 100% | Hydraulic context of canal systems. |
| CORONA DEM Missions 1105–1009 | 04-NOV-68 | ~10 | 1 stereopair | Morphology of selected canal features. |
| KH-4B Parameters | |
|---|---|
| CORONA Mission | 1105, 04-NOV-68, KH-4B |
| Camera type | Panoramic |
| Film width (mm) | 70 |
| Approximate frame format (cm) | 5.54 × 75.69 |
| Focal length (cm) | 607.609 |
| Best approximate film resolution (L/mm) | 160 |
| Best approximate ground resolution (m) | 1.83 |
| Nominal system altitude (nautical miles) | 81 |
| Image scale | 1:247,500 |
| Nominal ground coverage (km) | 14 × 188 |
Table 4.
DEM production from CORONA stereopairs.
| Nahr al Abbara Canal System | Tell Hammam et Turkman | Sahlan-Hammam Canal | |
|---|---|---|---|
| Subset size (km) | 2.6 × 4.5 | 1.4 × 0.8 | 0.9 × 1.0 |
| Control points | 87 | 40 | 24 |
| Auto-tie points | 184 | 44 | 12 |
| RMSE | 2.6 | 1.15 | 1.3 |
| mX | 5.3141 | 2.3103 | 5.5780 |
| mY | 3.5408 | 2.3402 | 2.6244 |
| mZ | 5.3759 | 4.3616 | 6.2376 |
Table 5.
Water management systems recorded by this study using satellite data.
| Chronological Period | Water Management Systems | Key References |
|---|---|---|
| Pre-1st millennium BC | Canal at Tell Fray | [52] |
| Some canals alongside the Euphrates between Balikh and Mari | [14] | |
| 1st millennium BC | Canals in northern Iraq | [6,7,8,32] |
| Canal at Carchemish | [16,48] | |
| Origin of canals alongside Habur | [33,53] | |
| Hellenistic–late Roman | Canal and rock-cut conduits in Jerablus area | [16,48] |
| Sahlan-Hamman canal and Qara Mokh canals in Balikh | [9,11] | |
| Qanats south of Membij | [15,16,54] | |
| Early Islamic (8th–15th centuries AD) | Large embanked canal between Tell Fray and Qalat Jabar | [16] |
| Large embanked canal at Dibsi Faraj and qanat | [1,12] | |
| Canals in Balikh Valley north of Raqqa | [1,15,16] | |
| Canals in Balikh Valley west of Raqqa | [11,15,16] | |
| Qanats, a tunnel, and canals around Raqqa | [11,15,16] | |
| Canals alongside the Habur | [53] | |
| Nahr Dawrin, Nahr Sa’id: Large embanked canals on both banks of the Euphrates between the Balikh and Mari | [13,14,15,16] | |
| Some of the large embanked canals in northern Iraq, Tarbisu canal and Nahr Qanausa | [8,32] | |
| Qanats on the Sinjar Plain | [15,16] |
© 2018 by the authors. Licensee MDPI, Basel, Switzerland. This article is an open access article distributed under the terms and conditions of the Creative Commons Attribution (CC BY) license (http://creativecommons.org/licenses/by/4.0/).
Share and Cite
MDPI and ACS Style
Rayne, L.; Donoghue, D. A Remote Sensing Approach for Mapping the Development of Ancient Water Management in the Near East. Remote Sens. 2018, 10, 2042. https://0-doi-org.brum.beds.ac.uk/10.3390/rs10122042
AMA Style
Rayne L, Donoghue D. A Remote Sensing Approach for Mapping the Development of Ancient Water Management in the Near East. Remote Sensing. 2018; 10(12):2042. https://0-doi-org.brum.beds.ac.uk/10.3390/rs10122042
Chicago/Turabian StyleRayne, Louise, and Daniel Donoghue. 2018. "A Remote Sensing Approach for Mapping the Development of Ancient Water Management in the Near East" Remote Sensing 10, no. 12: 2042. https://0-doi-org.brum.beds.ac.uk/10.3390/rs10122042
Note that from the first issue of 2016, this journal uses article numbers instead of page numbers. See further details here.