Article

Accuracy Assessment on MODIS (V006), GLASS and MuSyQ Land-Surface Albedo Products: A Case Study in the Heihe River Basin, China

1
College of Earth and Environmental Sciences, Lanzhou University, Lanzhou 730000, China
2
State Key Laboratory of Remote Sensing Science, Institute of Remote Sensing and Digital Earth, Chinese Academy of Sciences, Beijing 100101, China
3
Remote Sensing Laboratories, University of Zurich, 8057 Zurich, Switzerland
4
College of Global Change and Earth System Science, Beijing Normal University, Beijing 100875, China
5
College of Geography and Environment Science, Zhejiang Normal University, Zhejiang 321004, China
*
Author to whom correspondence should be addressed.
Remote Sens. 2018, 10(12), 2045; https://0-doi-org.brum.beds.ac.uk/10.3390/rs10122045
Submission received: 14 September 2018 / Revised: 9 December 2018 / Accepted: 14 December 2018 / Published: 16 December 2018
(This article belongs to the Special Issue Advanced Topics in Remote Sensing)

Abstract

:
This study assessed accuracies of MCD43A3, Global Land-Surface Satellite (GLASS) and forthcoming Multi-source Data Synergized Quantitative Remote Sensing Production system (MuSyQ) albedos using ground observations and Huan Jing (HJ) data over the Heihe River Basin. MCD43A3 and MuSyQ albedos show similar high accuracies with identical root mean square errors (RMSE). Nevertheless, MuSyQ albedo is better correlated with ground measurements when sufficient valid observations are available or snow-free. The opposite happens when less than seven valid observations are available. GLASS albedo presents a larger RMSE than MCD43A3 and MuSyQ albedos in comparison with ground measurements. Over surfaces with smaller seasonal variations, MCD43A3 and MuSyQ albedos show smaller RMSEs than GLASS albedo in comparison with HJ albedo. However, for surfaces with larger temporal variations, both RMSEs and R2 of GLASS albedo are comparable with MCD43A3 and MuSyQ. Generally, MCD43A3 and MuSyQ albedos featured the same RMSEs of 0.034 and similar R2 (0.920 and 0.903, respectively), which are better than GLASS albedo (RMSE = 0.043, R2 = 0.787). However, when it comes to comparison with aggregated HJ albedo, MuSyQ and GLASS albedos are with lower RMSEs of 0.027 and 0.032 and higher R2 of 0.900 and 0.898 respectively than MCD43A3 (RMSE = 0.038, R2 = 0.836). Despite the limited geographic region of the study area, they still provide an important insight into the accuracies of three albedo products.

Graphical Abstract

1. Introduction

Land-surface albedo is defined as the ratio of the upward and downward radiation at a surface [1]. Decreased surface albedo promotes the absorption of solar radiation by land surface and contributes to global warming as well as snow and ice melting, which, in turn, leads to decreased surface reflection and increased warming effects. The positive feedback of surface albedo on climate directly affects surface energy budget and the earth’s radiation balance [2,3,4,5]. The extreme sensitivity of earth’s climate to small variations in surface albedo poses a stringent accuracy requirement on albedo products [6]. It is recognized that climate model albedos and their related climate variables can be further improved only through use of satellite measurements [7].
Satellite remote sensing provides a practical way to efficiently and frequently map surface albedo regionally and globally [8]. However, the satellite-derived albedo is not a directly observed variable but is indirectly calculated from the satellite-observed surface reflectance or radiance using albedo algorithms. Albedo is associated with the land-surface reflectance by integrating over the angular and spectral domains, and thus depends on the land-surface bidirectional reflectance distribution function (BRDF), which describes the anisotropic reflective properties of land surfaces [9].
Obtaining a multi-angular clear-sky surface reflectance dataset requires accumulating multi-day observations of the same target. However, persistent clouds and limited capability of satellites (e.g., the orbit and the field of view) make it impossible to obtain sufficient observations from a sensor at a small time scale for land-surface BRDF modeling. This results in suboptimal temporal and spatial continuity of current albedo products [10]. In addition, the low temporal resolution is not enough to capture albedo trends under conditions of seasonal or rapid surface change [11,12], and there are still missing data, especially in the winter months [13].
Therefore, additional efforts are required to improve the temporal frequency of albedo updates and improve albedo temporal continuity. The MODIS MCD43 V006 has been greatly improved by increasing the temporal resolution from 8-day to daily, although the 16-day BRDF accumulation period remains [14]. Several recent studies have also made great efforts in enhancing the temporal resolution as well as improving the temporal continuity of albedo products. The GLASS (Global Land-Surface Satellite) albedo uses a direct-estimation method [11] to provide a high temporal resolution surface albedo product. Taking advantage of multiple-sensor reflectance [15,16] with multiple sun-view geometric samples, the Multi-source Data Synergized Quantitative Remote Sensing Production system (MuSyQ) has generated the MuSyQ albedo with the MCBI (multi-sensor combined BRDF/albedo inversion) model [17]. All these products are or will be freely released to the public.
The temporal span and continuity of these albedo products have been improved either by employing other retrieval algorithms instead of BRDF modeling or developing new methods to accumulate the multi-angle clear-sky surface reflectance. However, the question of whether the accuracies and uncertainties of these albedo products with a small time span were improved to satisfy the requirements of climate and environmental monitoring studies remains to be answered. Mira et al. [12] have pointed out that an uncertainty of 0.02 in albedo (roughly equivalent to 10% error in albedo for agricultural landscape) induces a relative uncertainty on net radiation of around 5%. In mapping evapotranspiration, an uncertainty of 10% in albedo may result in a relative uncertainty of 7.0–21.4% on latent heat flux [18] and an absolute error of 20 W·m−2 in net radiation [19]. It is clear that an accurate assessment of surface albedo product is desirable for accurate predictions of climate change.
Many researchers have performed validation by directly comparing satellite albedo products with ground-based measurements when the land surface was assumed to be fully homogeneous or the ground-based measurements were spatially representative [20,21,22,23,24,25,26]. However, such assumptions were rarely satisfied because heterogeneity is a natural characteristic of most land surfaces [27]. Consequently, the errors caused by spatial mismatch between satellite observations and ground-based measurements would obscure the true accuracy of satellite albedo products [26,28]. Furthermore, this screening of in situ data results in a large number of stations over heterogeneous surfaces not suitable for validation. An alternative method was introducing the high-resolution albedo as the bridge between in situ and satellite observations to reduce the errors caused by scale mismatch. However, using high-resolution albedo introduced additional errors from inversion, geometric registration errors and error propagation [13,29]. As a result, the overall uncertainty is very complex and difficult to be quantified. Therefore, a single validation scheme cannot solve the problems of spatial scale mismatch and complex uncertainties simultaneously. In addition, a compromise is urgently needed between the errors caused by scale mismatch and the uncertainties of validation results.
In this paper, an improved validation scheme based on an indicator of representativeness error [30] of ground sites is presented, aiming at achieving a rigorous accuracy assessment of MODIS (V006), GLASS and MuSyQ albedo products. Heihe River Basin is selected as the experimental area, which has different kinds of land covers from low albedo to high albedo. In addition, the data of the experimental area is described in Section 2. Section 3 explains the validation method, including the representativeness error calculation, the coarse-scale reference albedo determination as well as the assessment method. Section 4 shows the representativeness errors of ground-based measurements and the validation results of three albedo products. A brief conclusion is provided in the end.

2. Experimental Data

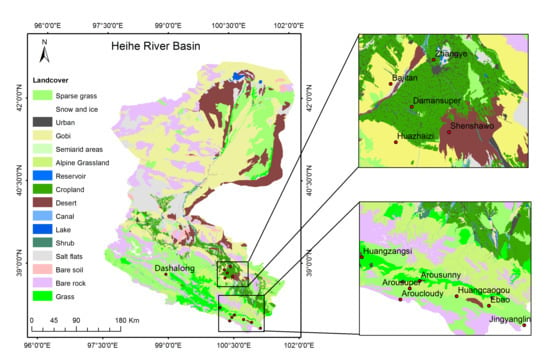
2.1. Study Area and In Situ Observation

The study area was in the upstream and midstream of the Heihe River Basin, which is a typical inland river basin in northwestern China and has been selected as the experimental area to conduct the Heihe Watershed Allied Telemetry Experimental Research (HiWATER) [31]. It covers the region bounded by 37.84°–38.98°N and 98.94°–101.12°E. Many typical land cover types are present within this region. The landscapes in the upstream include alpine grasslands, swamps meadows and wheat fields, whereas the midstream features irrigated crops, deserts, gobi, and wetlands (Figure 1).
Ground-observed albedo was collected by 13 automatic weather stations (AWS) (Table 1) from January 2013 to December 2014. All these field sites were instrumented with Kipp and Zonen Radiometers, measuring the total downward and upward shortwave radiation (300 nm–2800 nm) every 10 min. The footprints of these radiometers mainly depend on their height above the underlying surface. These radiometers have been strictly calibrated before these sites were setup to minimize the measurement uncertainties. Since the satellite products provide local solar noon albedo, the upward and downward radiation readings around local solar noon (±30 min) were averaged to generate the ground-based actual (or “blue-sky”) shortwave albedo on a daily basis. It is important to note that although the spectral range of in situ instruments is not completely in line with that of satellite shortwave albedo (0.3–5.0 µm), the in situ-measured albedo is comparable to satellite shortwave albedo, because there is very little downwelling solar energy in the spectral region above 2.2 µm or below 0.35 µm [32].

2.2. High Spatial Resolution Albedo Map

To take the surface heterogeneity of these sites into account, 23 Huan Jing (HJ) satellite sensor imageries on cloud-free days were acquired throughout the year 2013. The HJ-1A/B satellites have a 30 m spatial resolution and a revisiting circle of less than 2 days. The charge-coupled device (CCD) cameras aboard the HJ satellites collect 4-band images ranging from 430 nm to 900 nm. They were transformed into shortwave albedo values with the angular bin (AB) model [5,11], which estimates the surface albedo directly from the reflectance of one single HJ satellite observation. In addition, there is no BRDF generation during the albedo inversion process. The black-sky albedo (BSA) and white-sky albedo (WSA) were both calculated, and the actual albedo or blue-sky albedo can be estimated by weighting the BSA and WSA with the diffuse fraction of solar radiation arriving at the ground. The diffuse ratio is dependent on the solar zenith angle (SZA) and the atmospheric optical depth (AOD). The AOD information was obtained from MODIS 10 km aerosol products (Collection V005, at 550 nm). The high spatial resolution of 30 m renders it capable of capturing the details and subtle changes of surface albedo within the coarse pixels. Both Peng et al. [33] and Wu et al. [13] have demonstrated the acceptable quality of HJ albedo with an absolute error around 0.02. Furthermore, the HJ albedos were compared with the ground albedos throughout the experimental period (Figure 2), displaying an absolute accuracy (RMSE) of 0.025 and a coefficient of determination (R2) of 0.768. Despite its reliability, the calibration procedure was still carried out using the linear regression relationship between ground albedo and HJ albedo to reduce errors in the high-resolution albedo map. The HJ albedo was first used to quantitatively assess the surface heterogeneity of ground sites, and then to function as a bridge between coarse-scale albedo products and ground albedo for sites with serious heterogeneity.

2.3. MODIS (V006), GLASS and MuSyQ Albedo Products

The MCD43A3 (V006) product provides daily albedos at a 500 m spatial resolution. It is still using the 16-day accumulated directional reflectance based on the RossThick-LiSparse kernel-driven semi-empirical BRDF model to characterize the anisotropic reflectivity of land surfaces [34]. Full inversion is attempted when there are 7 or more high-quality observations well distributed over the sensor viewing hemisphere [35,36]. Unlike the MCD43A3 V005 which applied an equal weighting for the 16 days’ observations in the BRDF inversion, the MCD43A3 V006 BRDF algorithm emphasizes the contribution of the single date of interest by weighting the input data during the 16-day period as a function of the temporal distance from this day, thus aiming at better capturing the daily albedo [37,38]. The magnitude inversion algorithm is used if the amount of observations is less than 7 and greater than 2. The underlying pixel-based back up database is updated using the latest full inversions instead of relying on a land cover-based database used in V005. The date of each daily V006 retrieval represents the 9th day of the 16-day retrieval period [14].
The 1-km GLASS albedo was directly derived from MODIS/Terra and Aqua satellite reflectance products with the AB model [11,39]. It is important to note that although both the GLASS and HJ albedos were derived using the AB model, their algorithms, lying primarily in the look up table (LUT) which relates the surface albedo to the single reflectance observation, were basically different. Because the LUT was adjusted according to the reflectance data characteristics, e.g., the spectral response functions and the band ranges. The preliminary GLASS albedo is produced daily, but subject to data gaps and sharp fluctuations caused by data noise and algorithm uncertainties, and thereby averaged to an 8-day temporal resolution using a statistics-based temporal filtering (STF) algorithm to produce the final released product [40].
The MuSyQ albedo was retrieved by the MCBI model [17], which is also based on the RossThick-LiSparse kernel-driven model. The multiple satellite sensors include MODIS, VIIRS, AVHRR and MERIS (MEdium Resolution Imaging Spectrometer), which provide higher revisit frequencies and denser angular samplings. Compared to the 16 days accumulation period for MCD43A3, the accumulation period for MuSyQ BRDF was shortened to 10 days, with an albedo temporal resolution of 5 days. The number of valid observations greater than or equal to 7 during the accumulation period was identified as the high-quality inversion, the number of valid observations less than 7 and greater than or equal to 3 was classified as the medium quality inversion, and the number of valid observations less than 3 was regarded as the low quality inversion. All these 3 albedo products (Table 2) provide both shortwave BSA and WSA, and actual albedo was derived by weighting them using the diffuse fraction of solar radiation.

3. Methods

The representative errors coupled albedo product validation scheme is shown in Figure 3. To ensure the reliability of validation results, the spatial representativeness of ground sites is often assessed to screen out heterogeneous sites. However, the representative errors of ground measurements still contribute to the difference between product-ground measurements, exacerbating the uncertainties of validation results. Here, the representativeness error is defined as the error originating from the fact that the ground measurements cannot accurately represent the coarse-scale albedo. It is not only dependent on the degree of heterogeneity surrounding the site, but also the topography and location of a site within a coarse pixel since the ground site is not always flat and at the center of the pixel.
The ground site heterogeneity was first assessed, and representativeness errors of ground-observed albedo with respect to satellite coarse-pixel albedo were estimated to provide more critical constraints on the direct comparison between ground-observed albedo and satellite albedo products, narrowing down the uncertainty caused by spatial scale difference. Then, the reference value at a coarse-pixel scale was determined either directly using the ground-observed albedo or using the high-resolution albedo maps as the upscaling bridge. At last, the MCD43A3 (V006), GLASS and MuSyQ albedos were assessed over different land cover types with consideration of different inversion qualities.

3.1. Representativeness Error

The representativeness of ground-measured albedo relative to the coarse-scale albedo products was double-checked using the HJ albedo subsets to strengthen the validation results. The surface heterogeneity surrounding a ground site was first determined using the variogram functions (Equation (1)) extracted from HJ albedo since it is a major contributor to the representativeness error.
γ ( h ) = 1 2 N ( h ) i = 1 N ( h ) [ Z ( x i ) Z ( x i + h ) ] 2
where γ ( h ) is the variogram estimator between albedos that are within certain distance; Z ( x i ) is the surface albedo at pixel location x i ; Z ( x i + h ) is the surface albedo of another pixel within a lag distance h , and N ( h ) is the number of paired data at a distance of h . The theoretical model (i.e., Gaussian, spherical and exponential) with the smallest residual sum of squares relative to the experimental semivariograms is then selected as the variogram estimator.
The nugget indicates the small-scale variability within HJ pixels, measurement errors, or a combination of these [41]. The range describes the maximal distance between 2 sampling points that are correlated with each other [42]. The sill represents the maximal spatial variation in the coarse pixel and is used as an indicator of the degree of surface heterogeneity [26]. A smaller sill indicates a more homogenous albedo distribution, for which the ground-observed albedos are more spatially representative. In contrast, a large sill relates to a heterogeneous distribution where the measurement site is only spatially representative when its footprint is close to or larger than the range value. If the footprints of ground measurements are large enough and comparable with the spatial resolution of a satellite coarse pixel [22], the ground-observed albedos are considered as spatially representative.
However, the variogram provides only a qualitative understanding of the spatial representativeness of ground sites and the decision is vulnerable to subjective factors and affected by the magnitude of surface albedo. As recommended by Huang et al. [30], the representativeness error should be quantitatively identified during the validation process.
Following the measures suggested by Huang et al. [30], the representativeness error of a single site δ t is mathematically expressed as the relative difference between the HJ pixel albedo A t corresponding to this site and the averaged HJ albedo A ¯ t extending to the coarse pixel (Equation (2)). By using the same data source (Equation (2)), the inherent uncertainty from the HJ albedo can be cancelled out.
δ t = | A t A ¯ t | A ¯ t × 100 %
and
A ¯ t = ( x , y ) D f P S F ( x , y ) α t ( x , y ) ( x , y ) D f P S F ( x , y )
where D is the extent of a coarse pixel to be validated; α t represents the HJ pixel albedo within a coarse pixel at the specific time t ; f P S F denotes the point spread function (PSF) of satellite albedo product, which is used to describe the spatial response characteristics of the satellite pixels. Here, we adopted the functions characterized by Peng et al. [43]:
f P S F ( x , y ) = e x p ( x 2 + r 2 y 2 2 ( R σ ) 2 ) x = ( x x 0 ) cos θ + ( y y 0 ) sin θ y = ( x x 0 ) sin θ + ( y y 0 ) cos θ
where the r represents the ratio of height to width of the ellipse projected by this function in the xy plane, R σ indicates the standard deviation of the Gaussian function, and θ denotes the angle between the function and due east. The theoretical estimates for r , R σ , and θ are 1.35, 700 m, −20°, respectively.
To ensure a good seasonal representation of the results, the HJ albedo maps were inclusive of all data with high quality throughout the year. The frequency distribution of the representativeness error was analyzed, and the cumulative frequency of representativeness errors was used as the indicator of the practicability for the validation of coarse-scale albedo products via the direct comparison to ground single site measurements. In this study, the critical condition to carry out the direct comparison is that the percentage of representativeness errors larger than 15% cannot exceed 10.

3.2. The Reference Albedo Calculation

Determining the reference albedo at pixel scale is the implement basis of a validation. Due to limitations of instruments and measurement methods, an absolute truth is essentially inaccessible. Thus, only the best approximation is used as the reference instead. In this validation process, the representativeness error was used as an indicator to decide whether the direct comparison between ground-observed albedo and coarse-scale albedo products was reasonable or whether the fine-scale albedo map was mandatory to bridge up the scale mismatch between them.
For the sites where the representativeness errors are chiefly small (less than 5%) throughout the year, the ground-measured albedo can be used directly as the reference value for a direct comparison with coarse-pixel albedo products. In case a site shows mostly large representativeness errors (larger than 15%) all year round, the ground albedo needs to be upscaled to minimize the influence of spatial scale difference on the validation results. Here, high-resolution albedo imageries were used as the bridge between ground-observed albedo and coarse-scale albedo products, which is known as the multi-scale validation strategy. First, the ground albedo is used to calibrate the high-resolution albedo. Then, the calibrated high-resolution albedo maps are aggregated (i.e., upscaled) to the coarse-pixel scale by weighting the HJ pixel albedo with the PSF as the reference value.

3.3. Assessment Method

To comprehensively assess the performance of these albedo products, 6 land cover types, including grassland, wheat field, corn field, gobi, desert, and wetland, representing the typical land cover types in Heihe River Basin, were covered by the validation process. In addition, their abilities to capture the surface albedo temporal trend and magnitude in different inversion conditions were assessed. Statistical indexes such as root mean square error (RMSE), mean bias (Bias) and coefficient of determination (R2) as given in (Equations (5)–(7)) were employed to quantitatively indicate the accuracy. The RMSE and Bias measure the differences between albedo products and reference, while the R2 measures their consistency.
R M S E = l = 1 H ( P l O l ) 2 / H
B i a s = l = 1 H ( P l O l ) / H
R 2 = [ l = 1 H ( P l P ¯ ) ( O l O ¯ ) ] 2 / l = 1 H ( P l P ¯ ) 2 l = 1 H ( O l O ¯ ) 2
where P l and O l are the product-based albedo and reference albedo on the l th time period, respectively. In addition, P ¯ and O ¯ are the averaged value of the product-based albedo and reference albedo in time series, respectively. H is the number of the total time periods.
Additionally, in line with Wright et al. [32] and following the recommendations of Sütterlin et al. [38], the daily ground-observed albedos were used for the validation of MCD43A3 V006 to better assess its capability to capture the daily surface albedo. However, for the validation of 8-day GLASS and 5-day MuSyQ albedo, the daily ground albedos were first averaged to the corresponding temporal step of the albedo products [3,44,45].
The assessment was conducted from 2 aspects. First, the accuracies of the 3 albedo products with respect to the reference were assessed. Second, the performances of 3 albedo products were compared. Because of the differences in time and spatial resolutions of these albedo products, the comparison is just focused on their closeness and consistency with the reference at the corresponding pixel scale, but their absolute values were ignored.

4. Results and Discussions

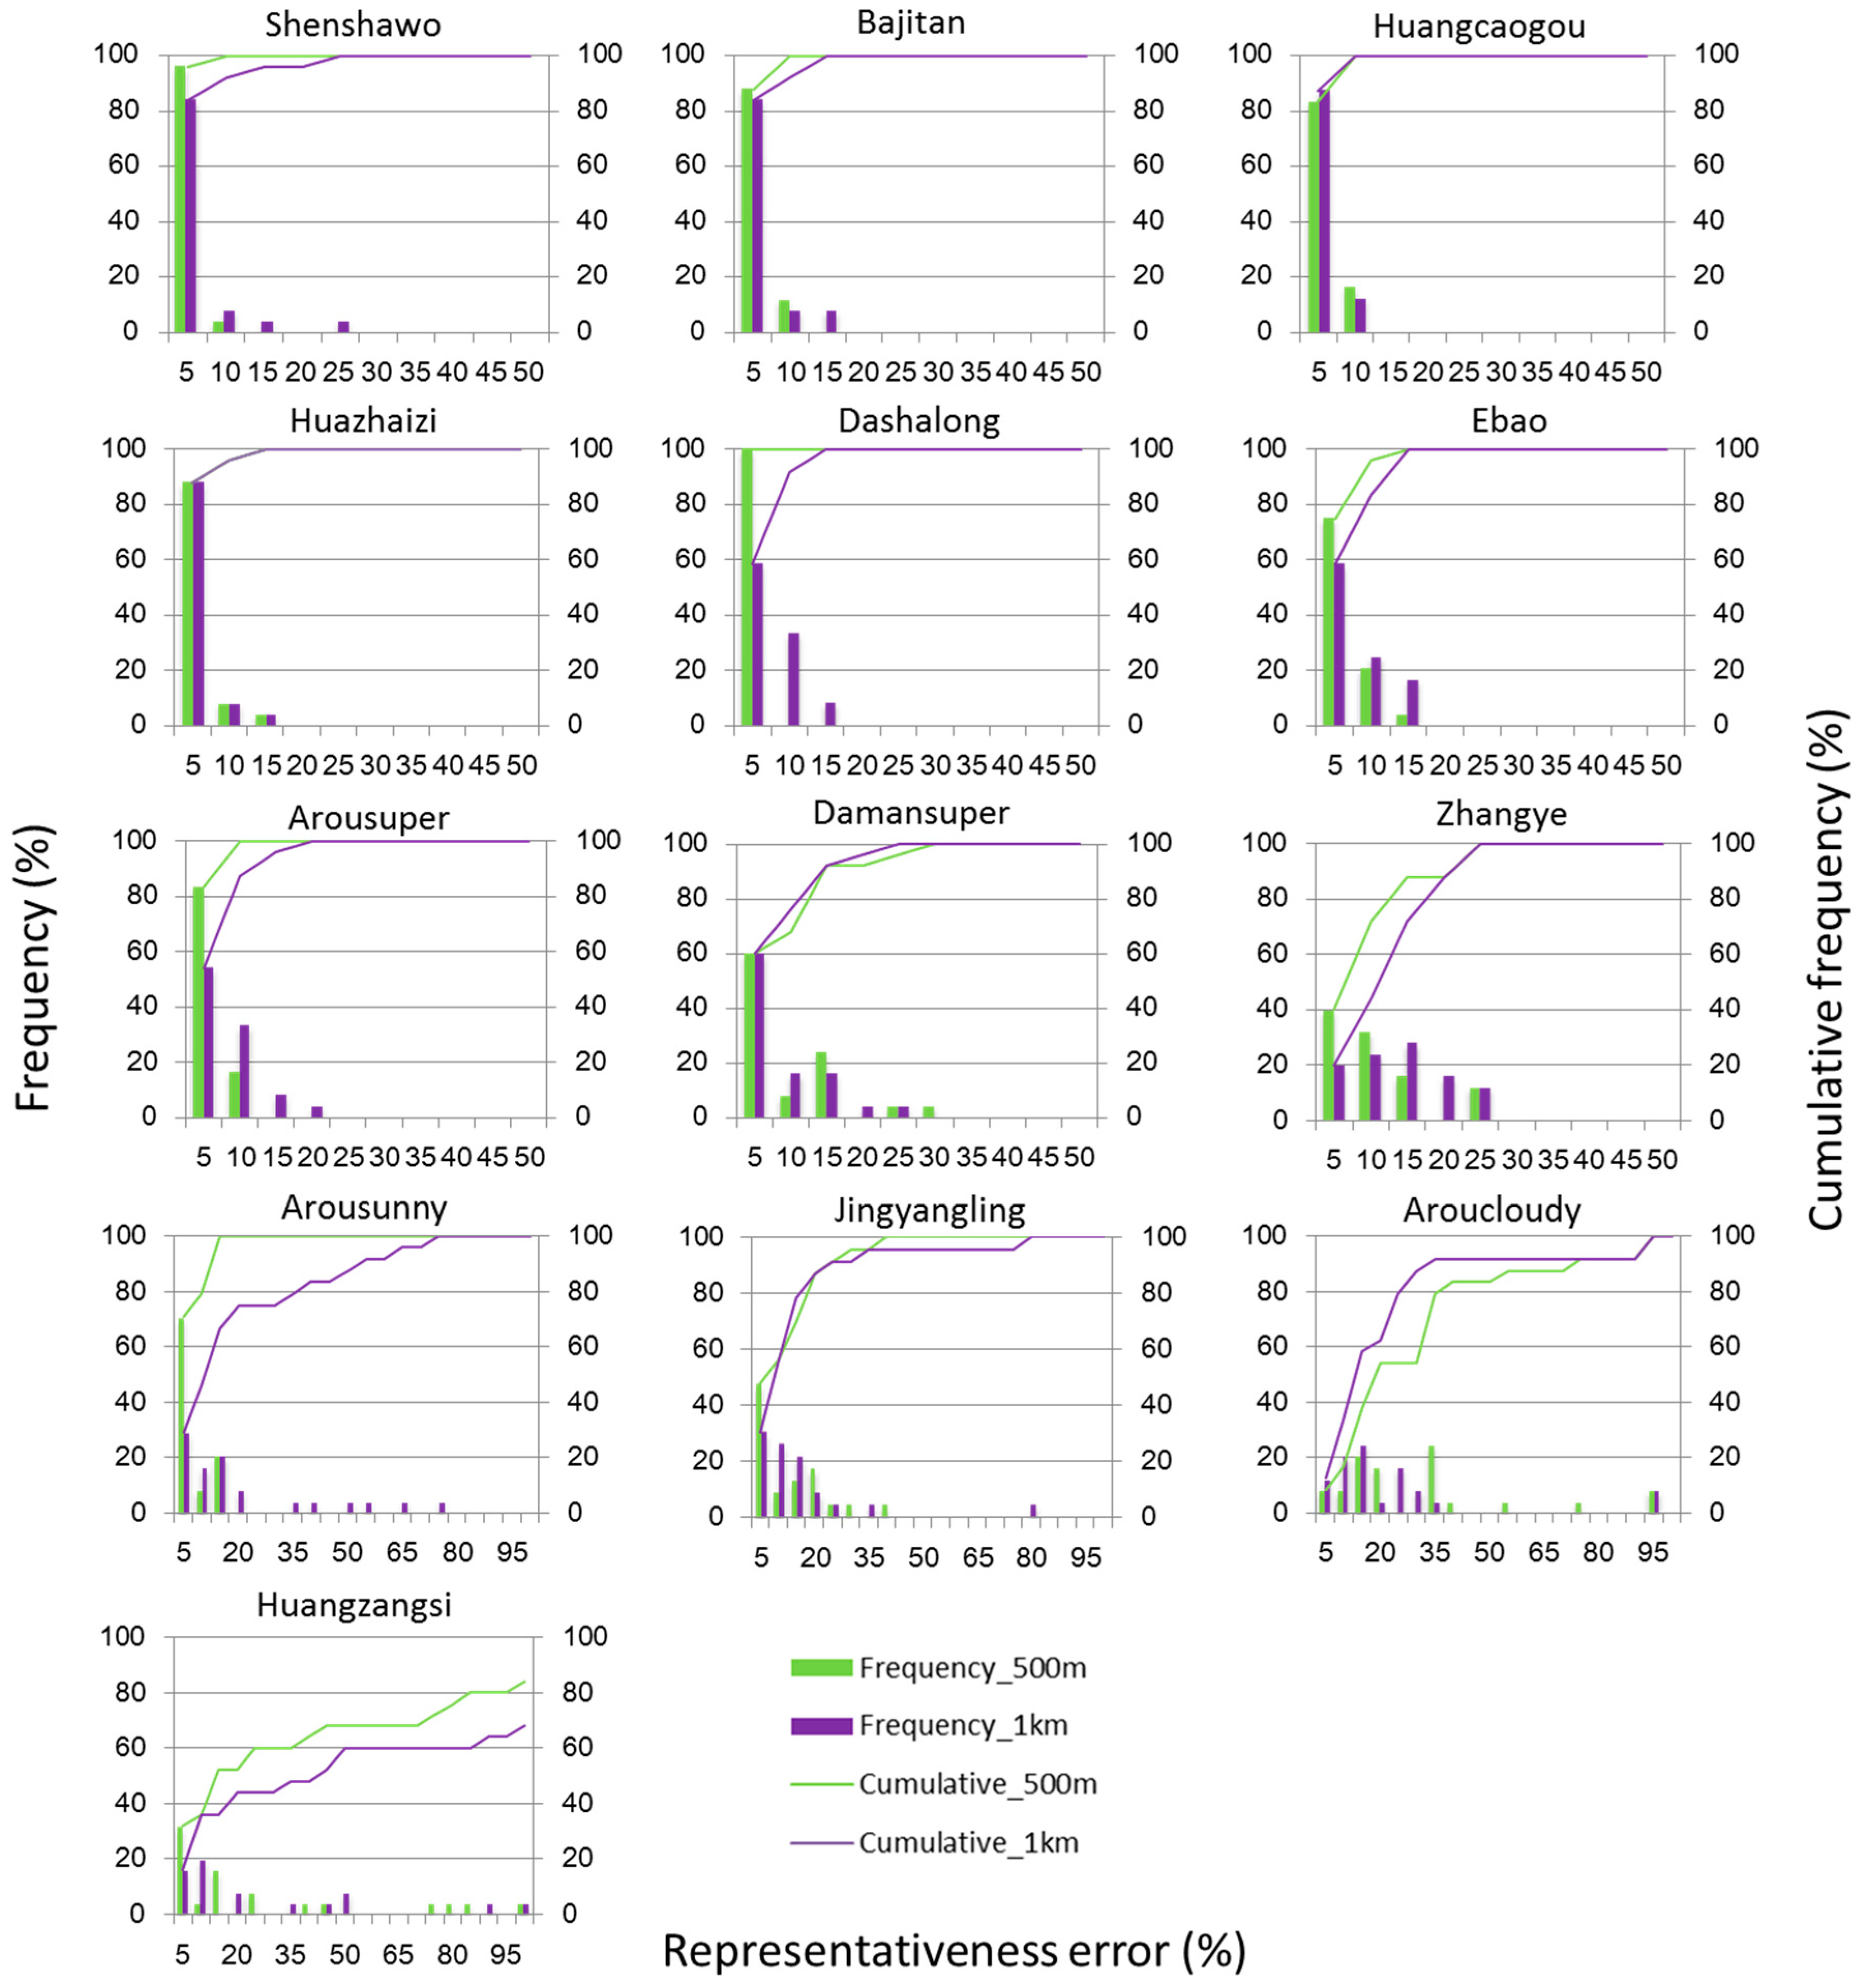
4.1. Spatial Heterogeneity and Representativeness Errors of Ground Sites

The nuggets on the two spatial scales (500 m and 1 km) are near zero over all the sites (Table 3), indicating that the 30 m HJ pixel can fully characterize the small-scale variability and that there is no spatial variance within the HJ pixel scale. Over the sites from Arousuper to Huazhaizi (Table 3), the sills are relatively small on two pixel scales (500 m and 1 km), and thus they were considered as the potential homogeneous sites. However, the range values on the two spatial scales are quite different, indicating that the degree of the spatial representativeness of these sites with respect to the satellite pixel is spatial scale dependent. The sill values of the Bajitan, Damansuper, Ebao and Huangzangsi are small on the 500 m pixel scale, while the sill values increase as 1 km areas are considered, indicating that these sites may be heterogeneous even though they may be homogeneous on the 500 m pixel scale. The sills of the other sites, including Zhangye, Arousunny, Aroucloudy and Jingyangling, are relatively large and thus are identified as potentially heterogeneous sites.
In fact, the spatial heterogeneity assessment using the variogram is just a subjective qualitative description based on the albedo information in a single period. The frequency distribution of representativeness errors with respect to different thresholds (%) are further calculated and shown in Table 4. Over Shenshawo, Bajitan, Huangcaogou and Huazhaizi sites, data points with relative errors lower than 5% amount to more than 83.3% and 84% throughout the year on the 500 m and 1 km pixel scales, respectively. Almost all the data points (larger than 92%) are with representativeness errors less than 10%, and the maximum relative errors over these sites are almost below 15%. Over the sites of Dashalong, Ebao and Arousuper, the percentages of representativeness errors less than 5% decrease (more than 75 and 54.2 for the 500 m and 1 km pixels, respectively). However, the representativeness errors less than 10% of these sites cover more than 95.8 and 83.3 percent for the 500 m and 1 km pixels, respectively. In addition, the maximum representativeness errors are also almost less than 15%. Over the Damansuper site, a substantial part (68% and 76% for the 500 m and 1 km pixels, respectively) of the representativeness errors are less than 10%. In addition, only a small percentage of the representativeness errors are larger than 15% for the 500 m and 1 km pixels. Over the other sites, including Zhangye, Arousunny, Jingyangling, Aroucloudy, and Huangzangsi, the percentage of representativeness errors within 5% is very small and a significant number (larger than 10 percent) of relative errors are larger than 15% over these sites. Furthermore, the representativeness errors are evenly distributed in different levels for both the 500 m and 1 km pixels and the maximum relative errors even reach 80% over most of these sites (Figure A1), causing the slow increase of the cumulative frequency when the representativeness errors are less than 15%.
The representativeness errors shown in Table 4 are not entirely consistent with the results of the spatial heterogeneity assessment in Table 3, which can be attributed to the fact that the representativeness errors are related to but not entirely dependent on surface heterogeneity. For instance, the representativeness error may be also determined by the location of a ground site within a coarse pixel. Thus, it provides a more rigorous, quantitative standard to constraint the direct comparison for a validation. For Shenshawo, Bajitan, Huangcaogou and Huazhaizi, the representativeness errors of ground sites are negligible, indicating the feasibility of directly using the ground-observed albedo as the reference for a validation. For Dashalong, Ebao, Arousuper and Damansuper, the ability of the ground-based point observation to represent the reference value at a coarse-pixel scale decreased a little bit but still hold. For Zhangye, Arousunny, Jingyangling, Aroucloudy, and Huangzangsi, the representativeness errors of ground sites cannot be negligible and will produce great impacts on the direct comparison between product-ground measurements. Under this circumstance, the multi-scale validation strategy is mandatory to ensure the reliability of results.

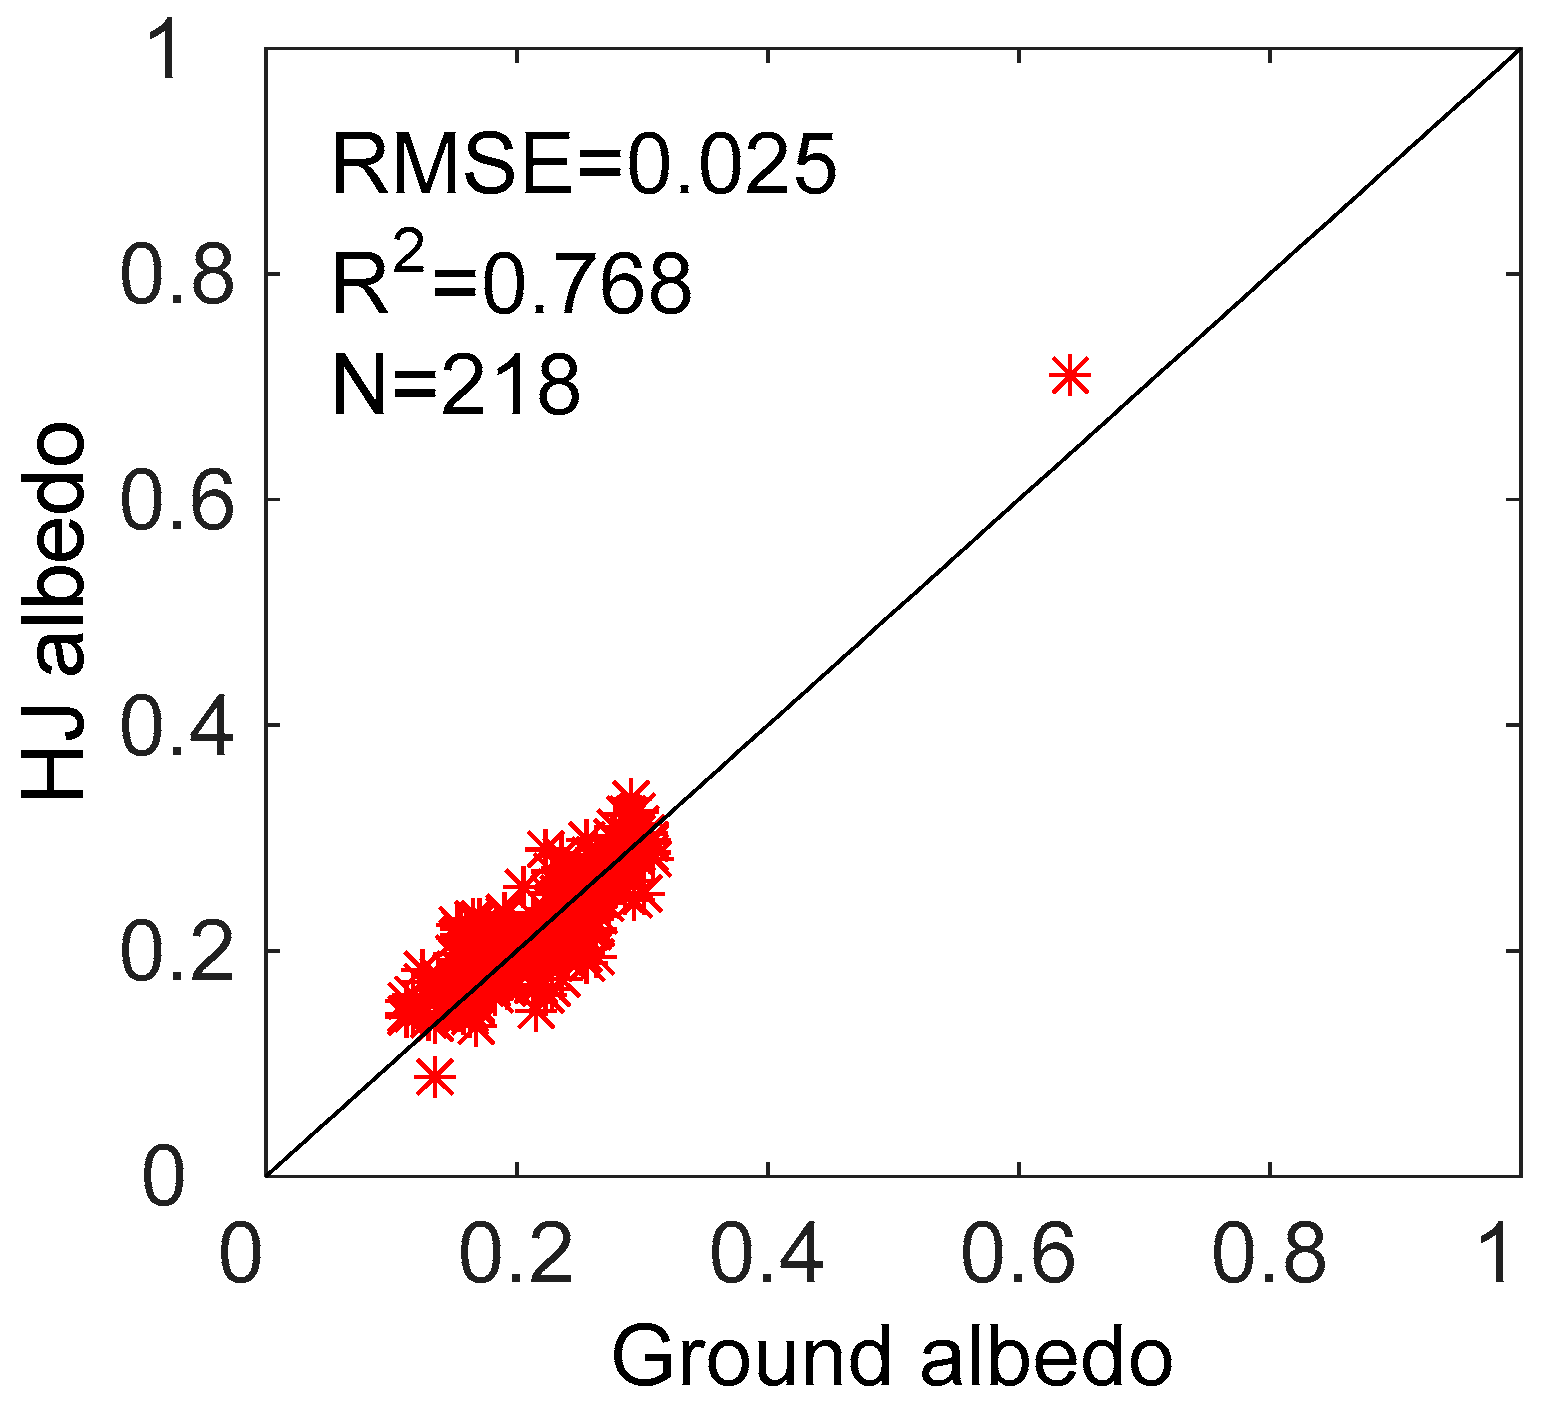
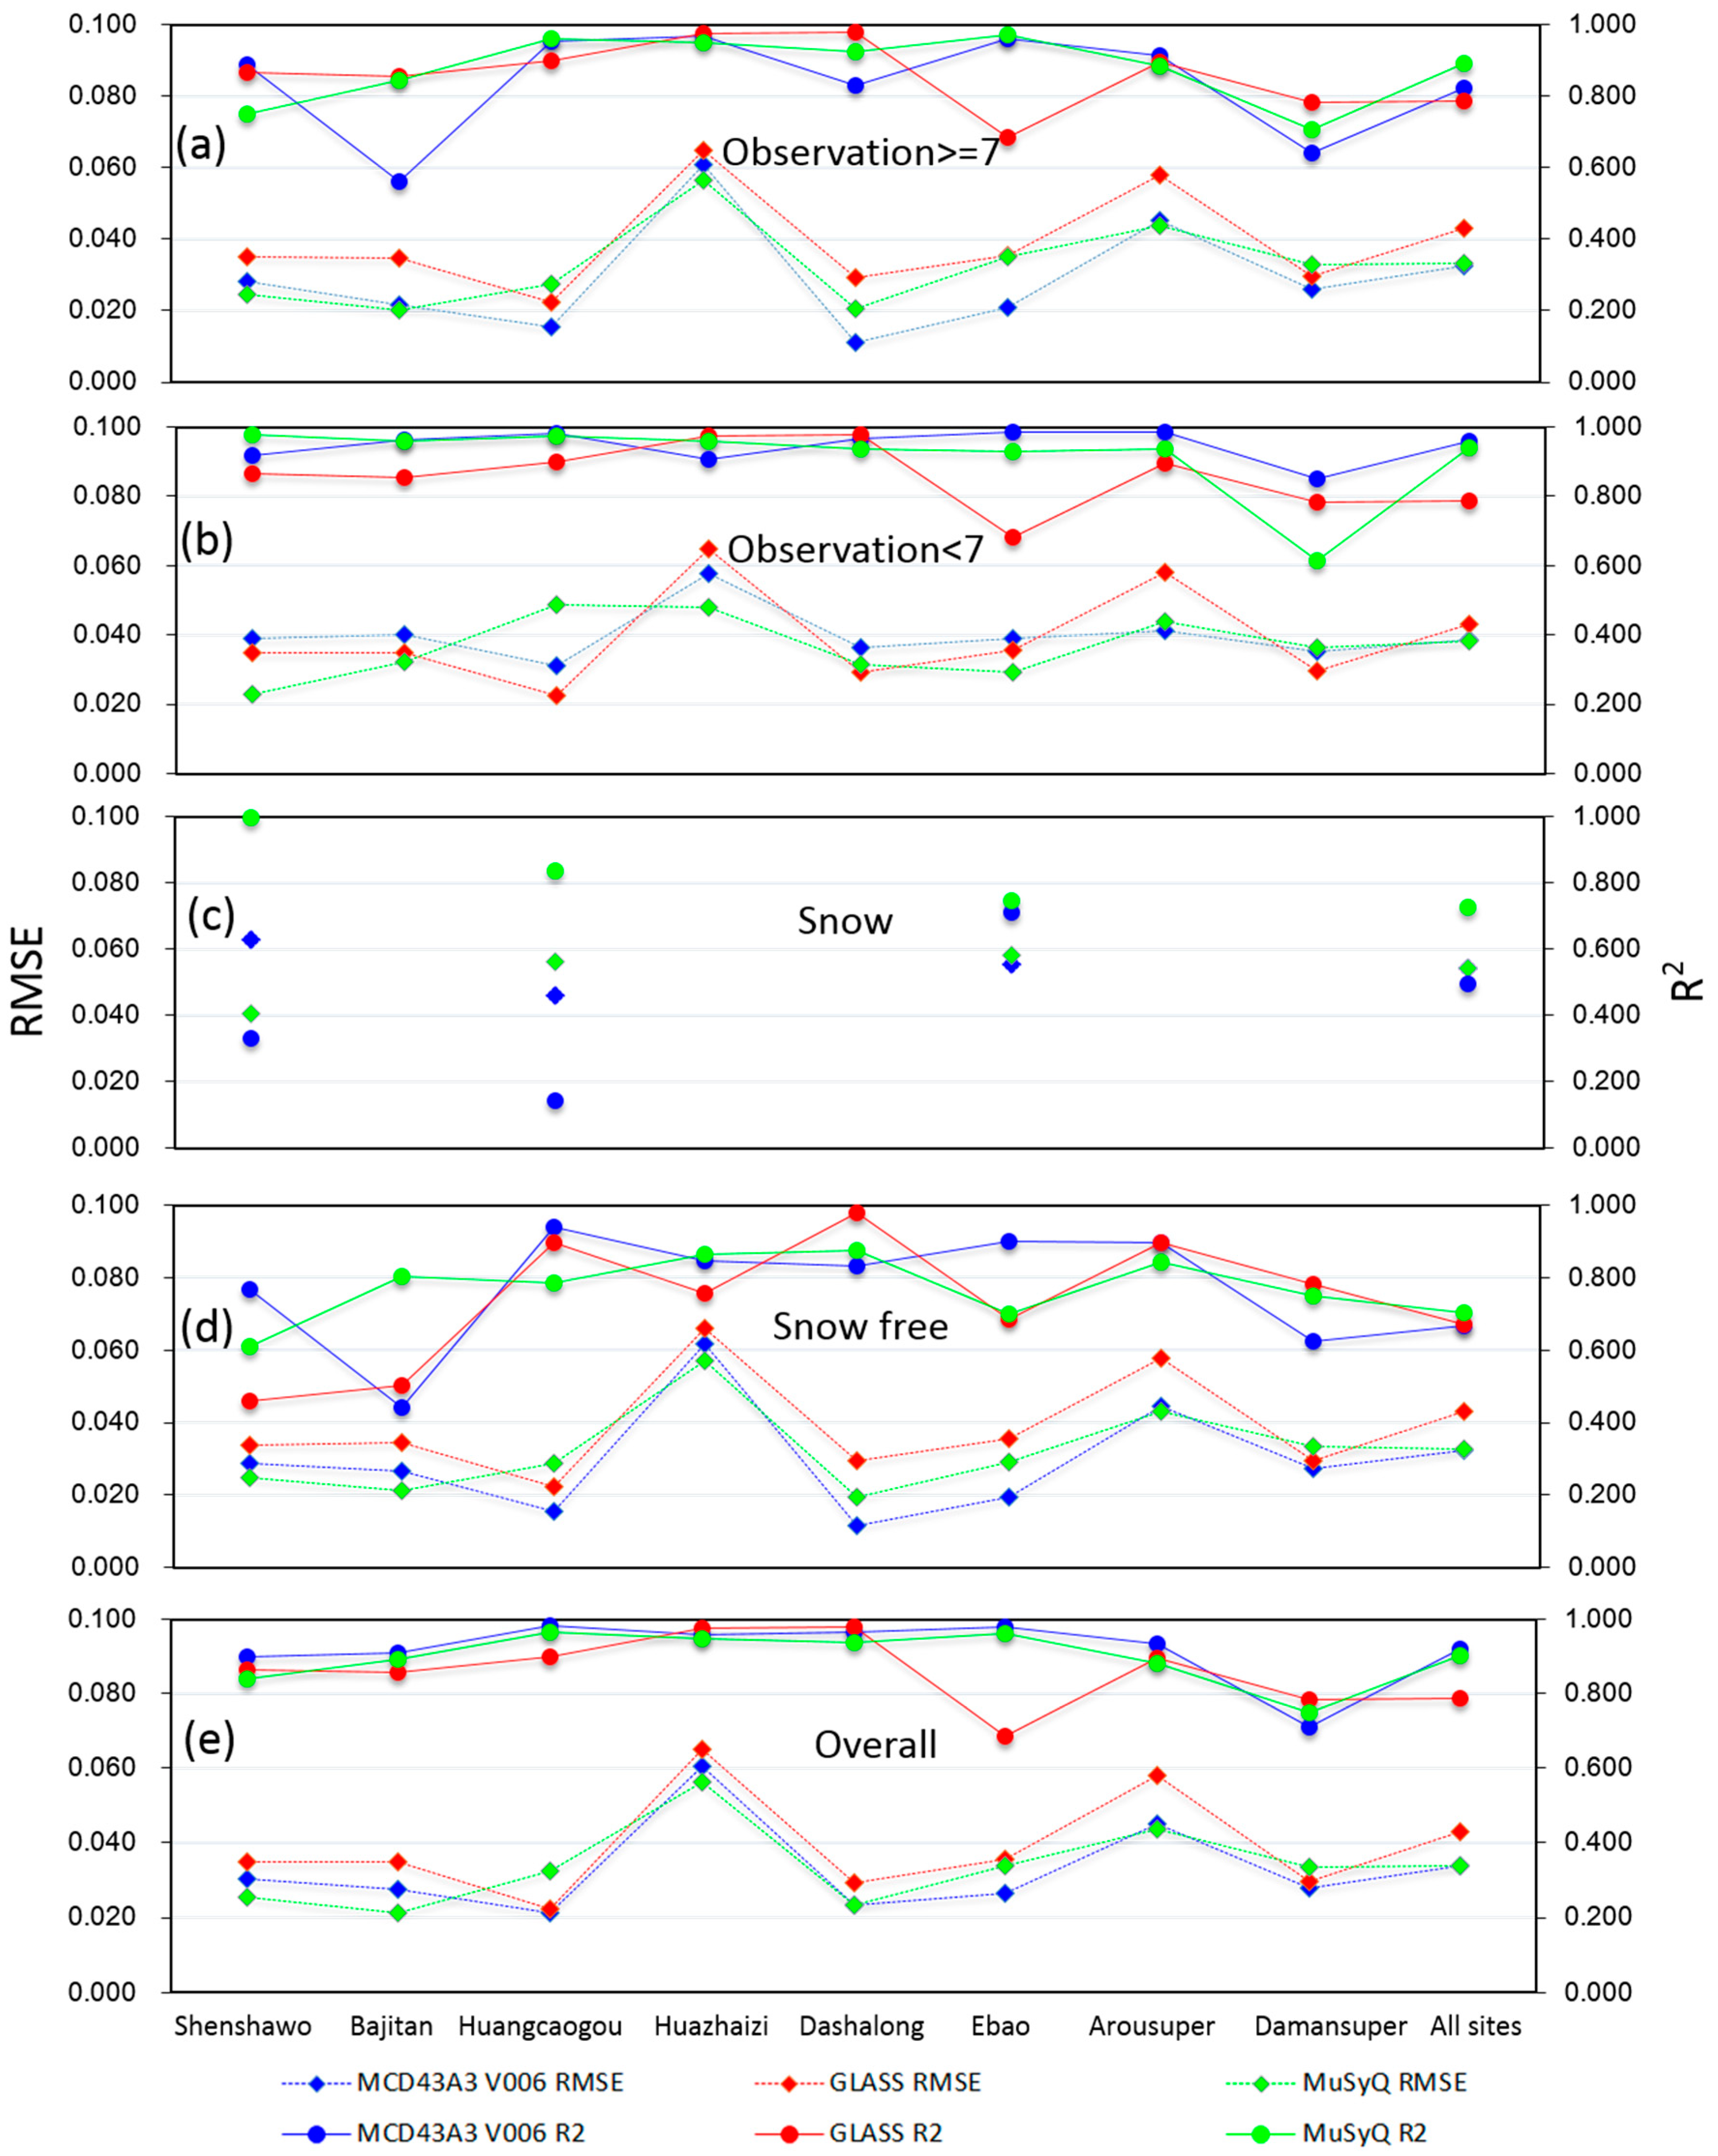
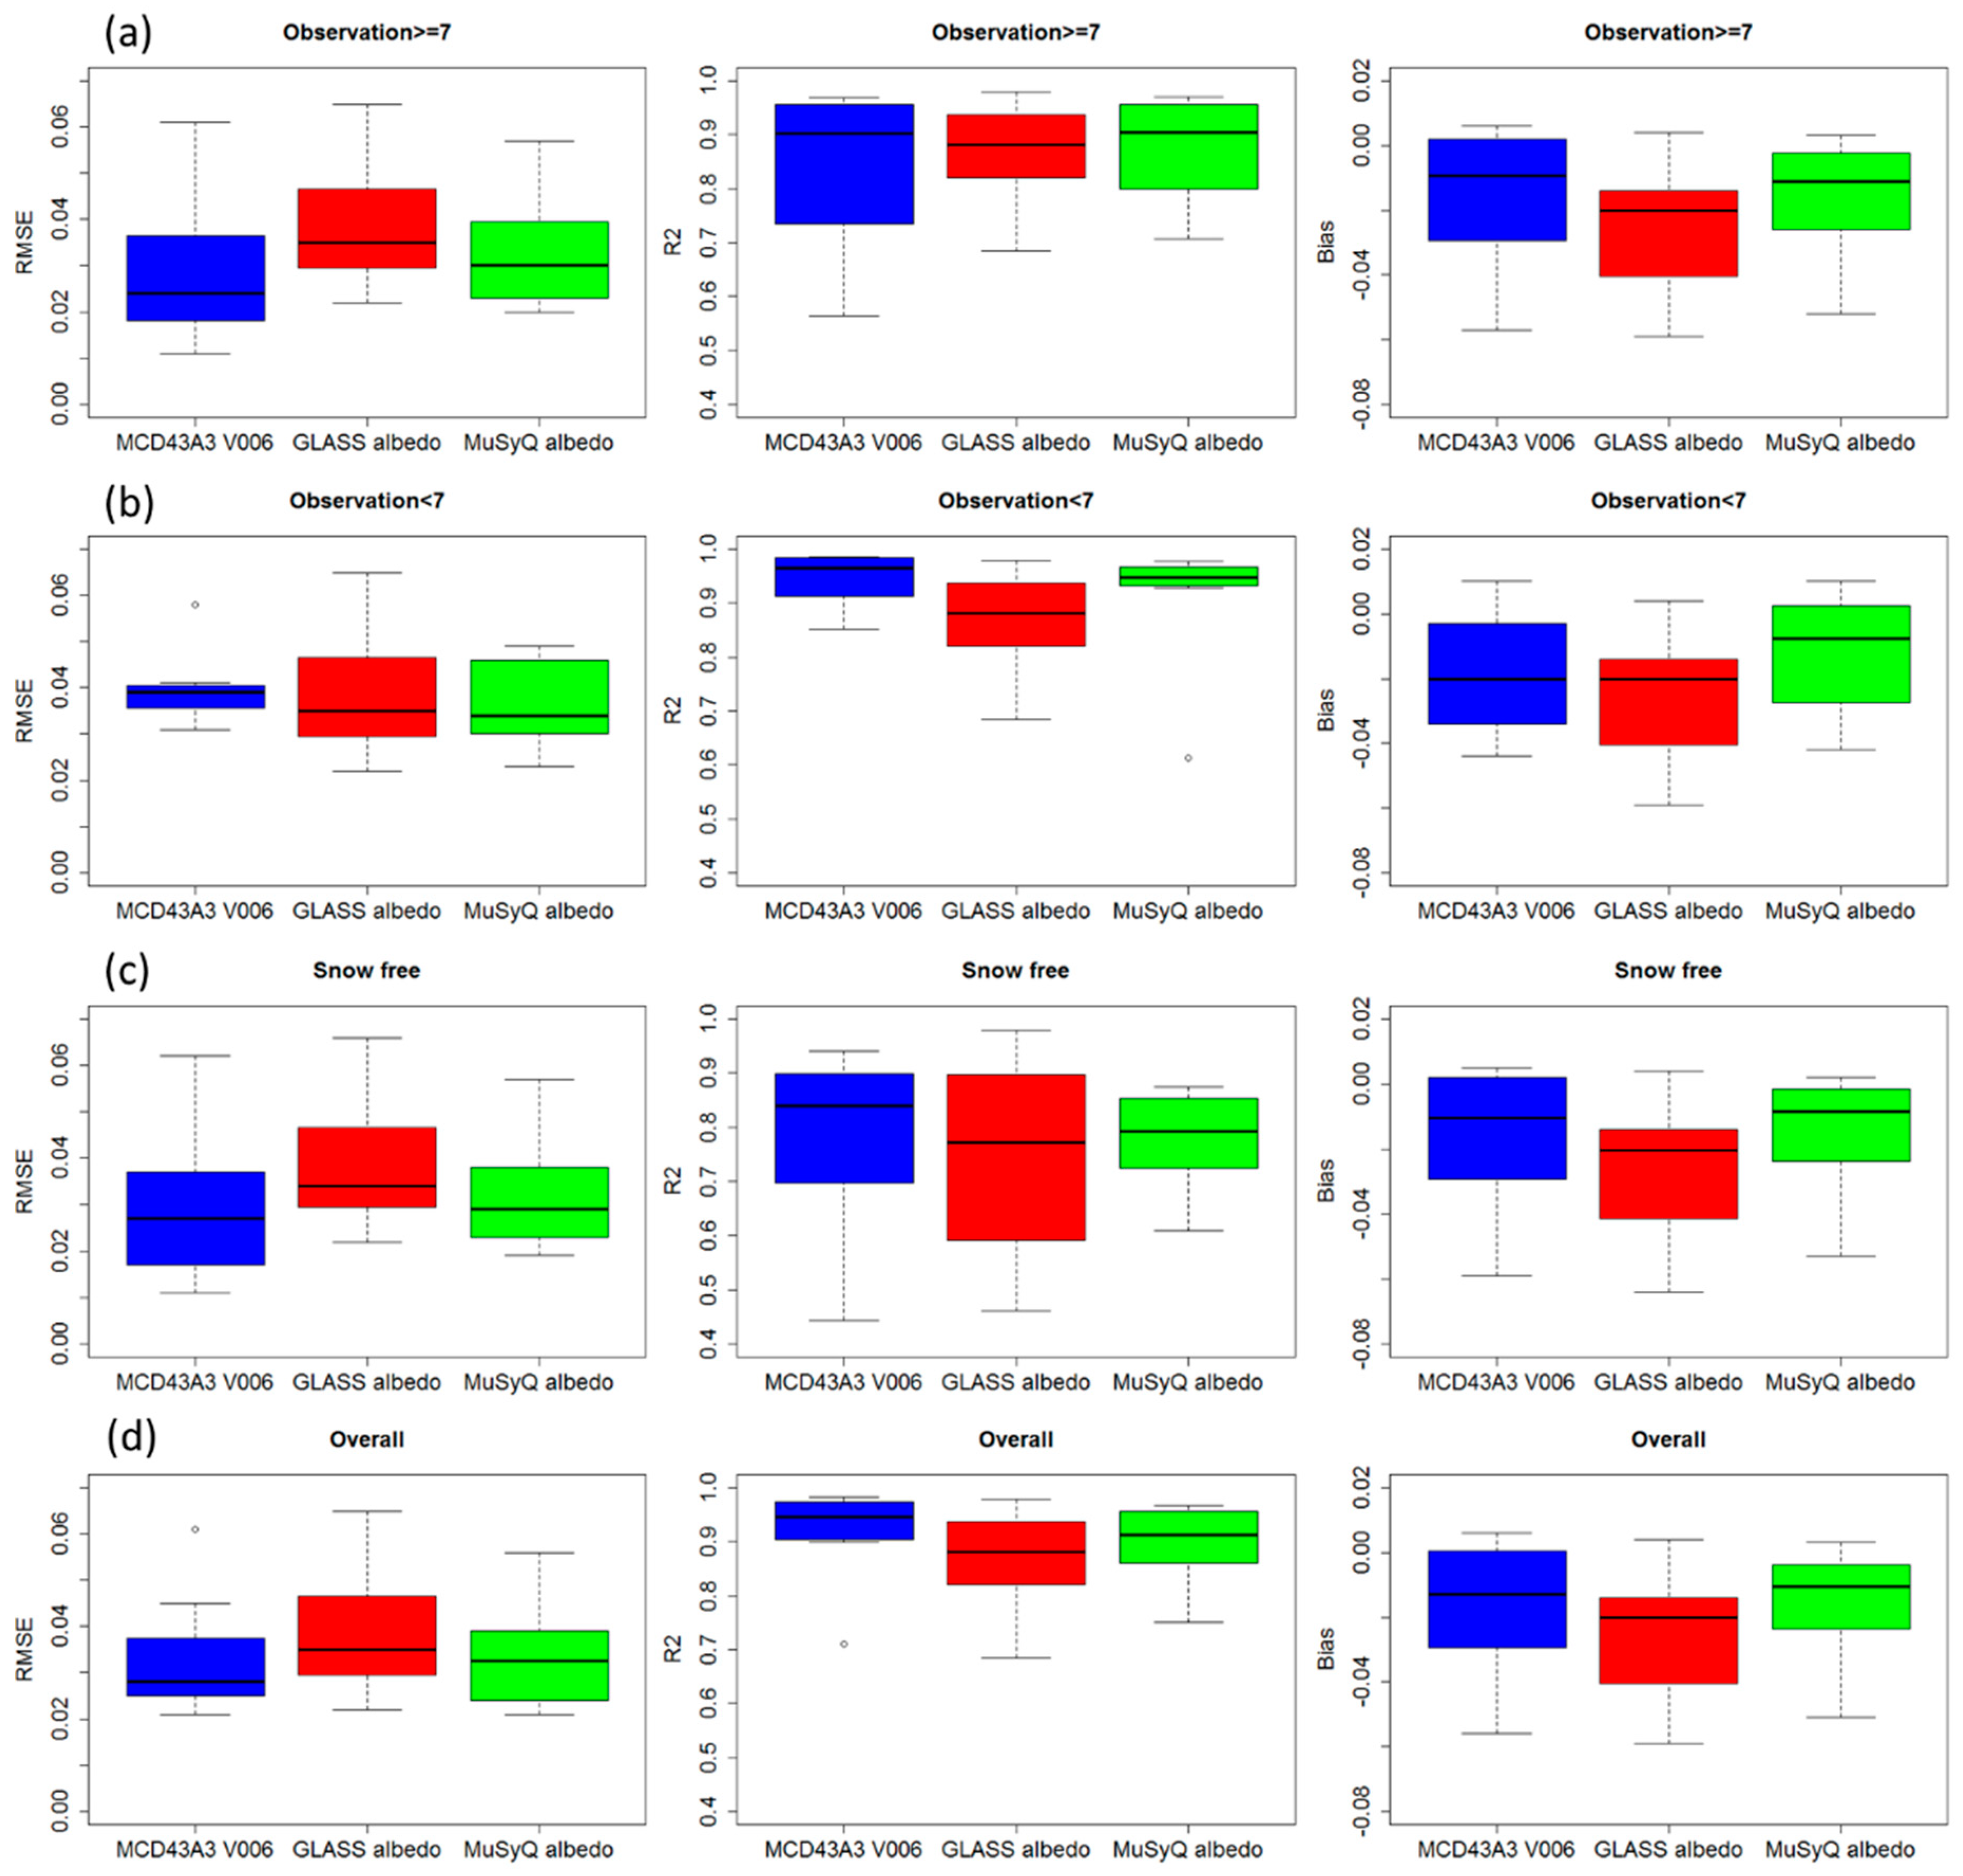
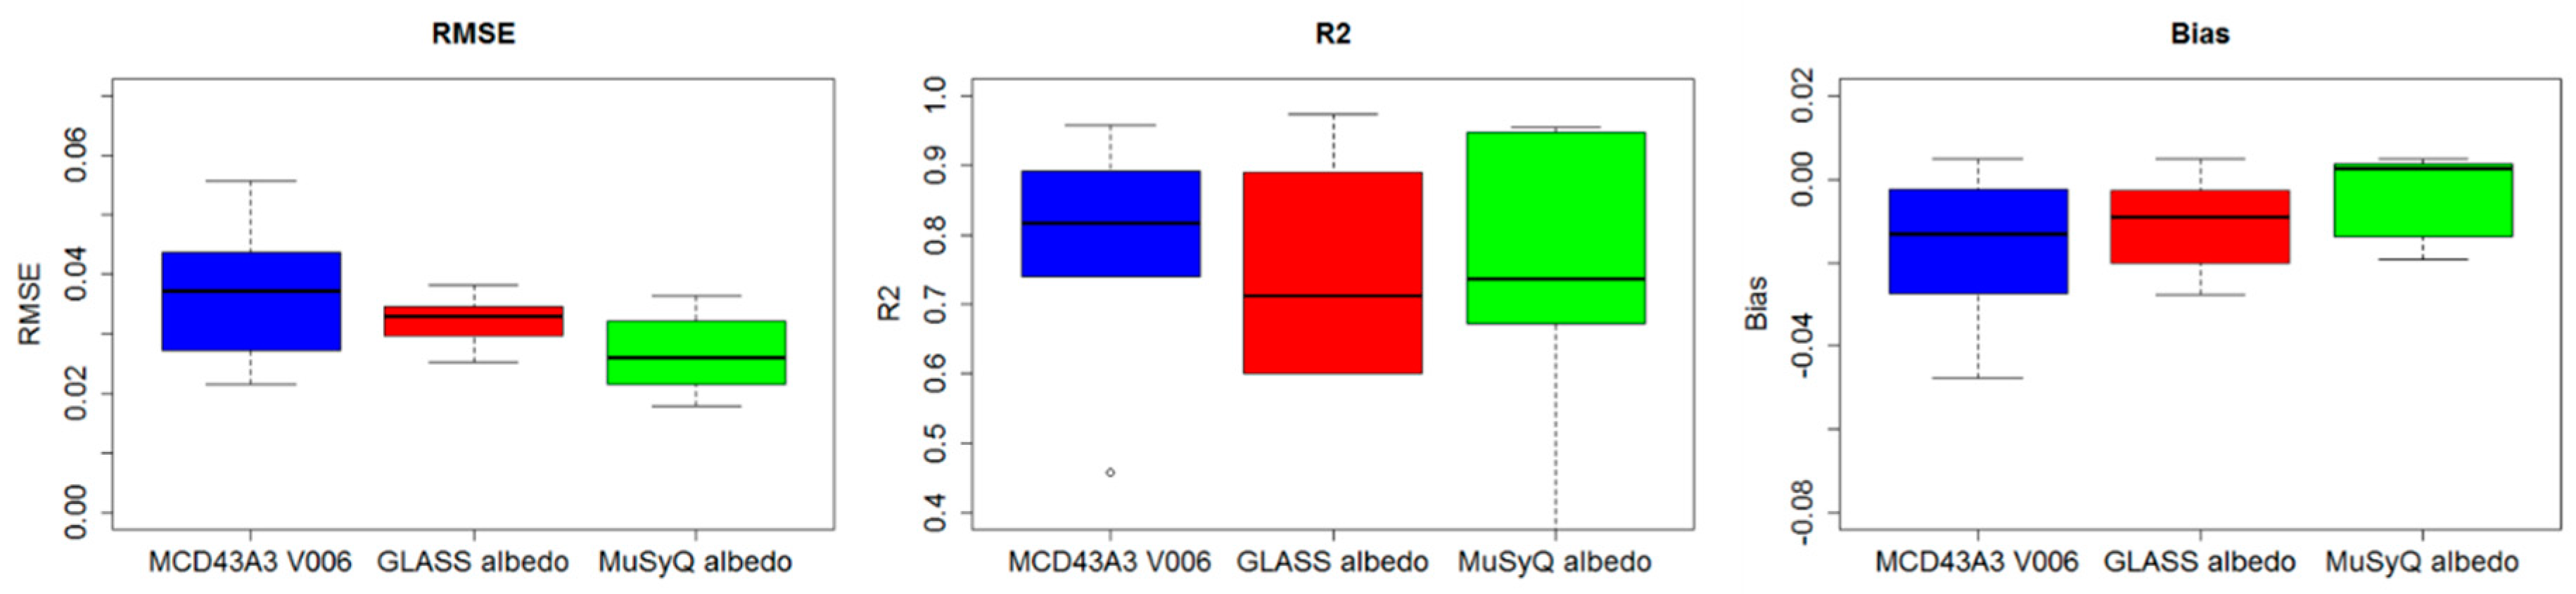
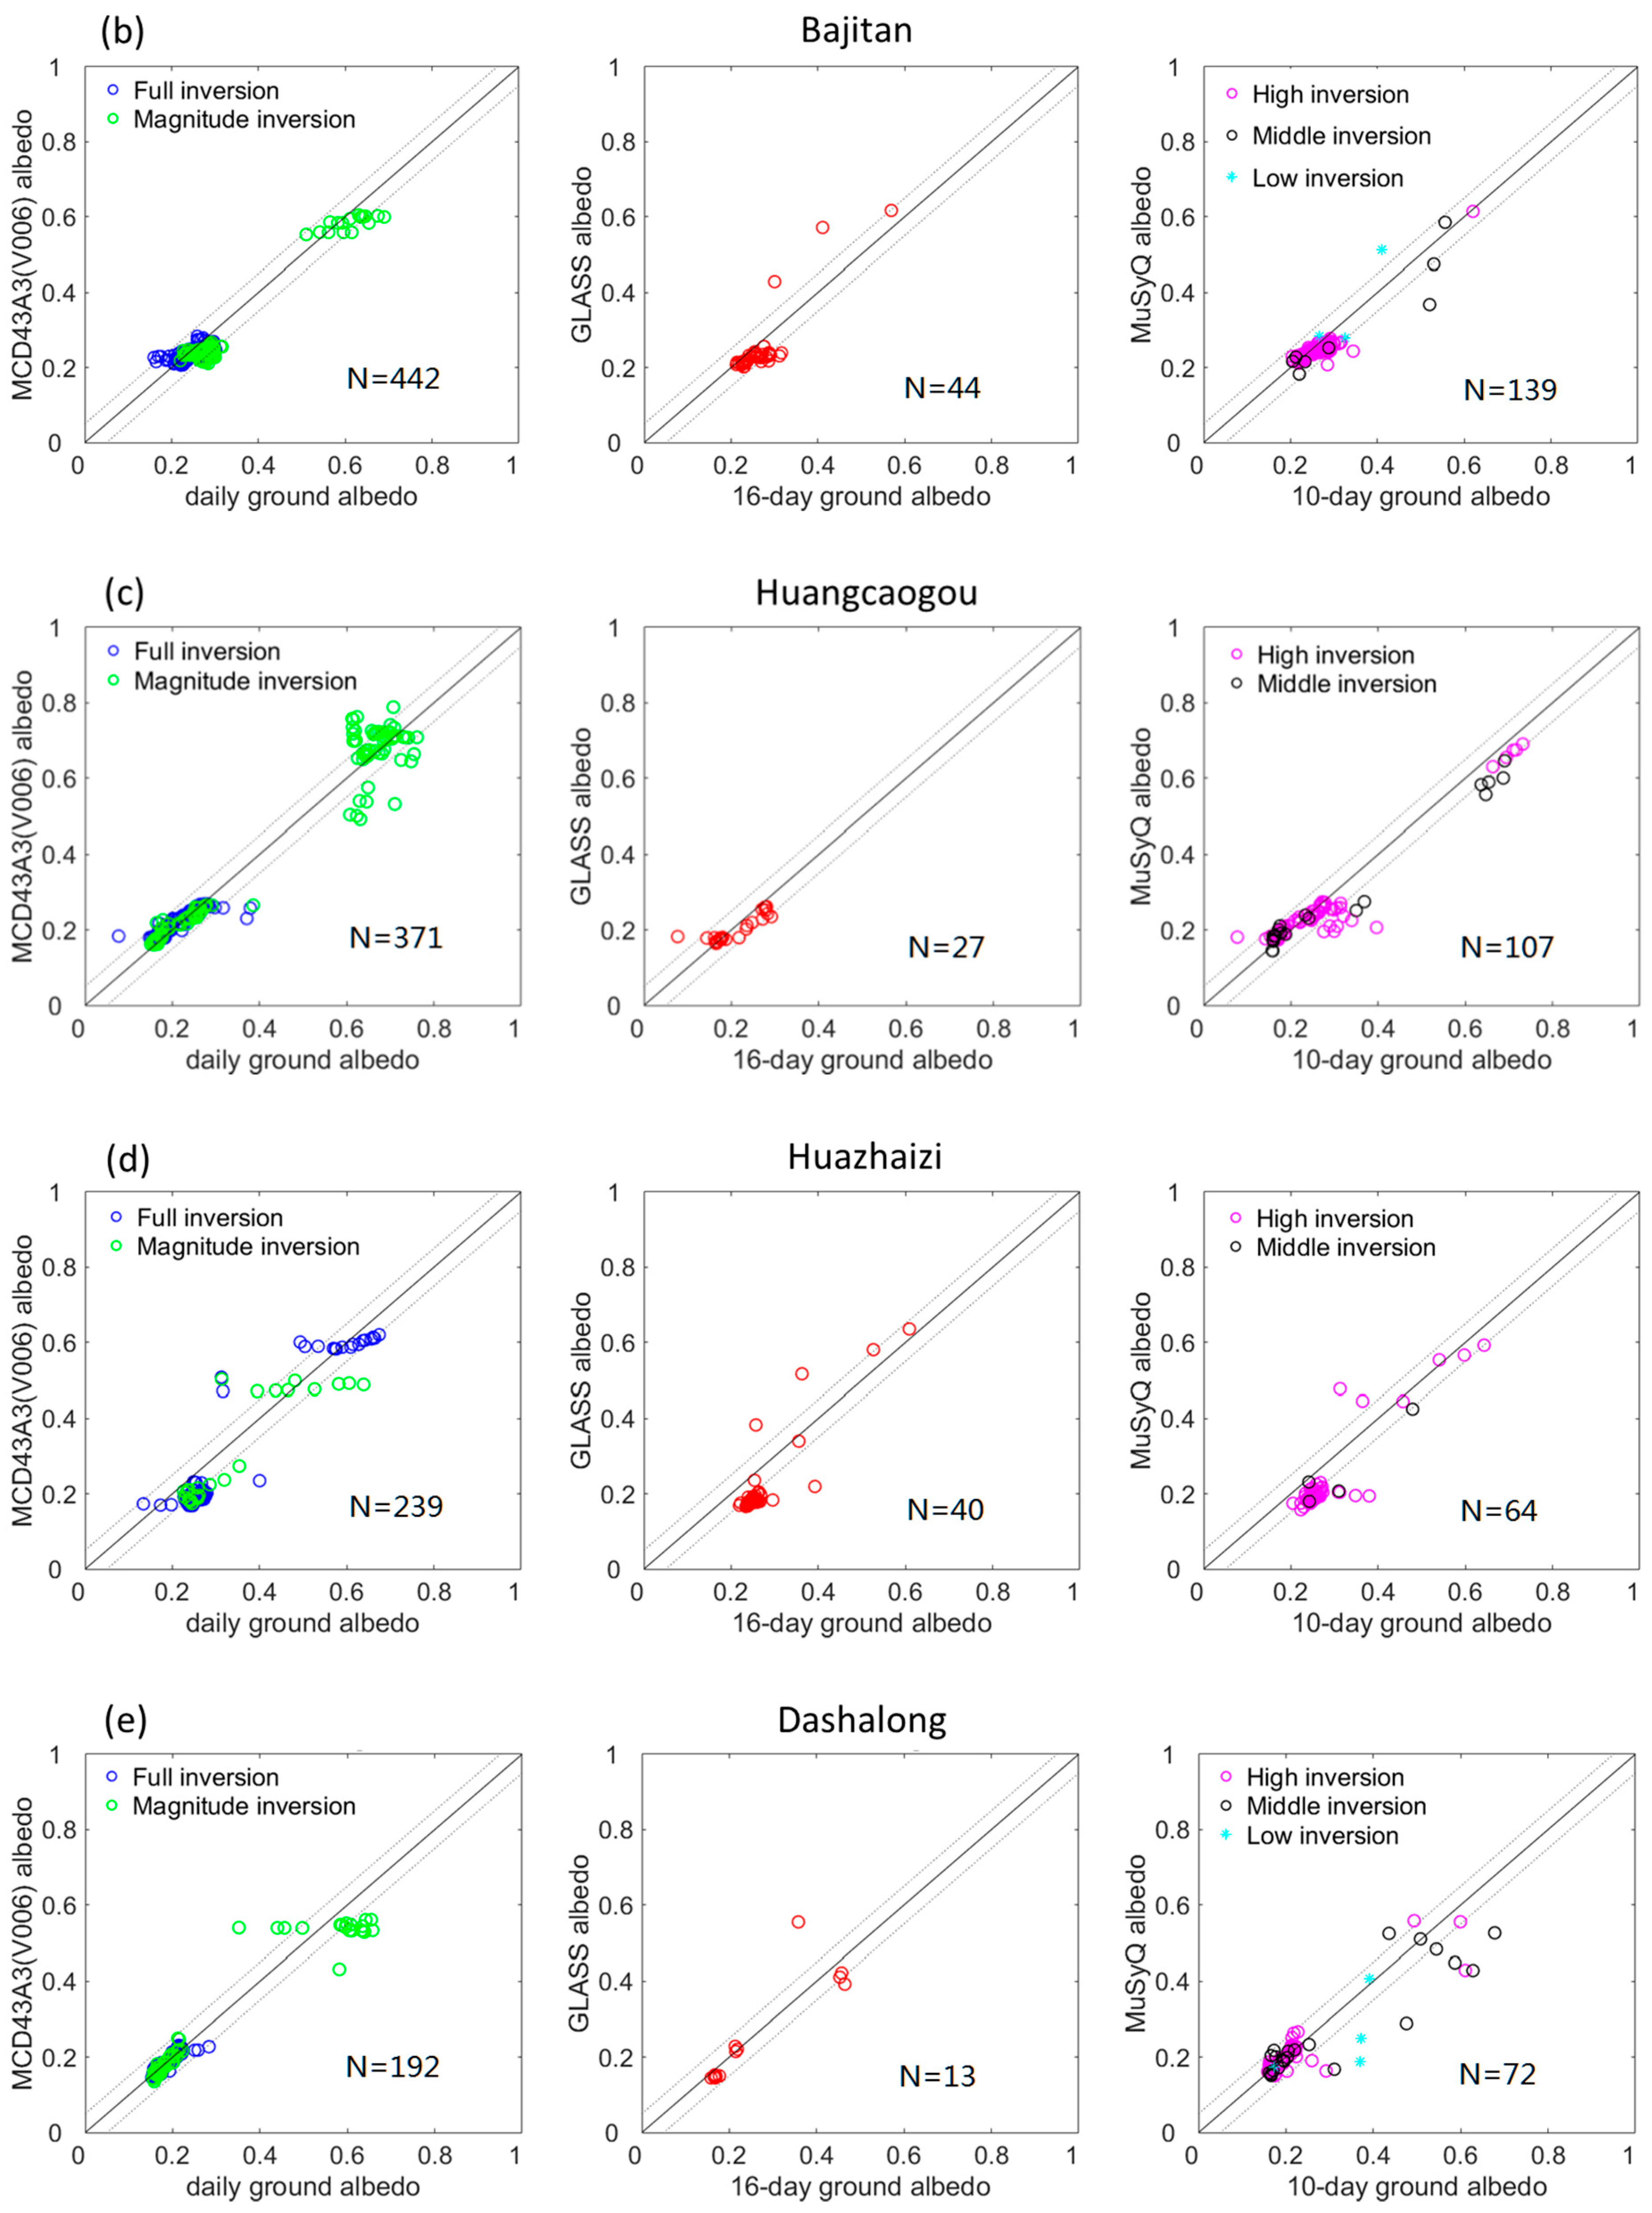
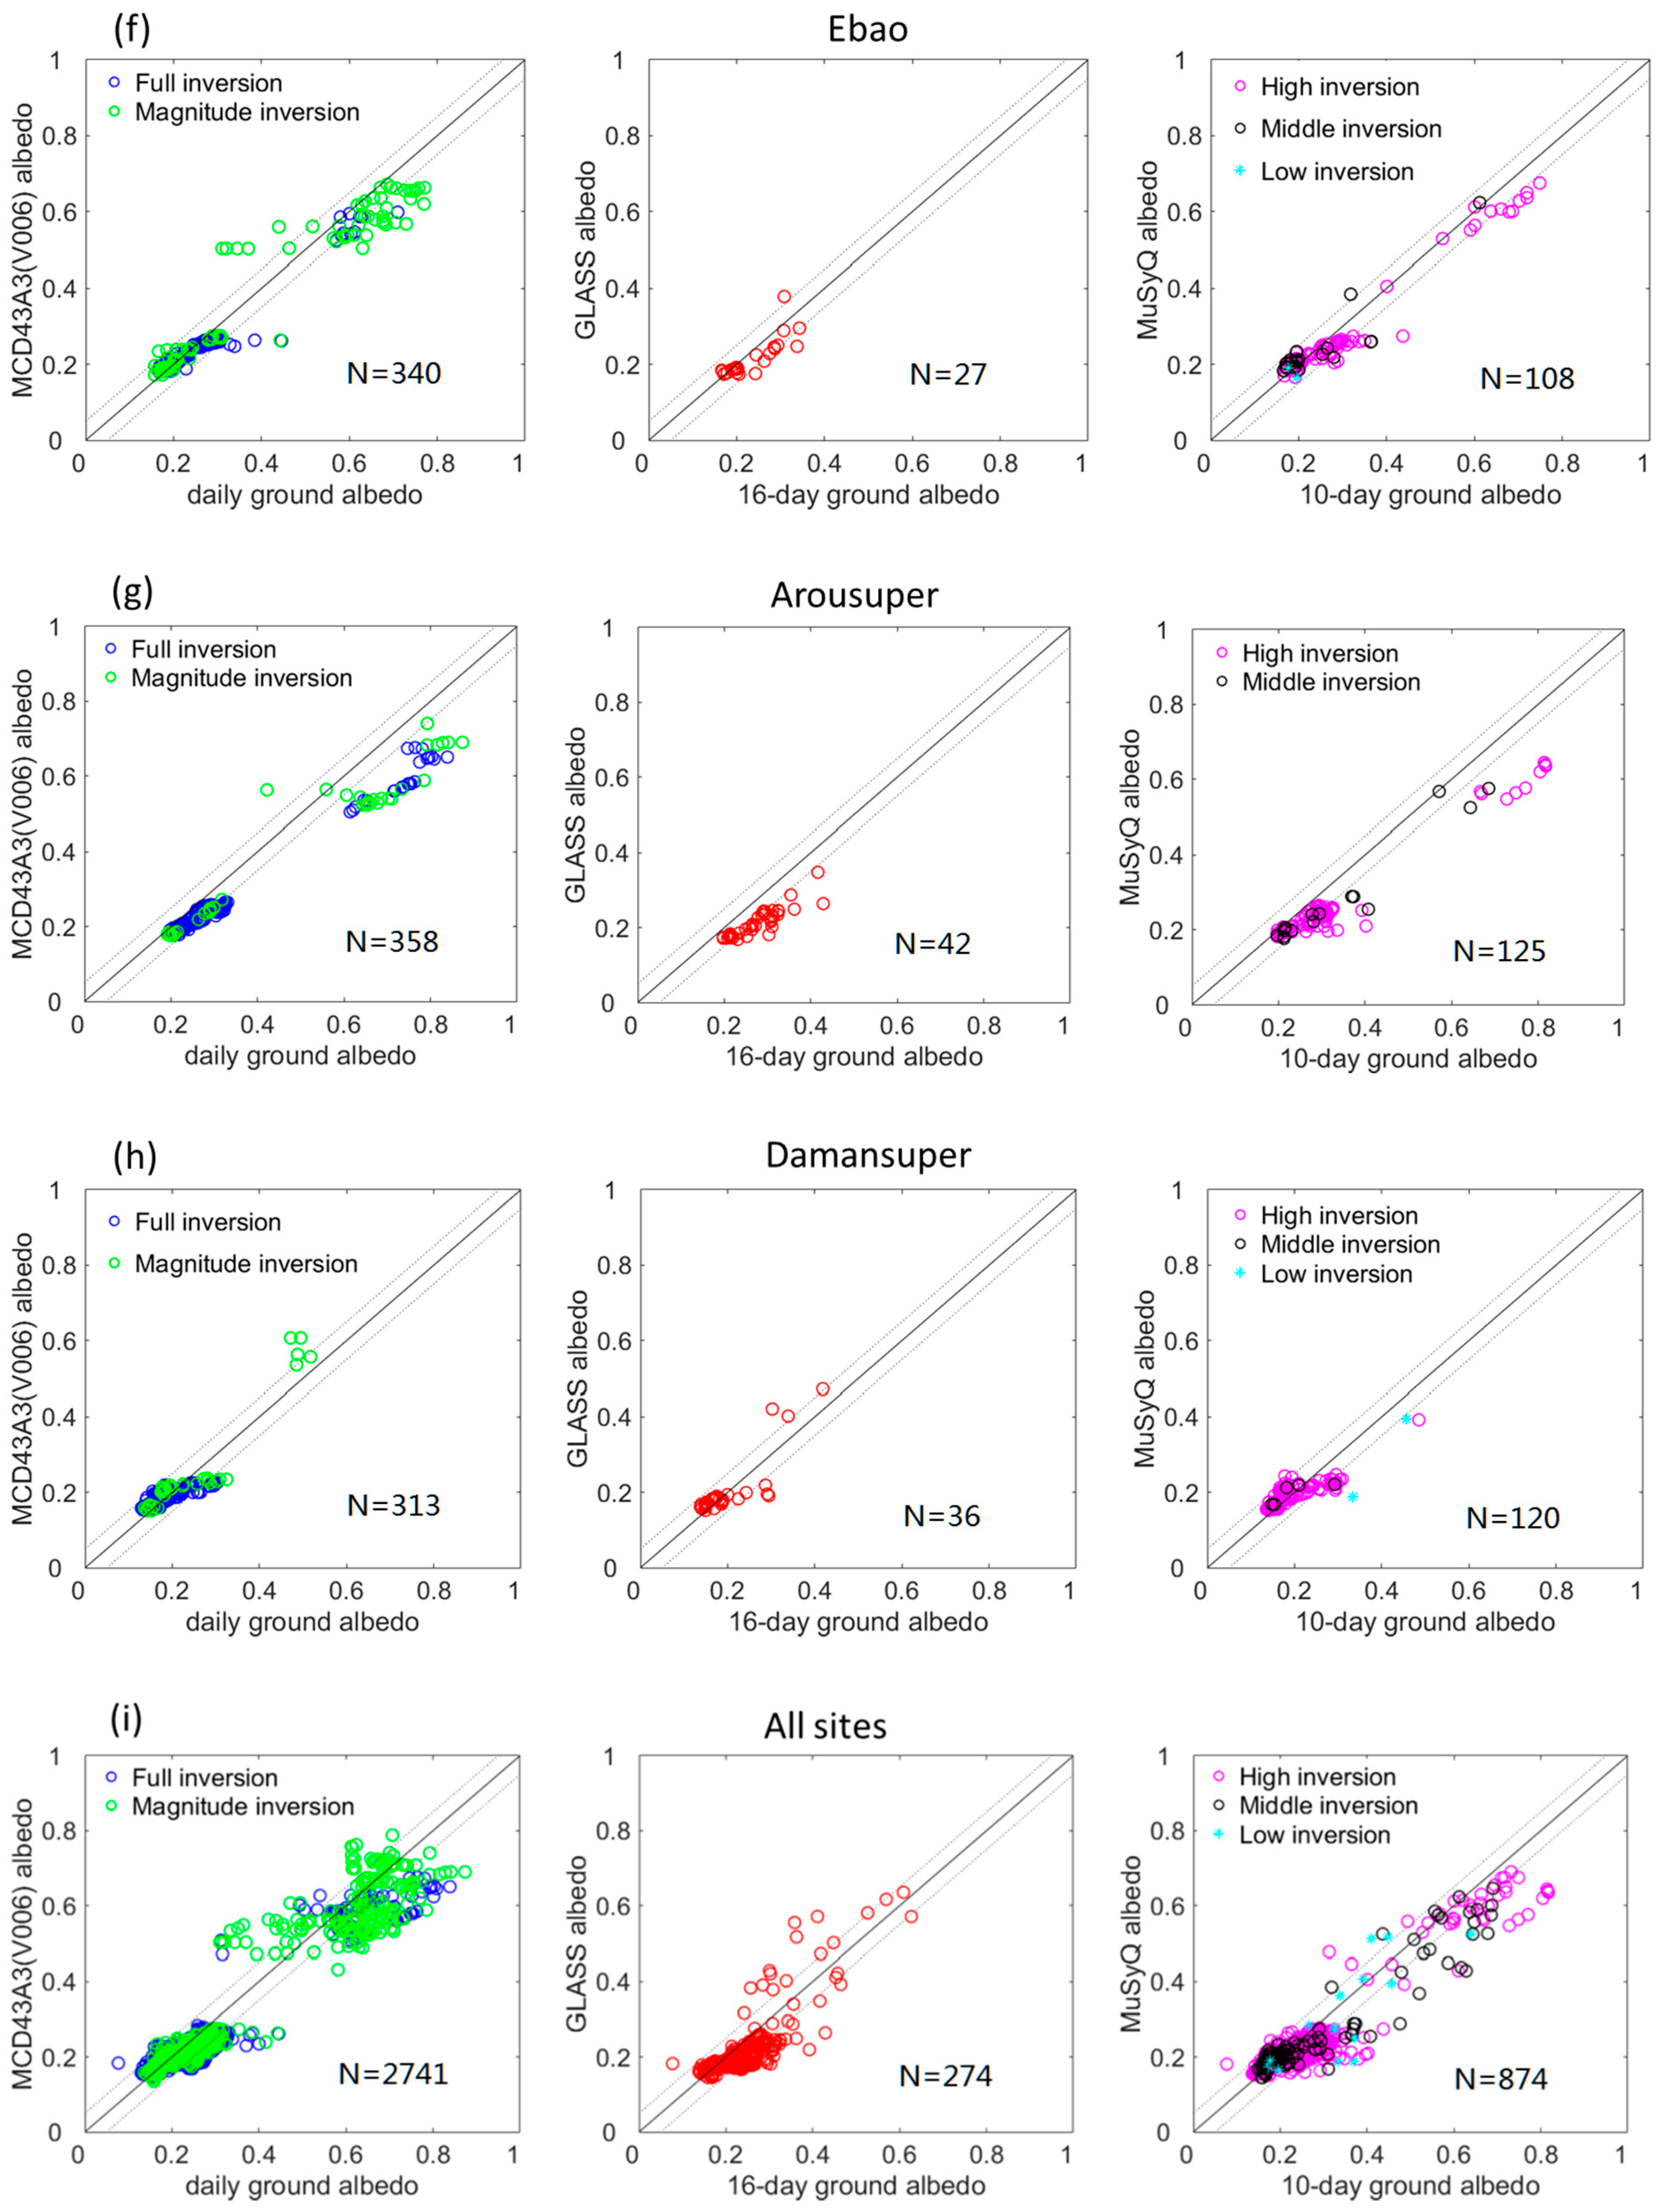
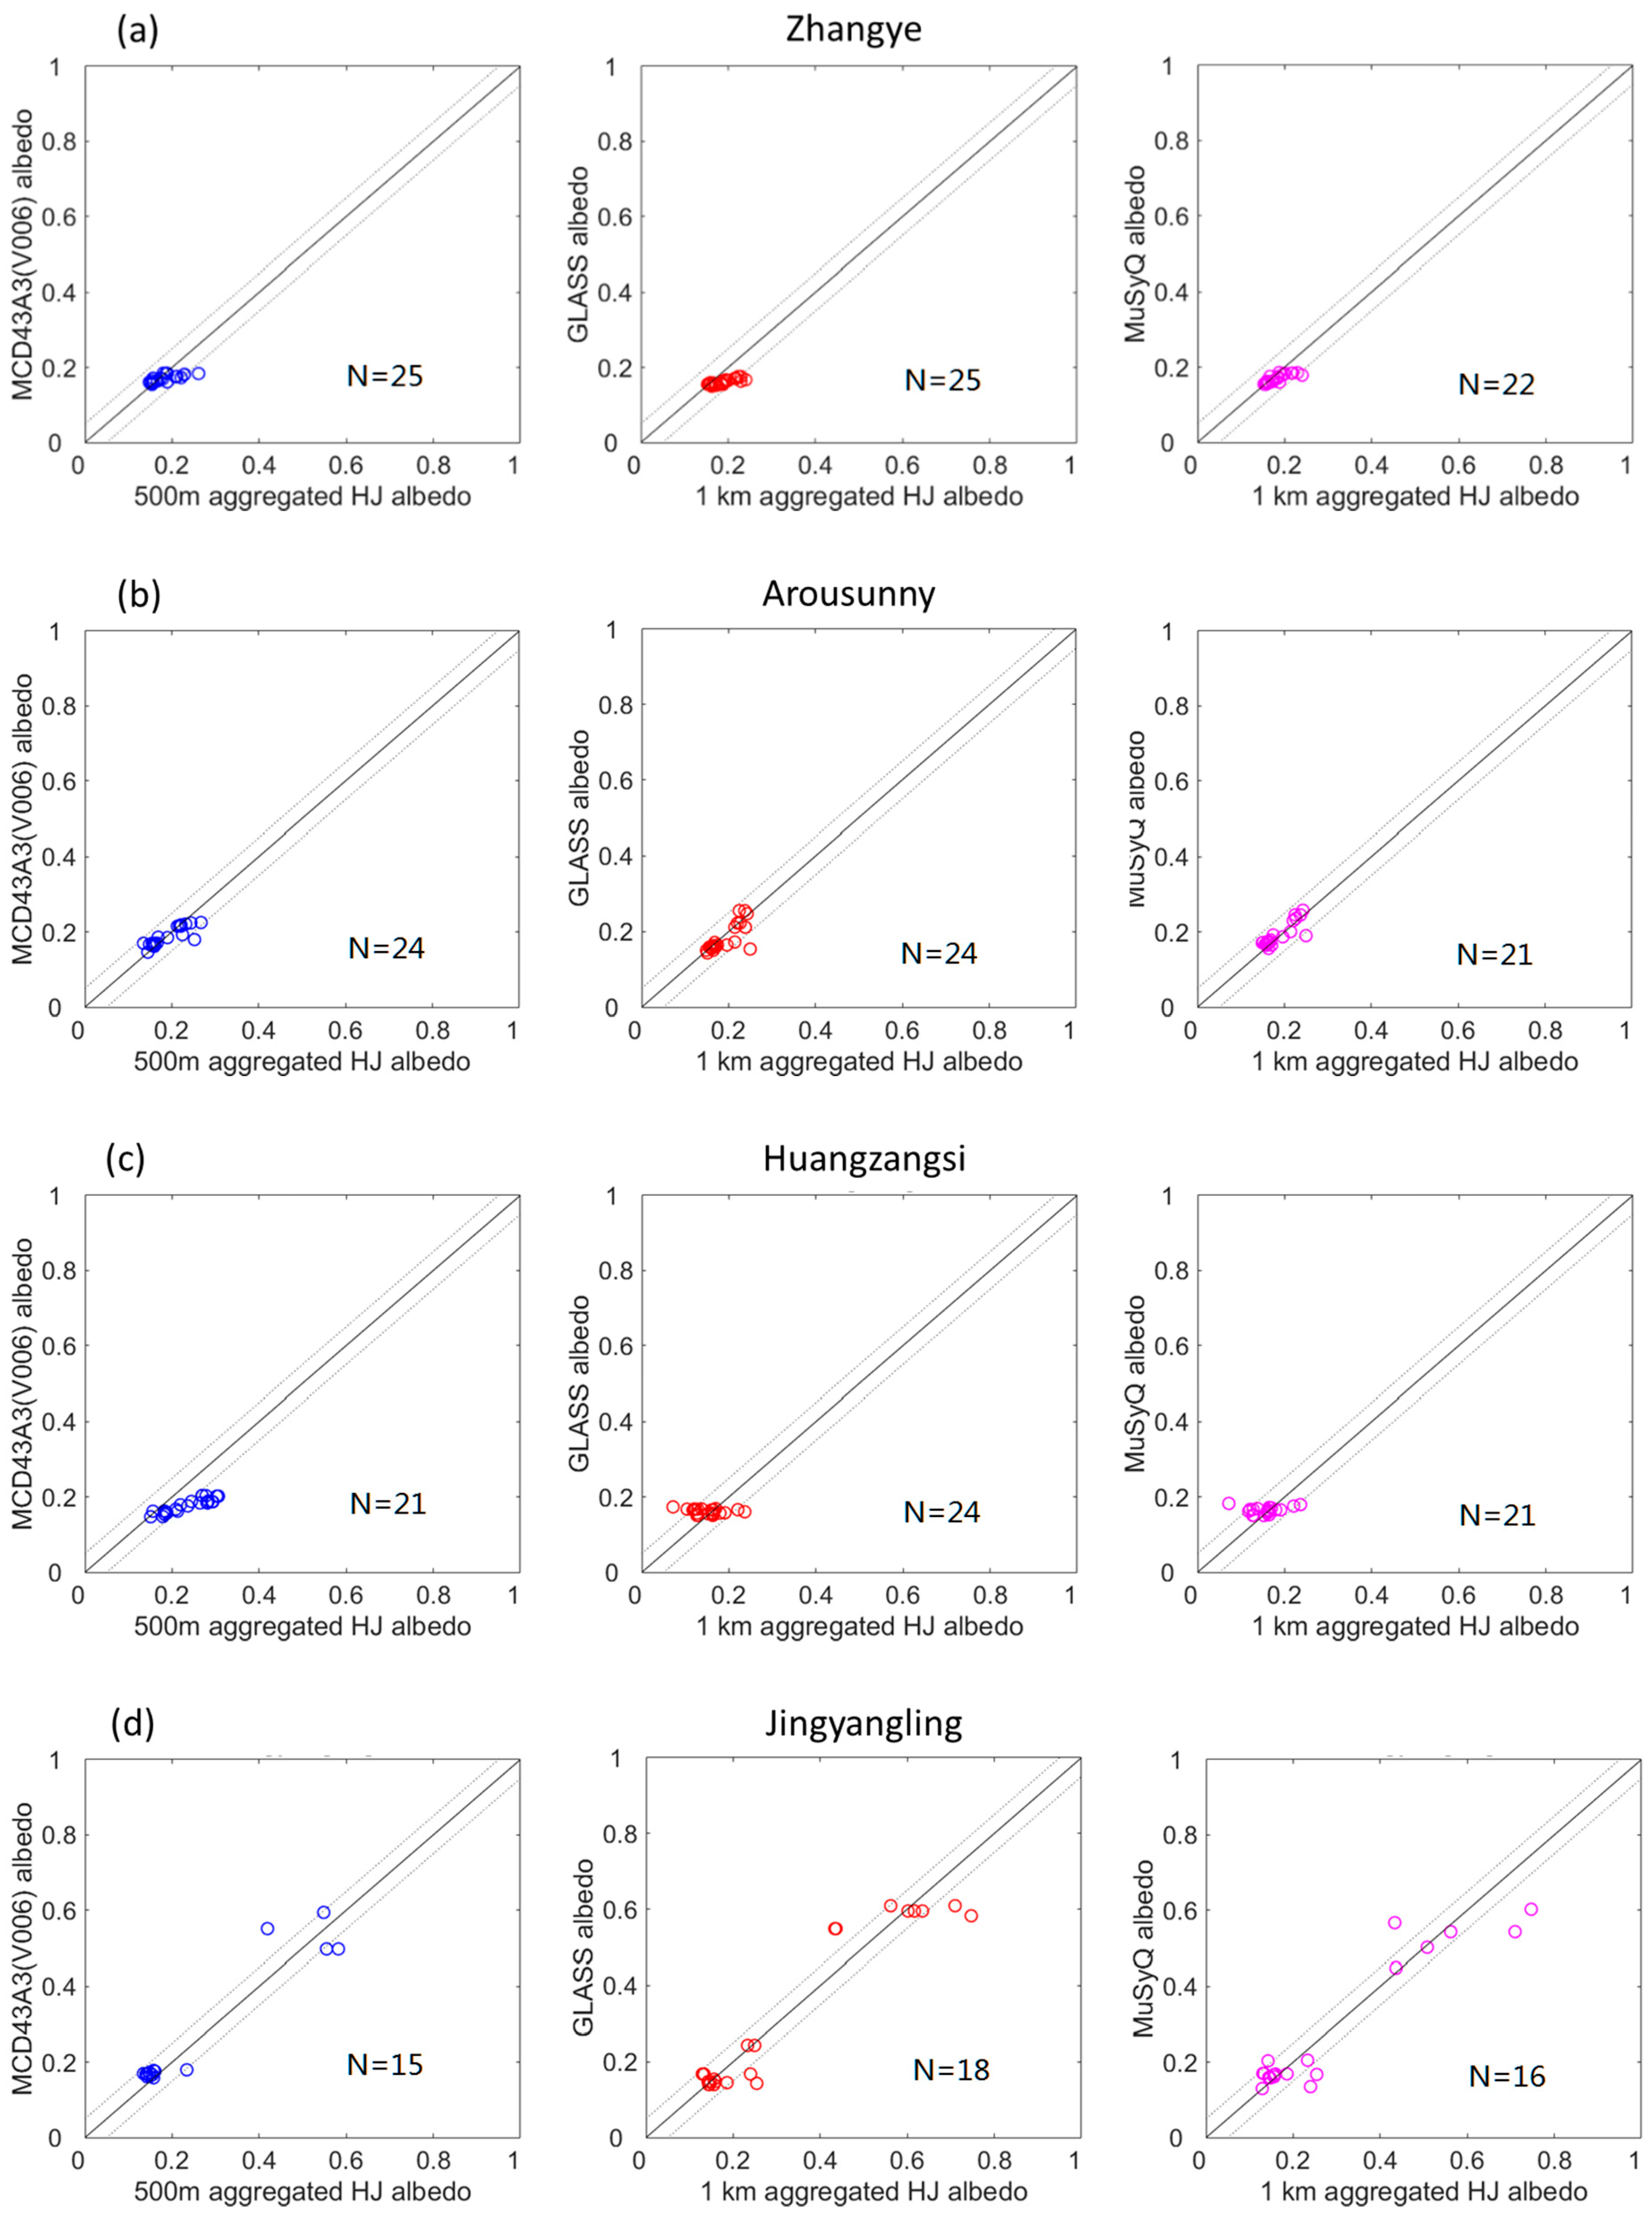
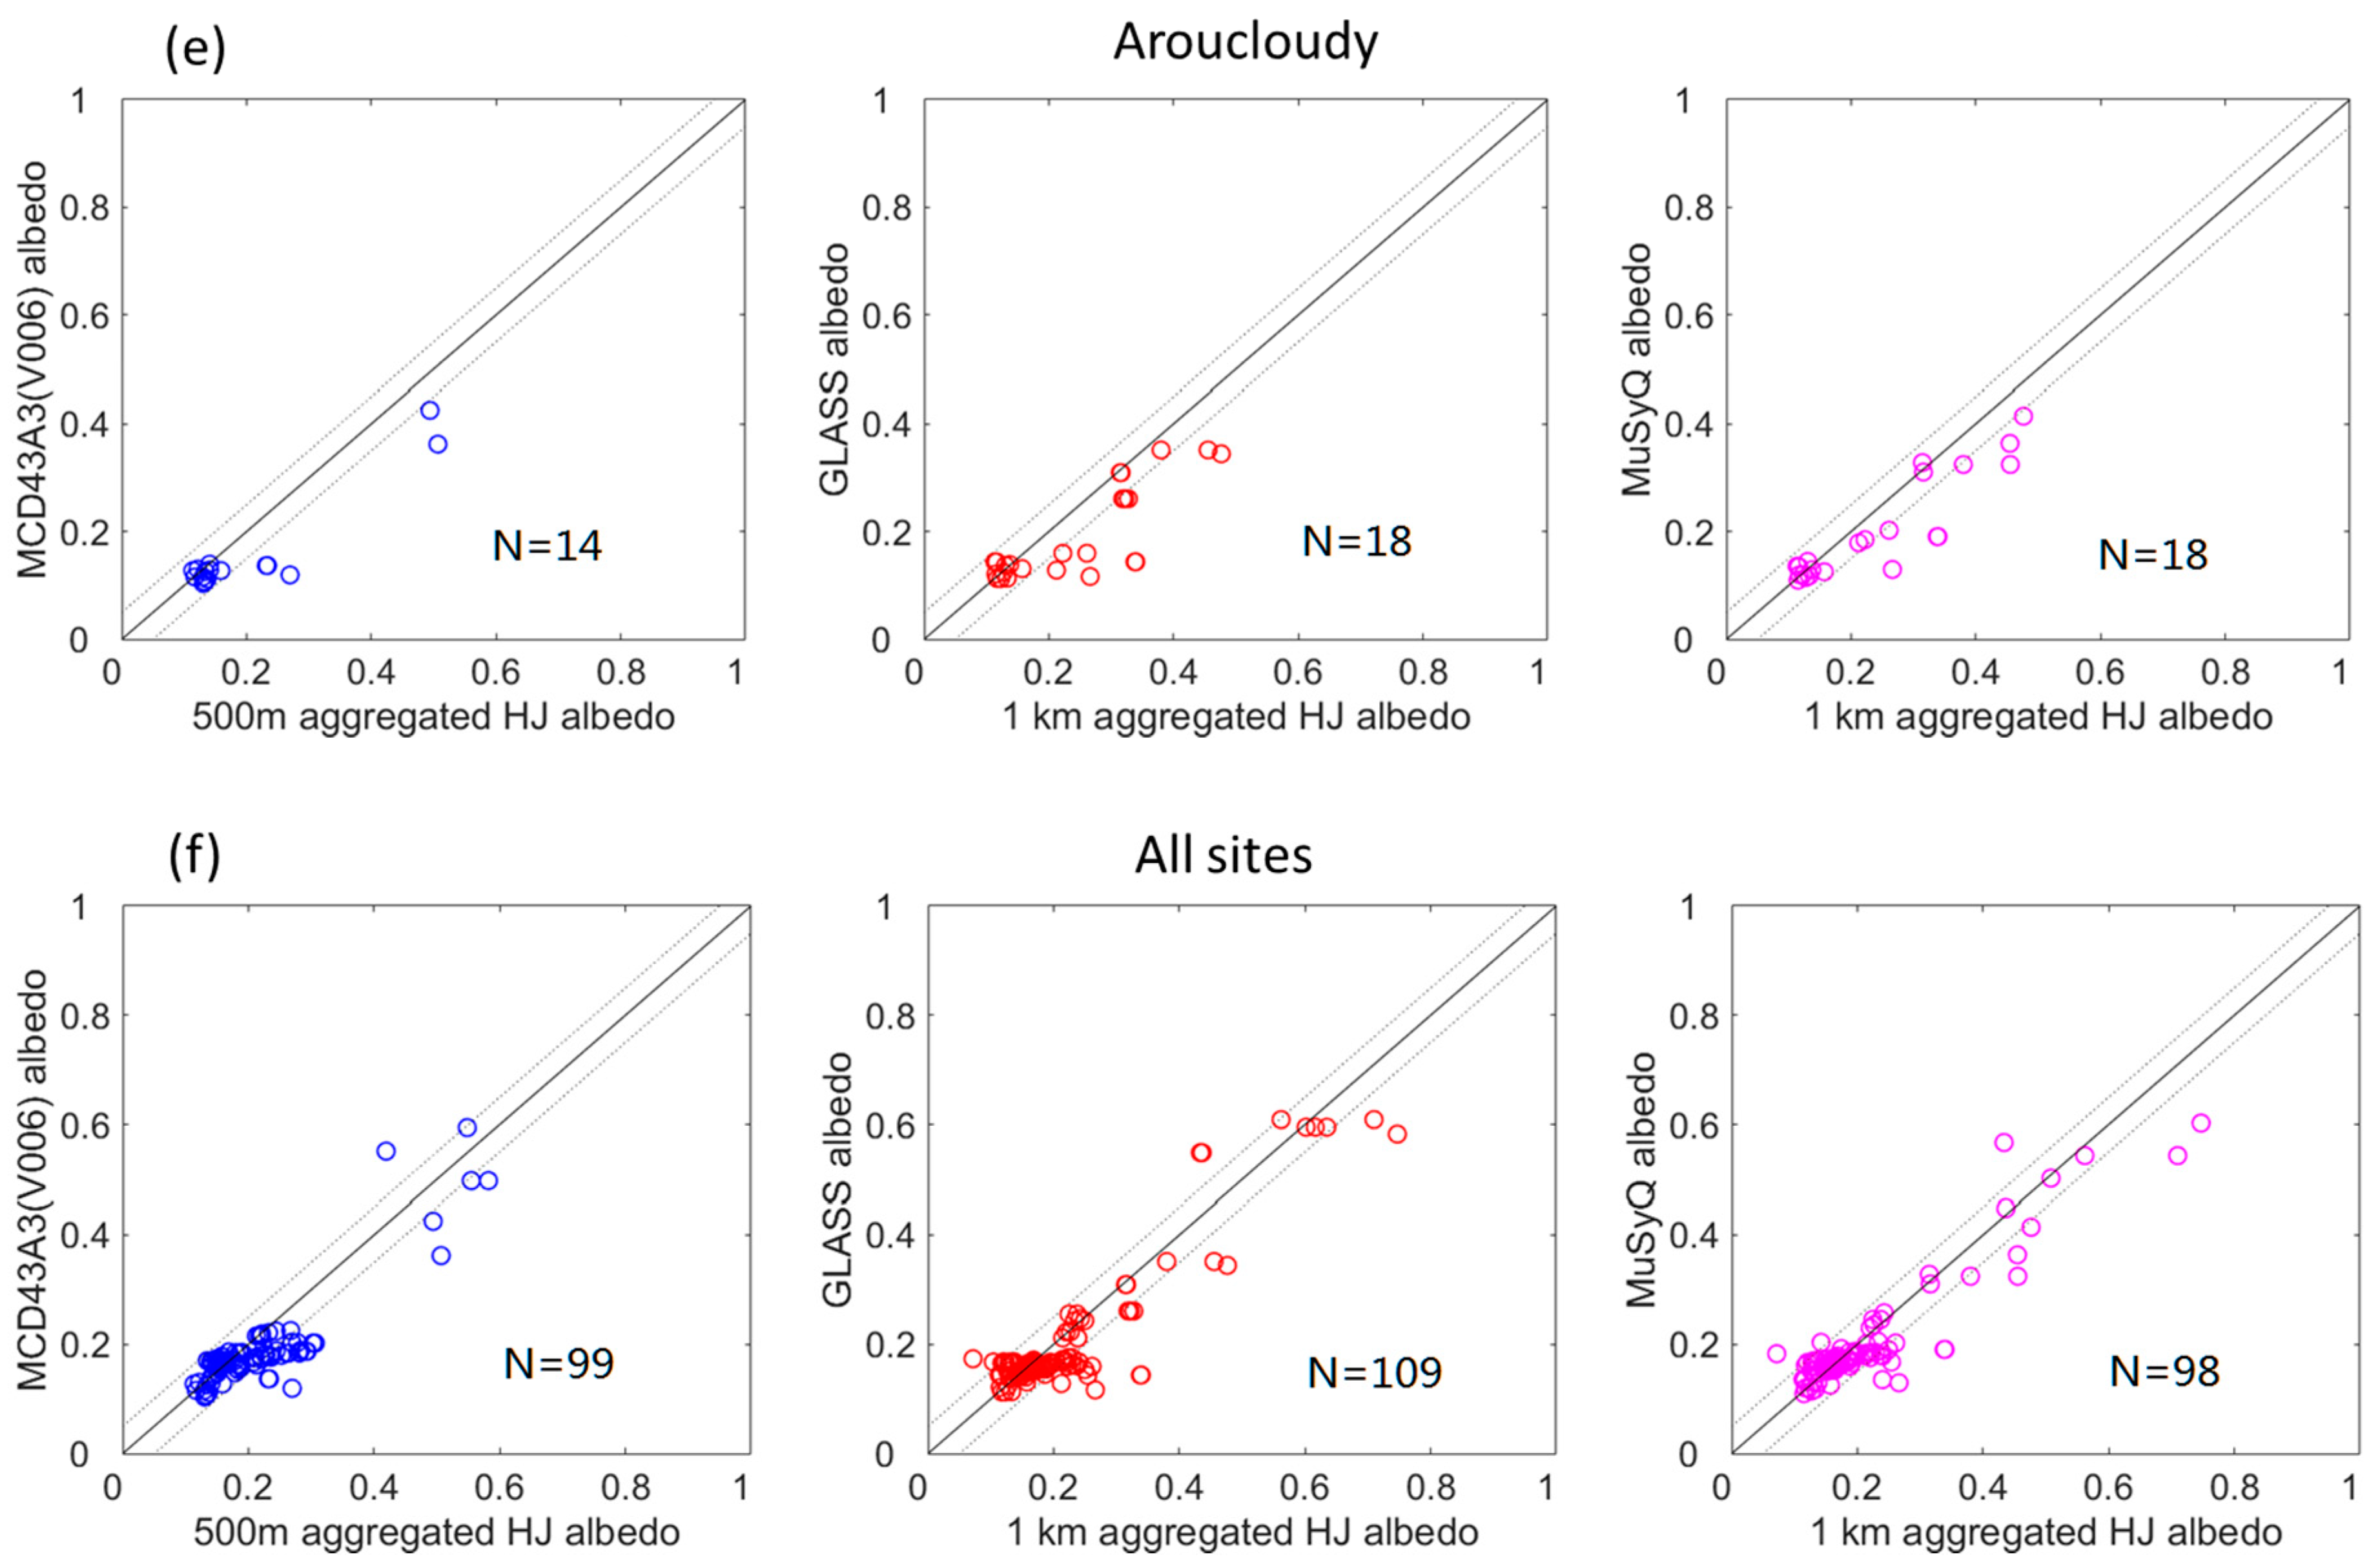
4.2. Direct Validation Results

When the number of valid observations is larger than 7 (corresponding to the full inversion of MCD43A3 and high-quality inversion of MuSyQ), the RMSE of the MuSyQ albedo is ranging from 0.020 to 0.057 with an average value of 0.033 (Figure 4a), and the Bias varies from −0.052 to 0.003 with an average value of −0.015 (Figure 5a). Both the RMSE and Bias are the smallest among these three albedo products in the same case. The R2 between the MuSyQ albedo and ground measurements are all larger than 0.846 except for Shenshawo and Damansuper sites, with an average value of 0.893 (Figure 4a). The product followed in terms of closeness and consistency with ground measurements is the MCD43A3, with an equal average RMSE of 0.033, a smaller average R2 of 0.825 (Figure 4a), and a similar average Bias of −0.016 (Figure 5a). Its RMSE ranges from 0.011 to 0.061, and Bias ranges from −0.057 to 0.006 (Figure 6a). The R2 between the MCD43A3 and ground measurements are larger than 0.830 with an exception over the Bajitan and Damansuper sites. The product ranking last is the GLASS albedo, with the largest average RMSE of 0.043 (Figure 4a). It is noticeable that the GLASS albedo shows larger RMSEs than those of MuSyQ albedo and MCD43A3 over most of these sites (Figure 4a). Furthermore, it can be found that the magnitudes of the Bias of GLASS albedo are always larger than those of MuSyQ albedo and MCD43A3 over these sites (Figure 5a). Nevertheless, most of the sites show good agreements between the GLASS albedo and the ground measurements with R2 larger than 0.783 except for Ebao (Figure 4a). The smaller R2 occurred at Ebao site, which is mainly due to the small variance of the distribution of GLASS surface albedo on this site.
From the results for the case of more than seven observations being available, it is concluded that the MuSyQ albedo and MCD43A3 work equally well in terms of their average closeness to the ground measurements. Nevertheless, the MCD43A3 has more variable RMSEs and Biases regarding their distributions throughout these sites (Figure 6a), indicating that the MuSyQ albedo shows a more stable behavior over different land cover types. Furthermore, the MuSyQ albedo is more consistent with ground measurements than MCD43A3 regarding the distribution of R2 as well as their average values (Figure 6a and Figure 4a). One possible explanation is that the algorithm of MuSyQ albedo enables more observations and a wider angular range for a roust BRDF retrieval. The GLASS albedo is inferior to MCD43A3 and MuSyQ in terms of the closeness to ground measurements. The results are reasonable because when there are sufficient reflectance observations for BRDF modeling, the albedo generations based on BRDF allow a more accurate specification of land-surface albedo [46]. The GLASS albedo, however, is estimated directly from a single reflectance, which is suboptimal at capturing the anisotropic reflectance behavior. Furthermore, the STF adopted by GLASS albedo may also weaken its ability to characterize the magnitude of surface albedo. Despite the inferiority of GLASS albedo, it still provides a satisfactory accuracy.
In the situation of less than seven valid observations (corresponding to the magnitude inversion of MCD43A3 and middle quality inversion of MuSyQ), MCD43A3 and MuSyQ again work equally well in terms of the average closeness to ground measurements with identical average RMSEs of 0.038 (Figure 4b). However, the MCD43A3 works more stable throughout these sites regarding the centralized distribution of its RMSEs (Figure 6b). Also, the MCD43A3 shows a higher average R2 (0.960) than that of MuSyQ albedo (0.939), indicating the better consistency of MCD43A3 with ground measurements (Figure 4b). This occurs because when the number of observations is basically the same, the uncertainties of multiple satellite sensors’ reflectance are bound to limit the retrieval performance of MuSyQ albedo. It is important to note that the magnitudes of Bias for MuSyQ are almost all less than MCD43A3 (Figure 5b), showing that the MCD43A3 show a larger systematic deviation from the ground measurements. The GLASS albedo still shows the largest average RMSE (0.043) and Bias (−0.028) among three albedo products, indicating its deficiency in characterizing the magnitude of surface albedo. It is noteworthy that although the R2 of GLASS albedo are smaller than those of MCD43A3 and MuSyQ albedos over most of the sites as shown in Figure 4b and Figure 6b, it does not necessarily mean that the GLASS albedo displays a worse consistency with ground measurements than MCD43A3 and MuSyQ albedo, since the R2 is determined not only by the product error, but also by the variance of the distribution of the albedo values.
During the snow-covered period, most of the MCD43A3 values were from magnitude inversions due to limited valid observations (Figure A2). In contrast, MuSyQ albedo is mainly from high inversions. That is because the MuSyQ albedo is based on multi-sensor observations, and the combination of satellite sensors results in a higher revisit frequency and a denser angular sampling, contributing to the full inversion of the land-surface albedo. Since the data points during snow-covered period are so few, only the sites with statistically significant results are presented in Figure 4c. There is no difference in average RMSE (0.054) between MCD43A3 and MuSyQ albedos. However, the R2 shows significant differences. For Huangcaogou site, almost no correlation (R2 = 0.144) exists between MCD43A3 and ground measurements. In contrast, the MuSyQ albedos are consistent with ground measurements with a high R2 of 0.836. When it comes to the average R2 of all sites, the MCD43A3 shows an improved correlation, which is still much less than that of MuSyQ albedo. This result demonstrates the advantage of MuSyQ albedo over MCD43A3 in capturing the temporal variation of surface albedo during the snowfall periods. This is to be expected as the temporal composition period for MCD43A3 (V006) is still 16 days, and therefore less sensitive to rapid changes of land-surface albedo. The temporal composition period for the MuSyQ is reduced to 10 days, and thus more capable to capture the surface albedo temporal variability. Since GLASS albedo is not available for 2014, only the results in 2013 when there was hardly any snowfall are displayed. This explains why there are no data plots for GLASS albedo in Figure 4c and Figure 5c.
Over the snow-free period, the MCD43A3 and MuSyQ albedos show nearly identical average RMSEs (0.032 and 0.033, respectively) and Biases (−0.016 and −0.014) as presented in Figure 4d and Figure 5d, demonstrating their equivalent performances in describing the magnitude of surface albedo. However, both the RMSE and Bias of MCD43A3 are more variable throughout these sites than those of MuSyQ albedo (Figure 6c), indicating the more stable behavior of MuSyQ albedo. Also, the average R2 of MuSyQ albedo is slightly larger and more stable than MCD43A3, indicating the better consistency of MuSyQ albedo with respect to the ground measurements (Figure 4d). These results are in line with the situation when sufficient observations (>7) are available as shown previously. The GLASS albedo generally displays larger RMSEs than MCD43A3 and MuSyQ albedo with an exception of Huangcaogou and Damansuper sites, resulting in the largest average RMSE of 0.043 (Figure 4d), again for the Bias (Figure 5d). It can be concluded that during the snow-free period, the MCD43A3 and MuSyQ albedos are more accurate than the GLASS albedo in characterizing the magnitude of surface albedo. However, when it comes to the consistency with ground measurements, the GLASS albedo is comparable to MCD43A3, indicated by their similar ranges and distributions of R2 in Figure 6c.
When combining all inversion cases, the MCD43A3 and MuSyQ albedos still show the same average RMSEs of 0.034 and nearly identical average Biases (−0.016 and −0.014, respectively) (Figure 4e and Figure 5e). The R2 values for MCD43A3 and MuSyQ are almost equal (0.920 and 0.903, respectively), which indicates the similarly high overall accuracies of these two albedo products. The GLASS albedo is largely different from MCD43A3 and MuSyQ albedos, with a larger overall RMSE of 0.043 (Figure 4e). Furthermore, the variabilities of RMSEs and R2 for GLASS albedo are larger than those of MCD43A3 and MuSyQ albedos throughout these sites (Figure 6d).
In general, there is almost no difference between the MCD43A3 and MuSyQ albedos in terms of their closeness to ground measurements. Nevertheless, for the situation of number of valid observations larger than seven or snow-free period, the MuSyQ albedo is slightly better correlated with ground measurements and shows a more stable behavior. On the contrary, for the case when there are insufficient valid observations, the MCD43A3 shows a slightly better consistency with ground measurements. During the snowfall period when rapid changes happen to land surface, the MuSyQ albedo outperforms MCD43A3 in characterizing the temporal variations of surface albedo. The GLASS albedo always shows the largest RMSE among these three albedo products, showing its worse accuracy than MCD43A3 and MuSyQ albedos.
Although the representativeness errors have been employed for a rigorous assessment, the representativeness errors of ground measurements with respect to the coarse-pixel albedo are not inherently solved. For instance, the RMSEs for three albedo products over Bajitan site are always smaller than those over Arousuper site (Figure 4). This is attributed to the fact that the percentage of representativeness errors larger than 5% is smaller for Bajitan than for Arousuper, as shown in Table 4. To remove the effect of representativeness errors, data points with differences larger than 0.1 have been excluded from the statistics analysis.

4.3. Multi-scale Validation Strategy Results

The aggregated calibrated HJ albedo at coarse-pixel scale was used as the reference to assess the accuracies of three albedo products over sites with large representativeness errors. Due to the limited number of HJ albedo maps throughout the year, there were not enough data points to make a distinction between different inversion cases for MCD43A3 and MuSyQ (Figure A3).
At stations where there is a smaller seasonal variation in albedo throughout the year (i.e., Zhangye, Arousunny), the MuSyQ albedo displays the smallest RMSEs (0.022 and 0.018, respectively). The product followed is MCD43A3, with little larger RMSEs of 0.027 and 0.022, respectively. The product ranks last is the GLASS albedo, with the largest RMSEs of 0.034 and 0.025, respectively (Figure 7). Similar but not identical results can be found in Bias (Figure 8), where the magnitude of Bias is the smallest for MCD43A3 and the largest for GLASS albedo. These quantitative results demonstrate similarly high accuracies of MuSyQ albedo and MCD43A3, being superior to GLASS albedo in magnitude with respect to the aggregated calibrated HJ albedo at the corresponding pixel scales.
These results are reasonable as the MCD43A3 (V006) algorithm emphasizes the contribution of the single day of interest more strongly, which enables it to capture subtle changes in surface albedo. The MuSyQ albedo, despite its 5-day temporal resolution, is based on multi-sensor observations, and thus can provide more observations and a wider angular range for BRDF retrieval to accurately capture the subtle dynamic changes of surface albedo. For GLASS albedo, its temporal filter smoothens the weak albedo variations in time series. Nevertheless, the accuracy of GLASS albedo is still acceptable with RMSEs less than 0.034 and R2 larger than 0.601.
An exception can be found at Huangzangsi, where there is no correlation (R2 = 0.019) between GLASS albedo and reference value at the 1 km pixel scale (Figure 7). In addition, MuSyQ shows only a weak correlation with the 1 km reference indicated by a small R2 of 0.286. In contrast, the MCD43A3 is surprisingly well correlated with the reference at the 500 m pixel scale with a high R2 of 0.817. This may be associated with the large difference in representativeness errors on the two pixel scales (Table 4). The percentage of representativeness errors less than 5% for the 500 m pixel is twice as that for the 1 km pixel. However, the percentage of representativeness errors less than 5% is very small (32 and 16 for the 500 m and 1 km pixel, respectively), and there are a large percentage of representativeness errors larger than 15% on the two pixel scales. Also, the largest representativeness error even exceeds 100%, indicating the serious heterogeneity around this site. Although the aggregated calibrated HJ albedo at the 1 km scale has been used as the reference, it may no longer be the best reference data in this case. The reason is that the calibration of HJ albedo was never perfect as the calibration model was established based on the individual pixels corresponding to the limited sites’ observations. When applying the relationship to the whole image, it will introduce errors, especially over the seriously heterogeneous sites [47].
Over the sites where there are larger seasonal variations in surface albedo, including the Jingyangling and Aroucloudy, the RMSEs of three albedo products are comparable in magnitude, which are no more than 0.044, 0.038 and 0.036 for MCD43A3, GLASS and MuSyQ, respectively (Figure 7). In addition, the R2 is also similarly high for three albedo products. These results indicate that when describing the surface albedo with obvious seasonal changes, these three albedo products function similarly. These results are expected since the obvious changes in surface albedo can be more easily captured, regardless of what kind of data and algorithms have been used.
When summing up all the sites (Figure 7 and Figure 9), the MuSyQ albedo shows the smallest RMSE of 0.027 and the largest R2 of 0.900 among these three albedo products. The product followed is GLASS albedo, with a RMSE of 0.032 and a R2 of 0.898. The MCD43A3 ranks last with the largest RMSE of 0.038 and the smallest R2 of 0.836. These results demonstrate the advantage of MuSyQ albedo in characterizing the surface albedo in both magnitude and temporal trend. However, it can be seen that the results of multi-scale validation are not completely in line with direct validation results. Part of the discrepancy may be a result of the different ability of the aggregated HJ albedo to represent the absolute albedo truth on the 500 m and 1 km pixel scales, given the different distributions of representativeness errors on the two pixel scales (Table 4). The absolute biases larger than 0.1 are apparently not caused by the product error, but more likely caused by the limitations of the reference value. The representativeness errors of these sites (Huangzangsi, Jingyangling and Aroucloudy) are evenly distributed in different levels ranging from 0 to 100%. Under this circumstance, the aggregated calibrated HJ albedo at a coarse scale is no longer the best reference to objectively evaluate the errors of satellite albedo products. A further discussion about the limitations of the aggregated calibrated HJ albedo is beyond the scope of this paper. To remove the impact of the questionable reference, the product-reference differences larger than 0.1 had been excluded from the statistical analysis.
In addition to the limitations of the reference in the form of aggregated calibrated HJ albedo over heterogeneous surfaces, gaps in the temporal scale may also lead to the differences between albedo products and the reference. The product-based albedos are temporally composited, whereas there may be only one HJ albedo map in every temporal step corresponding to the various coarse-scale albedo products.

5. Conclusions

The accuracy of satellite albedo products directly determines their effectiveness in climatic and atmospheric researches. This paper quantitatively analyzed the accuracies of MCD43A3 (V006), GLASS and MuSyQ albedo products over six typical land cover types in the Heihe River Basin, including alpine meadow, wheat field, corn field, gobi, desert, snow, and wetland. A fundamental requirement of a successful assessment is the quality of reference values at the corresponding pixel scale, which was indicated by the representativeness errors of ground site. Compared with the qualitative spatial representativeness assessment based on the semi-variogram, the representativeness errors provide more critical constraints on the direct comparison between the ground-observed albedo and satellite albedo products to narrow down the errors of validation results.
In the situation of more than seven effective observations being available during an accumulation period, there is almost no difference between the MCD43A3 and MuSyQ, with identical RMSEs of 0.033. The MuSyQ albedo is however better correlated with the references (with a higher R2 of 0.893) and more stable than that of MCD43A3 (R2 = 0.825). The GLASS albedo features the largest RMSE of 0.043 among these three albedo products. In addition, these results hold for the snow-free period. When the number of effective observations is less than 7, the MCD43A3 and MuSyQ albedos keep the same RMSEs of 0.038, but the MCD43A3 is more consistent with ground measurements and shows a more stable behavior than MuSyQ albedo. The GLASS albedo is not as accurate as MCD43A3 and MuSyQ albedos, with a larger RMSE of 0.043. During the snowfall period, the MuSyQ albedo shows an advantage over MCD43A3 in characterizing the temporal variability of surface albedo due to its shorter accumulation period.
Over the surfaces with smaller seasonal variations, MCD43A3 and MuSyQ albedos show similar high accuracies, with RMSEs not exceeding 0.027 and 0.022, respectively. The GLASS albedo is always with larger RMSEs, distributed between 0.025 and 0.034. For surfaces with larger seasonal variations, the RMSEs of three albedo products are close in magnitude, which are no more than 0.044, 0.038 and 0.036 for MCD43A3, GLASS and MuSyQ albedo, respectively. Furthermore, their R2 are also comparable, indicating that when describing the surface albedo with obvious changes, these three albedo products function comparably.
Generally, the MCD43A3 and MuSyQ albedos generally show similar high accuracies, featured the same RMSEs of 0.034 and similar R2 (0.920 and 0.903, respectively) with respect to ground measurements, which are better than GLASS albedo (RMSE = 0.043, R2 = 0.787). However, when it comes to the comparison with aggregated HJ albedo, the MuSyQ and GLASS albedos seem better than MCD43A3, with lower RMSEs of 0.027 and 0.032 and higher R2 of 0.900 and 0.898, respectively (MCD43A3: RMSE = 0.038, R2 = 0.836). The rank order of their performances under each specific situation is summarized in Table 5. It is important to remember that the current validation was only conducted in the limited land cover types over the small geographic region of the experimental area, and thus the current results are not sufficient to represent the overall performance of three albedo products. More sites should be included globally in the future to provide a more robust validation of these three albedo products.
Certain problems remain to be solved regarding the acquisition of reference value at a pixel scale. Although the multi-scale validation strategy was employed to overcome the representativeness errors of ground sites, there are still considerable disagreements between reference and albedo products over these sites with large representativeness errors. The satellite albedo products still require comprehensive validation by improving the upscaling method to get more reliable references. It is imperative to further develop improved upscaling methods that better compensate the limitations of high-resolution imagery and ground-based measurements.

Author Contributions

X.W. was responsible for the main research ideas and writing the manuscript. J.W. and Q.X. contributed to the manuscript organization. D.Y. contributed to the data collection. B.D., X.L. and A.H. preprocessed the remote sensing data. All the authors thoroughly reviewed and edited this paper.

Funding

This research is jointly supported by the National Natural Science Foundation of China (NO: 41801226), the Key Program of National Natural Science Foundation of China (NO: 41830648),and the Fundamental Research Funds for the Central Universities (lzujbky-2018-45).

Acknowledgments

The authors would like to thank all the scientists, engineers, and students who participated in the HiWATER campaigns, which provided ground data for this work.

Conflicts of Interest

The authors declare no conflict of interest.

Appendix

Figure A1. Frequency distribution histogram and cumulative frequency of representativeness errors of ground sites with respect to the 500 m and 1 km pixel scale albedos.
Remotesensing 10 02045 g0a1
Figure A2. (ai) The direct comparison results for MCD43A3 (V006) (left), GLASS (middle) and MuSyQ (right) albedos. The dotted lines show the errors on the interval [−0.05, 0.05]. N indicates the number of the data points.
Remotesensing 10 02045 g0a2aRemotesensing 10 02045 g0a2bRemotesensing 10 02045 g0a2c
Figure A3. (af) The multi-scale validation results based on the aggregated calibrated HJ albedo for MCD43A3 (V006) (left), GLASS (middle) and MuSyQ (right). N indicates the number of the data points.
Remotesensing 10 02045 g0a3aRemotesensing 10 02045 g0a3b

References

  1. Liang, S. Quantitative Remote Sensing of Land Surfaces; John Wiley & Sons, Inc.: Hoboken, NJ, USA, 2003; Volume 19, pp. 413–415. [Google Scholar]
  2. Dickinson, R.E. Land processes in climate models. Remote Sens. Environ. 1995, 51, 27–38. [Google Scholar] [CrossRef]
  3. Liu, J.; Schaaf, C.; Strahler, A.; Jiao, Z.; Shuai, Y.; Zhang, Q.; Dutton, E.G. Validation of Moderate Resolution Imaging Spectroradiometer (MODIS) albedo retrieval algorithm: Dependence of albedo on solar zenith angle. J. Geophys. Res. Atmos. 2009, 114, D01106. [Google Scholar] [CrossRef]
  4. Souza, R.B.; Mata, M.M.; Garcia, C.A.; Kampel, M.; Oliveira, E.N.; Lorenzzetti, J.A. Multi-sensor satellite and in situ measurements of a warm core ocean eddy south of the Brazil–Malvinas Confluence region. Remote Sens. Environ. 2006, 100, 52–66. [Google Scholar] [CrossRef]
  5. Liang, S. A direct algorithm for estimating land surface broadband albedos from MODIS imagery. IEEE Trans. Geosci. Remote Sens. 2003, 41, 136–145. [Google Scholar] [CrossRef] [Green Version]
  6. Ramanathan, V.; Barkstrom, B.R.; Harrison, E.F. Climate and the Earth’s radiation budget. Phys. Today 1989, 74, 22–32. [Google Scholar] [CrossRef]
  7. Wei, X.; Hahmann, A.N.; Dickinson, R.E.; Yang, Z.L.; Zeng, X.; Schaudt, K.J. Comparison of albedos computed by land surface models and evaluation against remotely sensed data. J. Geophys. Res. Atmos. 2001, 106, 20687–20702. [Google Scholar] [CrossRef] [Green Version]
  8. Zhong, Y.; Ma, A.; soon Ong, Y.; Zhu, Z.; Zhang, L. Computational intelligence in optical remote sensing image processing. Appl. Soft Comput. 2017, 64, 75–93. [Google Scholar] [CrossRef]
  9. Lucht, W.; Hyman, A.H.; Strahler, A.H.; Barnsley, M.J.; Hobson, P.; Muller, J.P. A comparison of satellite-derived spectral albedos to ground-based broadband albedo measurements modeled to satellite spatial scale for a semidesert landscape. Remote Sens. Environ. 2000, 74, 85–98. [Google Scholar] [CrossRef]
  10. Liu, Q.; Wang, L.; Qu, Y.; Liu, N.; Liu, S.; Tang, H.; Liang, S. Preliminary evaluation of the long-term GLASS albedo product. Int. J. Digit. Earth 2013, 6, 69–95. [Google Scholar] [CrossRef]
  11. Qu, Y.; Liu, Q.; Liang, S.; Wang, L.; Liu, N.; Liu, S. Direct-estimation algorithm for mapping daily land-surface broadband albedo from MODIS data. IEEE Trans. Geosci. Remote Sens. 2014, 52, 907–919. [Google Scholar] [CrossRef]
  12. Mira, M.; Weiss, M.; Baret, F.; Courault, D.; Hagolle, O.; Gallego-Elvira, B.; Olioso, A. The MODIS (collection V006) BRDF/albedo product MCD43D: Temporal course evaluated over agricultural landscape. Remote Sens. Environ. 2015, 170, 216–228. [Google Scholar] [CrossRef] [Green Version]
  13. Wu, X.; Wen, J.; Xiao, Q.; Liu, Q.; Peng, J.; Dou, B.; Liu, Q. Coarse scale in situ albedo observations over heterogeneous snow-free land surfaces and validation strategy: A case of MODIS albedo products preliminary validation over northern China. Remote Sens. Environ. 2016, 184, 25–39. [Google Scholar] [CrossRef]
  14. Schaaf, C.; Wang, Z. MCD43A3: MODIS/Terra and Aqua BRDF/Albedo Daily L3 Global 500 m V006 [Data Set]; NASA EOSDIS Land Processes DAAC, USGS/Earth Resources Observation and Science (EROS) Center: Sioux Falls, SD, USA, 2015.
  15. Govaerts, Y.M.; Lattanzio, A.; Taberner, M.; Pinty, B. Generating global surface albedo products from multiple geostationary satellites. Remote Sens. Environ. 2008, 112, 2804–2816. [Google Scholar] [CrossRef]
  16. Jin, Y.; Gao, F.; Schaaf, C.B.; Li, X. Improving modis surface BRDF/albedo retrieval with MISR multiangle observations. IEEE Trans. Geosci. Remote Sens. 2002, 40, 1593–1604. [Google Scholar]
  17. Wen, J.; Dou, B.; You, D.; Tang, Y.; Xiao, Q.; Liu, Q.; Liu, Q. Forward a Small-Timescale BRDF/Albedo by Multisensor Combined BRDF Inversion Model. IEEE Trans. Geosci. Remote Sens. 2017, 55, 683–697. [Google Scholar] [CrossRef]
  18. Bhattacharya, B.K.; Mallick, K.; Patel, N.K.; Parihar, J.S. Regional clear sky evapotranspiration over agricultural land using remote sensing data from Indian geostationary meteorological satellite. J. Hydrol. 2010, 387, 65–80. [Google Scholar] [CrossRef]
  19. Jacob, F.; Olioso, A.; Weiss, M.; Baret, F.; Hautecoeur, O. Mapping short-wave albedo of agricultural surfaces using airborne PolDER data. Remote Sens. Environ. 2002, 80, 36–46. [Google Scholar] [CrossRef]
  20. Jin, Y.; Schaaf, C.B.; Woodcock, C.E.; Gao, F.; Li, X.; Strahler, A.H.; Liang, S. Consistency of MODIS surface bidirectional reflectance distribution function and albedo retrievals: 2. Validation. J. Geophys. Res. Atmos. 2003, 108. [Google Scholar] [CrossRef] [Green Version]
  21. Salomon, J.G.; Schaaf, C.B.; Strahler, A.H.; Gao, F.; Jin, Y. Validation of the MODIS bidirectional reflectance distribution function and albedo retrievals using combined observations from the aqua and terra platforms. IEEE Trans. Geosci. Remote Sens. 2006, 44, 1555–1565. [Google Scholar] [CrossRef]
  22. Román, M.O.; Schaaf, C.B.; Woodcock, C.E.; Strahler, A.H.; Yang, X.Y.; Braswell, R.H.; Gu, L. The MODIS (Collection V005) BRDF/albedo product: Assessment of spatial representativeness over forested landscapes. Remote Sens. Environ. 2009, 113, 2476–2498. [Google Scholar] [CrossRef] [Green Version]
  23. Wang, Z.; Schaaf, C.B.; Chopping, M.J.; Strahler, A.H.; Wang, J.; Roman, M.O.; Shuai, Y. Evaluation of Moderate-resolution Imaging Spectroradiometer (MODIS) snow albedo product (MCD43A) over tundra. Remote Sens. Environ. 2012, 117, 264–280. [Google Scholar] [CrossRef]
  24. Cescatti, A.; Marcolla, B.; Vannan, S.K.S.; Pan, J.Y.; Román, M.O.; Yang, X.; Schaaf, C.B. Intercomparison of MODIS albedo retrievals and in situ measurements across the global FLUXNET network. Remote Sens. Environ. 2012, 121, 323–334. [Google Scholar] [CrossRef] [Green Version]
  25. Roman, M.O.; Gatebe, C.K.; Shuai, Y.; Wang, Z.; Gao, F.; Masek, J.G.; Schaaf, C.B. Use of in situ and airborne multiangle data to assess MODIS-and Landsat-based estimates of directional reflectance and albedo. IEEE Trans. Geosci. Remote Sens. 2013, 51, 1393–1404. [Google Scholar] [CrossRef]
  26. Wang, Z.; Schaaf, C.B.; Strahler, A.H.; Chopping, M.J.; Román, M.O.; Shuai, Y.; Fitzjarrald, D.R. Evaluation of MODIS albedo product (MCD43A) over grassland, agriculture and forest surface types during dormant and snow-covered periods. Remote Sens. Environ. 2014, 140, 60–77. [Google Scholar] [CrossRef]
  27. Wu, X.D.; Wen, J.G.; Xiao, Q.; Li, X.; Liu, Q.; Tang, Y.; Li, X.W. Advances in validation methods for remote sensing products of land surface parameters. J. Remote Sens. 2015, 19, 76–92. [Google Scholar]
  28. Román, M.O.; Schaaf, C.B.; Lewis, P.; Gao, F.; Anderson, G.P.; Privette, J.L.; Barnsley, M. Assessing the coupling between surface albedo derived from MODIS and the fraction of diffuse skylight over spatially-characterized landscapes. Remote Sens. Environ. 2010, 114, 738–760. [Google Scholar] [CrossRef]
  29. Wu, X.; Xiao, Q.; Wen, J.; Liu, Q.; Peng, J.; Li, X. Advances in uncertainty analysis for the validation of remote sensing products: Take leaf area index for example. J. Remote Sens. 2014, 18, 1011–1023. [Google Scholar]
  30. Huang, G.; Li, X.; Huang, C.; Liu, S.; Ma, Y.; Chen, H. Representativeness errors of point-scale ground-based solar radiation measurements in the validation of remote sensing products. Remote Sens. Environ. 2016, 181, 198–206. [Google Scholar] [CrossRef]
  31. Li, X.; Cheng, G.; Liu, S.; Xiao, Q.; Ma, M.; Jin, R.; Wen, J. Heihe watershed allied telemetry experimental research (HiWATER): Scientific objectives and experimental design. Bull. Am. Meteorol. Soc. 2013, 94, 1145–1160. [Google Scholar] [CrossRef]
  32. Wright, P.; Bergin, M.; Dibb, J.; Lefer, B.; Domine, F.; Carman, T.; Wang, Z. Comparing MODIS daily snow albedo to spectral albedo field measurements in Central Greenland. Remote Sens. Environ. 2014, 140, 118–129. [Google Scholar] [CrossRef]
  33. Peng, J.J.; Liu, Q.; Wen, J.G.; Liu, Q.H.; Tang, Y.; Wang, L.Z.; Dou, B.C.; You, D.Q.; Sun, C.K.; Zhao, X.J.; et al. Multi-scale validation strategy for satellite albedo products and its uncertainty analysis. Sci. China Earth Sci. 2014, 58, 573–588. [Google Scholar] [CrossRef]
  34. Schaaf, C.B.; Gao, F.; Strahler, A.H.; Lucht, W.; Li, X.; Tsang, T.; Lewis, P. First operational BRDF, albedo nadir reflectance products from MODIS. Remote Sens. Environ. 2002, 83, 135–148. [Google Scholar] [CrossRef] [Green Version]
  35. Lucht, W.; Schaaf, C.B.; Strahler, A.H. An algorithm for the retrieval of albedo from space using semiempirical BRDF models. IEEE Trans. Geosci. Remote Sens. 2002, 38, 977–998. [Google Scholar] [CrossRef]
  36. Wanner, W.; Strahler, A.H.; Hu, B.; Lewis, P.; Muller, J.P.; Li, X.; Barnsley, M.J. Global retrieval of bidirectional reflectance and albedo over land from EOS MODIS and MISR data: Theory and algorithm. J. Geophys. Res. Atmos. 1997, 102, 17143–17161. [Google Scholar] [CrossRef] [Green Version]
  37. Campagnolo, M.L.; Sun, Q.; Liu, Y.; Schaaf, C.; Wang, Z.; Román, M.O. Estimating the effective spatial resolution of the operational brdf, albedo, and nadir reflectance products from MODIS and VIIRS. Remote Sens. Environ. 2016, 175, 52–64. [Google Scholar] [CrossRef]
  38. Sütterlin, M.; Schaaf, C.B.; Stöckli, R.; Sun, Q.; Hüsler, F.; Neuhaus, C.; Wunderle, S. Albedo and reflectance anisotropy retrieval from AVHRR operated onboard NOAA and MetOp satellites: Algorithm performance and accuracy assessment for Europe. Remote Sens. Environ. 2015, 168, 163–176. [Google Scholar] [CrossRef]
  39. Wang, L.; Zheng, X.; Lin, S.; Liu, Q.; Liu, S. Validation of GLASS albedo product through Landsat TM data and ground measurements. J. Remote Sens. 2014, 18, 547–558. [Google Scholar]
  40. Liu, N.F.; Liu, Q.; Wang, L.Z.; Liang, S.L.; Wen, J.G.; Qu, Y.; Liu, S.H. A statistics-based temporal filter algorithm to map spatiotemporally continuous shortwave albedo from MODIS data. Hydrol. Earth Syst. Sci. 2013, 17, 2121–2129. [Google Scholar] [CrossRef] [Green Version]
  41. Noreus, J.P.; Nyborg, M.R.; Hayling, K.L. The gravity anomaly field in the Gulf of Bothnia spatially characterized from satellite altimetry and in situ measurements. J. Appl. Geophys. 1997, 37, 67–84. [Google Scholar] [CrossRef]
  42. Xu, B.; Li, J.; Liu, Q.; Huete, A.R.; Yu, Q.; Zeng, Y. Evaluating spatial representativeness of station observations for remotely sensed leaf area index products. IEEE J. Sel. Top. Appl. Earth Obs. Remote Sens. 2016, 9, 3267–3282. [Google Scholar] [CrossRef]
  43. Peng, J.; Liu, Q.; Wang, L.; Liu, Q.; Fan, W.; Lu, M. Characterizing the pixel footprint of satellite albedo products derived from MODIS reflectance in the Heihe River Basin, China. Remote Sens. 2015, 7, 6886–6907. [Google Scholar] [CrossRef]
  44. Stroeve, J.; Box, J.E.; Wang, Z.; Schaaf, C.; Barrett, A. Re-evaluation of MODIS MCD43 Greenland albedo accuracy and trends. Remote Sens. Environ. 2013, 138, 199–214. [Google Scholar] [CrossRef]
  45. Wang, K.; Liang, S.; Schaaf, C.L.; Strahler, A.H. Evaluation of Moderate Resolution Imaging Spectroradiometer land surface visible and shortwave albedo products at FLUXNET sites. J. Geophys. Res. Atmos. 2010, 115, D17107. [Google Scholar] [CrossRef]
  46. Ranson, K.J.; Irons, J.R.; Daughtry, C.S.T. Surface albedo from bidirectional reflectance. Remote Sens. Environ. 1991, 35, 201–211. [Google Scholar] [CrossRef]
  47. Wu, X.; Wen, J.; Xiao, Q.; You, D.; Liu, Q.; Lin, X. Forward a spatio-temporal trend surface for long-term ground-measured albedo upscaling over heterogeneous land surface. Int. J. Digit. Earth 2017, 6, 1–15. [Google Scholar] [CrossRef]
Figure 1. Land cover map of the Heihe River Basin, with zooms showing the spatial distribution of the measurement sites.
Remotesensing 10 02045 g001
Figure 2. The comparison between HJ pixel albedo and ground-observed albedo in the experimental area.
Remotesensing 10 02045 g002
Figure 3. The flowchart of the assessment based on representativeness errors analysis. point spread function (PSF) denotes the point spread function of satellite albedo product.
Remotesensing 10 02045 g003
Figure 4. The comparisons of the RMSEs and R2 between MCD43A3 (V006), GLASS and MuSyQ albedos from the direct comparison with ground-observed albedo: (a) Observation ≥ 7, (b) Observation < 7, (c) Snow, (d) Snow free, (e) Overall. “Observation < 7” corresponds to the magnitude inversion of MCD43A3 and medium quality inversion of MuSyQ albedo.
Remotesensing 10 02045 g004
Figure 5. The comparisons of the Biases between MCD43A3 (V006), GLASS and MuSyQ albedos from the direct comparison with ground-observed albedo: (a) Observation ≥ 7, (b) Observation < 7, (c) Snow, (d) Snow free, (e) Overall.
Remotesensing 10 02045 g005
Figure 6. Box plots of the RMSEs (left), R2 (middle), and Biases (right) from the direct comparison with ground-observed albedo in different inversion cases throughout the sites with small representativeness errors: (a) Observation ≥ 7, (b) Observation < 7, (c) Snow free, (d) Overall.
Remotesensing 10 02045 g006
Figure 7. The comparisons of the RMSEs and R2 between MCD43A3 (V006), GLASS and MuSyQ albedos from the multi-scale validation.
Remotesensing 10 02045 g007
Figure 8. The comparisons of the Biases between MCD43A3 (V006), GLASS and MuSyQ albedos from the multi-scale validation.
Remotesensing 10 02045 g008
Figure 9. Box plots of the RMSEs (left), R2 (middle), and Biases (right) from the multi-scale validation throughout the sites with large representativeness errors.
Remotesensing 10 02045 g009
Table 1. Descriptions of the experimental sites.
ScopeSiteLatitude (°)Longitude (°)Elevation (m)Land CoverTower Height (m)Footprint (m)
UpstreamArousuper38.0473100.46433033alpine grassland543.5
Arousunny38.0898100.52043529alpine grassland652.2
Aroucloudy37.9841100.41083536alpine grassland652.2
Dashalong38.839998.94063739swamp meadow652.2
Ebao37.9492100.91513294alpine grassland652.2
Huangzangsi38.2254100.19183529wheat field652.2
Huangcaogou38.0033100.73123137alpine grassland652.2
Jingyangling37.8384101.1163750alpine meadows652.2
MidstreamDamansuper38.8555100.37221556corn field12104.4
Bajitan38.915100.30421562gobi652.2
Shenshawo38.7892100.49331594desert652.2
Zhangye38.9751100.44641460wetland652.2
Huazhaizi38.7652100.31861731desert2.521.75
Table 2. List of coarse-scale albedo products in this paper.
ProductSensorSpatial ResolutionTemporal ResolutionAlgorithmBRDF Synthesis PeriodTemporal Range
MCD43A3 (V006)MODIS500 mdailyBRDF modeling16-day2013–2014
GLASSMODIS1 km8-dayDirect estimation1-day2013
MuSyQMODIS, VIIRS, AVHRR, MERIS/FY31 km5-dayBRDF modeling10-day2013–2014
Table 3. Variogram model parameters over these sites.
Site500 m1 km
NuggetPartial SillRange (m)NuggetPartial SillRange (m)
Arousuper5.208 × 10^-075.927 × 10^-06212.60.0001.229 × 10^-05686.4
Dashalong0.0004.877 × 10^-06313.00.0001.305 × 10^-05225.2
Shenshawo1.704 × 10^-062.330 × 10^-05233.80.0004.379 × 10^-05190.8
Huangcaogou0.0001.184 × 10^-05188.80.0007.489 × 10^-05409.0
Huazhaizi0.0004.885 × 10^-05237.90.0007.843 × 10^-05567.7
Zhangye3.141 × 10^-061.150 × 10^-04172.10.0001.834 × 10^-04719.8
Bajitan1.262 × 10^-063.750 × 10^-05184.10.0002.178 × 10^-041918.4
Damansuper2.814 × 10^-065.520 × 10^-05165.10.0002.795 × 10^-04951.5
Arousunny8.159 × 10^-071.179 × 10^-04237.01.191 × 10^-053.804 × 10^-04374.1
Aroucloudy2.907 × 10^-052.768 × 10^-03279.30.0005.900 × 10^-04311.3
Ebao0.0004.996 × 10^-05396.11.750 × 10^-058.612 × 10^-04318.4
Jingyangling0.0001.010 × 10^-04180.40.0006.450 × 10^-03628.3
Huangzangsi3.442 × 10^-069.062 × 10^-05216.60.0008.230 × 10^-02183,050.0
Table 4. Frequency of representativeness errors of ground measurements to the 500 m (left) and 1 km (right) pixel.
SitesBest EstimatorGood EstimatorFair EstimatorBad Estimator
Representativeness Error (%)<55–1010–15>15
Shenshawo96/844/80/40/4
Bajitan88/8412/80/80/0
Huangcaogou83.3/87.516.7/12.50/00/0
Huazhaizi88/888/84/40/0
Dashalong100/58.30/33.30/8.30/0
Ebao75/58.320.8/254.2/16.70/0
Arousuper83.3/54.216.7/33.30/8.30/4.2
Damansuper60/608/1624/168/8
Zhangye40/2032/2416/2812/28
Arousunny70.8/29.28.3/16.720.8/20.80/33.3
Jingyangling47.8/30.48.7/26.113/21.730.4/21.7
Aroucloudy8.3/12.58.3/20.820.8/2562.5/41.7
Huangzangsi32/164/2016/048/64
Table 5. The rank orders of the performances of MCD43A3, GLASS and MuSyQ albedo in different situations.
CasesMagnitude (RMSE/Bias)Consistency (R2)
Observation ≥ 7MuSyQ ≈ MCD43A3 > GLASSMuSyQ > MCD43A3
3 ≤ Observation < 7MCD43A3 ≈ MuSyQ > GLASSMCD43A3 > MuSyQ
SnowfallMCD43A3 ≈ MuSyQMuSyQ > MCD43A3
Snow-freeMuSyQ ≈ MCD43A > GLASSMuSyQ > MCD43A3 ≈ GLASS
OverallMCD43A3 ≈ MuSyQ > GLASSMCD43A3 ≈ MuSyQ
Subtle seasonal variationMuSyQ > MCD43A3 > GLASSMuSyQ > MCD43A3 ≈ GLASS
Obvious seasonal variationMuSyQ ≈ GLASS > MCD43A3MuSyQ > MCD43A3 ≈ GLASS

