Locking Status and Earthquake Potential Hazard along the Middle-South Xianshuihe Fault


1
State Key Laboratory of Geodesy and Earth’s Dynamics, Institute of Geodesy and Geophysics, Chinese Academy of Sciences, Wuhan 430077, China
2
State Key Laboratory of Geological Processes and Mineral Resources, Institute of Geophysics and Geomatics, China University of Geosciences, Wuhan 430074, China
3
College of Earth and Planetary Sciences, University of Chinese Academy of Sciences, Beijing 100049, China
4
The Second Monitoring and Application Center, China Earthquake Administration, Xi’an 710054, China
*
Author to whom correspondence should be addressed.
Remote Sens. 2018, 10(12), 2048; https://doi.org/10.3390/rs10122048
Submission received: 16 October 2018
/
Revised: 6 December 2018
/
Accepted: 15 December 2018
/
Published: 17 December 2018
(This article belongs to the Special Issue Environmental and Geodetic Monitoring of the Tibetan Plateau)
Abstract
:By combining the seismogenic environment, seismic recurrence periods of strong historical earthquakes, precise locations of small–moderate earthquakes, and Coulomb stress changes of moderate–strong earthquakes, we analyze the potential locking status of a seismically quiet segment of Xianshuihe fault between Daofu County and Kangding City (SDK). The interseismic surface velocities between 1999 and 2017 are obtained from updated global positioning system (GPS) observations in this region. After removing the post-seismic relaxation effect caused by the 2008 Mw 7.9 Wenchuan earthquake that occurred around the fault segment, the observed velocities reveal a pronounced symmetric slip pattern along the SDK trace. The far field slip rate is 7.8 ± 0.4 mm/a, and the fault SDK is confirmed to be in an interseismic silent phase. The optimal locking depth is estimated at 7 km, which is perfectly distributed on the upper edge of the relocated hypocenters. A moment deficit analysis shows cumulative seismic moment between 1955 and 2018, corresponding to an Mw 6.6 event. Finally, based on a viscoelastic deformation model, we find that moderate–strong earthquakes in the surrounding area increase the Coulomb stress level by up to 2 bars on the SDK, significantly enhancing the future seismic potential.

1. Introduction
Located at the junction of the Songpan–Ganzi fold, Sichuan Basin, and Sichuan–Yunnan terrane, the Xianshuihe–Xiaojiang fault system (hereafter abbreviated as XXFS) is a mature continental transform fault system that transmits convergent deformation between the Indian and Eurasian plates [1]. It is one of the most active sinistral strike-slip fault systems in the southeastern margin of the Tibetan Plateau [2,3,4,5], comparable to other highly active strike-slip systems in the world, such as the North Anatolian zone in Turkey [6,7,8] and the San Andreas fault system of California [9,10,11,12,13,14]. Almost all segments of the XXFS have experienced a series of moderate–strong earthquakes. In the past 300 years, at least 12 earthquakes of M ≥ 7 (35 earthquakes of M > 6) have occurred on the fault system [2,3], leading to extensive research attention in the past several decades. Li et al. [15], together with Zhang and Wang [16] exhibited the images of seismic velocity structure and seismogenic environment in this region. Papadimitrious et al. [17] and Paradisopoulou et al. [18] analyzed the stress evolution along this fault system, and identified stress-enhanced zones by studying sub-faults independently, without considering the effect of post-seismic viscoelastic relaxation following major earthquakes. After that, Shan et al. [3] calculated the Coulomb stress evolution along the XXFS since 1713 by incorporating the stress transfer due to post-seismic relaxation. With the development of geodetic technology, Wen et al. [19] studied the Anninghe seismic gap and found evident fault-locking and strain-accumulation. Zhao et al. [4] imaged the spatial variation in the locking status of the fault system before and after the 2008 Mw 7.9 Wenchuan earthquake, by ignoring post-seismic viscoelastic relaxation. All of these studies provide important insights to the seismogenic background and seismic hazard of the region.
Among all of the faults in the XXFS, the Xianshuihe fault exhibits the highest seismic hazard and active tectonic movement. By studying various types of data, including the damage or intensity distribution of historical earthquakes, as well as the surface rupture and the aftershock zones of modern earthquakes, Wen et al. [2] systematically determined the location and rupture spatial extents of major historical earthquakes. For recent earthquakes, they located and measured their ruptures from information on surface rupture, aftershock distribution, and the results of relevant geological investigation. For pre-instrumental earthquakes, they developed a semi-quantitative empirical relationship that can be used to determine the rupture extents from seismic intensity distribution. The seismic intensity, casualties, macro-damage, and so on are available or can be evaluated from historical literature, modern publications and reports. Finally, they established a time and space pattern of this fault for the past several hundreds of years. The average seismic recurrence intervals from major segment-ruptures indicates that the southern part of Xianshuihe fault between Bamei and Kangding is approximately close to rupture, which is consistent with the b-value variation that is estimated in modern seismic records [1,4,20]. Allen et al. [21] also proposed two seismic gaps that are capable of generating earthquakes with a magnitude over Mw 7.0: the 65 km long segment between Daofu and Qianning and the 135 km long segment bracketing Kangding. Moreover, Jiang et al. [22] revealed that the maximum accumulation rate of the tectonic stress on the Xianshuihe fault is up to ~7.05 kpa/a, and Shan et al. [3] demonstrated that the Coulomb failure stress (CFS) in the segment between Daofu and Kangding has been enhanced by previous moderate–strong earthquakes since 1713. Therefore, the segment between Daofu County and Kangding City (SDK) exhibits high potential for a strong earthquake.
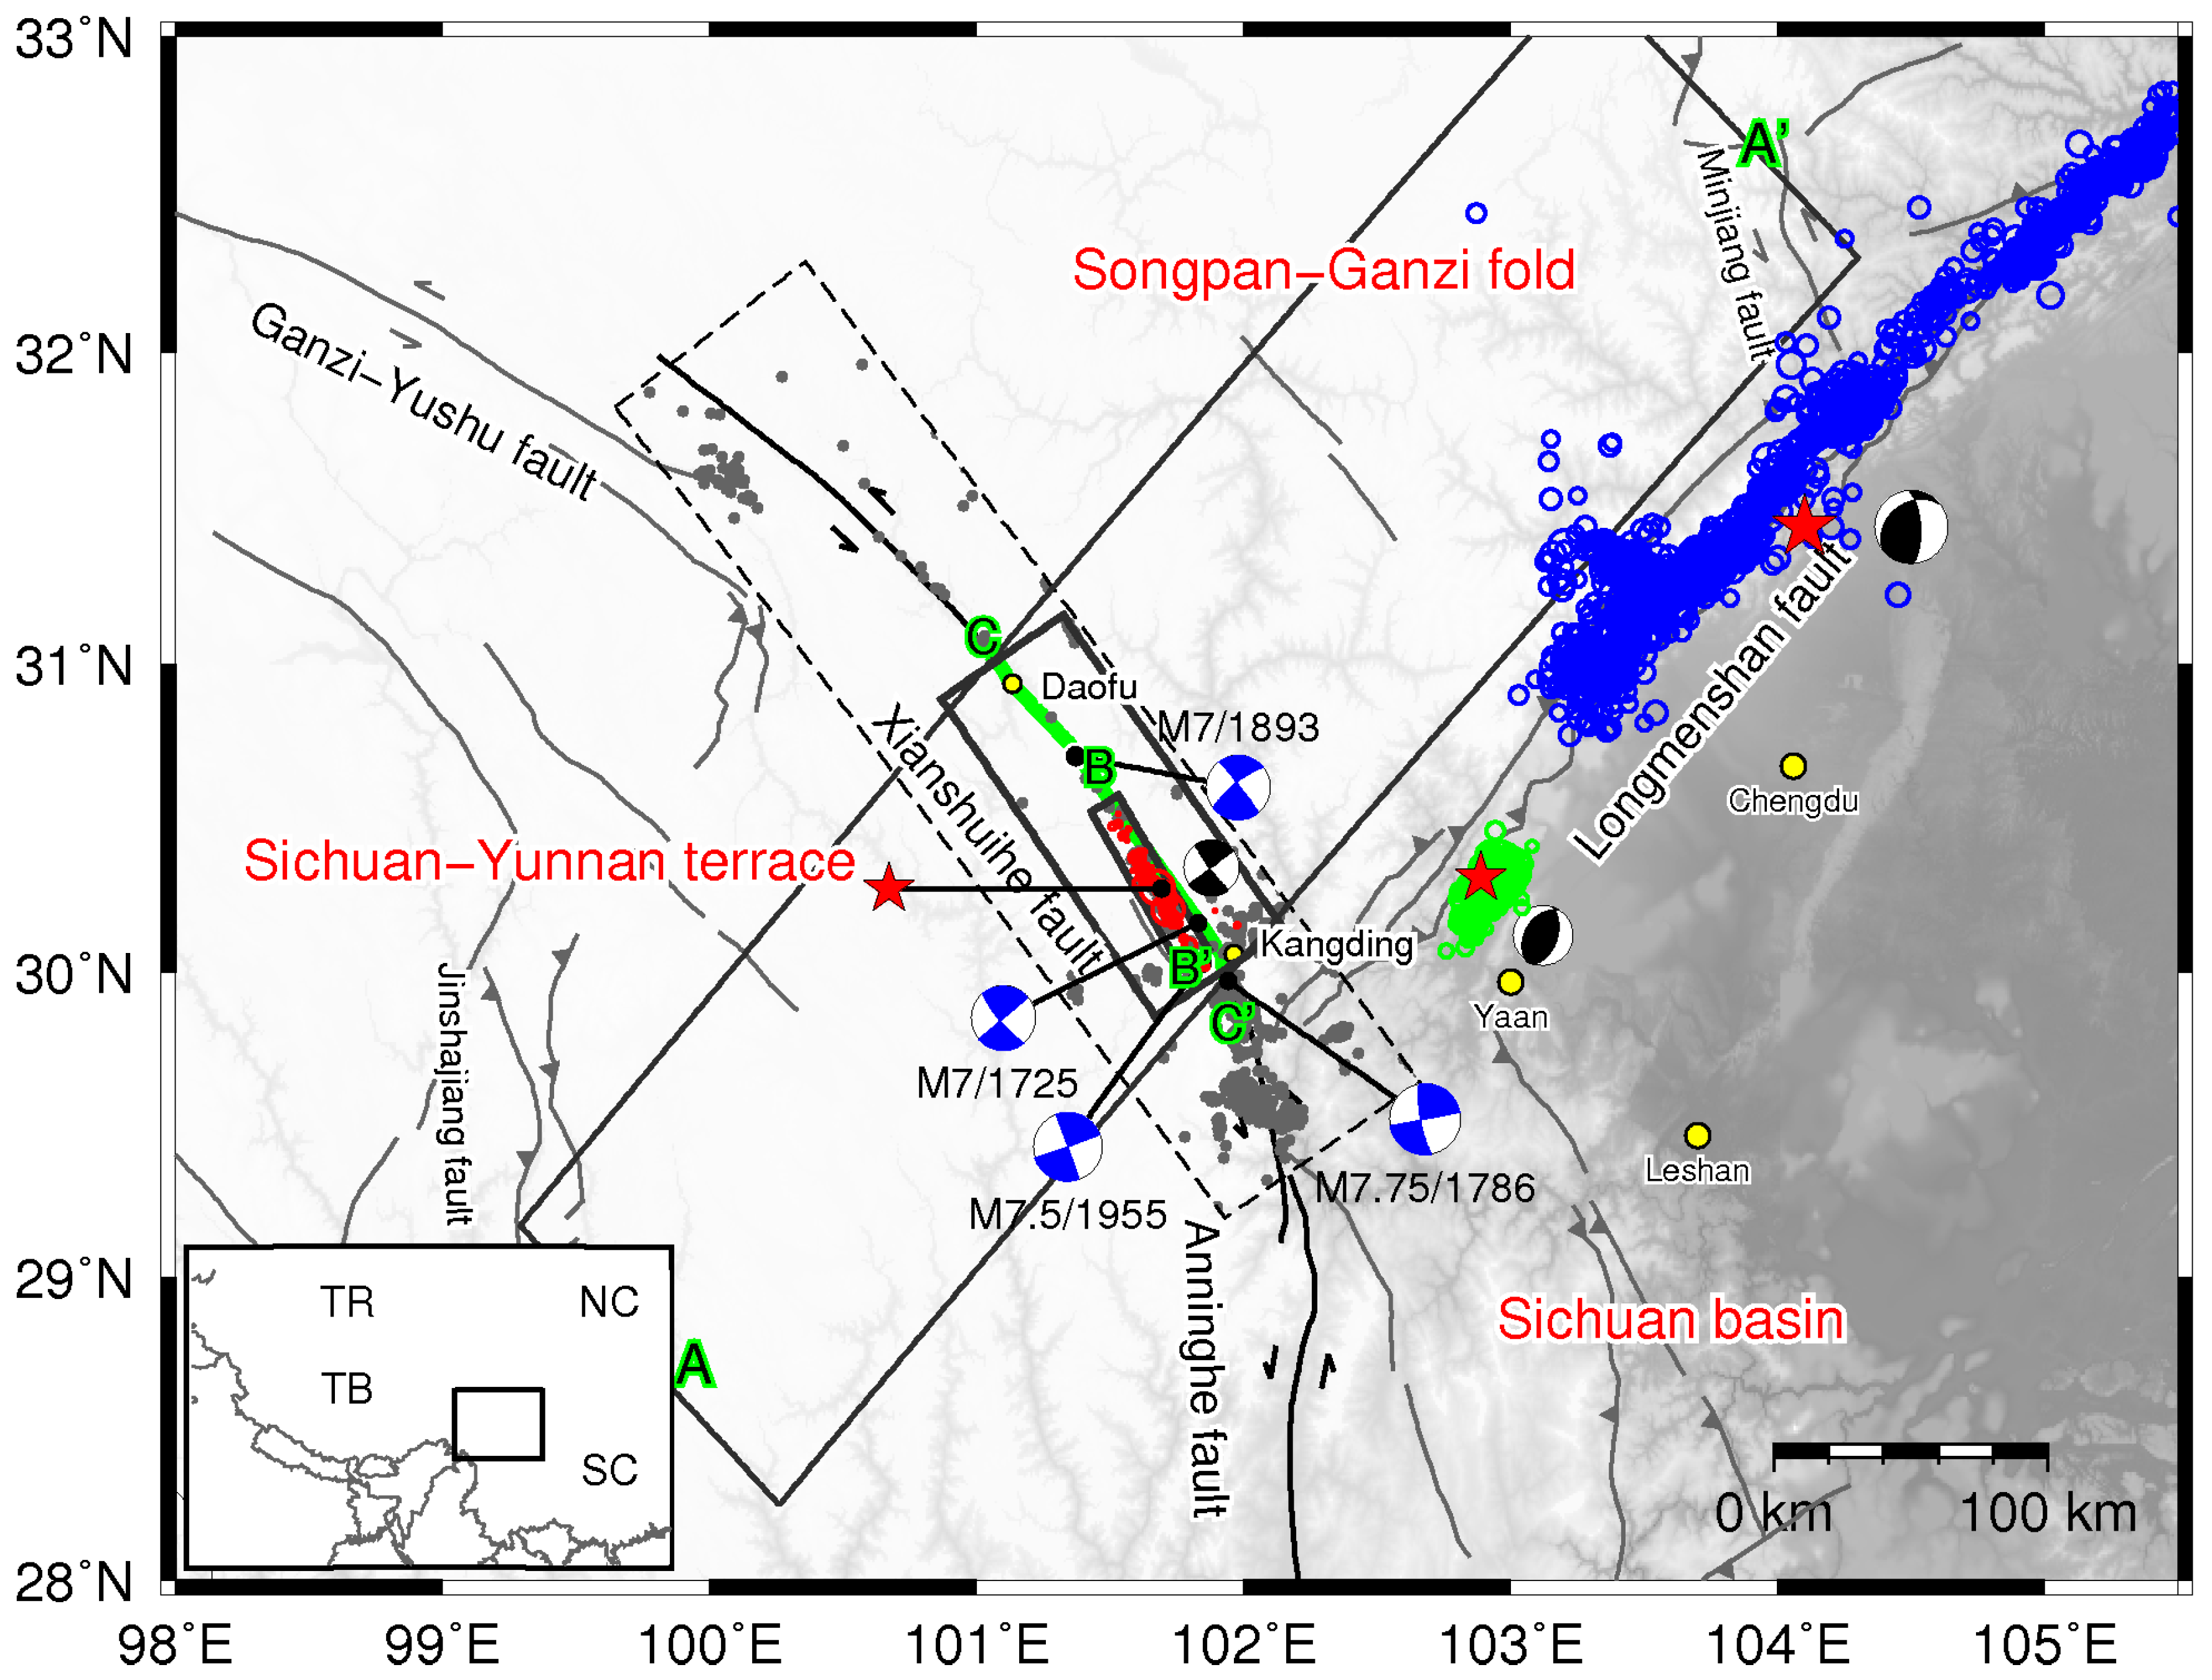
For this reason, we focus on the seismic silence of the 135 km long SDK [1,2,3]. As one of the most active segments on Xianshuihe fault, the SDK has experienced four earthquakes with magnitudes ≥7 in recent centuries (Figure 1) [2,3]. The last four major events in 1725, 1786, 1893, and 1955 (M = 7, 7.85, 7 and 7.5) reveal a recurrence interval of approximately 50–150 years. Moreover, Parsons et al. [23], Shan et al. [3,24], and Toda et al. [25] all showed that the Wenchuan earthquake enhanced the static Coulomb failure stress accumulation by more than 0.01 MPa between Daofu County and Kangding City. Two recent coupled moderate-sized events in a Kangding earthquake sequence, the 2014 Mw 5.9 event on 22 November and the 2014 Mw 5.6 event on 25 November, occurred on the SDK, also indicating a positive static stress transfer in the region [26]. Jiang et al. [1] suggested that the cumulative seismic moment of this segment has reached ~7.15 × 10¹⁸ N·m (a rigidity of 30 GPa) since the last M 7.5 earthquake. However, the combined seismic moment of these two events (~2.36 × 10¹⁸ N·m) were too small to release the total tectonic strain [26,27]. Also, the residual moment was equivalent to an Mw 6.4 earthquake, ignoring the high strain accumulation rate of 1.21 × 10¹⁷ N·m/a since 1955 [1]. Therefore, the seismic silence observed along this segment since 1955 makes the SDK one of the most promising sites for earthquake potential and hazard evaluation studies in the world.
The fault SDK has a long history of geological evolution [28]. Roger et al. [29] reported that its Rb–Sr age may be 10–12 Ma for the total displacements with 90–100 km, and determined its long-term average slip rate can be 7.5 to 11.1 mm/yr. Allen et al. [21] derived the late Quaternary slip rate on the southeastern segment of the Xianshuihe fault as 10 ± 5 mm/a, based on radiometrically dated offset stream channels and terrace deposits and offset glacial moraines. Chen et al. [30] determined the ages terrace treads using carbon 14 and OSL dating methods, measured a series of terrace riser offsets along this segment, and derived the average slip rate with 6.7–17 mm/a. Zhang et al. [28] suggested that the slip rate may be constrained to 8–11 mm/a using the age of upper terrace as the onset of the riser offset. The difference between different geological data sets may be due to the along-fault changes in the mechanical properties of the uppermost crustal layer [10]. In recent years, the advent of geodetic technology provides technical support measuring the real-time, large scale, and high precision data of crustal motion. In the past two decades, a large number of global positioning system (GPS) stations have been built in the Sichuan–Yunnan terrain by the Chinese Earthquake Administration, and other institutions [31]. Zhang et al. [32] reported the slip rate of SDK to be about 8.5–11.5 mm/a, using GPS data during 1998–2002. Shen et al. [5] derived that the slip rate for the whole Xianshuihe fault can be 8–12 mm/a, using updated GPS date between 1998 and 2004. Jiang et al. [1] estimated that the current slip rate on the SDK is 7.0–7.6 mm/a, using the slip deficit rate distribution model of 1018 Pa·s. In general, widely spaced geodetic observations across a fault zone are expected to mirror the interseismic motion, unless a very large earthquake occurred within the last one or two decades [5]. Post-seismic processes have a significant effect on the crustal velocity field, and on the reloading rate of next co-seismic fault segment [7,8,33,34]. As suggested by Kenner and Simons [33], this may be the reason for the variable earthquake recurrence intervals in some regions. Previous geodetic results on the XXFS mainly suffered from the following two difficulties, indicating that the reliability and accuracy of this research must be improved. (1) Space-time limitations of geodetic coverage in the early days [1,5,31,32,35]. (2) Contamination of the observed surface deformation signals by moderate–strong earthquakes in the surrounding regions during the observation period [4], such as the 2008 Mw 7.9 Wenchuan earthquake. In addition, the interactions between the studied fault and nearby faults should be considered [10,11]. The Sichuan-Yunnan terrain is a highly complex tectonic region; there are many active faults surrounding the XXFS, and movement on nearby faults could disturb the interseismic deformation of the studied fault.
In recent years, with the improvements of GPS stations coverage and accuracy, it is possible to better image the interseismic fault coupling and creeping in the XXFS. To remove or mitigate disturbances from aforementioned factors, we apply the following strategies to purify the near- and far-field deformations across the studied fault: Firstly, we choose an SDK segment without major active faults in the surrounding regions. Although there are few small fault branches at the southern end of this fault segment, we assume that they are in a line [1,4,5,28,35]. Secondly, we build a viscoelastic model to quantify the relaxation effect of past earthquakes during the studied period, and then correct the observed GPS deformation by removing the post-seismic effect. Through these steps, a relatively pure deformation field that caused by the status of fault SDK is built to study the fault-locking status. In addition, we compare the relocated earthquake hypocenters and the locking depth to analyze the validity of the inversion results. Finally, we combine the CFS changes that are triggered by surrounding moderate–strong earthquakes, and cumulative seismic moment to analyze future seismic hazards on the SDK.
2. Data
2.1. Data Collection
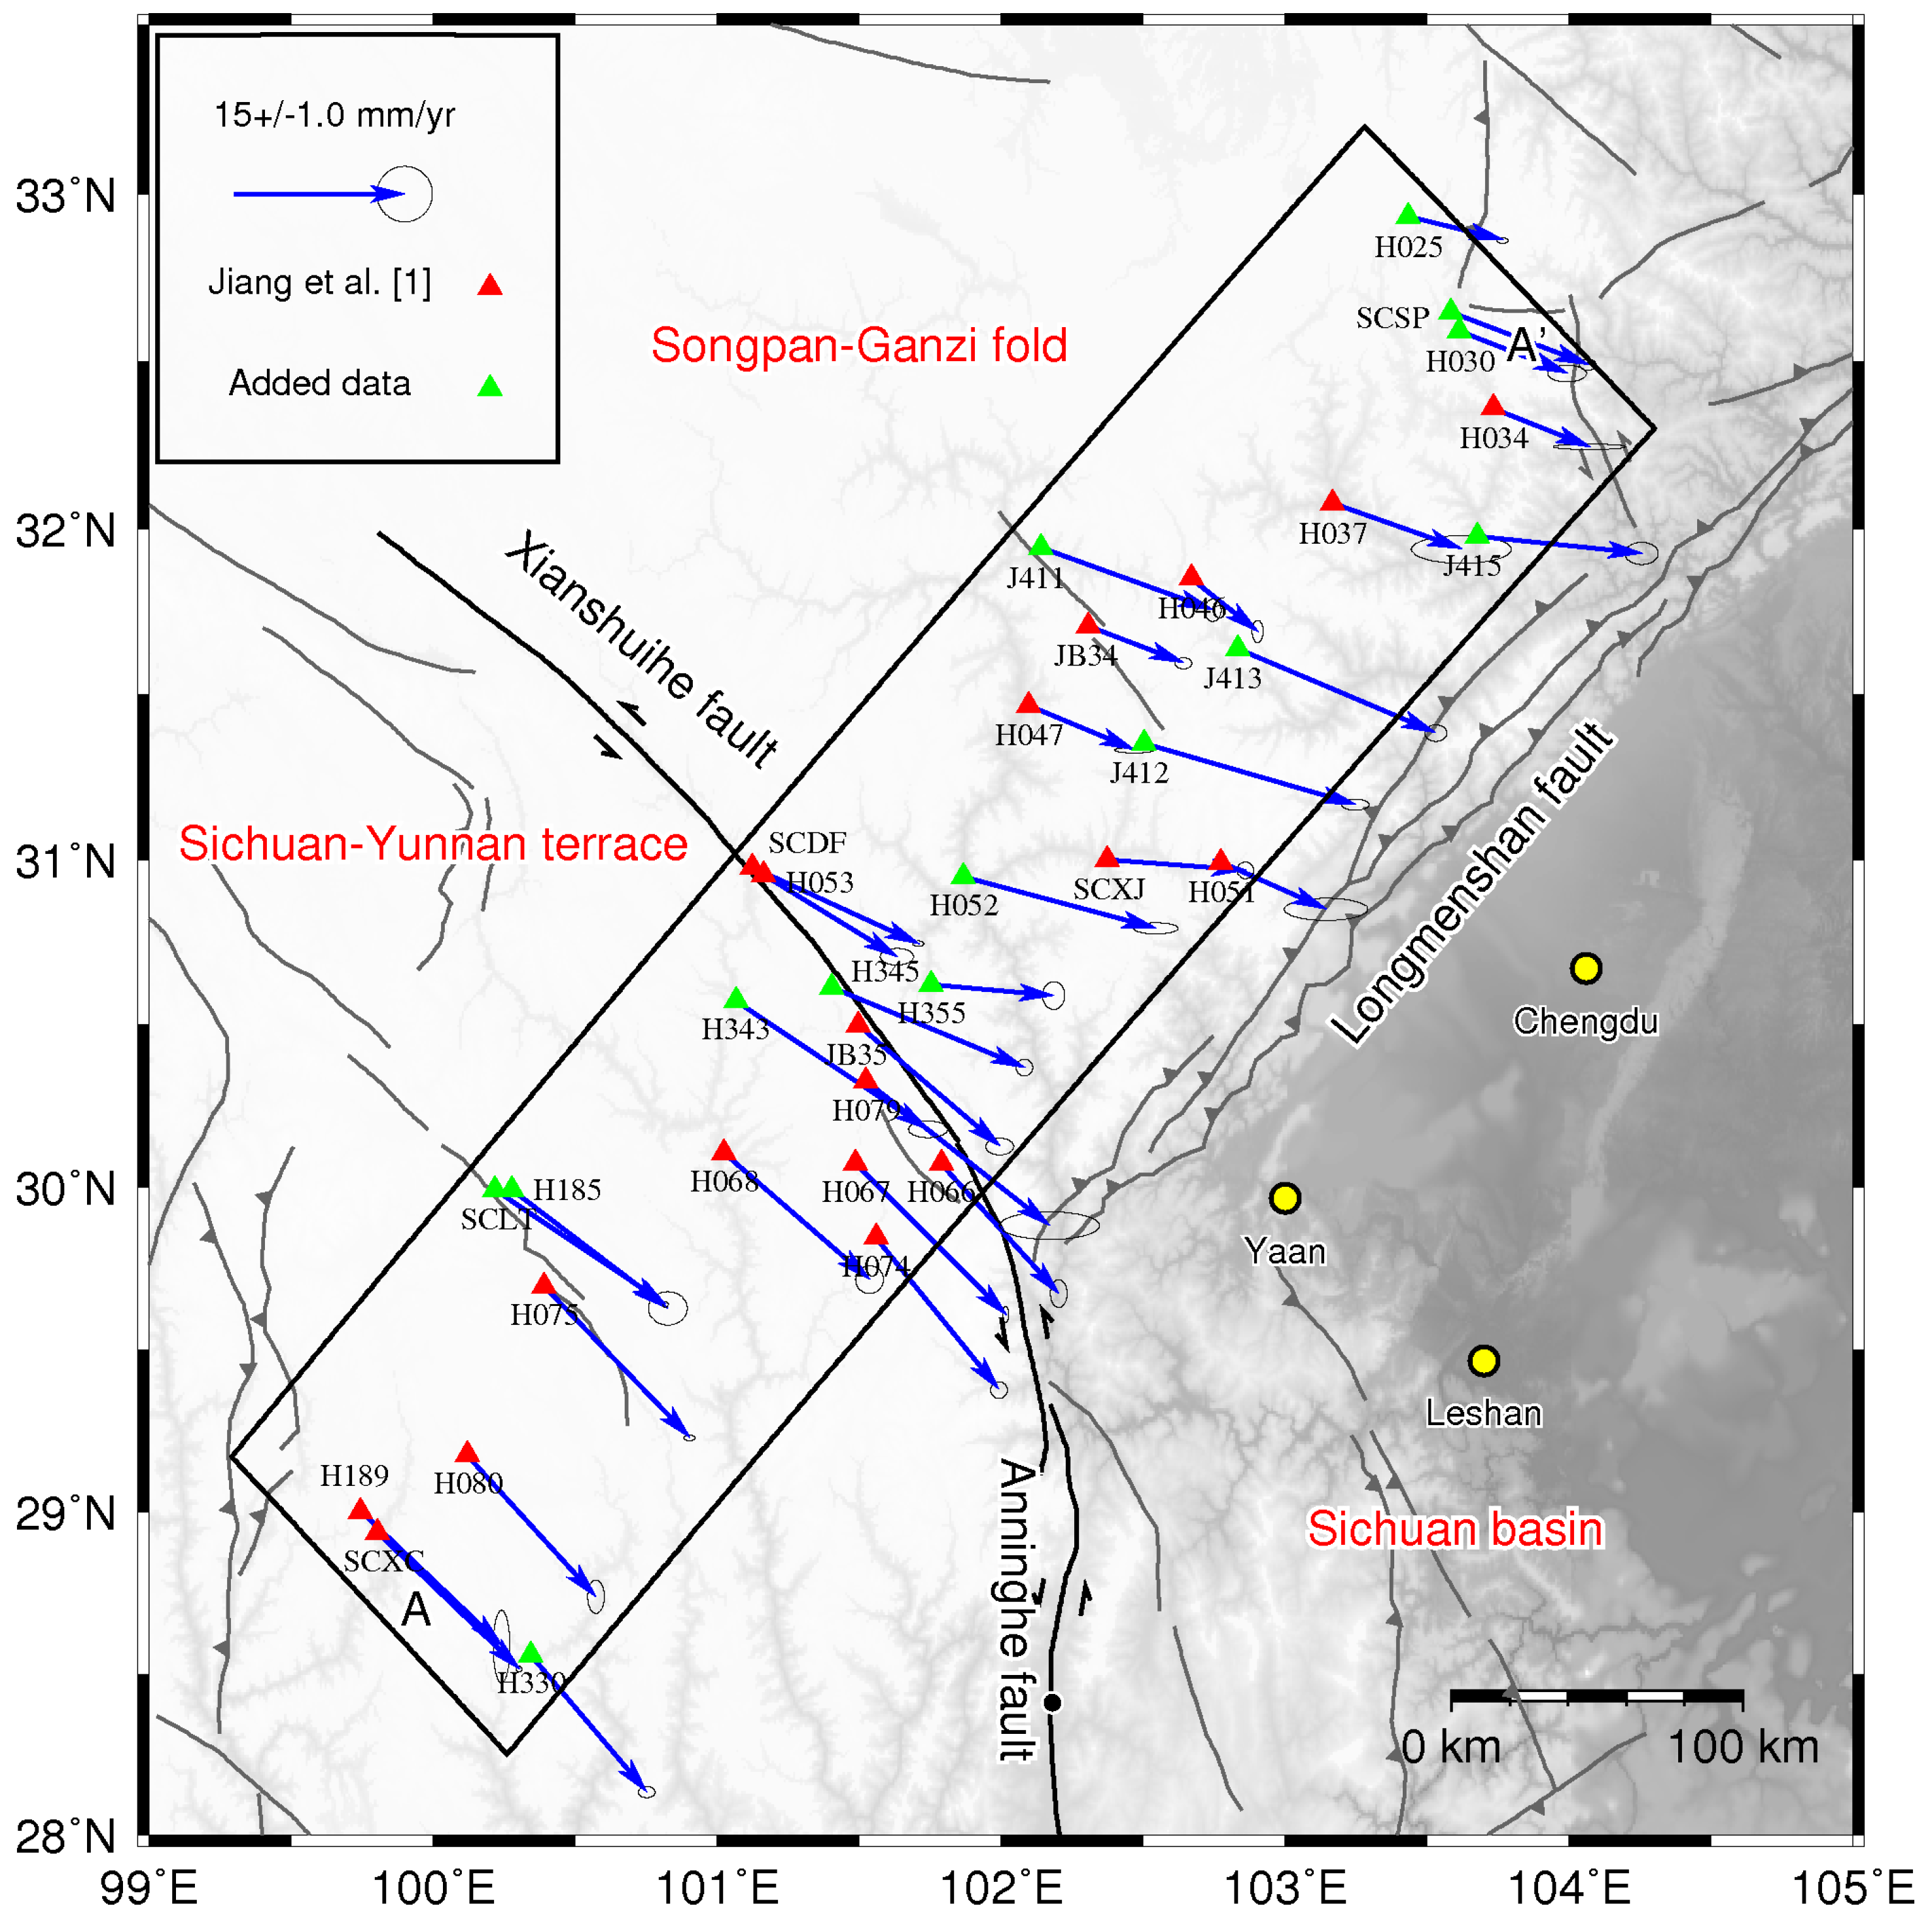
In the past two decades, many GPS measurements have been performed in mainland China, including two national major projects implemented by the China Earthquake Administration. They are the Crustal Movement Observation Network of China (CMONOC I) [36], and the Tectonic and Environmental Observation Network of Mainland China (CMONOC II) [37], respectively. Among these measurements, most of the stations have operated over a 10-year span, or have at least five observational campaigns (Table S1), so we can obtain high-accuracy horizontal velocities. We first select the stations in our studied area, and then exclude stations within 40 km of the non-modeled fault, such as Jinshajiang fault, Minjiang fault, and Longmenshan fault [1]. Finally, we select 33 updated GPS stations (Table S2) between 1999 and 2017 along the fault SDK for our analysis (Figure 2).
2.2. Data Processing
The GPS data were processed using GAMIT/GLOBK10.5 [5,32,38]. The process is mainly divided into two steps: (1) We processed the original observation data with GAMIT to obtain daily loosely constrained solutions and satellite orbits. (2) We then performed joint adjustment for the daily loosely constrained solutions of all stations, to obtain their position time series and the estimations of velocities in ITRF2008, using the software GLOBK10.5. The specific process is described below.
During data processing, considering the impact of the number of stations on the velocity solutions, we first performed the network processing for the daily observation data. The procedure mainly follows two strategies: (1) Each network is uniform overlying the mainland China. (2) There are five public sites between the two adjacent networks. According to these strategies, we divide the daily observation data into five or six networks, and then solve the loosely constrained solution of each network separately.
The baseline solution is used the orbital relaxation (RELAX) mode and imposed a constraint of 10−8 (about 20 cm) on the satellite orbital root parameters. We used the pseudorange constraint (LC_AUTCLN) to distinguish the wide lane (WL) and narrow lane (NL) ambiguities. In addition, taking into account the influence of multipath effects, the satellite cutoff elevation angle was set as 13°. For atmospheric delay, the global pressure and temperature (GPT) model [39] was used to calculate the zenith dry delay component of each station. At the same time, a zenith wet component was estimated every two hours for all stations, and then the global-mapping function (GMF) [40] was used to map the atmospheric delay to the satellite elevation angle. Two atmospheric horizontal gradient parameters were estimated for each station. Correction for solid tides, ocean tide, and pole tide loading were made with the IERS03 model [41]. For antenna phase center changes, the absolute antenna phase center model issued by the International Global Navigation Satellite System Service (IGS) was used for correction.
Based on the above constraints and models, we used GLOBK software to combine the daily loosely constrained solutions of the regional stations with loosely constrained global solutions of ~80 IGS tracking sites (produced at the Scripps Orbital and Position Analysis Center, http://sopac-csrc.ucsd.edu/). Finally, we selected the global stable and self-consistent IGS framework sites (Figure S1) and fixed it to the International Terrestrial Reference Frame 2008 (ITRF2008) framework by the seven-parameter transformation method, and finally obtained the coordinate time series and velocities using QOCA software (Figure S2). Then, we transformed the velocity solutions into an Eurasia-fixed reference frame, using the Euler vector of Eurasia with respect to the ITRF2008 [42].
It is noted that three moderate–strong earthquakes, that is, the 12 May 2008 Mw 7.9 Wenchuan earthquake, the 20 April 2013 Mw 6.6 Lushan earthquake, and the 22 November 2014 Mw 6.2 Kangding earthquake, occurred around our studied region between 1999 and 2017. We use the strategies of Liang et al. [31] and Gan et al. [38] to remove the co-seismic impact of these earthquakes on the relevant velocity field: First, the co-seismic displacement and uncertainty of each GPS station are estimated with an elastic dislocation model. Then, for the stations whose co-seismic displacement estimates are equal or greater than 3 mm, we add three co-seismic displacement parameters when solving the velocity field.
2.3. Signal Decomposition
In general, the crustal deformation recorded by GPS stations not only contains a steady block motion, but it also mixes with the post-seismic displacements caused by the viscoelastic relaxation of past earthquakes [1,7,43]. Therefore, in order to obtain the strain accumulation due to slip deficit near the fault, we also need to remove the effect of the earthquakes. As the studied region is located at the convergence boundary between the Indian and Eurasian Plates, the GPS signal is inevitably affected by the surrounding moderate–strong earthquakes, including the 2008 Mw 7.9 Wenchuan earthquake [3,22,23,24,25,44,45,46,47,48], the 2013 Mw 6.6 Lushan earthquake [49,50], and the 2014 Mw 6.2 Kangding earthquake [26,27,51], that occurred during the period from 1999 to 2017. In usual, the contribution of post-seismic deformation decreases to apparently negligible levels within approximately a decade, except some large earthquakes [11,52]; thus we neglect the post-seismic effects of earthquakes that occurred more than 40 years ago.
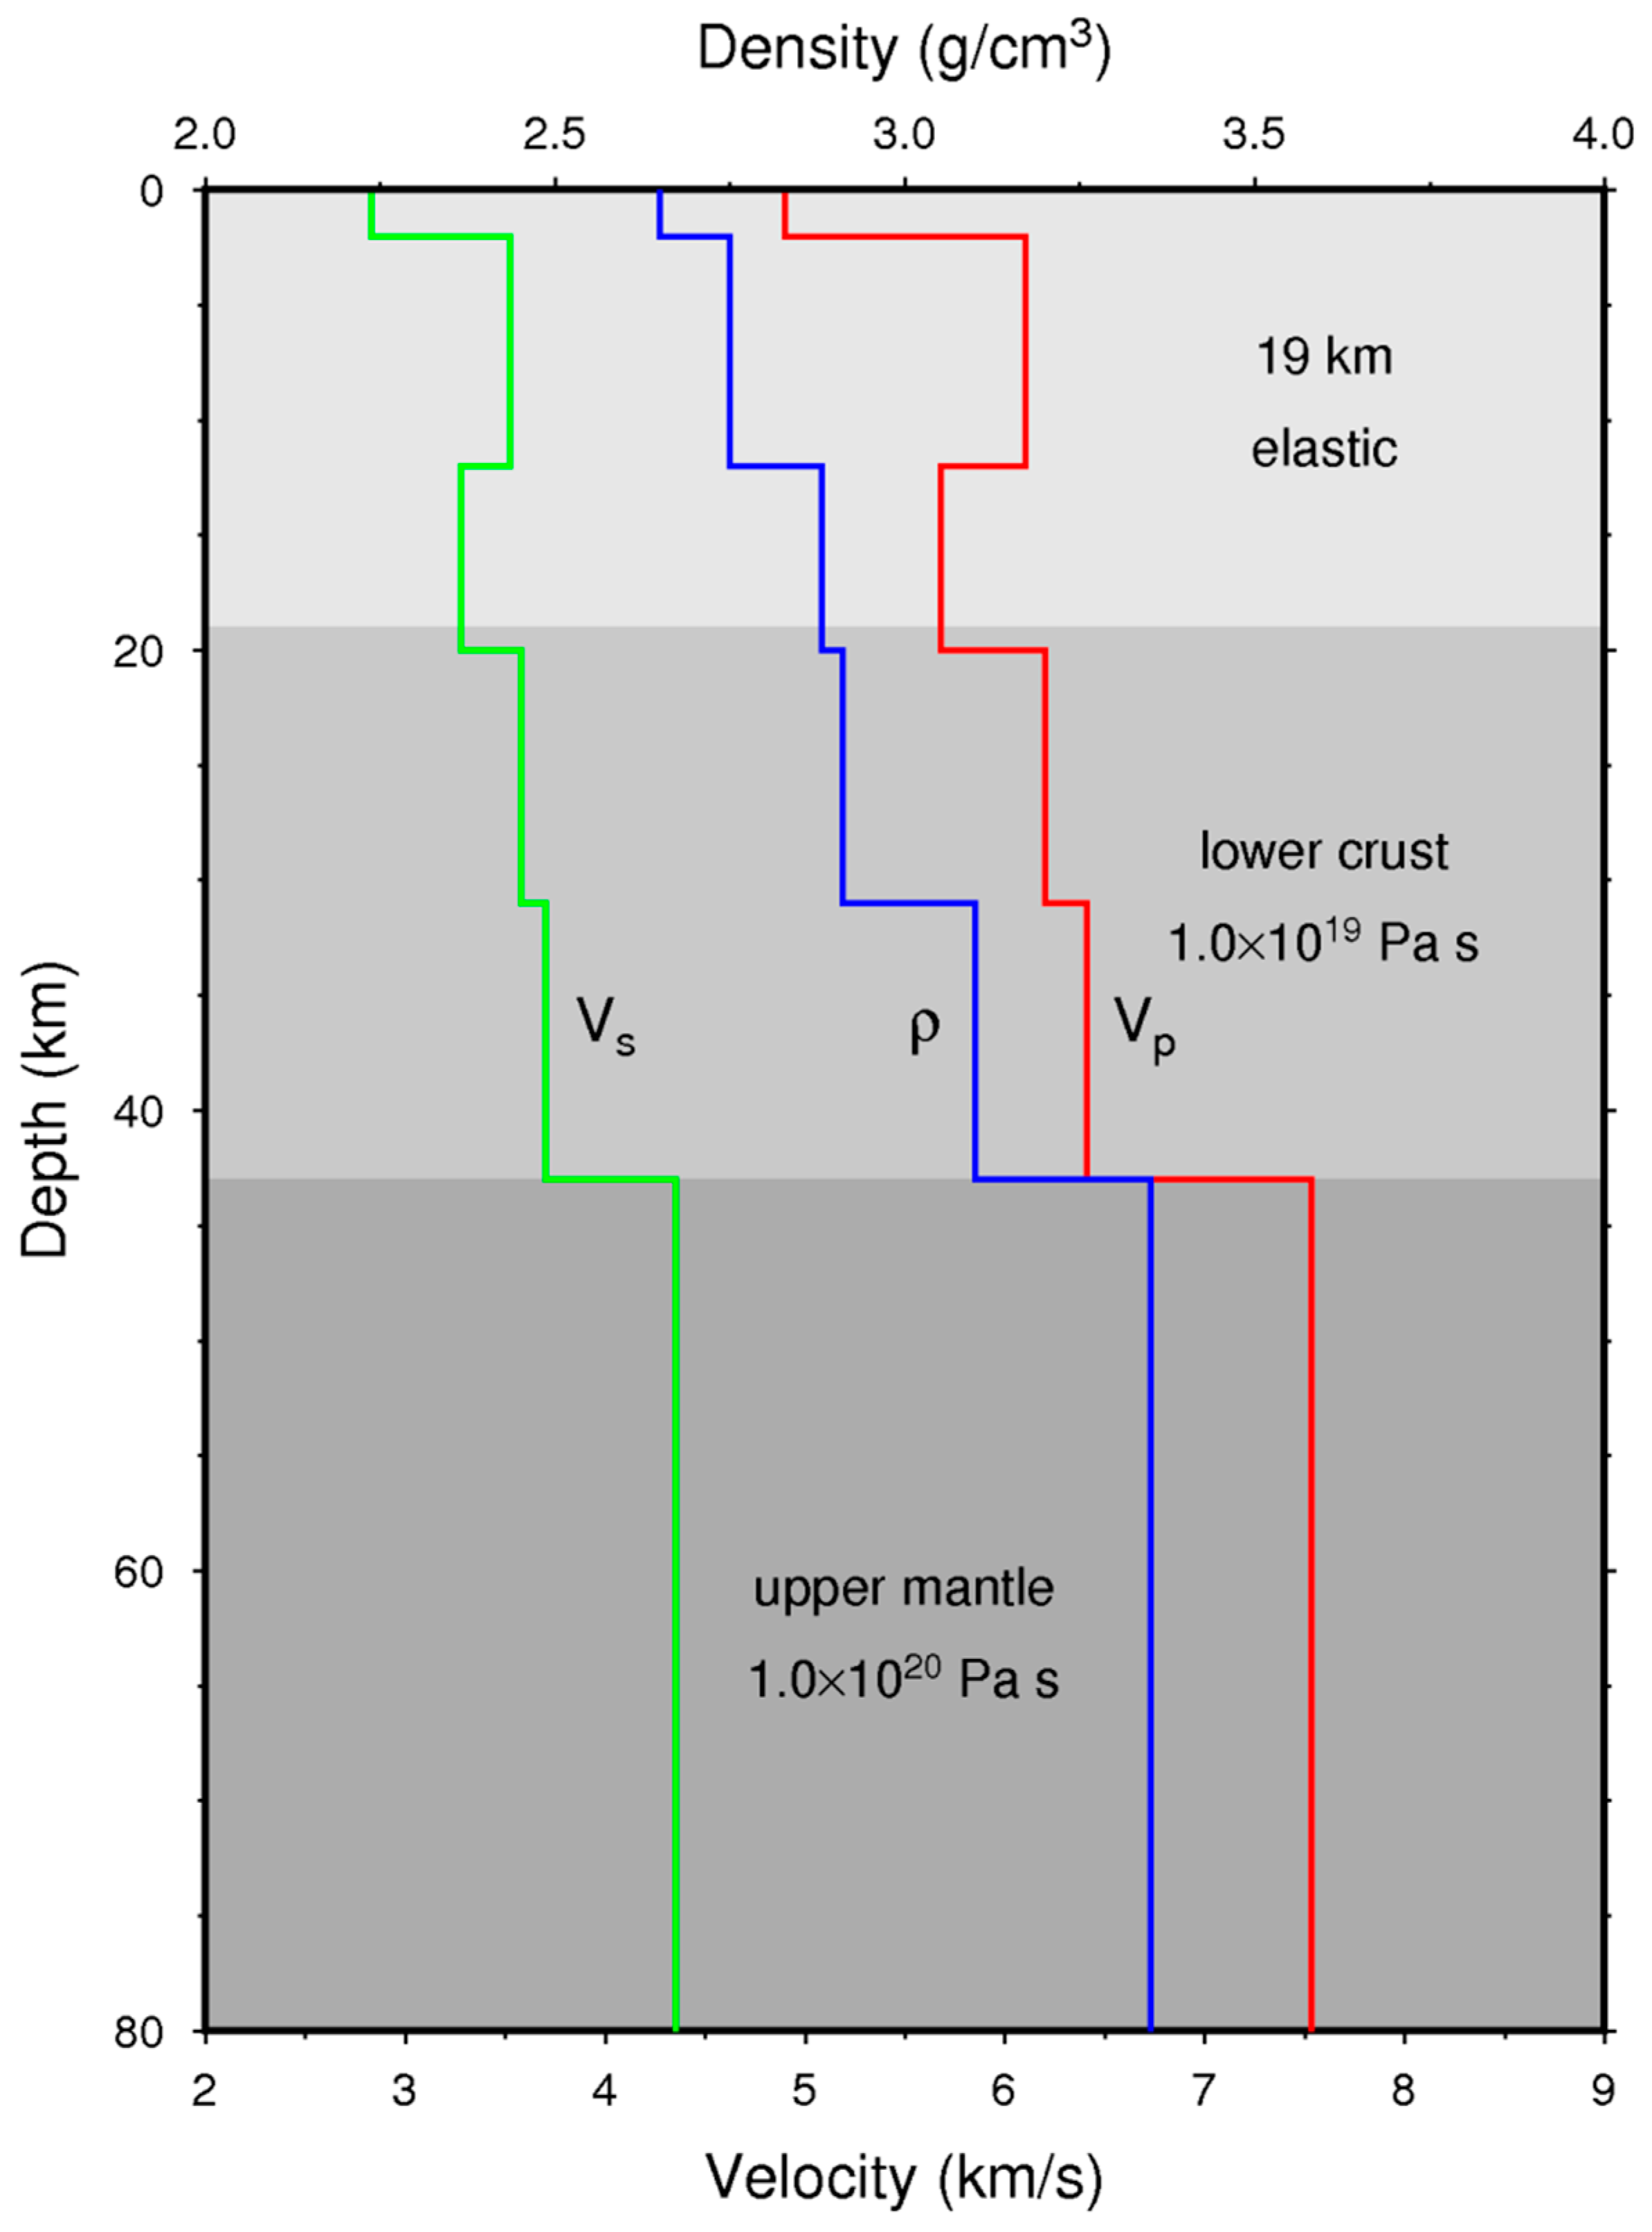
We perform a forward model to estimate the impact of past earthquakes (Text S1). A layered viscoelastic model is constructed to simulate the GPS displacements resulting from the relaxation effect of past earthquakes, by employing the PSGRN/PSCMP code that was developed by Wang et al. [53]. The model contains three layers: an elastic upper-crust layer overlying two homogeneous Maxwell viscoelastic substrates representing the lower crust and upper mantle, respectively. The magnitude of post-seismic viscoelastic relaxation relies on the rheological properties of the lower crust and upper mantle. In this study, the effective elastic thickness of the crust is set as 19 km [3,51], which agrees well with apparently ductile granite at depths of 14 to 19 km [54] and is similar to the depth of 20 km from Jiang et al. [1]. The viscosities of the lower crust and upper mantle are fixed at 1 × 10¹⁹ Pa·s and 1 × 10²⁰ Pa·s, respectively, which are consistent with the rheological parameters inferred by Shan et al. [3], Xie et al. [51], and Shi and Cao [55] (Figure 3). The co-seismic slip distribution of the Wenchuan earthquake proposed by Zhang et al. [44] is applied as the input model for estimating its viscoelastic effect. Figure 4a shows the post-seismic relaxation results in studied region, and indicates that the Wenchuan earthquake plays an important role in the interseismic crustal velocities, and plays a decisive factor in the viscoelastic effect of earthquakes. Here, since the moment magnitude of the 2013 Lushan earthquake and the 2014 Kangding is relatively small, and the elapsed time is short, resulting in a small post-seismic relaxation effect, therefore, they can be neglected during the data processing.
3. Methodology
We reexamine the updated GPS data pertinent to the determination of relative motion along the SDK. When measuring the crustal deformation across a section where the fault may be locked, it is vital to confirm that the measurements extend far enough beyond the fault to span the region of strain accumulation, to at least several times the locking depth [9,13]. Based on historical seismicity records and paleoseismological studies [2,3], we deduce that the dip angle of SDK is close to 90°. Therefore, we conduct our study on the basis of the simple screw dislocation model [7,9,56,57,58] using the expression:
where v represents the surface velocity, ṡ is the fault slip rate, x is the distance perpendicular to the fault that can be surveyed/calculated directly, and D is the locking depth. The equation suggests that the fault-parallel velocity is a function of the distance that is perpendicular to the fault. We systematically traverse the range of the locking depth to achieve the optimal value that provides the minimum root mean square (rms) misfit between the calculated and observed velocities, based on the slip rate obtained above. However, as suggested by Smith-Konter et al. [13] and Wang et al. [58], an accurate estimate of the locking depth requires a high density GPS velocity data. Due to the sparse geodetic data, the locking depth may have relatively large uncertainties. In order to evaluate the largest potential earthquake along the studied fault, we could roughly assume that the interseismic slip deficit is equal to the co-seismic slip [9,10,14,59]. Then, considering that the sign of the interseismic strain is opposite to that of the co-seismic strain, we can evaluate the co-seismic displacement in a future earthquake. According to this method, the locking depth and slip deficit along the SDK can be determined, and the potential for the segment can be quantitatively assessed thereafter.
4. Results
4.1. Locked Slip Deficit Rate of SDK
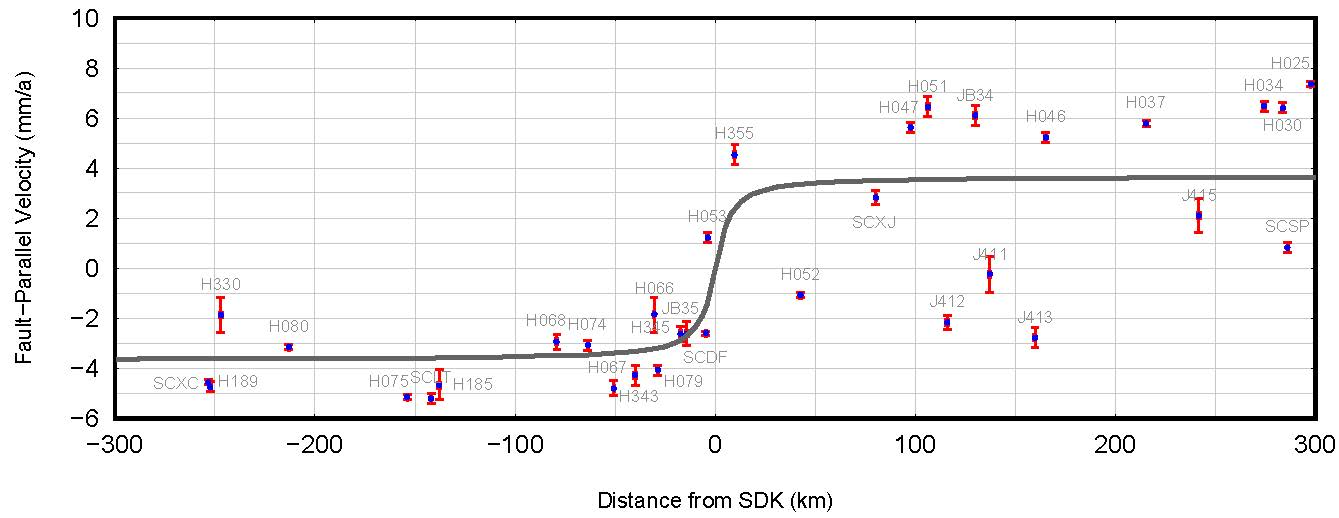
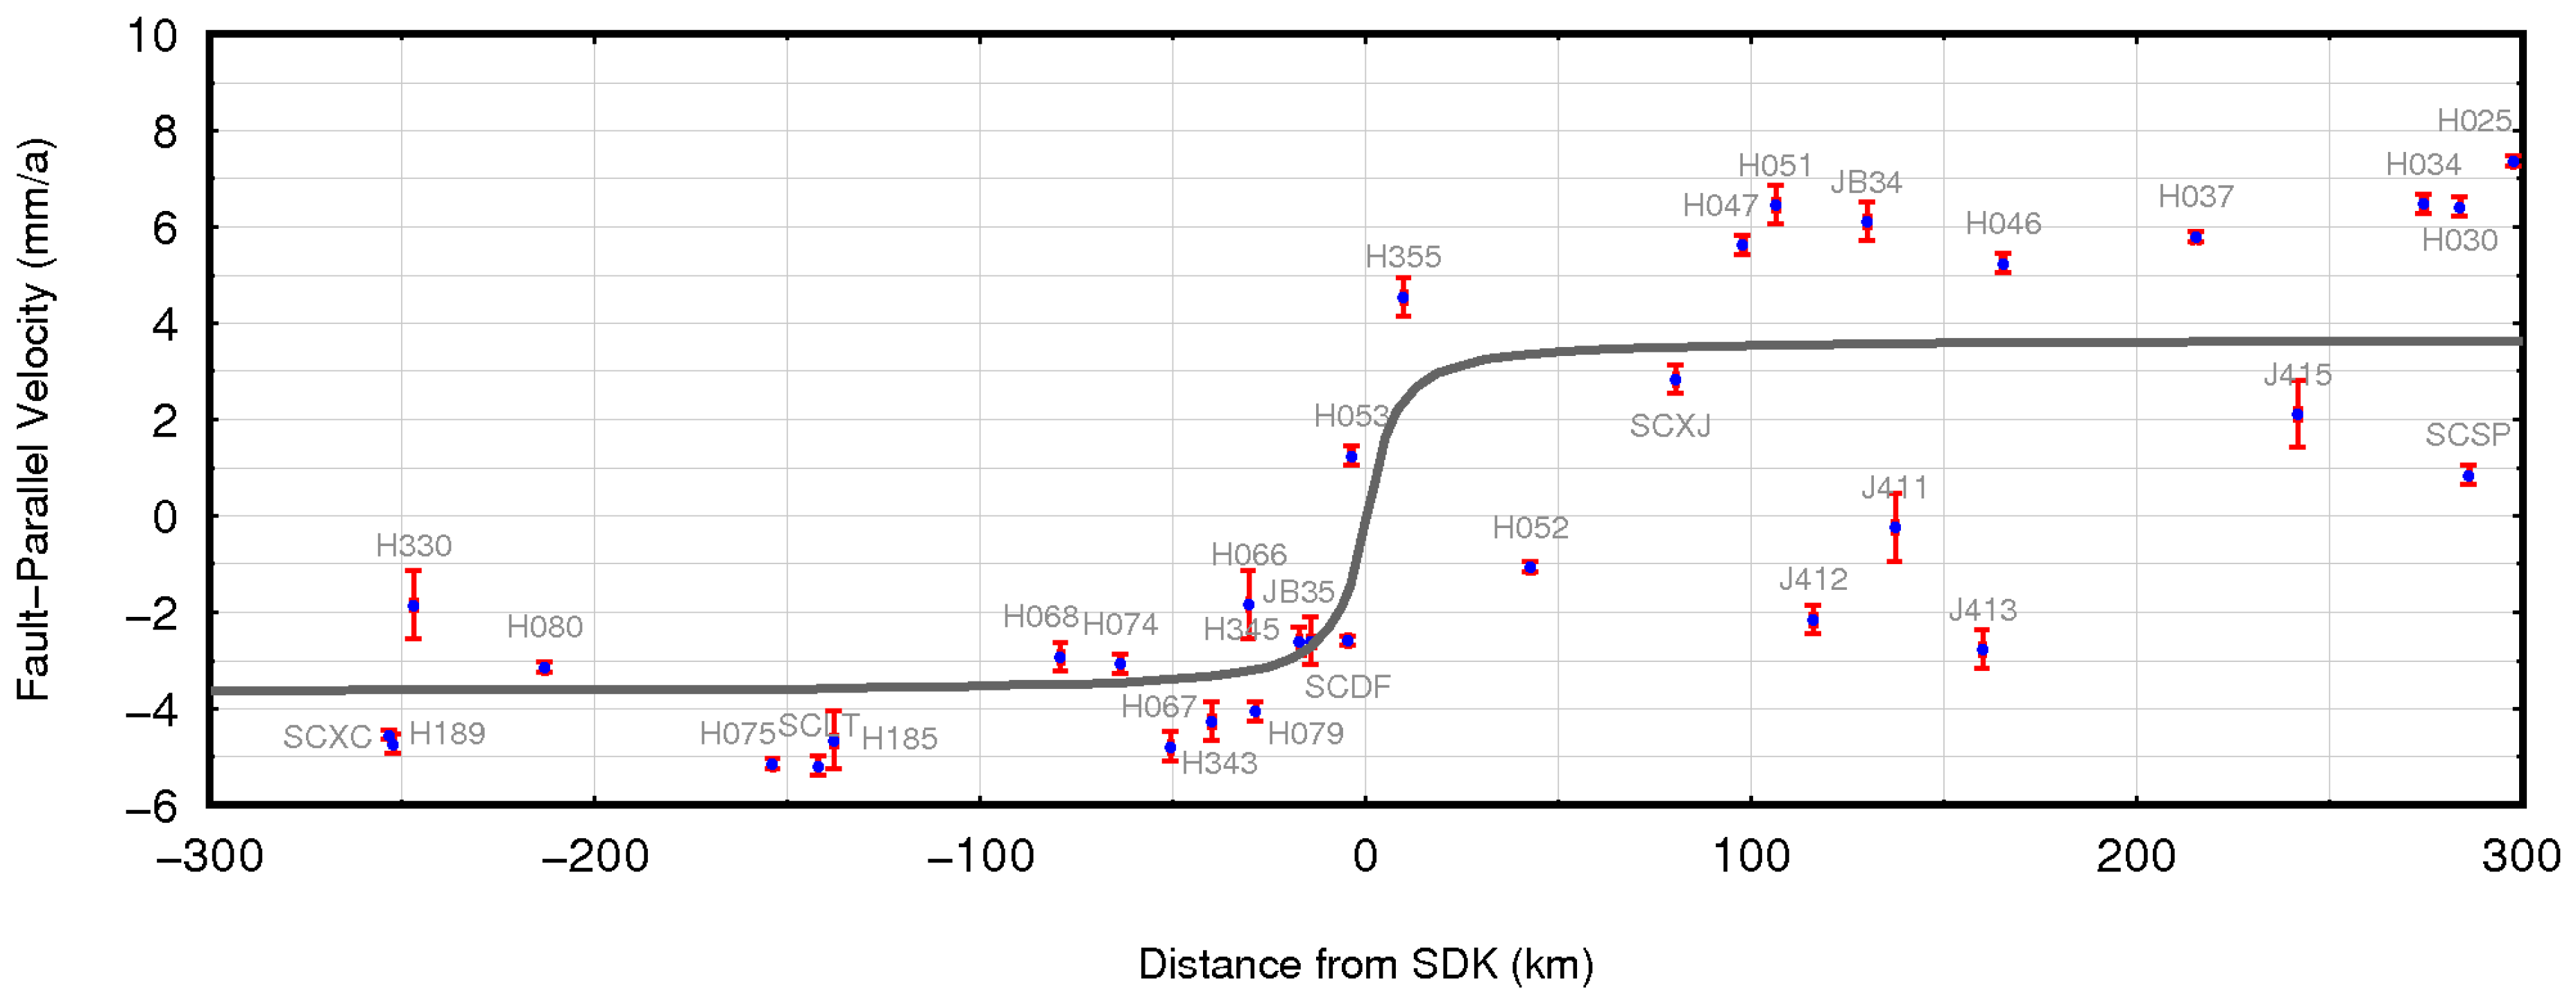
Figure 5 clearly shows that the interseismic fault-parallel surface velocities represent a symmetric pattern, and the fault SDK is accumulating significant elastic strain, as demonstrated by a broad area of high velocity gradients along the fault trace. Here, the locked slip deficit rate of the fault SDK with 7.8 ± 0.4 mm/a is obtained directly from the GPS observations. We have not specified any relationship between them. Therefore, although some creep may have been occurring in the uppermost crust, as evidenced by a steep gradient in the surface trace of the SDK, it does not prevent the accumulation of tectonic stress on the rest of the fault at seismogenic depths [10].
In addition, we find that the current slip rate is close to, but a little smaller than, the published results from geodesy-constrained elastic models and long-term geological investigations (Table S3). Jiang et al. [1] also found similar phenomena. Several studies have also suggested that slip rates inferred from viscoelastic models with geodetic data can be significantly different from those inferred from elastic models [60,61]. In addition, a number of investigators have explored that slip rates may vary with time, leading to the discrepancies between the current geodetic and long-term geological slip rates here and elsewhere [62,63]. Chuang and Johnson [62] suggested that the slip rates along the Garlock fault and Mojave segment of the San Andreas fault inferred from geologic data are a factor of 1.5–2 higher than slip rates inferred from GPS observations. They suggested that it might be related to the interseismic fault creep in the lower crust, and viscous flow in the upper mantle. Papanikolaou et al. [63] found a 2–4 mm/a discrepancy between rates measured over 18 kyr, and those measured over six years using GPS in Lazio–Abruzzo, Central Italy. They speculated that the strain accumulation rate would decelerate during the co-seismic and subsequent interseismic periods. In addition, several models have been developed to try to explain the physical basis for this disagreement, based on the time-dependent effect of viscoelastic relaxation and post-seismic stresses [33,34]. However, it can be reasonably assumed that in recent geological history, the slip rate of geodetic measurements remains relatively constant, especially in the past few decades [10]. In addition, our result is slightly greater than that of Jiang et al. [1]. This may be due to the fact that Jiang et al. [1] used a uniform relatively small viscosity (10 × 1018 Pa·s) throughout the whole asthenosphere, overestimating the effect of viscoelastic relaxation.
4.2. Locking Depth
As aforementioned, the slip rate with 7.8 ± 0.4 mm/a has been derived from geodetic studies, which is merged into the model such that the interseismic fault-parallel slip rate is constant. In addition, the deep slip is assigned a constant amount, which drives the secular interseismic deformation [9,13,52]. The fault segment is locked from the surface to a variable locking depth, D, which is tuned to match the present-day GPS horizontal velocities. Figure 6 shows that the optimal value of locking depth is about 7 km, corresponding to the minimum of the mean square error. Due to the sparse near-field GPS data, the depth uncertainties can be on the order of 1–2 km. Therefore, the result reveals a slip rate of 7.8 ± 0.4 mm/a and a locking depth of 6–9 km, suggesting that the fault SDK is active with a relatively shallow locking depth.
5. Discussion
5.1. Stability of the Relaxation Effect
To estimate the uncertainties of post-seismic deformation, we recalculate the viscoelastic relaxation effect of the Wenchuan earthquake on the fault SDK, using different viscosities of lower crust and upper mantle, effective elastic thickness, and co-seismic slip model. We first try to perform forward modeling with different viscosities. Since we ignore the lateral heterogeneity of the Sichuan Basin and the Tibetan Plateau, we test the average viscosities (lower crust: 2.0 × 10¹⁹ Pa·s; upper mantle: 5.0 × 10¹⁹ Pa·s) from Diao et al. [45], and we find that viscosities do not strongly affect our results (Figure 4b). Jiang et al. [1] and Shan et al. [3] also found similar phenomena. Then we choose a different effective elastic thickness with 14 km to calculate the post-seismic viscoelastic relaxation. The results are reduced slightly, as shown in Figure 4c. Finally, we test the sensitivity of the calculations to changes in the seismic slip model, and find no qualitative impact (Figure 4d). Therefore, we conclude that the uncertainties of different parameters do not significantly influence on our results.
In addition, our result is similar to the viscoelastic relaxation effect in the preferred combining model of Diao et al. [45]. It is smaller than the pure viscoelastic relaxation model, because it ignores the stress-driven afterslip. In order to fit the surface deformation, the viscosity of asthenosphere is reduced, resulting in a large effect of viscoelastic relaxation. Therefore, the results about viscoeslatic relaxation should be reliable.
5.2. Relationship Between Seismicity and Tectonic Structures
In order to verify our inversion results and determine the spatial distribution of small earthquakes along the SDK, we analyze the relocated mainshock and aftershocks of the Kangding earthquake. Here, we do not relocate all earthquakes during the studied period, only combining the relocation of the Kangding seismic sequence [26]; however, this is sufficient to explain the problem. 779 earthquakes are recorded and relocated since the 2014 Mw 5.9 event on 22 November, by using the code HypoDD proposed by Waldhauser and Ellsworth [64]. A dense array of 82 stations is used in the relocation, so that the relocated results are highly accurate [26]. Then, we plot a cross-section of the hypocenter depth distribution along the southern part of SDK (Figure 7b). Our refined hypocenter distribution reveals the SDK seismicity in space on a well-resolved scale. It suggests that almost all earthquakes are concentrated at depths below 7 km, which is perfectly consistent to the locking depth. In addition, in order to detect whether this remains true on a longer time scale, the focal mechanisms of Mw ≥ 4.0 since 1970 are derived with CAP (Cut and Paste) inversions of three-component waveforms [65,66], typically recorded by > 10 stations at regional distances (Figure 7a). The Green function is calculated using the frequency–wavenumber spectrum method [67]. The preferred focal depth of each event is derived by the best waveform match. We also plot a seismic depth profile along the SDK, as shown in Figure 7c, which indicates very few seismicity above 7 km during our studied period. Similar phenomena have also been observed in the Princes Islands segment [6] and the Anninghe fault [19].
5.3. Potential Seismic Hazard along the SDK
To further assess the earthquake potential, the quantities of density ρ and vs are used to derive the shear modulus, G, using the following expression [68]:
Through Equation (2), the shear modulus of the crust is approximately 21 GPa. In addition, we assume that the slip rate in the far-field region is the same as the slip deficit rate on the SDK, to estimate the possible largest earthquake that could occur in the near future. The relationship between the seismic moment accumulation rate, M0, the average slip deficit rate, ṡ, and the fault area, A = (L × D), is as follows [68]:
Solving Equation (3), we estimate the seismic moment rate to be approximately 1.50 × 10¹⁷ N·m/a, which is similar to the result of Jiang et al. [1]. It has been 63 years since the occurrence of the last M ≥ 7.0 earthquake. Thus, we estimate that the slip accumulation (backslip) on the SDK is 0.49 ± 0.02 m, combined with a moment magnitude of approximately 9.45 × 10¹⁸ N·m, which is equivalent to a ~Mw 6.6 earthquake. This can be compared to paleoseismic estimates of the average recurrence period of large events on the fault SDK of 50–150 years, and average co-seismic displacements with 0.37–1.23 m [2]. Though simple time- and size-predictable seismic models have been proved to be inadequate [69,70], and the earthquake recurrence intervals may vary significantly [33], it may be argued that the accumulated slip deficit cannot be much larger than the maximum interseismic displacement recorded throughout the fault history [10]. If so, the fault SDK is probably in the late phase of its interseismic recurrence [10,71,72].
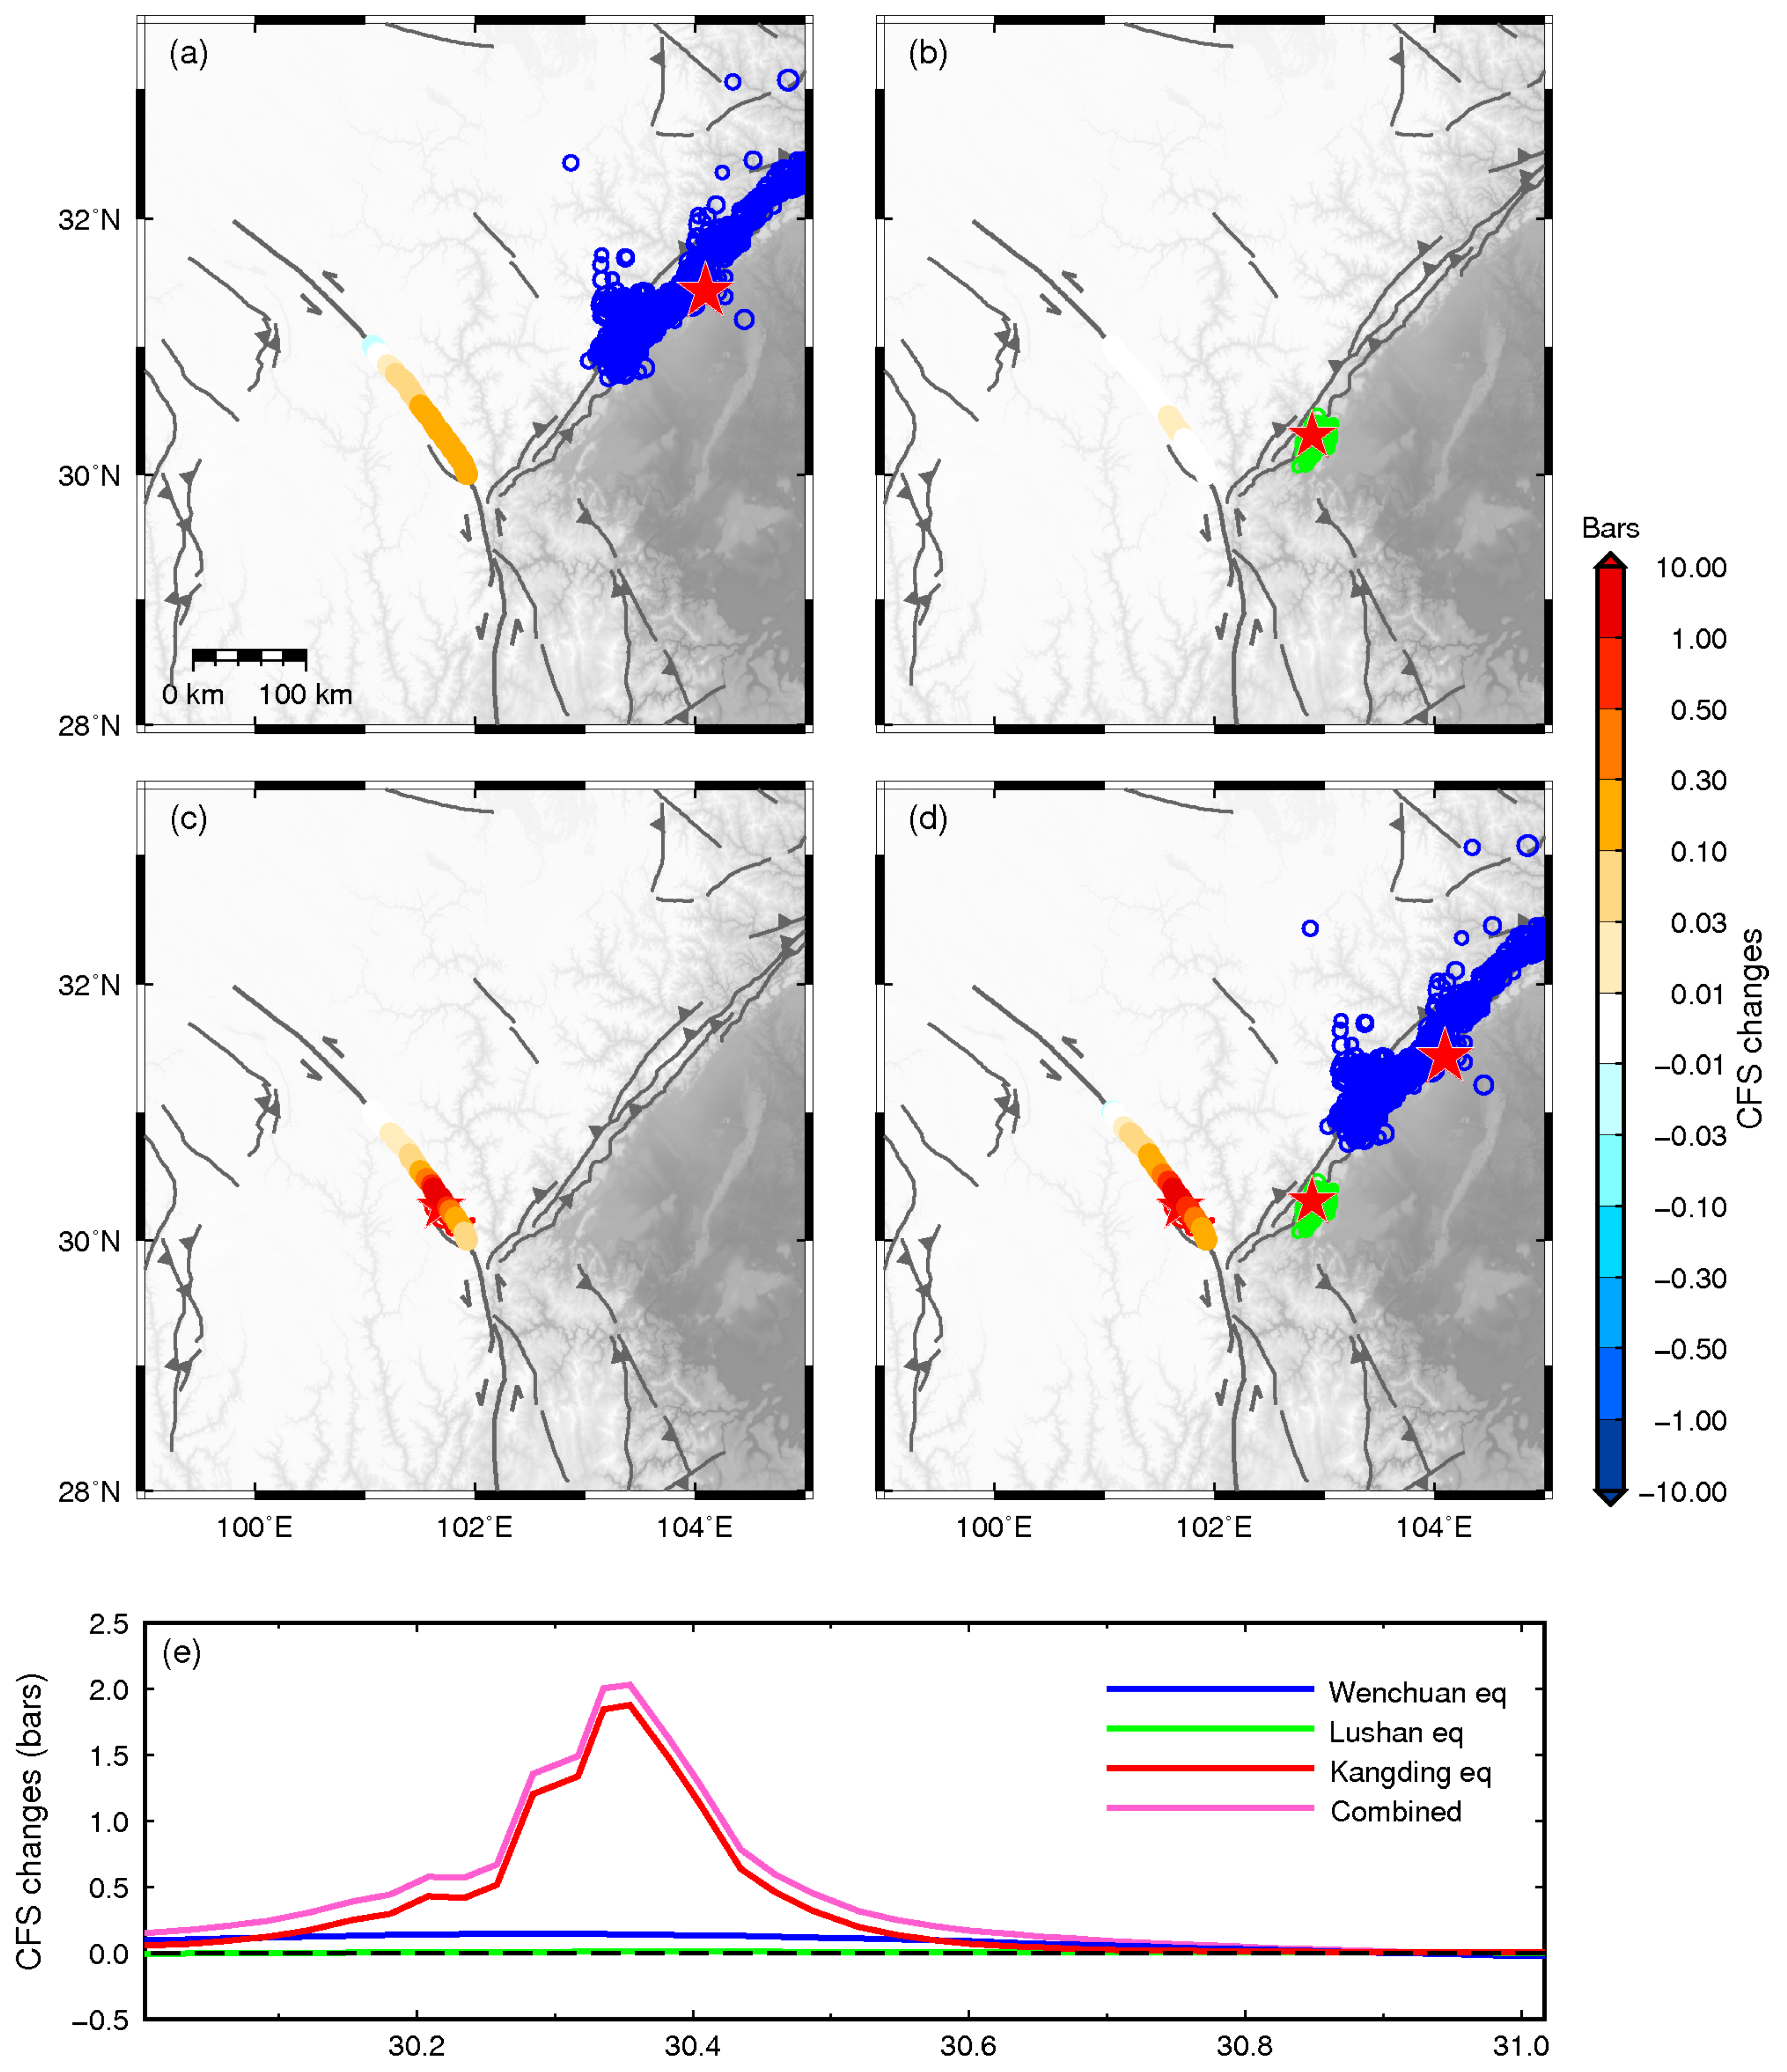
As suggested by Heidbach and Ben-Avraham [73], time-dependent seismic hazards are related to the current stress state of the active fault and its variation over time. The stress loading on the fault comes from two aspects: (1) the long-term tectonic movement of the plates; (2) the co-seismic and post-seismic stress perturbation of the adjacent earthquakes. The aforementioned results only consider the quantitative influence of tectonic loading. Thus, we also consider the CFS [3,23,24,25,52,73] caused by co- and post-seismic relaxation loading of earthquakes on the SDK (Text S2). CFS changes caused by the 2008 Wenchuan, 2013 Lushan, and 2014 Kangding earthquakes are shown in Figure 8a–c, respectively. The Kangding earthquake played a dominant role in the CFS increase of the SDK, followed by the Wenchuan earthquake and Lushan earthquake. Figure 8d illustrates the comprehensive impact of all three earthquakes on the SDK prior to 2018, and Figure 8e intuitively shows the CFS changes caused by earthquakes at different latitudes of the SDK. These results suggest that the maximum CFS increase could reach 2 bars. Shan et al. [3] reported that the sum of historical-earthquake-induced positive CFS on the SDK since 1713 is approximately 8 bars. Thus, the CFS level should have been increased much higher than the average threshold of static triggering (~0.1 bar). So, taking the slip deficit caused by fault locking and the CFS increases on the fault into consideration, the seismic hazard of the SDK is quite high, and is capable of generating an Mw ~6.6 or larger earthquake in the future.
5.4. Limitations
Although the inverted locking depth on the SDK segment of the XXFS is in good consistence with the vertical distribution of moderate to small earthquakes, some simplifications can cause uncertainties with the results. First, we assume that the dip angle of the SDK is near-vertical, so that a 2D screw dislocation model can be applied. In reality, the dip angle always changes with depth, and usually the dip angle decreases with depth; therefore, this assumption could cause some over- or under-estimation for the locking depth. Second, the 2D screw dislocation method assumes that the fault is locked from the surface to depth D, but that it slips by a constant amount below that depth; however, in reality, the locking scale varies in different areas, so that the real locking depth could be even deeper, and the locking scale should be smaller than 100%, so that there are some small earthquakes occurring in the locking areas. Fortunately, the focal mechanism solutions and relocated seismicity all demonstrate that the Xianshuihe fault is a high-dip angle strike slip fault, and the variations of dip angle with depth is small. Therefore, the uncertainties caused by the 2-D screw dislocation method should be small, and they can be neglected. Third, the uncertainties induced by signal decomposition may affect the results. The magnitude of the post-seismic viscoelastic relaxation effect of the 2008 Wenchuan earthquake relied on the viscosities of the lower crust and upper mantle; however, these viscosities are subject to large uncertainties. Fortunately, Jiang et al. [1] and Shan et al. [3] determined the influence of these viscosities, and concluded that a large uncertainty did not significantly affect the final results. Our related tests also show similar conclusions. Of course, the confidence level is confined by sparse near-fault observations. So, overall, the locking depth and the seismic hazard inversed in this work should be reliable and accurate.
6. Conclusions
We process the updated GPS records, and analyze the locking status and potential seismic hazard on the SDK of Xianshuihe fault. The slip deficit rate across the SDK is about 7.8 ± 0.4 mm/a, without the impact of the block motion and past earthquakes. The optimized locking depth for the fault SDK is about 7 km, with a depth range of 6–9 km, which is perfectly consistent with the seismicity pattern along the segment. If all accumulative strains of the SDK since the last major earthquake rupture fully at present, it will release a seismic moment of ~9.45 × 10¹⁸ N·m, which is equivalent to an Mw ~6.6 earthquake. In addition, the CFS on the SDK caused by the 2008 Wenchuan, 2013 Lushan, and 2014 Kangding earthquakes is about 2 bars. Thus, the seismic hazard of the SDK is quite high, and is capable of generating an Mw ~6.6 or larger earthquake in the future.
Supplementary Materials
The following are available online at https://0-www-mdpi-com.brum.beds.ac.uk/2072-4292/10/12/2048/s1, Text S1: Details of the viscoelastic relaxation model, Text S2: Details of the change of Coulomb failure stress model, Figure S1: IGS sites for the ITRF2008 framework, Figure S2: Displacements time series relative to ITRF2008 used in this work, Table S1: GPS stations used in this work, Table S2: GPS velocities used in this work (mm/a), Table S3: The geological and geodetic slip rate of the SDK (mm/a).
Author Contributions
Conceptualization, R.G. and Y.Z.; Methodology, R.G., Y.Z. and W.T.; Software, R.M. and Y.Z.; Validation, Y.Z. and J.X.; Formal analysis, R.G., Y.Z. and W.T.; Investigation, R.G. and W.T.; Resources, Y.Z. and W.Z.; Data curation, J.X. and W.Z.; Writing—original draft preparation, R.G.; Writing—review and editing, R.G., Y.Z. and J.X.; Visualization, R.G. and W.T.; Supervision, Y.Z. and J.X.; Project administration, Y.Z.; Funding acquisition, Y.Z. and J.X.
Funding
This research was funded by the Sichuan–Yunnan national earthquake monitoring and forecasting testing ground project (No. 2016CESE0204), the NSFC grants (No. 41621091, 41574057, 41874053, 41874094, and 41474062), and the fundamental research funds for the central universities, china university of geosciences (Wuhan) (No. 162301132637).
Acknowledgments
We are grateful to Rongjiang Wang from GFZ of the open source PSGRN/PSCMP software for his ongoing dedication to the software development, generous technical support, and very valuable comments. We thank Xinsheng Wang from National Earthquake Infrastructure Service, and Yuebing Wang from the seismic network center of CEA for their help in data processing. Three anonymous reviewers provided valuable comments and suggestions to improve the quality of the revised manuscript. The GPS data shown in this article are available from the Earthquake Engineering Center of China Earthquake Administration. The computation of this work is supported by the high-performance computing platform of the China University of Geosciences.
Conflicts of Interest
The authors declare no conflict of interest.
References
- Jiang, G.; Xu, X.; Chen, G.; Liu, Y.; Fukahata, Y.; Wang, H.; Yu, G.; Tan, X.; Xu, C. Geodetic imaging of potential seismogenic asperities on the Xianshuihe-Anninghe-Zemuhe fault system, southwest China, with a new 3-D viscoelastic interseismic coupling model. J. Geophys. Res. Solid Earth 2015, 120, 1855–1873. [Google Scholar] [CrossRef] [Green Version]
- Wen, X.; Ma, S.; Xu, X.; He, Y. Historical pattern and behavior of earthquake ruptures along the eastern boundary of the Sichuan-Yunnan faulted-block, southwestern China. Phys. Earth Planet. Inter. 2008, 168, 16–36. [Google Scholar] [CrossRef]
- Shan, B.; Xiong, X.; Wang, R.; Zheng, Y.; Yang, S. Coulomb stress evolution along Xianshuihe–Xiaojiang Fault System since 1713 and its interaction with Wenchuan earthquake, May 12, 2008. Earth Planet. Sci. Lett. 2013, 377, 199–210. [Google Scholar] [CrossRef]
- Zhao, J.; Jiang, Z.; Niu, A.; Liu, J.; Wu, Y.; Wei, W.; Liu, X.; Yan, W. Study on dynamic characteristics of fault locking and fault slip deficit in the eastern boundary of the Sichuan-Yunnan rhombic block. Chin. J. Geophys. 2015, 58, 872–885. [Google Scholar]
- Shen, Z.-K.; Lü, J.; Wang, M.; Bürgmann, R. Contemporary crustal deformation around the southeast borderland of the Tibetan Plateau. J. Geophys. Res. Solid Earth 2005, 110. [Google Scholar] [CrossRef] [Green Version]
- Bohnhoff, M.; Bulut, F.; Dresen, G.; Malin, P.E.; Eken, T.; Aktar, M. An earthquake gap south of Istanbul. Nat. Commun. 2013, 4, 1999. [Google Scholar] [CrossRef] [PubMed] [Green Version]
- Diao, F.; Walter, T.R.; Solaro, G.; Wang, R.; Bonano, M.; Manzo, M.; Ergintav, S.; Zheng, Y.; Xiong, X.; Lanari, R. Fault locking near Istanbul: Indication of earthquake potential from InSAR and GPS observations. Geophys. J. Int. 2016, 205, 490–498. [Google Scholar] [CrossRef]
- Motagh, M.; Hoffmann, J.; Kampes, B.; Baes, M.; Zschau, J. Strain accumulation across the Gazikoy–Saros segment of the North Anatolian Fault inferred from Persistent Scatterer Interferometry and GPS measurements. Earth Planet. Sci. Lett. 2007, 255, 432–444. [Google Scholar] [CrossRef]
- Savage, J.C.; Burford, R.O. Geodetic determination of relative plate motion in central California. J. Geophys. Res. 1973, 78, 832–845. [Google Scholar] [CrossRef]
- Fialko, Y. Interseismic strain accumulation and the earthquake potential on the southern San Andreas fault system. Nature 2006, 441, 968–971. [Google Scholar] [CrossRef] [Green Version]
- Loveless, J.P.; Meade, B.J. Stress modulation on the San Andreas fault by interseismic fault system interactions. Geology 2011, 39, 1035–1038. [Google Scholar] [CrossRef]
- Lyons, S.; Sandwell, D. Fault creep along the southern San Andreas from interferometric synthetic aperture radar, permanent scatterers, and stacking. J. Geophys. Res. Solid Earth 2003, 108. [Google Scholar] [CrossRef] [Green Version]
- Smith-Konter, B.R.; Sandwell, D.T.; Shearer, P. Locking depths estimated from geodesy and seismology along the San Andreas Fault System: Implications for seismic moment release. J. Geophys. Res. Solid Earth 2011, 116. [Google Scholar] [CrossRef] [Green Version]
- Bos, A.G.; Spakman, W. Kinematics of the southwestern US deformation zone inferred from GPS motion data. J. Geophys. Res. Solid Earth 2005, 110. [Google Scholar] [CrossRef]
- Li, H.; Su, W.; Wang, C.-Y.; Huang, Z. Ambient noise Rayleigh wave tomography in western Sichuan and eastern Tibet. Earth Planet. Sci. Lett. 2009, 282, 201–211. [Google Scholar] [CrossRef]
- Zhang, X.; Wang, Y. Crustal and upper mantle velocity structure in Yunnan, Southwest China. Tectonophysics 2009, 471, 171–185. [Google Scholar] [CrossRef] [Green Version]
- Papadimitriou, E.; Wen, X.; Karakostas, V.; Jin, X. Earthquake triggering along the Xianshuihe fault zone of western Sichuan, China. Pure Appl. Geophys. 2004, 161, 1683–1707. [Google Scholar] [CrossRef]
- Paradisopoulou, P.; Garlaouni, C.; Jin, X.; Papadimitriou, E.; Karakostas, V.; Yang, J. Application of the stress evolutionary model along the Xiaojiang fault zone in Yunnan Province, Southeast China. Acta Geophys. 2007, 55, 577–593. [Google Scholar] [CrossRef]
- Wen, X.; Fan, J.; Yi, G.; Deng, Y.; Long, F. A seismic gap on the Anninghe fault in western Sichuan, China. Sci. China Ser. D 2008, 51, 1375–1387. [Google Scholar] [CrossRef]
- Yi, G.-X.; Wen, X.-Z.; Su, Y.-J. Study on the potential strong-earthquake risk for the eastern boundary of the Sichuan-Yunnan active faulted-block, China. Chin. J. Geophys. 2008, 51, 1151–1158. [Google Scholar] [CrossRef]
- Allen, C.R.; Zhuoli, L.; Hong, Q.; Xueze, W.; Huawei, Z.; Weishi, H. Field study of a highly active fault zone: The Xianshuihe fault of southwestern China. Geol. Soc. Am. Bull. 1991, 103, 1178–1199. [Google Scholar] [CrossRef]
- Jiang, G.; Xu, C.; Wen, Y.; Xu, X.; Ding, K.; Wang, J. Contemporary tectonic stressing rates of major strike-slip faults in the Tibetan Plateau from GPS observations using least-squares collocation. Tectonophysics 2014, 615, 85–95. [Google Scholar] [CrossRef]
- Parsons, T.; Ji, C.; Kirby, E. Stress changes from the 2008 Wenchuan earthquake and increased hazard in the Sichuan basin. Nature 2008, 454, 509–510. [Google Scholar] [CrossRef] [PubMed]
- Shan, B.; Xiong, X.; Zheng, Y.; Diao, F. Stress changes on major faults caused by Mw 7.9 Wenchuan earthquake, May 12, 2008. Sci China Ser. D 2009, 52, 593–601. [Google Scholar] [CrossRef]
- Toda, S.; Lin, J.; Meghraoui, M.; Stein, R.S. 12 May 2008 M = 7.9 Wenchuan, China, earthquake calculated to increase failure stress and seismicity rate on three major fault systems. Geophys. Res. Lett. 2008, 35. [Google Scholar] [CrossRef] [Green Version]
- Jiang, G.; Wen, Y.; Liu, Y.; Xu, X.; Fang, L.; Chen, G.; Gong, M.; Xu, C. Joint analysis of the 2014 Kangding, southwest China, earthquake sequence with seismicity relocation and InSAR inversion. Geophys. Res. Lett. 2015, 42, 3273–3281. [Google Scholar] [CrossRef] [Green Version]
- Huai, Y.; Zhang, Y.; Zhu, Y.; Jiang, Y.; Yang, Z. Study on slip velocity of the Xianshuihe fault zone before and after the Kangding earthquake. Prog. Geophys. 2017, 32, 41–47. [Google Scholar]
- Zhang, P.-Z. A review on active tectonics and deep crustal processes of the Western Sichuan region, eastern margin of the Tibetan Plateau. Tectonophysics 2013, 584, 7–22. [Google Scholar] [CrossRef]
- Roger, F.; Calassou, S.; Lancelot, J.; Malavieille, J.; Mattauer, M.; Zhiqin, X.; Ziwen, H.; Liwei, H. Miocene emplacement and deformation of the Konga Shan granite (Xianshui He fault zone, west Sichuan, China): Geodynamic implications. Earth Planet. Sci. Lett. 1995, 130, 201–216. [Google Scholar] [CrossRef]
- Chen, G.; Xu, X.; Wen, X.; Wang, Y. Kinematical transformation and slip partitioning of northern to eastern active boundary belt of sichuan—Yunnan block. Seism. Geol. 2008, 30, 58–85. [Google Scholar]
- Liang, S.; Gan, W.; Shen, C.; Xiao, G.; Liu, J.; Chen, W.; Ding, X.; Zhou, D. Three-dimensional velocity field of present-day crustal motion of the Tibetan Plateau derived from GPS measurements. J. Geophys. Res. Solid Earth 2013, 118, 5722–5732. [Google Scholar] [CrossRef] [Green Version]
- Zhang, P.-Z.; Shen, Z.; Wang, M.; Gan, W.; Bürgmann, R.; Molnar, P.; Wang, Q.; Niu, Z.; Sun, J.; Wu, J. Continuous deformation of the Tibetan Plateau from global positioning system data. Geology 2004, 32, 809–812. [Google Scholar] [CrossRef]
- Kenner, S.J.; Simons, M. Temporal clustering of major earthquakes along individual faults due to post-seismic reloading. Geophys. J. Int. 2005, 160, 179–194. [Google Scholar] [CrossRef]
- Lynch, J.C.; Bürgmann, R.; Richards, M.A.; Ferencz, R.M. When faults communicate: Viscoelastic coupling and earthquake clustering in a simple two-fault system. Geophys. Res. Lett. 2003, 30. [Google Scholar] [CrossRef] [Green Version]
- Wang, Y.; Wang, E.; Shen, Z.; Wang, M.; Gan, W.; Qiao, X.; Meng, G.; Li, T.; Tao, W.; Yang, Y. GPS-constrained inversion of present-day slip rates along major faults of the Sichuan-Yunnan region, China. Sci. China Ser. D 2008, 51, 1267. [Google Scholar] [CrossRef]
- Zhijun, N.; Min, W.; Hanrong, S.; Jianzhong, S.; Xinzhao, Y.; Weijun, G.; Guijiang, X.; Jinxin, H.; Shaohua, X.; Yongqing, W. Contemporary velocity field of crustal movement of Chinese mainland from Global Positioning System measurements. Chin. Sci. Bull. 2005, 50, 939–941. [Google Scholar] [CrossRef]
- Gan, W.; Li, Q.; Zhang, R.; Shi, H.B. Construction and application of tectonics and environmental observation network of mainland China. J. Eng. Stud. 2012, 4, 324–331. [Google Scholar]
- Gan, W.; Zhang, P.; Shen, Z.-K.; Niu, Z.; Wang, M.; Wan, Y.; Zhou, D.; Cheng, J. Present-day crustal motion within the Tibetan Plateau inferred from GPS measurements. J. Geophys. Res. Solid Earth 2007, 112. [Google Scholar] [CrossRef] [Green Version]
- Böhm, J.; Heinkelmann, R.; Schuh, H. Short note: A global model of pressure and temperature for geodetic applications. J. Geodesy 2007, 81, 679–683. [Google Scholar] [CrossRef]
- Böhm, J.; Niell, A.; Tregoning, P.; Schuh, H. Global Mapping Function (GMF): A new empirical mapping function based on numerical weather model data. Geophys. Res. Lett. 2006, 33. [Google Scholar] [CrossRef] [Green Version]
- McCarthy, D.D.; Petit, G. IERS Conventions (2003); International Earth Rotation and Reference Systems Service (IERS): Frankfurt am Main, Germany, 2004. [Google Scholar]
- Altamimi, Z.; Métivier, L.; Collilieux, X. ITRF2008 plate motion model. J. Geophys. Res. Solid Earth 2012, 117. [Google Scholar] [CrossRef] [Green Version]
- Johnson, K.M.; Fukuda, J. New methods for estimating the spatial distribution of locked asperities and stress-driven interseismic creep on faults with application to the San Francisco Bay Area, California. J. Geophys. Res. Solid Earth 2010, 115. [Google Scholar] [CrossRef] [Green Version]
- Zhang, G.; Qu, C.; Shan, X.; Song, X.; Zhang, G.; Wang, C.; Hu, J.-C.; Wang, R. Slip distribution of the 2008 Wenchuan Ms 7.9 earthquake by joint inversion from GPS and InSAR measurements: A resolution test study. Geophys. J. Int. 2011, 186, 207–220. [Google Scholar] [CrossRef]
- Diao, F.; Wang, R.; Wang, Y.; Xiong, X.; Walter, T.R. Fault behavior and lower crustal rheology inferred from the first seven years of postseismic GPS data after the 2008 Wenchuan earthquake. Earth Planet. Sci. Lett. 2018, 495, 202–212. [Google Scholar] [CrossRef]
- Xu, X.; Wen, X.; Yu, G.; Chen, G.; Klinger, Y.; Hubbard, J.; Shaw, J. Coseismic reverse-and oblique-slip surface faulting generated by the 2008 Mw 7.9 Wenchuan earthquake, China. Geology 2009, 37, 515–518. [Google Scholar] [CrossRef]
- Jiang, Z.; Yuan, L.; Huang, D.; Yang, Z.; Chen, W. Postseismic deformation associated with the 2008 Mw 7.9 Wenchuan earthquake, China: Constraining fault geometry and investigating a detailed spatial distribution of afterslip. J. Geodyn. 2017, 112, 12–21. [Google Scholar] [CrossRef]
- Diao, F.; Xiong, X.; Wang, R.; Zheng, Y.; Hsu, H. Slip model of the 2008 Mw 7.9 Wenchuan (China) earthquake derived from co-seismic GPS data. Earth Planets Space 2010, 62, 869–874. [Google Scholar] [CrossRef]
- Guo, R.; Zheng, Y.; Diao, F.; Xiong, X.; Xu, J. Rupture model of the 2013 Mw 6.6 Lushan (China) earthquake constrained by new GPS data set and its effects on potential seismic hazard. Earthq. Sci. 2018, 31, 117–125. [Google Scholar]
- Jiang, Z.; Wang, M.; Wang, Y.; Wu, Y.; Che, S.; Shen, Z.-K.; Bürgmann, R.; Sun, J.; Yang, Y.; Liao, H. GPS constrained coseismic source and slip distribution of the 2013 Mw 6.6 Lushan, China, earthquake and its tectonic implications. Geophys. Res. Lett. 2014, 41, 407–413. [Google Scholar] [CrossRef]
- Xie, Z.; Zheng, Y.; Liu, C.; Shan, B.; Riaz, M.S.; Xiong, X. An integrated analysis of source parameters, seismogenic structure, and seismic hazards related to the 2014 MS 6.3 Kangding earthquake, China. Tectonophysics 2017, 712–713, 1–9. [Google Scholar] [CrossRef]
- Freed, A.M.; Ali, S.T.; Bürgmann, R. Evolution of stress in Southern California for the past 200 years from coseismic, postseismic and interseismic stress changes. Geophys. J. Int. 2007, 169, 1164–1179. [Google Scholar] [CrossRef] [Green Version]
- Wang, R.; Lorenzo-Martín, F.; Roth, F. PSGRN/PSCMP—A new code for calculating co-and post-seismic deformation, geoid and gravity changes based on the viscoelastic-gravitational dislocation theory. Comput. Geosci. 2006, 32, 527–541. [Google Scholar] [CrossRef]
- Zhu, A.-L.; Xu, X.-W.; Zhou, Y.-S.; Yin, J.-Y.; Gan, W.-J.; Chen, G.-H. Relocation of Small EarthquakesiIn Western Sichuan, China and Its Implications for Active Tectonics. Chin. J. Geophys. 2005, 48, 692–700. [Google Scholar] [CrossRef]
- Shi, Y.; Cao, J. Lithosphere effective viscosity of continental China. Earth Sci. Front. 2008, 15, 82–95. [Google Scholar] [CrossRef]
- Weertman, J.; Weertman, J.R. Elementary Dislocation Theory; Oxford University Press: Oxford, UK, 1966. [Google Scholar]
- Segall, P. Earthquake and Volcano Deformation; Princeton University Press: Princeton, NJ, USA, 2010. [Google Scholar]
- Wang, H.; Wright, T.J.; Biggs, J. Interseismic slip rate of the northwestern Xianshuihe fault from InSAR data. Geophys. Res. Lett. 2009, 36. [Google Scholar] [CrossRef] [Green Version]
- Savage, J.C.; Burford, R.O. Accumulation of tectonic strain in California. Bull. Seism. Soc. Am. 1970, 60, 1877–1896. [Google Scholar]
- Friedrich, A.M.; Wernicke, B.P.; Niemi, N.A.; Bennett, R.A.; Davis, J.L. Comparison of geodetic and geologic data from the Wasatch region, Utah, and implications for the spectral character of Earth deformation at periods of 10 to 10 million years. J. Geophys. Res. Solid Earth 2003, 108. [Google Scholar] [CrossRef] [Green Version]
- Dolan, J.F.; Bowman, D.D.; Sammis, C.G. Long-range and long-term fault interactions in Southern California. Geology 2007, 35, 855–858. [Google Scholar] [CrossRef]
- Chuang, R.Y.; Johnson, K.M. Reconciling geologic and geodetic model fault slip-rate discrepancies in Southern California: Consideration of nonsteady mantle flow and lower crustal fault creep. Geology 2011, 39, 627–630. [Google Scholar] [CrossRef]
- Papanikolaou, I.D.; Roberts, G.P.; Michetti, A.M. Fault scarps and deformation rates in Lazio–Abruzzo, Central Italy: Comparison between geological fault slip-rate and GPS data. Tectonophysics 2005, 408, 147–176. [Google Scholar] [CrossRef]
- Waldhauser, F.; Ellsworth, W.L. A double-difference earthquake location algorithm: Method and application to the northern Hayward fault, California. Bull. Seism. Soc. Am. 2000, 90, 1353–1368. [Google Scholar] [CrossRef]
- Zhao, L.-S.; Helmberger, D.V. Source estimation from broadband regional seismograms. Bull. Seism. Soc. Am. 1994, 84, 91–104. [Google Scholar]
- Zhu, L.; Helmberger, D.V. Advancement in source estimation techniques using broadband regional seismograms. Bull. Seism. Soc. Am. 1996, 86, 1634–1641. [Google Scholar]
- Zhu, L.; Rivera, L.A. A note on the dynamic and static displacements from a point source in multilayered media. Geophys. J. Int. 2002, 148, 619–627. [Google Scholar] [CrossRef] [Green Version]
- Aki, K.; Richards, P.G. Quantitative Seismology; University Science Books: Sausalito, CA, USA, 2002. [Google Scholar]
- Murray, J.; Segall, P. Testing time-predictable earthquake recurrence by direct measurement of strain accumulation and release. Nature 2002, 419, 287. [Google Scholar] [CrossRef] [PubMed]
- Weldon, R.; Scharer, K.; Fumal, T.; Biasi, G. Wrightwood and the earthquake cycle: What a long recurrence record tells us about how faults work. GSA Today 2004, 14, 4–10. [Google Scholar] [CrossRef]
- Bennett, R.A.; Rodi, W.; Reilinger, R.E. Global Positioning System constraints on fault slip rates in southern California and northern Baja, Mexico. J. Geophys. Res. Solid Earth 1996, 101, 21943–21960. [Google Scholar] [CrossRef]
- Weldon, R.J.; Fumal, T.E.; Biasi, G.P.; Scharer, K.M. Past and future earthquakes on the San Andreas fault. Science 2005, 308, 966–967. [Google Scholar] [CrossRef] [PubMed]
- Heidbach, O.; Ben-Avraham, Z. Stress evolution and seismic hazard of the Dead Sea fault system. Earth Planet. Sci. Lett. 2007, 257, 299–312. [Google Scholar] [CrossRef]
Figure 1.
Seismogenic environment and historical earthquakes of the segment of the Xianshuihe fault between Daofu County and Kangding City (SDK). The colored line represents the SDK trace, solid black lines represent faults along the Xianshuihe–Xiaojiang fault system (XXFS), and gray lines denote the active boundary faults in the region. Red stars and black beachballs represent the epicenters and focal mechanisms of the 2008 Mw 7.9 Wenchuan earthquake, the 2013 Mw 6.6 Lushan earthquake, and the 2014 Mw 6.2 Kangding earthquake, respectively. Blue beachballs indicate the focal mechanisms of historical earthquake with M ≥ 7 (adapted from [3]). Yellow circles show cities in this region. Red, green, and blue circles show the aftershocks of the Kangding, Lushan, and Wenchuan earthquakes, respectively. Gray dots indicate earthquakes with Mw > 2.0 since October 2008. A–A’ represents our studied region. B–B’ and C–C’ represent the earthquake depth profiles for the following cross-section views. TR: Tarim Basin; NC: North China; TB: Tibet; SC: South China.

Figure 2.
Distribution of global positioning system (GPS) stations across the SDK. Red and green triangles represent the stations used by Jiang et al. [1] and added stations, respectively. Blue arrows with error ellipses of 95% confidence represent interseismic GPS velocities relative to the stable Eurasian plate. A–A’ represents our studied region.

Figure 3.
Viscoelastic layered model used in this study. Vp is the P wave velocity, Vs is the S wave velocity, and ρ is the density. The viscosities of the lower crust and upper mantle are set at 1.0 × 10¹⁹ Pa·s and 1.0 × 10²⁰ Pa·s, respectively.
Figure 3.
Viscoelastic layered model used in this study. Vp is the P wave velocity, Vs is the S wave velocity, and ρ is the density. The viscosities of the lower crust and upper mantle are set at 1.0 × 10¹⁹ Pa·s and 1.0 × 10²⁰ Pa·s, respectively.

Figure 4.
Cumulative post-seismic relaxation effect and slip model of the 2008 Mw 7.9 Wenchuan earthquake. The model with (a) original parameters; (b) different viscosities of lower crust (2.0 × 10¹⁹ Pa·s) and upper mantle (5.0 × 10¹⁹ Pa·s); (c) different effective elastic thickness (14 km); and (d) different slip model (Diao et al. [48]). Blue arrows indicate the impact of the earthquakes in the studied region, and the red star represents its epicenter.

Figure 5.
GPS horizontal fault-parallel velocities across the SDK. The gray line is the optimal fit curve. Blue points represent the fault-parallel velocities. The bars denote the σ error of the point measurements.
Figure 5.
GPS horizontal fault-parallel velocities across the SDK. The gray line is the optimal fit curve. Blue points represent the fault-parallel velocities. The bars denote the σ error of the point measurements.

Figure 6.
Relationship between the mean square error and the locking depth.

Figure 7.
Seismicity along the SDK. (a) Red points show the aftershock distribution of the 2014 Kangding earthquake. Blue beachballs indicate the focal mechanisms of historical earthquakes (Mw ≥ 4.0) since 1970; (b) Relocated aftershock hypocenters of the Kangding earthquake are color coded with source depth. The dashed line indicates the estimated locking depth; (c) Depth profile of historical earthquakes along profile C–C’.

Figure 8.
Coulomb failure stress (CFS) changes on the SDK caused by strong earthquakes (co- and post-seismic viscoelastic relaxation effects) prior to 2018 (red stars indicate earthquake epicenters). (a) The 2008 Mw 7.9 Wenchuan earthquake. Blue circles represent aftershocks; (b) The 2013 Mw 6.6 Lushan earthquake. Green circles represent aftershocks; (c) The 2014 Mw 6.2 Kangding earthquake. Red circles represent aftershocks; (d) Combined effects of the Wenchuan, Lushan, and Kangding earthquakes; (e) Stress accumulation caused by strong earthquakes prior to 2018 along the SDK.

© 2018 by the authors. Licensee MDPI, Basel, Switzerland. This article is an open access article distributed under the terms and conditions of the Creative Commons Attribution (CC BY) license (http://creativecommons.org/licenses/by/4.0/).
Share and Cite
MDPI and ACS Style
Guo, R.; Zheng, Y.; Tian, W.; Xu, J.; Zhang, W. Locking Status and Earthquake Potential Hazard along the Middle-South Xianshuihe Fault. Remote Sens. 2018, 10, 2048. https://0-doi-org.brum.beds.ac.uk/10.3390/rs10122048
AMA Style
Guo R, Zheng Y, Tian W, Xu J, Zhang W. Locking Status and Earthquake Potential Hazard along the Middle-South Xianshuihe Fault. Remote Sensing. 2018; 10(12):2048. https://0-doi-org.brum.beds.ac.uk/10.3390/rs10122048
Chicago/Turabian StyleGuo, Rumeng, Yong Zheng, Wen Tian, Jianqiao Xu, and Wenting Zhang. 2018. "Locking Status and Earthquake Potential Hazard along the Middle-South Xianshuihe Fault" Remote Sensing 10, no. 12: 2048. https://0-doi-org.brum.beds.ac.uk/10.3390/rs10122048
Note that from the first issue of 2016, this journal uses article numbers instead of page numbers. See further details here.