2D vs. 3D Change Detection Using Aerial Imagery to Support Crisis Management of Large-Scale Events


1
Remote Sensing Technology Institute, German Aerospace Center, Muenchener Str. 20, 82234 Wessling, Germany
2
German Remote Sensing Data Center, German Aerospace Center, Muenchener Str. 20, 82234 Wessling, Germany
*
Author to whom correspondence should be addressed.
Remote Sens. 2018, 10(12), 2054; https://0-doi-org.brum.beds.ac.uk/10.3390/rs10122054
Submission received: 16 October 2018
/
Revised: 9 December 2018
/
Accepted: 11 December 2018
/
Published: 17 December 2018
(This article belongs to the Special Issue Earth Observation to Support Disaster Preparedness and Disaster Risk Management)
Abstract
:Large-scale events represent a special challenge for crisis management. To ensure that participants can enjoy an event safely and carefree, it must be comprehensively prepared and attentively monitored. Remote sensing can provide valuable information to identify potential risks and take appropriate measures in order to prevent a disaster, or initiate emergency aid measures as quickly as possible in the event of an emergency. Especially, three-dimensional (3D) information that is derived using photogrammetry can be used to analyze the terrain and map existing structures that are set up at short notice. Using aerial imagery acquired during a German music festival in 2016 and the celebration of the German Protestant Church Assembly of 2017, the authors compare two-dimensional (2D) and novel fusion-based 3D change detection methods, and discuss their suitability for supporting large-scale events during the relevant phases of crisis management. This study serves to find out what added value the use of 3D change information can provide for on-site crisis management. Based on the results, an operational, fully automatic processor for crisis management operations and corresponding products for end users can be developed.
1. Introduction
Remote sensing data has long been used in various areas of crisis management, be it risk or vulnerability analyses, early warning, or damage assessment [1,2,3]. With the increasing availability and quality of remote sensing data, the procedures for the derivation of 3D information are becoming faster; at the same time, they can produce more accurate and reliable results. As a result, more and more fields of application are opening up for operational use, and civil protection actors also discover potential applications for their work [4,5,6]. As with remote sensing data in general, applications for derived 3D information can be found in all of the classical phases of disaster and crisis management [7]. During the preparation phase, surface and building models can be included in analysis and planning processes. Examples would be the modeling of explosions and their impact and consequences, the assessment of flood risks, and correspondingly adapted evacuation or site planning [6,8,9]. Furthermore, the observation and research of slope movements gives insights for possible early warning systems [10,11,12]. Another aspect is the use of 3D worlds for the preparation and training of task forces [13]. After a disaster has struck or the crisis has begun, rapid relief must be provided. This requires a common operational picture with accurate, reliable, and up-to-date spatial information [7]. The situation must be assessed promptly, comprehensively, and in detail so that emergency forces and resources can be deployed efficiently. Damaged structures can be recorded and assessed by experts, damage analyses, e.g., after earthquakes, provide information on the degree of debris and possible obstacles on access roads, as well as damages to the infrastructure, which can be used for planning alternative routes [14,15,16]. In the aftermath of the event, reconstruction measures can be accompanied by continuous monitoring and using 3D change detection techniques [17].
1.1. 3D Data from Optical Remote Sensing for Crisis and Event Management
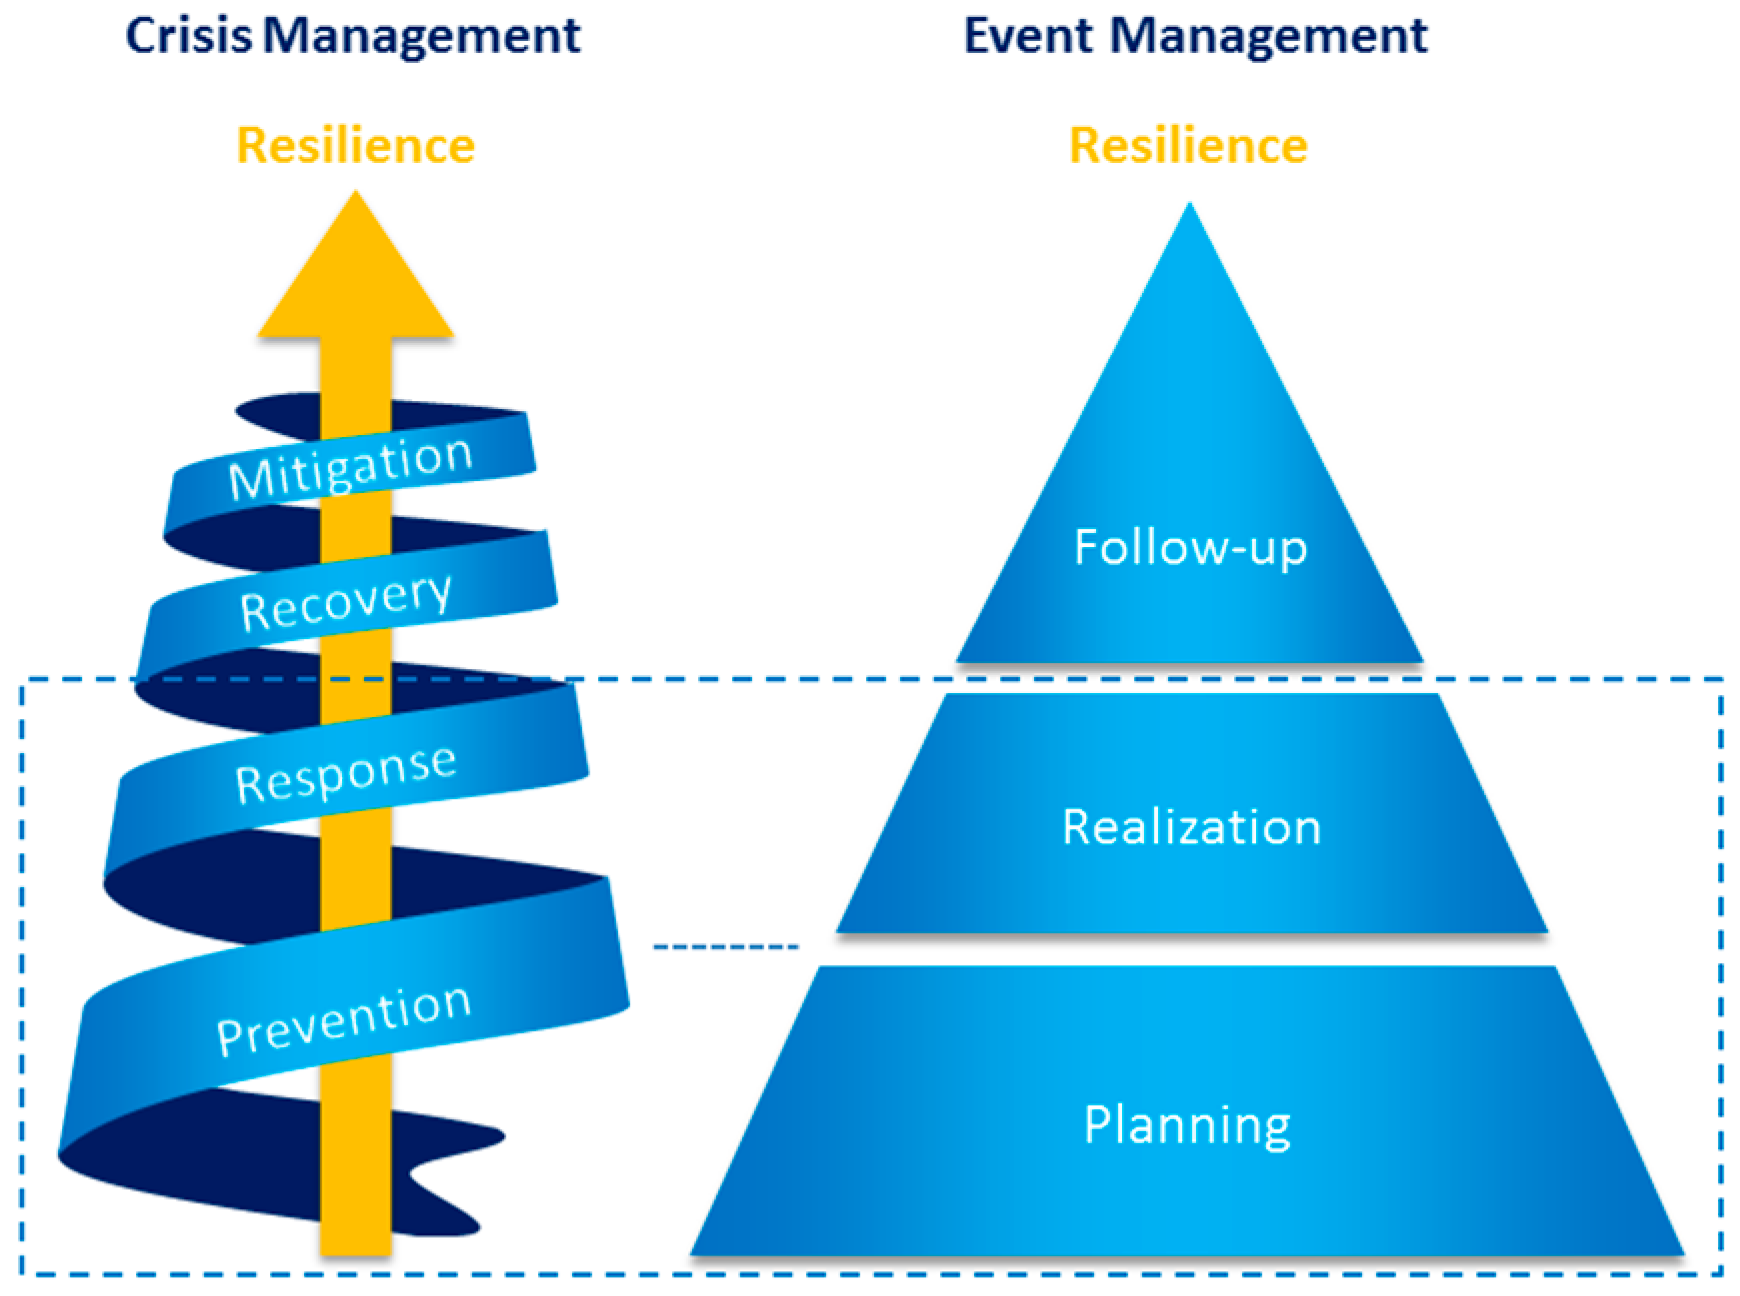
Event management can be divided into comparable main phases: planning, realization and follow-up [18] (see Figure 1). To ensure the safety of all of the participants, great effort is invested both during the planning phase and during the realization of a major event in order to identify hazards at an early stage and minimize the risks for those involved, which is in line with the preparation phase of crisis management. During the planning phase, indicators such as the height of the terrain, slopes, or depressions with a possible risk of waterlogging facilitate the routing, as well as the planning of necessary building and fastening materials. In preparation for missions, the derivation of a surface model shortly before or even during the event would make it possible to assess even temporary constructions on site, and help emergency forces prepare [13]. During the event, it is important to maintain an overview of the site and its utilization capacity [19]. The capacity (number of persons) is valuable information when it comes to the organization of supply and evacuation measures. Another main interest is access routes to the event area and the rescue lanes within the area. Automatic measurements of traffic parameters can provide comprehensive information on how delays occur, and which routes could be suitable alternative options [20]. 3D information of remote sensing data can cover large areas and can provide valuable input to improve automatic vehicle detection and classification, identify obstacles on access routes, as well as estimate the number of people on site [21]. The added value of 3D change information is to be examined in more detail in the context of this work.
A further reason for the investigation of major events is the potential transferability to civil security or defense scenarios. In case of armed conflicts, there can be a large number of refugees who are outside the urban supply infrastructure and only have temporary accommodation at their disposal. Nevertheless, their care and security must be ensured. Thus, tools for estimating the number of persons on site, as well as possibilities for crisis management support in such situations, also represent added value for civil protection.
1.2. Optical Image Acquistion
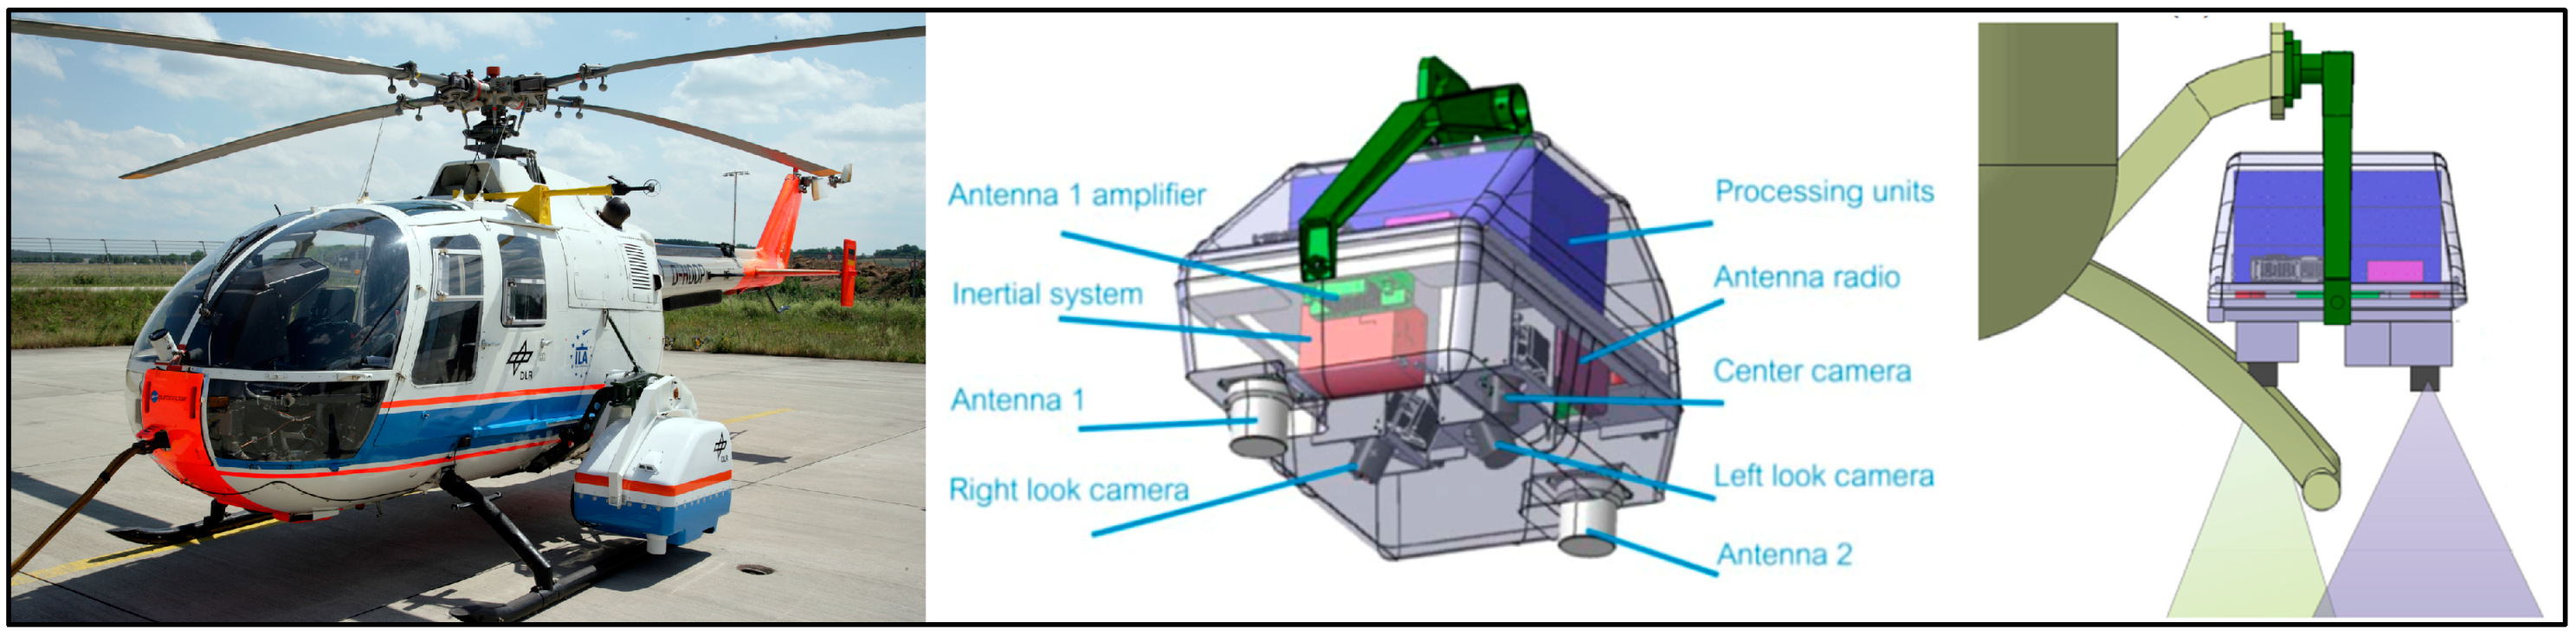
This study is based on optical imagery acquired by the optical 4k camera system of the German Aerospace Center (DLR) (see Figure 2) [22]. The overall system is divided into an airborne and a ground-based component. The left-looking and right-looking cameras acquire aerial images that are processed on board and can be transmitted directly to the ground station. Depending on the flight altitude, ground resolutions of 10 centimeters or better can be achieved [23,24]. On the ground, the data can be received via a mobile antenna and visualized via a web-based portal and, if necessary, further processed in order to derive value added information products. Timeliness is one of the key issues in many scenarios of crisis management; thus, the main advantage of the system is that the data and analysis results are available on the ground, and can be passed onto the responsible persons and emergency services in near-real time [7]. The camera system itself was mainly developed within the DLR research project VABENE++ (Traffic Management for Disasters and Large-Scale Events) and has been used in various crisis management exercises and operations during the last five years [24,25]. The system is certified for different types of helicopters, and can be operated in direct cooperation with German rescue forces and the police.
Another possible platform for airborne optical image acquisition are UAVs (unmanned aerial vehicles), especially as the use of UAVs is getting more and more established in the field of disaster management [26,27,28]. The advantages here are above all in the speed and flexibility of the on-site data collection. In addition, the systems deliver very high spatial resolutions for deriving very detailed ground structures and are becoming cheaper and cheaper, thus standing out from comparatively cost-intensive aerial image acquisition systems mounted on planes or helicopters. The disadvantages are mainly related to the small and simple acquisition systems that are used by the common rescue forces. These systems provide only short recording times, and cover comparatively small areas. In order to increase the spatial coverage and speed up the acquisition time, intensive research is being conducted on systems for the operation of UAV swarms in which several UAVs fly in parallel [27]. However, another disadvantage of the small and inexpensive UAV is that only light payloads can be flown; therefore, quite often, only simple sensors for position measurements are installed [29]. The resulting loss of accuracy and increased effort in post-processing can be improved with the help of special flight patterns and RTK (Real-Time Kinematic) and GNSS (Global Navigation Satellite System)-capable instruments on board [30]. These systems are commercially available, but crisis management practitioners have not (yet) adopted them into common operational use. As this study aims at working toward a fully automatic processor that analyzes large areas very quickly in order to provide near-real time information, derived data from systems such as the 4k system appear to be the most suitable to meet these requirements at the moment.
This study is organized as follows. Section 2 describes the observed study sites, as well as the acquired image data sets. In Section 3, the process chain for deriving digital surface models (DSMs) is explained, and the procedures for 2D and fusion-based 3D change detection are presented. Afterwards, the results of the 2D and fusion-based 3D change detection methods applied to several test areas are shown; these are then validated in Section 4, and discussed in Section 5. An outlook on the further development possibilities and a potential implementation of the methodology with regard to applications in an operational environment is given, and followed by the final conclusion in Section 6.
2. Data Sets
2.1. Study Sites
Data of two large-scale events in Germany were analyzed during this study (see Figure 3). The first was the annual Wacken Open Air music festival in northern Germany in 2016. The festival took place in a quite rural area of Schleswig-Holstein, and was attended by about 75,000 visitors and 9500 other participants. In addition to the event area with stages and supply infrastructure, large parking and camping areas were set up within walking distance of the event area. Two test sites were identified for change detection in order to represent the main structures of the camp ground with cars, tents, roads and sanitary infrastructure (see Figures 9 and 10).
The second event that was investigated was the Protestant Church Celebration in Wittenberg in Saxony-Anhalt, Germany in 2017. The event part in Wittenberg took place on the Elbe meadow south of Wittenberg, and more than 100,000 people were expected. The first test area for change detection covered the western part of the backstage area with a part of the visitors’ tribune, as well as a fenced area with vehicles and numerous mobile constructions (see Figure 11). The second test site showed the eastern access road to the site with various road closures during the event (see Figure 12). These test sites were chosen in order to analyze the safety critical infrastructure during the event. The entire festival area was built on the banks of the Elbe River, which is exposed to a high risk of flooding, even during minor flood events.
2.2. Image Data Sets
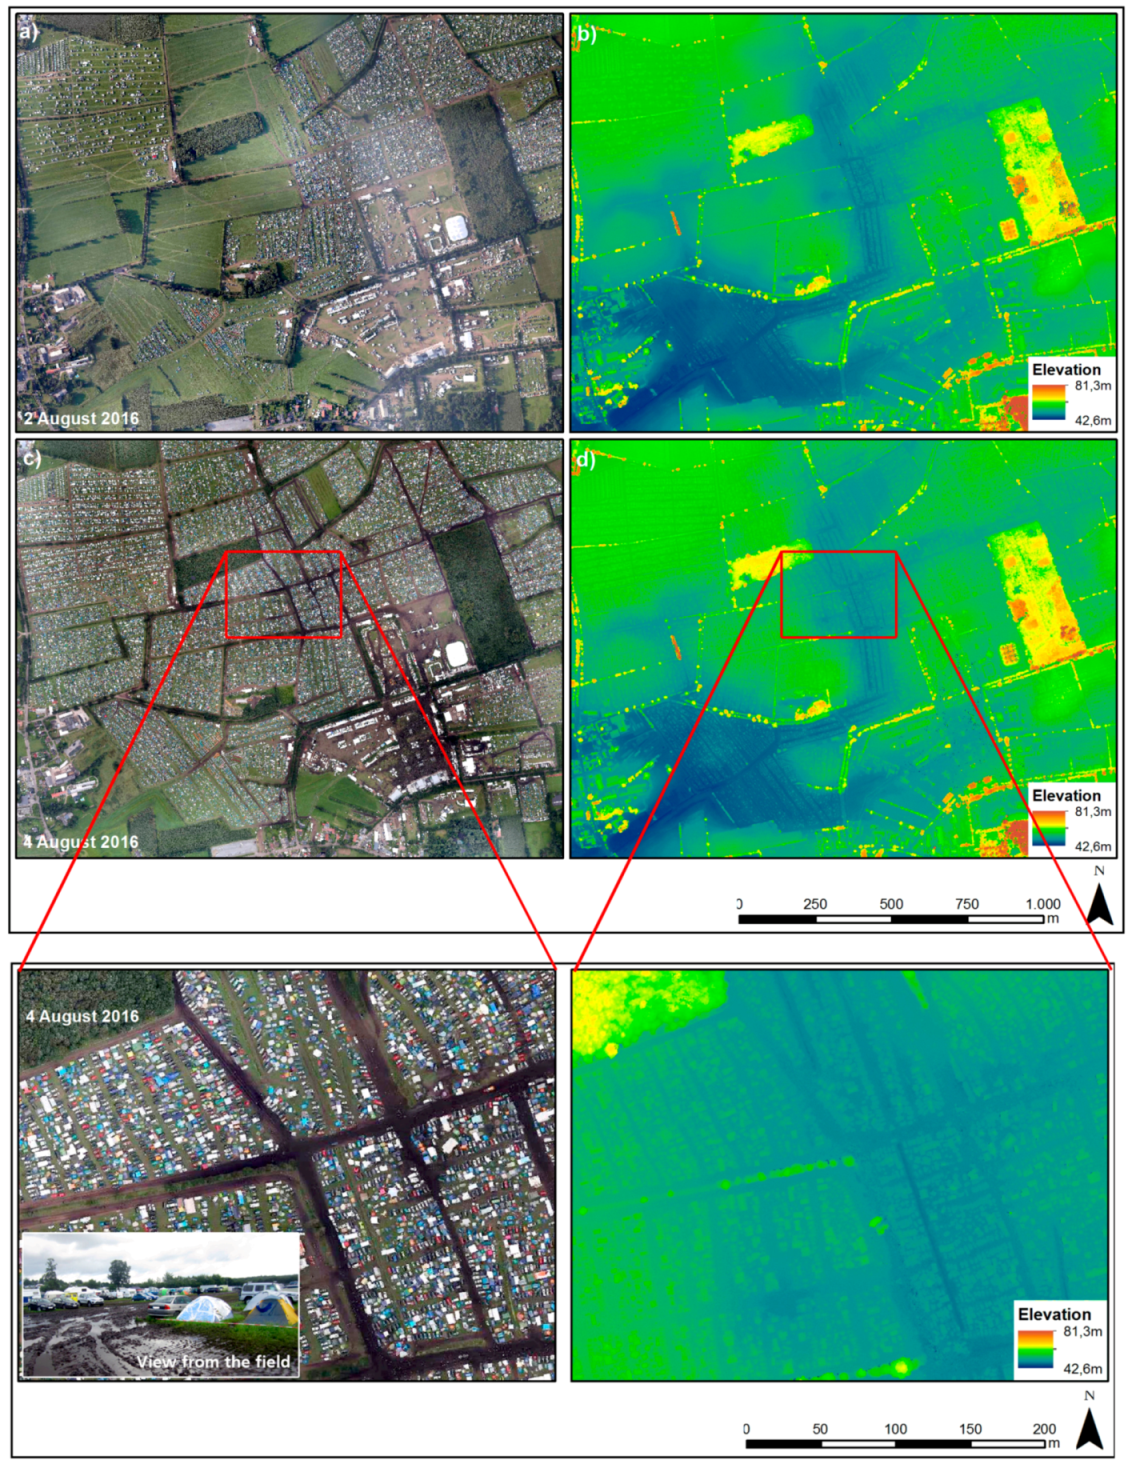
In total, two aerial image data sets and derived surface models were evaluated for each event. The data of Wacken Open Air were acquired on 2 August 2016 (A) and 4 August 2016 (B) in the late afternoon, and the images of the Protestant Church Celebration were taken on 24 May 2017 in the evening (C) and 28 May 2017 in the morning (D). The selected study sites at the Wacken Open Air festival comprised an area of 1.0 km × 1.5 km, which was covered by 54 (A) and 60 (B) left-looking and right-looking images taken from flight heights of 600 m (A) and 650 m (B) above ground. Images were acquired with 90% overlap along-track and 60% overlap across track. Figure 4 displays the entire test site of the Wacken Open Air festival with a zoom box on an area showing heavily soaked roads due to heavy rainfalls.
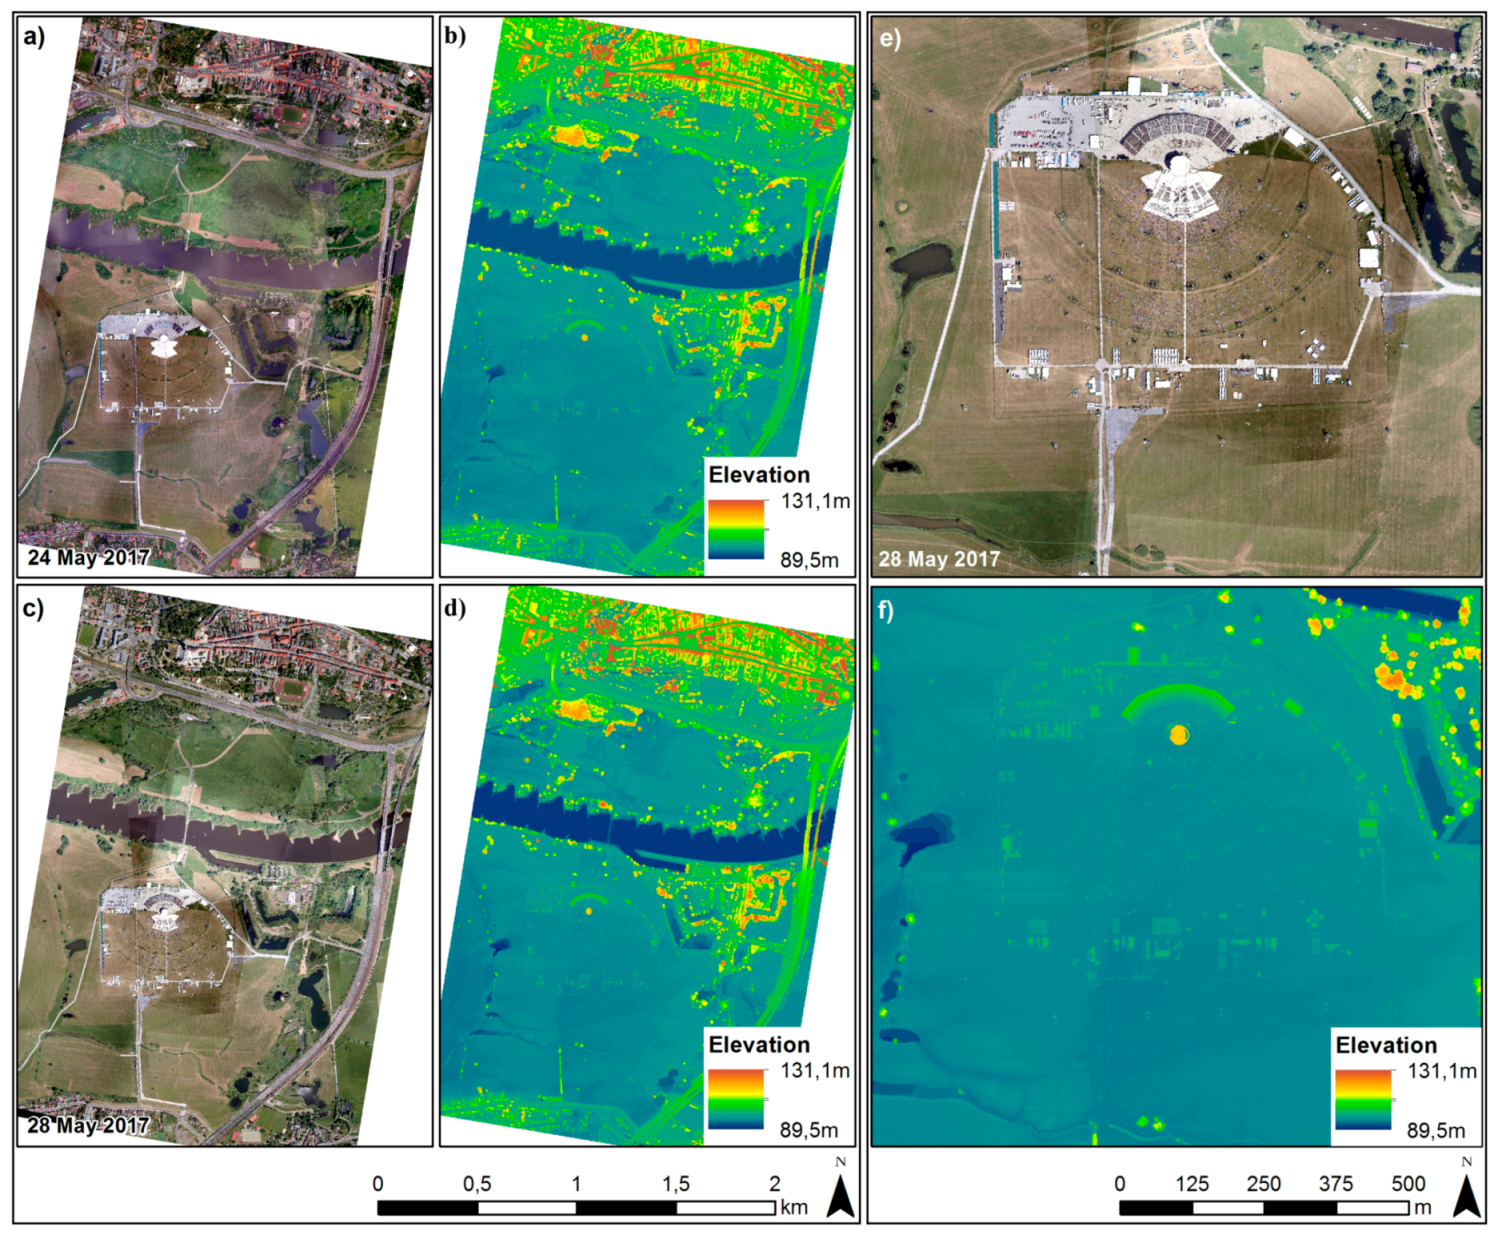
At Wittenberg, the main study site comprised an area of 5.0 km × 5.0 km, and altogether, 621 images (C) and 554 images (D) were acquired from a flight height of 850 m and 900 m above ground, respectively. Images were taken with 90% overlap along track and 70% overlap across track. The ground sampling distance of the images was around nine cm (A and B) and 11 cm (C and D), respectively, which led to a sample distance of 20 cm of all the DSMs (see Figure 5).
3. Materials and Methods
3.1. Image Acquisition and Pre-Processing
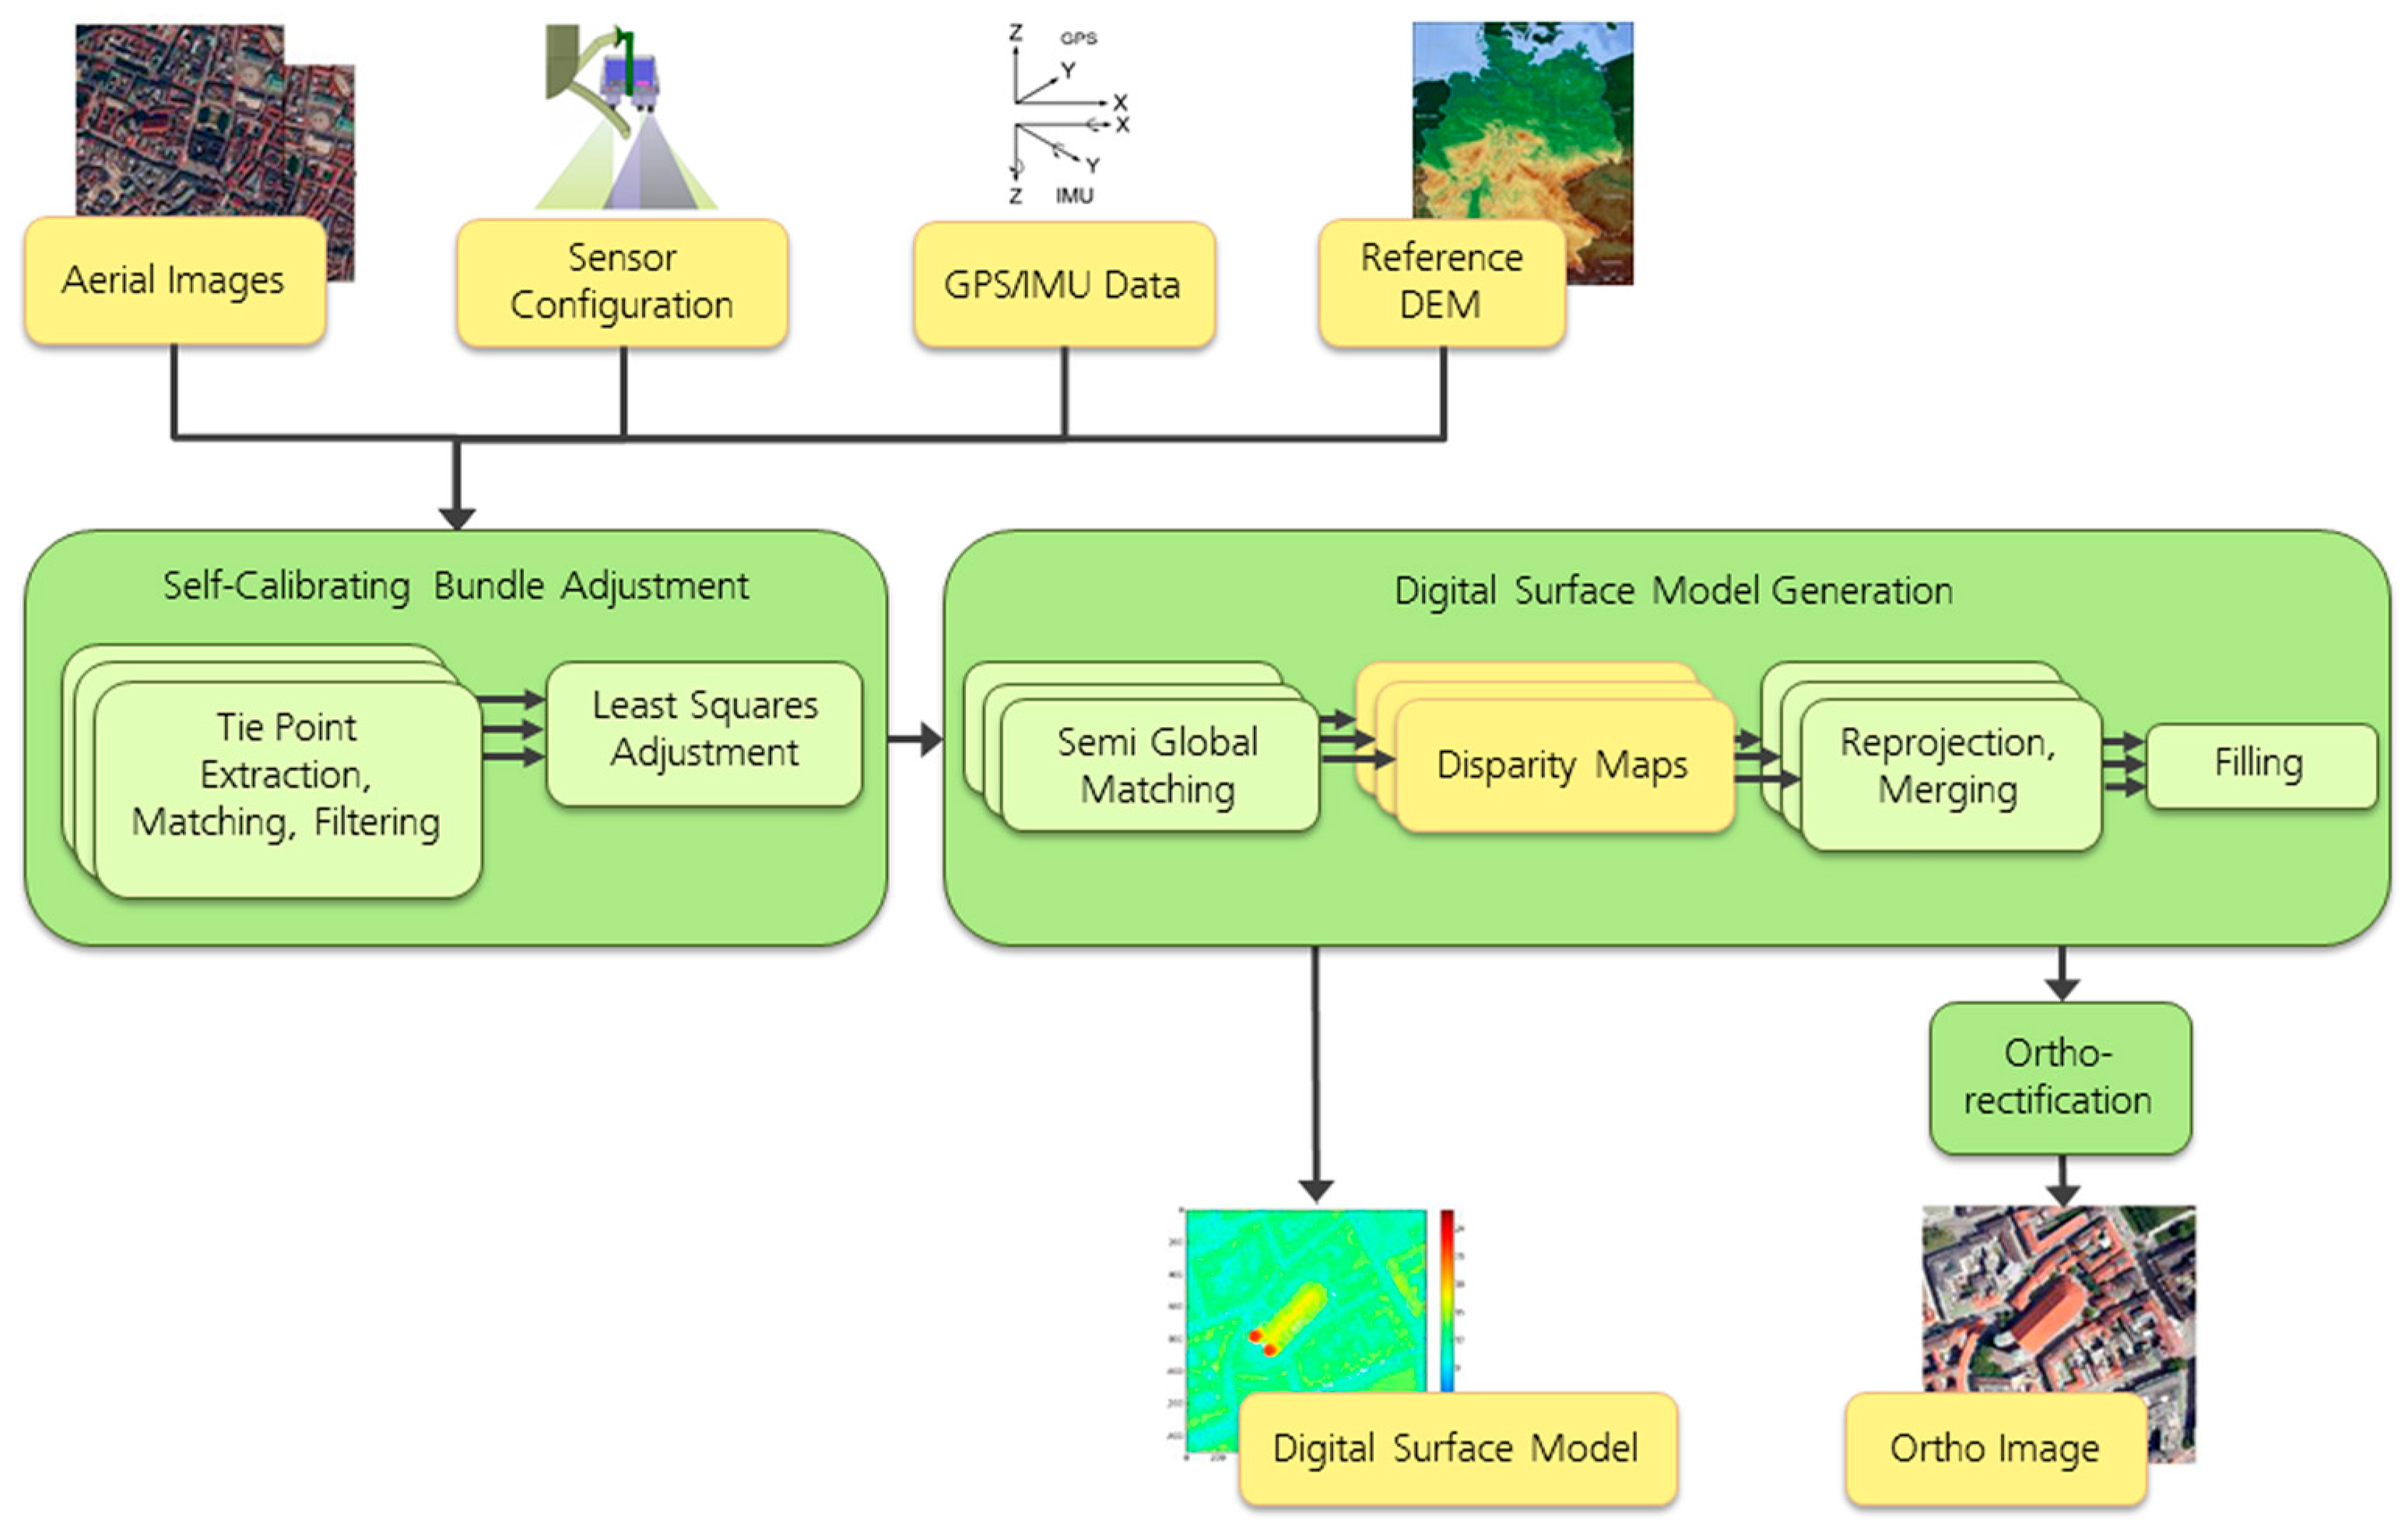
In order to derive 3D information from aerial photographs, the same area had to be photographed several times from different perspectives. Then, a 3D surface had to be reconstructed from the 2D aerial image data. This was done by a Structure from Motion (SfM) technique, which is used in many ways in the geosciences [31]. An overview of the processing steps that were carried out is given in Figure 6. The aerial photographs were linked to the respective position measurements of the GNSS/INS (Inertial Navigation System) and interlaced with additional data such as the elevation model and road information for traffic evaluation. Additionally, all of the measured GNSS positions were differentially corrected using SAPOS (German satellite positioning service) to provide absolute accuracies in the centimeter range. For further DSM processing, all of the measured image positions and attitudes were improved by a self-calibrating least-squares bundle adjustment. Manual ground control measurements are not integrated in the pre-processing step, as from the concept of near-real-time processing, manual interaction would be too time consuming. Instead, the bundle adjustment received necessary pass information from a reference surface model (X-Band SRTM (Shuttle Radar Topography Mission)), which provided approximate heights for each tie point. In the adjustment step, also the interior camera parameters such as the focal length, principal point, and lens distortion parameters were estimated to reach the required accuracies for DSM processing. With this, the final height level of the DSM is tied to the level of the reference Digital Elevation Model (DEM). The precision (RMSE, or Root Mean Square Error) of the tie point`s coordinates was between 0.1 and 0.3 m for all of the data sets. The absolute accuracy of the tie point`s coordinates could not be determined, as there was no ground information available. The mentioned precisions refer to highly accurate matched tie points with errors of 0.2 pixels. The precision of the dense, matched DSM is discussed in Section 3.2.3.
Subsequently, an SGM (semi-global matching)-based process chain was carried out by distributed grid computing generating 3D points that could be used to reconstruct the observed earth surface [32]. We used the computing infrastructure Catena, which was available at the Remote Sensing Technology Institute for processing remote sensing data [33]. The process delivered DSMs together with true-orthorectified images to be mosaicked afterwards. In the mosaicking step, the radiometric differences between the single images were reduced, and a seamline was detected automatically. The mosaicked true-orthorectified images were later used as 2D data sets, whereas the 3D data sets comprise DSMs and the true-orthorectified mosaics.
3.2. Change Detection Methods
Comprehensive reviews of using multi-temporal remote sensing images for natural disaster monitoring have been published by [1,16,34]. Examples of natural disaster events that have been studied include landslide detection in Hong Kong, flooding events in Australia, and the Haiti Earthquake [12,15,35,36,37]. Moreover, the importance of remotely sensed images with different spatial, spectral, and radiometric resolutions acquired by low-cost aerial sensors as well as satellites, has been shown in a number of previous research studies [38,39]. In addition, the fusion of data from different sources can provide temporally dense and regular information at medium/high resolutions [17,40]. The combination of satellite and aerial data, which are then fed them into a disaster monitoring system, establishes an indispensable tool for mapping local changes and environmental effects, planning, and civil security to meet scientific, social, economic, national, and international needs [41]. We broadly categorize the existing approaches into 2D and 3D change detection, depending on the dimensions of change features.
3.2.1. 2D Change Detection
For the 2D change detection approaches, only 2D optical images were used as input in order to deliver 2D change features. An efficient 2D feature should be able to only highlight the real changes. The basic 2D change detection approaches include algebra, image transformation, and post-classification [42]. The Interactively Reweighted Multivariate Alteration Detection (IRMAD) was selected for 2D change detection due to its robustness and comparatively simple application. IRMAD was introduced to highlight changes between two images [43]. This method mainly aims at establishing a reliable background estimation method of no change, thus to identify the real changes and reduce false alarms.
As an unsupervised change detection method, IRMAD considered all of the feature channels that were generated from the images of the two dates and , where and represented the information in band of the pre-event and post-event data, respectively. represented the total number of spectral bands. The changes were expressed by the linear combination of F and G that are shown in Equation (1). and were the coefficients calculated by applying canonical correlation analysis, which is a method for describing the relationship between two sets of variables [42].
As the Multivariate Alteration Detection (MAD) values are linear combinations of two variables, they will follow a Gaussian distribution [42]. Thus, after the normalization, the sum of the squared MAD values of pixel approximately follow a distribution with degrees of freedom as:
In the original MAD, all of the pixels are processed equally (), while IRMAD iteratively put higher weight on the pixels that showed little change over time. Nielsen [42] weighted the pixel by in the next integration, calculating the probability of finding a larger value of the value in Equation (2). Iterations stop when the largest absolute change in the canonical correlations becomes smaller than a predefined very small threshold value (e.g., 10−6).
3.2.2. 3D Change Detection
In urban and suburban regions, changes of relevant objects are often accompanied by height changes. Thus, height information that can be extracted from DSMs provides essential additional features for change detection. In [17], an extensive overview of the existing 3D change detection approaches is given. The decision fusion approach that was presented in [44] was selected in this research due to its efficiency and robustness. This approach has so far been applied to satellite data, and was used with aerial imagery for the first time in this study. For this approach, the change indicators were extracted from the DSMs and the images, respectively. Afterwards, these indicators were fused based on the Dempster–Shafer (DS) fusion theory. Based on the DS rule, the independent sources of evidence, which were represented by the basic belief assignments (BBAs) , were fused using the following model:
i: indicator, and 1 ≤ i ≤ p; : BBA; p: number of indicators
As shown in Figure 7, the approach can be divided into three main steps: the extraction of 2D/3D change indicators, the refinement of change indicators, and the fusion of change indicators. In the first step, the robust height differences and IRMAD-based image difference were calculated and represented as and , respectively. In the second step, each indicator was represented on a concordance and discordance index based on Sigmoid reprojection. The concordance index measures the concordance of the change indicator and BBA in the assertion, while the discordance index measures the opposition of the change indicator to the BBA [17]. These indices were denoted symbolically by and for the height change, and and for the image changes, respectively, and fused based on the DS fusion model to generate and . In the last step, the fusion model proposed in [44] was applied to generate the final building probability map.
After the pre-event and post-event DSMs were generated, a robust height differencing was performed to obtain the height changes ∆H. The 2D change detection result was recorded as ∆Img. In the second step, the change indicators were normalized based on the sigmoid function. We separated each indicator to the concordance index and the discordance index , which got fused based on the DS fusion theory in order to get a refined mass function . In the last step, the mass functions from ∆H and ∆Img were further fused using the proposed fusion model to deliver the final change probability map. A more detailed description of this approach is presented in [44]. The change detection that was performed in this study focused on detecting positive changes. Negative changes can be detected similarly, but they are not displayed in detail in this study.
3.2.3. Accuracies and Errors of the DSMs
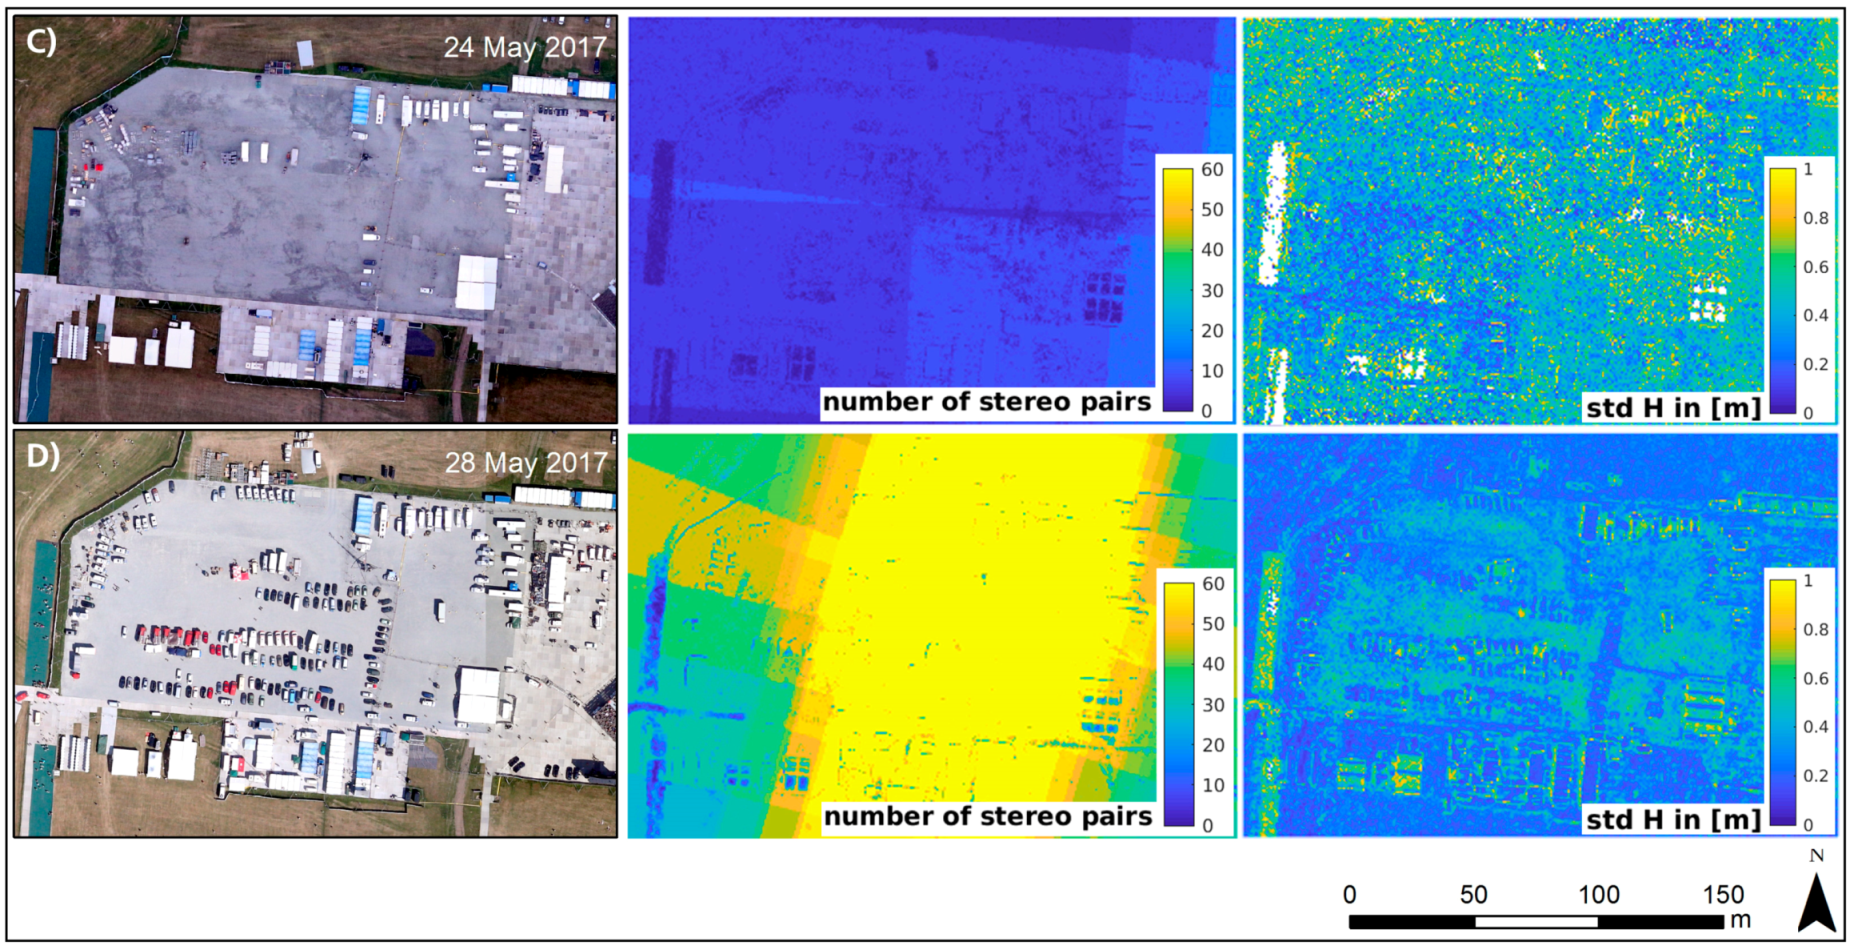
In general, the matching precision of dense matching algorithms such as SGM is lower than the traditional tie point matching based on e.g., least squares. In datasets A to D, the matching precision of SGM was estimated to be about 0.5 pixels [45]. Additionally, many matching outliers were produced, particularly in areas with low textures or repeating patterns. The errors could be reduced by averaging the heights in the large number of overlapping stereo pairs. If the number of stereo pairs was less than or equal to two, the affected area was excluded from further processing. In Figure 8, the influence of error sources such as low texture and the number of stereo pairs on the standard deviation of the final DSM is illustrated based on an example area of datasets C (top row) and D (bottom row). The standard deviation of the DSM is calculated by superimposing all of the contributing stereo pairs. The number of stereo pairs in dataset D was higher than that in dataset C due to the different flight configuration, which led to lower standard deviations in the heights of dataset D (~0.3 m) compared to C (~0.5 m). Higher standard deviations (~1 m) emerged e.g., in the shadowed areas, at saturated white areas on top of the containers, and on the turquoise floor covering (on the left side).
The standard deviations were calculated based on the heights of the different stereo pairs, but they did not reflect the overall accuracy, as there was no accurate ground information available. For change detection, the relative noise level between two DSMs was decisive. As during the bundle adjustment, all of the GNSS positions were corrected by SAPOS, and the additional offsets between two datasets were negligible, i.e. no offsets in X and Y had to be applied to the datasets. Additionally, by using the SRTM reference height model for all of the datasets, systematic differences in Z differences were also negligible, as all of the datasets were tied to the same absolute heights. By calculating the standard deviations of the differences between the two final DSMs displayed in Figure 8, the precision ranged between 0.6 and1.2 m, and some of the positions reached even 1.6 m. This means that the changed objects in some of the areas of the example had to have a minimum height of up to 1.6 m in order to be reliably detected as such.
4. Change Detection Results
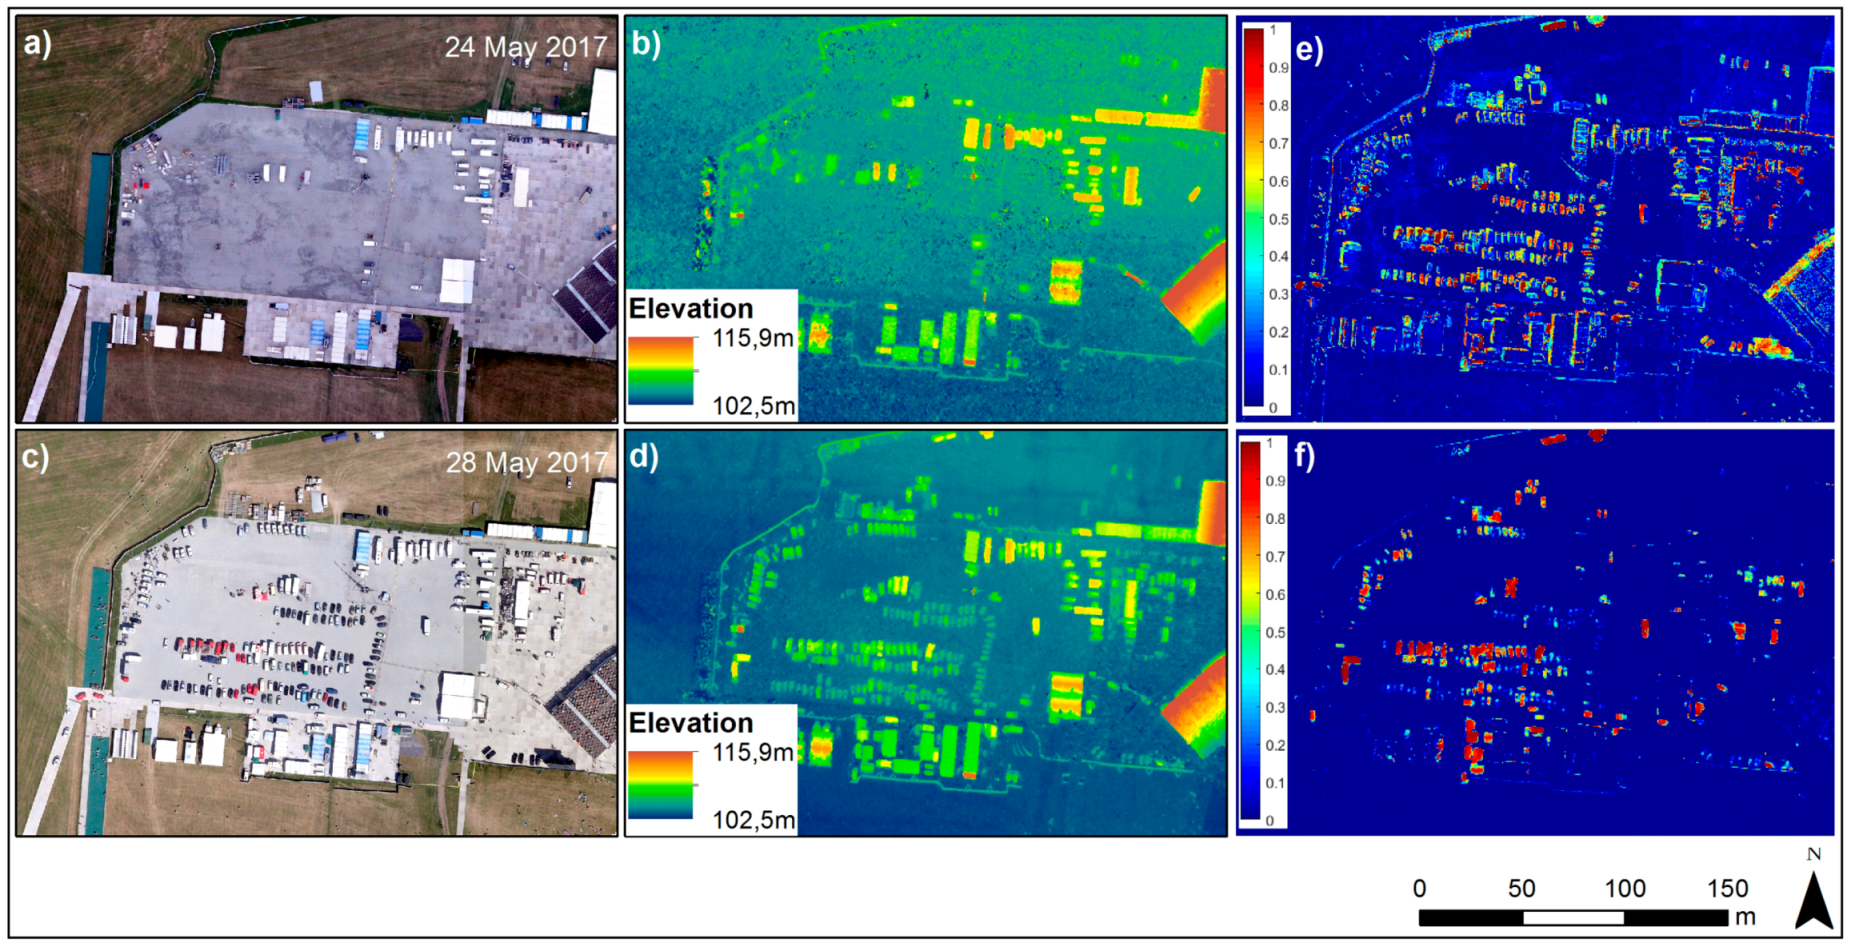
As described in Section 2, two test sites from Wacken and two test sites from Wittenberg were selected and analyzed using 3D change detection. During the two acquisition times of the event for the Protestant Church Celebration, only a few changes were visible concerning the main structures. The stage area, the transport routes, and the supply infrastructure were already completed and remained largely unchanged. However, at the event, there was an increase in vehicles and parked materials in the stage area, as well as barriers and controls at the access roads and entrances to the grounds. At the first recording time of the Wacken Open Air, parking spaces were already marked out, and sanitary facilities were completed. The main changes between the two acquisition times were the vast increase in the number of vehicles and tents. The individual test areas are described in more detail below. The 2D and fusion-based 3D change detection methods were applied to the four smaller test sites, and the results are displayed in the subsets e) and f) of Figure 9, Figure 10, Figure 11 and Figure 12. In subset e), a histogram enhancement was performed for a better representation of the 2D change detection result by removing 1% of the large values and 1% of the small values. It shows the chi-square distance for all of the MAD (multivariate alteration detection) components from 0 to 1. Subset f) refers to the fusion-based 3D change detection and shows values from 0 to 1 representing the probability for changes of each pixel.
4.1. Test Region Wacken-1
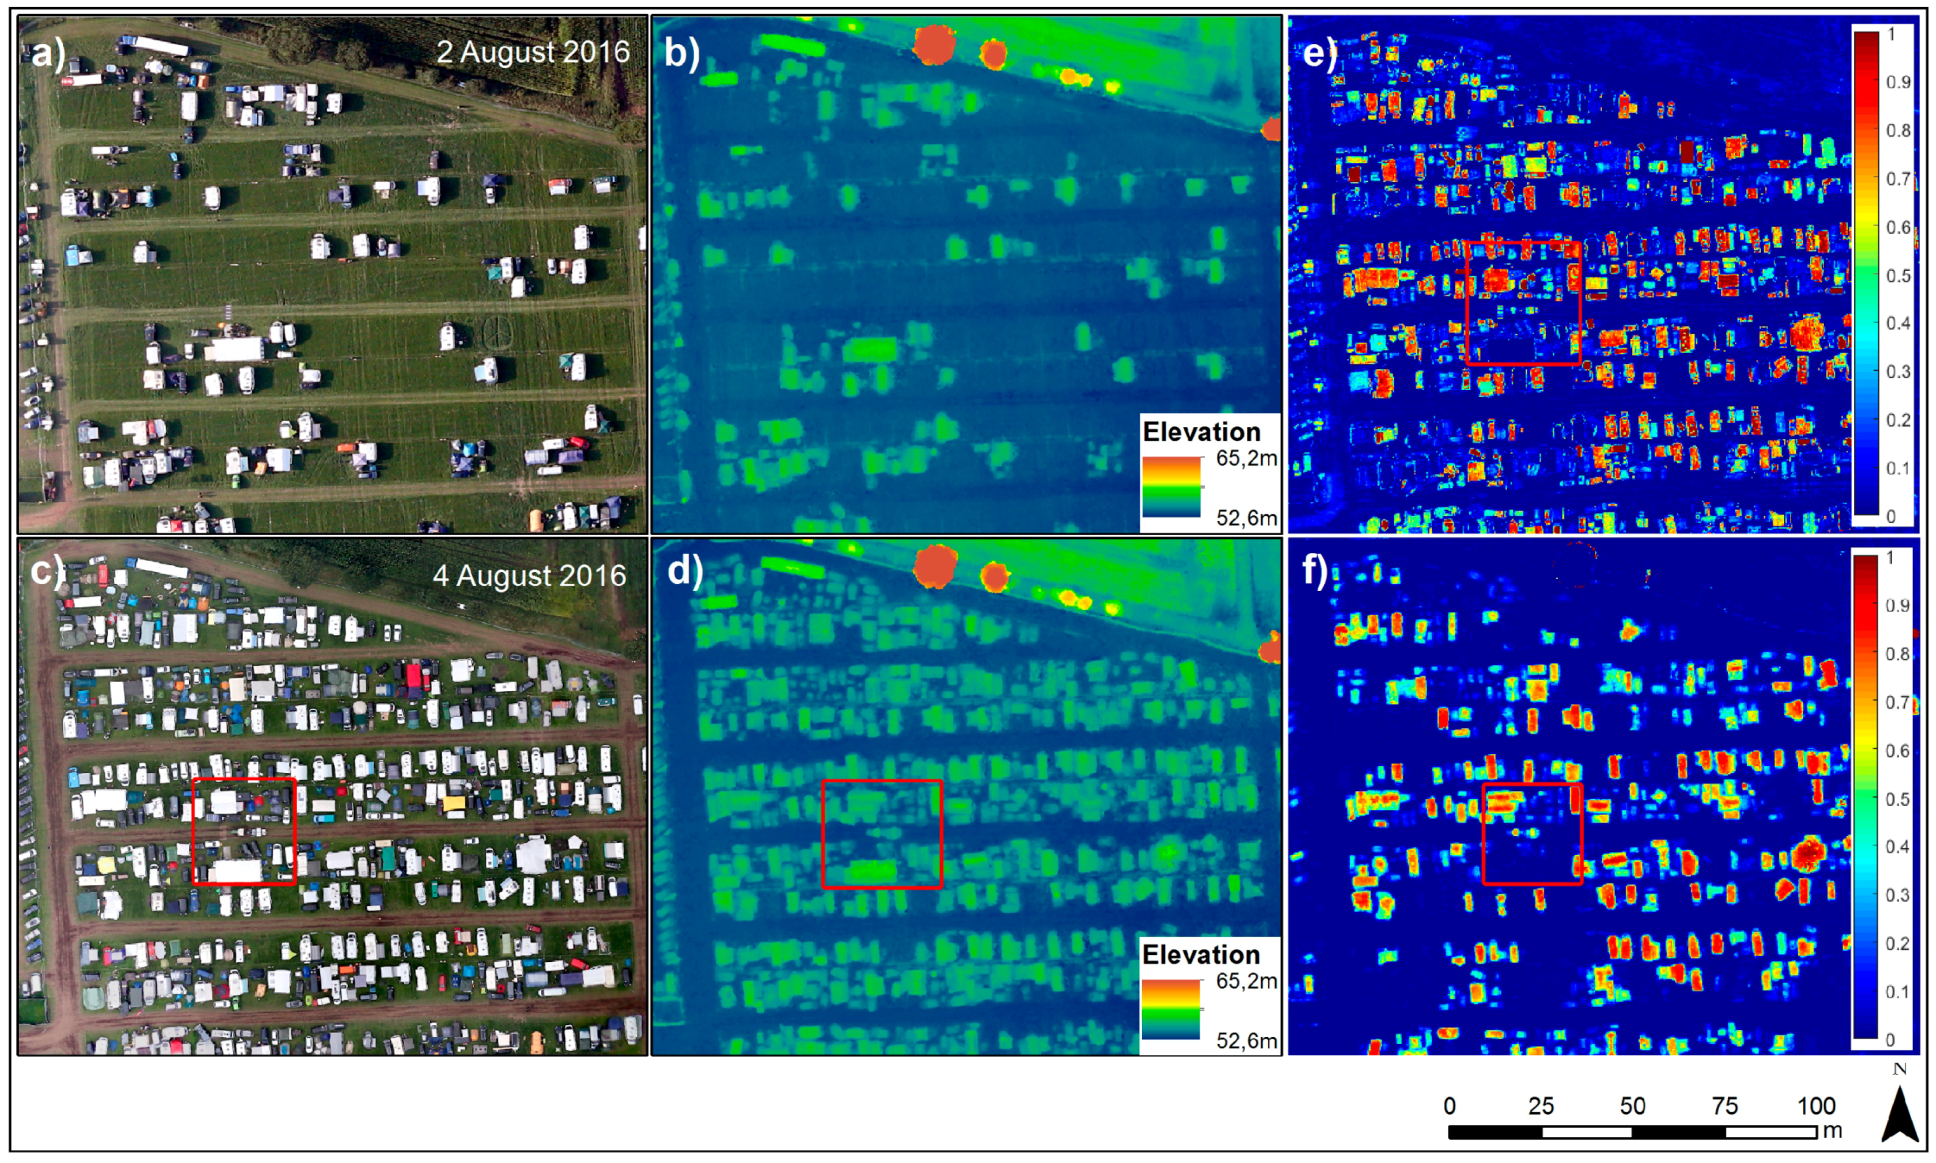
The first test area of the Wacken Open Air shows a part of the campsite for mainly larger vehicles such as campers or motor homes (see Figure 9). At the first time of acquisition, the predefined areas and sections for parking and camping, as well as the previously laid out paths between them, were already visible on the aerial photographs as well as on the derived DSM. During the first acquisition, the official journey to the event had already begun, but the event had not yet been started, so large areas were still available. At the second time, the event had started, and the aerial photos clearly show the high occupancy of the camping area. In addition, it had rained heavily between the first and second overflight, which made the access roads partly muddy. A further difference is the extension of the western north–south connection, which represents a main connection axis, and was obviously intentionally kept clear and extended.
The 2D change detection recognized large changes such as vehicles, but also showed texture changes in vegetation and driveways. Taking into account the 3D component, small changes without height relevance were filtered out. The remaining areas that displayed changes were more clearly defined, and thus indicate actually changed objects. The red boxes in sections c) to f) show a tractor with a loaded trailer. Combined with the path network, the object can be quickly identified as a potentially undesirable obstacle and further examined from the elevation information to make a decision about what it is and whether action needs to be taken to remove it. As mentioned in Section 3.2.2., the 3D change detection algorithm that was used in this study focused on positive changes, and therefore, objects that have left the scene do not appear in the 3D change result.
4.2. Test Region Wacken-2
The second test area of the Wacken Open Air shows a different part of the campsite with slightly smaller vehicles and tents, as well as a large sanitary facility on the eastern part of the test site (see Figure 10). Here, the number of vehicles and tents has increased significantly as well. This test area gives an impression of the very high vertical spatial resolution and the quality of the surface models, because even small differences in the terrain heights are visible and features such as lanes on the meadow are clearly recognizable. While diagonal lanes can still be seen on the aerial photographs as well as on the derived DSM at the first acquisition date, these have already been partially parked by the second time. If these paths would have been evacuation routes, the combination of a reference dataset of planned emergency routes and up-to-date aerial and height information would allow for the easy identification of possible risks and thus could support decisions regarding measures to be taken in order to keep them clear. Here, too, the condition of the paths is already significantly more humid and thus darker in the aerial photographs, which has an effect on the result of the 2D change analysis. With the help of the 3D change analysis, these areas could again easily be removed, as well as the fine structures between the main objects. However, a changed lighting situation can lead to false alarms regarding the 2D change detection. The example of the large red roof shows that this detection was reliably removed by taking the height information into account. However, it became difficult in areas where the aerial photographs were saturated. The roof of the large sanitary facility at the eastern edge of the test site shows deviations of the elevation models due to the saturated aerial imagery. These were erroneously added in the 3D change analysis as very probable changes. Figure 10 and Figure 13 show that not all of the smaller tents have been detected correctly by the 3D change detection.
4.3. Test Region Wittenberg-1
The first test area in Wittenberg shows a part of the tribune as well as a part of the backstage area. The large tent structures, containers, vehicles, and fences are clearly visible on the aerial photographs and surface models. The surface model of the first acquisition displayed in Figure 11b shows clear noise both in the area of the paved ground and on the surrounding meadow due to an insufficient number of available stereo pairs. Further noise can be seen at the western edge of the test area in the surface model, where footpaths were fixed with plastic mats. The reason for these artefacts is the low-contrast background, which leads to an insufficient number of matching points (see Section 3.2.3). The second image was taken in the morning when the sun was shining, which is why it is more contrasting and, above all, contains clear shadows. The 2D change detection in this test area showed not only the changed vehicles and structures, but also changes at fences and shadow areas, e.g., behind a monitor at the eastern, lower edge of the image, or at the back of the large visitor tribune. The 3D change detection includes the most important changes to objects with relevant heights, and could support the classification of such objects. In addition, 3D change detection was able to eliminate the influence of shadows. Strong changes of structures such as fences can be observed, which were erroneously caused by inaccuracies in the surface models. However, the noise of the surface models on the ground can be eliminated by 3D change detection.
4.4. Test Region Wittenberg-2
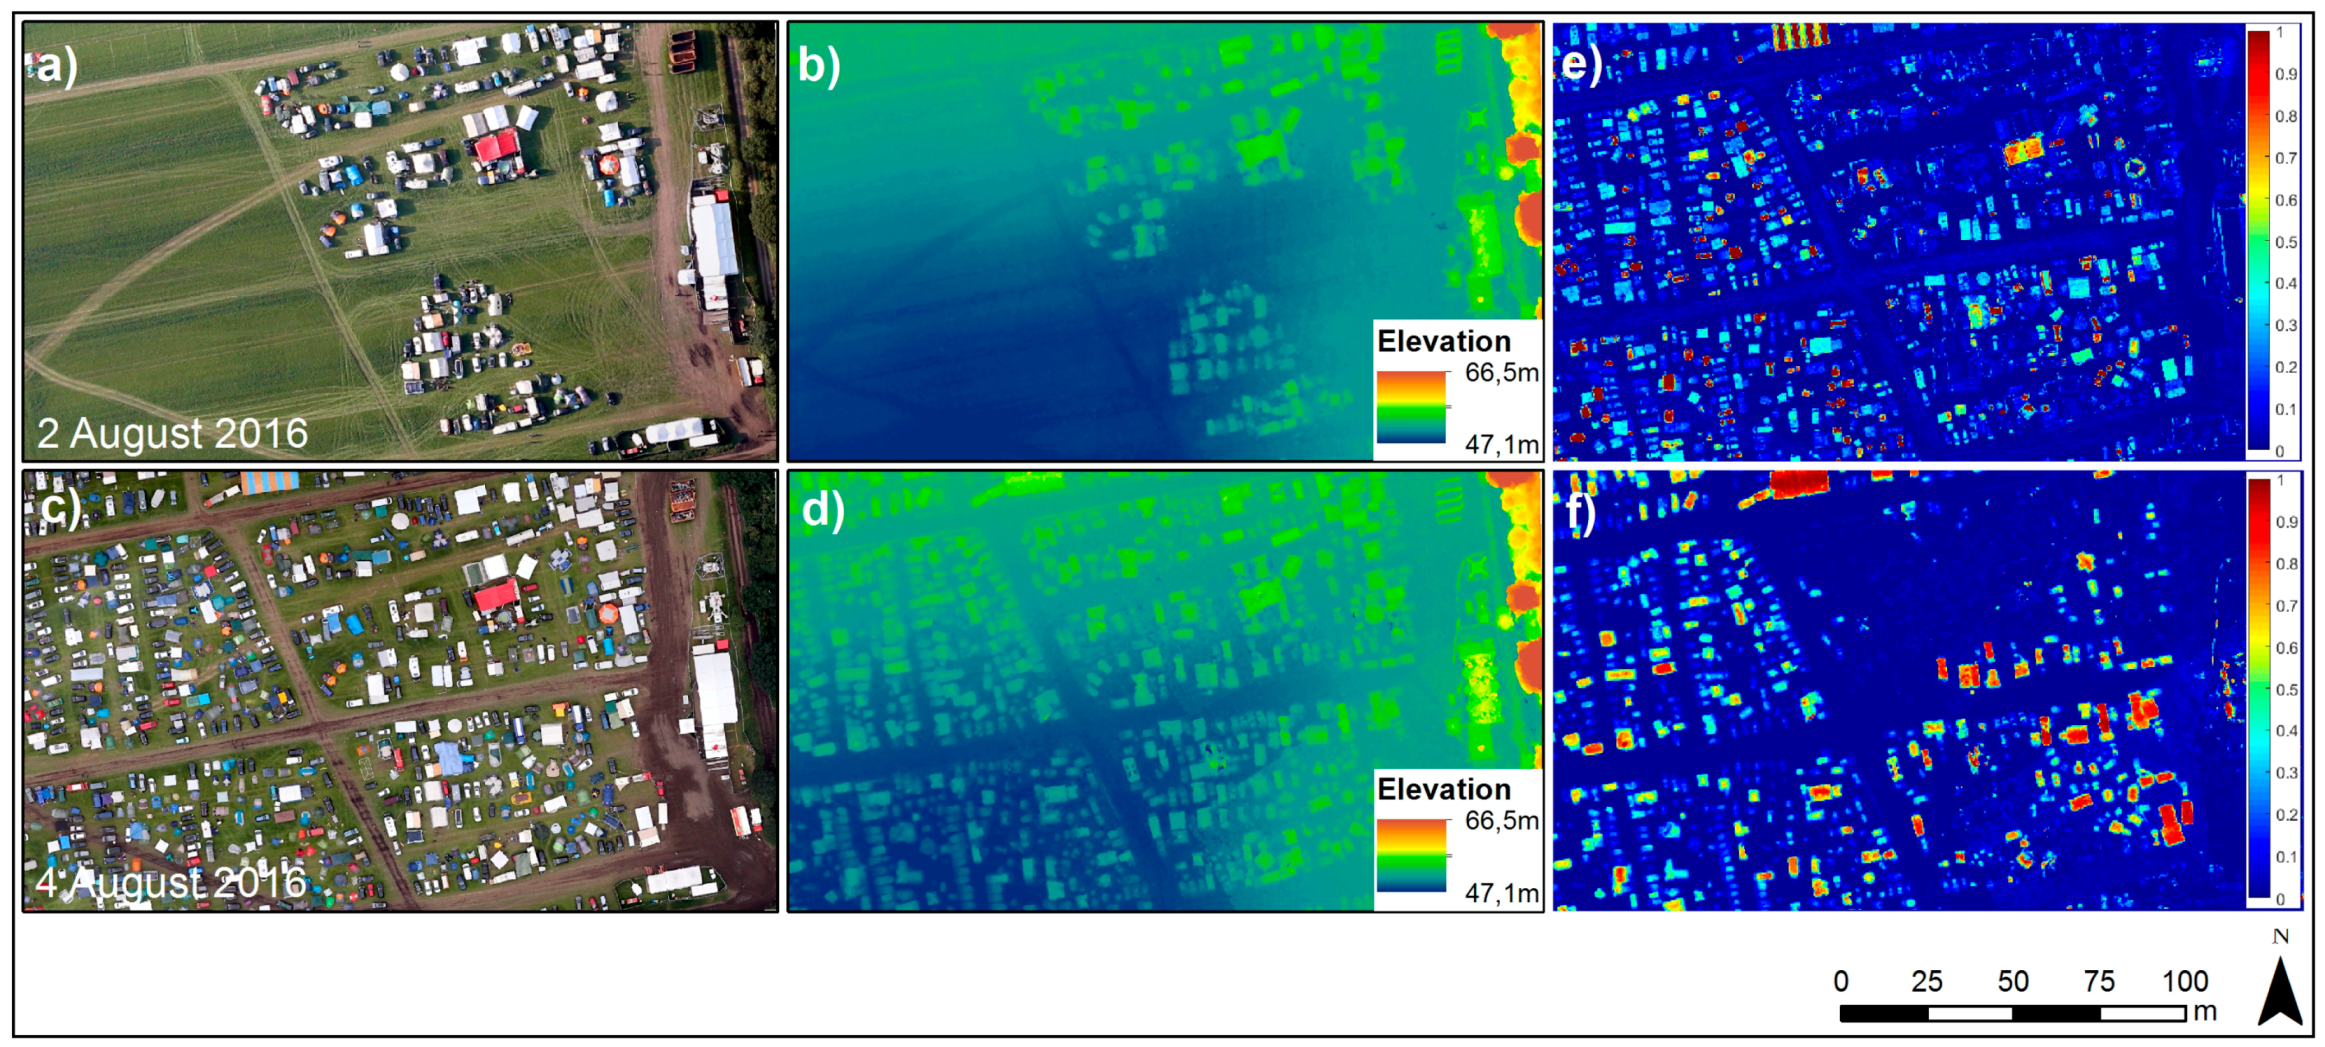
The second test area of Wittenberg shows a small intersection with a nearby railway line. At this point, there was an access road to the festival area. The surface model shows strong noise on the road and in the rail track at the first time of survey (a and b) due to the low contrast of the road and the insufficient number of available stereo pairs. The second time of image acquisition (c and d) shows that road closures in the form of vehicles, fences, and blockades on the road could be detected in the optical imagery, as these were also visible in the surface model. While the 2D change detection shows serious changes in the vegetation area, these can be significantly reduced with the help of the fusion-based 3D change analysis (see Figure 12). The vehicles on the road are certainly marked as changes, but narrow structures such as fences and blockades on the road disappear due to their low height (see also Figure 13).
4.5. Validation of the Results
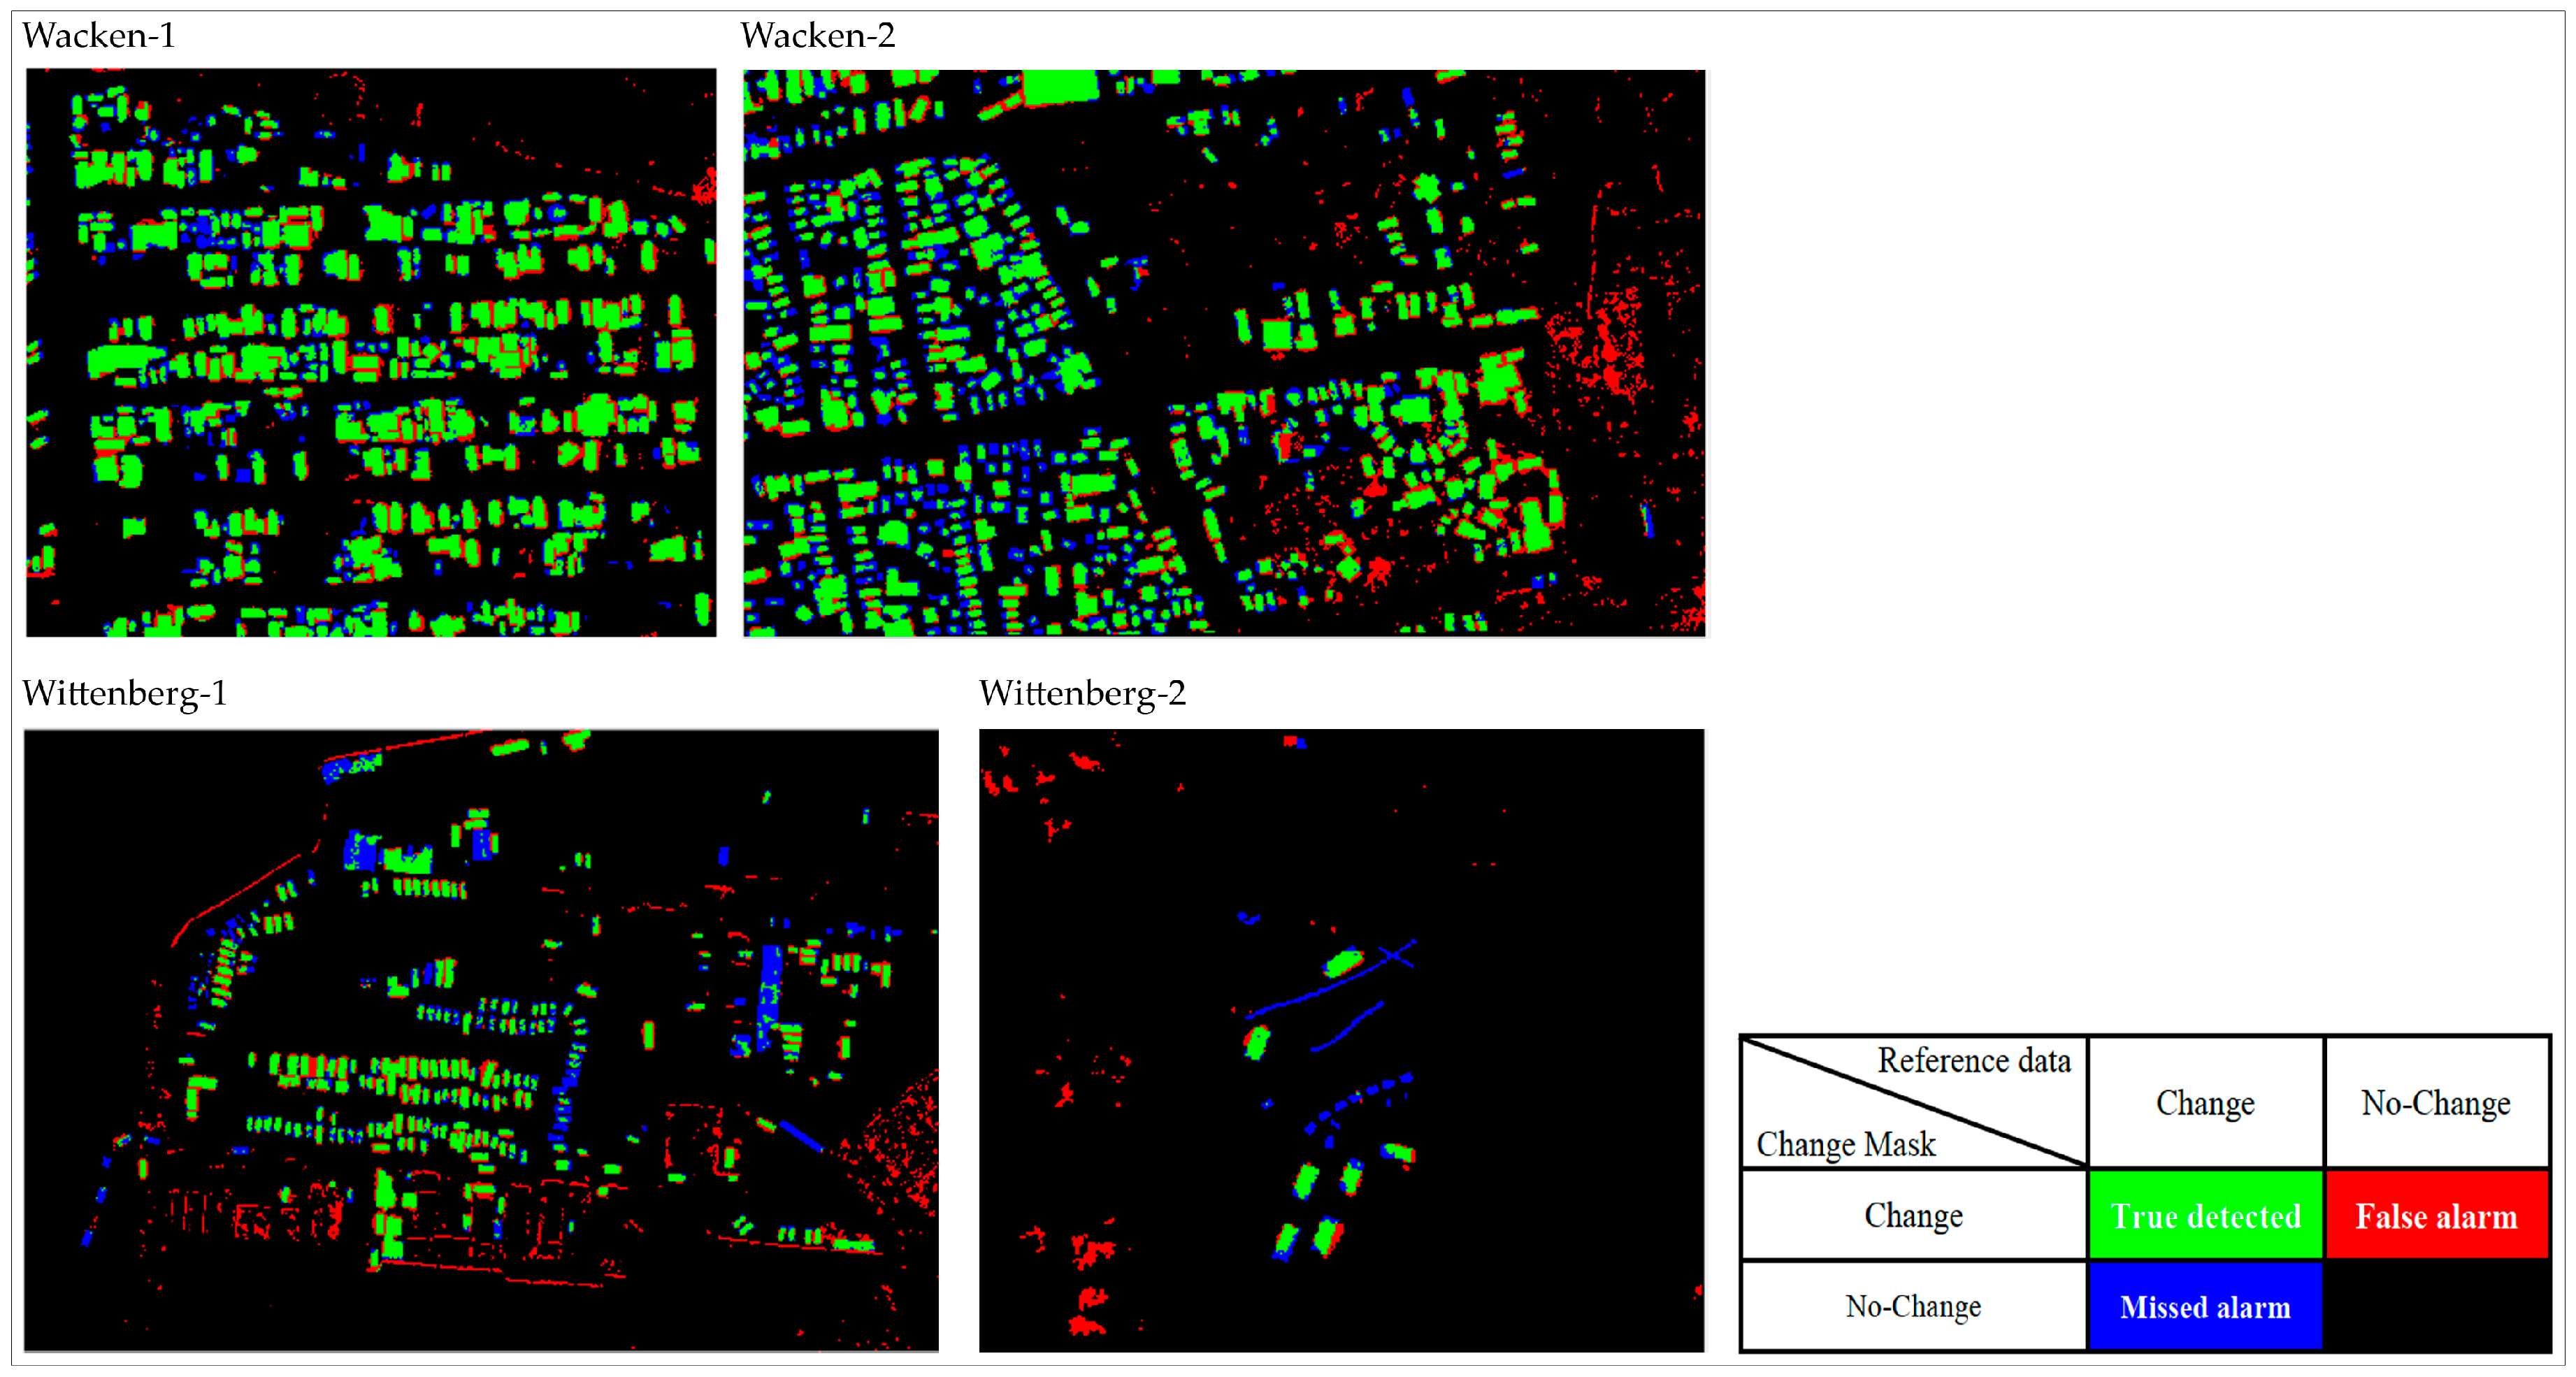
For a quantitative evaluation of the generated change maps, they have been compared to the manually extracted change masks. The area under a receiver operating characteristic curve (AUC) was used for the evaluation [46]. The operating characteristic curve (ROC) represented the relationship between the true positive rate (Sensitivity) and false positive rate (1-Specificity) when various threshold values were set. A larger AUC indicated the better quality of the change map. In addition, we compared the fusion-based 3D change detection approach with other traditional 2D change detection methods, including change vector analyses (CVA), IRMAD, and a simple height-based change detection approach [47]. According to the results listed in Table 1, the IRMAD was more robust in dealing with a multi-temporal dataset compared to the results of the CVA. However, in cases with strong shadow effects, as observed in the Wittenberg test sites, using only 2D information could not deliver a reliable change detection result. The proposed fusion-based 3D change detection approach was able to use both 2D and height information efficiently and provide better results than the simple height-based approach. The change mask was generated after manually giving a probability threshold. Figure 13 and Table 2 show the results of the fusion-based 3D changes compared to the reference dataset. This reference dataset was manually derived from aerial images, as there was no real ground truth data available. They show that most of the changes were correctly detected. The overall accuracy (OA) and kappa accuracy (KA) are displayed in Table 2.
5. Discussion
The study shows that precise and high-resolution surface models derived from optical aerial imagery can be used to extract reliable indications of changes by using a fusion-based 3D change detection technique. While a pure 2D comparison of aerial photographs shows numerous changes with a high degree of detail and leads to misclassifications, especially in shadow areas, these misclassifications can be eliminated by taking height information into account. For many large-scale events, such as the examples presented in this study, the changes that are mainly in the context of man-made objects—for example additional vehicles, tents, or larger constructions—are relevant.
However, an important aspect for the application of surface models and fusion-based 3D change analysis is data quality. If surfaces are too low in texture or the optical imagery is saturated, or if there is not a sufficient number of stereo pairs available, the number of qualitative matching points decreases, which leads to a reduction of the respective surface models, and has a direct effect on the detection of changes.
Although the presented results of the fused 2D and 3D change detection are promising and very meaningful, they cannot be considered a mature product and passed onto decision makers in crisis management yet. The data must be understood in context, and a certain amount of expertise is required for interpretation. For the management of large-scale events, fast and reliable estimations of the occupancy of camping and tent sites as well as parking lots and the classification of the objects located there are of great use, since they indicate the number of people on site who have to be evacuated or supplied in an emergency. Ongoing work that integrates the results of 3D change detection has not yet been completed, but it provides promising intermediate results. The ways in which deep learning methods can contribute to improving classifications are currently being investigated, as well as the use of UAV imagery for 3D change detection.
In order to guarantee the supply of the participants of a large event, access routes to and within the area must be available. The planning of these access and escape routes, as well as the identification of alternative routes, can significantly be supported with the help of up-to-date 3D information. Information about the terrain is already helpful in the planning phase, especially if the event takes place in a flood-prone area. Questions such as which routes are safe, which areas are threatened by waterlogging, and whether the paths must be additionally paved, are questions that can be answered. The derived DSMs of the test areas of both events are precise enough to detect even small sinks, and could thus already make valuable contributions in the planning phase. Continuous monitoring, taking into account additional geographic information, such as existing access maps, can be used to identify objects that are on the roads and might be obstacles. In addition, detailed elevation information may provide crucial indications as to what type of object it is and what action is required to remove it. However, it must be taken into account that the possible obstacles must have a minimum height in order to be reliably detected by the fusion-based 3D change detection.
The DSMs that were used in this study were created after the events had taken place. In the meantime, a procedure has been implemented in the data processing chain of the 4k system with which ad hoc DSMs can be derived during the flight and transmitted directly to the ground station. This will speed up the processing time for DSM generation from hours/days to only minutes. The procedure is currently being tested and analyzed. The automatic 3D change detection process will then be integrated into the processes at the ground station so that the results are immediately available for further analysis and for the creation of products for end users.
6. Conclusions
This study shows that using 3D information for change detection, and in particular fusing 3D and 2D change information, can deliver valuable indications regarding where changes have taken place in the correspondence of actual objects such as mobile constructions, cars, and tents, which are of interest for event and crisis management. The other advantages of the introduced fusion-based 3D change analysis in comparison to simple 2D change analysis are that illumination-related changes or false detections due to shadows can be excluded. Nevertheless, the quality of the results highly depends on the quality of the input data. A deficiency in the number of available stereo pairs, low texture, and saturated image areas lead to quality variations in the derived surface models, and thus to inaccuracies that directly affect the 3D change analysis. As a result, the required minimum height of changed objects to be detected as such can vary over a small area.
The 4k camera system, together with the components for automatic image processing, is capable of providing aerial images and 3D information quickly and reliably. Thus, the results of 3D change analysis are not yet a product for the end user. They should be combined with other geographical information, e.g., paths or site plans, and included in further analysis steps in order to derive information on land use, the number of people on site, or the condition of rescue lanes. This information can be particularly useful for the planning and implementation phase of the management of major events, and thus support crisis management.
Author Contributions
This work was a joint effort and the contribution of each author is as follows: Conceptualization, V.G.; Methodology, J.T. and F.K.; Software, J.T. and F.K.; Validation, J.T., V.G., R.K. and F.K.; Formal Analysis, V.G., J.T. and R.K.; Data Curation, F.K. and V.G.; Writing-Original Draft Preparation, V.G., J.T. and F.K.; Writing-Review & Editing, V.G., J.T., F.K. and R.K.; Visualization, V.G., J.T. and F.K.
Funding
This research received no external funding.
Conflicts of Interest
The authors declare no conflict of interest.
References
- Joyce, K.E.; Belliss, S.E.; Samsonov, S.V.; McNeill, S.J.; Glassey, P.J. A review of the status of satellite remote sensing and image processing techniques for mapping natural hazards and disasters. Prog. Phys. Geogr. Earth Environ. 2009, 33, 183–207. [Google Scholar] [CrossRef]
- Bello, O.M.; Aina, Y.A. Satellite Remote Sensing as a Tool in Disaster Management and Sustainable Development: Towards a Synergistic Approach. Procedia Soc. Behav. Sci. 2014, 120, 365–373. [Google Scholar] [CrossRef]
- Gähler, M. Remote Sensing for Natural or Man-Made Disasters and Environmental Changes. In Environmental Applications of Remote Sensing; Marghany, M., Ed.; IntechOpen Limited: London, UK, 2016; pp. 309–338. [Google Scholar]
- Lechner, K.; Gähler, M. Earth observation based crisis information—Emergency mapping services and recent operational developments. In Proceedings of the 4th International Conference on Information and Communication Technologies for Disaster Management (ICT-DM), Münster, Germany, 11–13 December 2017; pp. 1–7. [Google Scholar] [CrossRef]
- Biljecki, F.; Stoter, J.; Ledoux, H.; Zlatanova, S.; Çöltekin, A. Applications of 3D City Models: State of the Art Review. ISPRS Int. J. Geo-Inf. 2015, 4, 2842–2889. [Google Scholar] [CrossRef] [Green Version]
- Lee, J.; Zlatanova, S. A 3D data model and topological analyses for emergency response in urban areas. In Geospatial Information Technology for Emergency Response: International Society for Photogrammetry and Remote Sensing; Aplin, P., Ed.; Taylor and Francis: London, UK, 2008; Volume 6, pp. 143–168. ISBN 0415422477. [Google Scholar]
- Alexander, D. Principles of Emergency Planning and Management, 6th ed.; Dunedin Academic Press Ltd.: Edinburgh, EB, UK, 2012; pp. 1–352. ISBN 978-1-903544-10-5. [Google Scholar]
- Lichter, M.; Grinberger, A.S.; Felsenstein, D. Simulating and Communicating Outcomes in Disaster Management Situations. ISPRS Int. J. Geo-Inf. 2015, 4, 1827–1847. [Google Scholar] [CrossRef] [Green Version]
- Sanders, B. Evaluation of on-line DEMs for flood inundation modeling. Adv. Water Resour. 2007, 30, 1831–1843. [Google Scholar] [CrossRef]
- Martha, T.R.; Kerle, N.; Jetten, V.; van Westen, C.J.; Kumar, K.V. Landslide volumetric analysis using Cartosat-1-derived DEMs. IEEE Geosci. Remote Sens. Lett. 2010, 7, 582–586. [Google Scholar] [CrossRef]
- Turner, D.; Lucieer, A.; de Jong, S.M. Time Series Analysis of Landslide Dynamics Using an Unmanned Aerial Vehicle (UAV). Remote Sens. 2015, 7, 1736–1757. [Google Scholar] [CrossRef] [Green Version]
- Nichol, J.; Wong, M.S. Satellite remote sensing for detailed landslide inventories using change detection and image fusion. Int. J. Remote Sens. 2005, 26, 1913–1926. [Google Scholar] [CrossRef]
- Döllner, J.; Kolbe, T.; Liecke, F.; Sgouros, T.; Teichmann, K. The virtual 3D city model of Berlin-Managing, integrating, and communicating complex urban information. In Proceedings of the 25th Urban Data Management Symposium (UDMS), Aalborg, Denmark, 15–17 May 2006. [Google Scholar]
- Frassl, M.; Lichtenstern, M.; Angermann, M.; Gullotta, G. Micro Aerial Vehicles in Disaster Assessment Operations—The Example of Cyprus 2011. In Future Security. Communications in Computer and Information Science; Aschenbruck, N., Martini, P., Meier, M., Tölle, J., Eds.; Springer: Berlin/Heidelberg, Germany, 2012; Volume 318, pp. 475–479. ISBN 978-3-642-33160-2. [Google Scholar]
- Tian, J.; Nielsen, A.A.; Reinartz, P. Building damage assessment after the earthquake in Haiti using two post-event satellite stereo imagery and DSMs. Int. J. Image and Data Fus. 2015, 6, 155–169. [Google Scholar] [CrossRef] [Green Version]
- Dong, L.; Shan, J. A comprehensive review of earthquake-induced building damage detection with remote sensing techniques. ISPRS J. Photogramm. Remote Sens. 2013, 84, 85–99. [Google Scholar] [CrossRef]
- Qin, R.; Tian, J.; Reinartz, P. 3D change detection–approaches and applications. ISPRS J. Photogramm. Remote Sens. 2016, 122, 41–56. [Google Scholar] [CrossRef]
- Bundesamt für Bevölkerungsschutz und Katastrophenhilfe (BBK). Bausteine für die Sicherheit von Großveranstaltungen. Bonn, Germany, 2016. Available online: https://www.bbk.bund.de/SharedDocs/Downloads/BBK/DE/Publikationen/Praxis_Bevoelkerungsschutz/Band_17_Praxis_BS_Sicherheit_Grossveranstaltungen.pdf?__blob=publicationFile (accessed on 13 October 2018).
- Römer, H.; Kiefl, R.; Henkel, F.; Cao, W.; Nippold, R.; Kurz, F.; Kippnich, U. Using airborne remote sensing to increase situational awareness in civil protection and humanitarian relief—The importance of user involvement. Int. Arch. Photogramm. Remote Sens. Spatial Inf. Sci. 2016, XLI-B8, 1363–1370. [Google Scholar] [CrossRef]
- Türmer, S. Car detection in low frame-rate aerial imagery of dense urban areas. Ph.D. Thesis, Technical University, Munich, Germany, 2014. [Google Scholar]
- Schilling, H.; Bulatov, D.; Middelmann, W. Object-based detection of vehicles using combined optical and elevation data. ISPRS J. Photogramm. Remote Sens. 2018, 136, 85–105. [Google Scholar] [CrossRef]
- Kurz, F.; Rosenbaum, D.; Meynberg, O.; Mattyus, G. Real-Time Mapping from a Helicopter with a New Optical Sensor System. Gemeinsame Tagung 2014 der DGfK, der DGPF, der GfGI und des GiN, Hamburg, Germany. 2014. Available online: https://s3.amazonaws.com/academia.edu.documents/41539230/Real-time_mapping_from_a_helicopter_with20160124-30547-peji7j.pdf?AWSAccessKeyId=AKIAIWOWYYGZ2Y53UL3A&Expires=1545122498&Signature=nzZh8hgDOht%2BjaH7dsoa9CSyiBA%3D&response-content-disposition=inline%3B%20filename%3DReal-time_mapping_from_a_helicopter_with.pdf (accessed on 18 December 2018).
- Kurz, F.; Tuermer, S.; Meynberg, O.; Rosenbaum, D.; Runge, H.; Reinartz, P. Low-cost optical Camera System for real-time Mapping Applications. PFG 2012, 2, 159–176. [Google Scholar]
- Verkehrsmanagement bei Großereignissen und Katastrophen. Available online: https://verkehrsforschung.dlr.de/de/projekte/vabene (accessed on 14 October 2018).
- Gstaiger, V.; Römer, H.; Rosenbaum, D.; Henkel, F. Airborne Camera System for Real-Time Applications—Support of a National Civil Protection Exercise. Int. Arch. Photogramm. Remote Sens. Spatial Inf. Sci. 2015, XL-7/W3, 1189–1194. [Google Scholar] [CrossRef]
- Restas, A. Drone Applications for Supporting Disaster Management. WJET 2015, 3, 316–321. [Google Scholar] [CrossRef]
- Erdelj, M.; Król, M.; Natalizio, E. Wireless Sensor Networks and Multi-UAV systems for natural disaster management. Comput. Netw. 2017, 124, 72–86. [Google Scholar] [CrossRef]
- Drones for Humanitarian and Environmental Applications. Available online: http://drones.fsd.ch/en/homepage/ (accessed on 14 October 2018).
- Colomina, I.; Molina, P. Unmanned aerial systems for photogrammetry and remote sensing: A review. ISPRS J. Photogramm. Remote Sens. 2014, 92, 79–97. [Google Scholar] [CrossRef]
- Gerke, M.; Przybilla, H.-J. Accuracy Analysis of Photogrammetric UAV Image Blocks: Influence of Onboard RTK-GNSS and Cross Flight Patterns. PFG 2016, 1, 17–30. [Google Scholar] [CrossRef]
- Westoby, M.J.; Brasington, J.; Glasser, N.F.; Hambrey, M.J.; Reynolds, J.M. Structure-from-Motion’ photogrammetry: A low-cost, effective tool for geoscience applications. Geomorphology 2012, 179, 300–314. [Google Scholar] [CrossRef]
- d’Angelo, P.; Reinartz, P. Semiglobal Matching Results on the ISPRS Stereo Matching Benchmark. Int. Arch. Photogramm. Remote Sens. Spatial Inf. Sci. 2011, XXXVIII-4/W19, 79–84. [Google Scholar] [CrossRef]
- Krauß, T.; d’Angelo, P.; Schneider, M.; Gstaiger, V. The Fully Automatic Optical Processing System CATENA at DLR. ISPRS Int. Arch. Photogramm. Remote Sens. Spatial Inf. Sci. 2013, XL-1/W, 177–181. [Google Scholar] [CrossRef]
- Tralli, D.M.; Blom, R.G.; Zlotnicki, V.; Donnellan, A.; Evans, D.L. Satellite remote sensing of earthquake, volcano, flood, landslide and coastal inundation hazards. ISPRS J. Photogramm. Remote Sens. 2005, 5, 185–198. [Google Scholar] [CrossRef]
- Mueller, N.; Lewis, A.; Roberts, D.; Ring, S.; Melrose, R.; Sixsmith, J.; Lymburner, L.; McIntyre, A.; Tan, P.; Curnow, S.; Ip, A. Water observations from space: Mapping surface water from 25 years of Landsat imagery across Australia. Remote Sens. Environ. 2016, 174, 341–352. [Google Scholar] [CrossRef]
- Corbane, C.; Saito, K.; Dell’Oro, L.; Bjorgo, E.; Gill, S.P.; Emmanuel Piard, B.; Huyck, C.K.; Kemper, T.; Lemoine, G.; Spence, R.J. A comprehensive analysis of building damage in the 12 January 2010 MW7 Haiti earthquake using high-resolution satellite and aerial imagery. Photogramm. Eng. Remote Sens. 2011, 77, 997–1009. [Google Scholar] [CrossRef]
- Voigt, S.; Schneiderhan, T.; Twele, A.; Gähler, M.; Stein, E.; Mehl, H. Rapid damage assessment and situation mapping: Learning from the 2010 Haiti earthquake. Photogramm. Eng. Remote Sens. 2011, 7, 923–931. [Google Scholar] [CrossRef]
- Paolini, L.; Grings, F.; Sobrino, J.A.; Jiménez Muñoz, J.C.; Karszenbaum, H. Radiometric correction effects in Landsat multi-date/multi-sensor change detection studies. Int. J. Remote Sens. 2006, 27, 685–704. [Google Scholar] [CrossRef]
- Deng, J.S.; Wang, K.; Deng, Y.H.; Qi, G.J. PCA-based land-use change detection and analysis using multitemporal and multisensor satellite data. Int. J. Remote Sens. 2018, 29, 4823–4838. [Google Scholar] [CrossRef]
- Reiche, J.; Hamunyela, E.; Verbesselt, J.; Hoekman, D.; Herold, M. Improving near-real time deforestation monitoring in tropical dry forests by combining dense Sentinel-1 time series with Landsat and ALOS-2 PALSAR-2. Remote Sens. Environ. 2018, 204, 147–161. [Google Scholar] [CrossRef]
- Zhang, J. Multi-source remote sensing data fusion: status and trends. Int. J. Image Data Fusion 2010, 1, 5–24. [Google Scholar] [CrossRef] [Green Version]
- Lu, D.; Mausel, P.; Brondizio, E.; Moran, E. Change detection techniques. Int. J. Remote Sens. 2004, 25, 2365–2401. [Google Scholar] [CrossRef]
- Nielsen, A. The regularized iteratively reweighted MAD method for change detection in multi- and hyperspectral data. IEEE Trans. Image Process. 2007, 16, 463–478. [Google Scholar] [CrossRef] [PubMed]
- Tian, J.; Dezert, J. Fusion of multispectral imagery and DSMs for building change detection using belief functions and reliabilities. Int. J. Image Data Fusion 2018. [Google Scholar] [CrossRef]
- Scharstein, D.; Hirschmüller, H.; Kitajima, Y.; Krathwohl, G.; Nesic, N.; Wang, X.; Westling, P. High-Resolution Stereo Datasets with Subpixel-Accurate Ground Truth. In Pattern Recognition. GCPR 2014. Lecture Notes in Computer Science; Jiang, X., Hornegger, J., Koch, R., Eds.; Springer: Cham, Germany, 2014; Volume 8753, pp. 31–42. [Google Scholar]
- Zweig, M.H.; Campbell, G. Receiver-operating characteristic (ROC) plots: A fundamental evaluation tool in clinical medicine. Clin. Chem. 1993, 39, 561–577. [Google Scholar] [PubMed]
- Johnson, R.D.; Kasischke, E.S. Change vector analysis: A technique for the multispectral monitoring of land cover and condition. Int. J. Remote Sens. 1998, 19, 411–426. [Google Scholar] [CrossRef]
Figure 1.
Crisis management phases and corresponding phases of event management.

Figure 2.
The 4k camera system on the German Aerospace Center (DLR)’s research helicopter BO 105 (DLR (CC-BY 3.0)).
Figure 2.
The 4k camera system on the German Aerospace Center (DLR)’s research helicopter BO 105 (DLR (CC-BY 3.0)).

Figure 3.
(a) Wacken Open Air Festival 2016; (b) Protestant Church Celebration 2017 (DLR (CC-BY 3.0)).
Figure 3.
(a) Wacken Open Air Festival 2016; (b) Protestant Church Celebration 2017 (DLR (CC-BY 3.0)).

Figure 4.
Imagery and derived digital surface model (DSM) of Wacken data set A (a and b) and Wacken dataset B (c and d) with zoom boxes enlarging an area with a wet driveway (DLR (CC-BY 3.0)).
Figure 4.
Imagery and derived digital surface model (DSM) of Wacken data set A (a and b) and Wacken dataset B (c and d) with zoom boxes enlarging an area with a wet driveway (DLR (CC-BY 3.0)).

Figure 5.
Imagery and derived DSM of Wittenberg dataset C (a and b) and Wittenberg data set D (c,d). Subsets e and f show the main event area of dataset D in detail.
Figure 5.
Imagery and derived DSM of Wittenberg dataset C (a and b) and Wittenberg data set D (c,d). Subsets e and f show the main event area of dataset D in detail.

Figure 6.
DSM data processing workflow at DLR.

Figure 7.
Flowchart of the three-dimensional (3D) change detection.

Figure 8.
Error sources in DSM generation in datasets C (top row) and D (bottom row). Areas with low texture resulted in a higher standard deviation of the DSM. In addition, the number of stereo pairs influenced the accuracy level. Areas with too few stereo pairs were masked out (white areas) and excluded from further processing.

Figure 9.
Test region Wacken-1: aerial imagery before (a) and during the event (c) with corresponding DSMs (b,d), 2D (e) and fusion-based 3D change detection result (f).
Figure 9.
Test region Wacken-1: aerial imagery before (a) and during the event (c) with corresponding DSMs (b,d), 2D (e) and fusion-based 3D change detection result (f).

Figure 10.
Test region Wacken-2: Aerial imagery before (a) and during the event (c) with corresponding DSMs (b,d), 2D (e) and fusion-based 3D change detection result (f).
Figure 10.
Test region Wacken-2: Aerial imagery before (a) and during the event (c) with corresponding DSMs (b,d), 2D (e) and fusion-based 3D change detection result (f).

Figure 11.
Test region Wittenberg-1: Aerial imagery before (a) and during the event (c) with corresponding DSMs (b,d), 2D (e) and fusion-based 3D change detection result (f).
Figure 11.
Test region Wittenberg-1: Aerial imagery before (a) and during the event (c) with corresponding DSMs (b,d), 2D (e) and fusion-based 3D change detection result (f).

Figure 12.
Test region Wittenberg-2: aerial imagery before (a) and during the event (c) with corresponding DSMs (b,d), 2D (e) and fusion-based 3D change detection result (f).
Figure 12.
Test region Wittenberg-2: aerial imagery before (a) and during the event (c) with corresponding DSMs (b,d), 2D (e) and fusion-based 3D change detection result (f).

Figure 13.
Change masks overlapped with the reference datasets for all four test regions (green: true detected; red: false alarm; blue: missed alarm).
Figure 13.
Change masks overlapped with the reference datasets for all four test regions (green: true detected; red: false alarm; blue: missed alarm).


Table 1.
Area under a receiver operating characteristic curve (AUC) comparison of the proposed test sites. CVA: change vector analyses, IRMAD: Interactively Reweighted Multivariate Alteration Detection.
Table 1.
Area under a receiver operating characteristic curve (AUC) comparison of the proposed test sites. CVA: change vector analyses, IRMAD: Interactively Reweighted Multivariate Alteration Detection.
| Methods | Wacken-1 | Wacken-2 | Wittenberg-1 | Wittenberg-2 |
|---|---|---|---|---|
| CVA | 0.8542 | 0.8035 | 0.6094 | 0.6703 |
| IRMAD | 0.9372 | 0.9194 | 0.8946 | 0.7587 |
| Height | 0.9357 | 0.8988 | 0.8479 | 0.9017 |
| Fusion-based | 0.9566 | 0.9198 | 0.9393 | 0.9115 |
Table 2.
Overall accuracy (OA) and kappa accuracy (KA) of the change masks of the proposed test sites.
Table 2.
Overall accuracy (OA) and kappa accuracy (KA) of the change masks of the proposed test sites.
| Methods | Wacken-1 | Wacken-2 | Wittenberg-1 | Wittenberg-2 |
|---|---|---|---|---|
| OA | 0.9127 | 0.9002 | 0.9530 | 0.9841 |
| KA | 0.7522 | 0.6786 | 0.6104 | 0.4464 |
© 2018 by the authors. Licensee MDPI, Basel, Switzerland. This article is an open access article distributed under the terms and conditions of the Creative Commons Attribution (CC BY) license (http://creativecommons.org/licenses/by/4.0/).
Share and Cite
MDPI and ACS Style
Gstaiger, V.; Tian, J.; Kiefl, R.; Kurz, F. 2D vs. 3D Change Detection Using Aerial Imagery to Support Crisis Management of Large-Scale Events. Remote Sens. 2018, 10, 2054. https://0-doi-org.brum.beds.ac.uk/10.3390/rs10122054
AMA Style
Gstaiger V, Tian J, Kiefl R, Kurz F. 2D vs. 3D Change Detection Using Aerial Imagery to Support Crisis Management of Large-Scale Events. Remote Sensing. 2018; 10(12):2054. https://0-doi-org.brum.beds.ac.uk/10.3390/rs10122054
Chicago/Turabian StyleGstaiger, Veronika, Jiaojiao Tian, Ralph Kiefl, and Franz Kurz. 2018. "2D vs. 3D Change Detection Using Aerial Imagery to Support Crisis Management of Large-Scale Events" Remote Sensing 10, no. 12: 2054. https://0-doi-org.brum.beds.ac.uk/10.3390/rs10122054
Note that from the first issue of 2016, this journal uses article numbers instead of page numbers. See further details here.