Article

Super-Resolution Reconstruction and Its Application Based on Multilevel Main Structure and Detail Boosting

1
College of Resource Environment and Tourism, Capital Normal University, Beijing 100048, China
2
Satellite Surveying and Mapping Application Center, NASG, Beijing 100048, China
3
Key Laboratory of Satellite Surveying and Mapping Technology and Application, NASG, Beijing 10048, China
4
School of Geomatics, Liaoning Technical University, Fuxin 123000, China
5
School of Earth Science and Engineering, Hohai University, Nanjing 211100, China
6
School of Electronic and Information Engineering, Liaoning Technical University, Huludao 125105, China
*
Authors to whom correspondence should be addressed.
Remote Sens. 2018, 10(12), 2065; https://0-doi-org.brum.beds.ac.uk/10.3390/rs10122065
Submission received: 28 October 2018 / Revised: 30 November 2018 / Accepted: 5 December 2018 / Published: 19 December 2018

Abstract

:
Vivid main structure and rich texture detail are important factors with which to determine the quality of high-resolution images after super-resolution (SR) reconstruction. Owing to the loss of high-frequency information in the process of SR reconstruction and the limitation of the accurate estimation of the unknown information in the inversion process, a gap still exists between the high-resolution image and the real image. The main structure can better preserve the edge structure of the image, and detail boosting can compensate for the missing high-frequency information in the reconstruction process. Therefore, a novel single remote-sensing image SR reconstruction method based on multilevel main structure and detail boosting (MMSDB-SR) is put forward in this paper. First, the multilevel main structure was obtained based on the decomposition of the remote-sensing image through use of the relative total variation model. Subsequently, multilevel texture detail information was obtained by a difference process. Second, the multilevel main structure and texture detail were reconstructed separately. The detail-boosting function was used to compensate for the missing high-frequency details in the reconstruction process. Finally, the high-resolution remote-sensing image with clear edge and rich texture detail can be obtained by fusing the multilevel main structure and texture-detail information. The experimental results show that the reconstructed high-resolution image has high clarity, high fidelity, and multi-detail visual effects, and the objective evaluation index exhibits significant improvement. Actual results show an average gain in entropy of up to 0.34 dB for an up-scaling of 2. Real results show an average gain in enhancement measure evaluation of up to 2.42 for an up-scaling of 2. The robustness and universality of the proposed SR method are verified.

Graphical Abstract

1. Introduction

Super-resolution (SR) reconstruction is the technology of obtaining high-resolution (HR) images or sequences from one or more low-resolution (LR) observation images by means of signal processing [1]. SR reconstruction is widely used in remote sensing, video surveillance, medical diagnosis, military reconnaissance, and other civil and military fields [2]. This research has important theoretical significance and application value. In recent years, it has become one of the most active research topics in the field of image reconstruction. In the field of remote sensing, with the rapid development of optical remote-sensing satellite technology, the amount of remote-sensing data in China is becoming increasingly abundant, but a gap still exists regarding the resolution of foreign optical satellite images. Therefore, the resolution of optical satellite images can be improved with the help of SR reconstruction technology at a small economic cost to meet the increasingly more refined applications of remote-sensing images [3,4,5]. At present, in terms of the amount of image data involved in SR reconstruction, the SR reconstruction method should be divided into SR reconstruction technology based on single image and that based on multiple images.
The multiple-image-based SR methods mostly exploit the differences between LR images to generate HR images. Owing to the fact that the complementary information contained in multiple images can make up for the high-frequency information lost in the reconstruction process, it has received the attention of many researchers and promising results have been forthcoming. In the remote sensing field, the satellite has the return visit period, in which a multi-sensor can achieve multi-angle observation, and different satellites can acquire images covering the same area with similar exposures. That is to say, image data is easy to obtain. For example, three-line-array images captured seconds apart in the same satellite overpass are shown in Figure 1. As shown in Figure 1, despite the fact that the images are acquired easier, the television tower is different in the images due to the different observation angles. However, beyond that, image distortion, terrain undulation, and shadow existence, are much more challenging for multiple-image-based SR methods. These factors can exert a significant influence on the quality of the reconstructed image. In addition, high-precision sub-pixel registration accuracy of homologous or heterogenous images is still a bottleneck.
By contrast, single-image SR is a valuable and efficient method. However, the key issues remain to be solved urgently, which are how to recover clear edges and finer texture details. Key challenges in single-image SR reconstruction, then, are to fully exploit the information contained in the image and to retain the clarity of the reconstructed image edge, with an aim toward reconstructing the HR image, which can provide more detailed information about the target scene. In summary, to reconstruct a high-resolution remote-sensing image with high clarity, high fidelity, and multiple textures, a flexible single-remote-sensing-image SR reconstruction method based on multilevel main structure and detail boosting (MMSDB-SR) is presented. One embodying a simple and yet effective method of achieving retention of the edge structure of the reconstructed image and restoration of the high-frequency texture details.

2. Related Work

The existing single-image SR reconstruction methods can be divided into four categories [6,7]: SR models based on interpolation, based on reconstruction, based on deep learning, and based on information enhancement.
SR models based on interpolation comprise the most basic SR reconstruction method [8,9,10], and they are widely used as a pre-treatment method for other SR reconstructions in practical applications. Interpolation-based SR models have the performance advantages of simple operation and fast speed, but image edge structure is not taken into account in the process of SR reconstruction using them. This may lead to image edges spreading in different degrees and detail information blurring in the reconstructed image. SR models based on reconstruction [11,12,13] are usually used to incorporate some prior distribution of the corresponding HR image to constrain the constructed result. Many models have been introduced in reconstruction-based SR models, such as the iteration back-projection (IBP) [14], maximum a posteriori (MAP) [15], and the total variation (TV) [12] models, among others. These models aim to solve the difficult problem of SR reconstruction and obtain a stable and relative optimal solution. Although a SR model based on reconstruction is simple to realize, it has the drawback of losing high-frequency information and blurring the edges. Moreover, prior-knowledge-provided accuracy is still a difficult problem in remote-sensing images with complex topography [16,17]. In recent years, a SR reconstruction method based on deep learning was developed [18,19] in which a large number of convolution templates were utilized to learn the features of images. The high-level structural features are learned from patches between LR and HR images in deep-learning-based SR models. On the basis of the learning features, the quality of reconstructed images can be improved effectively. In addition, other state-of-the-art SR methods have been proposed. Image SR using deep convolutional networks (SRCNN) was put forward by Dong et al. [20]. Accurate image SR using very deep convolutional networks (VDSR) was introduced by Kim et al. [21]. These approaches have shown great promise, but a large-capacity training-sample library is needed and the training process is very time-consuming. Such methods can only realize the designated up-scaling factor reconstruction under the training model, and thus a certain lack of flexibility exists. When the convolutional layer is less, there are still some deficiencies in the reconstruction of high-frequency information. SR models based on deep learning often lack high-frequency details and are perceptually unsatisfying in that they fail to match the fidelity expected at the higher remote-sensing image resolutions. SR models based on information enhancement [22,23,24] comprise a kind of method based on image pre-processing. A level of image-enhancement technology has been introduced in some SR models to compensate the loss of high-frequency information in the reconstruction process [25,26]. The problem of SR reconstruction model complexity is solved in such information-enhancement-based SR models. Nevertheless, how to balance the scale of image enhancement and to avoid reconstruction images appearing with excessively sharp edges are the difficult problems introduced in their use.
In summary, a method of improving the visibility and texture details of a reconstructed image from a LR remote-sensing image with clear edge structure and rich texture details based on the multilevel main structure and detail boosting is presented in this paper, the rest of which is organized as follows. We describe the SR reconstruction method and objective evaluation indexes are introduced in Section 3. Experimental analysis and discussion of the SR reconstruction are provided in Section 4. A review of SR applications in Section 5, and final remarks in Section 6.

3. Method

Here, contrary to previous works, a SR reconstruction method based on multilevel main structure and detail boosting is put forward. This method aims to solve the existing problems of edge blurring and lack of detail information in single-image SR reconstruction methods. Motivated by this, a novel and flexible single-image SR method flow is introduced. First, the relative total variation (RTV) algorithm is used to extract multilevel main structure information, and multilevel detail information is obtained by a difference method. Next, the multilevel main structure and texture-detail information are up-sampled separately. Finally, a detail-boosting function is utilized to enhance the texture-detail information in the HR image. Under the premise of controlling excessive edge sharpening, the multilevel main structure and texture-detail information are fused. The complete single remote-sensing image SR reconstruction flow is shown in Figure 2.

3.1. RTV Algorithm

For remote-sensing images, the meaningful structure of images is the main data of the human visual perception system, and thus the main structure forms an important basis for acquiring image information. Therefore, it is valuable to extract meaningful structural data and texture details from the image; it can also be powerful support for SR reconstruction based on a single remote-sensing image. The RTV algorithm was proposed in the literature [27], and it can effectively decompose the main structural and texture details of an image whether the texture is regular or symmetric. In other words, this algorithm is general and arbitrary and is applicable to non-uniform or anisotropic textures. The objective function of the RTV model is finally expressed as
ξ ( ε , λ , I , S ) = P ( S P I p ) 2 + λ ( D x ( p ) L x ( p ) + ε + D y ( p ) L y ( p ) + ε ) S = arg min S ξ ( ε , λ , I , S )
where I is the input image, p the pixel index of the two-dimensional image, S the output structure image, λ a weight value that controls the degree of separation between the main structure and texture detail of the image, and ε a small positive value introduced to avoid the case of the denominator appearing to be 0, the fixed value of which is 0.001. A general pixel-wise windowed total variation measure is contained in this method. D x ( p ) and D y ( p ) are windowed total variations in the x and y directions, respectively, for pixel p. To help distinguish prominent structures from the texture elements, a novel windowed inherent variation is defined. L x ( p ) and L y ( p ) are windowed inherent variations in the x and y directions, respectively, for pixel p. expressed as
D x ( p ) = q R ( p ) g p , q · | ( x S ) q | D y ( p ) = q R ( p ) g p , q · | ( y S ) q | , L x ( p ) = | q R ( p ) g p , q · ( x S ) q | L y ( p ) = | q R ( p ) g p , q · ( y S ) q |
where q belongs to R(p), the window centered at pixel p. x and y are the partial derivatives in two directions. g p , q is a weighting function, expressed as
g p , q exp ( ( x p x q ) 2 + ( y p y q ) 2 2 δ 2 ) ,
where δ controls the spatial scale of the window, the size of δ is an important parameter in the process of image structure and texture separation, the range of empirical values is between 0 and 8, and the δ increase can suppress the texture very well and retain the effect of sharpening the edge of the main structure. Next, we provide an example to introduce the solution process of Equation (3) in the x direction:
p D x ( p ) L x ( p ) + ε = q p R ( q ) g p , q | q R ( p ) g p , q · ( x S ) q | + ε | ( x S ) q | q p R ( q ) g p , q L x ( x ) + ε 1 | ( x S ) q | + ε s ( x S ) q 2 = q u x q w x q ( x S ) q 2 .
Actually, the second line of Equation (4) is an approximate calculation, since the small value ε s is introduced. Here, the quadratic term ( x S ) q 2 is reconstructed and the nonlinear parts u x q , w x q , u x q , w x q are expressed as follows:
u x q = p R ( q ) g p , q L x ( p ) + ε = ( G δ 1 | G δ x S | + ε ) q , w x q = 1 | ( x S ) q | + ε s .
Here, G δ is the Gaussian kernel function of standard deviation δ and * a convolution symbol. The calculation in the y direction is similar to that in the x direction.
By deduction, we can transform Formula (1) into the following matrix form:
ξ ( ε , λ , I , S ) = ( v S v I ) T ( v S v I ) + λ ( v S T C x T U x W x C x v S + v S T C y T U y W y C y v S ) ,
where v S and v I represent the images are vectorized into column vectors, respectively; C x and C y are the Toeplitz matrices from the discrete gradient operators with forward difference. U x , U y , W x , and W y are diagonal matrices, the diagonal values of which are, respectively, U x [ i , j ] = u x i , U y [ i , j ] = u y i , W x [ i , j ] = w x i , and W y [ i , j ] = w y i .
The form in Equation (6) enables a special iterative optimization procedure. A numerically stable approximation is naturally obtained, the optimization is as follows. First, the values of u and w are straightforward to calculate based on Equation (5). Second, the values of Ux, Uy, Wx and Wy are used, minimization boils down to solving a linear system in each iteration as
v S t + 1 = ( 1 + λ L t ) - 1 v I .
Here, 1 is a unit matrix, L t = C x T U x t W x t C x + C y T U y t W y t C y the weight matrix, and ( 1 + λ L t ) the symmetric positive-definite Laplacian matrix and an invertible matrix. We can directly solve the inverse operation of the matrix or use a conjugate gradient algorithm to solve it. The result is obtained after t-th iteration. The whole optimization process is summarized in Reference [27].

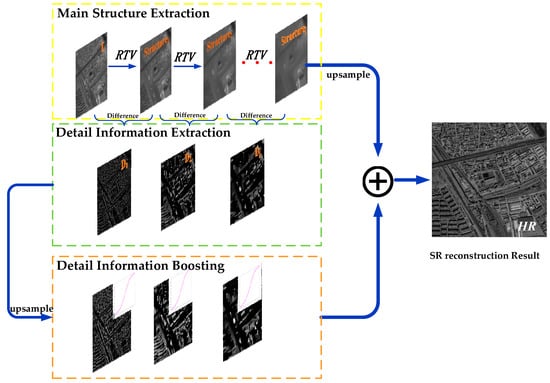
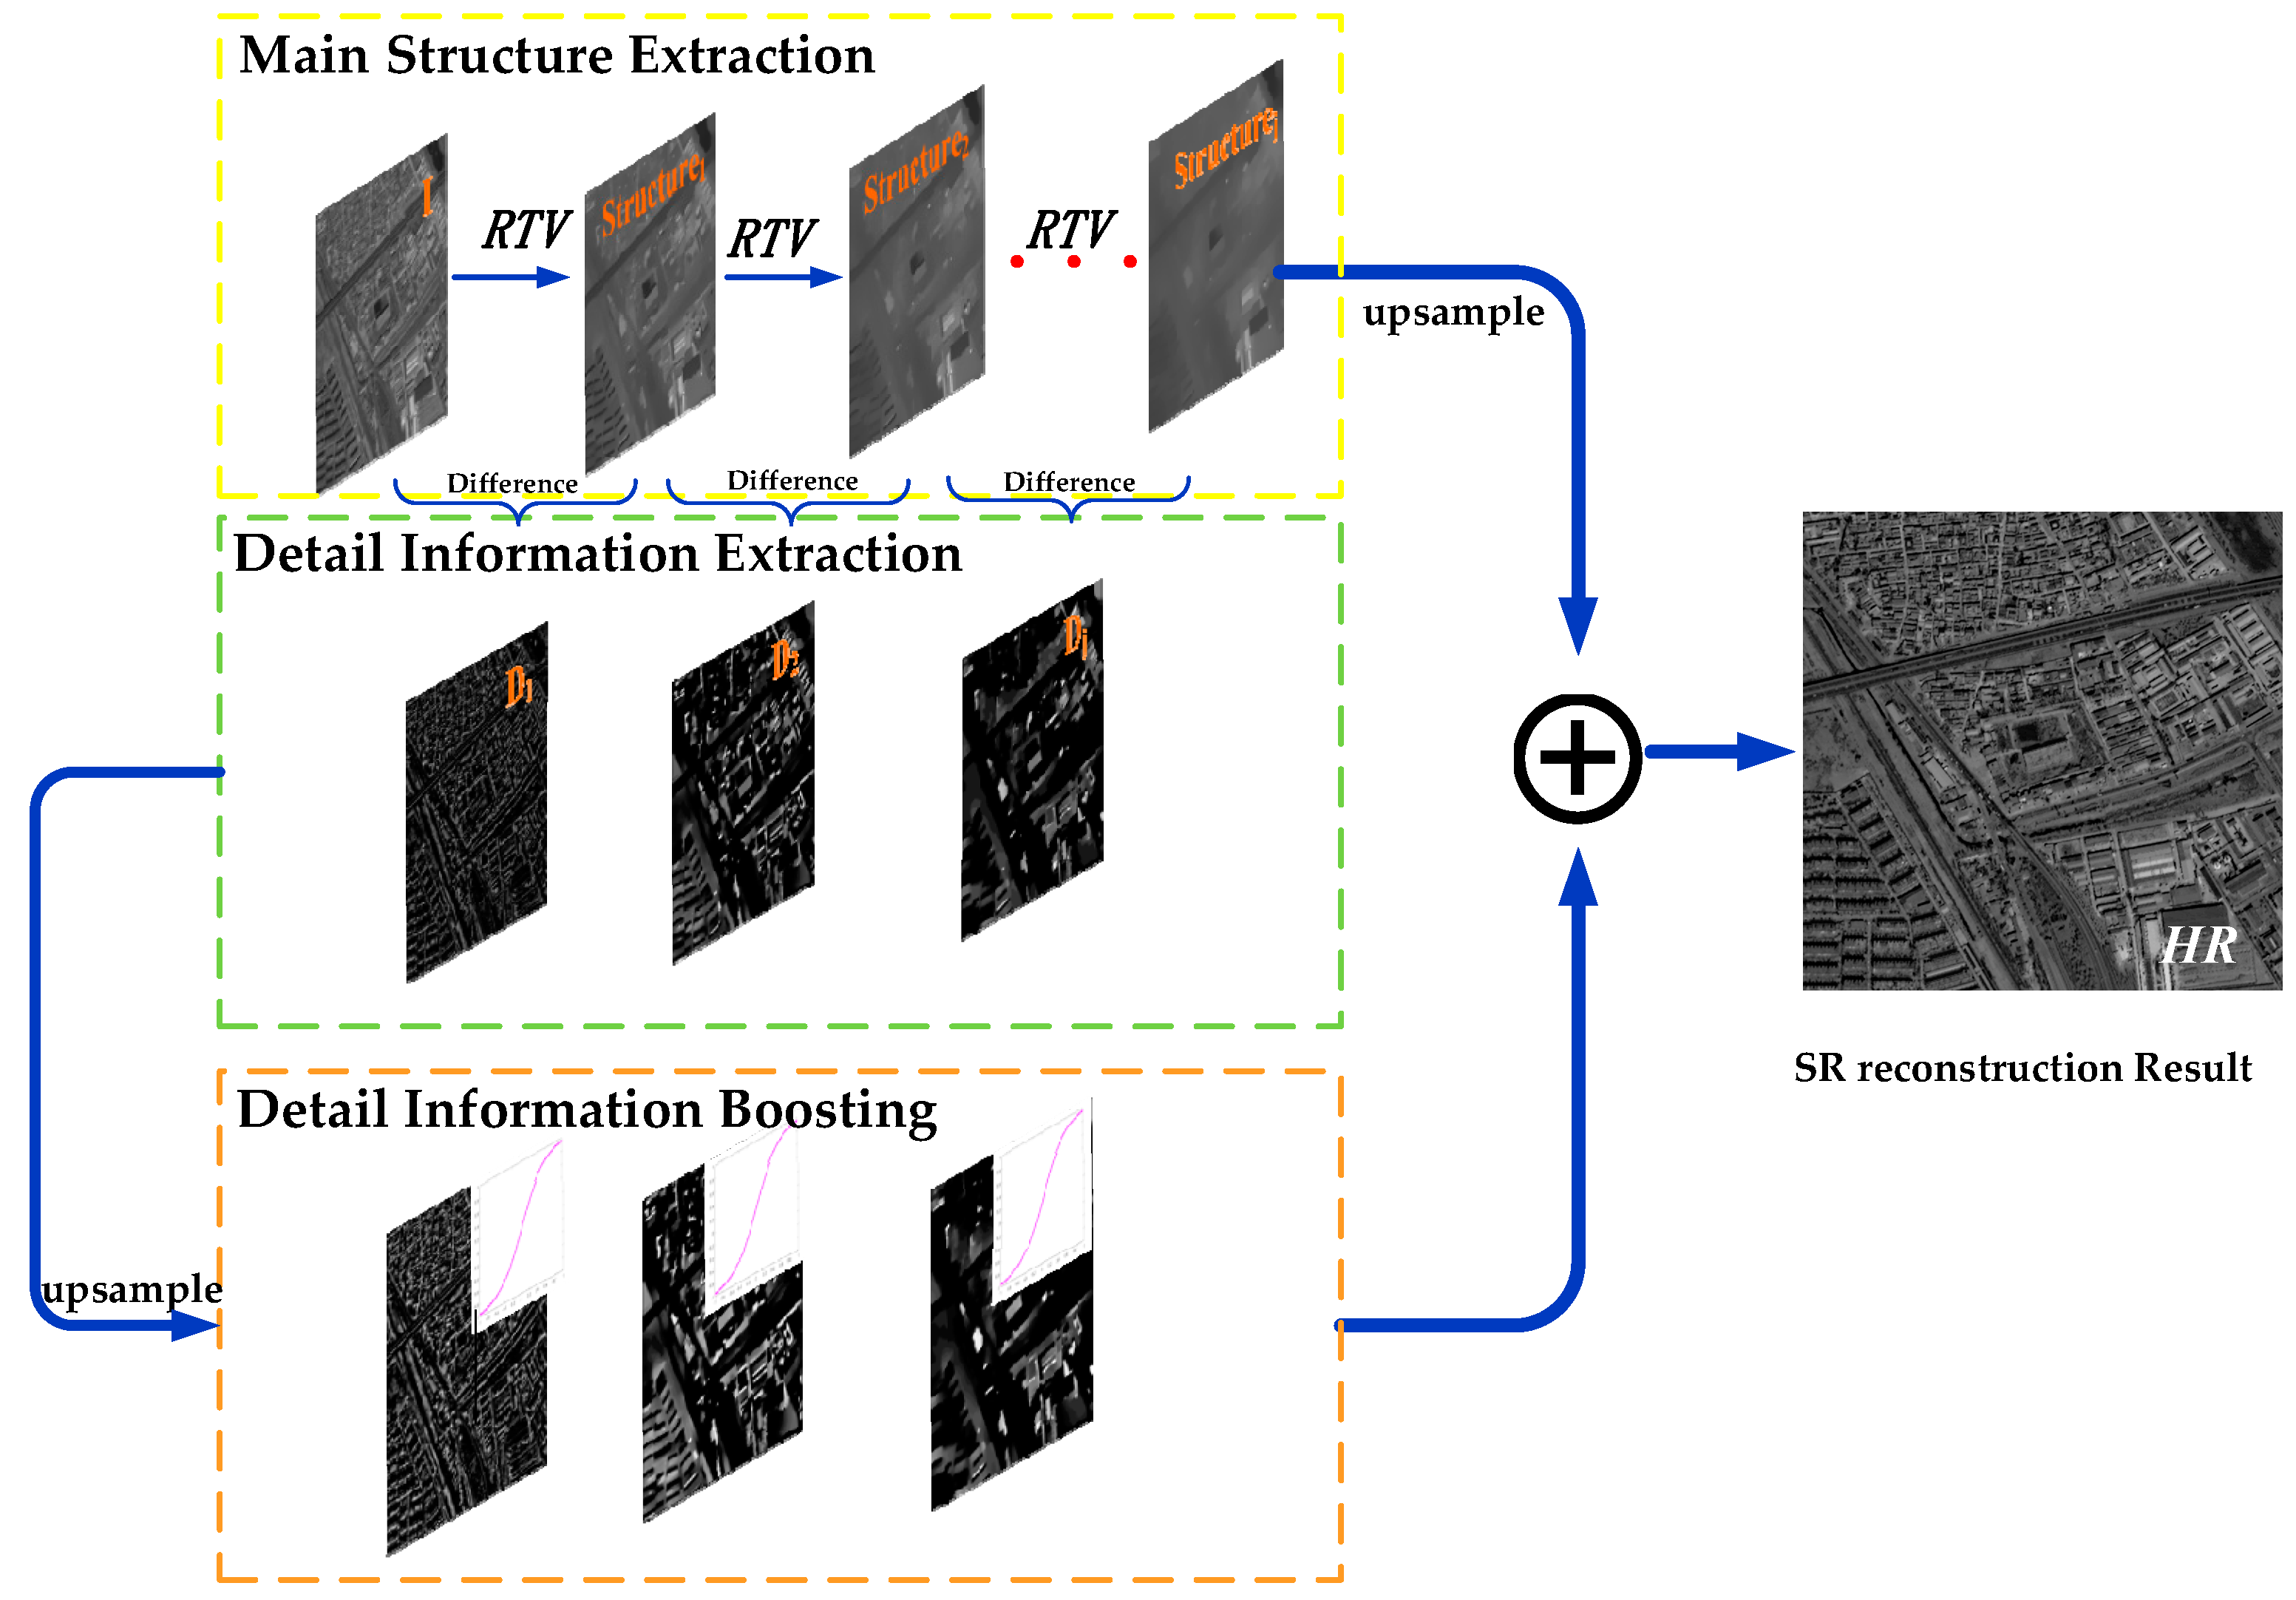
3.2. Multilevel Main Structure and Detail-Information Extraction

From the psychological point of view, the overall structure of the image is the main source of human visual perception. Definition of the edge main structure is one of the important indicators that determine the resolution of an image. Owing to the RTV algorithm being applicable to non-uniform or anisotropic textures, it can be used to extract the main structure of edges from remote-sensing images with complex textures. Therefore, the RTV algorithm is used to decompose the main structure and texture detail in single remote-sensing-image SR reconstruction. The accuracy of HR-image-structure estimation can be improved based on edge main structure reconstruction. Multilevel main structural information is obtained by adjusting the parameters of the RTV algorithm. For example, the target of multilevel decomposition is to acquire a set of main structure information v S j (scale j = 0, 1, …, m). Suppose that the input original remote-sensing image is decomposed into an m-layer main structure. The image must then be decomposed at m + 1 levels. When the main structure level is j = 0, we set v S 0 = I . Then, the RTV algorithm is iteratively applied to the input image and a series of multilevel edge main structures b 1 , , b j are obtained. The progressive main structure is mainly structured by the parameter increase at each level j. We set the initial parameters λj=1 = 1 × 10⁻² and δ j = 1 = 0.5 , and then set λ j = j * λ j = 1 and δ j = j * δ j = 1 for all j 1 . The multilevel main structure information can be described as b 1 , , b j , and the mathematical description of multilevel main structure extraction is expressed as follows:
v s j t + 1 = { R T V ( v s 0 , λ j , δ j ) i f   j = 1 R T V ( v s j 1 , λ j , δ j ) o t h e r w i s e .
To fully extract the information carried by a single image, multilevel texture detail is acquired through multilevel main structure difference processing. The specific computational process of extracting different levels of texture-detail information is as follows.
d 1 = I v S 1 , d 2 = v S 1 v S 2 , , d i = v S j 1 v S j ( i = 1 , 2 , , m ) .
An edge-guided image-interpolation algorithm via directional filtering and data fusion [10] is used as an up-sampling method in this paper. Up-sampling the multilevel main structure and detail information. Related information of multiple-direction known pixel points is taken into consideration in this interpolation algorithm. Clear and saliency edge main structure can be retained in the reconstruction result. The multilevel main structure v S j was reconstructed V S j , the multilevel detail information di was reconstructed Di.

3.3. Detail Boosting and Fusion

Compared with a SR reconstruction based on multiple images, it is difficult for a single image to provide complementary information and compensate the lost detail information in the reconstruction process. To solve this problem, we converted the image into a signal. The middle part of the signal is the texture detail of the image and the two sides are mostly the edge main structure of the image. To make the reconstruction of HR image restore more vivid texture detail, a flexible detail-boosting function is proposed in this paper, one that can compensate for the lost high-frequency detail in the SR reconstruction process. The mathematical description is:
F ( D i ; α , β i ) = ( 1 β i sign ( 1 e 2 D i α 1 + e 2 D i α ) ) · 1 e 2 D i α 1 + e 2 D i α ,
where D i is the reconstructed multilevel texture detail information, i refers to the range of samples of Di, α controls the amount of detail boosting, β controls the high-frequency range compression, and sign is better known as signum function. The value of α typically varies in a small range (1,10], β i ( i = 1 , , m ) are usually fixed to 0.5, 0.25 and 0.25, respectively.
The function has the task of boosting the texture detail of the image and of suppressing the reconstruction image oversaturation. We set function f equal to 1 e 2 D i α / 1 + e 2 D i α , where f belongs to the hyperbolic tangent function and is a sigmoid function. A sigmoid function is an S-shaped function commonly seen in biology, and is also known as an S-shaped growth curve. A sigmoid function is often used as a threshold function in deep-learning convolution neural networks. In information science, the sigmoid function has the inverse function. A sigmoid function can map variables to [0,1] and the function-value range is [−1,1]. For multiple-scale SR experiments, different detail-boosting parameters were applied to the multilevel detail information and a series of differently enhanced texture-detail levels D1, … ,Di obtained. The progressive detail-boosting information was realized by increasing the parameter α. We set α × η = 2 ( j 1 ) α × 2 , set the initial parameter α × 2 = 2 , the subscript × η is an up-scaling factor of SR reconstruction. The detail-boosting function is used to activate the details of the middle texture. The detail-boosting information can be exploited to infer high-frequency components. While Di is acquired by difference processing from the reconstructed multilevel main structure, Di is mixed with a certain marginal main structure. When the texture-detail information Di is improved, the edge main structure information may be promoted simultaneously. This may lead to whole-image oversaturation. Consequently, the symbolic function and the parameter control the high-frequency range compression.
Finally, the multilevel main structure and texture-detail information are fused. An HR image is generated that contains the clear edge and rich texture detail. The fusion process is expressed as Equation (11) and the proposed SR reconstruction (SRR) method is outlined in Algorithm 1:
HR = i = 1 m F ( D i ; α , β i ) + j = 1 m v S j / m .
Algorithm 1. Multilevel Main Structure and Detail-Boosting SRR
1:Input: image I, up-scaling factor η ,
2:Initialization
3:For band=1: n do
4:   Decompose and obtain multilevel main structure, v S j = I , R T V ( v s j 1 , λ j , δ j )
5:   Calculate multilevel detail information, d i = v S j 1 v S j
6:   Up-sample multilevel main structure and texture detail, and get V S j and Dj
7:   Detail boosting with Equation (10)
8:   Fusion with Equation (11)
9:End for
10:Output: HR image

3.4. Objective Evaluation

How to evaluate quality improvement is also one of the key points of SR reconstruction. Referring to the evaluation method of most SR methods in the literature, the full-reference-image quality-assessment index Peak Signal-to-Noise Ratio (PSNR) [28] and Structural Similarity (SSIM) [29] were used in the simulation experiment. The full-reference-image quality-assessment algorithm needs a reference image that is the same size as the evaluated image. For remote-sensing satellites, a complete reference image cannot be obtained, which is also the significance of studying SR reconstruction of remote-sensing images. Under the circumstances, entropy [30] and enhancement measure evaluation (EME) [31] are used to evaluate the quality of SR reconstruction results in terms of whether they are satisfactory or not.
Peak Signal-to-Noise Ratio (PSNR). PSNR is one of the commonly quantitative evaluation methods and mainly used to evaluate the SR reconstructed image quality by calculating the mean square error between the real HR image and the reconstructed HR image. The higher PSNR value is, the better reconstruction image will be. The description of this index can be expressed as follows:
P N S R = 10 l g L 2 m n i = 1 m j = 1 n [ I H R ( i , j ) I S R ( i , j ) ] 2 ,
where I H R ( i , j ) is the real HR image and I S R ( i , j ) is the SR reconstruction image, m and n represent the line number and column number of the image, respectively, and L generally represents the gray distribution range of image.
Structural Similarity index (SSIM). SSIM is widely used in the SR reconstruction quality evaluation when the HR image exist. The mathematical description of the SSIM index is defined as:
S S I M = ( 2 μ x μ y + C 1 ) ( 2 δ x y + C 2 ) ( μ x 2 + μ y 2 + C 1 ) ( δ x 2 + δ y 2 + C 2 ) ,
where μx, μy is the average of x and y respectively, δ x 2 , δ y 2 are the variance of x and y respectively, δ x y is the covariance of x and y, C1, C2 are the constants.
Entropy. It is used to represent the degree of uniform distribution of any energy in space. The better the energy distribution, the larger the entropy value. The entropy of image information can be generally expressed as:
Entropy = i = 0 n P ( i ) log 2 P ( i ) ,
where P(i) is the probability of a pixel value i appearing in the image and i the grayscale range of the image. The larger the entropy value is, the larger the peak area of the image histogram. When the probability of all of the grayscale values tends to be equal, more image information will be carried, and the more abundant the information that will be contained.
Enhancement Measure Evaluation (EME). The principle of EME is to calculate the maximum and minimum ratios of the gray level in the sub-region, which is obtained by dividing the evaluated image into k1 × k2 sub-regions. The logarithm of the ratios is the evaluation result of the image detail. This evaluation index represents the degree of gray change of the local image. The larger the EME value, the richer the detail information in the image. The EME value is mathematically expressed as:
EME = 1 k 1 k 2 l = 1 k 2 k = 1 k 1 20 log I max ; k , l w I min ; k , l w ,
where I max ; k , l w and I min ; k , l w denote the maximum and minimum values of the local image blocks wk,l, respectively.

4. Experimental Analysis and Discussion

To verify the reliability and universality of the proposed SR reconstruction method based on multilevel main structure and detail boosting, the panchromatic and multispectral images of ZiYun-3 (ZY-3), GaoFen-2 (GF-2), and WorldView-2 were selected as experimental data. SR reconstruction experiments were carried out on a machine with an Intel(R) CPU E3-1505M v6 @3.00 GHz processor running a 64-bit operating system and the MATLAB R2016a platform (MathWorks, USA, Natick).

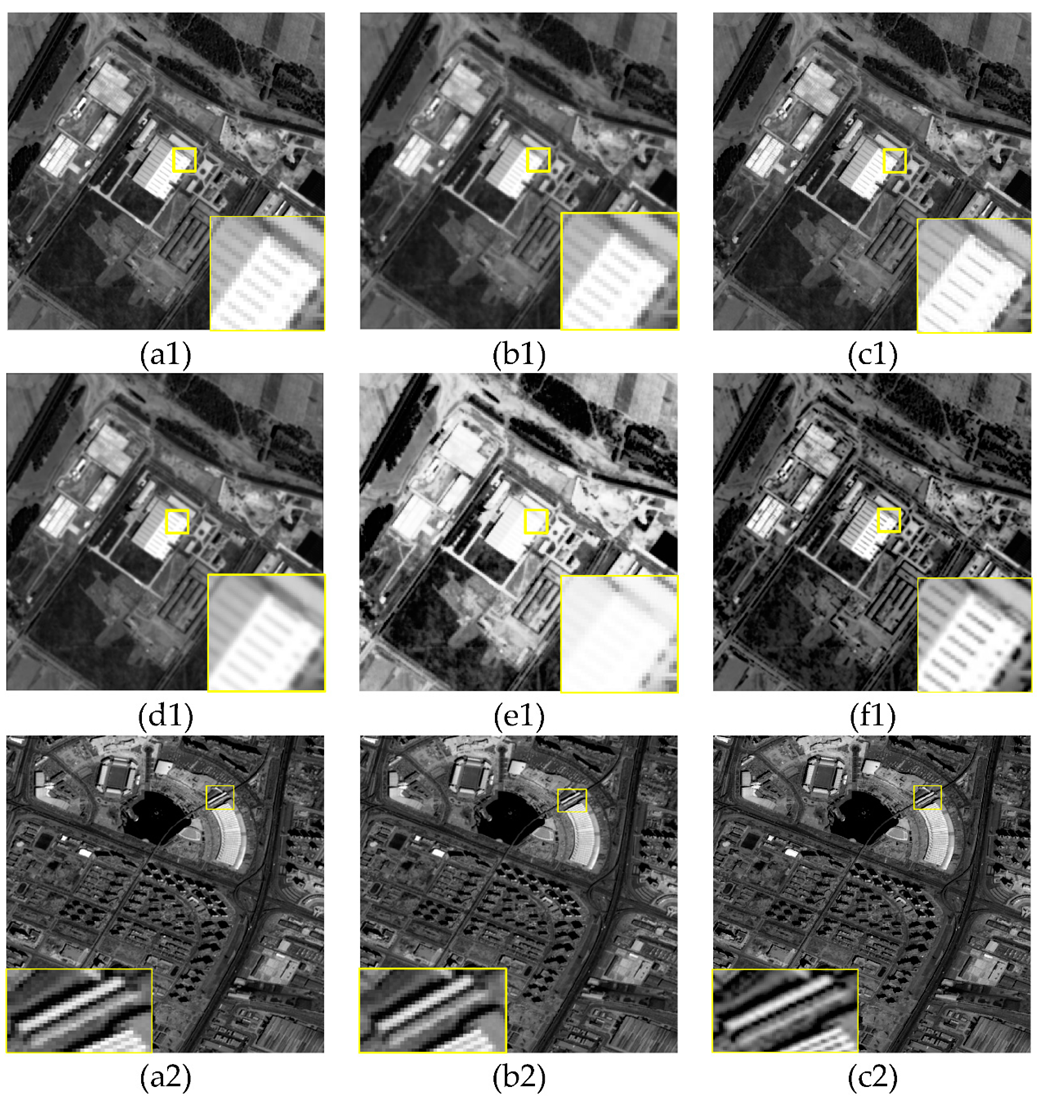
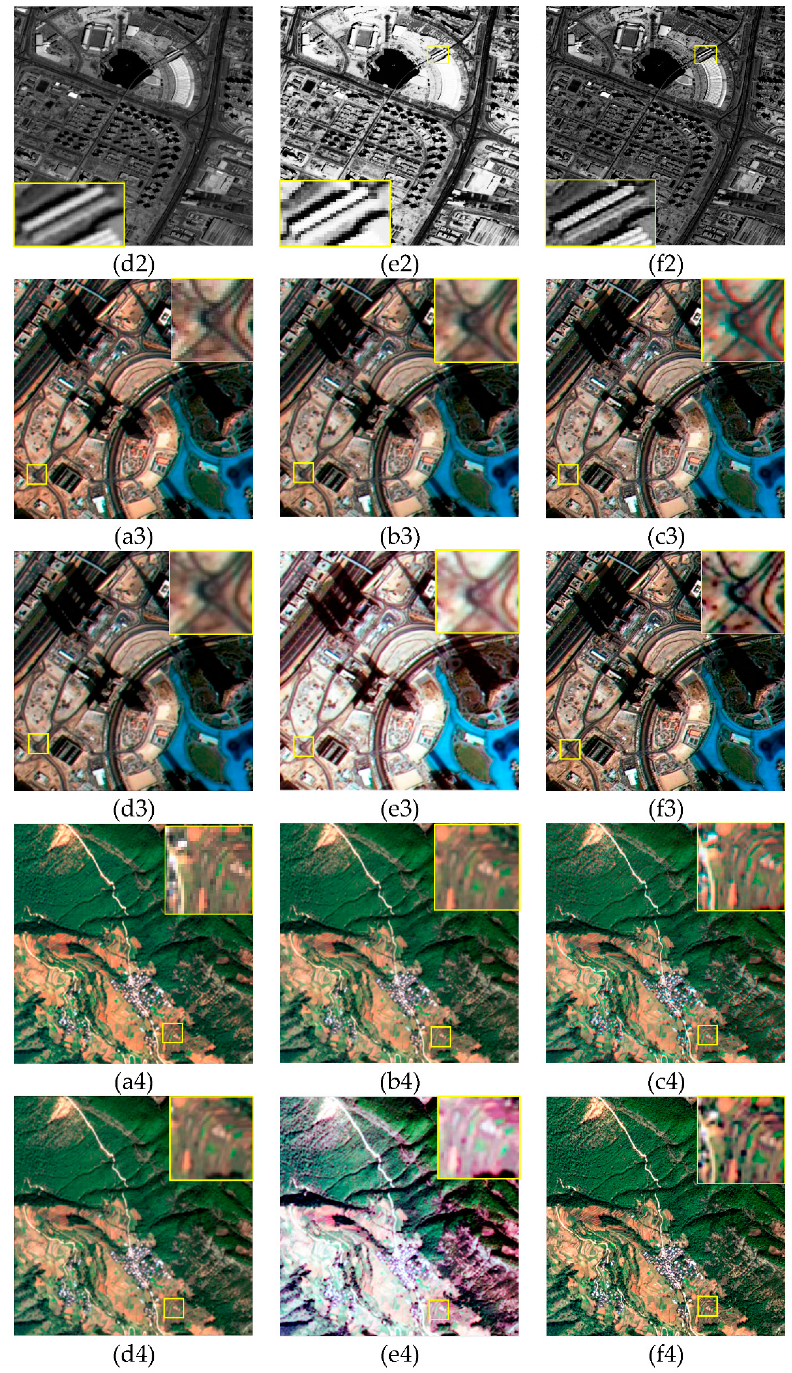
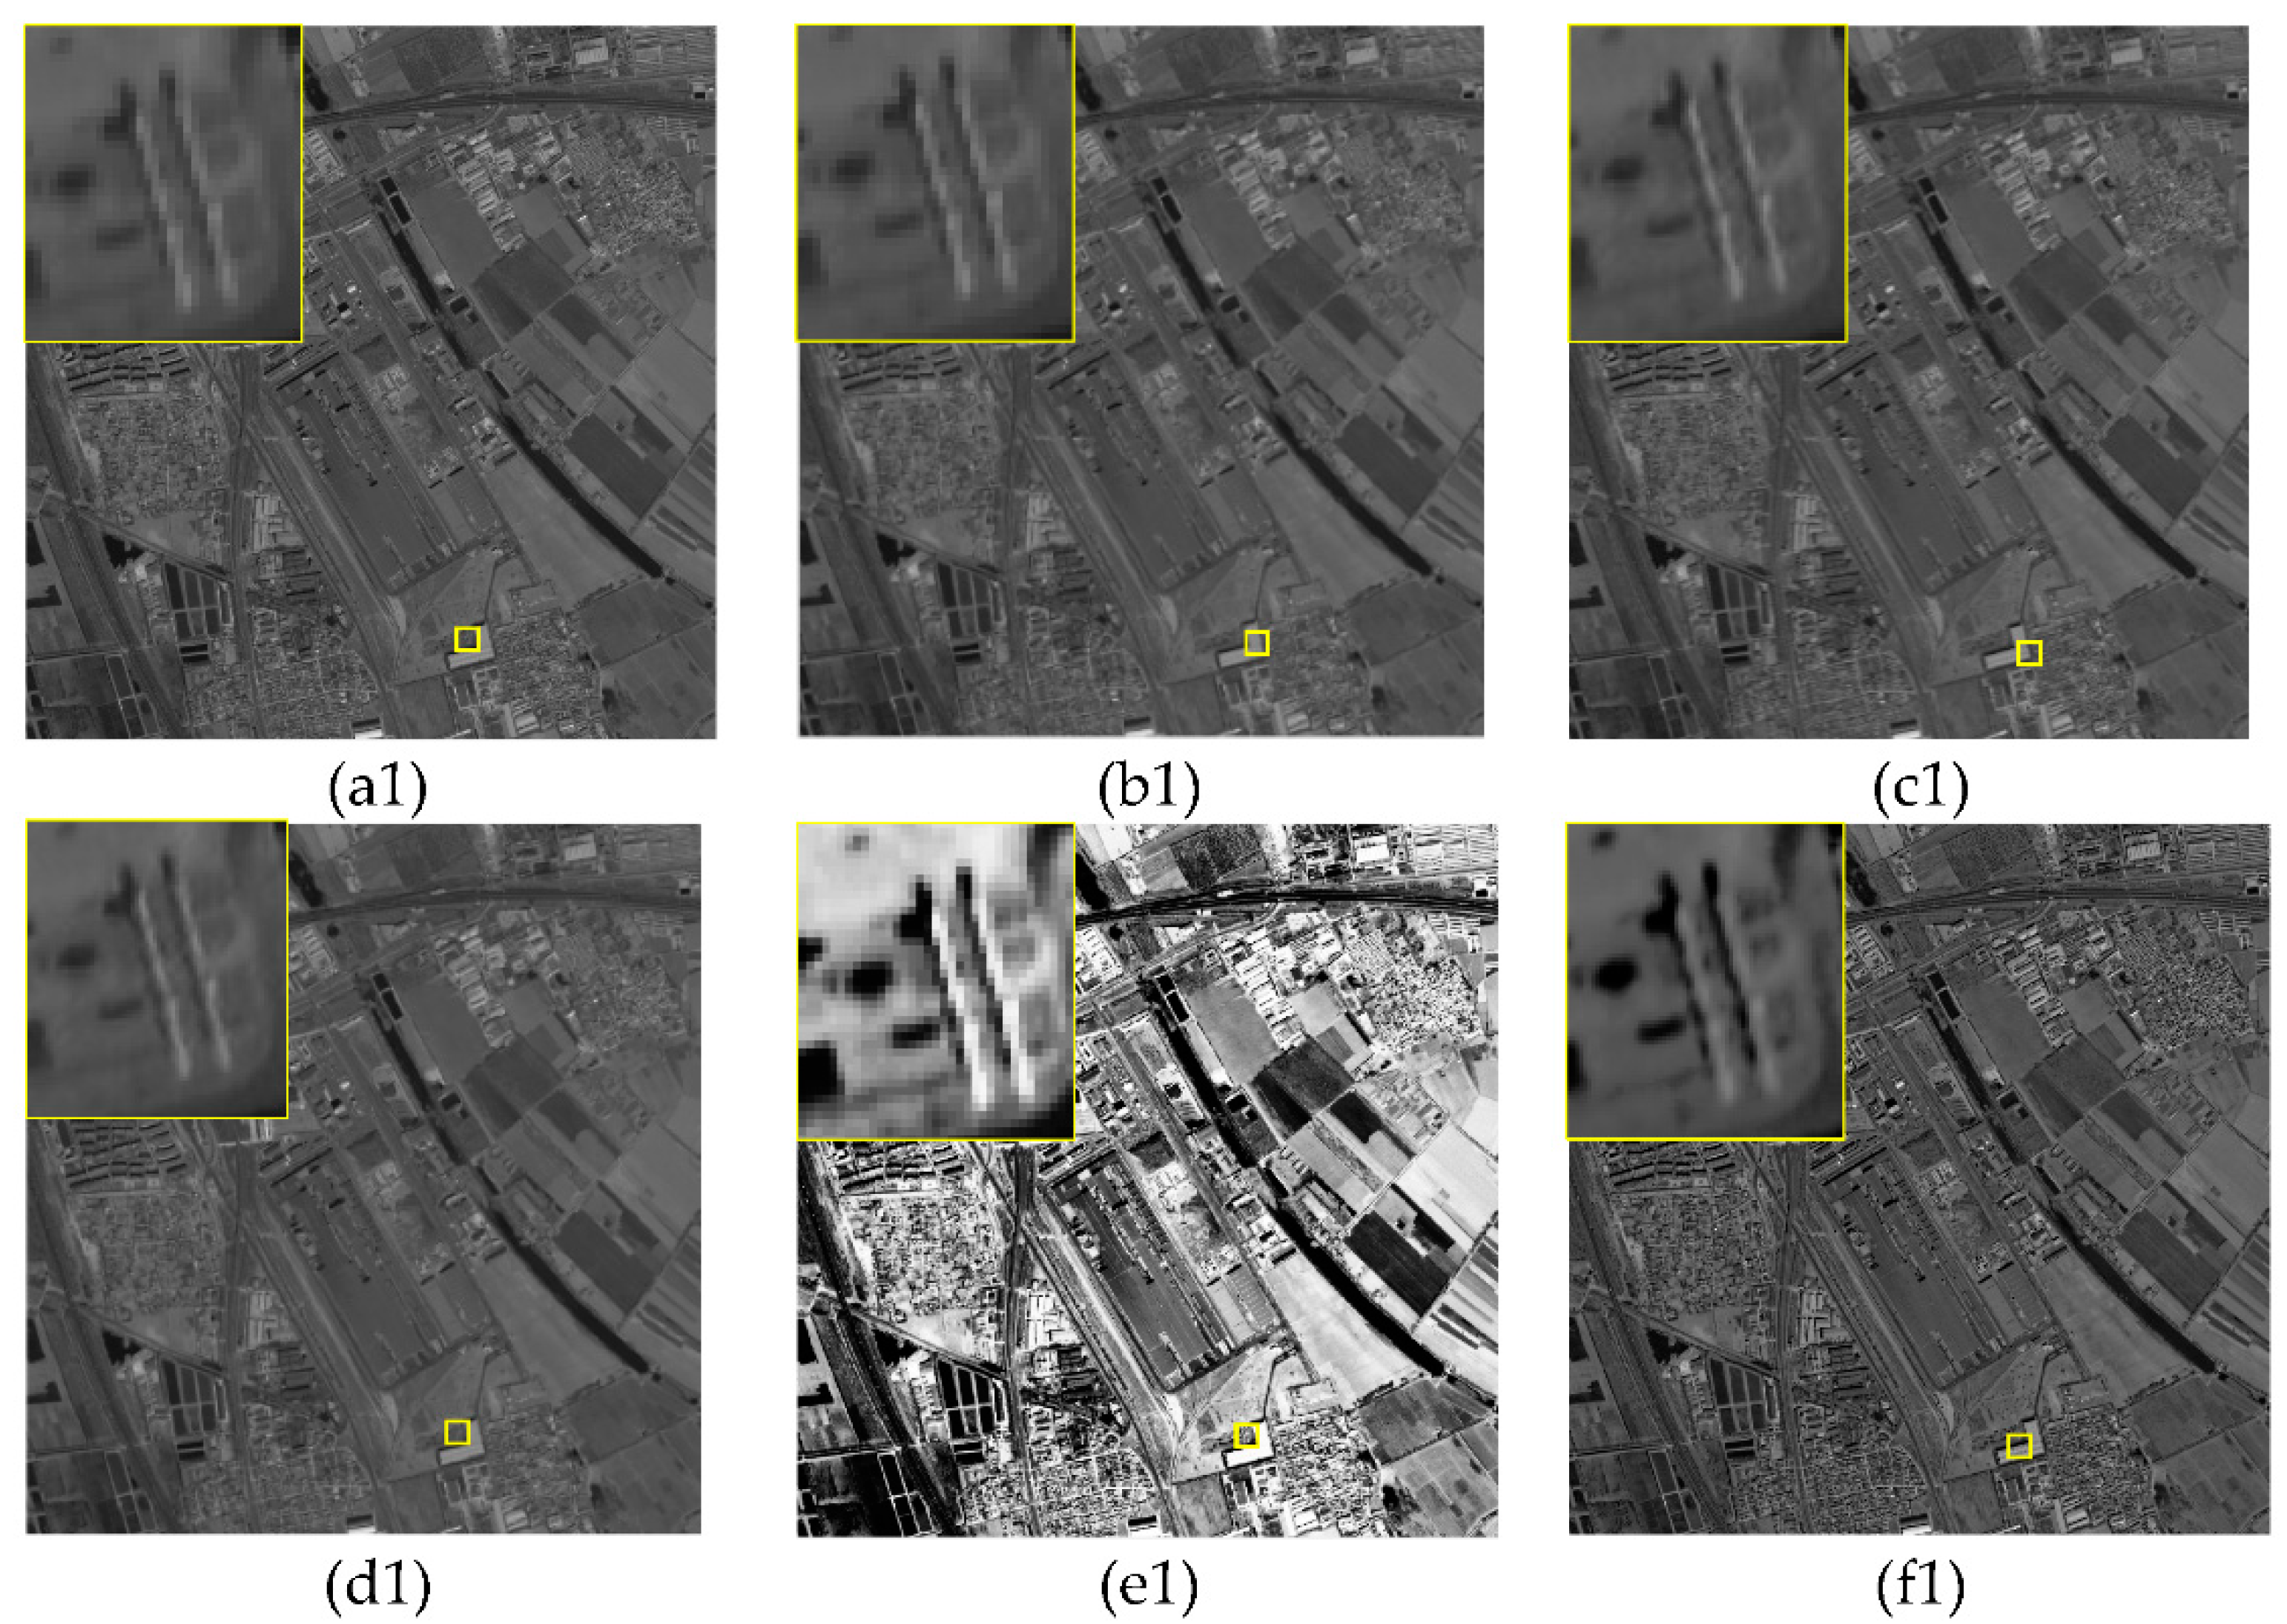
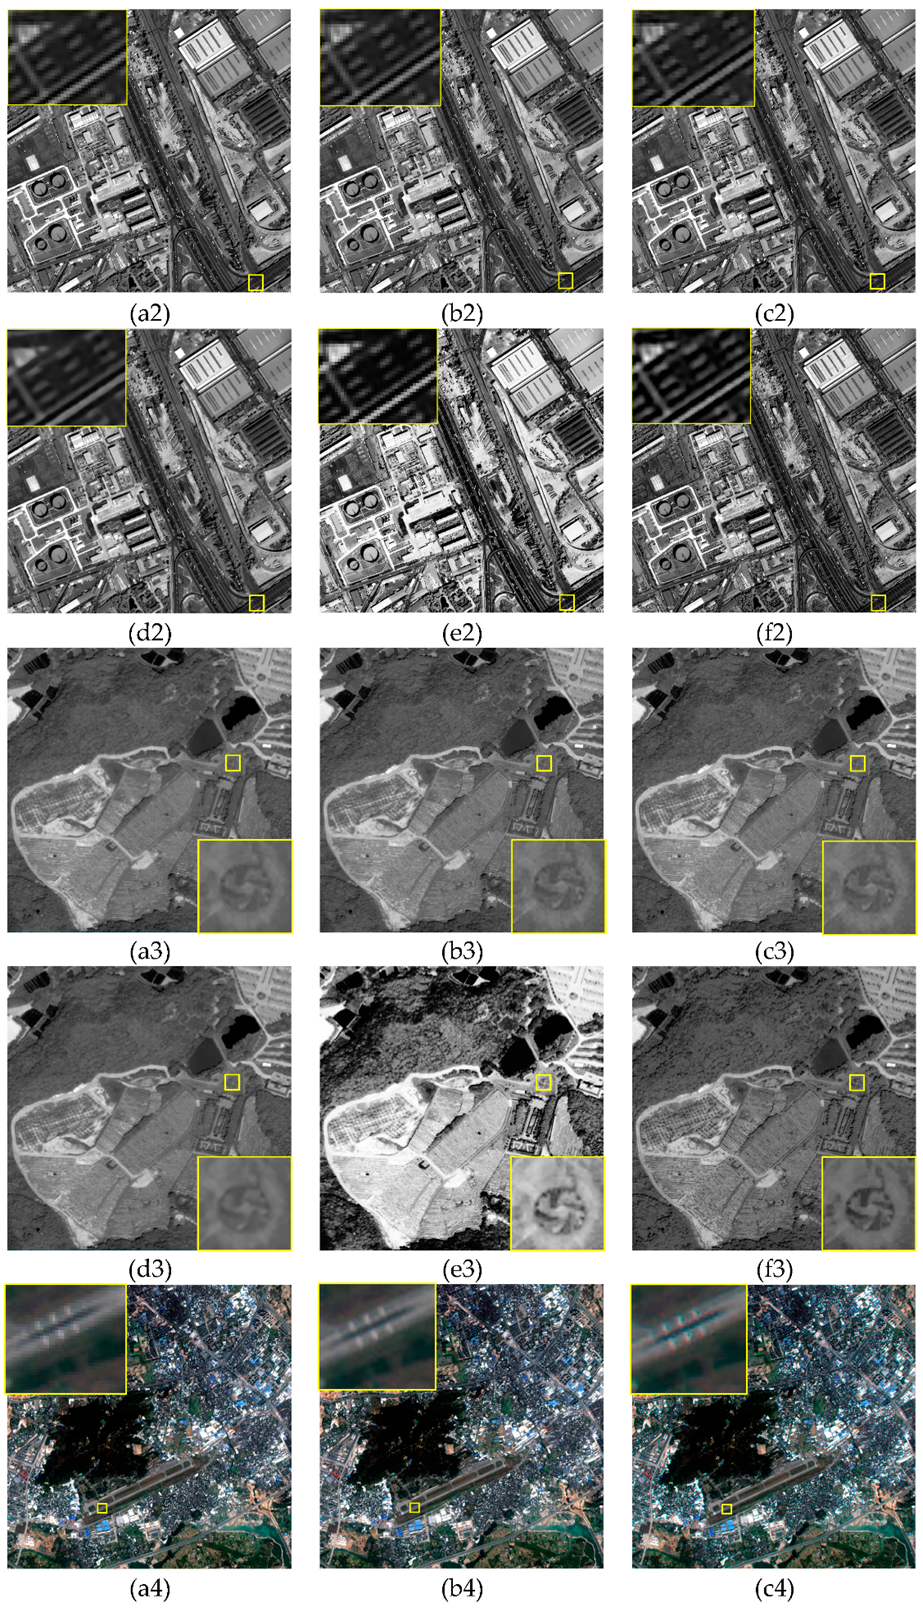
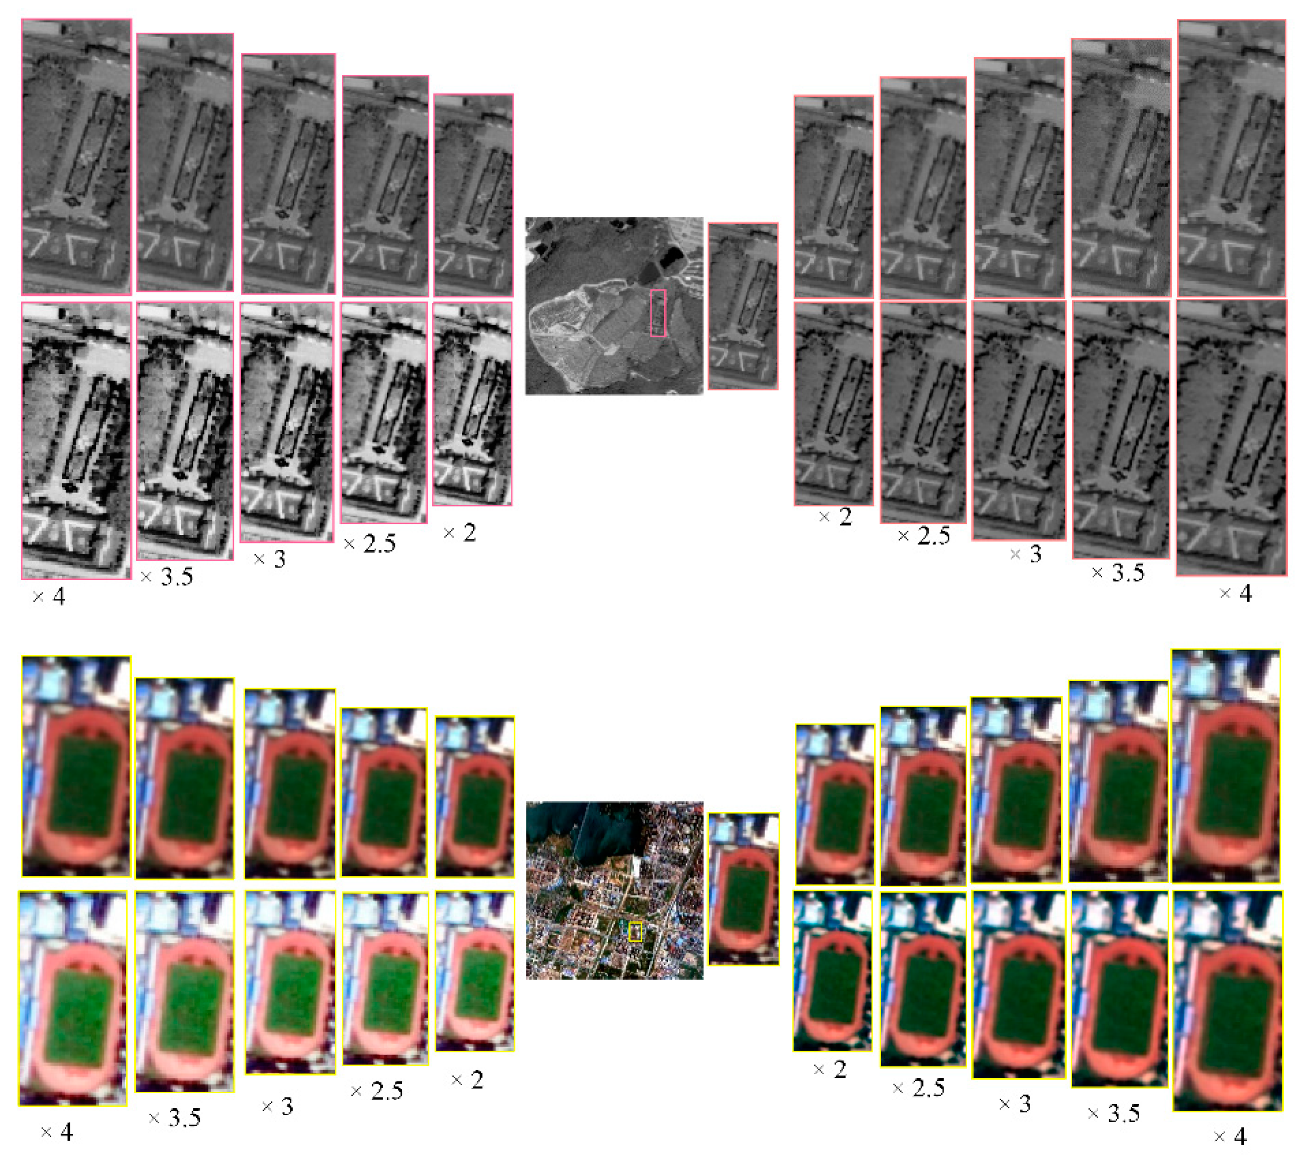
4.1. Simulation Image SR Experiment

As the real HR remote sensing image under the same sensor is difficult to obtain, the effectiveness of the proposed SR reconstruction method was verified by simulation experiments. Simulation images were obtained from Resources satellite three (ZY-3) and Gaofen-2 (GF-2). The parameters of the simulation experimental images are shown in Table 1 and the original HR images are shown in Figure 3.
The remote sensing image obtained from the satellite was treated as the real HR image, the corresponding LR image was obtained through the simulation model Y = HKX + N, where Y represents the simulated LR image, X is the original remote sensing image, N represents the noise, K the fuzzy convolution kernel, H is the down-sampling matrix, * representative convolution operation. The type of subsampling is bilinear that was used to decrease the size of the original images. In this experiment, the scaling factor η = 2, three layers were used in the algorithm to decompose the images. The result based on the typical and state-of-the-art SR reconstruction methods were compared with our SR method. Due to a limitation of space, the simulation experimental results with random noise with the range of [−2, 2] were shown in Figure 4.
From the subjective perspective, the edge structure is blurry, the sawing phenomenon is also very serious in Figure 4a. The main reason is the high-frequency information is lost. The IBP results in Figure 4b are better than Bicubic. One important factor is that the real HR image is involved in the SRR process. The overall effect of the experiment result based on the SRCNN and VDSR method is better than the traditional methods. Nevertheless, compared with the real HR image, the result is a little blurry, and the detail information is still not enough. The reconstructed result in Figure 4e is too saturated, the essential information of the image has been changed, and the result deviates from the real HR image. In Figure 4f, the proposed method can reconstruct rich detail information and retain a better edge structure. The high-frequency information is promoted in this method. In order to evaluate the reconstruction results more objectively, the quality evaluation method was adopted in this paper, and the objective evaluation index results for different amounts of noise are shown in Table 2 and Table 3.
To further test the performance of the MMSDB-SR method, simulative panchromatic and multi-spectral images were used to experiment for different scale factors. Similar to 2×-up-scaling-factor SR reconstruction, 2×-, 2.5×-, 3×-, 3.5×- and 4×-upscaling-factor SRR experiments results are shown in Figure 5.
In the different scale factors SRR experiment, SRR based on Bicubic, IBP and HE were compared with MMSDB-SR method. This is because SRR based on SRCNN and VDSR directly learn an end-to-end mapping between the low/high-resolution images. The deep-learning methods were not trained for each different scale, and these methods were trained and rebuilt on a set scale at the same time. As can be clearly seen in Figure 5, the overall outline of the SRR result based on Bicubic is not very clear. The SRR result based on IBP is better than Bicubic, but there was no qualitative improvement. The reconstruction image distribution of the SRR result based on HE is too saturated. The detail information of the reconstruction image is not really improved. Through the comparison, it can be shown that MMSDB-SR method resulted in a clear edge structure. In order to analyze the experimental results more objectively, the objective evaluation indexes are listed in Table 4.
It can also be seen from the objective evaluation results, that the MMSDB-SR result is better than other methods. IBP is better is obviously better than the Bicubic method because the real HR images participate in the reconstruction process. Nevertheless, when the real HR image does not exist, the IBP method will not work well. Meanwhile, when the scale factor is too big, the quality of the results of all SRR methods will also decline because of the reference information limited. Therefore, it is still necessary to further explore and study the goal which retains all kinds of detail information of the original image.

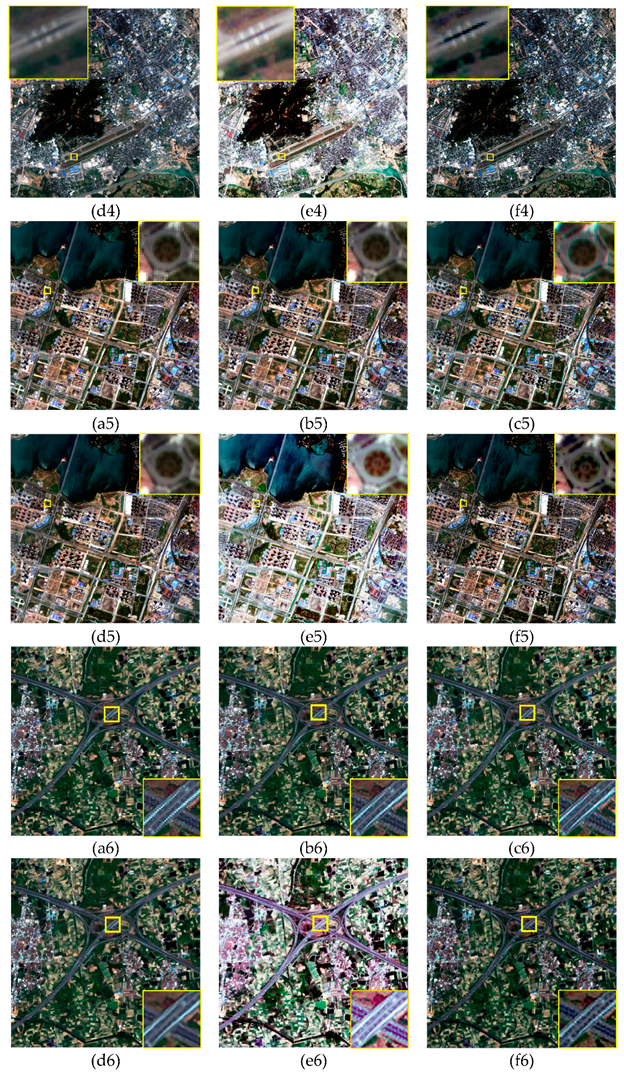
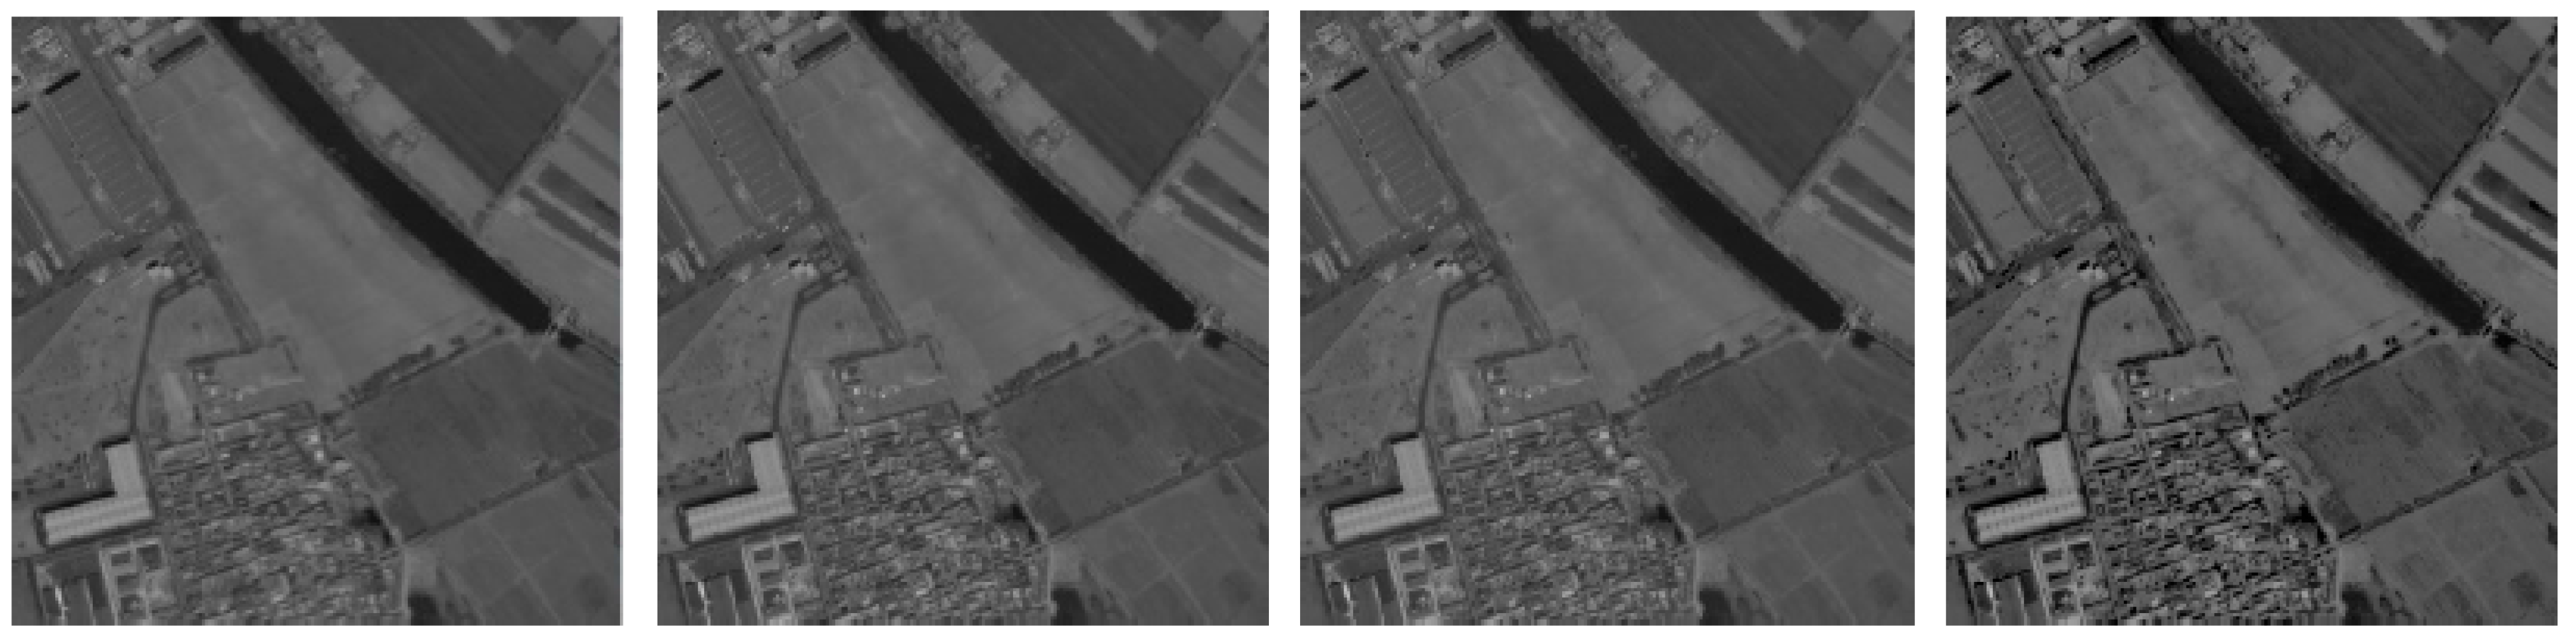
4.2. Real Remote-Sensing Image SR Experiment

Unlike the experimental data selected in most of the published literature, in this paper real remote-sensing images were used as SR reconstruction experimental data. Instead of using simulated degraded images, urban areas, villages and towns, roads, water areas, mountains, and other topographies were selected for the SR reconstruction experiments. The parameters of the experimental images are shown in Table 5 and the experimental images themselves are shown in Figure 6.
The actual remote-sensing images were super-resolved with a 2× up-scaling factor. The reconstructed results were compared with those obtained from the bicubic, IBP, SRCNN, VDSR, and histogram-equalization (HE) methods. In the case of multispectral images, the three multi spectral channels, including red, green and blue, were used to apply the SRR process. Subjective and objective evaluation methods were utilized to evaluate and analyze all the SR reconstruction results. The first three groups of images were panchromatic images and the last three groups were multispectral images; the experimental results are shown in Figure 7.
Taking all of the reconstructed results together, reconstruction of the image using the bicubic method did not perform well. The edge structure was fuzzy, the amount of information was not increased by the SRR process, and the texture details were not rich enough. SRR results based on the IBP method were better than those based on the bicubic method. However, the improvement of the results was not visually obvious. The improvement of reconstructed image quality is evidently limited by not having real HR images as references. Compared to the state-of-the-art SR methods in the field of deep learning, such as the SRCNN and VDSR methods, the quality of the reconstructed image by those methods was better than that obtained using the bicubic and IBP methods. The definition of the reconstructed image edge structure was improved, but the information on the complex geomorphology did not substantially change. To further illustrate that the contribution of this paper is not simple contrast enhancement, HE was used in the SR experiments to facilitate comparative analysis. It is well known that HE can improve the contrast of images visually. The detail information was not improved, and the edge structure not clear enough. Through the comparison and analysis of the reconstruction results, it can be shown that the SRR method proposed in this paper resulted in a clear edge structure. Meanwhile, the HR image contained rich topographic feature information and more prominent texture details. To make a quantitative analysis of the reconstruction results obtained by using different reconstruction methods, the reconstruction images were evaluated objectively through entropy and the EME index. The objective evaluation indexes of different SRR results are listed in Table 6.
In the SRR experiments, entropy and the EME index were used to evaluate the reconstructed HR images, because the real HR remote-sensing images acquired by the same sensor cannot be obtained. For the objective evaluation indicators used in this paper, the entropy represents the degree of uniform distribution of any energy in space, the higher the objective evaluation index, the more information of the reconstructed image. Statistical results show that the proposed multilevel main structure and detail-boosting method reflect significant advantages in objective evaluation indicators. The entropy indexes of the reconstructed image increased by 0.32, 0.28, 0.25, 0.24, and 0.85 dB for the Bicubic, IBP, SRCNN, VDSR, and HE methods, respectively. Compared with other SR methods, the EME index of the proposed SR method was also significantly improved, and the reconstructed HR image is superior to that obtained using the classical and state-of-the-art SR methods. To further test the complexity of the proposed algorithm compared with other SRR methods, the running time of different SRR methods were calculated during the experiment. The number of iterations was set to 10 in IBP method. For deep learning methods, 500 and 290 images were used for the training process in the SRCNN and VDSR method, and training takes roughly 12 and 4 h on GTX 1060, respectively. Different number of images were used in deep learning methods, because the fewer the layers, the more difficult the convergence. The execution time is shown in Table 7.
It can be seen from Table 7, Bicubic, IBP and HE methods with relatively short running time as their computation complexity are relatively low, the decrease of image size is accompanied by the loss of information. Compared with the state-of-the-art SR methods, the execution time of MMSDB-SR is shorter than SRCNN, and longer than VDSR. The reconstruction process of the MMSDB-SR method focuses on detail information, and the reconstruction results are superior to VDSR in visual and subjective evaluation. The sacrifice of time is worthwhile.
To further test the performance of the proposed SR method, panchromatic and multi-spectral images were again used as experimental objects. Similar to 2×-up-scaling-factor SR reconstruction, 2×-, 2.5×-, 3×-, 3.5×- and 4×-upscaling-factor SRR experiments were carried out separately. The experimental results are shown in Figure 8.
Compared with the experimental results, it can be seen that the proposed SRR performed better than that based on the interpolation method, and the high-frequency edge information was blurred owing to the effect of the interpolation algorithm. The method proposed in this paper not only has the same flexibility as the interpolation method, but can also restore the high-frequency information in the reconstructed image. When the multiples of reconstruction increase, the edge blurring of the traditional algorithms become increasingly more serious, and the detail distortion is more obvious. The SR algorithm proposed in this paper restores the high-frequency information in the reconstruction process. The reconstruction image has more feature information, clear edge contours, and richer texture information. It not only meets the needs of human vision, but also reflects better reconstruction performance. According to the results of the state-of-the-art SR methods based on deep learning, a training model cannot used for all scales at the same time. To handle multiple scales, existing methods require multiple networks. Therefore, in multiscale-factor SRR experiments the state-of-the-art SR methods were not included. To evaluate the multiscale-factor SR experimental results objectively, the objective evaluation indexes required are listed in Table 8.
It can be seen directly from Table 4 that the reconstructed image carried more information after being processed using the proposed SR method. In other words, the SR method in this paper can provide the high-frequency information in multiple SRR processes. By comparison, the information based on the bicubic method remained basically unchanged. When multiple scales were too high, there was little detailed information and the edge ambiguity was even more serious.

4.3. Discussion

The SR method proposed in this paper can provide abundant texture-detail information in 2×-up-scaling-factor and multiple SRR experiments. Based on the results of comprehensive subjective evaluation and objective evaluation analysis, the reconstruction effect is better than that of the classical and state-of-the art SR methods. The amount of information in an SRR image reconstructed based on HE cannot be increased. In addition, the image contrast is promoted in SRR under the circumstance of normal light and radiation, which may eventually result in poor visual effects in the reconstructed image. Compared with the HE method, it can be proved that the proposed SR reconstruction method is not simple contrast enhancement. The idea of multilevel decomposition is different from the approach of wavelets. The main difference is the size of the image decreases during the decomposition process in the wavelets. When the size of the image decreases, the information of the image is also lost. The multi-scale decomposition in this paper can better retain the image information and be better used for SR reconstruction. The information in a single remote-sensing image is fully extracted to complete SRR, and the problem of high-precision registration of multiple remote-sensing images is avoided in the proposed method. According to the results of previous experiments, the proposed SR method can restore an HR image without requiring any training on it. Moreover, the proposed SR reconstruction method is flexible. Generally, however, once a deep-learning network is well trained, it can only reconstruct the designated up-scaling-factor SR experiment.
The contributions of the SRR method proposed in this paper are mainly the following:
(1)
To fully extract the information in a single remote-sensing image, a multilevel decomposition model is proposed to extract multilevel main structure and texture detail.
(2)
A novel detail-boosting function is put forward to improve the multilevel detail information.
(3)
A flexible SRR method is realized using a single LR image without any auxiliary information.
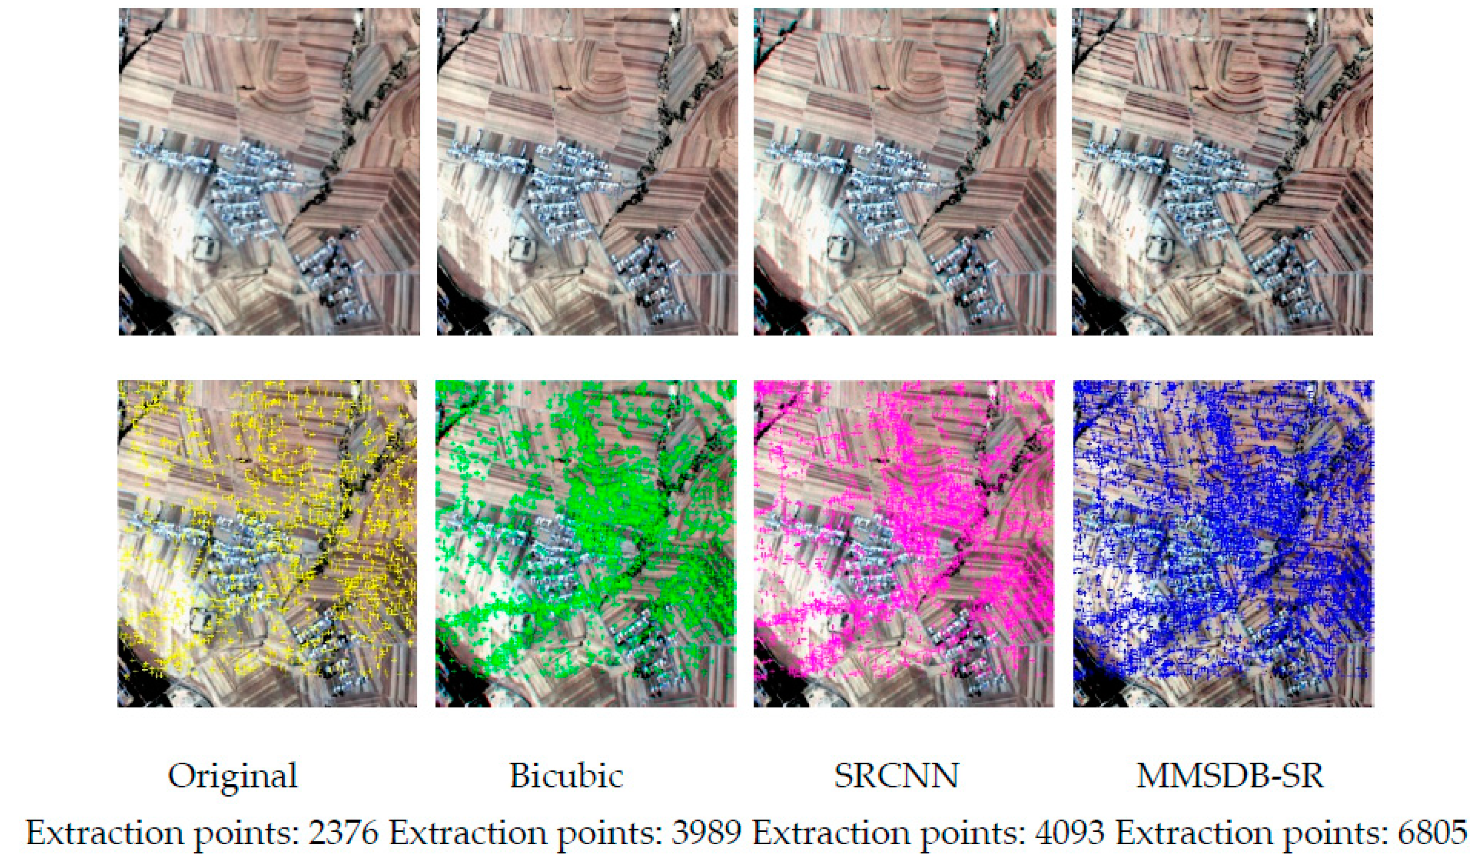
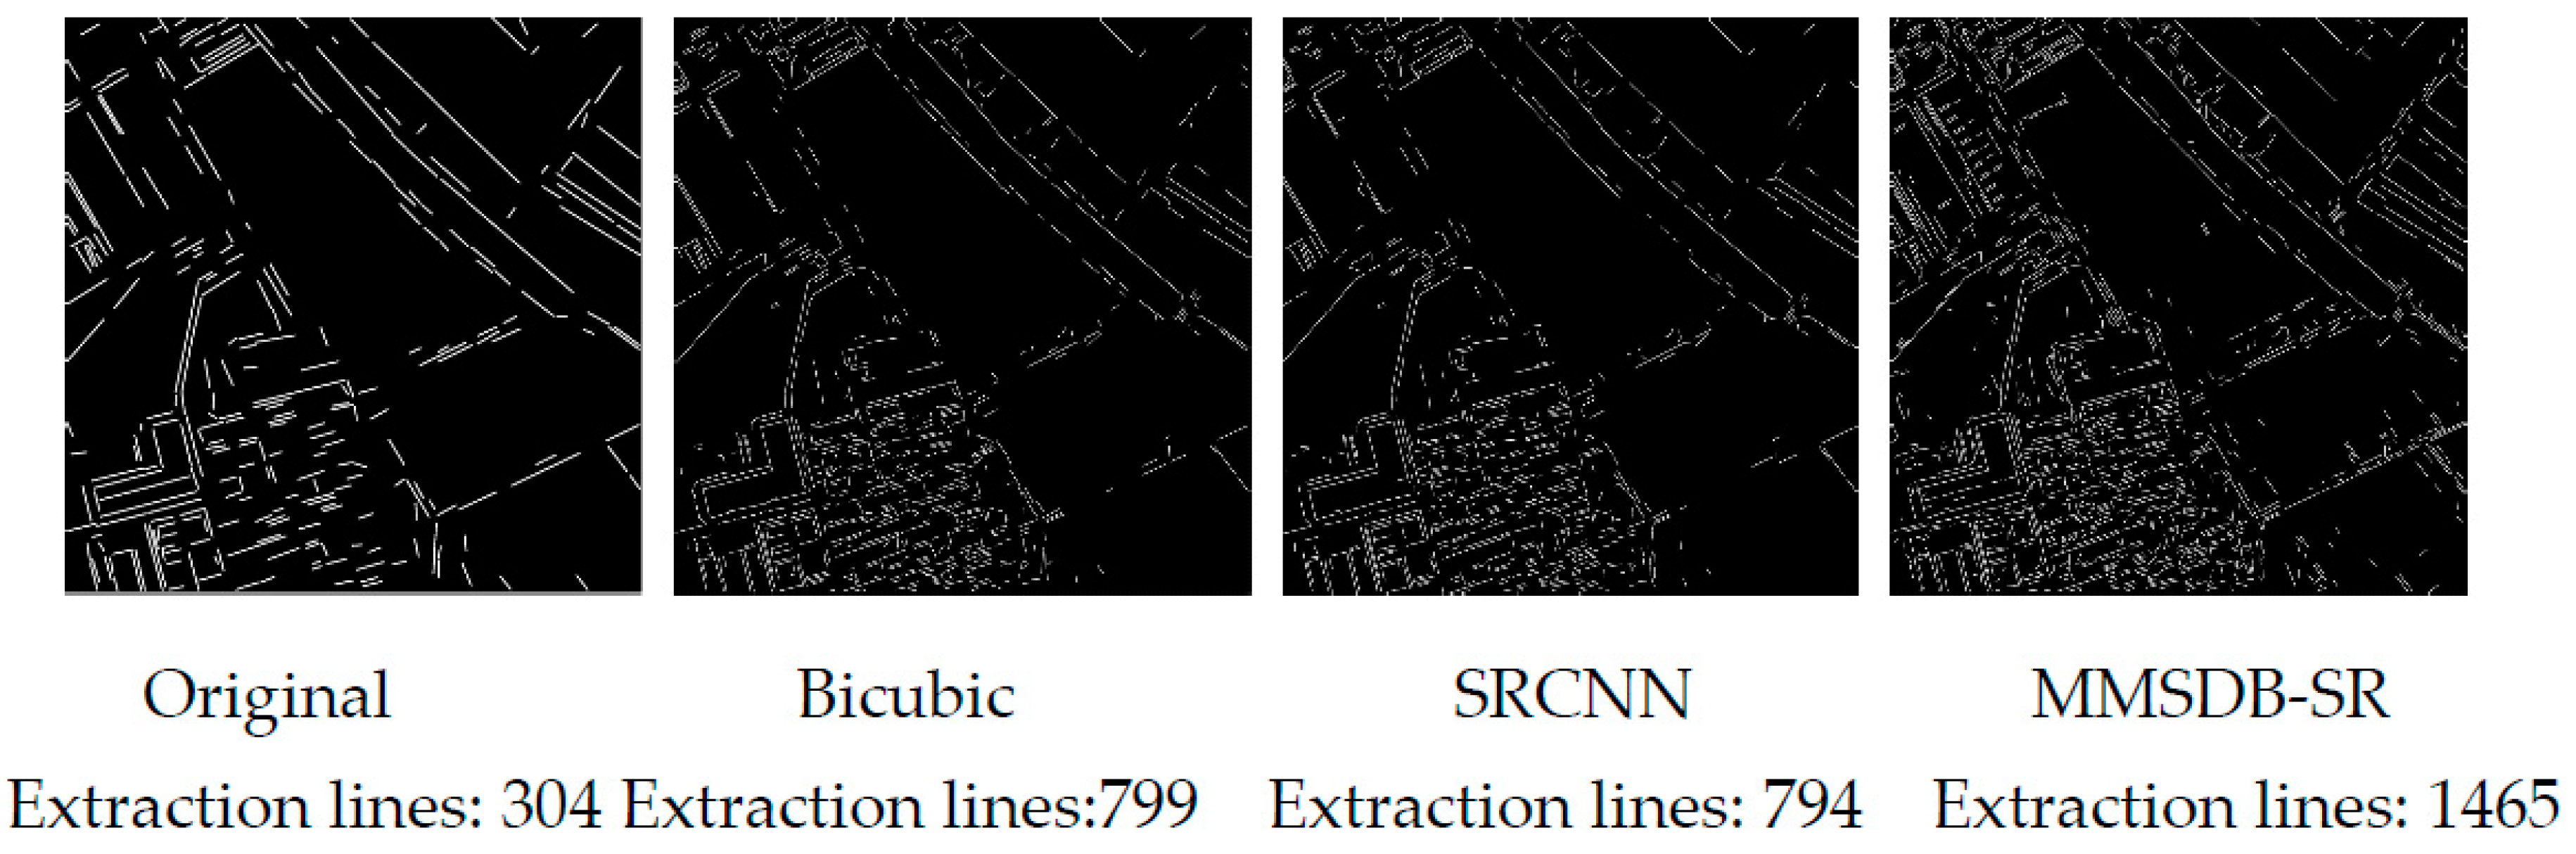
5. Applications

We can obtain HR remote-sensing images through use of an SRR method rather than via the observation images acquired by a satellite. Clearly, targets and rich topographies can be provided in HR images. Therefore, HR images have a wide range of economic and military applications. Thus, fast and effective feature extraction from HR remote-sensing images is a hot topic in the photogrammetry and remote-sensing fields. To illustrate the performance of SRR of remote-sensing images with different resolutions for feature extraction, feature-extraction experiments were carried out. It is proven that the edge of an HR image is clearer, and the texture features are recognized more easily. The SIFT operator [32] and LSD algorithm [33] were used to extract the point and line features, respectively. The imagery was acquired from the ZY-3 satellite. The point- and line-feature-extraction results for the original image and different SRR images are shown in Figure 9 and Figure 10, respectively.
Two conclusions can be drawn intuitively from examination of Figure 9 and Figure 10. First, feature point and line extraction in HR images is greater than those in LR images. Meanwhile, our SR method can extract more point and line features. Second, the reconstructed image can extract the line features that are not found in the original image. In particular, for feature-line-extraction results, the consistency of some line features is better in the proposed SRR. Combined with this result, it can be further concluded that the proposed method can reconstruct more feature information than the interpolation-based and state-of-the-art SR methods. It can also be proven from these results that the proposed SRR can not only improve the spatial resolution of the image, but it can also advance the recognition degree of the remote-sensing-image information.

6. Conclusions

In this paper, a novel single remote-sensing-image SRR method was put forward. The information in a single-remote-sensing image is fully extracted using a multilevel decomposition model. The proposed SR method can realize multiple SRRs and the edge main structure of the reconstruction image is clear and sharp. To restore the lost high-frequency information in multiple SRRs, an optimized and flexible detail-boosting function was proposed for our SRR that effectively improves the problem of reconstructed image-edge overflow. As a result, the reconstructed image is rich in texture landform information. Our SRR method solves the problem of how to regenerate HR images with newer and more useful high-frequency detail. Actual results show an average gain in entropy of up to 0.34 dB for 2× up-scaling. Actual image results show an average gain in EME of up to 2.42 for 2× up-scaling. Experimental results show that the definition of the reconstructed HR image and the expression of the texture detail are better using the proposed SRR than those obtained using the bicubic, IBP, and other state-of-the art SRR methods. They further demonstrate that our SR method is not a simple contrast enhancement method. The proposed SR method can actually improve the details in the reconstructed HR image. Moreover, the complexity of the SRR model is simplified in the proposed method. Finally, the reconstructed HR image can be used for feature extraction and image fusion applications. From such applications, it can be seen that SRR is very meaningful research technology. In the future, we plan to further accelerate the proposed SRR method and improve the SR algorithm, at which time we plan to extend the proposed method to video remote-sensing-image SRR.

Author Contributions

H.Z. proposed the super-resolution reconstruction based on multilevel main structure and detail boosting method and wrote the paper; X.G., X.T. and J.X. gave some useful guidance of the proposed method; F.M. gave guidance of the experimental and some detail problem; D.J. collected the experimental image data and polished the language of the paper.

Funding

This research was funded by Information processing for distributed Multi-star multi-source and multi-resolution remote sensing, grant number [2016YFB0501005] And the APC was funded by National key research and development project of China.

Acknowledgments

This paper was supported by National key research and development project of China (2016YFB0501005), High Remote Sensing, Surveying and Mapping Application Demonstration System (project No. AH1601-8), the National Natural Science Foundation of China (project Nos. 41301525, 41571440, 61601213, 41601505, 41871379 and 41871382), the Special Scientific Research Fund of Public Welfare Surveying and Mapping Profession of China (project Nos. 201412007 and 201512012), National key research and development program (project No. 2017YFB0504201), the Project funded by China Postdoctoral Science Foundation (project Nos. 2017M611252), the Project of Liaoning Education Department (No. 16-1096, No. LR2016045), Public welfare research fund in Liaoning Province (No. 20170003), and National Key R & D Program for Strategic International Scientific and Technological Innovation Cooperation of China (No: 2016YFE0205300). Many people contributed to this paper. Thanks to Guohui Jia’s support and help in the supplementary experiment, Wenjie Lin polished the revised paper and put forward some suggestions, etc. We are very grateful for the reviewers’ comments for the manuscript.

Conflicts of Interest

The authors declare no conflict of interest.

References

  1. Bätz, M.; Koloda, J.; Eichenseer, A.; Kaup, A. Multi-image super-resolution using a locally adaptive denoising-based refinement. In Proceedings of the 2016 IEEE 18th International Workshop on Multimedia Signal Processing, Montreal, QC, Canada, 21–23 September 2016; pp. 1–6. [Google Scholar]
  2. Nayak, R.; Harshavardhan, S.; Patra, D. Morphology based iterative back-projection for super-resolution reconstruction of image. In Emerging Technology Trends in Electronics, Communication and Networking (ET2ECN), Proceedings of the 2014 2nd International Conference on, Surat, India, 26–27 December 2014; IEEE: Piscataway, NJ, USA, 2015; pp. 1–6. [Google Scholar]
  3. Zhu, H.; Tang, X.; Xie, J. Spatio-Temporal Super-Resolution Reconstruction of Remote-Sensing Images Based on Adaptive Multi-Scale Detail Enhancement. Sensors 2018, 18, 498. [Google Scholar] [CrossRef] [PubMed]
  4. Gou, S.; Liu, S.; Yang, S.; Jiao, L. Remote Sensing Image Super-Resolution Reconstruction Based on Nonlocal Pairwise Dictionaries and Double Regularization. IEEE J. Sel. Top. Appl. Earth Obs. Remote Sens. 2015, 7, 4784–4792. [Google Scholar] [CrossRef]
  5. Li, L.; Wang, W.; Luo, H.; Ying, S. Super-Resolution Reconstruction of High-Resolution Satellite ZY-3 TLC Images. Sensors 2017, 17, 1062. [Google Scholar] [CrossRef]
  6. Kwan, C.; Choi, J.H.; Chan, S.; Zhou, J.; Budavari, B. Resolution enhancement for hyperspectral images: A super-resolution and fusion approach. In Proceedings of the IEEE International Conference on Acoustics, Speech and Signal Processing, New Orleans, LA, USA, 5–9 March 2017; pp. 6180–6184. [Google Scholar]
  7. Lim, B.; Son, S.; Kim, H.; Nah, S.; Lee, K.M. Enhanced Deep Residual Networks for Single Image Super-Resolution. In Proceedings of the Computer Vision and Pattern Recognition Workshops, Honolulu, HI, USA, 21–26 July 2017; pp. 1132–1140. [Google Scholar]
  8. Yang, D.; Li, Z.; Xia, Y.; Chen, Z. Remote sensing image super-resolution: Challenges and approaches. In Proceedings of the IEEE International Conference on Digital Signal Processing, Singapore, 21–24 July 2015; pp. 196–200. [Google Scholar]
  9. Dong, W.; Zhang, L.; Lukac, R.; Shi, G. Sparse Representation Based Image Interpolation with Nonlocal Autoregressive Modeling. IEEE Trans. Image Process. 2013, 22, 1382–1394. [Google Scholar] [CrossRef] [PubMed]
  10. Zhang, L.; Wu, X. An edge-guided image interpolation algorithm via directional filtering and data fusion. IEEE Trans. Image Process. 2006, 15, 2226–2238. [Google Scholar] [CrossRef]
  11. Zhang, H.; Yang, Z.; Zhang, L.; Shen, H. Super-Resolution Reconstruction for Multi-Angle Remote Sensing Images Considering Resolution Differences. Remote Sens. 2014, 6, 637–657. [Google Scholar] [CrossRef] [Green Version]
  12. Chambolle, A. An Algorithm for Total Variation Minimization and Applications. J. Math. Imaging Vis. 2004, 20, 89–97. [Google Scholar]
  13. Fan, C.; Wu, C.; Li, G.; Ma, J. Projections onto Convex Sets Super-Resolution Reconstruction Based on Point Spread Function Estimation of Low-Resolution Remote Sensing Images. Sensors 2017, 17, 362. [Google Scholar] [CrossRef]
  14. Irani, M.; Peleg, S. Improving resolution by image registration. CVGIP-Gr. Models Image Process. 1991, 53, 231–239. [Google Scholar] [CrossRef]
  15. Liu, C.; Sun, D. On Bayesian Adaptive Video Super Resolution. IEEE Trans. Pattern Anal. Mach. Intell. 2014, 36, 346–360. [Google Scholar] [CrossRef] [Green Version]
  16. Freeman, B.; Liu, C. Markov Random Fields for Super-resolution and Texture Synthesis. Adv. Markov Random Fields Vis. Image Process. 2011, 82, 5–7. [Google Scholar]
  17. Shen, H.; Zhang, L. A MAP-Based Algorithm for Destriping and Inpainting of Remotely Sensed Images. IEEE Trans. Geosci. Remote Sens. 2009, 47, 1492–1502. [Google Scholar] [CrossRef]
  18. Mei, S.; Yuan, X.; Ji, J.; Zhang, Y.; Wan, S.; Du, Q. Hyperspectral Image Spatial Super-Resolution via 3D Full Convolutional Neural Network. Remote Sens. 2017, 9, 1139. [Google Scholar] [CrossRef]
  19. Ledig, C.; Theis, L.; Huszar, F.; Caballero, J.; Cunningham, A.; Acosta, A.; Aitken, A.; Tejani, A.; Totz, J.; Wang, Z.; et al. Photo-Realistic Single Image Super-Resolution Using a Generative Adversarial Network. arXiv, 2016; arXiv:1609.04802. [Google Scholar]
  20. Dong, C.; Chen, C.L.; He, K.; Tang, X. Image Super-Resolution Using Deep Convolutional Networks. IEEE Trans. Pattern Anal. Mach. Intell. 2016, 38, 295–307. [Google Scholar] [CrossRef] [PubMed]
  21. Kim, J.; Lee, J.K.; Lee, K.M. Accurate Image Super-Resolution Using Very Deep Convolutional Networks. In Proceedings of the Computer Vision and Pattern Recognition, Las Vegas, NV, USA, 27–30 June 2016; pp. 1646–1654. [Google Scholar]
  22. Tai, Y.; Liu, S.; Brown, M.S.; Lin, S. Super resolution using edge prior and single image detail synthesis. In Proceedings of the 2010 IEEE Computer Society Conference on Computer Vision and Pattern Recognition, San Francisco, CA, USA,, 13–18 June 2010; pp. 2400–2407. [Google Scholar] [CrossRef]
  23. Jiang, H.; Yang, J. In-place similarity and its applications in image and video detail enhancement. Electron. Lett. 2016, 52, 1022–1024. [Google Scholar] [CrossRef]
  24. Vishnukumar, S.; Wilscy, M. Super-resolution for remote sensing images using content adaptive detail enhanced self examples. In Proceedings of the International Conference on Circuit, Power and Computing Technologies, Nagercoil, India, 18–19 March 2016; pp. 1–5. [Google Scholar]
  25. Sun, J.; Xu, Z.; Shum, H.Y. Gradient profile prior and its applications in image super-resolution and enhancement. IEEE Trans. Image Process. 2010, 20, 1529–1542. [Google Scholar]
  26. Yu, L.; Xu, H.; Xu, Y.; Yang, X. Robust single image super-resolution based on gradient enhancement. In Proceedings of the Signal & Information Processing Association Summit and Conference, Hollywood, CA, USA, 3–6 December 2012; pp. 1–6. [Google Scholar]
  27. Xu, L.; Yan, Q.; Xia, Y.; Jia, J. Structure extraction from texture via relative total variation. ACM Trans. Gr. 2012, 31, 139. [Google Scholar] [CrossRef] [Green Version]
  28. Sheikh, H.R.; Sabir, M.F.; Bovik, A.C. A Statistical Evaluation of Recent Full Reference Image Quality Assessment Algorithms. IEEE Trans. Image Process. 2006, 15, 3440–3451. [Google Scholar] [CrossRef]
  29. Zhou, W.; Bovik, A.C.; Sheikh, H.R.; Simoncelli, E.P. Image Qualifty Assessment: From Error Visibility to Structural Similarity. IEEE Trans. Image Process. 2004, 13, 600–612. [Google Scholar]
  30. Tsai, D.Y.; Lee, Y.; Matsuyama, E. Information entropy measure for evaluation of image quality. J. Digit. Imaging 2008, 21, 338–347. [Google Scholar] [CrossRef] [PubMed]
  31. Agaian, S.; Panetta, K.; Grigoryan, A. Transform-based image enhancement algorithms with performance measure. IEEE Trans. Image Process. 2001, 10, 367–382. [Google Scholar] [CrossRef] [PubMed]
  32. Lowe, D.G. Distinctive Image Features from Scale-Invariant Keypoints. Int. J. Comput. Vis. 2004, 60, 91–110. [Google Scholar] [CrossRef] [Green Version]
  33. Gioi, R.G.V.; Jakubowicz, J.; Morel, J.M.; Randall, G. LSD: A line segment detector. Image Process. Line 2012, 2, 35–55. [Google Scholar] [CrossRef]
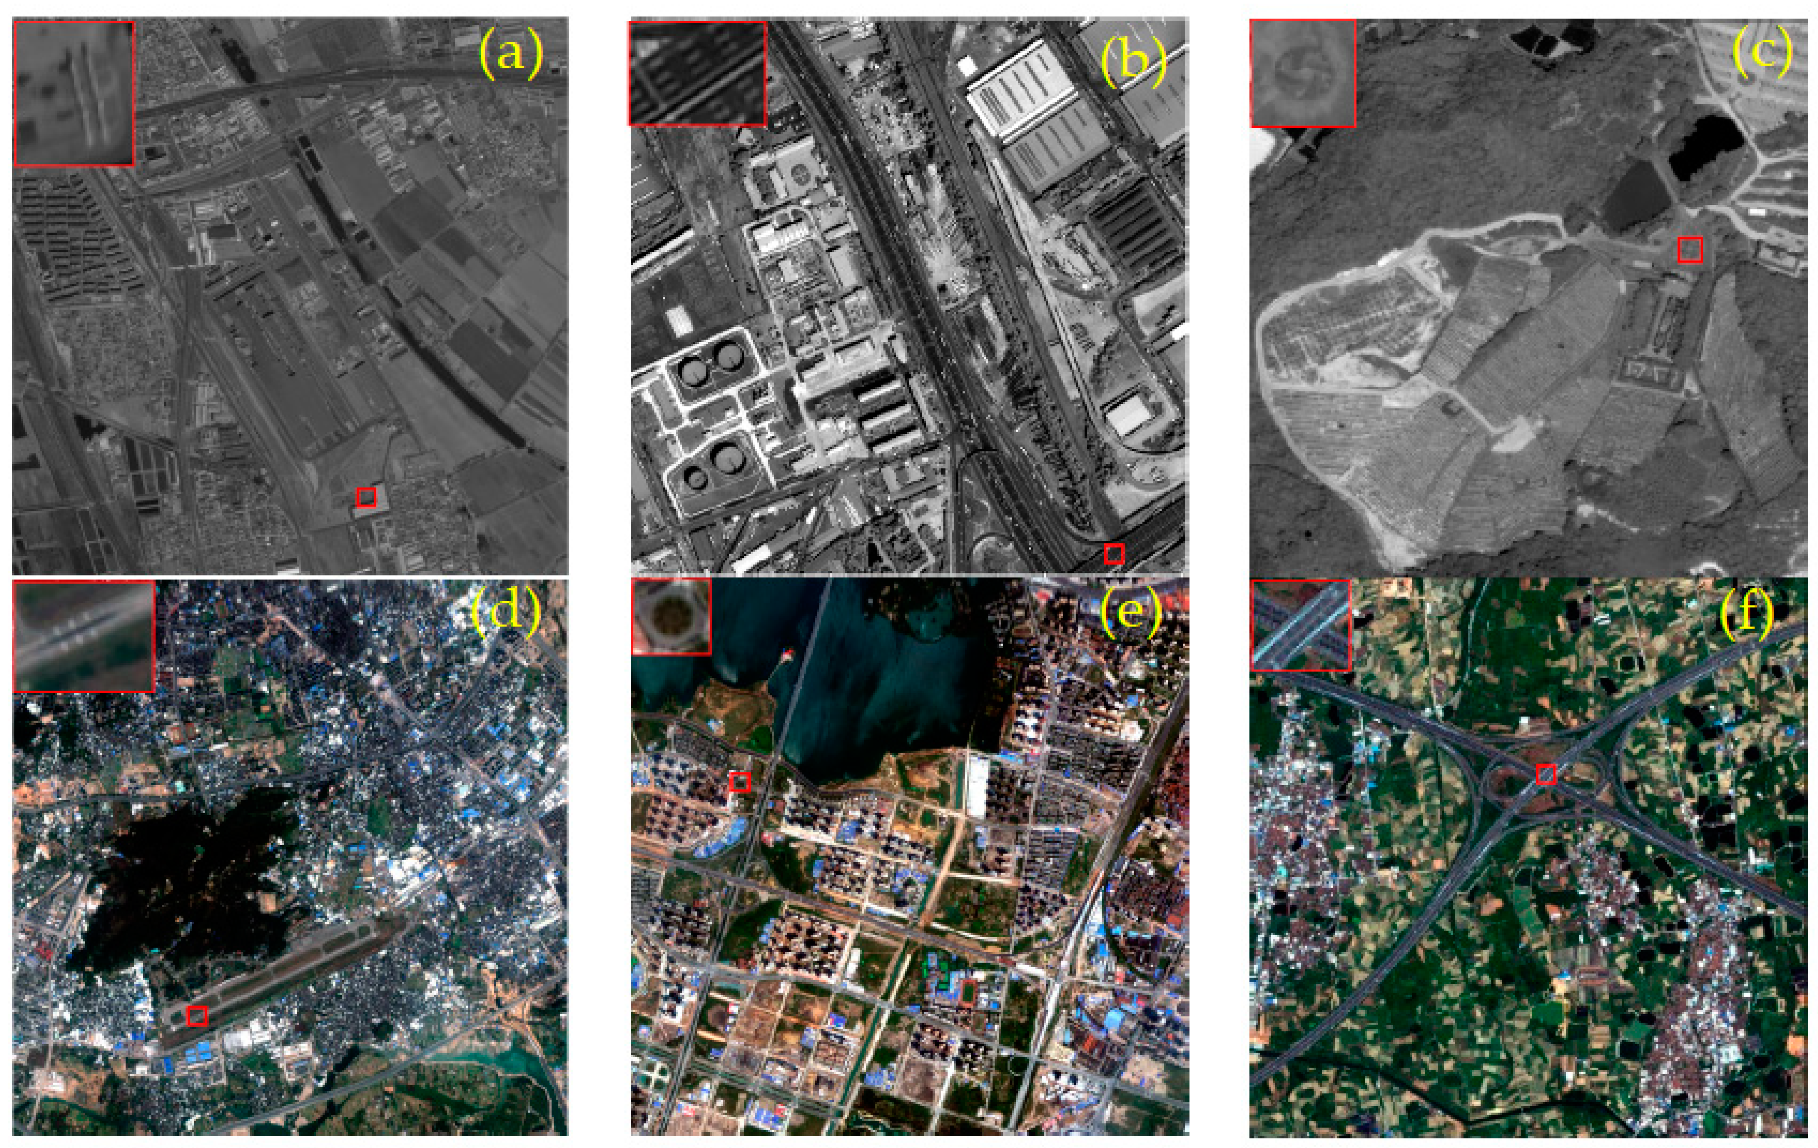
Figure 1. Simultaneous-phase three-line-array remote-sensing images.
Remotesensing 10 02065 g001
Figure 2. Framework of single-remote-sensing-image super-resolution (SR) reconstruction.
Remotesensing 10 02065 g002
Figure 3. Original high-resolution (HR) remote sensing images (a) ZY-3 panchromatic image; (b) ZY-3 panchromatic image; (c) ZY-3 multi-spectral image; (d) GF-2 multi-spectral image.
Remotesensing 10 02065 g003
Figure 4. Simulation experimental results (a) Bicubic; (b) iteration back-projection (IBP); (c) SR using deep convolutional networks (SRCNN); (d) very deep convolutional networks (VDSR); (e) histogram equalization (HE); (f) SR based on multilevel main structure and detail boosting (MMSDB-SR).
Remotesensing 10 02065 g004aRemotesensing 10 02065 g004b
Figure 5. Different up-scaling factor SR reconstruction (SRR) results. The first layer is the SRR result based on Bicubic, the second layer is the SRR result based on IBP, the third layer is the SRR result based on HE, the fourth layer is the SRR result based on MMSDB-SR.
Remotesensing 10 02065 g005
Figure 6. Experimental images (a) ZY-3 panchromatic image; (b) GF-2 panchromatic image; (c) WorldView-2 panchromatic image; (d) ZY-3 multi-spectral image; (e) GF-2 multi-spectral image; (f) WorldView-2 multi-spectral image.
Remotesensing 10 02065 g006
Figure 7. Comparison of image-reconstruction results of proposed method with other methods for 2× SR: (a) Bicubic; (b) IBP; (c) SRCNN; (d) VDSR; (e) HE; (f) MMSDB-SR.
Remotesensing 10 02065 g007aRemotesensing 10 02065 g007bRemotesensing 10 02065 g007c
Figure 8. Different up-scaling factor SRR results. (left top) The result based on IBP; (left bottom) the result based on HE; (right top) the result based on Bicubic; (right bottom) the result based on MMSDB-SR.
Remotesensing 10 02065 g008
Figure 9. Feature-point-extraction results.
Remotesensing 10 02065 g009
Figure 10. Feature-line-extraction results.
Remotesensing 10 02065 g010aRemotesensing 10 02065 g010b
Table 1. Parameters of simulation experimental imagery.
No.FigureSatelliteView/Spectral ModeImage SizeNumber of BandsGSD (m)Acquisition Date
13aZY3panchromatic500 × 50012.16 June 2016
23bZY3panchromatic870 × 87012.112 February2015
33cZY3multi-spectral500 × 5003510 January 2017
43dGF-2multi-spectral500 × 50033.211 November 2017
Table 2. The objective evaluation index results with random noise, with the range of [−2,2].
MethodBicubicIBPSRCNN [20]VDSRHEMMSDB-SR
Image Data
Exp_1PSNR: 25.53PSNR: 26.17PSNR: 26.36PSNR: 26.47PSNR: 13.57PSNR: 26.59
SSIM: 0.82SSIM: 0.83SSIM: 0.85SSIM: 0.86SSIM: 0.63SSIM: 0.88
Exp_2PSNR: 20.65PSNR: 20.71PSNR: 20.76PSNR: 20.94PSNR: 11.69PSNR: 21.02
SSIM: 0.82SSIM: 0.83SSIM: 0.85SSIM: 0.87SSIM: 0.62SSIM: 0.89
Exp_3PSNR: 32.09PSNR: 32.13PSNR: 33.05PSNR: 33.08PSNR: 13.39PSNR: 33.11
SSIM: 0.81SSIM: 0.85SSIM: 0.94SSIM: 0.95SSIM: 0.69SSIM: 0.89
Exp_4PSNR: 29.94PSNR: 30.01PSNR: 30.15PSNR: 30.16PSNR: 13.47PSNR: 30.17
SSIM: 0.85SSIM: 0.89SSIM: 0.90SSIM: 0.91SSIM: 0.64SSIM: 0.92
Table 3. The objective evaluation index results with random Noise with the range of [−5,5].
MethodBicubicIBPSRCNN [20]VDSRHEMMSDB-SR
Image Data
Exp_1PSNR: 24.16PSNR: 24.81PSNR: 25.08PSNR: 25.17PSNR: 13.49PSNR: 25.21
SSIM: 0.76SSIM: 0.78SSIM: 0.81SSIM: 0.83SSIM: 0.55SSIM: 0.85
Exp_2PSNR: 20.52PSNR: 20.58PSNR: 20.63 PSNR: 20.46PSNR: 11.67PSNR: 20.53
SSIM: 0.81SSIM: 0.82SSIM: 0.84SSIM: 0.86SSIM: 0.59SSIM: 0.89
Exp_3PSNR: 28.38PSNR: 28.49PSNR: 29.17PSNR: 29.19PSNR: 13.37PSNR: 29.23
SSIM: 0.76SSIM: 0.79SSIM: 0.83SSIM: 0.85SSIM: 0.66SSIM: 0.87
Exp_4PSNR: 27.92PSNR: 28.36PSNR: 28.84PSNR: 28.87PSNR: 13.46PSNR: 28.92
SSIM: 0.72SSIM: 0.74SSIM: 0.77SSIM: 0.81SSIM: 0.59SSIM: 0.82
Table 4. Objective evaluation indexes of different-scale reconstruction results.
IndexMethod×2×2.5×3×3.5×4
Exp_1PNSRBicubic25.5325.2722.9721.1921.04
IBP26.1725.2823.9323.3723.08
HE13.5713.1212.3612.1512.12
MMSDB-SR26.5925.3524.3624.0523.93
SSIMBicubic0.820.820.740.610.57
IBP0.830.730.710.640.54
HE0.630.620.540.460.40
MMSDB-SR0.880.880.840.830.81
Exp_4PNSRBicubic29.9424.6023.8422.4222.22
IBP30.0125.2324.3123.5423.48
HE13.4713.3713.2613.0613.04
MMSDB-SR30.1726.3925.0524.9824.90
SSIMBicubic0.850.710.610.470.45
IBP0.890.760.610.540.48
HE0.640.520.440.350.32
MMSDB-SR0.920.850.780.760.75
Table 5. Parameters of experimental imagery.
No.FigureSatelliteView/Spectral ModeImage SizeGSD (m)Acquisition Date
14aZY3panchromatic2000 × 20002.110 July 2013
24bGF-2panchromatic1024 × 102411 September 2016
34cWorldView-2panchromatic500 × 5000.4616 October 2017
44dZY3multi-spectral1024 × 102459 March 2013
54eGF-2multi-spectral1024 × 1024419 May 2016
64fWorldView-2multi-spectral500 × 5001.81 June 2016
Table 6. Objective evaluation indexes of different reconstruction methods in real experiments.
IndexBicubicIBP [14]SRCNN [20]VDSR [21]HEMMSDB-SR
Exp_1Entropy6.186.266.286.296.116.66
EME5.936.056.176.546.809.69
Exp_2Entropy7.557.607.677.687.267.94
EME10.2310.5111.7011.719.1812.45
Exp_3Entropy6.987.017.037.026.747.21
EME5.9011.7511.8512.269.0313.02
Exp_4Entropy7.527.537.547.546.997.60
EME14.0815.3215.7015.8114.0615.99
Exp_5Entropy7.647.657.667.676.987.76
EME11.3912.1813.7314.739.6815.07
Exp_6Entropy7.397.427.477.525.997.99
EME20.0220.1021.6521.8520.7523.62
Table 7. The running time (s) of different SRR methods with 2× up-scaling factor.
BicubicIBP [14]SRCNN [20]VDSR [21]HEMMSDB-SR
Exp_10.082.90306.9297.752.02101.40
Exp_20.262.14175.0643.141.3765.03
Exp_30.231.4141.1222.221.1725.87
Exp_40.143.17170.77104.882.33131.13
Exp_50.143.17171.75103.062.36130.16
Exp_60.081.7440.8710.491.8533.25
Table 8. Objective evaluation indexes of different-scale reconstruction results.
IndexMethod×2×2.5×3×3.5×4
Exp_1EntropyBicubic6.985.485.485.485.48
IBP7.017.027.027.027.02
HE6.745.425.425.425.42
MMSDB-SR7.217.207.207.207.20
EMEBicubic5.904.544.343.893.54
IBP11.756.246.065.354.83
HE9.034.494.423.363.31
MMSDB-SR13.0210.579.518.988.18
Exp_4EntropyBicubic7.646.646.646.646.64
IBP7.656.666.656.656.65
HE6.985.995.995.995.99
MMSDB-SR7.767.577.557.557.55
EMEBicubic11.3911.086.366.075.09
IBP12.1811.7510.949.228.37
HE9.688.717.977.817.77
MMSDB-SR15.0714.8912.6111.4210.41

