A New MODIS C6 Dark Target and Deep Blue Merged Aerosol Product on a 3 km Spatial Grid

 ,
,  , , ,
, , ,
Abstract
:
1. Introduction
2. Dataset
3. Methods
- (i)
- Only those DT3K and DB10K AOD retrievals at 0.55 µm passing recommended quality assurance (AQ) checks [13,16,37] were used (for DT, this corresponds to retrievals flagged QA = 3, and, for DB, retrievals flagged QA = 2 or QA = 3). Therefore, the DT3K and DB10K highest-quality retrievals were obtained from the Scientific Data Set (SDS) “Optical_Depth_Land_And_Ocean” and “Deep_Blue_Aerosol_Optical_Depth_550_Land_Best_Estimate”, respectively.
- (ii)
- DB10K AOD retrievals were resampled to 3 km spatial grid (DB3k) onto the DT3K grid using the nearest neighbor interpolation algorithm [65,66] to match and overlap pixels of DB3K with the pixels of DT3K. As the DB algorithm first retrieves AOD at 1 km resolution, by finding the best match between satellite TOA reflectance and pre-calculated TOA reflectance stored in a LUT, all available pixels are then aggregated to 10 km resolution [16,37,38]. It is expected that resampling from 10 to 3 km will not affect the accuracy and quality of the DB AOD retrievals.
- (iii)
- To reduce errors in DT3K, the DTB3k product is generated using the Simplified Merge Scheme (SMS) (DTBM1 in [39]). This technique is selected as it increases the number of collocations and decreases the errors, and is defined as “an average of the DT3K and DB3K AOD retrievals or the available one with highest quality assurance flag” independent of the NDVI values [39]. This proposed technique differs from the operational DTB10K technique [13], which uses “an average of the DT10K and DB10K AOD retrievals or available one for only 0.2 < NDVI < 0.3”. Instead, the proposed technique uses “an average the DT10K and DB10K AOD retrievals or available one” for all available NDVI values.
- (iv)
- AERONET AOD is interpolated to 0.55 µm using a standard Ångström exponent (α) extrapolation [37], as the project does not provide AOD measurements directly at this common MODIS wavelength.
- (v)
- To increase the number of samples for validation, collocations are defined as the average of at least two AERONET AOD measurements between 10:00 and 12:00 local solar time and at least two pixels of MODIS AOD observations within a sampling window of 3 pixels × 3 pixels (average of 9 pixels) centered on the AERONET site. (i.e., an average within a 9 km × 9 km region).
- (vi)
- Retrieval errors are reported using the expected error (EE) of the DT algorithm at 3 km resolution over land [32], root mean square error (RMSE), and mean bias (MB). To compare DT3K and DTB3K statistically, the percent relative differences in N, EE Equation (1), RMSE Equation (2), MB Equation (3), and R Equation (4) are calculated using Equation (5). These relationships are defined asand
4. Results and Discussion
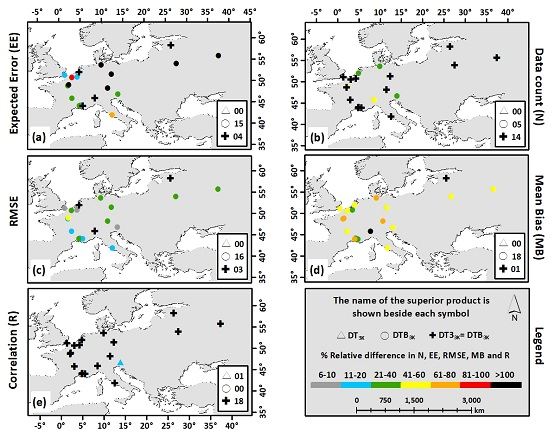
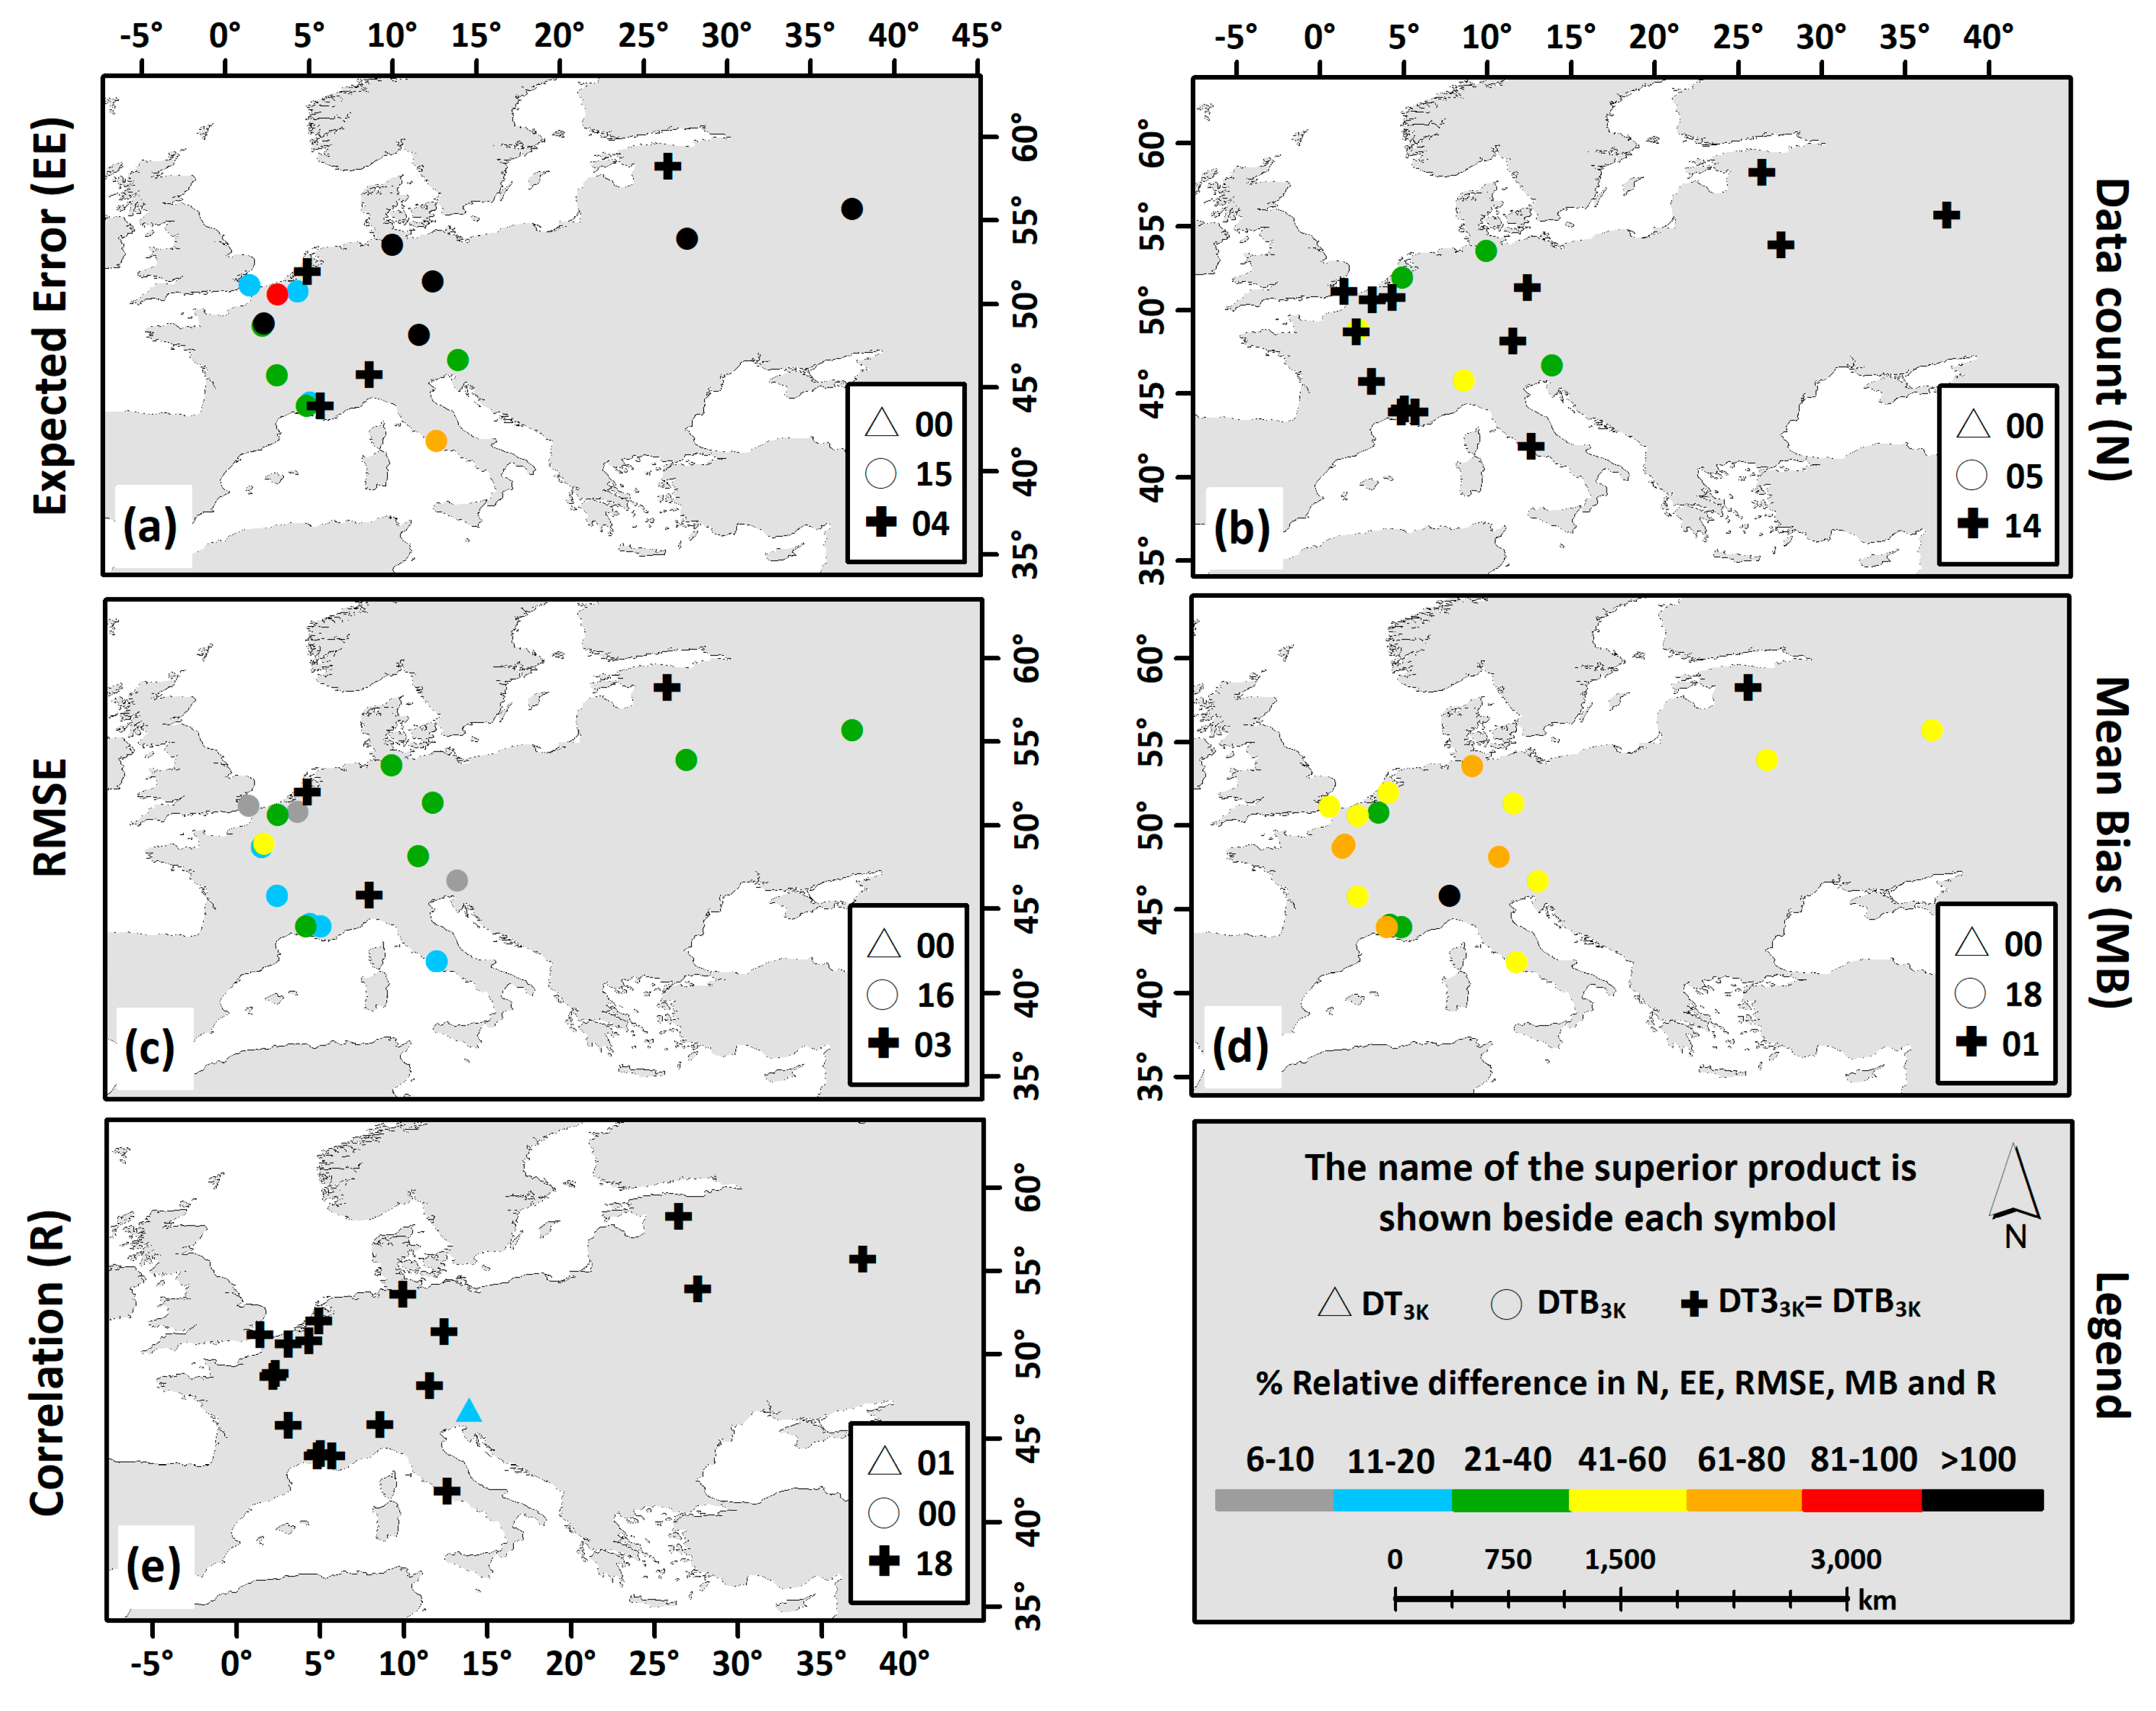
4.1. Validation of the DT3K and DTB3K AOD Products at Regional Scale
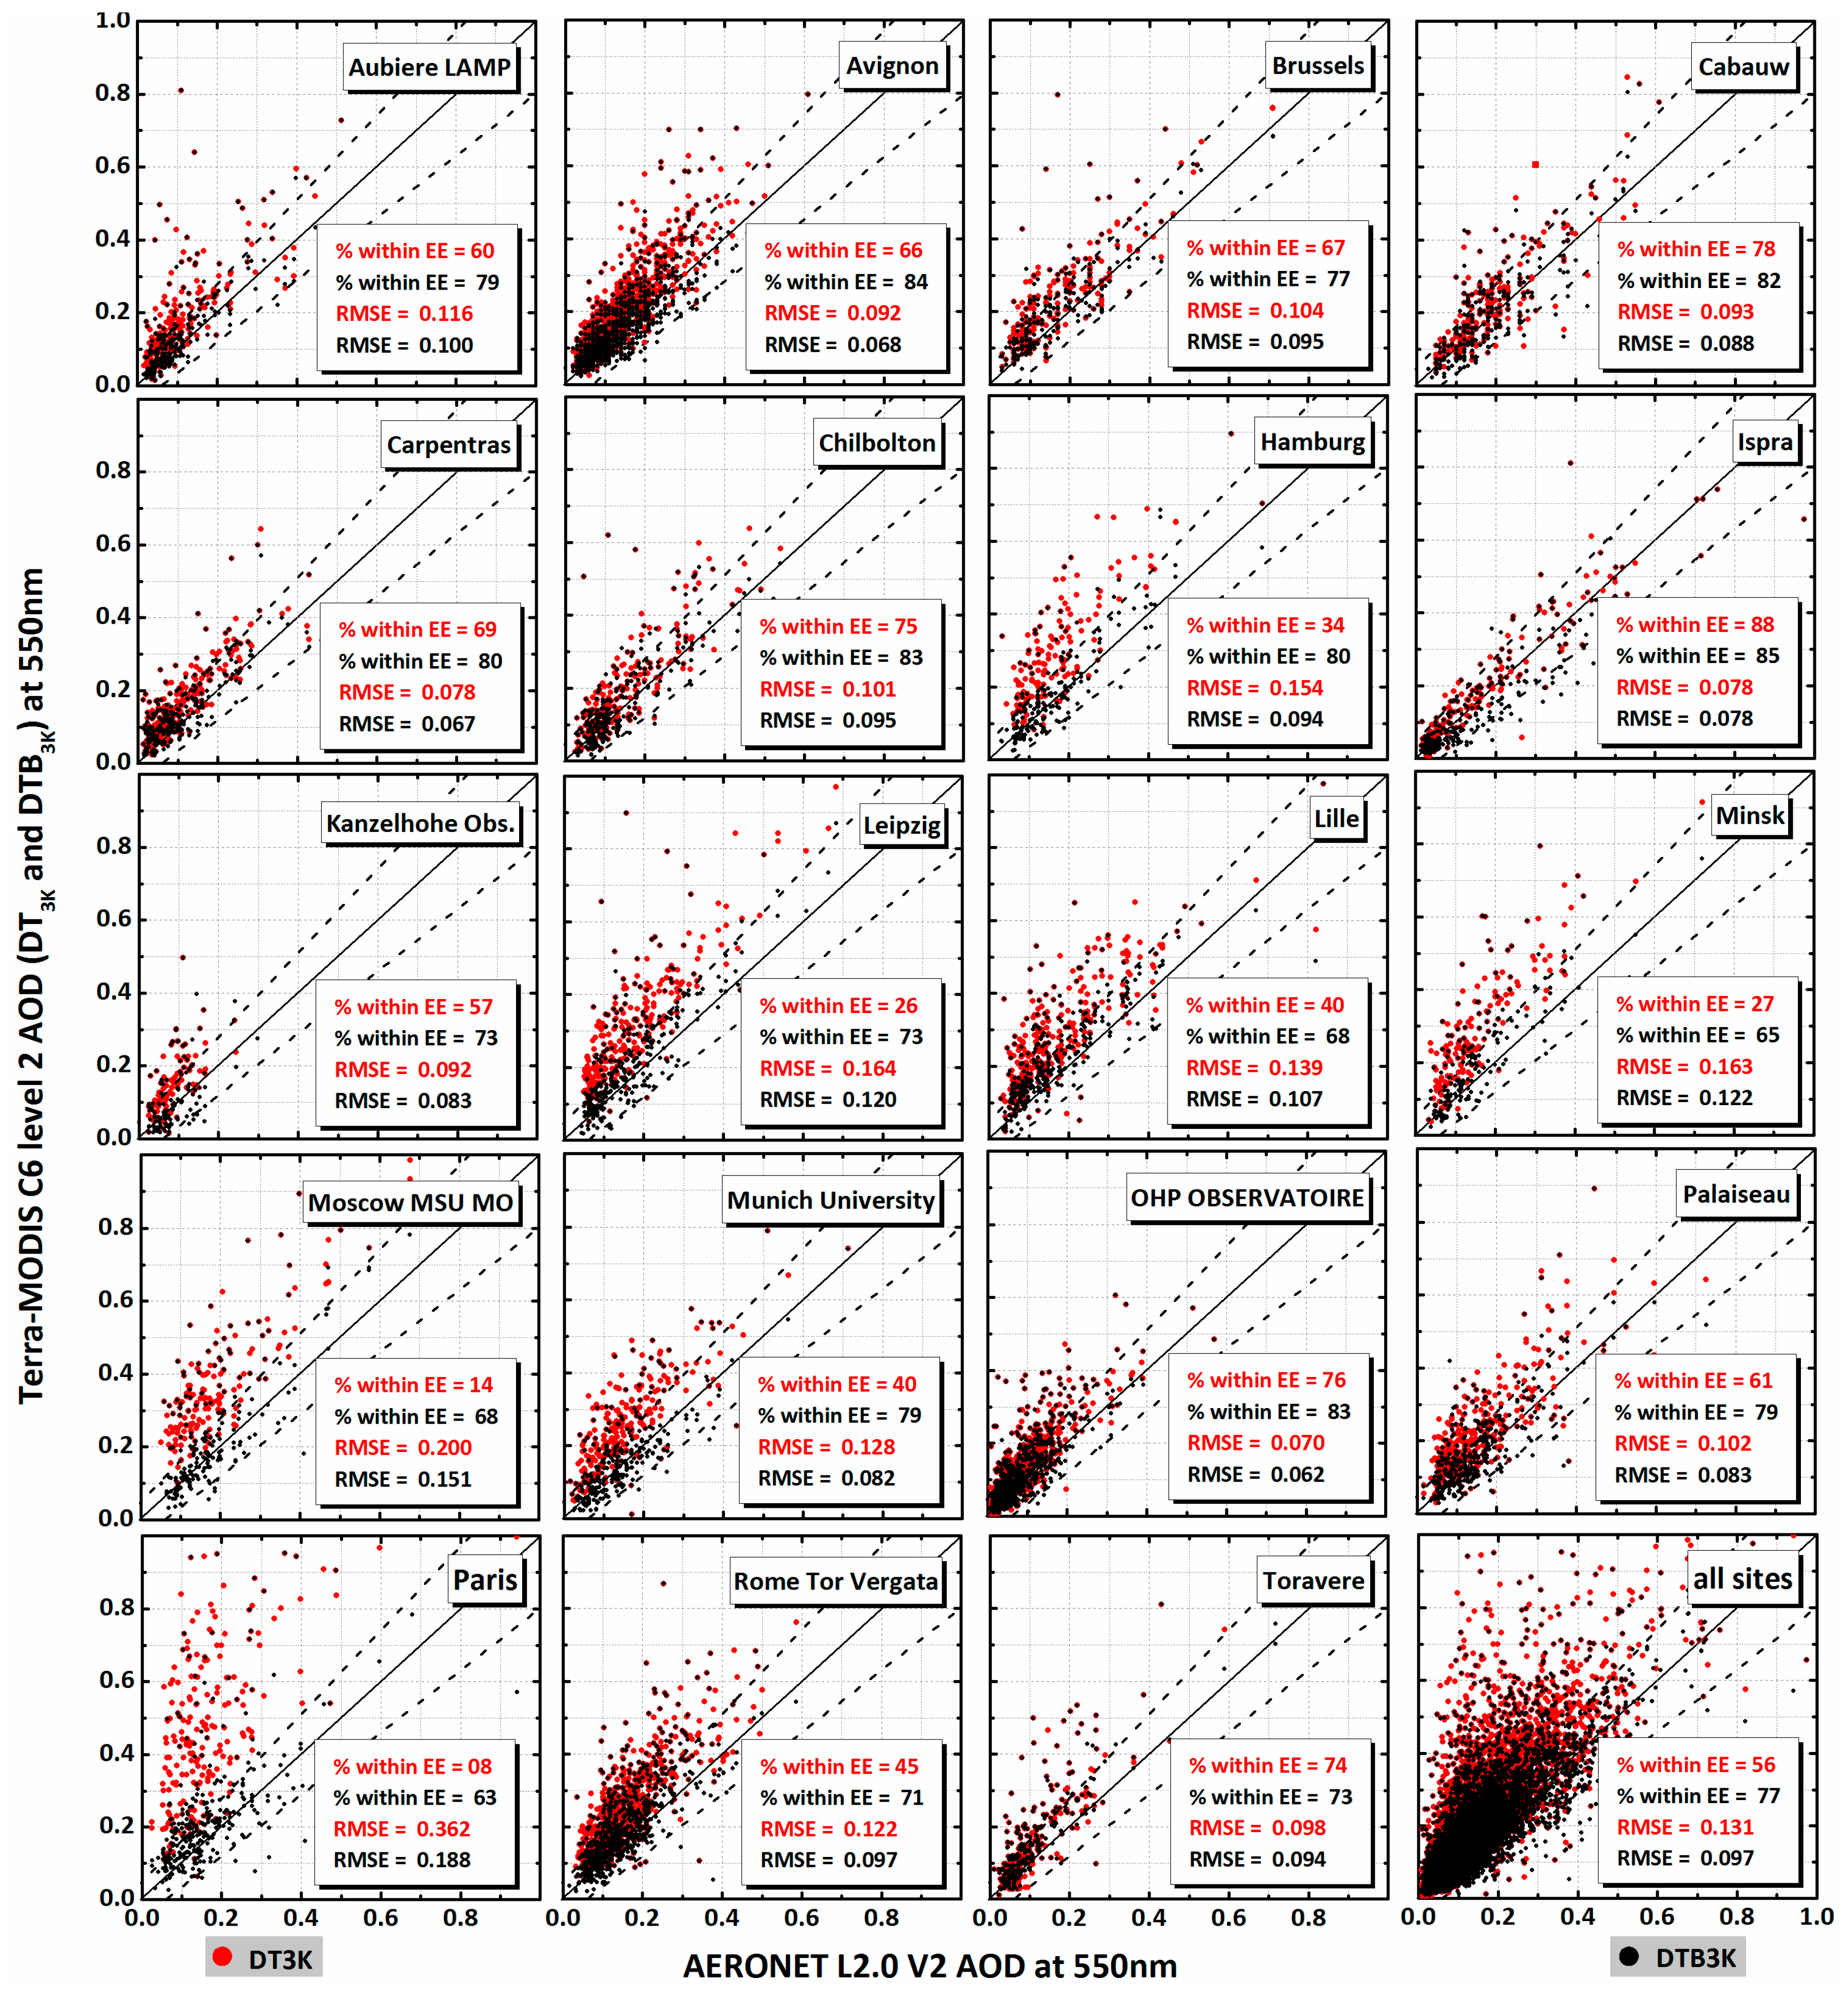
4.2. Validation of the DT3K and DTB3K AOD Products at Local Scales
5. Summary and Conclusions
- (i)
- DT3K AOD retrievals were overestimated over vegetated surfaces for both low and high aerosol loadings.
- (ii)
- The overestimation might be caused by the underestimation of the surface reflectance and inappropriate aerosol model.
- (iii)
- Only 56% retrievals of the DT3K were within the EE which indicates that the DT3K product does not meet the requirements of the EE.
- (iv)
- The DTB3K method significantly improved the retrieval quality as the percentage of the retrievals and data counts were increased, and RMSE and MB were decreased.
- (v)
- The contribution of DB AOD retrievals in the DTB3K helped to reduce the overestimation in the DT3K AOD retrievals for both low and high aerosol loadings.
- (vi)
- The percentage within the EE for the DTB3K retrievals increased up to 77% which indicates that the DTB3K product meets the requirements of the EE, and this is a 38% relative increase over the DT3K AOD retrievals.
- (vii)
- The DBT3K method reduced the RMSE and MB errors by 26% and 54%, respectively, for all sites.
Supplementary Materials
Supplementary File 1Acknowledgments
Author Contributions
Conflicts of Interest
References
- Kaufman, Y.J.; Tanré, D.; Boucher, O. A satellite view of aerosols in the climate system. Nature 2002, 419, 215–223. [Google Scholar] [CrossRef] [PubMed]
- Cheung, H.-C.; Wang, T.; Baumann, K.; Guo, H. Influence of regional pollution outflow on the concentrations of fine particulate matter and visibility in the coastal area of southern China. Atmos. Environ. 2005, 39, 6463–6474. [Google Scholar] [CrossRef]
- Park, R.J.; Jacob, D.J.; Kumar, N.; Yantosca, R.M. Regional visibility statistics in the United States: Natural and transboundary pollution influences, and implications for the Regional Haze Rule. Atmos. Environ. 2006, 40, 5405–5423. [Google Scholar] [CrossRef] [Green Version]
- Bell, M.L.; Ebisu, K.; Belanger, K. Ambient air pollution and low birth weight in Connecticut and Massachusetts. Environ. Health Perspect. 2007, 115, 1118–1124. [Google Scholar] [CrossRef] [PubMed]
- Dominici, F.; Peng, R.D.; Bell, M.L.; Pham, L.; McDermott, A.; Zeger, S.L.; Samet, J.M. Fine particulate air pollution and hospital admission for cardiovascular and respiratory diseases. JAMA 2006, 295, 1127–1134. [Google Scholar] [CrossRef] [PubMed]
- Götschi, T.; Heinrich, J.; Sunyer, J.; Künzli, N. Long-term effects of ambient air pollution on lung function: A review. Epidemiology 2008, 19, 690–701. [Google Scholar] [CrossRef] [PubMed]
- Pope, C.A.; Burnett, R.T.; Thun, M.J.; Calle, E.E.; Krewski, D.; Ito, K.; Thurston, G.D. Lung cancer, cardiopulmonary mortality, and long-term exposure to fine particulate air pollution. JAMA 2002, 287, 1132–1141. [Google Scholar] [CrossRef] [PubMed]
- Pope, C.A.; Dockery, D.W. Health effects of fine particulate air pollution: Lines that connect. J. Air Waste Manag. Assoc. 2006, 56, 709–742. [Google Scholar] [CrossRef]
- Pope, C.A.; Ezzati, M.; Dockery, D.W. Fine-particulate air pollution and life expectancy in the United States. N. Engl. J. Med. 2009, 360, 376–386. [Google Scholar] [CrossRef] [PubMed]
- Holben, B.N.; Eck, T.F.; Slutsker, I.; Tanré, D.; Buis, J.P.; Setzer, A.; Vermote, E.; Reagan, J.A.; Kaufman, Y.J.; Nakajima, T.; et al. Aeronet—A federated instrument network and data archive for aerosol characterization. Remote Sens. Environ. 1998, 66, 1–16. [Google Scholar] [CrossRef]
- Holben, N.; Tanr, D.; Smirnov, A.; Eck, T.F.; Slutsker, I.; Newcomb, W.W.; Schafer, J.S.; Chatenet, B.; Lavenu, F.; Kaufman, J.; et al. An emerging ground-based aerosol climatology: Aerosol optical depth from AERONET. J. Geophys. Res. Atmos. 2001, 106, 12067–12097. [Google Scholar] [CrossRef]
- Smirnov, A.; Holben, B.N.; Eck, T.F.; Dubovik, O.; Slutsker, I. Cloud-screening and quality control algorithms for the AERONET database. Remote Sens. Environ. 2000, 73, 337–349. [Google Scholar] [CrossRef]
- Levy, R.C.; Mattoo, S.; Munchak, L.A.; Remer, L.A.; Sayer, A.M.; Patadia, F.; Hsu, N.C. The Collection 6 MODIS aerosol products over land and ocean. Atmos. Meas. Tech. 2013, 6, 2989–3034. [Google Scholar] [CrossRef]
- Aaron, V.D.; Randall, V.M.; Robert, J.D.S.; Richard, T.B. High-resolution satellite-derived PM2.5 from optimal estimation and geographically weighted regression over North America. Environ. Sci. Technol. 2015, 49, 10482–10491. [Google Scholar]
- Hauser, A.; Oesch, D.; Foppa, N.; Wunderle, S. NOAA AVHRR derived aerosol optical depth over land. J. Geophys. Res. 2005, 110, D08204. [Google Scholar] [CrossRef]
- Hsu, N.C.; Jeong, M.-J.; Bettenhausen, C.; Sayer, A.M.; Hansell, R.; Seftor, C.S.; Huang, J.; Tsay, S.-C. Enhanced deep blue aerosol retrieval algorithm: The second generation. J. Geophys. Res. Atmos. 2013, 118, 9296–9315. [Google Scholar] [CrossRef]
- Jackson, J.M.; Liu, H.; Laszlo, I.; Kondragunta, S.; Remer, L.A.; Huang, J.; Huang, H.-C. Suomi-NPP VIIRS aerosol algorithms and data products. J. Geophys. Res. Atmos. 2013, 118, 12673–12689. [Google Scholar] [CrossRef]
- Kahn, R.A.; Gaitley, B.J.; Garay, M.J.; Diner, D.J.; Eck, T.F.; Smirnov, A.; Holben, B.N. Multiangle imaging spectroradiometer global aerosol product assessment by comparison with the aerosol robotic network. J. Geophys. Res. 2010, 115, D23209. [Google Scholar] [CrossRef]
- Kahn, R.A.; Gaitley, B.J.; Martonchik, J.V.; Diner, D.J.; Crean, K.A.; Holben, B. Multiangle Imaging Spectroradiometer (MISR) global aerosol optical depth validation based on 2 years of coincident Aerosol Robotic Network (AERONET) observations. J. Geophys. Res. 2005, 110, D10S04. [Google Scholar] [CrossRef]
- Liu, H.; Remer, L.A.; Huang, J.; Huang, H.-C.; Kondragunta, S.; Laszlo, I.; Oo, M.; Jackson, J.M. Preliminary evaluation of S-NPP VIIRS aerosol optical thickness. J. Geophys. Res. Atmos. 2014, 119, 3942–3962. [Google Scholar] [CrossRef]
- Remer, L.a.; Kaufman, Y.J.; Tanré, D.; Mattoo, S.; Chu, D.a.; Martins, J.V.; Li, R.-R.; Ichoku, C.; Levy, R.C.; Kleidman, R.G.; et al. The MODIS aerosol algorithm, products, and validation. J. Atmos. Sci. 2005, 62, 947–973. [Google Scholar] [CrossRef]
- Riffler, M.; Popp, C.; Hauser, A.; Fontana, F.; Wunderle, S. Validation of a modified avhrr aerosol optical depth retrieval algorithm over central europe. Atmos. Meas. Tech. 2010, 3, 1255–1270. [Google Scholar] [CrossRef] [Green Version]
- Sayer, A.M.; Hsu, N.C.; Bettenhausen, C.; Jeong, M.-J.; Holben, B.N.; Zhang, J. Global and regional evaluation of over-land spectral aerosol optical depth retrievals from SeaWiFS. Atmos. Meas. Tech. 2012, 5, 1761–1778. [Google Scholar] [CrossRef]
- Torres, O.; Bhartia, P.K.; Herman, J.R.; Sinyuk, A.; Ginoux, P.; Holben, B. A long-term record of aerosol optical depth from toms observations and comparison to AERONET measurements. J. Atmos. Sci. 2002, 59, 398–413. [Google Scholar] [CrossRef]
- Torres, O.; Tanskanen, A.; Veihelmann, B.; Ahn, C.; Braak, R.; Bhartia, P.K.; Veefkind, P.; Levelt, P. Aerosols and surface UV products from ozone monitoring instrument observations: An overview. J. Geophys. Res. 2007, 112, D24S47. [Google Scholar] [CrossRef]
- Vidot, J.; Santer, R.; Aznay, O. Evaluation of the meris aerosol product over land with AERONET. Atmo. Chem. Phys. 2008, 8, 7603–7617. [Google Scholar] [CrossRef]
- Kaufman, Y.J.; Tanr, D.; Remer, L.A.; Vermote, E.F.; Chu, A. Operational remote sensing of tropospheric aerosol over land from EOS moderate resolution imaging spectroradiometer after the launch of MODIS the distribution. J. Geophys. Res. Atmos. 1997, 102, 17051–17067. [Google Scholar] [CrossRef]
- Levy, R.C.; Remer, L.a.; Mattoo, S.; Vermote, E.F.; Kaufman, Y.J. Second-generation operational algorithm: Retrieval of aerosol properties over land from inversion of moderate resolution imaging spectroradiometer spectral reflectance. J. Geophys. Res. 2007, 112, D13211. [Google Scholar] [CrossRef]
- Tanré, D.; Kaufman, Y.J.; Herman, M.; Mattoo, S. Remote sensing of aerosol properties over oceans using the MODIS/EOS spectral radiances. J. Geophys. Res. Atmos. 1997, 102, 16971–16988. [Google Scholar] [CrossRef]
- Hsu, N.C.; Tsay, S.-C.; King, M.D.; Herman, J.R. Aerosol properties over bright-reflecting source regions. IEEE Trans. Geosci. Remote Sens. 2004, 42, 557–569. [Google Scholar] [CrossRef]
- Hsu, N.C.; Tsay, S.-C.; King, M.D.; Herman, J.R. Deep blue retrievals of asian aerosol properties during ACE-Asia. IEEE Trans. Geosci. Remote Sens. 2006, 44, 3180–3195. [Google Scholar] [CrossRef]
- Remer, L.A.; Mattoo, S.; Levy, R.C.; Munchak, L.A. MODIS 3 km aerosol product: Algorithm and global perspective. Atmos. Meas. Tech. 2013, 6, 1829–1844. [Google Scholar] [CrossRef]
- Munchak, L.A.; Levy, R.C.; Mattoo, S.; Remer, L.A.; Holben, B.N.; Schafer, J.S.; Hostetler, C.A.; Ferrare, R.A. Modis 3 km aerosol product: Applications over land in an urban/suburban region. Atmos. Meas. Tech. 2013, 6, 1747–1759. [Google Scholar] [CrossRef]
- Livingston, J.M.; Redemann, J.; Shinozuka, Y.; Johnson, R.; Russell, P.B.; Zhang, Q.; Mattoo, S.; Remer, L.; Levy, R.; Munchak, L.; et al. Comparison of MODIS 3 km and 10 km resolution aerosol optical depth retrievals over land with airborne sunphotometer measurements during arctas summer 2008. Atmo. Chem. Phys. 2014, 14, 2015–2038. [Google Scholar] [CrossRef]
- Bilal, M.; Nichol, J.E. Evaluation of MODIS aerosol retrieval algorithms over the Beijing-Tianjin-Hebei region during low to very high pollution events. J. Geophys. Res. Atmos. 2015, 120, 7941–7957. [Google Scholar] [CrossRef]
- Nichol, J.; Bilal, M. Validation of MODIS 3 km resolution aerosol optical depth retrievals over Asia. Remote Sens. 2016, 8, 328. [Google Scholar] [CrossRef]
- Sayer, A.M.; Hsu, N.C.; Bettenhausen, C.; Jeong, M.-J. Validation and uncertainty estimates for MODIS Collection 6 “deep blue” aerosol data. J. Geophys. Res. Atmos. 2013, 118, 7864–7872. [Google Scholar] [CrossRef]
- Sayer, A.M.; Munchak, L.A.; Hsu, N.C.; Levy, R.C.; Bettenhausen, C.; Jeong, M.J. MODIS Collection 6 aerosol products: Comparison between Aqua‘s e-deep blue, dark target, and “merged” data sets, and usage recommendations. J. Geophys. Res. Atmos. 2014, 119, 13965–13989. [Google Scholar] [CrossRef]
- Bilal, M.; Nichol, J.; Wang, L. New customized methods for improvement of the MODIS C6 dark target and deep blue merged aerosol product. Remote Sens. Environ. 2017, 197, 115–124. [Google Scholar] [CrossRef]
- Tao, M.; Chen, L.; Wang, Z.; Tao, J.; Che, H.; Wang, X.; Wang, Y. Comparison and evaluation of the MODIS Collection 6 aerosol data in China. J. Geophys. Res. Atmos. 2015, 120, 6992–7005. [Google Scholar] [CrossRef]
- Mhawish, A.; Banerjee, T.; Broday, D.M.; Misra, A.; Tripathi, S.N. Evaluation of MODIS Collection 6 aerosol retrieval algorithms over indo-gangetic plain: Implications of aerosols types and mass loading. Remote Sens. Environ. 2017, 201, 297–313. [Google Scholar] [CrossRef]
- Bilal, M.; Nazeer, M.; Nichol, J.E. Validation of MODIS and viirs derived aerosol optical depth over complex coastal waters. Atmos. Res. 2017, 186, 43–50. [Google Scholar] [CrossRef]
- Bilal, M.; Nichol, J.E.; Chan, P.W. Validation and accuracy assessment of a simplified aerosol retrieval algorithm (sara) over Beijing under low and high aerosol loadings and dust storms. Remote Sens. Environ. 2014, 153, 50–60. [Google Scholar] [CrossRef]
- Bilal, M.; Nichol, J.E.; Bleiweiss, M.P.; Dubois, D. A simplified high resolution MODIS aerosol retrieval algorithm (sara) for use over mixed surfaces. Remote Sens. Environ. 2013, 136, 135–145. [Google Scholar] [CrossRef]
- Sun, L.; Wei, J.; Bilal, M.; Tian, X.; Jia, C.; Guo, Y.; Mi, X. Aerosol optical depth retrieval over bright areas using landsat 8 oli images. Remote Sens. 2016, 8, 23. [Google Scholar] [CrossRef]
- Mateos, D.; Bilbao, J.; Kudish, A.I.; Parisi, A.V.; Carbajal, G.; di Sarra, A.; Román, R.; de Miguel, A. Validation of omi satellite erythemal daily dose retrievals using ground-based measurements from fourteen stations. Remote Sens. Environ. 2013, 128, 1–10. [Google Scholar] [CrossRef] [Green Version]
- Bilal, M.; Nichol, J. Evaluation of the NDVI-based pixel selection criteria of the MODIS C6 dark target and deep blue combined aerosol product. IEEE J. Sel. Top. Appl. Earth Obs. Remote Sens. 2017, 10, 3448–3453. [Google Scholar] [CrossRef]
- He, L.; Wang, L.; Lin, A.; Zhang, M.; Bilal, M.; Wei, J. Performance of the NPP-VIIRS and Aqua-MODIS aerosol optical depth products over the Yangtze River Basin. Remote Sens. 2018, 10, 117. [Google Scholar] [CrossRef]
- Wei, J.; Sun, L.; Huang, B.; Bilal, M.; Zhang, Z.; Wang, L. Verification, improvement and application of aerosol optical depths in China part 1: Inter-comparison of NPP-VIIRS and Aqua-MODIS. Atmos. Environ. 2018, 175, 221–233. [Google Scholar] [CrossRef]
- Sayer, A.M.; Hsu, N.C.; Bettenhausen, C.; Jeong, M.J.; Meister, G. Effect of MODIS terra radiometric calibration improvements on Collection 6 deep blue aerosol products: Validation and Terra/Aqua consistency. J. Geophys. Res. Atmos. 2015, 120, 12157–12174. [Google Scholar] [CrossRef]
- Bilal, M.; Nichol, J.; Spak, S. A new approach for estimation of fine particulate concentrations using satellite aerosol optical depth and binning of meteorological variables. Aerosol Air Qual. Res. 2017, 11, 356–367. [Google Scholar] [CrossRef]
- Zou, B.; Pu, Q.; Bilal, M.; Weng, Q.; Zhai, L.; Nichol, J.E. High-resolution satellite mapping of fine particulates based on geographically weighted regression. IEEE Geosci. Remote Sens. Lett. 2016, 13, 495–499. [Google Scholar] [CrossRef]
- You, W.; Zang, Z.; Zhang, L.; Li, Y.; Wang, W. Estimating national-scale ground-level PM25 concentration in China using geographically weighted regression based on MODIS and MISR AOD. Environ. Sci. Pollut. Res. Int. 2016, 23, 8327–8338. [Google Scholar] [CrossRef] [PubMed]
- Li, R.; Gong, J.; Chen, L.; Wang, Z. Estimating ground-level PM2.5 using fine-resolution satellite data in the megacity of Beijing, China. Aerosol Air Qual. Res. 2015, 15, 1347–1356. [Google Scholar] [CrossRef]
- Ma, Z.; Hu, X.; Sayer, A.M.; Levy, R.; Zhang, Q.; Xue, Y.; Tong, S.; Bi, J.; Huang, L.; Liu, Y. Satellite-based spatiotemporal trends in PM2.5 concentrations: China, 2004–2013. Environ. Health Perspect. 2015, 124, 184–192. [Google Scholar] [CrossRef] [PubMed]
- Geng, G.; Zhang, Q.; Marin, R.V.; Donkelaar, A.V.; Huo, H.; Che, H.; Lin, J.; He, K. Estimating long-term PM2.5 concentrations in China using satellite-based aerosol optical depth and a chemical transport model. Remote Sens. Environ. 2015, 166, 262–270. [Google Scholar] [CrossRef]
- Guo, Y.; Feng, N.; Christopher, S.A.; Kang, P.; Zhan, F.B.; Hong, S. Satellite remote sensing of fine particulate matter (PM2.5) air quality over Beijing using MODIS. Int. J. Remote Sens. 2014, 35, 6522–6544. [Google Scholar] [CrossRef]
- Ma, Z.; Hu, X.; Huang, L.; Bi, J.; Liu, Y. Estimating ground-level PM2.5 in China using satellite remote sensing. Environ. Sci. Technol. 2014, 48, 7436–7444. [Google Scholar] [CrossRef] [PubMed]
- Snider, G.; Weagle, C.L.; Martin, R.V.; van Donkelaar, A.; Conrad, K.; Cunningham, D.; Gordon, C.; Zwicker, M.; Akoshile, C.; Artaxo, P.; et al. Spartan: A global network to evaluate and enhance satellite-based estimates of ground-level particulate matter for global health applications. Atmos. Meas. Tech. Discuss 2014, 7, 7569–7611. [Google Scholar] [CrossRef]
- Saunders, R.O.; Kahl, J.D.W.; Ghorai, J.K. Improved estimation of PM2.5 using lagrangian satellite-measured aerosol optical depth. Atmos. Environ. 2014, 91, 146–153. [Google Scholar] [CrossRef]
- Toth, T.D.; Zhang, J.; Campbell, J.R.; Hyer, E.J.; Reid, J.S.; Shi, Y.; Westphal, D.L. Impact of data quality and surface-to-column representativeness on the PM2.5/satellite AOD relationship for the contiguous United States. Atmos. Chem. Phys. 2014, 14, 6049–6062. [Google Scholar] [CrossRef] [Green Version]
- Fang, X.; Zou, B.; Liu, X.; Sternberg, T.; Zhai, L. Satellite-based ground PM2.5 estimation using timely structure adaptive modeling. Remote Sens. Environ. 2017, 186, 152–163. [Google Scholar] [CrossRef]
- Zou, B.; Wang, M.; Wan, N.; Wilson, J.G.; Fang, X.; Tang, Y. Spatial modeling of PM2.5 concentrations with a multifactoral radial basis function neural network. Environ. Sci. Pollut. Res. Int. 2015, 22, 10395–10404. [Google Scholar] [CrossRef] [PubMed]
- Zou, B.; Luo, Y.; Wan, N.; Zheng, Z.; Sternberg, T.; Liao, Y. Performance comparison of LUR and OK in PM2.5 concentration mapping: A multidimensional perspective. Sci. Rep. 2015, 5, 8698. [Google Scholar] [CrossRef] [PubMed]
- Parker, J.A.; Kenyon, R.V.; Troxel, D.E. Comparison of interpolating methods for image resampling. IEEE Trans. Med. Imaging 1983, 2, 31–39. [Google Scholar] [CrossRef] [PubMed]
- Lehmann, T.M.; Gonner, C.; Spitzer, K. Survey: Interpolation methods in medical image processing. IEEE Trans. Med. Imaging 1999, 18, 1049–1075. [Google Scholar] [CrossRef] [PubMed]
- Remer, L.A.; Kleidman, R.G.; Levy, R.C.; Kaufman, Y.J.; Tanré, D.; Mattoo, S.; Martins, J.V.; Ichoku, C.; Koren, I.; Yu, H.; et al. Global aerosol climatology from the MODIS satellite sensors. J. Geophys. Res. 2008, 113, D14S07. [Google Scholar] [CrossRef]
- Bilal, M.; Nichol, J.E.; Nazeer, M. Validation of Aqua-MODIS C051 and C006 operational aerosol products using AERONET measurements over Pakistan. IEEE J. Sel. Top. Appl. Earth Obs. Remote Sens. 2016, 9, 2074–2080. [Google Scholar] [CrossRef]
- Ichoku, C.; Remer, L.A.; Kaufman, Y.J.; Levy, R.C.; Chu, D.A.; Tanré, D.; Holben, B.N. Modis observation of aerosols and estimation of aerosol radiative forcing over Southern Africa during SAFARI 2000. J. Geophys. Res. 2003, 108, 8499. [Google Scholar] [CrossRef]


| Site | Latitude (°N) | Longitude (°E) | Elevation (m) | Avg. NDVI | Country |
|---|---|---|---|---|---|
| Aubiere LAMP | 45.76096 | 3.11107 | 423.0 | 0.36 | France |
| Avignon | 43.93275 | 4.87807 | 32.0 | 0.54 | France |
| Brussels | 50.78333 | 4.35000 | 120.0 | 0.59 | Belgium |
| Cabauw | 51.97100 | 4.92700 | −0.7 | 0.72 | Netherlands |
| Carpentras | 44.08333 | 5.05833 | 100.0 | 0.45 | France |
| Chilbolton | 51.14446 | 1.43698 | 88.0 | 0.60 | UK |
| Hamburg | 53.56833 | 9.97333 | 105.0 | 0.37 | Germany |
| Ispra | 45.80305 | 8.62670 | 235.0 | 0.57 | Italy |
| Kanzelhohe Obs. | 46.67800 | 13.90700 | 1526.0 | 0.65 | Austria |
| Leipzig | 51.35250 | 12.43528 | 125.0 | 0.44 | Germany |
| Lille | 50.61167 | 3.14167 | 60.0 | 0.45 | France |
| Minsk | 53.92000 | 27.60100 | 200.0 | 0.32 | Belarus |
| Moscow MSU MO | 55.70000 | 37.51000 | 192.0 | 0.31 | Russia |
| Munich University | 48.14800 | 11.57300 | 533.0 | 0.37 | Germany |
| OHP OBSERVATOIRE | 43.93500 | 5.71000 | 680.0 | 0.55 | France |
| Palaiseau | 48.70000 | 2.20833 | 156.0 | 0.57 | France |
| Paris | 48.86667 | 2.33333 | 50.0 | 0.15 | France |
| Rome Tor Vergata | 41.83955 | 12.64733 | 130.0 | 0.48 | Italy |
| Toravere | 58.25500 | 26.46000 | 70.0 | 0.50 | Estonia |
| Site | N | % Above/Within/Below EE | RMSE | MB | R |
|---|---|---|---|---|---|
| DT3K AOD Product | |||||
| Aubiere LAMP | 232 | 40/60/00 | 0.116 | 0.073 | 0.731 |
| Avignon | 783 | 34/66/00 | 0.092 | 0.064 | 0.853 |
| Brussels | 211 | 33/67/00 | 0.104 | 0.063 | 0.817 |
| Cabauw | 219 | 19/78/03 | 0.093 | 0.040 | 0.837 |
| Carpentras | 258 | 31/69/00 | 0.078 | 0.057 | 0.861 |
| Chilbolton | 241 | 24/75/01 | 0.101 | 0.041 | 0.728 |
| Hamburg | 149 | 66/34/00 | 0.154 | 0.127 | 0.835 |
| Ispra | 183 | 09/88/03 | 0.078 | 0.012 | 0.913 |
| Kanzelhohe Obs. | 96 | 43/53/00 | 0.092 | 0.067 | 0.623 |
| Leipzig | 293 | 74/26/00 | 0.164 | 0.137 | 0.832 |
| Lille | 303 | 58/40/02 | 0.139 | 0.107 | 0.793 |
| Minsk | 161 | 73/27/00 | 0.163 | 0.135 | 0.828 |
| Moscow MSU MO | 173 | 86/14/00 | 0.200 | 0.179 | 0.888 |
| Munich University | 257 | 59/40/01 | 0.128 | 0.104 | 0.794 |
| OHP OBSERVATOIRE | 765 | 24/76/00 | 0.070 | 0.045 | 0.834 |
| Palaiseau | 354 | 38/61/01 | 0.102 | 0.066 | 0.787 |
| Paris | 212 | 92/08/00 | 0.362 | 0.311 | 0.533 |
| Rome Tor Vergata | 675 | 54/45/01 | 0.122 | 0.096 | 0.778 |
| Toravere | 261 | 25/74/01 | 0.098 | 0.053 | 0.811 |
| All sites | 5826 | 43/56/01 | 0.131 | 0.085 | 0.769 |
| DTB3K AOD Product | |||||
| Aubiere LAMP | 240 | 20/79/01 | 0.100 | 0.043 | 0.724 |
| Avignon | 897 | 15/84/01 | 0.068 | 0.023 | 0.809 |
| Brussels | 223 | 23/77/00 | 0.095 | 0.048 | 0.802 |
| Cabauw | 266 | 14/82/04 | 0.088 | 0.019 | 0.817 |
| Carpentras | 268 | 20/80/00 | 0.067 | 0.037 | 0.828 |
| Chilbolton | 254 | 15/83/02 | 0.095 | 0.022 | 0.717 |
| Hamburg | 188 | 19/80/01 | 0.094 | 0.036 | 0.804 |
| Ispra | 276 | 04/85/11 | 0.076 | −0.019 | 0.897 |
| Kanzelhohe Obs. | 120 | 24/73/03 | 0.084 | 0.027 | 0.552 |
| Leipzig | 324 | 24/74/02 | 0.120 | 0.063 | 0.760 |
| Lille | 325 | 31/68/01 | 0.107 | 0.063 | 0.787 |
| Minsk | 178 | 34/65/01 | 0.122 | 0.066 | 0.767 |
| Moscow MSU MO | 202 | 30/68/02 | 0.151 | 0.072 | 0.932 |
| Munich University | 286 | 19/79/02 | 0.082 | 0.022 | 0.768 |
| OHP OBSERVATOIRE | 779 | 17/83/00 | 0.062 | 0.030 | 0.803 |
| Palaiseau | 369 | 18/79/03 | 0.083 | 0.025 | 0.751 |
| Paris | 304 | 34/63/03 | 0.188 | 0.083 | 0.495 |
| Rome Tor Vergata | 717 | 28/71/01 | 0.097 | 0.052 | 0.734 |
| Toravere | 276 | 26/73/01 | 0.094 | 0.051 | 0.802 |
| All sites | 6492 | 21/77/02 | 0.097 | 0.039 | 0.801 |
© 2018 by the authors. Licensee MDPI, Basel, Switzerland. This article is an open access article distributed under the terms and conditions of the Creative Commons Attribution (CC BY) license (http://creativecommons.org/licenses/by/4.0/).
Share and Cite
Bilal, M.; Qiu, Z.; Campbell, J.R.; Spak, S.N.; Shen, X.; Nazeer, M. A New MODIS C6 Dark Target and Deep Blue Merged Aerosol Product on a 3 km Spatial Grid. Remote Sens. 2018, 10, 463. https://0-doi-org.brum.beds.ac.uk/10.3390/rs10030463
Bilal M, Qiu Z, Campbell JR, Spak SN, Shen X, Nazeer M. A New MODIS C6 Dark Target and Deep Blue Merged Aerosol Product on a 3 km Spatial Grid. Remote Sensing. 2018; 10(3):463. https://0-doi-org.brum.beds.ac.uk/10.3390/rs10030463
Chicago/Turabian StyleBilal, Muhammad, Zhongfeng Qiu, James R. Campbell, Scott N. Spak, Xiaojing Shen, and Majid Nazeer. 2018. "A New MODIS C6 Dark Target and Deep Blue Merged Aerosol Product on a 3 km Spatial Grid" Remote Sensing 10, no. 3: 463. https://0-doi-org.brum.beds.ac.uk/10.3390/rs10030463