Article

The Spatiotemporal Response of Soil Moisture to Precipitation and Temperature Changes in an Arid Region, China

1
State Key Laboratory of Desert and Oasis Ecology, Xinjiang Institute of Ecology and Geography, Chinese Academy of Sciences, Urumqi 830011, China
2
University of Chinese Academy of Sciences, Beijing 100049, China
3
Department of Geography, Ghent University, 9000 Ghent, Belgium
4
Sino-Belgian Joint Laboratory of Geo-Information, Urumqi 830011, China
5
Sino-Belgian Joint Laboratory of Geo-Information, 9000 Ghent, Belgium
6
National Institute of Water and Atmospheric Research, Christchurch 8000, New Zealand
*
Author to whom correspondence should be addressed.
Submission received: 6 January 2018 / Revised: 11 March 2018 / Accepted: 14 March 2018 / Published: 16 March 2018
(This article belongs to the Special Issue Retrieval, Validation and Application of Satellite Soil Moisture Data)

Abstract

:
Soil moisture plays a crucial role in the hydrological cycle and climate system. The reliable estimation of soil moisture in space and time is important to monitor and even predict hydrological and meteorological disasters. Here we studied the spatiotemporal variations of soil moisture and explored the effects of precipitation and temperature on soil moisture in different land cover types within the Tarim River Basin from 2001 to 2015, based on high-spatial-resolution soil moisture data downscaled from the European Space Agency’s (ESA) Climate Change Initiative (CCI) soil moisture data. The results show that the spatial average soil moisture increased slightly from 2001 to 2015, and the soil moisture variation in summer contributed most to regional soil moisture change. For the land cover, the highest soil moisture occurred in the forest and the lowest value was found in bare land, and soil moisture showed significant increasing trends in grassland and bare land during 2001~2015. Both partial correlation analysis and multiple linear regression analysis demonstrate that in the study area precipitation had positive effects on soil moisture, while temperature had negative effects, and precipitation made greater contributions to soil moisture variations than temperature. The results of this study can be used for decision making for water management and allocation.

Graphical Abstract

1. Introduction

Soil moisture is an important state variable of the terrestrial system and plays a critical role in the hydrological cycle by controlling the partition of rainfall between land (infiltration, percolation, and runoff) and the atmosphere (evaporation and plant transpiration) [1]. Soil moisture is also recognized as an essential climate variable, which can affect how available solar energy is returned to the atmosphere through partitioning the net radiation into sensible heat to heat air and latent heat for evaporation [2,3]. Recent studies have shown the effects of soil moisture on the feedbacks between land-surface and atmospheric processes that lead to climate irregularities [4,5]. In addition, soil moisture plays a vital role in monitoring drought persistence and development, and provides a base for drought indices, such as the Standardized Soil Moisture Index (SSI), Soil Moisture Percentile (SMP) [6], soil moisture-based Drought Severity Index (DSI) [7] and Empirical Standardized Soil Moisture Index (ESSMI) [8]. Hence, the reliable estimation of the spatial and temporal characteristics of soil moisture is important to understand the land-atmosphere coupling and monitor drought.
Soil moisture variation is influenced by multiple factors. Climate change is the main driving force of soil moisture variation [9]. Precipitation is the main input of water balance and can directly impact the soil moisture; temperature controls evapotranspiration and indirectly affects soil moisture [10,11]. To some degree, soil moisture can be seen as the result of the balance of precipitation and evaporation [12]. In addition to the effects of climate, land covers can affect the soil characteristics and evapotranspiration and, subsequently, soil moisture variation [13,14]. Furthermore, different soil types can lead to heterogeneity of soil moisture due to different soil physical characteristics. Soil moisture distribution depends on different combinations of climate, vegetation, and soil types [15].
As stated above, many researchers have intensively studied the relationship between soil moisture and meteorological variables, but to the best of our knowledge, few studied the relative importance of one meteorological variable over others to soil moisture variation. Only Feng et al. [16] demonstrated that temperature contributes more than precipitation to soil moisture variation in a humid basin. Whether this conclusion generally applies (e.g., in an arid basin) is still unknown due to the complicated soil moisture-climate interaction and feedback. Furthermore, relevant research about multi-factor (e.g., precipitation, temperature, land cover and soil type) effects on soil moisture variation is still rare, especially in arid areas. Hence it is necessary to conduct further research in arid areas.
Tarim River Bain is a typical arid basin with scarce water resources and a fragile ecosystem, and it is sensitive to climate change [17,18]. In this basin, agriculture consumes over 90% water resources [19], which make it difficult to manage scarce water resources for the stability of the ecological environment and the sustainable development of agriculture. In recent years, the Tarim River Basin has experienced drastic hydrological changes due to climate change and intensive human activities [20]. The research on the spatiotemporal variation of soil moisture can provide a decision support for local water resource management and drought monitoring under the climate change. In this research, we will explore the effects of the climate factors (i.e., precipitation and temperature) and land cover type on soil moisture variation within the Tarim River Basin, and aim to provide a better understanding on the spatiotemporal variation of soil moisture. As soil types in the study area have relatively less variation, and loam and sandy loam take up about 92% of the study area, we ignored the effect of soil type on the soil moisture variation in this research.
The in situ observation data can reflect the temporal characteristics of soil moisture at the point scale, but it can hardly be used for research in large spatial scale, especially area with high spatial heterogeneity. Compared with field survey, microwave remote sensing provides a better way to capture soil moisture at different spatial and temporal scales. Microwave techniques include the passive and active microwave approaches. Passive microwave radiometers record naturally emitted radiation, while active microwave sensors transmit electromagnetic waves and record the backscattered radiation [21]. These two approaches (i.e., active and passive) offer different advantages because of their instrument characteristics [22,23,24]. Active microwave remote sensing data have higher spatial resolution than passive data, while passive data have higher temporal resolution than active data [25,26]. In addition, active microwave is more sensitive to surface roughness, and passive microwave is more sensitive to soil moisture [27,28]. The complementarity of active and passive microwave products indicates that the combination of these two approaches can obtain better soil moisture retrieval [29,30].
However, there are some limitations of microwave soil moisture retrieval in areas with dense vegetation (e.g., tropical and boreal forests), as a thick canopy can obscure the soil surface [31]. Previous studies have shown that higher frequency band (e.g., X-band) can reflect from the upper surfaces of the vegetation canopy, and intermediate frequency band (e.g., C-band) can reflect from both the canopy and soil surface, while lower frequency band (e.g., L-band) can penetrate through the canopy and reflect from the soil surface [32,33]. Therefore, L-band has been proved to be the optimal remote sensing technology to estimate soil moisture at global scale [34,35]. However, L-band products (e.g., SMOS and SMAP) provide available soil moisture data for a relatively short period (less than 10 years), and cannot meet the demands of long time sequence analysis. For intermediate frequency band, Brown et al. [36] demonstrated that C-band can penetrate the drier vegetation and reflect from the soil surface. Recent studies also showed that intermediate band can provide accurate estimates of soil moisture in sparsely to moderately vegetated areas [30,37]. Tarim River Basin is a typical arid basin with a dry ecosystem, and most of the forests are desert riparian forests sparsely distributed near the Tarim River. In our study area, it has been proved that the intermediate band (e.g., C-band) can provide reliable estimates of soil moisture with a low random error [38,39].
ESA CCI soil moisture product (C-band observations), developed by European Space Agency’s (ESA) Climate Change Initiative (CCI) project, is derived from multiple active and passive microwave products and spans more than 30 years. However, the spatial resolution of ESA CCI soil moisture data is 25 km, which is unmatched with the land cover data used in this study. Here we applied a downscaling method proposed by Carlson et al. [40] to downscale the ESA CCI soil moisture data to a high spatial resolution with additional surface vegetation, temperature, and albedo, and then use the downscaled soil moisture data to do the analysis.
In this study, we will first downscale the ESA CCI soil moisture data from 25 km spatial resolution to 1 km spatial resolution, and then try to answer three questions with regard to the soil moisture-climate relationship at a monthly scale in different land covers: (1) what is the spatiotemporal variation of soil moisture in the study area; (2) what is the difference of soil moisture variations in different land cover types; and (3) which climate variable has greater effects on soil moisture in this region.

2. Study Area and Datasets

2.1. Study Area

The Tarim River is the largest inland river in China, with a total length of 1312 km. Currently, only the Yarkant River, Aksu River, and Hotan River have links with the main stream of the Tarim River (Figure 1).The Tarim River Basin is located in the arid area of Northwest China, where the Qinghai-Tibetan Plateau, Tianshan Mountains, Kunlun Mountains and Altun Mountains act as barriers to prevent warm and moist air from penetrating into the study area [41]. The annual precipitation is only 40~80 mm in the plain areas while as high as 250 mm in the mountains, and more than 80% falls from May to October. The annual mean air temperature is 10.6~11.5 °C, and the monthly mean temperature is between 20~30 °C in July and −10~−20 °C in January [17].
As the microwave remote sensing data suffer from severe data gaps in high altitude areas within the Tarim River Basin [39], here we only consider soil moisture data in the low altitude areas with elevations below 1500 m.

2.2. Satellite Soil Moisture Data

Recently, a multi-decadal product of soil moisture combining multiple active and passive microwave products has been developed by European Space Agency’s (ESA) Climate Change Initiative (CCI) project [38,42]. The ESA CCI product contains an active data set, a passive data set and a combined data set. In this study, the version v03.2 of ESA CCI soil moisture combined data set, derived from three active (AMI-WS, MetOp-A ASCAT, MetOp-B ASCAT) and seven passive (SMMR, SSM/I, TMI, WindSat, AMSR-E, AMSR2, SMOS) microwave sensors, was used to analyze the soil moisture variations. This dataset spans the period 1978~2015, with a temporal resolution of 1 day and a spatial resolution of 25 km, and it provides surface soil moisture information in volumetric units (m3·m−3). The general accuracy of the ESA CCI soil moisture data have been extensively examined in Africa [43], China [44], and the whole world [30].
Since satellite observation does not cover the whole study area every day, the ESA CCI data suffer from many spatial gaps on the daily scale. Therefore, our analysis is based on monthly soil moisture dataset averaged from ESA CCI daily data. To guarantee the accuracy of month average values, the averaging conversion was only applied to pixels where valid data have a length of more than 15 days every month. Additionally, to exclude the impact of snow cover and low soil temperatures on soil moisture retrieval, we focused our study on soil moisture during the warm season, that is, spring (April and May), summer (June, July, and August) and autumn (September and October).

2.3. Meteorological Data

The gridded datasets (V2.0) of precipitation and air temperature developed by the China Meteorological Data Sharing Service System were used in this study. The datasets cover the entirety of China with a spatial resolution of 50 km, based on more than 2400 weather stations. The time period spans from 1961 to the present, with a temporal resolution of one month. In our study, the datasets were subsequently re-sampled to 1 km with bilinear interpolation method to match the spatial resolution of the downscaled soil moisture data used in this study.

2.4. In Situ Observed Data

To validate the downscaled soil moisture data, we compared the downscaled soil moisture data with the in situ soil moisture observation from Shache station (38°71′ N, 77°45′ E) for the period 2001~2010. The data are obtained from National Meteorological Information Center of China Meteorological Administration [39]. This observation is measured using the gravimetric technique on the 8th, 18th and 28th day of each month at depths spanned 0~1 m during 1988~2010. As the remote sensing can only estimate soil moisture at top 5 cm of the soil, here we select the top layer (0~10 cm) for comparison.
Furthermore, the in situ precipitation and temperature data at Bachu station (39°48′ N, 78°34′ E), Tieganlike station (40°38′ N, 87°42′ E), Hetian station (37°08′ N, 79°56′ E) and Qiemo station (38°09′ N, 85°33′ E) were used to validate the re-sampled 1 km meteorological data. The data are provided at a monthly scale by the Chinese meteorological station network.

2.5. Auxiliary Data

The Land Cover Type product MCD12Q1 provided by Land Processes Distributed Active Archive Center was used as an auxiliary data set to analyze the soil moisture variations [45]. MCD12Q1 dataset provides a suite of land cover types with a global coverage and a spatial resolution of 500 m for 2001~2013. The primary classification system is defined by the International Geosphere Biosphere Programme (IGBP), which contains 17 land cover types. In this study, land cover types were reclassified into seven groups: (1) Forest, including evergreen needleleaf forest, evergreen broadleaf forest, deciduous needleleaf forest, deciduous broadleaf forest and mixed forest; (2) Shrubland, including closed shrubland and open shrubland; (3) Grassland, including woody savanna, savanna and grassland; (4) Cropland, including cropland and natural vegetation mosaic; (5) Water, including lakes, ice and snow; (6) Construction land, referring to cities and other human activity areas; and (7) Bare land, including barren and sparse vegetation coverage areas. In this study, the dataset was re-sampled to 1 km by applying the method of nearest neighbor.
Three products from the Moderate Resolution Imaging Spectroradiometer (MODIS) were used to downscale the ESA CCI soil moisture data: (1) Normalized Different Vegetation Index (NDVI) from MOD13A3; (2) Land Surface Temperature (LST) data from MOD11A2; (3) Albedo (A) data from MCD43B3. All of these products are at 1 km spatial resolution and can be downloaded from NASA’s Earth Observing System Data and Information System. LST and A are provided at a temporal resolution of 8 days, and they were converted into monthly averages in this study.

3. Methods

3.1. Downscaling of Soil Moisture

The ESA CCI soil moisture data have a spatial resolution of 25 km and does not match the land cover data used in this study. To achieve a high resolution, a downscaling method, proposed by Carlson et al. [40] and improved by Chauhan et al. [46], was used to downscale ESA CCI monthly soil moisture data from 25 km resolution to 1 km resolution, based on NDVI, LST and A. The relationship between soil moisture (SM), NDVI, LST and A can be expressed as a polynomial, and Carlson et al. [40] proved that normally the second or third order of a regression formula can provide a reasonable representation.
S M = i = 0 n j = 0 n k = 0 n a i j k · N D V I * ( i ) · L S T * ( j ) · A * ( k )
By expanding Equation (1) to a third order polynomial formula, one obtains:
S M = a 000 + a 100 N D V I * + a 010 L S T * + a 001 A * + a 200 N D V I * 2 + a 020 L S T * 2 + a 002 A * 2 + a 110 N A V I * L S T * + a 101 N D V I * A * + a 011 L S T * A * + a 300 N D V I * 3 + a 030 L S T * 3 + a 003 A * 3 + a 210 N D V I * 2 L S T * + a 201 N D V I * 2 A * + a 120 N D V I * L S T * 2 + a 021 L S T * 2 A * + a 102 N D V I * A * 2 + a 012 L S T * A * 2 + a 111 N D V I * L S T * A *
N D V I * = N D V I N D V I m i n N D V I m a x N D V I m i n
L S T * = L S T L S T m i n L S T m a x L S T m i n
A * = A A m i n A m a x A m i n
where a i j k is the regression coefficient with dimensions i , j , and k ; N D V I * , L S T * and A * are the normalized versions; N D V I , L S T and A are the original MODIS data, and the subscripts m i n and m a x stand for minimum and maximum.
The method was performed on a monthly basis. For each month the pixels with valid values of SM, NDVI, LST, and A were selected for downscaling. When applying the downscaling method, first the N D V I * , L S T * and A * were averaged spatially to 25 km resolution, and then all the data with 25 km resolution were inputted into Equation (2) to determine the regression coefficients, and finally, 1 km N D V I * , L S T * , A * and regression coefficients were used to estimate soil moisture at 1 km resolution based on Equation (2).

3.2. Trend Analysis

To analyze the trends in seasonal soil moisture, a linear regression relationship between soil moisture and time is established to examine the pixel-wise linear trends. The regression equation can be expressed as follows:
S = n i = 1 n i X i i = 1 n i i = 1 n X i n i = 1 n i 2 ( i = 1 n i ) 2
where S [-/year] is the trend of seasonal soil moisture, n is the number of years, and X i is the seasonal soil moisture at year i . A positive value of S means an increasing trend, while a negative value means a decreasing trend. The significance of these changes was determined using T-test at a significant level of 0.05.

3.3. Partial Correlation Analysis

Partial correlation analysis is normally used to study the degree of association between two variables after eliminating the effects of other factors [47]. The partial correlation coefficient R x y , z between factors x and y without the effect from z is calculated as:
R x y , z = R x y R x z R y z ( 1 R x z 2 ) + ( 1 R y z 2 )
where R x y , R x z and R y z represent the correlation coefficients between x and y , x and z , and y and z . We verified the statistical significance of the partial correlation coefficient with the T-test at a significance level of 0.05. In this study, the partial correlation analysis is applied between soil moisture and precipitation, air temperature, respectively.

3.4. Multiple Linear Regression Models

To analyze the sensitivity of soil moisture to temperature and precipitation, the multi regression model is applied to each land cover type [48]. The regression formula can be written as follows:
S M i = a 0 + a 1 · P i + a 2 · T i + a 3 S M i 1
where S M i is the spatially averaged soil moisture for a given land cover type in month i ; P i , T i and S M i 1 represent precipitation, temperature in month i and the soil moisture in month i 1 , respectively; a 0 is a constant term; and a 1 , a 2 and a 3 are the corresponding regression coefficients, which can reflect the sensitivity of soil moisture to each factor by the sign and magnitude.
To make the variables of different dimensions comparable, all variables were normalized using the following formula before conducting the regression analysis:
X n = X X m i n X m a x X m i n
where X m i n and X m a x are the minimum and maximum values of variable X .

4. Results

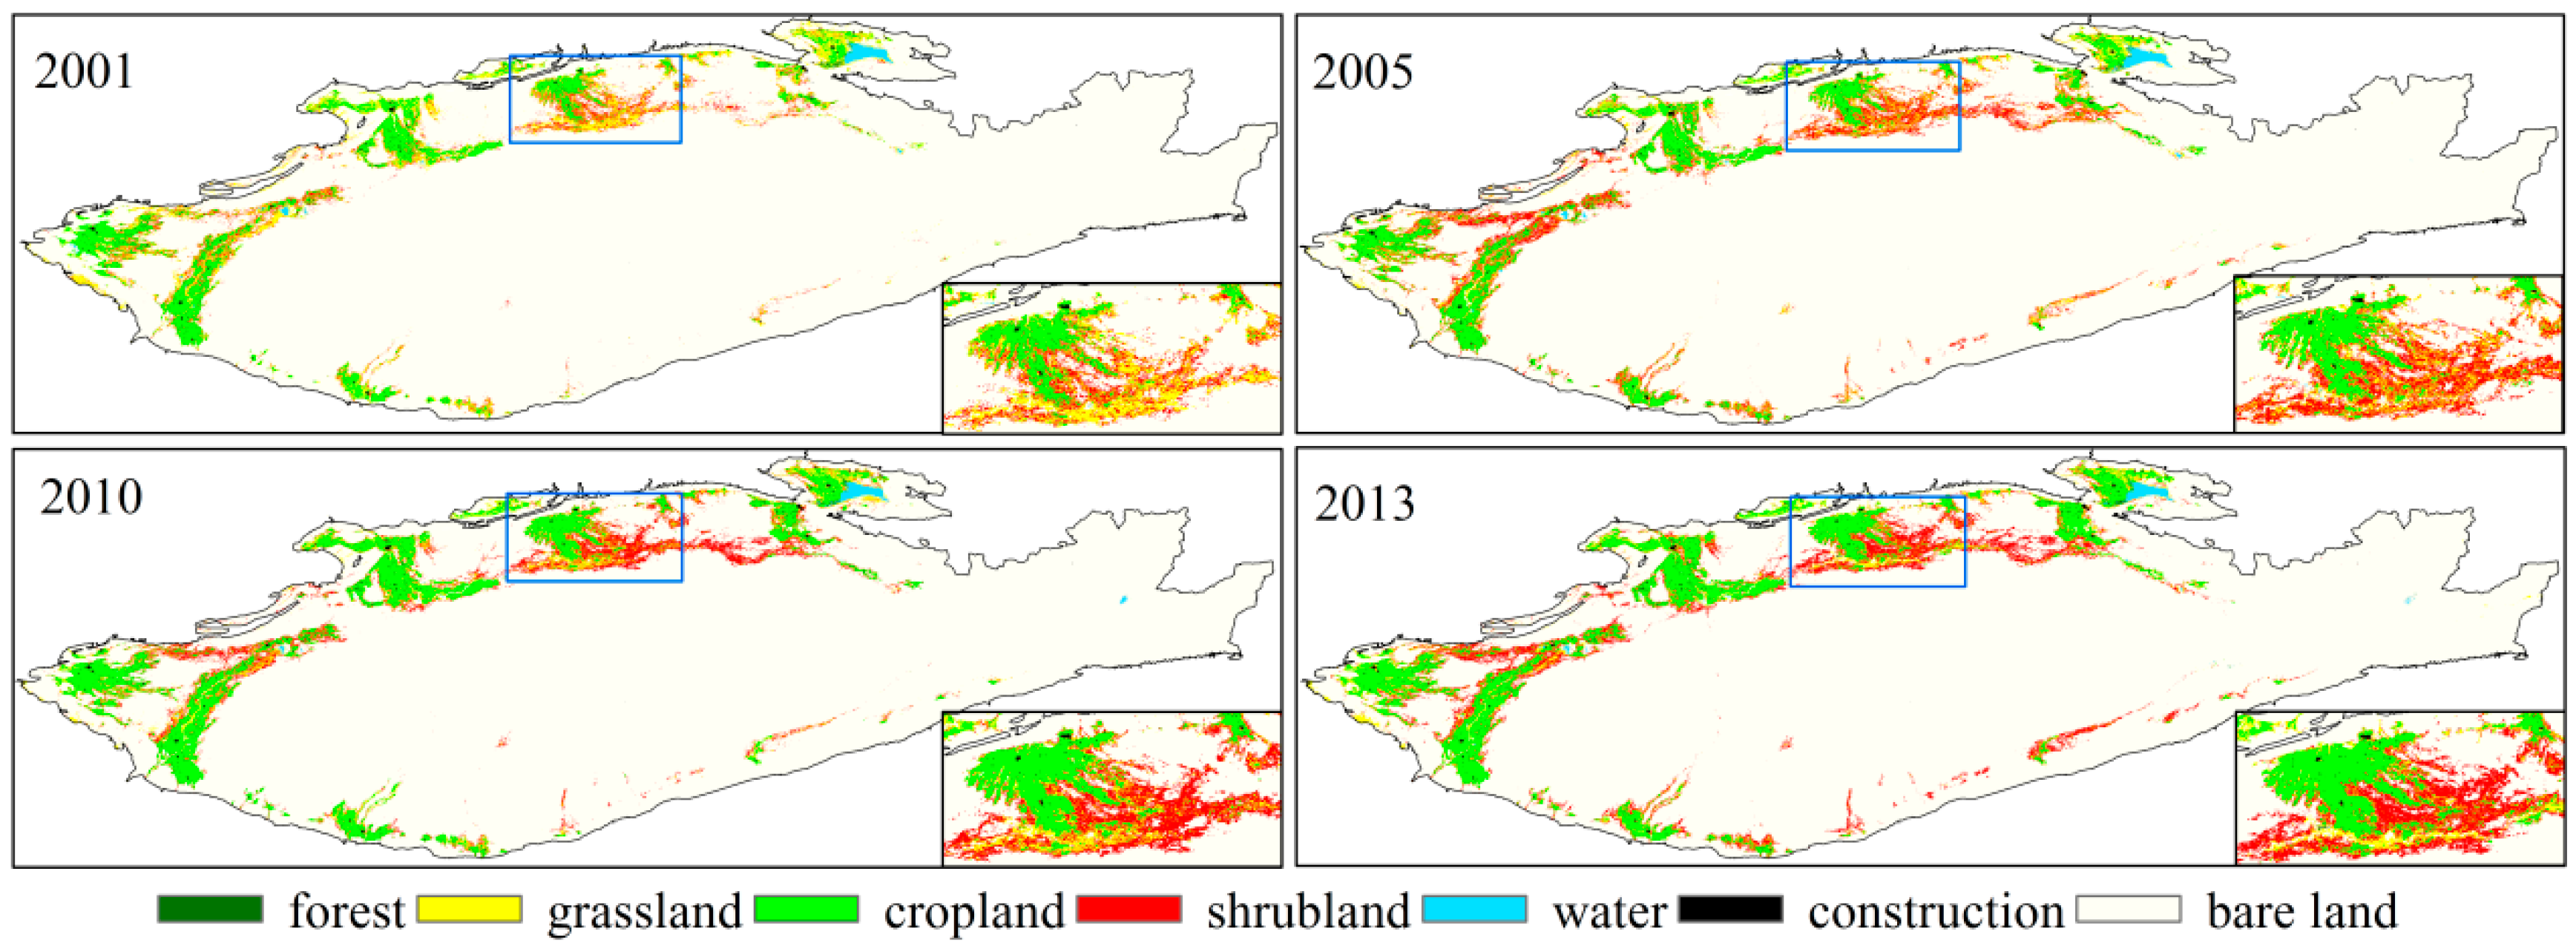
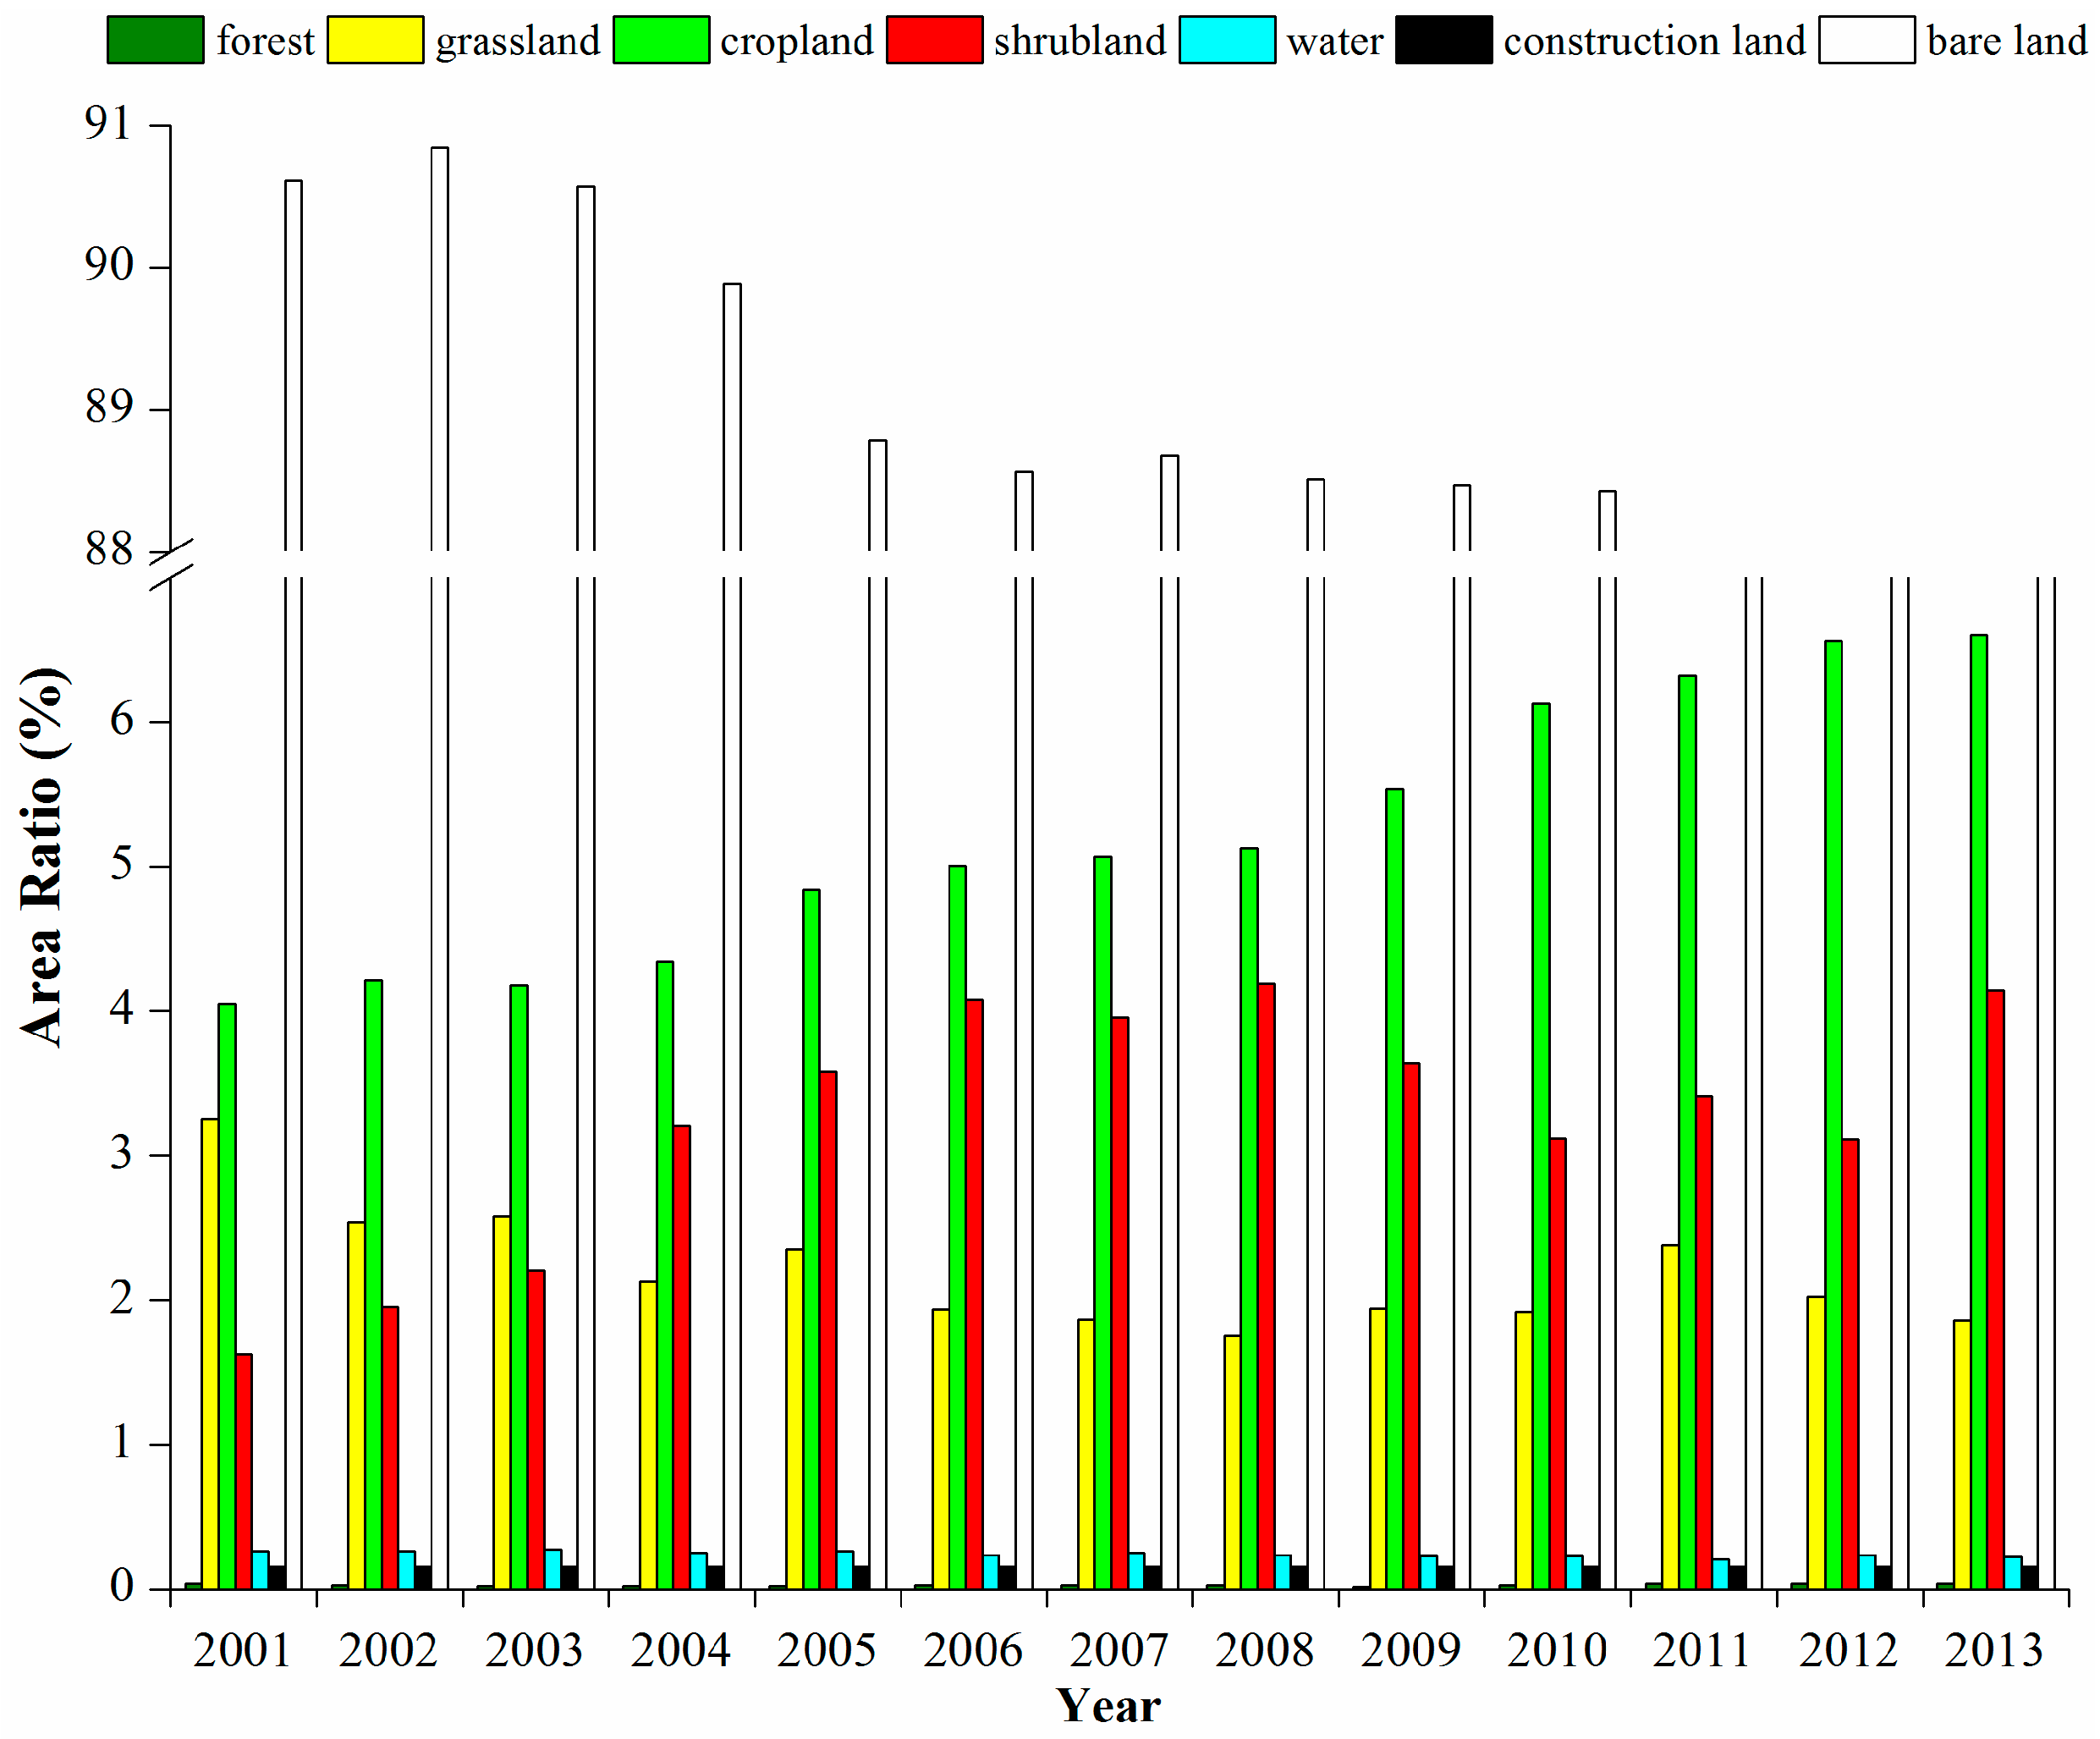
4.1. Land Cover Change in the Study Area

Figure 2 shows the spatial distributions of land cover in four selected years, and Figure 3 shows the variations of land cover types from 2001 to 2013. In the study area, bare land makes up about 90% of the area and dominates the spatial distribution. Forest, grassland, shrubland, and cropland have a mosaic distribution in the marginal area and cover approximately 10% of the study area. Water and construction only cover less than 0.5% of the study area. During the period 2001~2013, the area ratio of grassland and bare land decreased by 1.39% and 3.64%, respectively, while the area ratio of cropland and shrubland increased by 2.61% and 2.42%, respectively. This observation implies that some of the grassland and bare land were transformed into cropland and shrubland. Since the annual variation of land cover type is small, we used the land cover type of 2013 for the year 2014 and 2015 in this study. In addition, as the area of construction is small and had little effect on soil moisture, we only considered forest, grassland, shrubland, cropland, and bare land.

4.2. Spatial and Temporal Characteristics of Soil Moisture

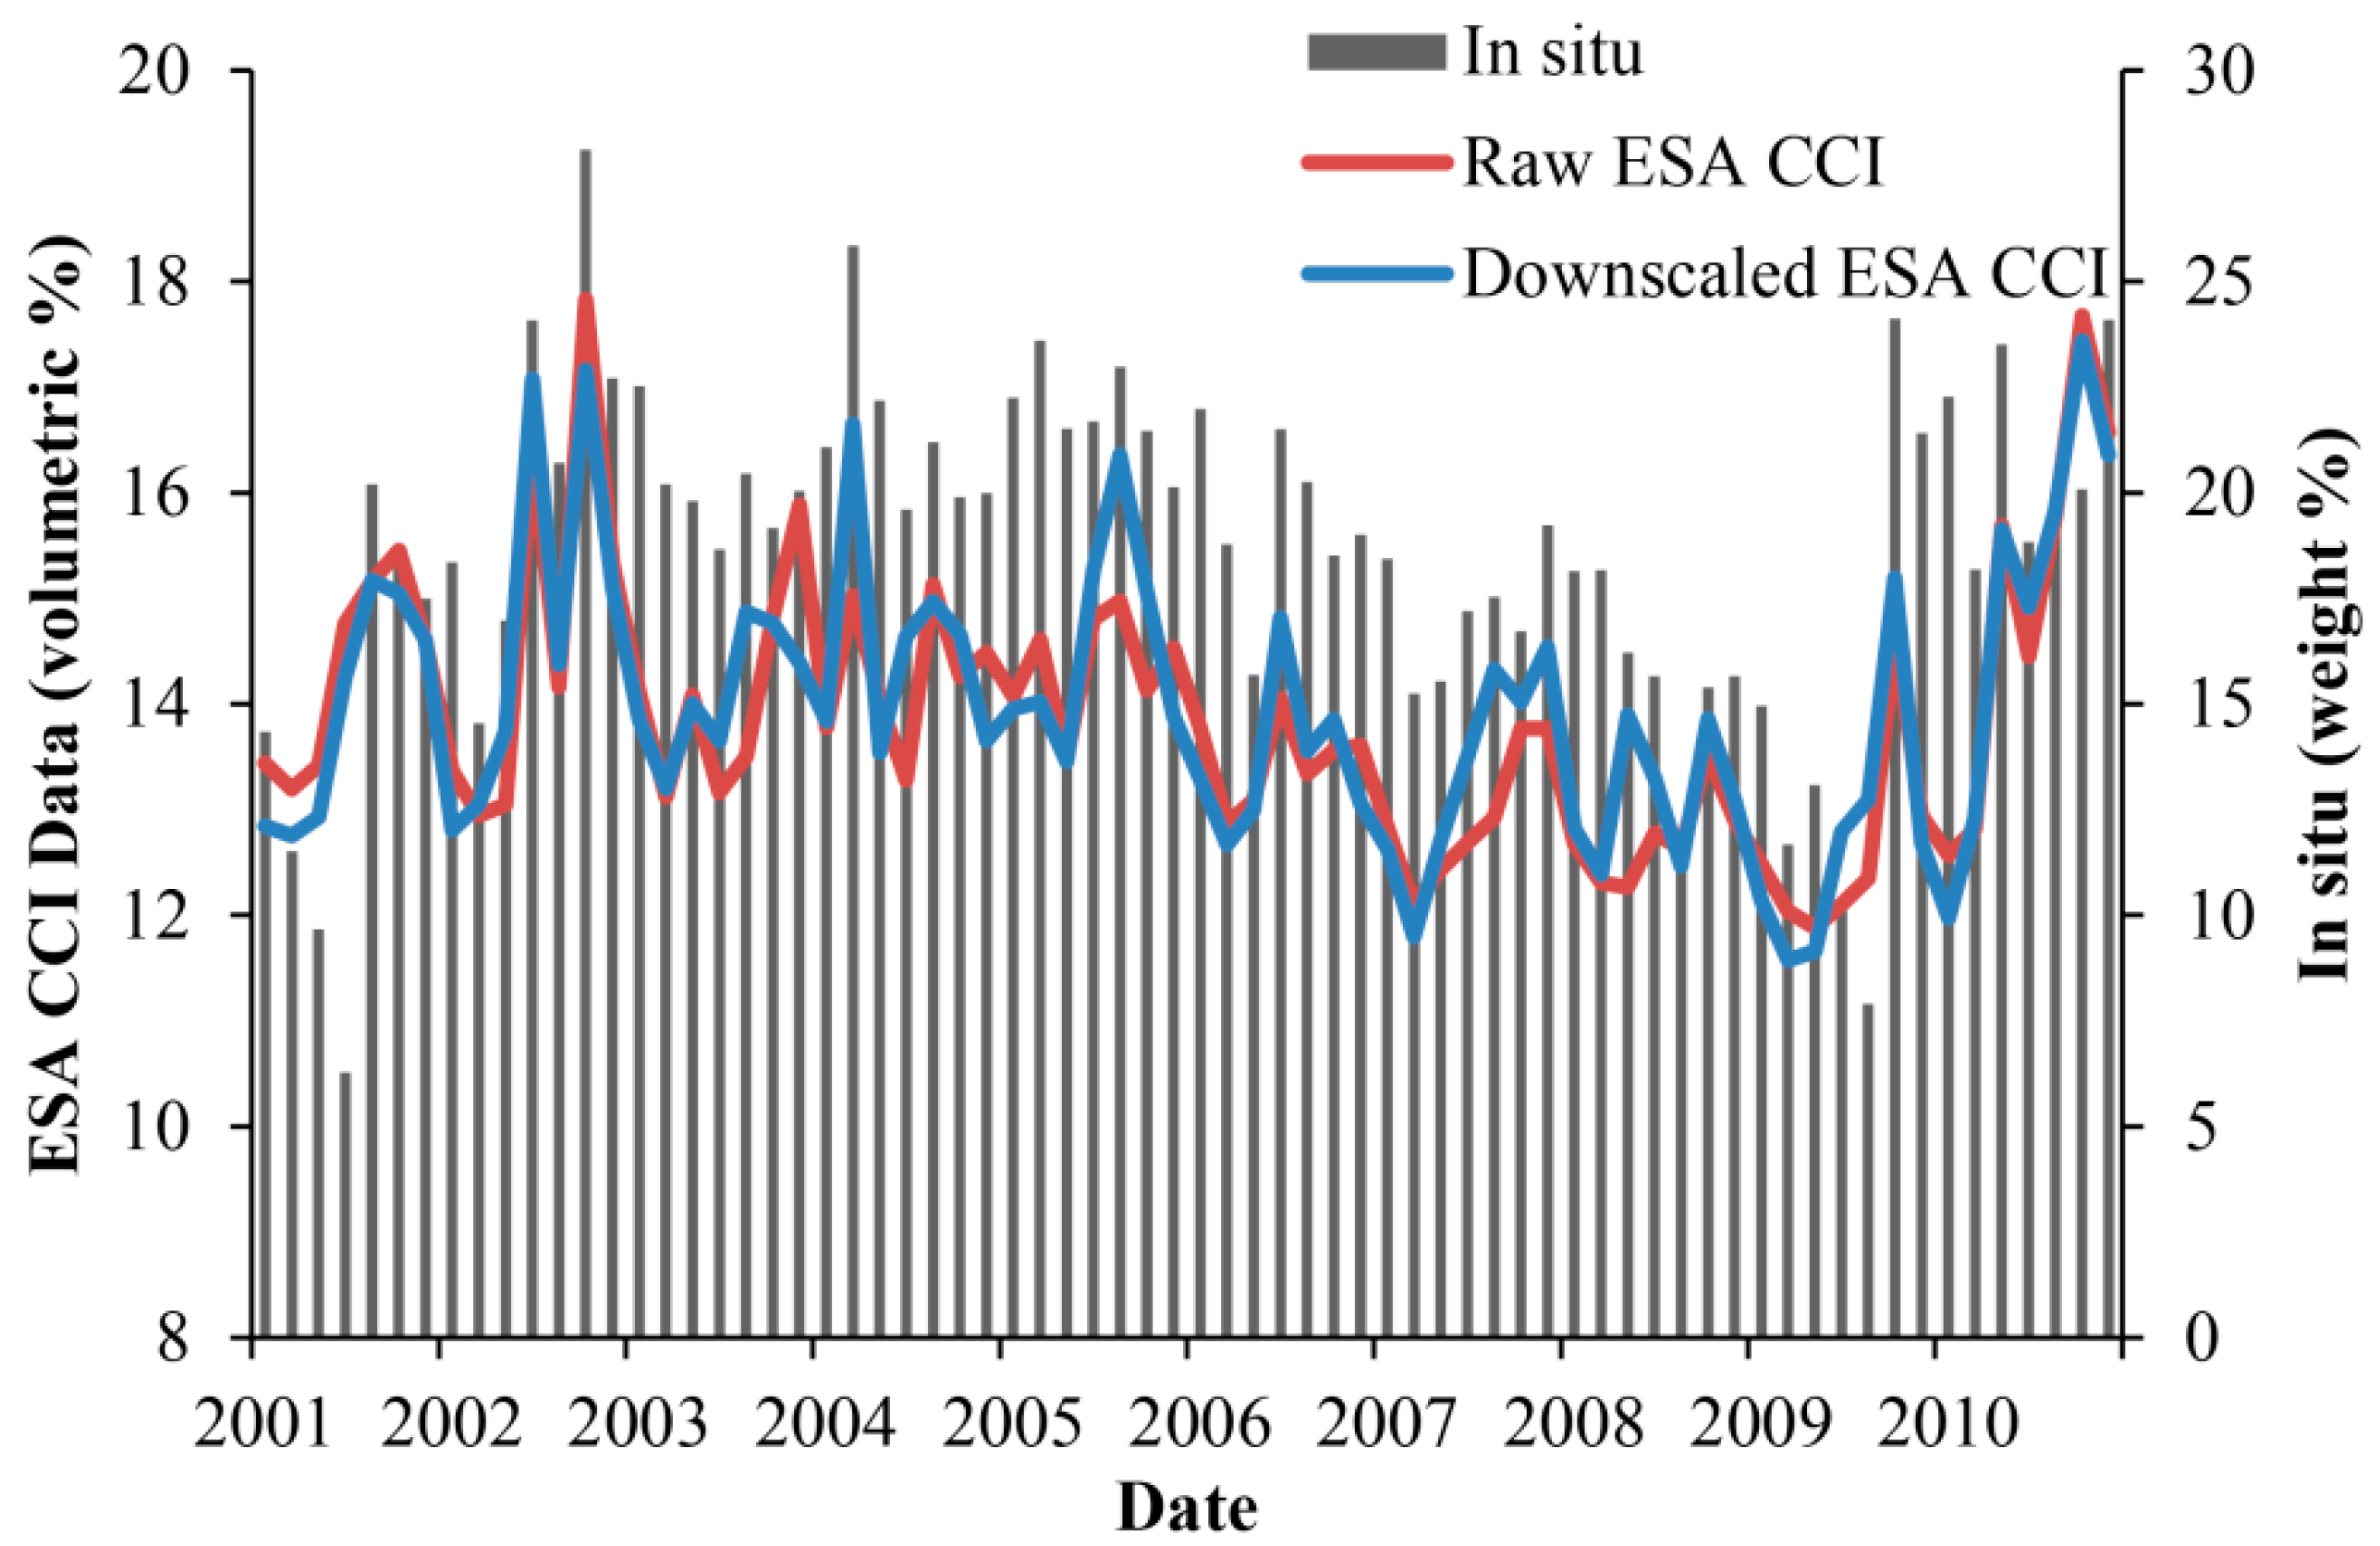
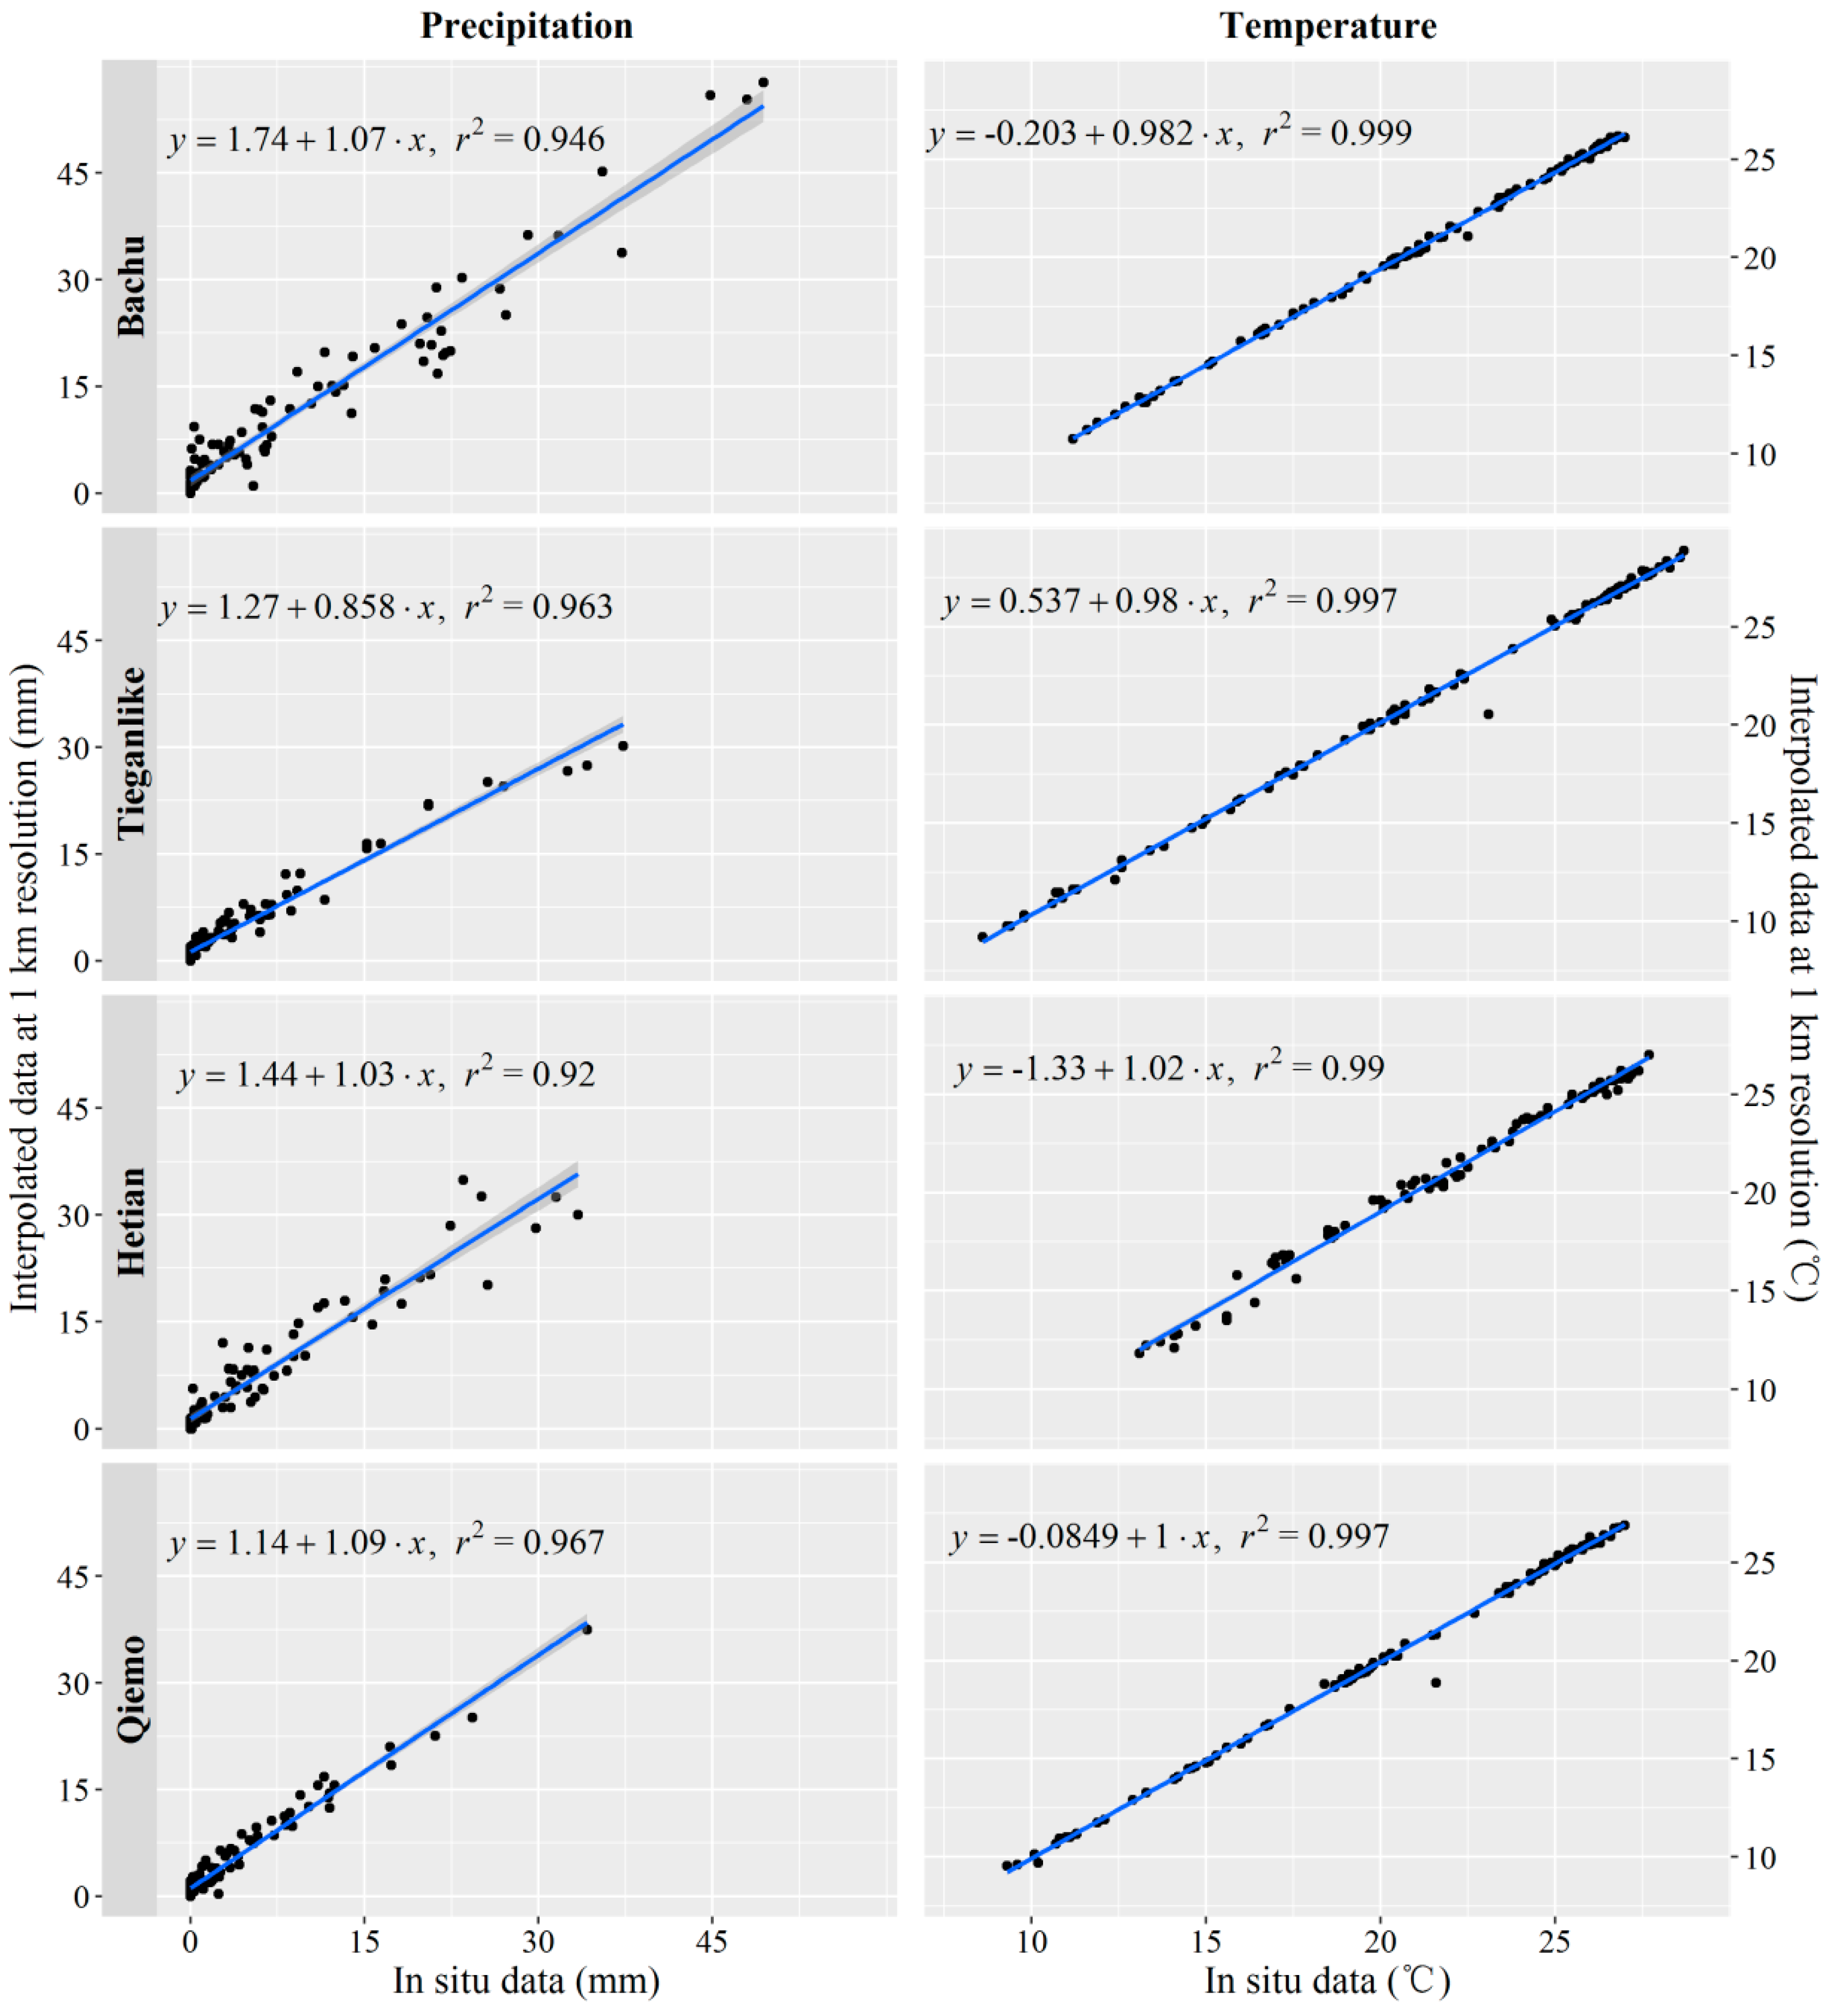
4.2.1. Validation of Data

The ESA CCI soil moisture data were downscaled from 25 km to 1 km based on the approach in Section 3.1, and then used to compare with in situ soil moisture data at Shache station. As in situ soil moisture data are in weight units, while the downscaled ESA CCI data are in volumetric units, we only compared their variations rather than magnitudes at a monthly scale. Figure 4 shows the monthly variations of the in situ, raw ESA CCI and downscaled ESA CCI soil moisture data from 2001 to 2010. Both the raw and downscaled ESA CCI soil moisture data can capture the main fluctuations of the in situ soil moisture. The correlation coefficient between monthly in situ and downscaled ESA CCI soil moisture is about 0.6, which is slightly higher than that between in situ and raw ESA CCI soil moisture (R = 0.58). In addition, the correlation coefficients between in situ and two sets of ESA CCI soil moisture for different seasons were calculated to further verify the accuracy of the downscaled soil moisture data. The correlation coefficients between in situ and raw ESA CCI soil moisture data are 0.64 for spring, 0.62 for summer, and 0.62 for autumn, while those between in situ and downscaled ESA CCI soil moisture data are 0.63 for spring, 0.76 for summer, and 0.60 for autumn. Compared with the raw ESA CCI data, the downscaled ESA CCI soil moisture data have a better performance in summer. All results indicate that the downscaled soil moisture data show a reasonable accuracy in the study area.
The meteorological data used in this study were re-sampled from 50 km to 1 km using the bilinear interpolation method. Figure 5 shows the comparisons between the interpolated meteorological data and the in situ observation data from four weather stations (i.e., Bachu, Tieganlike, Hetain and Qiemo). For precipitation, the R2 values are 0.946, 0.963, 0.92 and 0.967, respectively. For temperature, the R2 values are all more than 0.99 at these four stations. In terms of RMSE, the RMSE values for the interpolated precipitation are 3.89 mm, 1.85 mm, 3.23 mm and 1.94 mm, respectively, at these four weather stations. For temperature, the RMSE values are 0.61 °C, 0.34 °C, 0.95 °C, and 0.31 °C, respectively. The results indicate a good agreement between the in situ and the interpolated meteorological data.

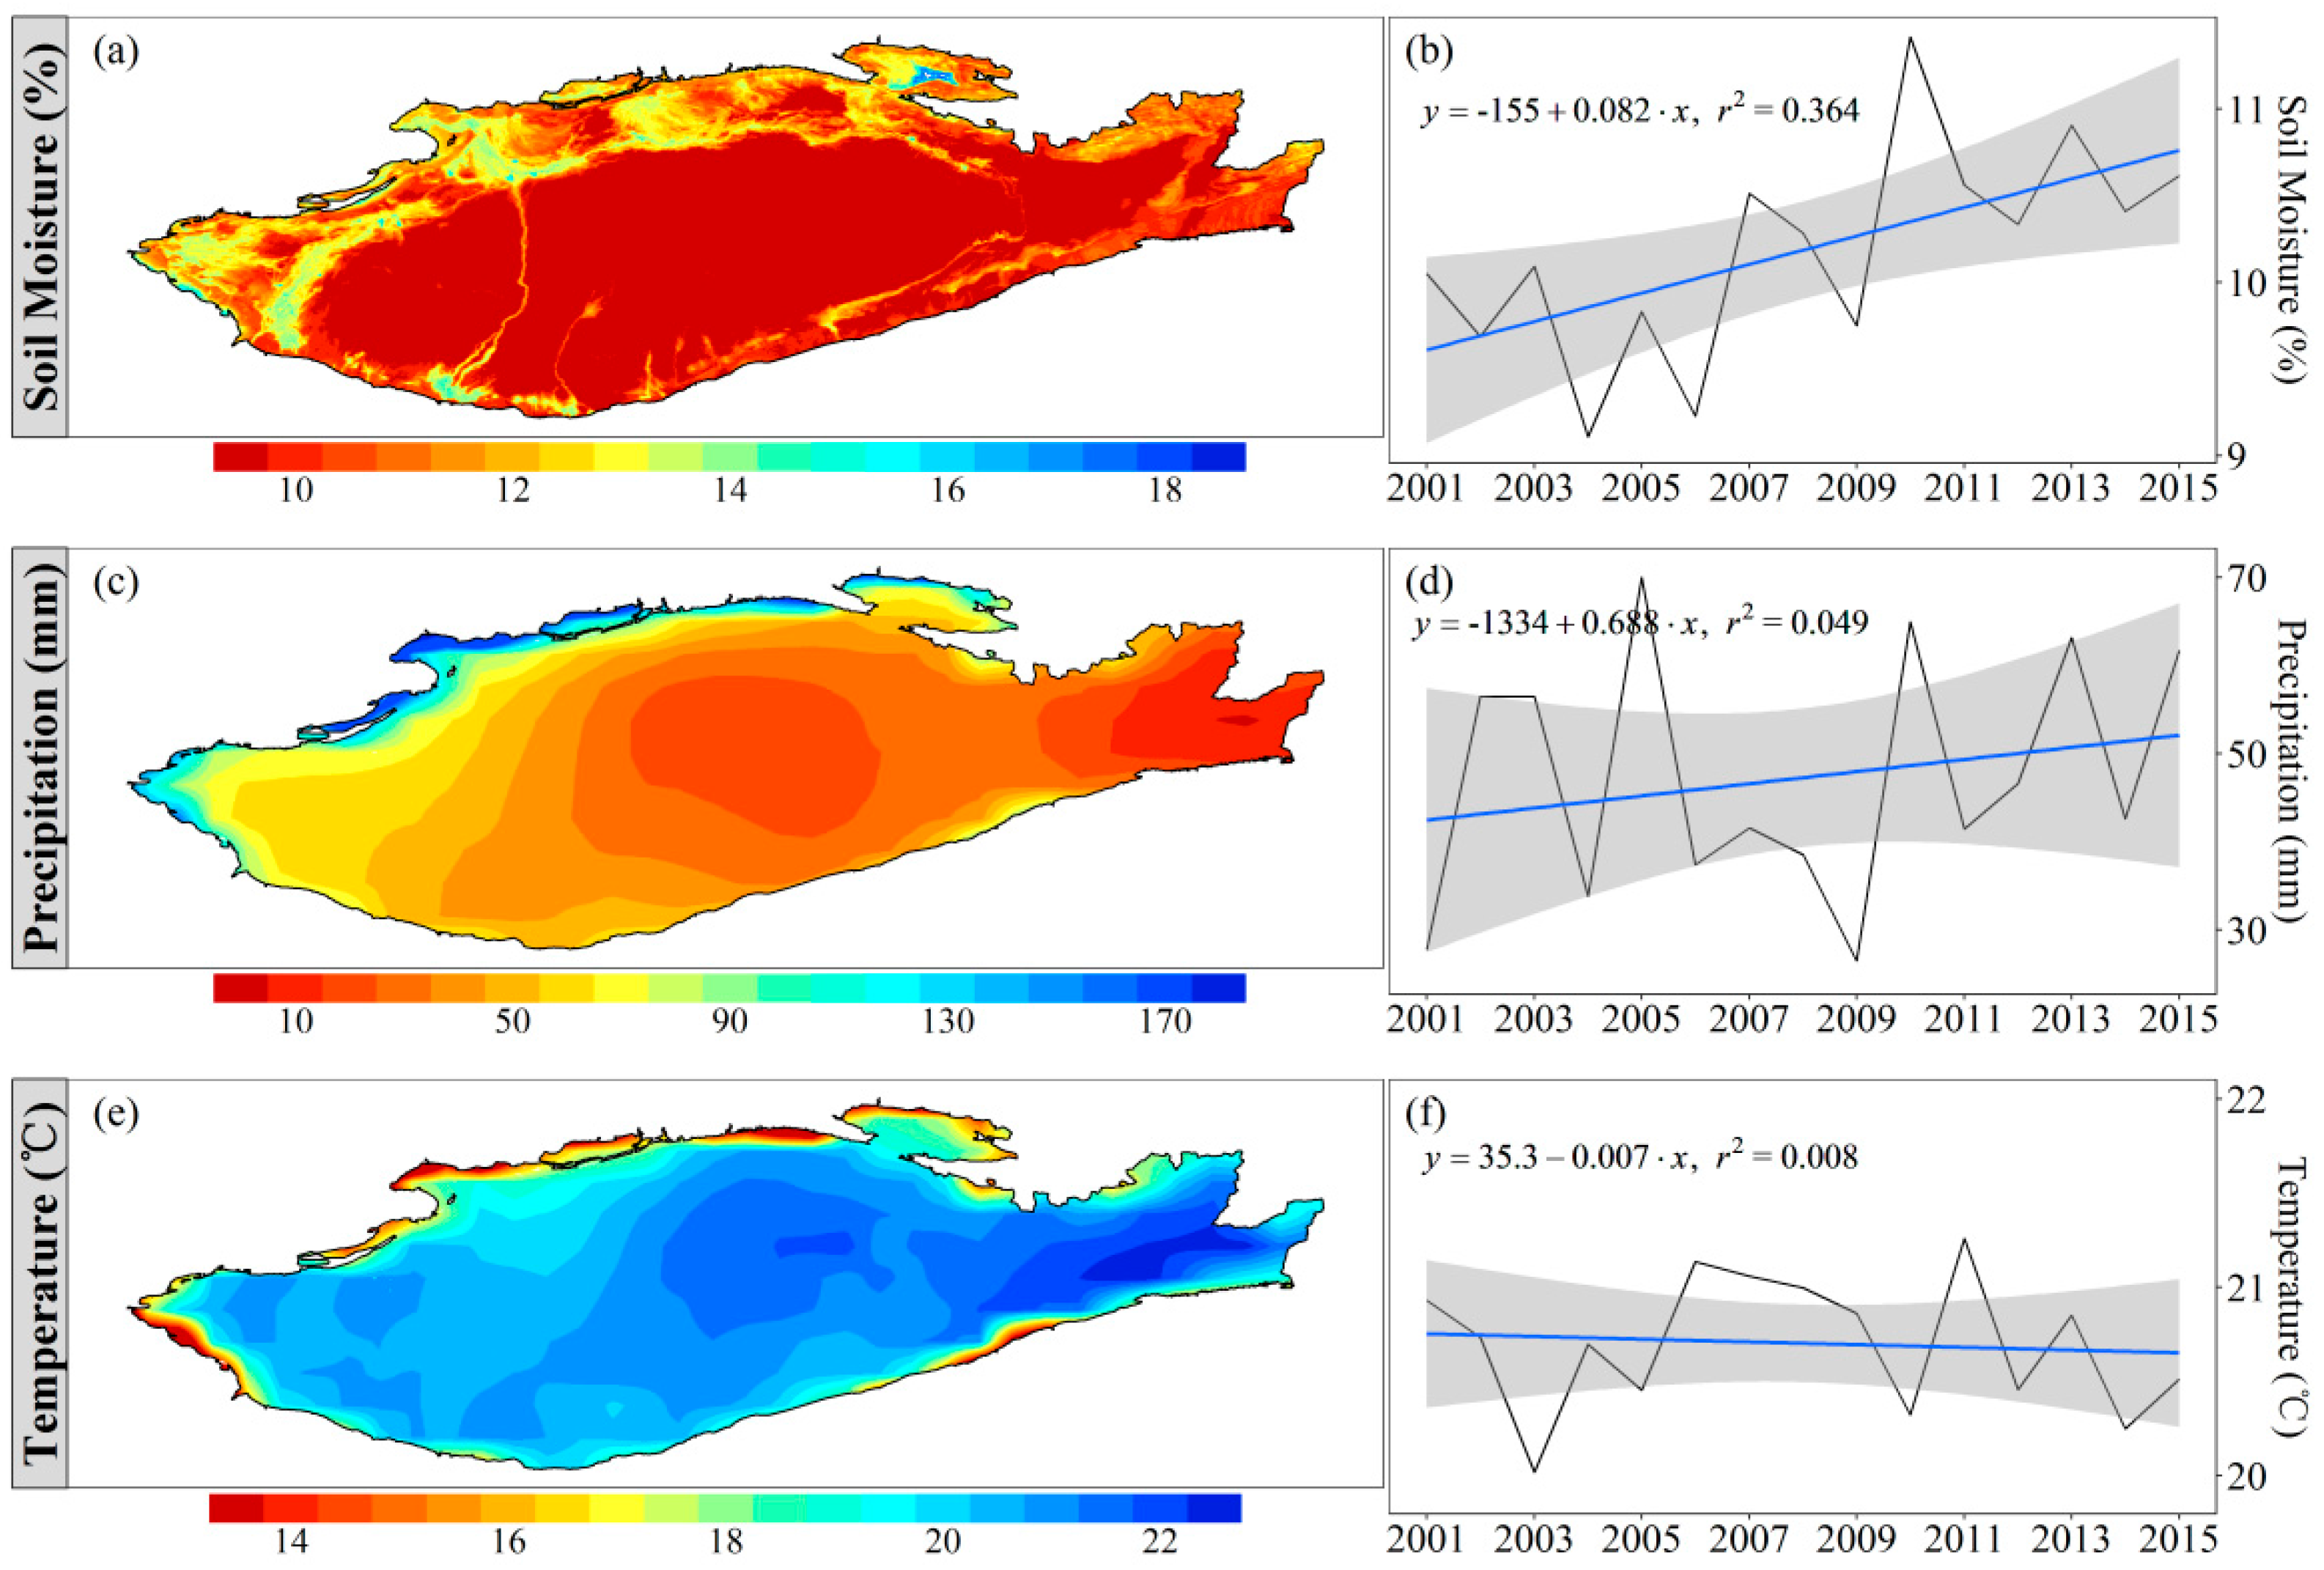
4.2.2. Spatial Patterns and Dynamics of Soil Moisture and Climate Factors

The spatial distribution of average soil moisture in the warm season from 2001 to 2015 is shown in Figure 6a. Obviously, high soil moisture concentrates in the northern part, while low soil moisture is observed in the southern part of the study area, which follows the distributions of the oasis and desert. In addition, the soil moisture is relatively high near rivers and varies in different river sections. Soil moisture decreases from west to east along the Tarim River, with the minimum occurring in the downstream, resembling the river flow direction. The variation of the spatial average soil moisture in the warm season is shown in Figure 6b, where the soil moisture posed a slightly increasing trend during 2001~2015, with a slope 0.082%/year. The T-test shows that soil moisture variation is significant at a level of 0.05.
Figure 6c–f describes the spatial patterns and temporal variation of precipitation and temperature in the study area. Spatially, precipitation exhibits an increasing pattern from the center to the periphery, with more than 200 mm at the boundary and less than 50 mm in the center; temperature varies between 8 °C (marginal areas) and 23 °C (west and center of the study area) and basically follows altitude variations. Low values of temperature are observed in the marginal areas which are near the mountains with higher altitude, while high temperatures are found in the areas with low altitude. In addition, the changes in precipitation and temperature were not significant during 2001~2015.

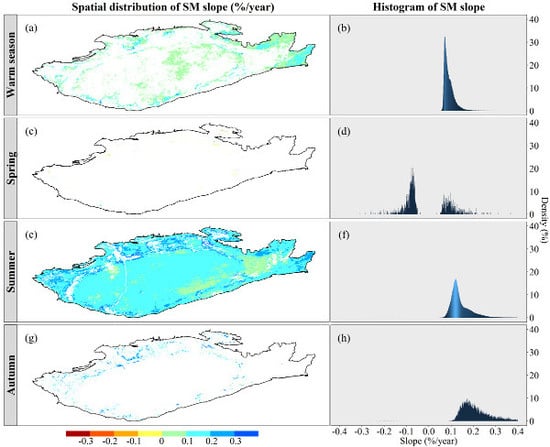
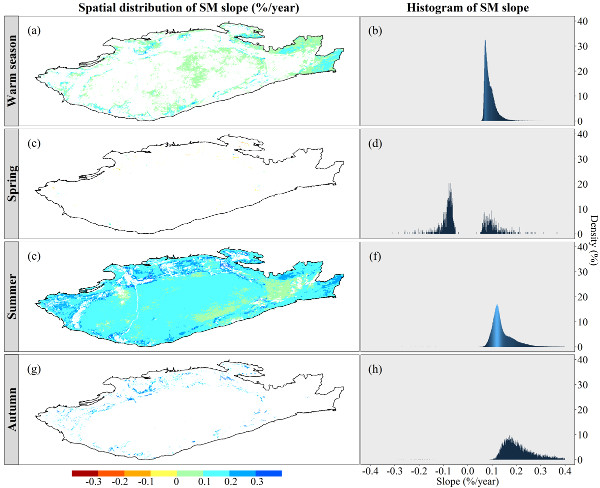
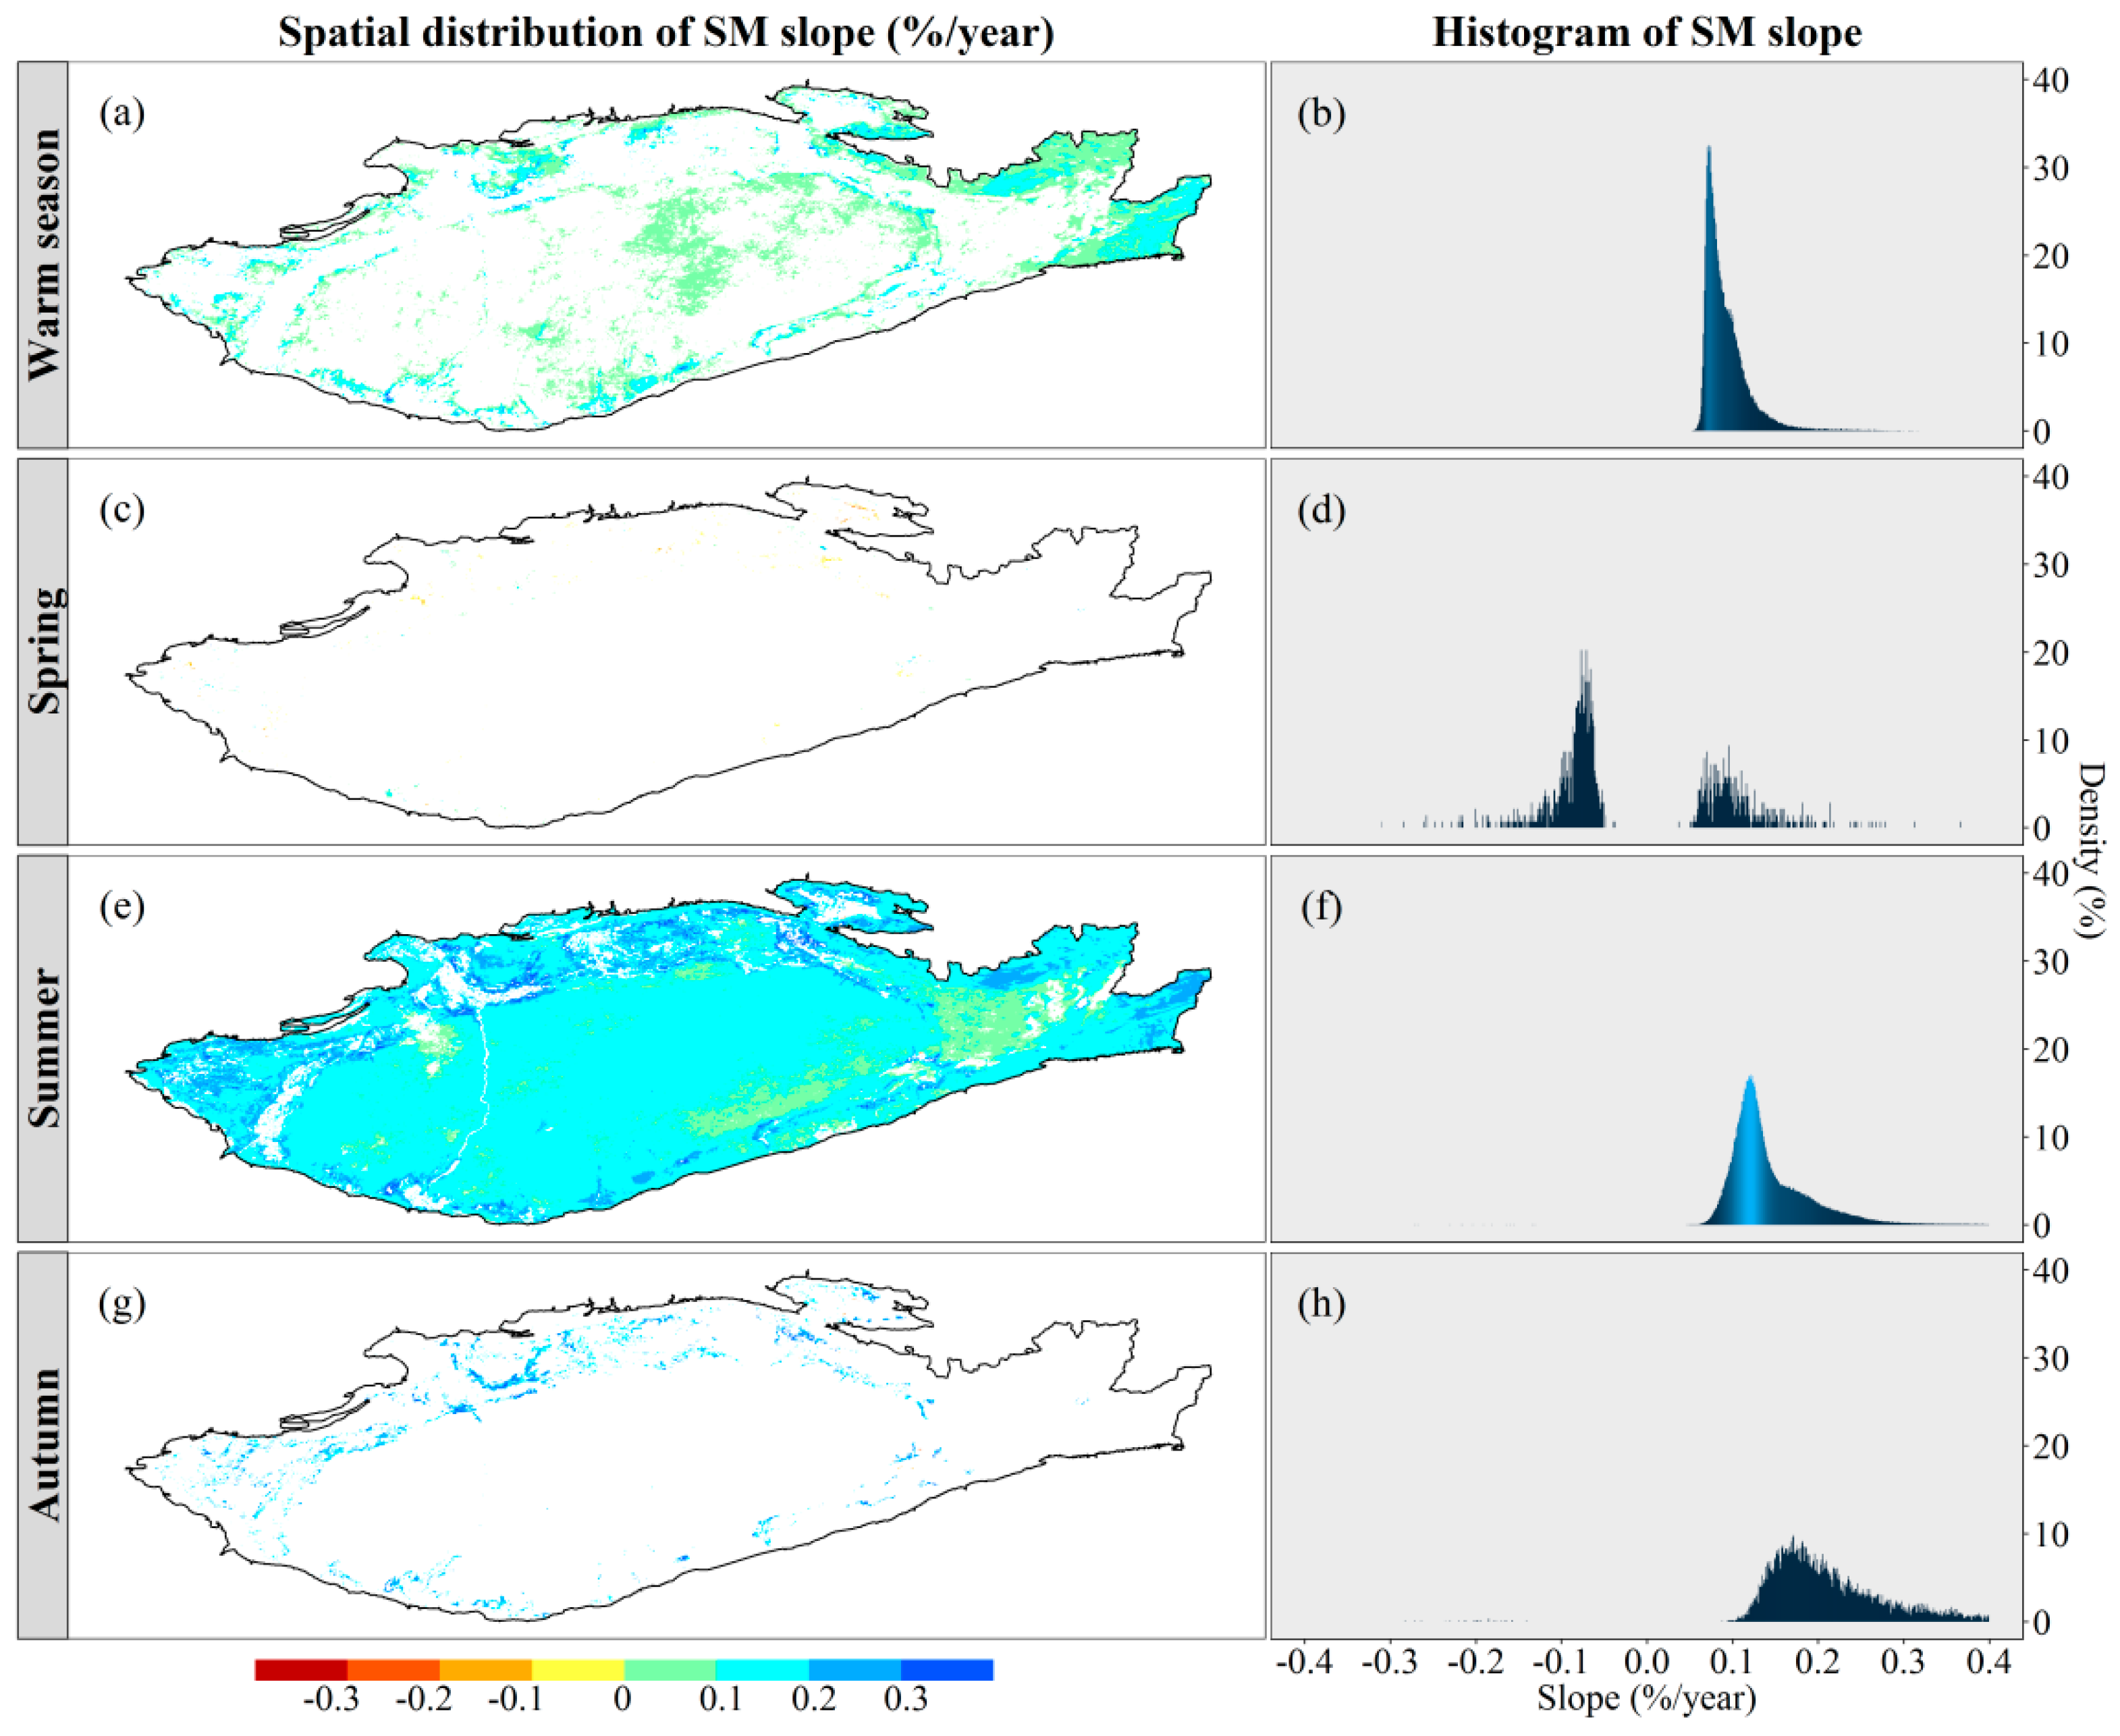
4.2.3. Trends in Seasonal Soil Moisture

Figure 7 shows the spatial distributions and histograms of mean seasonal soil moisture changes during 2001~2015. For the warm season (Figure 7a,b), about 23% of the area exhibited significant changes, of which 99.9% showed an increasing trend with rates mainly concentrated in 0~0.2%/year.
In spring (Figure 7c,d), the spatial mean soil moisture decreased at a rate of −0.011%/year during 2001~2015. Soil moisture showed a significant change in about 0.29% of the area. Of these, soil moisture increased by 0.044~0.338%/year in about 37% of the area and decreased by −0.287~−0.038%/year in about 63% of the area.
In summer (Figure 7e,f), an increase in spatial mean soil moisture by 0.138% a year occurred from 2001. About 90% of the study area showed significant change, of which 99.9% showed increasing trends of 0.065~0.4%/year
In autumn (Figure 7g,h), spatial mean soil moisture increased by 0.069% a year. The area with significant change is small, about 2.7% of the study area, and mainly distributed in the boundary area. Of these, pixels with increasing trend of 0.1~0.4%/year accounted for 99.7%.
In general, the increasing trend of soil moisture is predominant in the study area, and summer is the most important season for the regional soil moisture change.

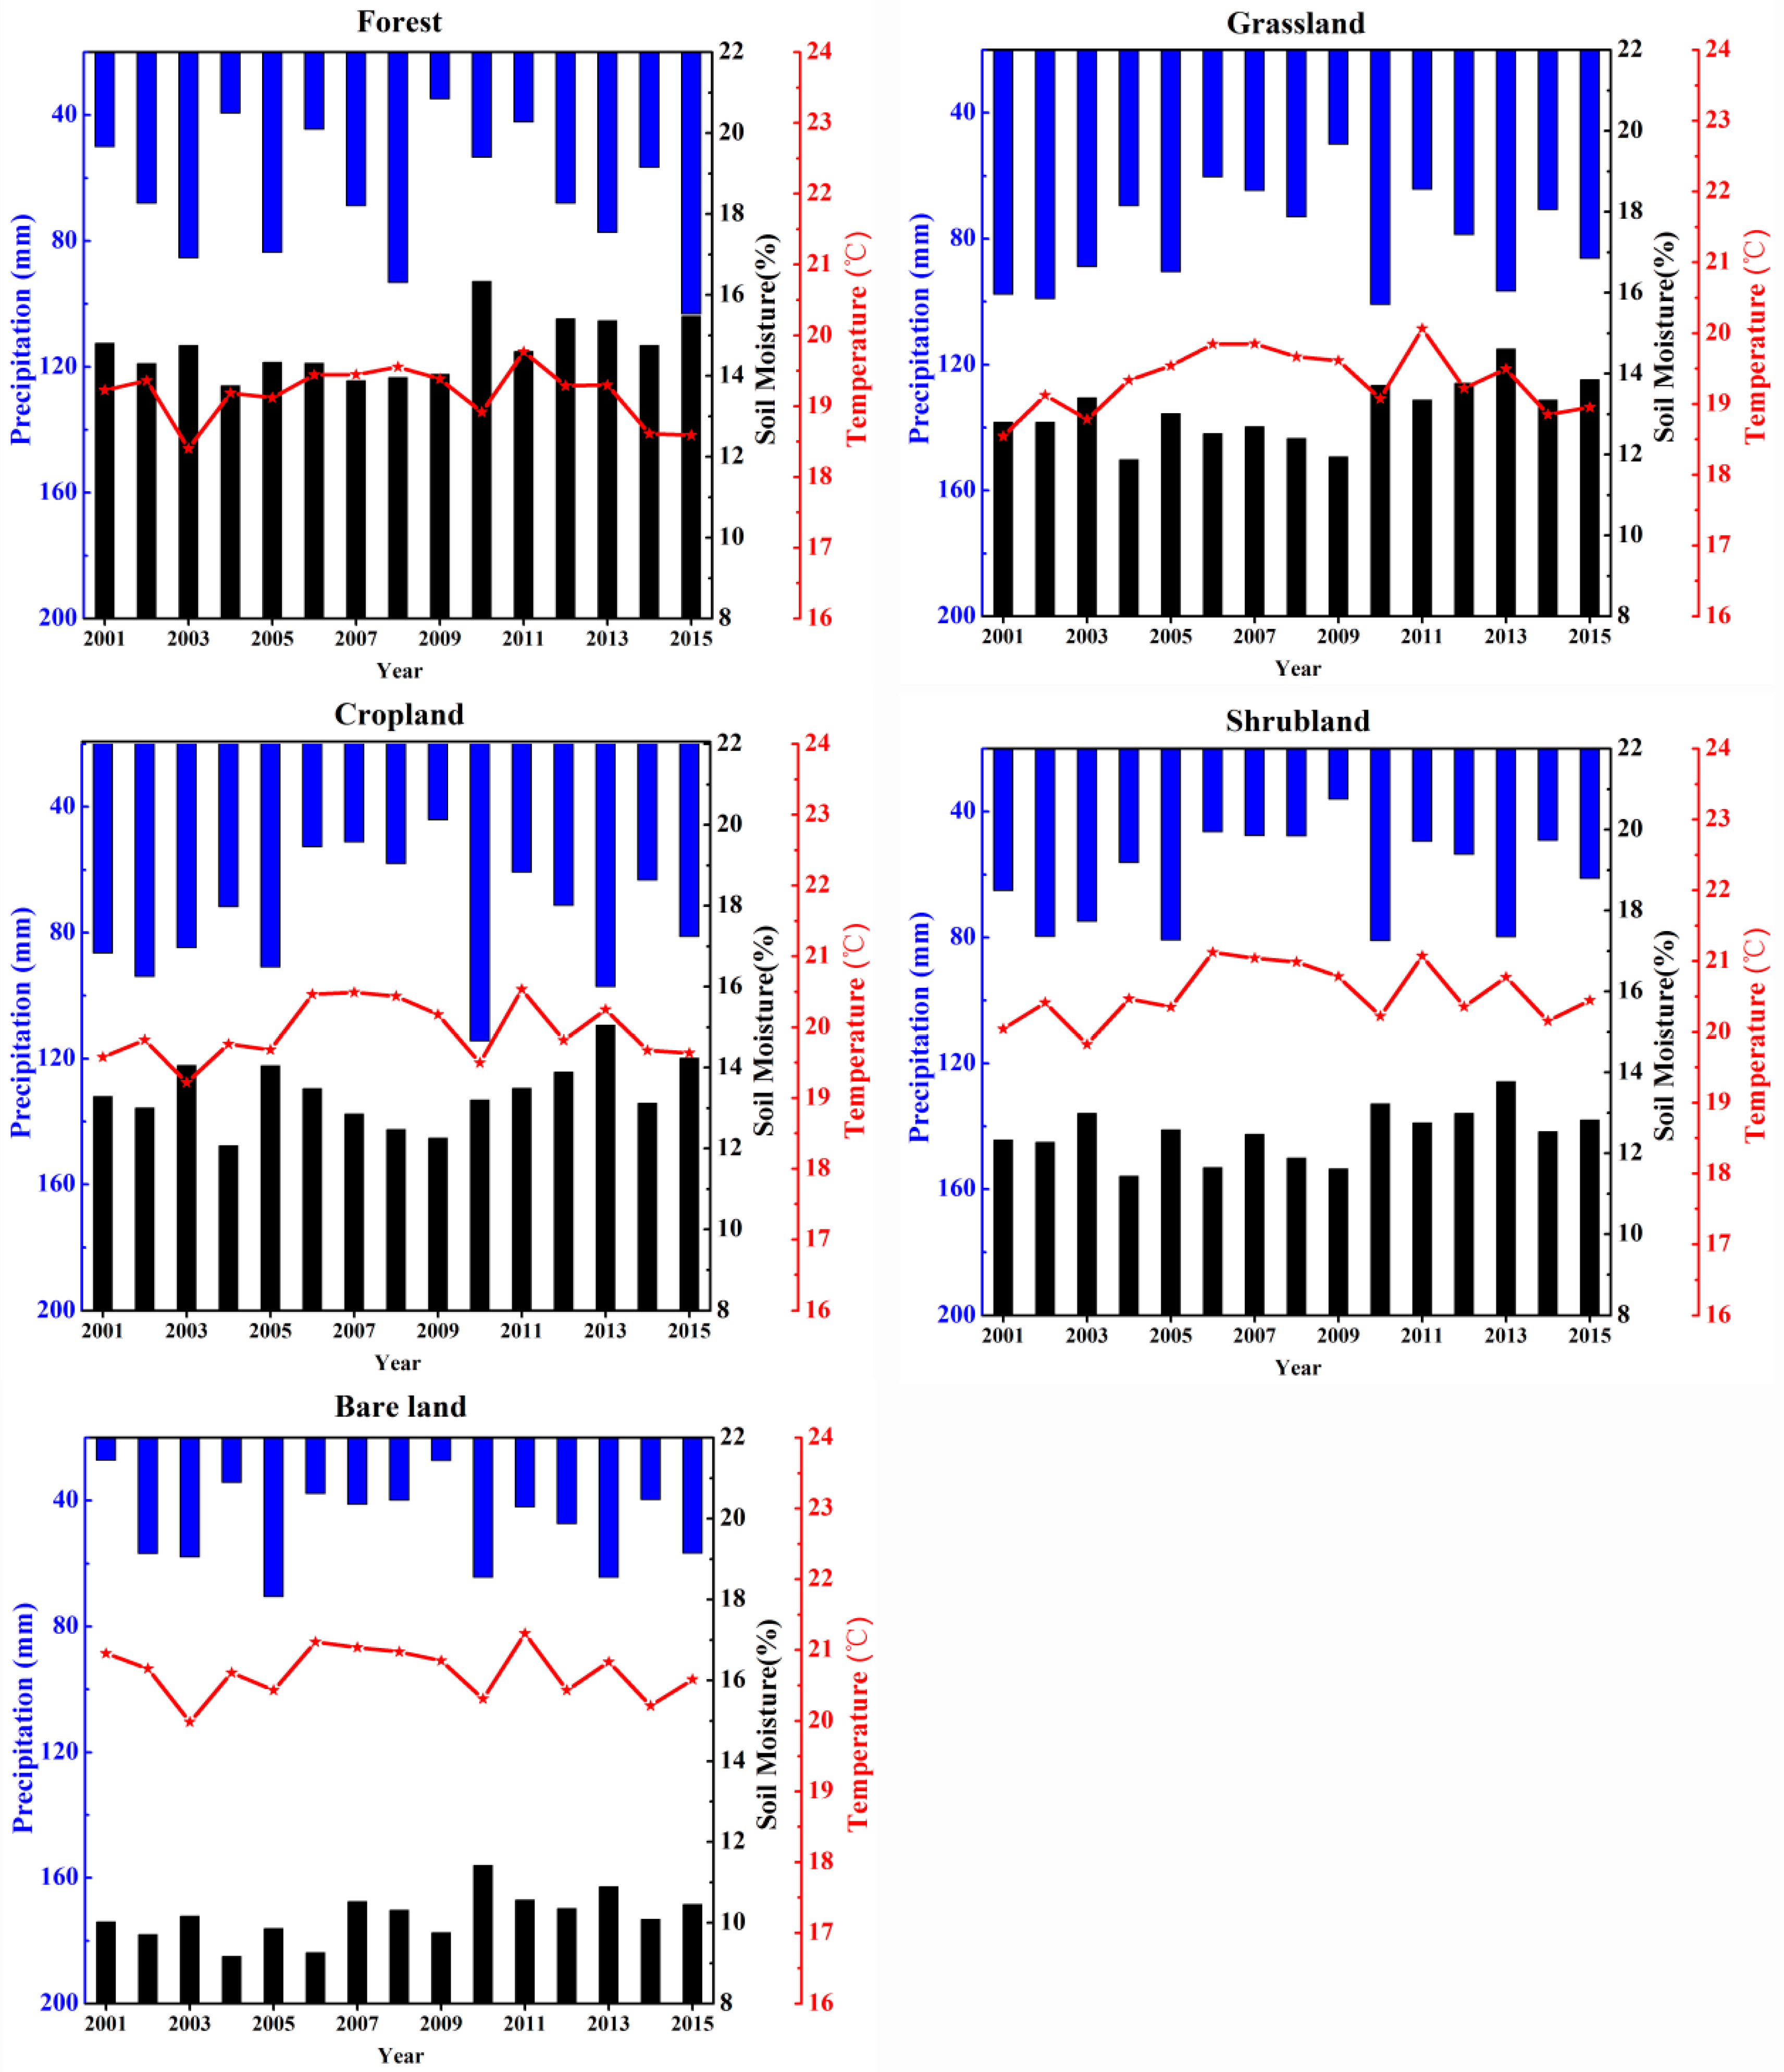
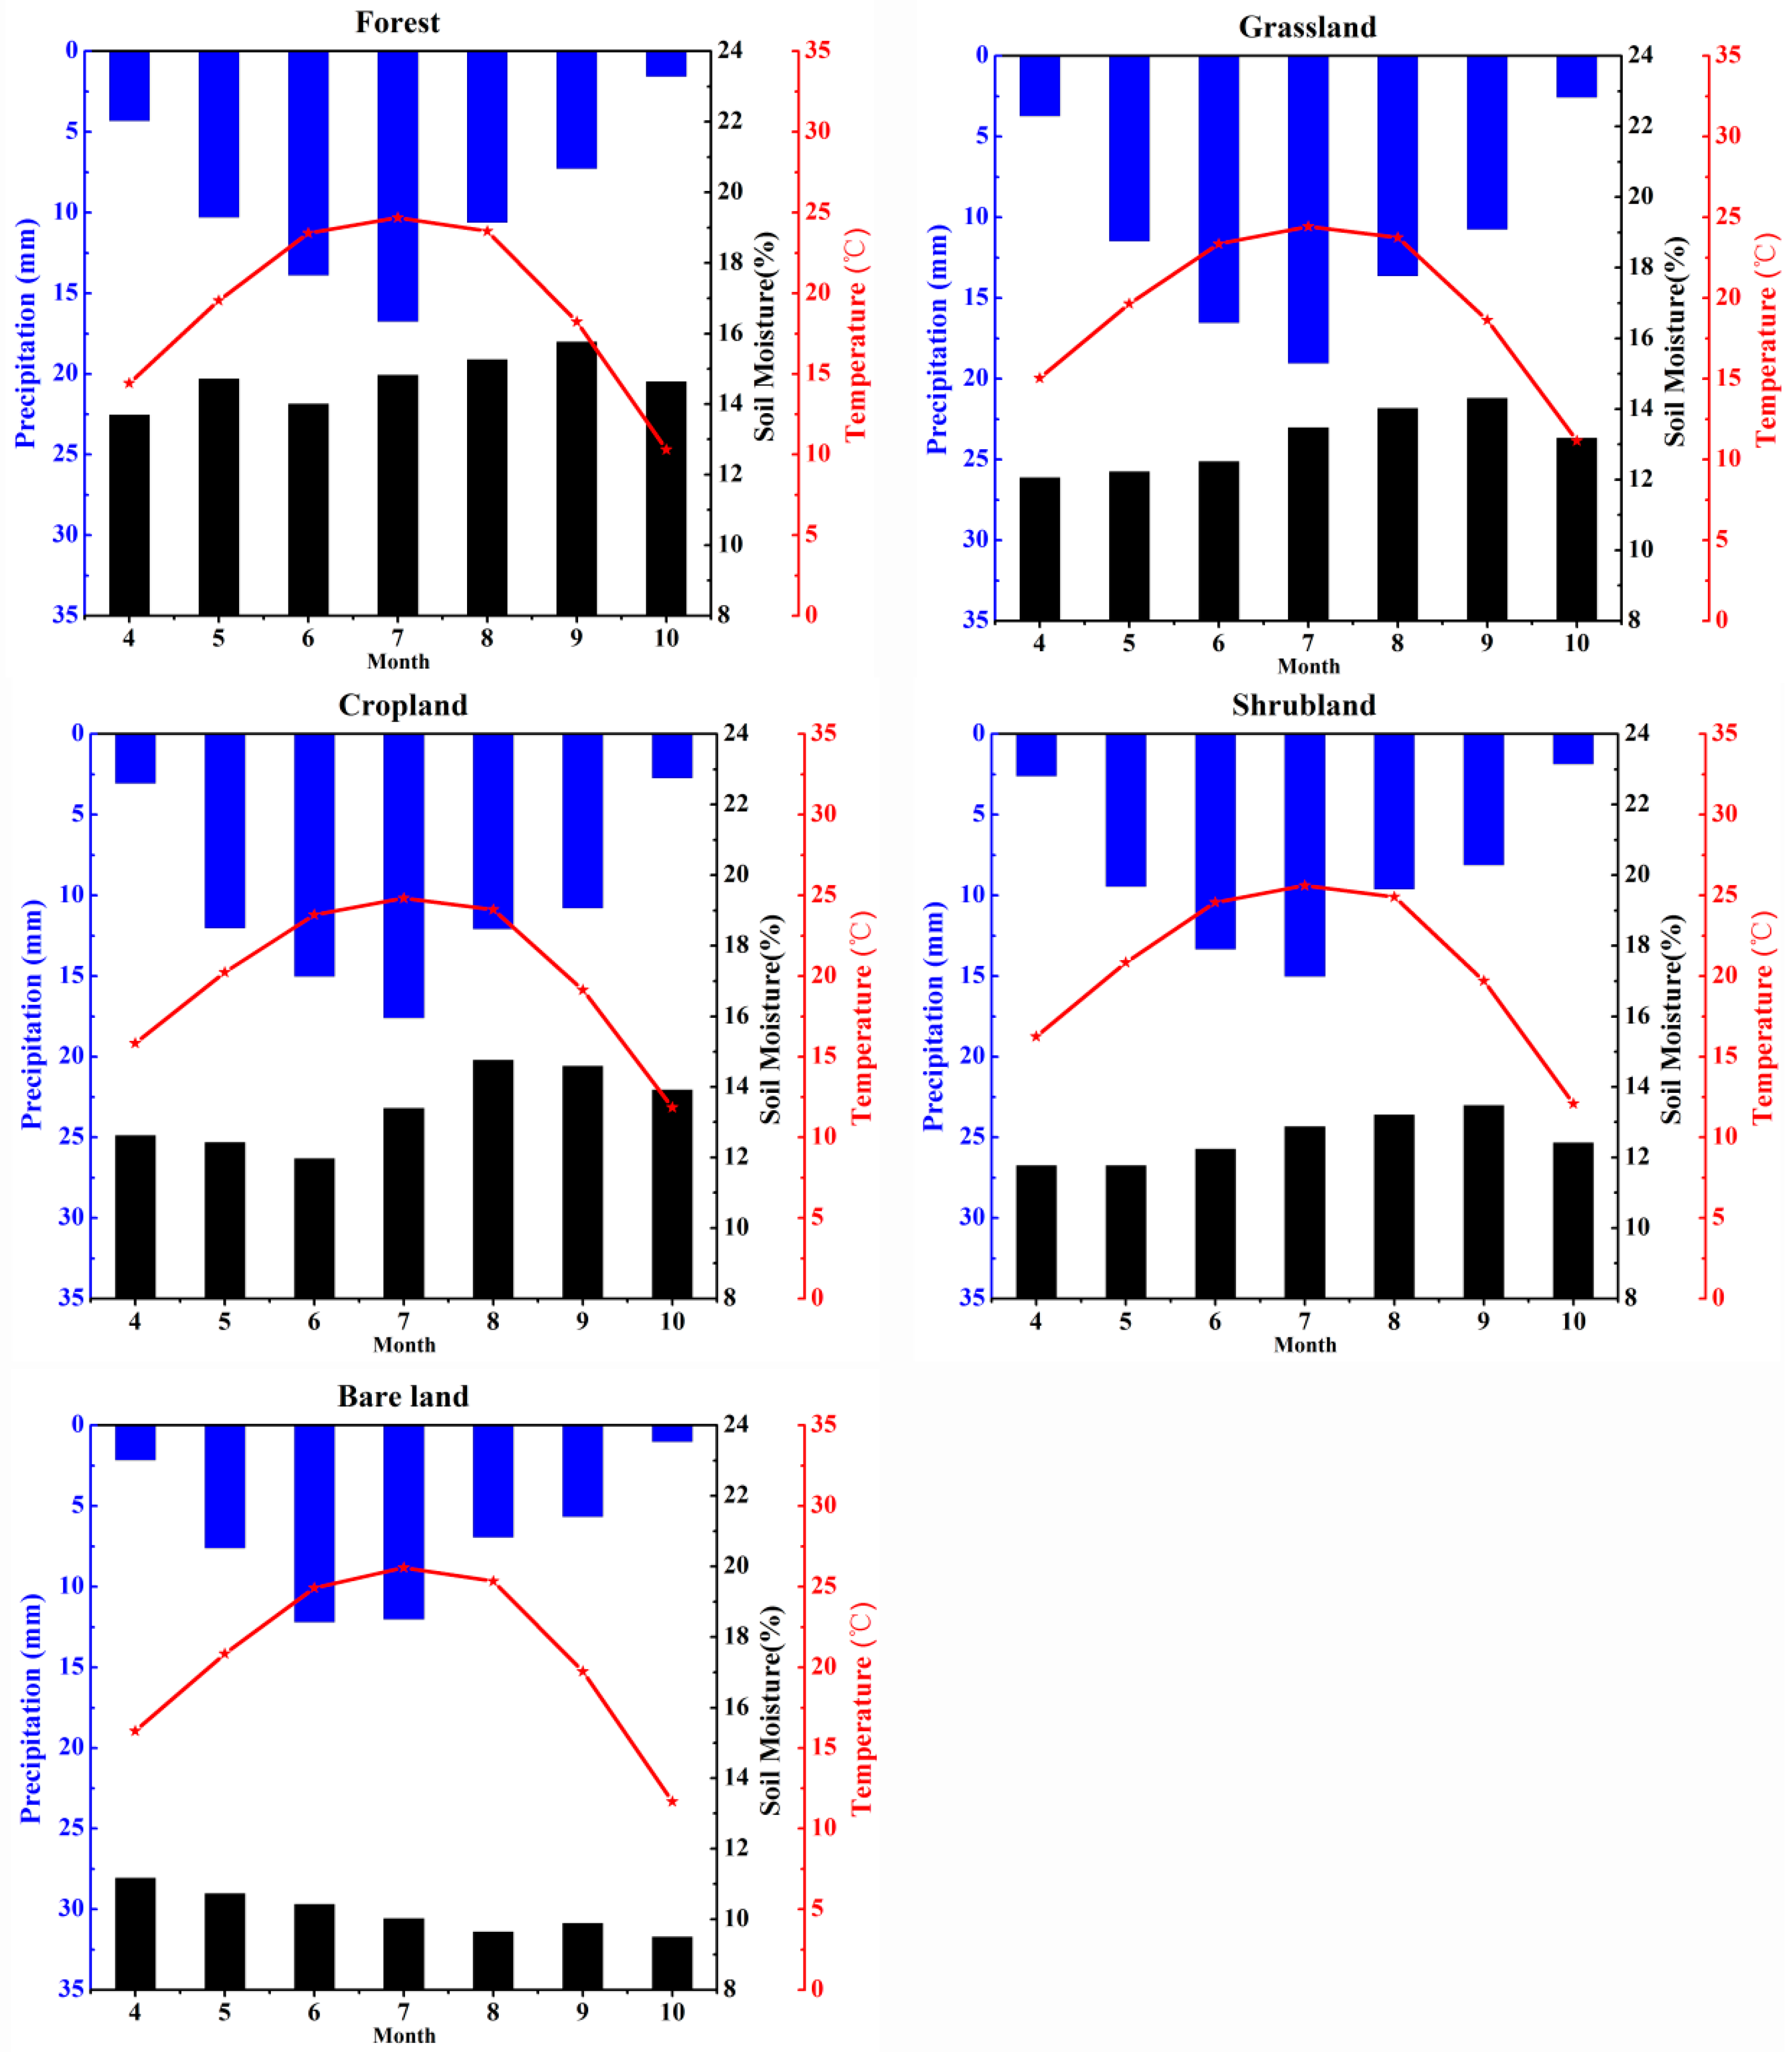
4.2.4. Soil Moisture Variations in Different Land Cover Types

Figure 8 shows the dynamics of soil moisture, precipitation, and temperature in the warm season during 2001~2015 over different land cover types. Spatially, soil moisture was highest in the forest (14.67%), followed by cropland (13.36%), grassland (13.07%), and shrubland (12.48%), and the lowest value occurred in the bare land (10.17%); the annual precipitation is highest in grassland (79 mm), followed by cropland (75 mm), forest (64 mm), shrubland (60 mm) and bare land (47 mm); the annual average temperature is lowest in the forest (19 °C) and highest in bare land (21 °C). Temporally, the changes in precipitation and temperature are not significant in all land cover types. The annual changes of soil moisture in different land cover types can be described as y = 0.078x + 14.04 (R2 = 0.24, p = 0.06) for forest, y = 0.096x + 12.30 (R2 = 0.33, p = 0.02) for grassland, y = 0.060x + 12.88 (R2 = 0.11, p = 0.22) for cropland, y = 0.064x + 11.97 (R2 = 0.20, p = 0.09) for shrubland, and y = 0.068x + 9.62 (R2 = 0.27, p = 0.04) for bare land. Only for grassland and bare land, soil moisture showed a significant increasing trend at a significant level of 0.05 by T-test.
Figure 9 shows the monthly variations of soil moisture and meteorological factors in different land cover types. Both precipitation and temperature exhibited an increase from April to July and then a decrease to October, with the highest values in July. The monthly variations of soil moisture were different in different land cover types. Soil moisture in the forest had no obvious change, revealing the strong ability of soil moisture conservation. For grassland and shrubland, soil moisture increased first and then decreased, with a maximum observed in September. For cropland, soil moisture in April and May is higher than in June, which may be related to the spring irrigation. Soil moisture variation in cropland was the combined results of climate and agricultural activities. In bare land, soil moisture presented a continuous descending trend, which was attributed to low precipitation and high evaporation. Higher temperature results in greater potential evaporation in bare land, and the increase in precipitation is less than the evaporation, so the soil moisture continues to decline.

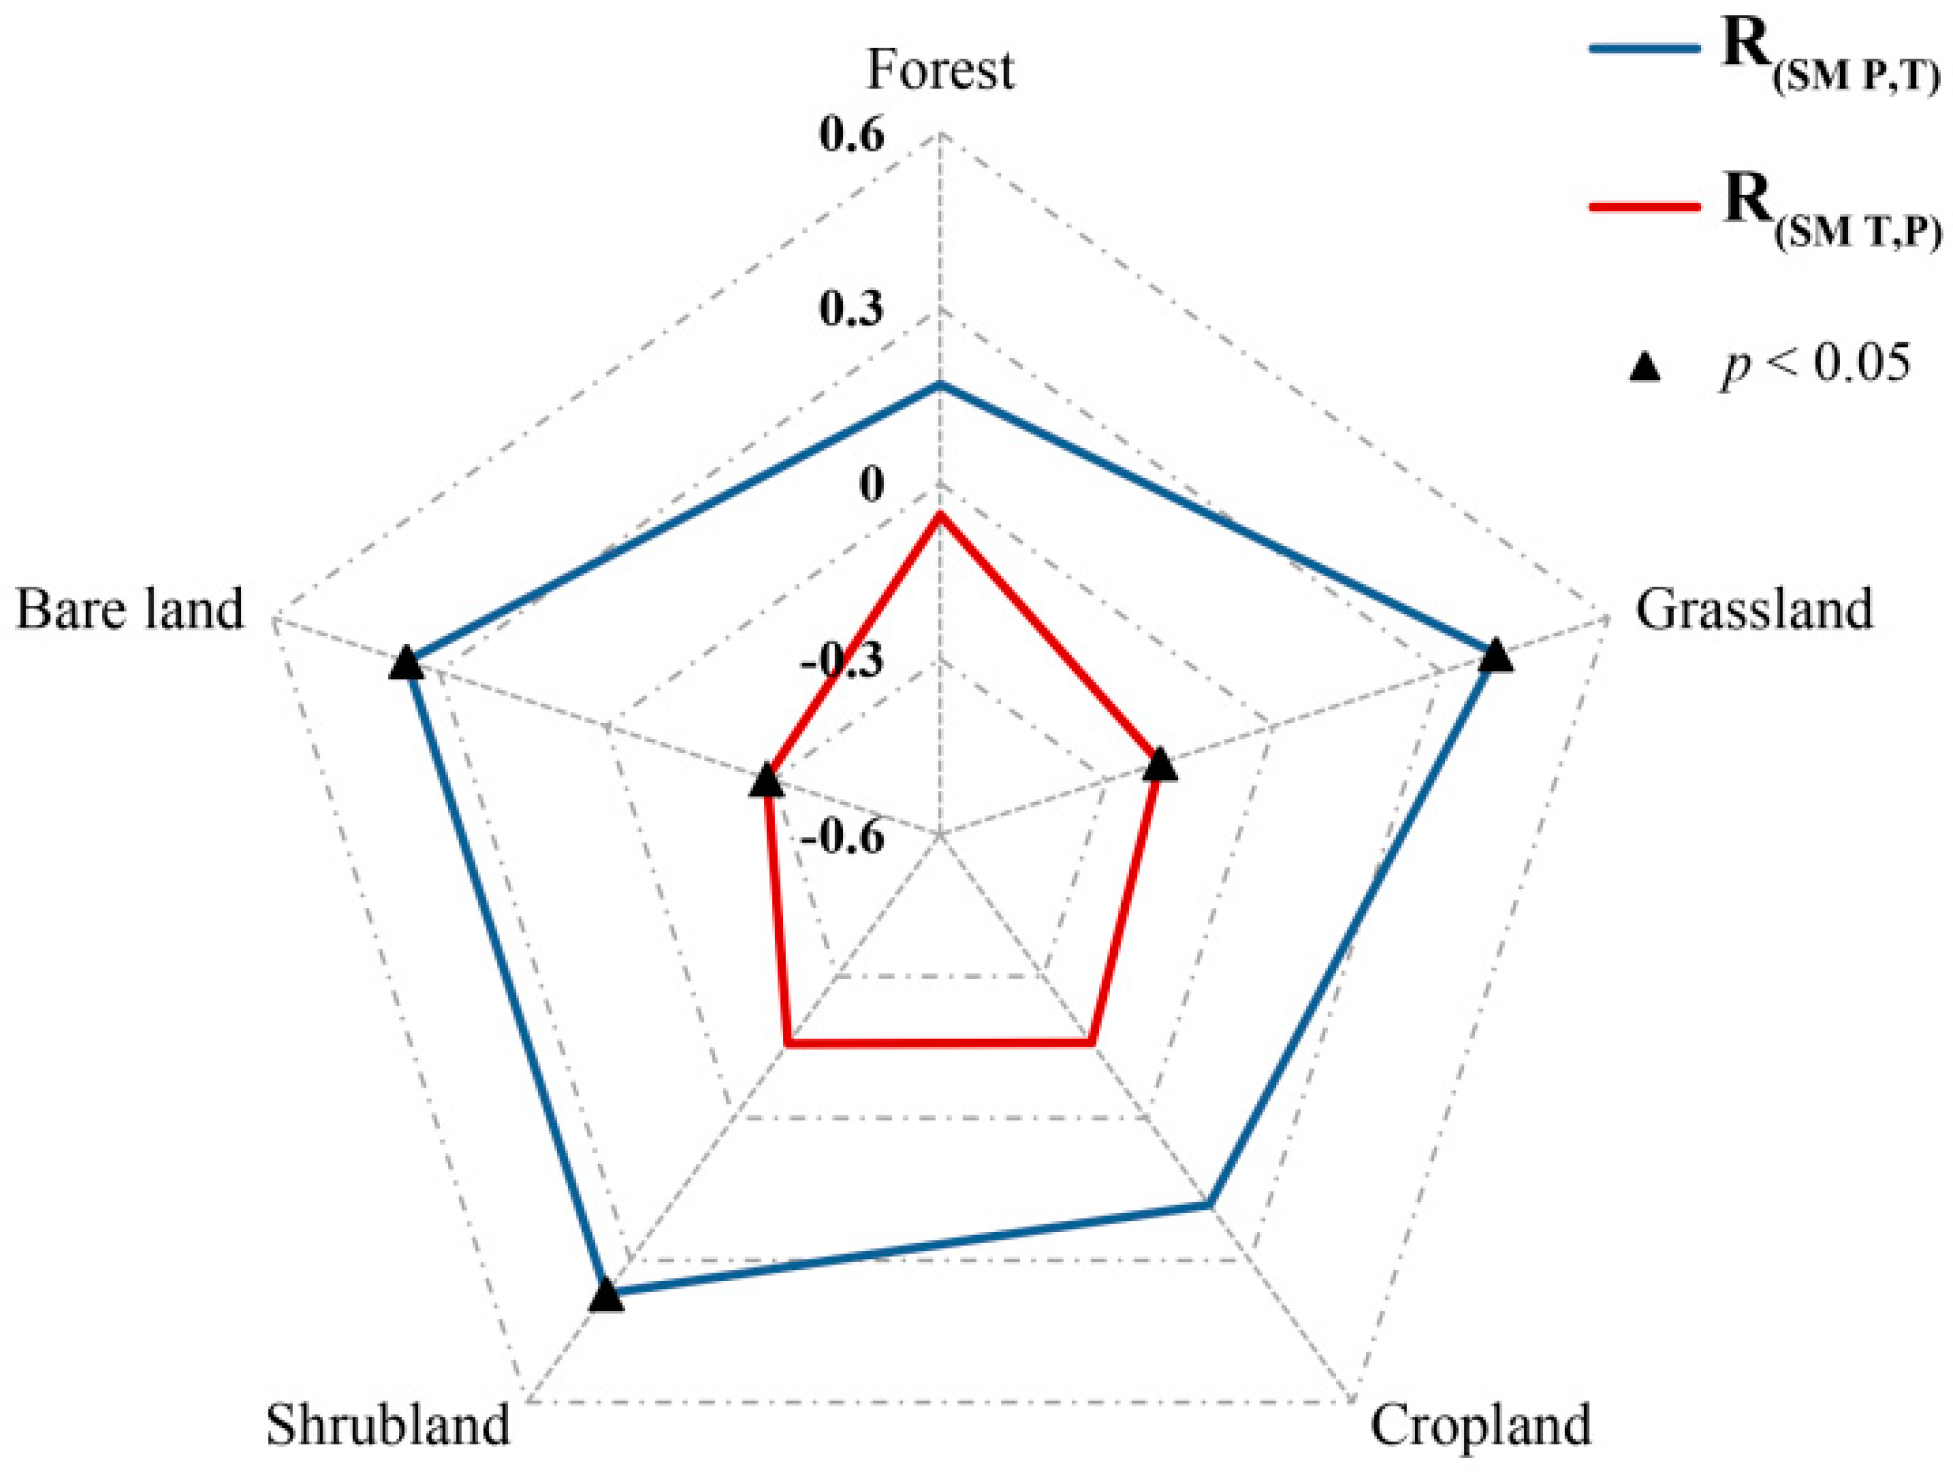
4.3. Combined Effects of Temperature and Precipitation on Soil Moisture

Partial correlation analysis was adopted to analyze the respective contribution of temperature and precipitation to soil moisture. The monthly data in each land cover type were used to calculate the partial correlation. The results (Figure 10) obviously indicate that soil moisture had negative correlations with temperature and positive correlations with precipitation. The absolute values of correlation coefficients (R) for precipitation were higher than that for temperature in all land cover types, which means soil moisture had stronger correlations with precipitation than temperature. Significant correlations between soil moisture and temperature were only found in grassland (R = −0.19) and bare land (R = −0.26). Soil moisture was significantly correlated with precipitation in grassland (R = 0.4), shrubland (R = 0.38) and bare land (R = 0.37). For forest and cropland, soil moisture had weaker correlations with temperature and precipitation, which indicates that soil moisture in these areas is also affected by other factors, such as human activities.
Table 1 shows the results of Multi-regression analysis, which corroborate the results of partial correlation analysis. As indicated by their coefficients, the sign of the coefficients was positive for precipitation and negative for temperature; the absolute values of the coefficients for precipitation were greater than for temperature in all land cover types, meaning that soil moisture was more sensitive to precipitation. The average soil moisture increases by 0.33% with every increase of precipitation, while it decreases by 0.06% with every increase in temperature. The coefficients of S M i 1 reflect the hysteretic effects of climate on soil moisture to a certain extent. Low absolute values of coefficients for precipitation, temperature and in forest and cropland indicate that the soil moisture variations were not sensitive to climate in these land cover types. In addition, R2 was low for forest and cropland, which means that the precipitation and temperature cannot account for the major variation of soil moisture. In the study area, most of the forests are the desert riparian forests distributed near the Tarim River, and the main water supply is from the river, so climate factors may have little impact on the soil moisture in the forest. For cropland, human activities may have more effects than climate factors. In the study area, there are three main crops, cotton, corn and wheat, and they are all irrigated crops, so the soil moisture variations in cropland are strongly influenced by irrigation.

5. Discussion

There is an obvious regional difference in the spatial distribution of soil moisture. The northern part of the study area, with high soil moisture, is influenced by precipitation and melting ice/snow water from Tianshan Mountains [49], while the southern part with low soil moisture is a result of extremely low precipitation. The spatial mean soil moisture shows a significant increasing trend from 2001 to 2015, and in summer about 90% area shows a significant increasing trend. Li et al. [50] demonstrated that the precipitation in northwest China showed a significantly increasing trend during 1960~2010 and the precipitation variation in summer contributed most to the yearly change. The soil moisture variation may be related to the precipitation variation. In addition, comparing Figure 7e,g, the areas with large soil moisture slope in summer stayed in autumn. Prior studies showed that the memory of soil moisture is approximately 2 months [51], which can reasonably explain the soil moisture variation in autumn.
For different land cover types, soil moisture is higher in areas with vegetation than in the bare land. This is because vegetation can preserve soil moisture, especially in arid ecosystems [52]. The vegetation patches can retain runoff and make it infiltrate into the soil. Besides, previous researchers demonstrated that the infiltration rate is higher for soil in the forest than in cropland and grassland [53,54], which gives a reasonable explanation that the forest area captures more soil moisture than other lands. As respect to the variation of soil moisture, there is a relatively high rate of increase (about 0.096%/year) of soil moisture in grassland, which implies that soil moisture in grassland is more sensitive to climate change. The forests in the study are desert riparian forests, and the water resource is mainly from the Tarim River, so the soil moisture variation in the forest may be related to the runoff of the river. 2007, 2008, and 2009 are three consecutive dry years for the Tarim River [55], which is responding to the low soil moisture in the forest during this period (Figure 8). In 2010, a high summer flood occurred in the Tarim River [55], and resulted in high soil moisture value in the forest.
Both the partial correlation analysis and the multiple linear regression analysis indicate that precipitation plays a more important role than temperature in explaining the soil moisture variations in the study area. In the arid area, the deficit of the soil moisture is mainly attributed to limit precipitation, and even a small increase in the total precipitation has strong effects on soil moisture. On the other hand, the contribution of temperature is lower. In temperature-soil moisture coupling system, temperature indirectly affects soil moisture by influencing evapotranspiration, and soil moisture can also affect evapotranspiration in soil moisture-limited regimes [56,57]. In the study area, low soil moisture strongly constrains evapotranspiration variability, thus resulting in relatively small effects of temperature on soil moisture.

6. Conclusions

This paper studied the spatiotemporal variations of soil moisture and its response to precipitation and temperature in different land cover types in an arid area, based on high-spatial-resolution soil moisture data derived from microwave remote sensing data. The conclusions can be drawn as follows:
(1) In the study area, the soil moisture showed a distinctive spatial pattern, with higher content in the north than in the south, which was consistent with the distributions of the oasis and desert. Temporally, the spatial mean soil moisture posed a slightly increasing trend during 2001~2015.
(2) Trends analysis indicates that areas with the decreasing trends of soil moisture were trivial and can be ignored, compared to those with significant increasing trends. The soil moisture variations were related to the precipitation, and summer was the most important season for the regional soil moisture change.
(3) Soil moisture was highest in the forest, followed by cropland, grassland, and shrubland, and it was lowest in the bare land. During 2001~2015, soil moisture exhibited significant increasing trends in grassland and bare land. Soil moisture variations were different in different land cover types, indicating the effects of land cover on soil moisture.
(4) Statistical results reveal that precipitation had positive effects on soil moisture while temperature had negative effects, and precipitation played a more important role than temperature in soil moisture variations within the study area. In arid areas, the deficit of soil moisture is mainly attributed to low precipitation, so even a small increase in precipitation could have strong effects on soil moisture.

Acknowledgments

This study was supported by the Science and Technology Service Network Initiative Project of Chinese Academy of Sciences (KFJ-STS-ZDTP-036) and the National Natural Science Foundation of China (41630859).

Author Contributions

Yunqian Wang analyzed the data and wrote the first draft. Jing Yang proposed the main structure of this study. Yaning Chen and Philippe De Maeyer provided useful advice and revised the manuscript. Anqian Wang processed the in situ soil moisture data at Shache station. All authors contributed to the final manuscript.

Conflicts of Interest

The authors declare no conflict of interest.

References

  1. Pierdicca, N.; Fascetti, F.; Pulvirenti, L.; Crapolicchio, R.; Muñoz-Sabater, J. Analysis of ASCAT, SMOS, in-situ and land model soil moisture as a regionalized variable over Europe and North Africa. Remote Sens. Environ. 2015, 170, 280–289. [Google Scholar] [CrossRef]
  2. Dirmeyer, P.A. The terrestrial segment of soil moisture–climate coupling. Geophys. Res. Lett. 2011, 38. [Google Scholar] [CrossRef]
  3. Schwingshackl, C.; Hirschi, M.; Seneviratne, S.I. Quantifying spatio-temporal variations of soil moisture control on surface energy balance and near-surface air temperature. J. Clim. 2017, 30, 7105–7124. [Google Scholar] [CrossRef]
  4. Alexander, L. Climate science: Extreme heat rooted in dry soils. Nat. Geosci. 2011, 4, 12–13. [Google Scholar] [CrossRef]
  5. Vogel, M.M.; Orth, R.; Cheruy, F.; Hagemann, S.; Lorenz, R.; van den Hurk, B.J.J.M.; Seneviratne, S.I. Regional amplification of projected changes in extreme temperatures strongly controlled by soil moisture-temperature feedbacks. Geophys. Res. Lett. 2017, 44, 1511–1519. [Google Scholar] [CrossRef]
  6. AghaKouchak, A.; Farahmand, A.; Melton, F.S.; Teixeira, J.; Anderson, M.C.; Wardlow, B.D.; Hain, C.R. Remote sensing of drought: Progress, challenges and opportunities. Rev. Geophys. 2015, 53, 452–480. [Google Scholar] [CrossRef]
  7. Cammalleri, C.; Micale, F.; Vogt, J. A novel soil moisture-based drought severity index (DSI) combining water deficit magnitude and frequency. Hydrol. Process. 2016, 30, 289–301. [Google Scholar] [CrossRef]
  8. Carrão, H.; Russo, S.; Sepulcre-Canto, G.; Barbosa, P. An empirical standardized soil moisture index for agricultural drought assessment from remotely sensed data. Int. J. Appl. Earth Obs. Geoinform. 2016, 48, 74–84. [Google Scholar] [CrossRef]
  9. Feng, H. Individual contributions of climate and vegetation change to soil moisture trends across multiple spatial scales. Sci. Rep. 2016, 6, 32782. [Google Scholar] [CrossRef] [PubMed]
  10. Stéfanon, M.; Drobinski, P.; D’Andrea, F.; Lebeaupin-Brossier, C.; Bastin, S. Soil moisture-temperature feedbacks at meso-scale during summer heat waves over Western Europe. Clim. Dyn. 2014, 42, 1309–1324. [Google Scholar] [CrossRef]
  11. Pablos, M.; Martínez-Fernández, J.; Piles, M.; Sánchez, N.; Vall-llossera, M.; Camps, A. Multi-temporal evaluation of soil moisture and land surface temperature dynamics using in situ and satellite observations. Remote Sens. 2016, 8, 587. [Google Scholar] [CrossRef]
  12. Longobardi, A. Observing soil moisture temporal variability under fluctuating climatic conditions. Hydrol. Earth Syst. Sci. Discuss. 2008, 5, 935–969. [Google Scholar] [CrossRef]
  13. Fu, B.; Wang, J.; Chen, L.; Qiu, Y. The effects of land use on soil moisture variation in the Danangou catchment of the Loess Plateau, China. Catena 2003, 54, 197–213. [Google Scholar] [CrossRef]
  14. Zucco, G.; Brocca, L.; Moramarco, T.; Morbidelli, R. Influence of land use on soil moisture spatial–temporal variability and monitoring. J. Hydrol. 2014, 516, 193–199. [Google Scholar] [CrossRef]
  15. D’Odorico, P.; Ridolfi, L.; Porporato, A.; Rodriguez-Iturbe, I. Preferential states of seasonal soil moisture: The impact of climate fluctuations. Water Res. Res. 2000, 36, 2209–2219. [Google Scholar] [CrossRef]
  16. Feng, H.; Liu, Y. Combined effects of precipitation and air temperature on soil moisture in different land covers in a humid basin. J. Hydrol. 2015, 531, 1129–1140. [Google Scholar] [CrossRef]
  17. Xu, C.; Chen, Y.; Li, W.; Chen, Y. Climate change and hydrologic process response in the Tarim River Basin over the past 50 years. Chin. Sci. Bull. 2006, 51, 25–36. [Google Scholar] [CrossRef]
  18. Liu, T.; Willems, P.; Pan, X.L.; Bao, A.-M.; Chen, X.; Veroustraete, F.; Dong, Q.H. Climate change impact on water resource extremes in a headwater region of the Tarim basin in China. Hydrol. Earth Syst. Sci. Discuss. 2011, 8, 6593–6637. [Google Scholar] [CrossRef]
  19. Huang, Y.; Li, Y.; Chen, X.; Ma, Y. Optimization of the irrigation water resources for agricultural sustainability in Tarim River Basin, China. Agric. Water Manag. 2012, 107, 74–85. [Google Scholar] [CrossRef]
  20. Xu, C.; Chen, Y.; Chen, Y.; Zhao, R.; Ding, H. Responses of surface runoff to climate change and human activities in the arid region of Central Asia: A case study in the Tarim River Basin, China. Environ. Manag. 2013, 51, 926–938. [Google Scholar] [CrossRef] [PubMed]
  21. De Jeu, R.; Wagner, W.; Holmes, T.; Dolman, A.; van de Giesen, N.; Friesen, J. Global soil moisture patterns observed by space borne microwave radiometers and scatterometers. Surv. Geophys. 2008, 29, 399–420. [Google Scholar] [CrossRef] [Green Version]
  22. Santi, E.; Paloscia, S.; Pettinato, S.; Fontanelli, G. Application of artificial neural networks for the soil moisture retrieval from active and passive microwave spaceborne sensors. Int. J. Appl. Earth Obs. Geoinform. 2016, 48, 61–73. [Google Scholar] [CrossRef]
  23. Akbar, R.; Das, N.; Entekhabi, D.; Moghaddam, M. Active and Passive Microwave Remote Sensing Synergy for Soil Moisture Estimation. Satell. Soil Moisture Retr. 2016, 187–207. [Google Scholar] [CrossRef]
  24. Kolassa, J.; Reichle, R.; Draper, C. Merging active and passive microwave observations in soil moisture data assimilation. Remote Sens. Environ. 2017, 191, 117–130. [Google Scholar] [CrossRef]
  25. Jackson, T.; Schmugge, J.; Engman, E. Remote sensing applications to hydrology: Soil moisture. Hydrol. Sci. J. 1996, 41, 517–530. [Google Scholar] [CrossRef]
  26. Tomer, S.K.; Al Bitar, A.; Sekhar, M.; Zribi, M.; Bandyopadhyay, S.; Kerr, Y. MAPSM: A spatio-temporal algorithm for merging soil moisture from active and passive microwave remote sensing. Remote Sens. 2016, 8, 990. [Google Scholar] [CrossRef]
  27. Liu, P.-W.; Judge, J.; DeRoo, R.; England, A.; Luke, A. Utilizing complementarity of active/passive microwave observations at L-band for soil moisture studies in sandy soils. In Proceedings of the 2013 IEEE International Geoscience and Remote Sensing Symposium (IGARSS), Melbourne, Australia, 21–26 July 2013; pp. 743–746. [Google Scholar]
  28. Link, M.; Entekhabi, D.; Jagdhuber, T.; Ferrazzoli, P.; Guerriero, L.; Baur, M.; Ludwig, R. Simulating L/L-Band and C/L-Band Active-Passive Microwave Covariation of Crops with the Tor Vergata Scattering and Emission Model for a SMAP-Sentinel 1 Combination. In Proceedings of the 2017 IEEE International Geoscience and Remote Sensing Symposium (IGARSS), Fort Worth, TX, USA, 23–28 July 2017; pp. 4143–4146. [Google Scholar]
  29. Wagner, W.; Dorigo, W.; de Jeu, R.; Fernandez, D.; Benveniste, J.; Haas, E.; Ertl, M. Fusion of Active and Passive Microwave Observations to Create an Essential Climate Variable Data Record on Soil Moisture. ISPRS Ann. Photogramm. Remote Sens. Spat. Inform. Sci. (ISPRS Ann.) 2012, 7, 315–321. [Google Scholar]
  30. Dorigo, W.; Gruber, A.; De Jeu, R.A.M.; Wagner, W.; Stacke, T.; Loew, A.; Albergel, C.; Brocca, L.; Chung, D.; Parinussa, R.M.; et al. Evaluation of the ESA CCI soil moisture product using ground-based observations. Remote Sens. Environ. 2015, 162, 380–395. [Google Scholar] [CrossRef]
  31. Parinussa, R.M.; Meesters, A.G.; Liu, Y.Y.; Dorigo, W.; Wagner, W.; de Jeu, R.A. Error estimates for near-real-time satellite soil moisture as derived from the land parameter retrieval model. IEEE Geosci. Remote Sens. Lett. 2011, 8, 779–783. [Google Scholar] [CrossRef]
  32. Barrett, B.W.; Dwyer, E.; Whelan, P. Soil moisture retrieval from active spaceborne microwave observations: An evaluation of current techniques. Remote Sens. 2009, 1, 210–242. [Google Scholar] [CrossRef]
  33. Ulaby, F.; Moore, R.; Fung, A. Microwave Remote Sensing: Active and Passive. Radar Remote Sensing and Surface Scattering and Emission Theory, Vol. 2. Massachusetts; Addison-Wesley: Reading, MA, USA, 1982. [Google Scholar]
  34. Escorihuela, M.J.; Quintana-Seguí, P. Comparison of remote sensing and simulated soil moisture datasets in Mediterranean landscapes. Remote Sens. Environ. 2016, 180, 99–114. [Google Scholar] [CrossRef]
  35. Wigneron, J.-P.; Jackson, T.; O’neill, P.; De Lannoy, G.; De Rosnay, P.; Walker, J.P.; Ferrazzoli, P.; Mironov, V.; Bircher, S.; Grant, J.P.; et al. Modelling the passive microwave signature from land surfaces: A review of recent results and application to the L-band SMOS & SMAP soil moisture retrieval algorithms. Remote Sens. Environ. 2017, 192, 238–262. [Google Scholar]
  36. Brown, R.; Manore, M.; Poirier, S. Correlations between X-, C-, and L-band imagery within an agricultural environment. Int. J. Remote Sens. 1992, 13, 1645–1661. [Google Scholar] [CrossRef]
  37. Liu, Y.Y.; Parinussa, R.M.; Dorigo, W.A.; De Jeu, R.A.M.; Wagner, W.; van Dijk, A. Developing an improved soil moisture dataset by blending passive and active microwave satellite-based retrievals. Hydrol. Earth Syst. Sci. 2011, 15, 425. [Google Scholar] [CrossRef] [Green Version]
  38. Dorigo, W.; Wagner, W.; Albergel, C.; Albrecht, F.; Balsamo, G.; Brocca, L.; Chung, D.; Ertl, M.; Forkel, M.; Gruber, A.; et al. ESA CCI Soil Moisture for improved Earth system understanding: State-of-the art and future directions. Remote Sens. Environ. 2017, 203, 185–215. [Google Scholar] [CrossRef]
  39. Su, B.; Wang, A.; Wang, G.; Wang, Y.; Jiang, T. Spatiotemporal variations of soil moisture in the Tarim River basin, China. Int. J. Appl. Earth Obs. Geoinform. 2016, 48, 122–130. [Google Scholar] [CrossRef]
  40. Carlson, T.N.; Gillies, R.R.; Perry, E.M. A method to make use of thermal infrared temperature and NDVI measurements to infer surface soil water content and fractional vegetation cover. Remote Sens. Rev. 1994, 9, 161–173. [Google Scholar] [CrossRef]
  41. Xu, Z.; Liu, Z.; Fu, G.; Chen, Y. Trends of major hydroclimatic variables in the Tarim River basin during the past 50 years. J. Arid Environ. 2010, 74, 256–267. [Google Scholar] [CrossRef]
  42. Liu, Y.Y.; Dorigo, W.A.; Parinussa, R.; de Jeu, R.A.; Wagner, W.; McCabe, M.F.; Evans, J.P.; van Dijk, A.I.J.M. Trend-preserving blending of passive and active microwave soil moisture retrievals. Remote Sens. Environ. 2012, 123, 280–297. [Google Scholar] [CrossRef]
  43. McNally, A.; Shukla, S.; Arsenault, K.R.; Wang, S.; Peters-Lidard, C.D.; Verdin, J.P. Evaluating ESA CCI soil moisture in East Africa. Int. J. Appl. Earth Obs. Geoinform. 2016, 48, 96–109. [Google Scholar] [CrossRef]
  44. An, R.; Zhang, L.; Wang, Z.; Quaye-Ballard, J.A.; You, J.; Shen, X.; Gao, W.; Huang, L.; Zhao, Y.; Ke, Z.; et al. Validation of the ESA CCI soil moisture product in China. Int. J. Appl. Earth Obs. Geoinform. 2016, 48, 28–36. [Google Scholar] [CrossRef]
  45. Friedl, M.A.; Sulla-Menashe, D.; Tan, B.; Schneider, A.; Ramankutty, N.; Sibley, A.; Ramankutty, N.; Sibley, A.; Huang, X. MODIS Collection 5 global land cover: Algorithm refinements and characterization of new datasets. Remote Sens. Environ. 2010, 114, 168–182. [Google Scholar] [CrossRef]
  46. Chauhan, N.; Miller, S.; Ardanuy, P. Spaceborne soil moisture estimation at high resolution: A microwave-optical/IR synergistic approach. Int. J. Remote Sens. 2003, 24, 4599–4622. [Google Scholar] [CrossRef]
  47. Liu, X.; Zhang, J.; Zhu, X.; Pan, Y.; Liu, Y.; Zhang, D.; Lin, Z. Spatiotemporal changes in vegetation coverage and its driving factors in the Three-River Headwaters Region during 2000–2011. J. Geogr. Sci. 2014, 24, 288–302. [Google Scholar] [CrossRef]
  48. Yuan, X.; Li, L.; Chen, X.; Shi, H. Effects of precipitation intensity and temperature on NDVI-based grass change over Northern China during the period from 1982 to 2011. Remote Sens. 2015, 7, 10164–10183. [Google Scholar] [CrossRef]
  49. Deng, H.; Chen, Y.; Wang, H.; Zhang, S. Climate change with elevation and its potential impact on water resources in the Tianshan Mountains, Central Asia. Glob. Planet. Change 2015, 135, 28–37. [Google Scholar] [CrossRef]
  50. Li, B.; Chen, Y.; Chen, Z.; Xiong, H.; Lian, L. Why does precipitation in northwest China show a significant increasing trend from 1960 to 2010? Atmos. Res. 2016, 167, 275–284. [Google Scholar] [CrossRef]
  51. Kim, Y.; Wang, G. Impact of initial soil moisture anomalies on subsequent precipitation over North America in the coupled land–atmosphere model CAM3–CLM3. J. Hydrometeorol. 2007, 8, 513–533. [Google Scholar] [CrossRef]
  52. Archer, N.A.; Otten, W.; Schmidt, S.; Bengough, A.G.; Shah, N.; Bonell, M. Rainfall infiltration and soil hydrological characteristics below ancient forest, planted forest and grassland in a temperate northern climate. Ecohydrology 2016, 9, 585–600. [Google Scholar] [CrossRef]
  53. Mao, D.; Cherkauer, K.A. Impacts of land-use change on hydrologic responses in the Great Lakes region. J. Hydrol. 2009, 374, 71–82. [Google Scholar] [CrossRef]
  54. Neris, J.; Jiménez, C.; Fuentes, J.; Morillas, G.; Tejedor, M. Vegetation and land-use effects on soil properties and water infiltration of Andisols in Tenerife (Canary Islands, Spain). Catena 2012, 98, 55–62. [Google Scholar] [CrossRef]
  55. Thevs, N.; Peng, H.; Rozi, A.; Zerbe, S.; Abdusalih, N. Water allocation and water consumption of irrigated agriculture and natural vegetation in the Aksu-Tarim river basin, Xinjiang, China. J. Arid Environ. 2015, 112, 87–97. [Google Scholar] [CrossRef]
  56. Koster, R.; Schubert, S.; Suarez, M. Analyzing the concurrence of meteorological droughts and warm periods, with implications for the determination of evaporative regime. J. Clim. 2009, 22, 3331–3341. [Google Scholar] [CrossRef]
  57. Seneviratne, S.I.; Corti, T.; Davin, E.L.; Hirschi, M.; Jaeger, E.B.; Lehner, I.; Orlowsky, B.; Teuling, A.J. Investigating soil moisture–climate interactions in a changing climate: A review. Earth-Sci. Rev. 2010, 99, 125–161. [Google Scholar] [CrossRef]
Figure 1. The geographical location of the study area.
Remotesensing 10 00468 g001
Figure 2. Spatial patterns of different land cover types in 2001, 2005, 2010, and 2013.
Remotesensing 10 00468 g002
Figure 3. Changes in land cover within the study area from 2001 to 2013.
Remotesensing 10 00468 g003
Figure 4. The monthly variations of the in situ, raw ESA CCI and downscaled ESA CCI soil moisture data.
Remotesensing 10 00468 g004
Figure 5. Scatterplots of the interpolated climate data against the in-situ data at four weather stations.
Remotesensing 10 00468 g005
Figure 6. Spatial patterns and interannual dynamics of soil moisture (a,b); precipitation (c,d) and temperature (e,f) in the warm season from 2001 to 2015.
Remotesensing 10 00468 g006
Figure 7. The spatial distributions and histograms of significant slope (p < 0.05) for soil moisture in the warm season (a,b); spring (c,d); summer (e,f) and autumn (g,h).
Remotesensing 10 00468 g007
Figure 8. Interannual variations of soil moisture, precipitation, and temperature in different land cover types from 2001 to 2015.
Remotesensing 10 00468 g008
Figure 9. Monthly variations of soil moisture, precipitation, and temperature in different land cover types from April to October.
Remotesensing 10 00468 g009
Figure 10. Partial correlation analysis between soil moisture and meteorological factors.
Remotesensing 10 00468 g010
Table 1. The results of multiple linear regression analysis between soil moisture and climate factors.
TypeR2ConstantPiTiSMi−1
CoefficientpCoefficientpCoefficientp
Forest0.0550.4290.1500.100−0.0730.3800.1640.124
Grass0.5510.0030.526<0.0001−0.0360.6310.692<0.0001
Crop0.1430.2730.1900.064−0.0640.4190.3510.002
Shrub0.4890.0190.474<0.0001−0.0140.8480.667<0.0001
Bare land0.4250.2770.316<0.0001−0.1440.0160.381<0.0001

