1. Introduction
Current inventories and reported statistics on irrigated areas, particularly in developing countries, are varied and inconsistent due to the host of different methods and data used to map and estimate the irrigated areas [
1,
2,
3]. As a result, there are significant knowledge gaps and uncertainties that remain in reported statistics of irrigated areas that are supposed to inform investment decisions and policy making [
4]. The Comprehensive Africa Agriculture Development Program (CAADP) set a target to expand area under irrigation on the continent by at least 5 million ha by 2025 [
5,
6]. Achieving such a goal will require the reduction of anomalies and uncertainties in reported information on irrigated areas, especially on informal irrigation.
As the economies of most African countries are agro-based, their economic development hinges on irrigation expansion. However, investment and policy change has been slow due to the lack of accurate information on the status of existing irrigation [
1,
7]. There are large variations between reported statistics of irrigated areas and the actual irrigated areas in African and Asian countries [
1,
8]. These variations and uncertainties render associated policies and investment plans, which base their analyses on these numbers, much less effective. The unavailability of an accurate, up-to-date and comprehensive baseline database and timely reporting of changes in irrigated areas and the corresponding crop production hinders economic development and slows the implementation of climate change adaptation strategies [
1].
Knowledge on irrigated areas is important for water planning and management, particularly in this era of resource scarcity and climate change [
9]. Irrigation plays a pivotal role in ecosystems related to water and food, and eventually human well-being and the environment [
10,
11]. Irrigation is also the largest water use sector in the world, accounting for about 70% of the world’s freshwater withdrawals [
12,
13]. National and regional food security targets in developing countries are often built on irrigation development [
6,
14]. There are renewed efforts to ensure food and water security as set out by many countries, development agencies and, globally, the United Nations’ Sustainable Development Goals (SDGs). Specifically the SDGs 1, 2, and 6 on poverty eradication, zero hunger, and provision of clean water and sanitation, respectively, are aligned to food and water security. Providing accurate statistics on irrigated areas benefits decision making and sustainable water management through improved crop water productivity, which helps countries achieve these goals.
The advent of remote sensing has enabled easier mapping and monitoring of irrigated areas to better manage water resources and agricultural development [
1,
8,
15]. Valid for application at multiple scales such as global scale [
16], regional scale [
17], and basin scale [
18], remote sensing allows mapping large areas within a short period of time and at a low cost. More importantly, remote sensing can map areas actually irrigated using vegetation indices such as the normalized difference vegetation index (NDVI) and other algorithms such as Fourier analysis which assesses phenology [
1,
18]. This helps to map areas that are actually being irrigated rather than areas which are equipped for irrigation. There can be profound differences between the two: sometimes the actual irrigated area is larger than the areas equipped for irrigation, particularly in regions where agriculture is more fragmented with informal irrigation. Sometimes, the actual irrigated area is much smaller, mainly in the case of large public irrigation schemes where the actual command areas often shrink due to lack of maintenance [
19]. Remote sensing overcomes some of the problems associated with only using infrastructure information to estimate irrigated area and provides a snapshot of the real situation during the mapping period [
20]. An analysis of the snapshots gives a clearer indication of the dynamics of the irrigated areas. It further helps understand the ecological footprint of food production, assesses the potential of agricultural development in regions of limited land and water resources, and achieves a balance between agricultural and natural ecosystems [
1].
The accuracy of irrigated areas mapped through remote sensing can be enhanced by post-classification correction (PCC) through ground verification of the mapped fields and knowledge based logic rules [
20,
21,
22]. This study outlines the use of an unmanned aerial vehicle (UAV), also called a drone, to improve the mapping accuracy of irrigated fields. Agriculture fields (irrigated and rainfed) were delineated using the supervised classification of Landsat 8 imageries. Winter NDVI data derived from Landsat 8 was then used to separate irrigated and rainfed areas. The aim of this study was to improve the mapping accuracy of irrigated fields.
2. Materials and Methods
2.1. Study Area
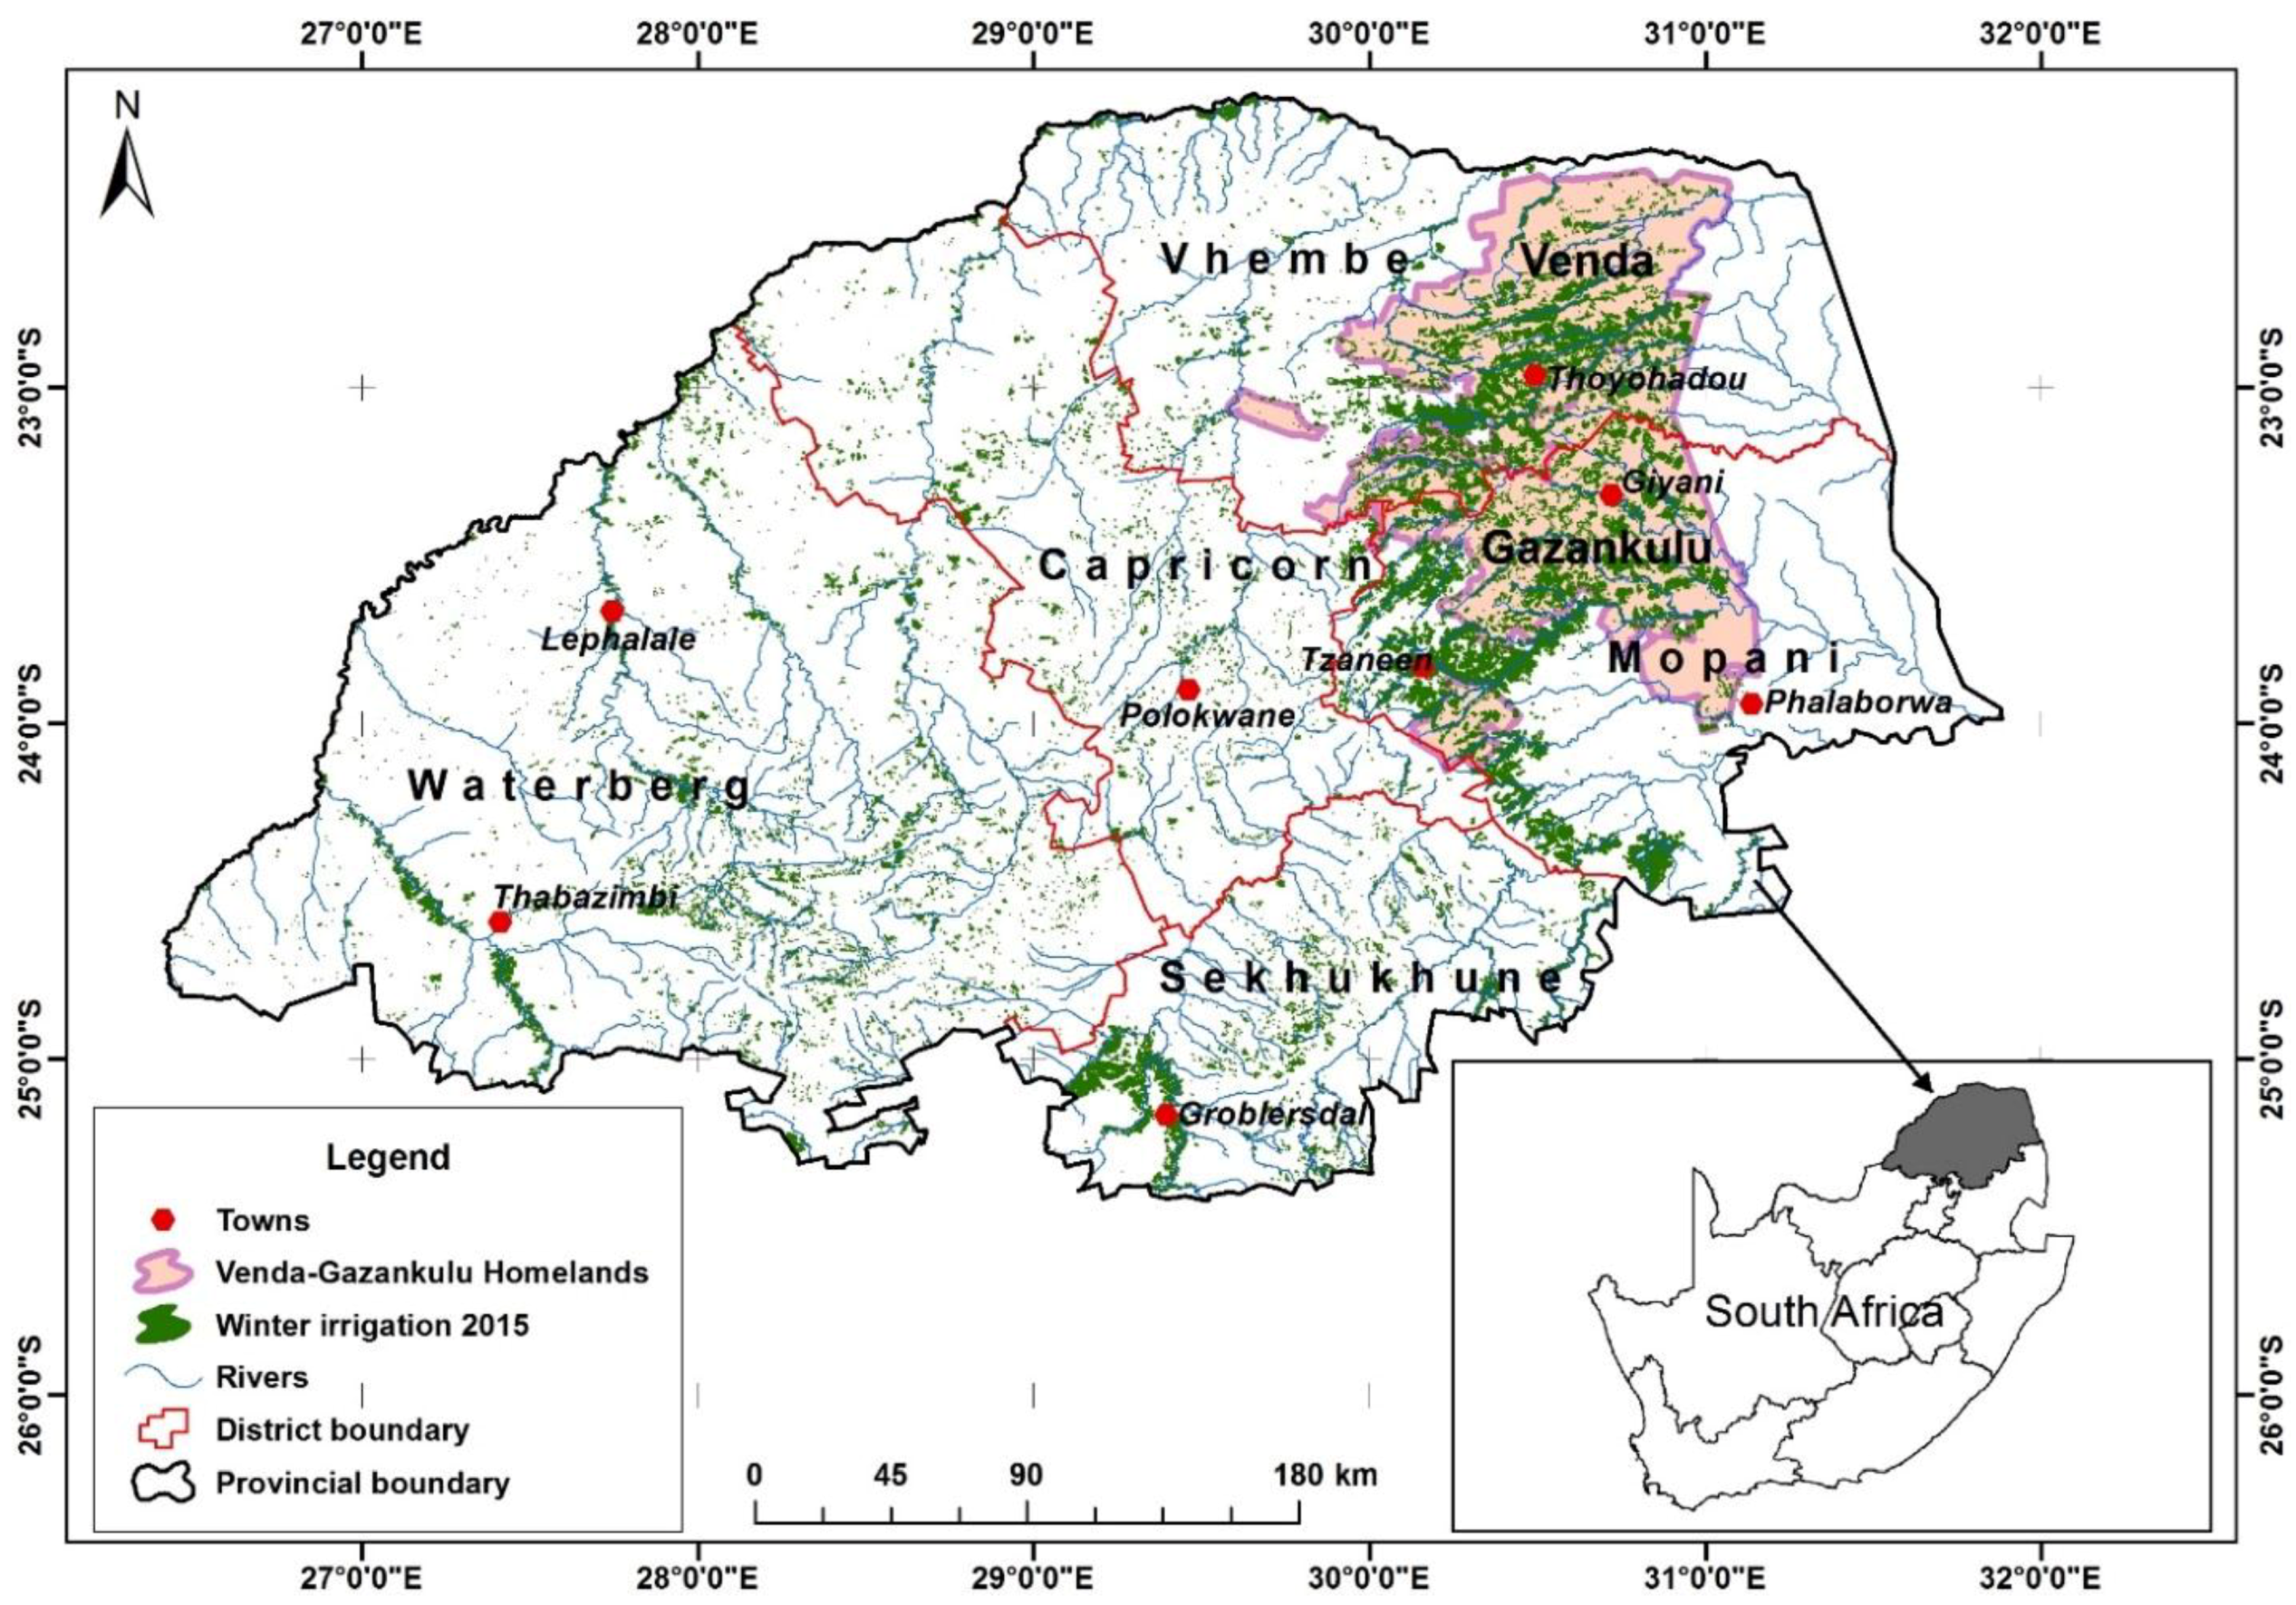
The study was done in the former homelands (areas allocated to indigenous black peasants during apartheid) of Venda and Gazankulu (
Figure 1), located in Vhembe and Mopani districts in the northeast of Limpopo Province. The two former homelands were chosen as they have the highest concentration of irrigated areas in Limpopo Province. Within the Limpopo Province, the Mopani District (in which former Gazankulu homeland is located) lies on the south-east of Vhembe District (where former Venda homeland is located). The Vhembe District shares borders with Botswana (northwest), Zimbabwe (north), and Mozambique (east), while Mopani District shares borders with Mozambique in the east through the Kruger National Park. The study area has a combined area of 16,774 km
2, whose population reside mostly in towns of Thohoyandou, Giyani and Tzaneen [
23]. The Limpopo River forms the border between the study area and the international neighbours. In the 2017 ground truthing trip, local municipalities of Thulamela and Makhado (Vhembe District) and Greater Giyani and Greater Letaba (Mopani District) were visited.
The topography of the area is varied with altitude ranging from 240 to 1400 m above sea level. The Soutpansberg mountain range stretches in an east-west direction for approximately 150 km, with the eastern half breaking up into three parallel ranges with fertile valleys between them [
24]. The main rivers flowing through the study area and their mean annual runoff (MAR in million m
3) are the Nzhelele (89.4), Nwanedi (24.5), Groot Letaba (380.9), Middle Letaba (151.9), Shingwedzi (89.8), Mutale (157.1), and Luvuvhu (362.9) [
25,
26]. The northern section between the mountains and the Limpopo River is hot and arid. Parts of the central zone as well as the area to the south of the Soutpansberg range have a hot, humid, subtropical climate with high rainfall averaging 500 mm per year, and are suitable for agriculture and the growing of subtropical fruits [
27]. Rainfall mainly occurs in the summer (October to April) whilst winters (May to September) are mild and generally frost-free.
Vembe and Mopani districts are predominantly rural and are known as a legendary cultural hub, and a catalyst for agricultural and tourism development [
23]. There are scattered commercial farms as well as irrigation schemes producing market garden and other cash crops for sale in nearby towns. Smallholder farms around mountainous areas mostly use gravity irrigation throughout the year. Most village households maintain gardens during the summer months to grow the staple crop, maize. Other crops include vegetables, pumpkins, sweet potatoes, groundnuts, sorghum, and finger millet. There are fruit trees in most gardens; the most commonly grown fruits are mangoes, papayas, avocados, bananas, and plantains, with some also producing citrus fruits and macadamia nuts [
27].
2.2. Delineation of Agriculture Fields
Cloud free Landsat 8 [
28] imageries for the year 2015, with a spatial and temporal resolution of 30 m and 16 days respectively, were used to delineate agricultural fields of the study area. Of the many Landsat scenes that were downloaded from the United States Geological Surveys (USGS) Earth-Explorer website [
28], only eight scenes, for the months of July and August of 2015 (
Table 1) were used in the classification of agriculture fields and extraction of winter irrigation areas. The visibility of most summer satellite imageries was deterred by clouds, making it impossible to make a cloud free mosaic for the summer season. The Landsat 8 scenes that were used, and their dates of acquisition are listed in
Table 1.
The satellite imageries were layer-stacked and mosaicked into three segments. A maximum likelihood supervised classifier was applied as it enables recognizing classes in the imageries based on prior knowledge of the area (personal experience, ground truth visits, and Google Earth zoom-in views). Prior knowledge of the area benefited the selection and setting-up discrete samples for each land use/cover class and assigning names to the classes. These samples, called training sites, and spectral signatures (mean values and variance of digital number (DN)) of each of the training sites were computed in ERDAS IMAGINE on the imageries. At least 15 training sites and spectral signatures were created for each of the four classes of landuses considered: (a) water; (b) urban and bare areas; (c) natural vegetation and (d) agriculture, although the focus was agricultural area. These were used as input to perform a maximum likelihood supervised classification in ERDAS IMAGINE to delineate agricultural fields. Using statistical processing, every pixel on the imageries was compared with the signatures on the training sites and was assigned to the classes it resembled. Fruit plots and shadenets that have clear boundaries were classified as agriculture.
2.3. Delineation of Irrigated Areas
NDVI computed on same Landsat 8 (
Table 1) cloud free winter imageries (June to August) were used to identify irrigated areas on the agricultural areas map during the winter season. NDVI is a vegetation index derived from the reflectance values of near infrared and red portions of the electromagnetic spectrum, and is used to quantify photosynthetic capacity, moisture stress, and vegetation productivity [
29]. NDVI is calculated as follows [
30].
where,
NIR represents the spectral reflectance in near infrared band and
R represents the red band. Chlorophyll, which is the primary photosynthetic pigment in the plant absorbs visible light (0.4–0.7 µm) bands but reflects infrared light (0.7–1.1 µm) wavelengths. Healthy vegetation reflects more infrared and absorbs more red and blue portions of the electromagnetic spectrum. The blue portion is affected by atmospheric scattering, hence the use of red and near infra-red bands to calculate NDVI and other vegetation indices. In arid areas and dry season, there is less absorption of the visible light and low reflection of the infrared light, thereby a low NDVI value and the opposite applies in humid areas and wet seasons. NDVI values range from −1 to +1 where 0 to 1 represents high plant productivity, and −1 to 0 represent no vegetation cover, presence of clouds, water, or glaciers. NDVI was calculated from the Landsat 8 cloud free winter images shown on
Table 1.
An NDVI threshold of 0.14 was used to separate irrigated from rainfed areas during the dry season, which falls during the winter season in the study area. The selection of the 0.14 NDVI threshold value was based on feature extraction method, comparing the Landsat 8 false color composite and the NDVI image [
31]. Pixels with NDVI values above the threshold value were classified as winter irrigated areas and those below were classified as non-irrigated. This was based on the assumption that in the study area crops could have healthy conditions during the dry winter season only when under irrigation. Thus, any pixel within agricultural areas with NDVI above the NDVI threshold should be irrigated areas. Post-classification techniques were applied in ArcGIS 10 to separate irrigated and rainfed areas.
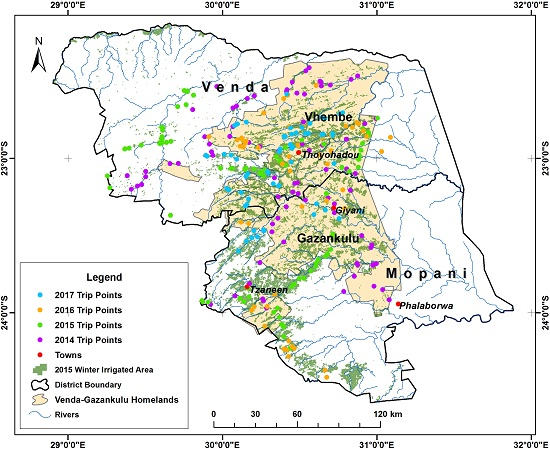
2.4. Field Data Collection
Two sets of field surveys were conducted for field verification, accuracy improvement and post-classification correction on both agricultural and irrigated areas respectively. The first set of field survey was manually done in the field using Handheld Android GPS compatible with Open Data Kit (ODK) Collect. The survey was done in the months of September and October of 2014, 2015, and 2016 as shown on
Figure 2. Sample fields of both irrigated and rainfed areas were randomly surveyed as the purpose was mainly to assess the mapping accuracy and also gain understanding of the ground reality during pre-processing. The second fieldwork which was done in 2017 used an UAV to assess the accuracy and to refine/enhance irrigated fields that were derived from the remotely sensed agriculture fields. Thus, the second fieldwork was mainly for post-classification correction (PCC) of irrigated areas. The first fieldwork produced 137 pre-classification ground-truth points and the second produced 74 points (
Figure 2). The 137 points produced an accuracy of 96% on the agricultural areas map, but the accuracy reduced to 71% on the extracted irrigated areas map. This reduction in accuracy of irrigated areas necessitated the PCC analysis.
Although the achieved 96% accuracy of agriculture fields is quite acceptable for this exercise, there was need to refine the accuracy of the irrigated area map which was 71%. The sampling method used during fieldwork was random, except instances when smallholder irrigation schemes were surveyed. The surveys targeted smallholder farming plots which are generally difficult to map because of their small size. The surveys focused on the former homelands of Venda and Gazankulu. Former homeland areas are predominantly smallholder farming areas occupied by peasants who own very small fields of about 2 ha in area [
32]. The high density of irrigated areas in the former homelands of Venda and Gazankulu motivated their selection for the study. Although the 2014, 2015, and 2016 fieldwork used a more systematic sampling method, as smaller and more isolated cropped areas were visited, the selection was still random. Thus, the PCC identified the misclassified land parcels, rectified them, and improved the mapping accuracy. The ground survey points collected in the study area are shown in
Figure 2.
2.5. Use of UAVs in Post-Classification Correction
The Phantom 4 Pro UAV (by DJI) (
www.dji.com/phantom-4-pro) was used during irrigated areas field survey. It is a low cost UAV that flies at a height of 500 m and travels a distance of 5 km from take-off point. It has a maximum flight time of 30 min, therefore extra batteries need to be taken during field surveys. Its built in camera has five-directions of obstacle sensing, which is made up of vision and infrared sensors that enables it to intelligently avoid obstacles during flight. The use of UAV needs to take into account local privacy laws and area restrictions. In this study, there were no local restrictions on the use of UAVs for scientific study.
The UAV was indispensable in exploring small and isolated agricultural plots and verifying whether they were actually irrigated. The UAV was used during the PCC as an addition and/or alternative to manual field verification because of its flexibility to survey previously inaccessible and remote fields. Thus, it was envisaged that an UAV could provide an alternative approach to ground truthing, and that it could result in even greater accuracy. Through the UAV aerial photographs and videos taken in 2017, we identified that most of the misclassified fields were abandoned fields and smallholder gardens which are irrigated using simple irrigation tools like handheld jars and hosepipes. The exercise was aided by interviews with local people and farmers. Time series Google Earth images were also used to evaluate historical changes in the land use/cover of the targeted irrigated fields. The exercise was carried out on 74 mapped irrigated fields, assessing their accuracy. Where farmers and locals were available, they were interviewed to further verify whether the mapped fields were irrigated in the winter of 2015. Where there were no people to interview, the following assumptions were made:
At indicated irrigated fields where irrigation was taking place during the winter of 2017, it was assumed that it was also irrigated in the winter of 2015, as was also verified on 2015 Google Earth.
At indicated irrigated fields where there were agricultural activities but without any sign of irrigation and with no people to interview, the field was deemed to be rainfed.
At indicated irrigated fields with no sign of agricultural activity nor irrigation infrastructure on the UAV photograph or on time series Google Earth images, it was assumed that the field was never irrigated.
With these knowledge based logic rules, 10 plots that had been mapped as irrigated were removed, since there was not enough evidence to confirm that irrigation ever took place in the winter of 2015. The PCC technique was, therefore, used on 74 randomly selected irrigated plots. The UAV aerial photographs and videos were used to reclassify targeted mapped irrigated fields more accurately, as plots without evidence of irrigation were removed and overestimated irrigated fields rectified. The analysis was aided by interviews of local people who had knowledge of farming history. Misclassifications were generally more evident on smallholder fields of about 2 ha in size.
2.6. Post-Classification Correction Process
The UAV was essential during post-classification correction and refinement of class assignment of areas classified as irrigated but which showed some anomalies and were not accurately representing the reality on the ground. The derived irrigated area map had noisy patches (areas that were being classified as irrigated due to high NDVI values yet were not actually irrigated) due to spectral similarity during the classification process. For example, some vegetated land parcels were misclassified as agricultural land and therefore, during the NDVI analysis, were picked as irrigated due to high vegetation richness. These misclassified irrigated fields included abandoned croplands that had been replaced by invasive alien species which are green throughout the year. The challenge was exacerbated by the fact that the study looked at all crops grown in the province, which gave various spectral reflectance. Thus, the study looked into vegetation richness during the dry season to detect irrigated fields.
Although the procedure used to classify irrigated areas and differentiate them from rainfed areas is appropriate, it also picked some land parcels that were not actually irrigated. The PCC was, therefore, applied to: (a) minimize the presence of misclassified fields through on-field verification with an UAV to better comprehend current landuse; (b) cross-check the mapped fields on Google Earth; (c) minimize the misclassification by removing the errant fields and improving the mapping accuracy. The UAV was flown to mapped irrigated fields for a detailed assessment and verification of whether they were actually irrigated areas. The advantage of a UAV is that it produces high resolution and detailed aerial photographs of the area of interest. UAVs also enable accessing previously unreached remote and isolated fields. As the aim of the study was to improve the accuracy of mapping irrigated areas, the UAV is also the most convenient tool to explore an area for the source of water used for irrigation.
3. Results and Discussion
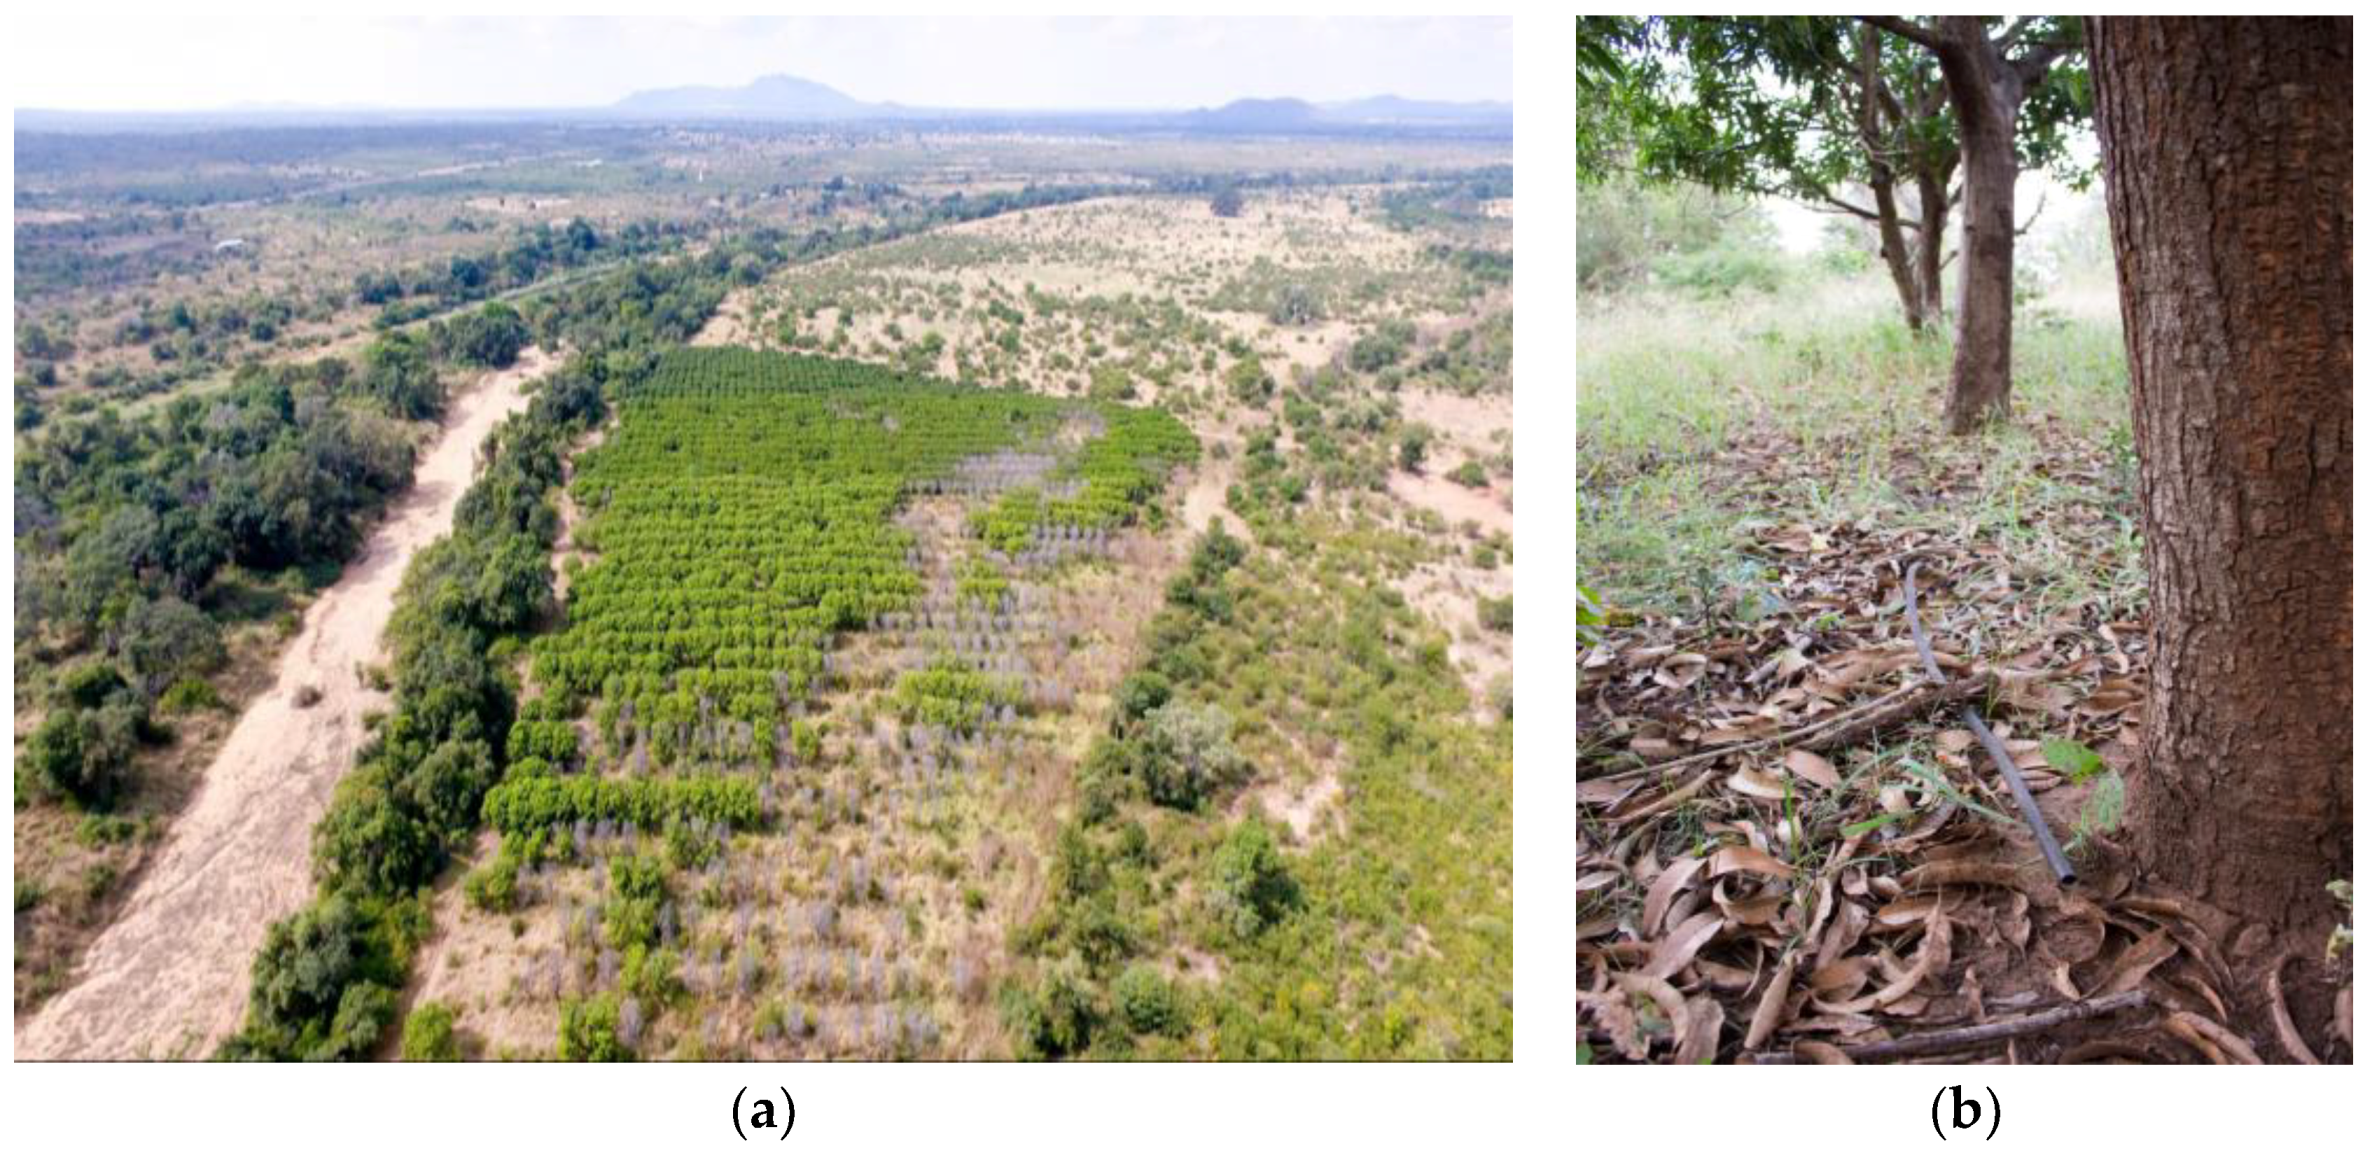
Of the 74 post-classification ground truth points, 71% were correctly mapped, but 29% were wrongly classified as irrigated. Misclassified irrigated fields were mainly abandoned croplands that had been infested with invasive alien species that where always green, or abandoned fruit plantations that still had productive trees and thus showed high NDVI values. Also there were some vegetated areas that were mapped as irrigated. The PCC analysis improved the mapping accuracy of irrigated areas as 10 fields that had no evidence of irrigation were removed.
Figure 3a is an UAV aerial photograph of a field that was identified as irrigated yet not actually irrigated as it is an abandoned fruit plantation. However, a closer look at the mango orchard gave evidence of an irrigation footprint through the presence of unused micro drip irrigation pipes (
Figure 3b). However, the field had clearly been abandoned a long time ago. After interviewing locals in the area it was found that the orchard was abandoned in 2004. The UAV aerial photograph (
Figure 3b) shows that part of the orchard had not survived the years of abandonment. There is however a large area that has survived and is still producing fruits. Thus, the orchard was classified as irrigated in the winter of 2015 due to its high NDVI values. Such scenarios present challenges during the NDVI classification of irrigated areas. These anomalies can only be detected and rectified through a PCC exercise. Observing time series images from Google Earth, it was noted that in 2003 the orchard was indeed healthy and productive. The 2015 Google Earth image shows a decrease in plant density, but it appeared as if it were still irrigated, a scenario that misled the supervised classification of landuse.
The other challenge that was observed was the over estimation of some irrigated fields. This was evident mainly on irrigated fields that were mapped as large contiguous fields. However, a further examination of UAV photographs of such fields identified some patches that were either abandoned or were fallow. As shown on
Figure 4a, the area has green patches, but also abandoned fields and a settlement. During the supervised classification, the whole area was classified as irrigated (
Figure 4b), yet some patches had been abandoned. This clearly increased the area of the field that was actually irrigated. Further studies are therefore needed to differentiate areas that are actually irrigated from those equipped for irrigation.
3.1. Pre- and Post-Classification Accuracy Comparative Analysis
Table 2 gives a comparative analysis of the accuracy assessments done during pre- and post-classification of the developed irrigated area map within the Venda-Gazankulu former homeland. The kappa coefficient of agreement [
33] was used to summarize the results of the accuracy assessment of remotely sensed agriculture and irrigated areas. The accuracy of the irrigated area map was 71% using 74 ground truth points. After the PCC using a UAV, accuracy improved to 95%. The UAV played an important role in improving the accuracy of the final irrigated area map by 24% as it enabled a detailed analysis of irrigated fields. Thus, the PCC was necessary in that it improved the accuracy of the final product.
3.2. Importance of UAVs in Post-Classification Enhancement of Irrigated Areas
The importance of remote sensing and vegetation indices such as NDVI in mapping irrigated areas was evident during fieldwork. Most agriculture fields that were identified as irrigated were actually irrigated. The accuracy of the initial agriculture fields map produced using the maximum likelihood classifier was 96% after the ground truthing of 137 field points. However, the accuracy of the classification for irrigated areas was only 71%, but improved in this study by using an UAV. The UAV enabled reaching isolated and inaccessible areas, taking high resolution images of targeted fields. The accuracy of agriculture areas map (combining both rainfed and irrigated areas) was higher than the accuracy of the extracted irrigated area map because the agriculture fields map considered all fields including those in fallow or abandoned as long as they had agriculture footprint. The irrigated area map targeted areas that were actually irrigated in 2015, which is more difficult to distinguish. The UAV allowed removing fields that had high NDVI but were not actually irrigated. The UAV aerial photographs allowed to fully comprehend the dynamics of each field and capture information that even manual fieldwork had not. The manual fieldwork recorded a field as irrigated if it had winter crops or showed signs of irrigation but without considering the surrounding fields. The pre-classification fieldwork was the reason why some abandoned fields were classified as irrigated. Although the PCC process was useful in concluding that most mapped areas were actually irrigated, there were still some anomalies on 5% of the fields.
The UAV has shown its importance in fieldwork as it can access previously unreachable and remote areas and returns high resolution aerial photographs and videos in real-time to give a snapshot of what is happening on the target field. UAVs are not only important during PCC, but are also essential during pre-classification fieldwork. If the UAV had been used during the pre-classification process more ground truth points would have been collected and improved accuracy assessment process at pre-processing stage. UAVs give a bird’s eye perspective and wide overview that cannot be achieved by a human eye during manual fieldwork. Thus, the use of UAVs in fieldwork is cost and time effective as they cover large areas within a short space of time and reduces the time spend in the field as illustrated in
Table 3 which compares manual fieldwork and the use of UAVs in ground truthing. On average, more points were collected using UAV by a single person than manual fieldwork which was done by two people. Although the cost of buying an UAV doubles the cost of buying two handheld Android GPS that were used in the manual fieldwork, the UAV can survey areas that are not easily accessible and returns high resolution aerial images and videos of the area of interest. Also, the cost of two personnel for the manual fieldwork that was done to cover many points makes manual fieldwork more costly.
4. Conclusions
Remote sensing is a useful and efficient technique to map irrigated areas and other landuse/cover categories at various scales. Although it is a cost-effective way of mapping irrigated areas, there is need for pre- and post-verification through fieldwork and expert knowledge to enhance accuracy of the irrigated area map. The mapping accuracy was enhanced by post-classification correction (PCC) using an UAV flown on a sample of targeted irrigated fields that were mapped in the winter of 2015, aiming to identify anomalies in the mapped irrigated fields and improve accuracy. The PCC resulted in 10 plots that had been mapped as irrigated being removed completely as they had no evidence of having been irrigated in the winter of 2015. The use of UAV in post-classification correction improved the accuracy of irrigated areas from 71% to 95%. The study has demonstrated the usefulness of integrating UAV technology, ancillary data, and knowledge-based rules into a land cover/use classification process for improving accuracy of irrigated area map. Although remote sensing mapping remains an important tool for mapping land uses, it is never 100% accurate. Accuracy is enhanced through post-classification correction using recent technologies such as UAV. High resolution aerial photographs from the UAV give a clear picture of what is actually happening on the ground. Thus, the accuracy of remotely sensed landuses can only get better with post-classification correction. The combination of remote sensing and UAV, enabled production of a useful policy product, essential in decision-making for better understanding and monitoring irrigated areas and improves water resources management.


