1. Introduction
Forest ecosystems provide a wide range of benefits to humans [
1,
2,
3] but remain under great pressure due to population growth and economic development. The protection of forests and their resources is important as local and distant human populations benefit directly from food, fuel, fiber and eco-tourism from healthy ecosystems. Functioning ecosystems also stabilize the climate, provide fresh water, control floods, and provide non-material benefits such as aesthetic views and recreational opportunities [
4,
5,
6,
7,
8]. Deforestation and degradation are a major source of greenhouse gas emissions, while forest management and restoration programs can improve livelihoods, create jobs, and improve economic growth in local communities. They can also lead to healthier environments, functioning ecosystem services, and reduce global greenhouse gas emissions.
This latter issue, the protection of forest ecosystems and subsequent reduction of greenhouse gas emissions is an important item in the international environmental fora. REDD+ (Reducing Emissions from Deforestation and forest Degradation) is a major global initiative which, for example, aims to reduce land-use related emissions from developing countries. Payment for Ecosystem Services (PES) is another exemplar initiative, which creates voluntary agreements between individuals generating benefits from extracting forest resources, and those individuals negatively impacted by the deforestation [
9]. The challenge in all of these initiatives is that developing countries often need extensive support to implement climate resilient strategies and protect their natural resources for future generations. Many international Non-Governmental Organizations (NGOs) offer generous support for the implementation of such strategies, but have strict guidelines on monitoring, evaluation and report on the impact of the measures which may be difficult for the host country to adhere to without specialized technical support.
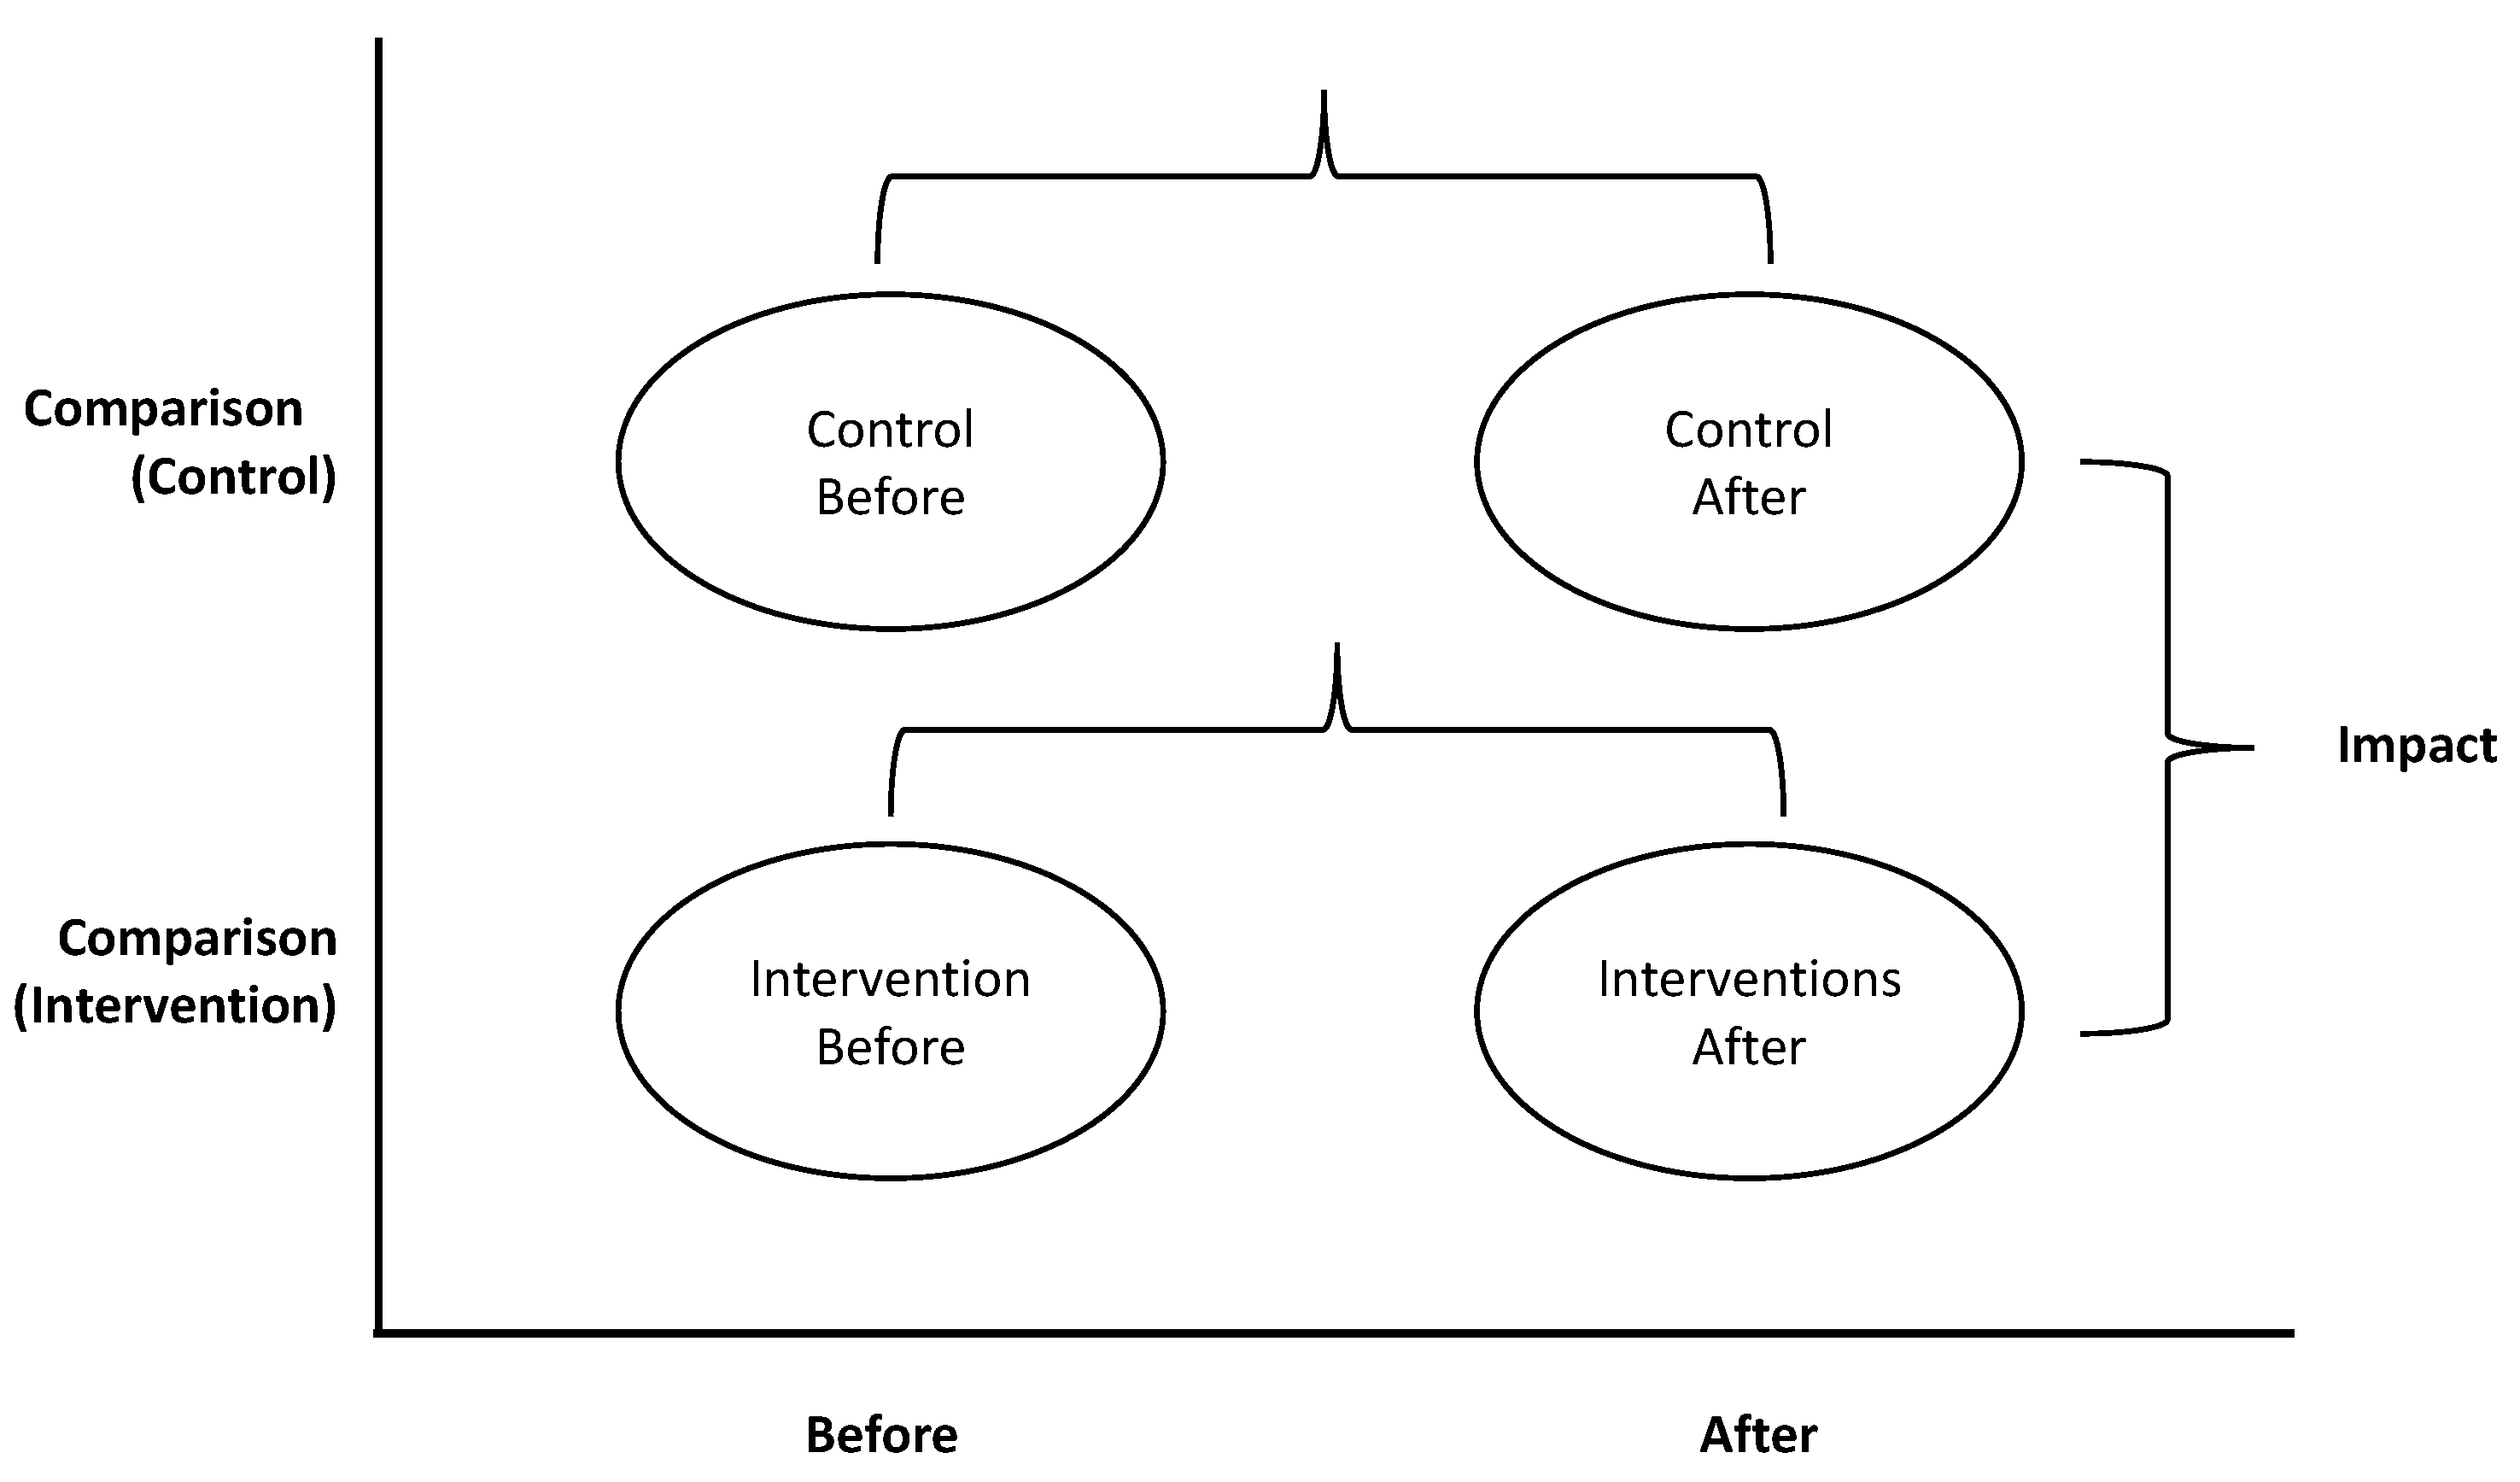
A common method for evaluating the impact of environmental and ecological interventions is the BACI (Before-After, Control-Impact) method [
10].
Figure 1 provides a schematic overview of the BACI framework. For the intervention area, the before and after variables of interest are measured. These are compared with the before and after measures of the same variables at a control site. The differences between the intervention and control sites determine the impact generated by the interventions [
11,
12]. Other studies have used BACI to study Marine protected areas [
13], integrated marsh management [
14] and ecosystem recovery [
15].
Monitoring forest ecosystems is important but difficult due to their highly distinctive complex spatial and temporal patterns [
17,
18]. Conventional methods for forest evaluation include extensive field research on a wide range of biophysical parameters such as vegetation health, tree height, tree cover, species distributions, animal movement patterns, and many more. Important work is being conducted by the United Nations Food and Agricultural Organization (FAO) in their 5-yearly Global Forest Resources Assessments [
19] where forest area and characteristics are identified. However, these approaches are expensive in terms of time and resources.
Recent international scientific developments have led to high resolution global satellite derived data products for assessing the state of vegetation and forest cover for the entire globe. These products have the resolution and coverage required for an adequate quantitative assessment of many environmental and ecological features and patterns. Together with recent advances in cloud-based remote sensing and geo-computational platforms, these technologies have led to greater open scientific data for use by policy makers and practitioners outside of academia. The hybridization and simplification of these technologies also allow scientists to provide policy-makers, international donors, NGOs, and other development partners with tailor-made products to monitor and value their ecosystems in near real-time, and requiring less advanced technical expertise than in the past.
In this paper we demonstrate a near real-time method for quantifying vegetation using cloud computing technology and remote-sensing data. We developed a novel custom indicator to monitor vegetation on a planetary scale, and then combined this with remote-sensing data for near real-time customized quantification of vegetation change. We demonstrate how new cloud-based geo-computational technology can be used to temporally, geographically and adaptively filter data collections, all while performing calculations on a global scale. Finally, we present a case study how these technologies can help policy makers, project managers and other non-experts to quantify vegetation for various purposes including monitoring and ecosystem valuation, and allow them to use the results for local economic and social progress in a developing nation.
2. Methods
We developed a framework to quantify and monitor vegetation using two common remote-sensing data products that incorporate the Before and After Control Impact (BACI) design [
20]. This approach is used in ecology and environmental studies as an experimental design to evaluate the impact of an environment change on an ecosystem [
21]. The framework is based on repeated measurements of several vegetation variables at various times over an observational period. Measurements were taken at a location which was known to be unaffected by vegetational change (control location) and at another location which potentially would be affected this same change (be explicit) (treatment location) for each timestep [
20]. This approach is applicable for evaluating both natural and man-made changes to an ecosystem especially when it is not possible to randomly select treatment sites [
22]. The framework is based on the Google Earth Engine cloud computing platform, which is a technology that is able to rapidly deliver information derived from remotely sensed imagery in near-real time.
2.1. Data
Vegetation conditions of a landscape were calculated from the Moderate Resolution Imaging Spectroradiometer (MODIS) Enhanced Vegetation Index (EVI) products (
Table 1). The MODIS EVI products used in this study are provided every 16 days at 500 m spatial resolution as a gridded level-3 product. MYD13A1 and MOD13A1 are derived from MODIS Aqua and Terra satellites respectively and thus have a difference in temporal coverage. Both products contain 12 layers, including Normalized Difference Vegetation Index (NDVI), EVI, red reflectance, blue reflectance, Near Infrared (NIR) reflectance, view zenith, solar zenith, relative azimuth angle, Summary QA, detailed QA and day of the year.
The MODIS EVI products minimize canopy background variations and maintain sensitivity over dense vegetation conditions [
23]. The blue band is used to remove residual atmosphere contamination caused by smoke and sub-pixel thin clouds. These products are computed from atmospherically corrected bi-directional surface reflectance that has been masked for water, clouds, heavy aerosols, and cloud shadows [
24]. Many studies have been conducted which compare the relationship of MODIS EVI to biophysical conditions and Gross Primary Productivity of an ecosystem (e.g., [
25,
26,
27]) making it a suitable remote sensing product for monitoring biophysical variables.
2.2. Vegetation Cover
To quantify changes in vegetation we adopted a climatological change approach. A user-defined baseline is calculated for a specified region and time period. The baseline defines the initial condition of the selected area. The baseline is calculated for pixels on a monthly timescale using all images in the baseline time-series. Equation (
1) shows that the average monthly baseline (
EVI) is calculated from the monthly
EVI maps (
EVI). The user specified study period is calculated from changes from the baseline, as shown in Equation (
2), where
EVI is the monthly averaged
EVI map. Equation (
3) is applied to calculate the cumulative sum at time
t iteratively over the time-series.
Both EVI products, namely, MYD13A1 and MOD13A1 are merged into one image collection. A time filter is then applied to create two image collections; one for the baseline period and one for the study period.
Box 1 shows the JavaScript code to calculate the monthly EVI anomaly (Equations (
1) and (
2)). The monthly means of the baseline are calculated and subtracted from the monthly mean in the study period. The map function is used to apply the calculation to each month in the study period. These calculations are executed in parallel on the cloud-computing platform.
The calculation of the cumulative anomaly is computationally most expensive. First, a list with one image containing zeros is created (see
box 2). Next, an image of the sorted (date) image collection of the anomaly is added to the last image in the newly created list. The iterate function is used to apply the function (box below) to each image in the collection. The iteration on a sorted image collection makes the calculation computational more intensive, as the results are dependent on results of the previous calculation.
2.3. Computational Platform
Recent technological advances have greatly enhanced computational capabilities and facilitated increased access to the public. In this regard, Google Earth Engine (GEE) is an online service that applies state-of-the-art cloud computing and storage frameworks to geospatial datasets. The archive contains a large catalog of earth observation data which enables the scientific community to perform calculations on large numbers of images in parallel. The capabilities of GEE as a platform which can deliver at a planetary scale are detailed in Gorelick, et al [
28]. Various studies have been carried out using the GEE at a variety of scales for different purposes (see e.g., [
29,
30,
31]).
Box 1. JavaScript code to calculate the monthly EVI anomaly.
Box 1. JavaScript code to calculate the cumulative anomaly.
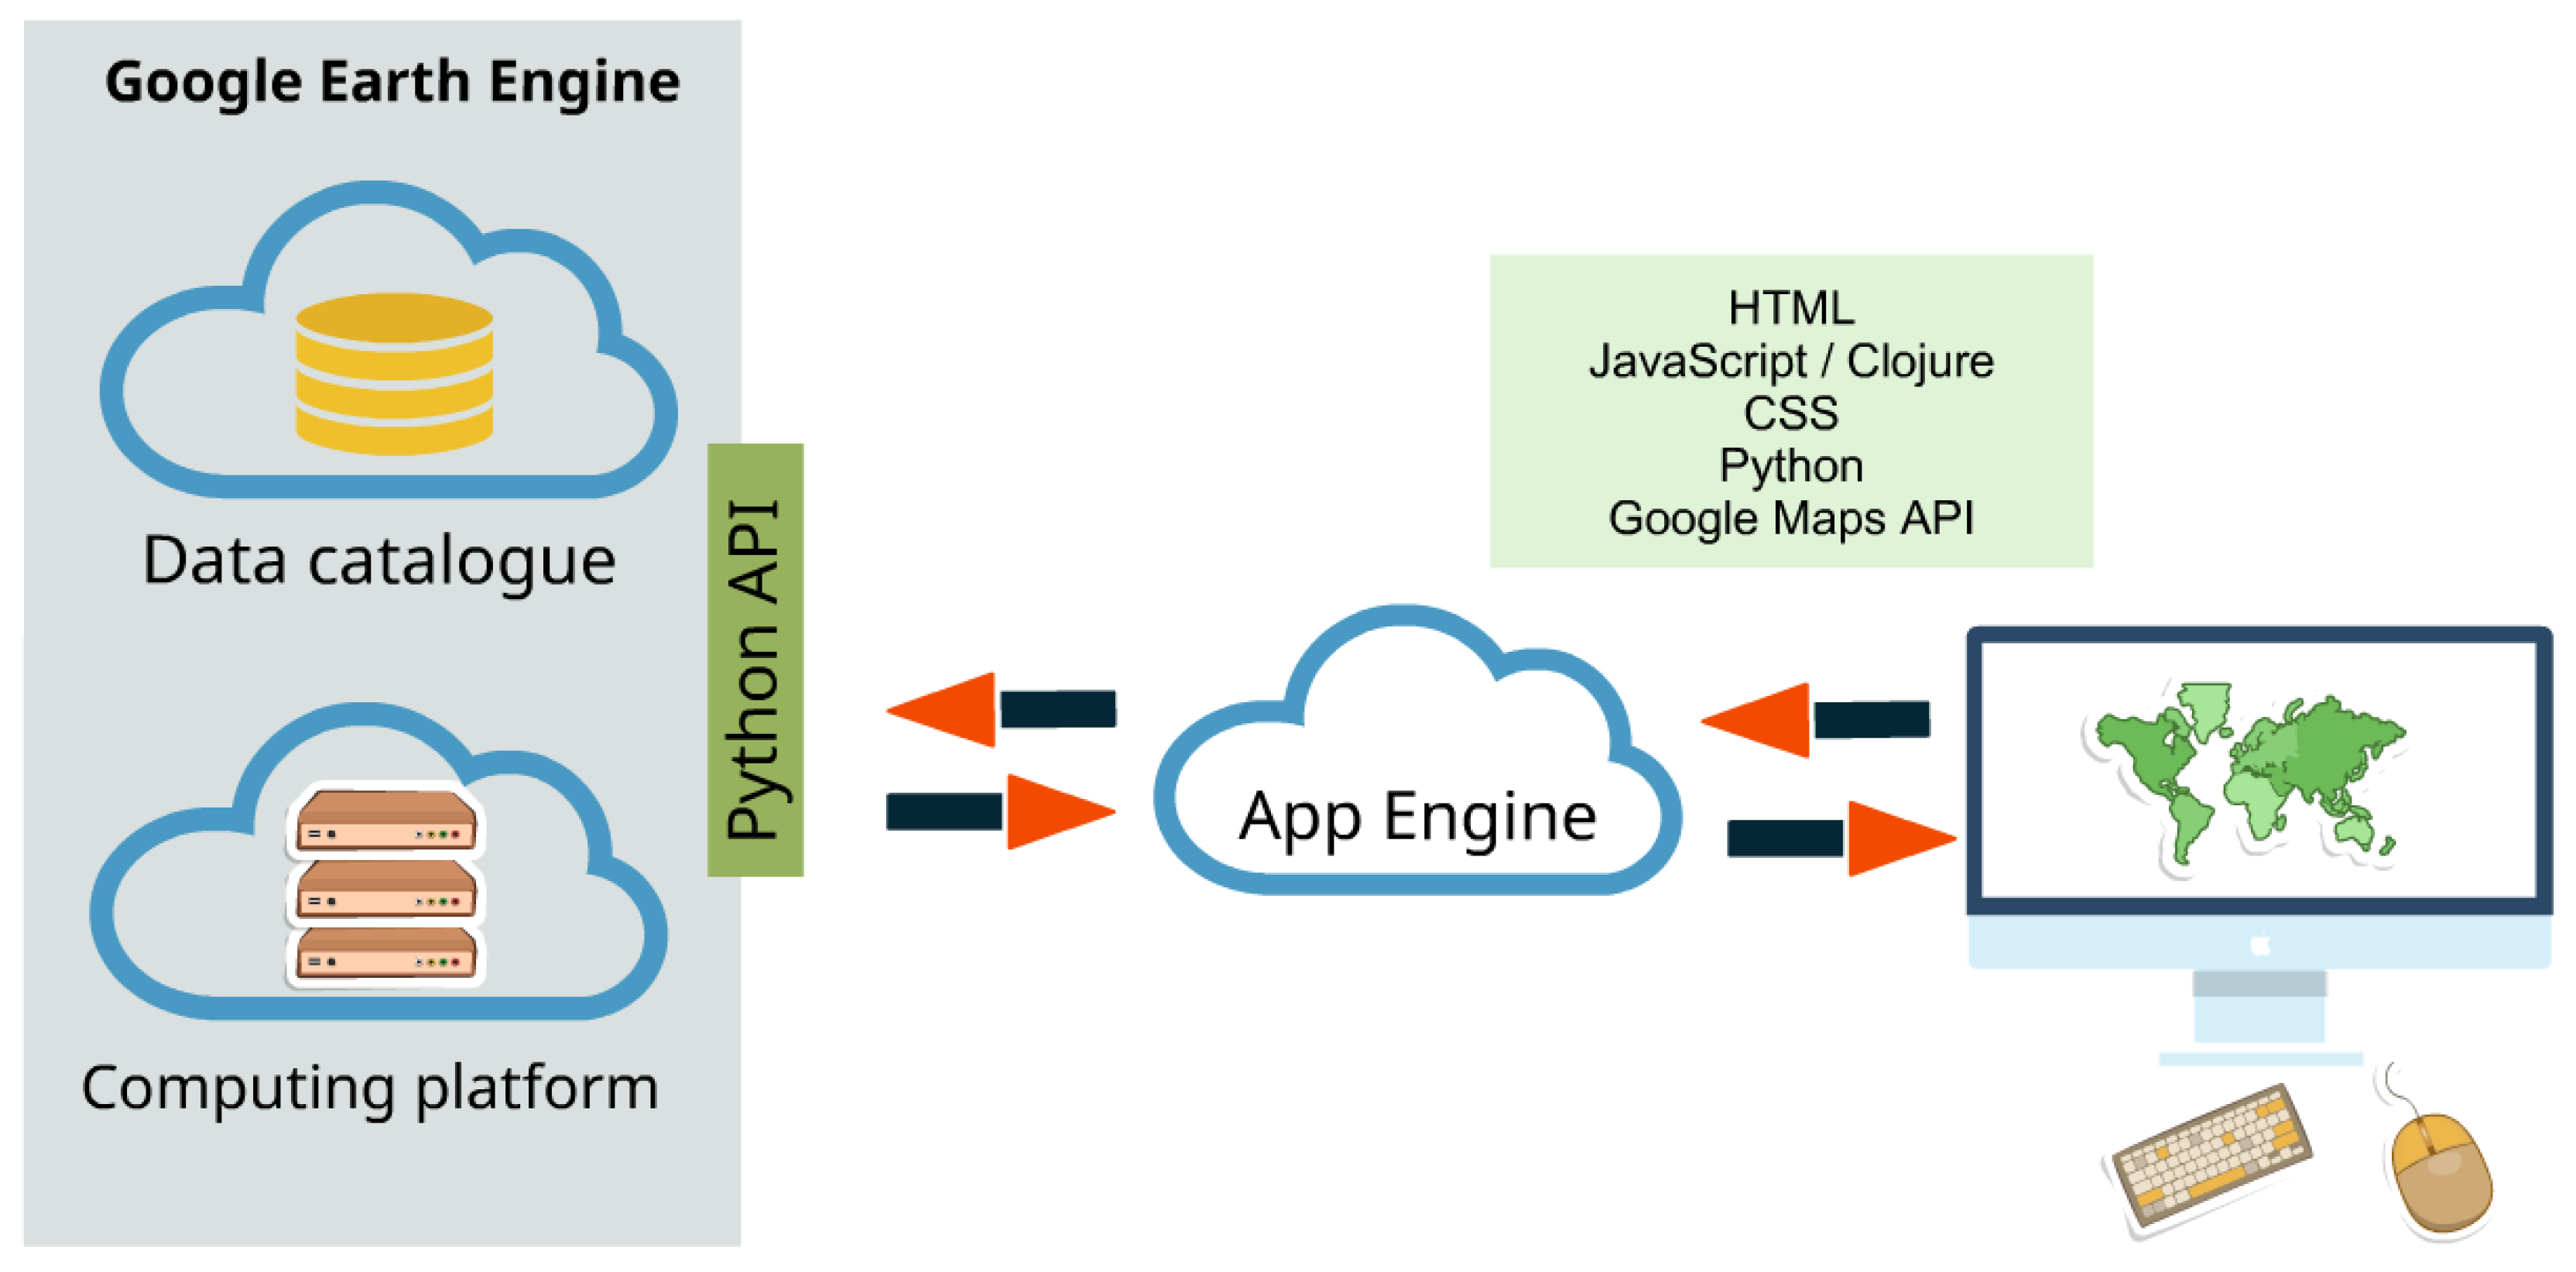
The framework to request data, perform spatial calculations, and serve the information in a browser is shown in
Figure 2. The front-end relies on Google App engine technology. Code developed from either the JavaScript or Python APIs are interpreted by the relevant client library (JavaScript or Python, respectively) and sent to Google as JSON request objects. Results are sent to either the Python command line or the web browser for display and/or further analysis. Spatial information is displayed with the Google Maps API and other information is sent to a console or the Google Visualization API.
3. Results
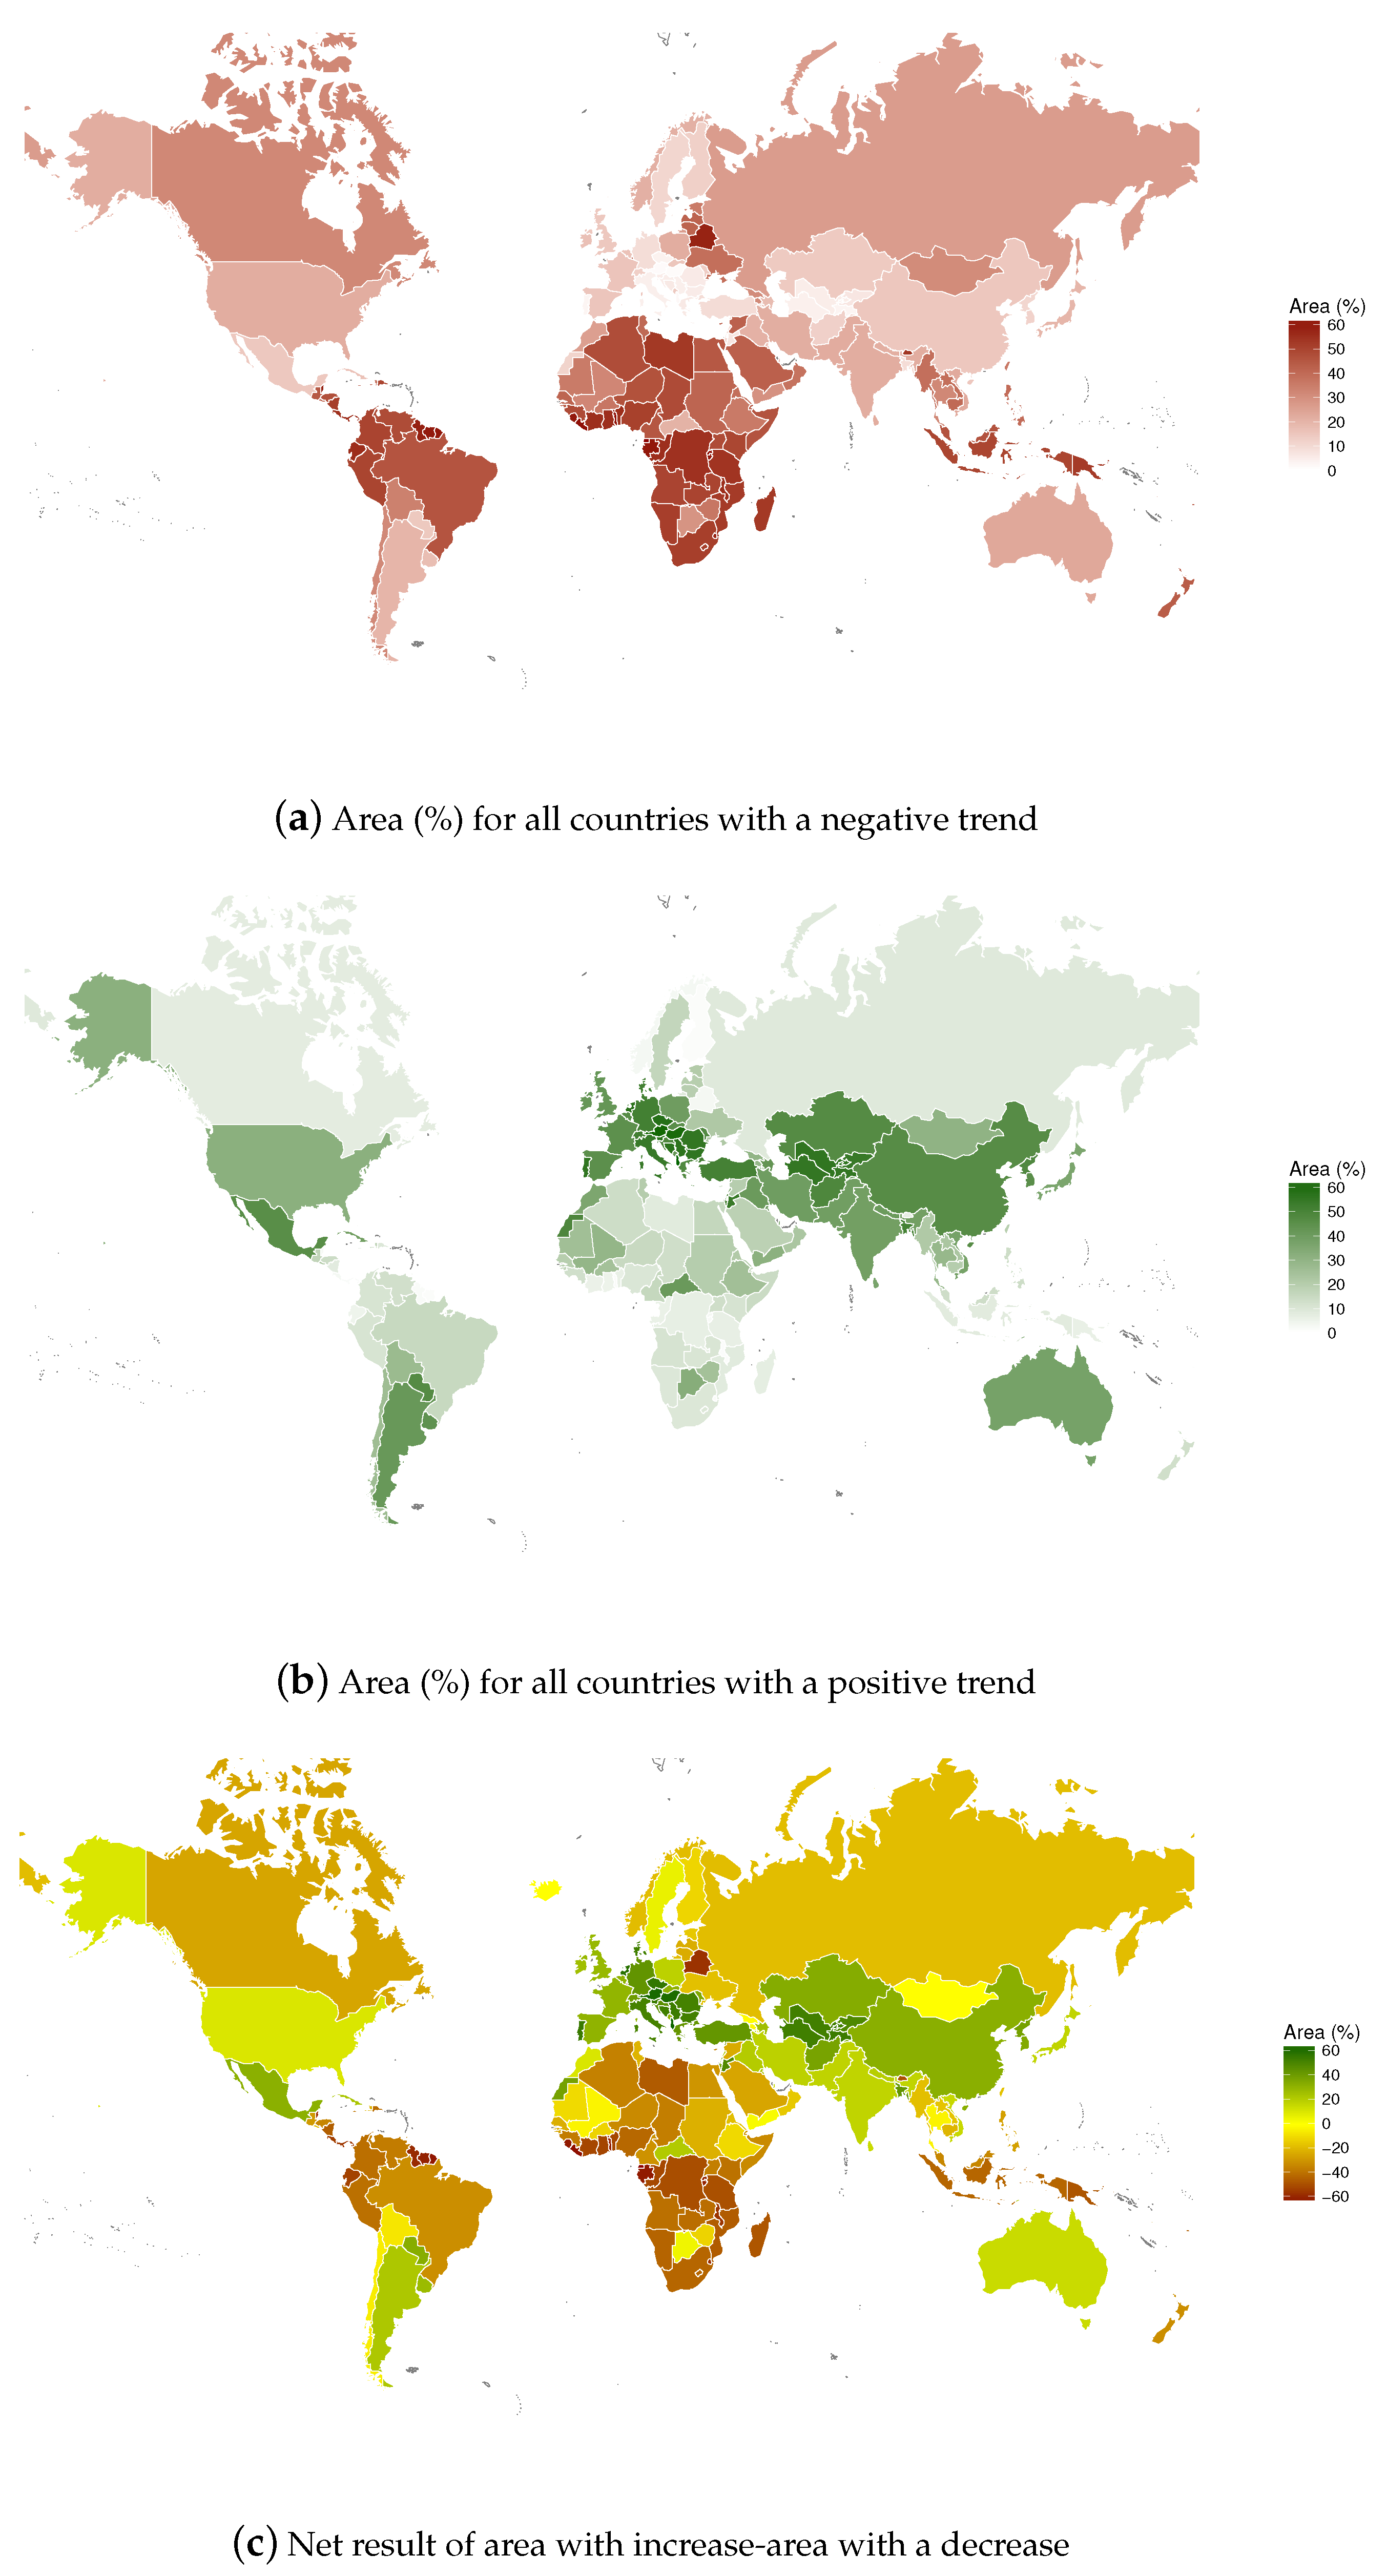
To demonstrate the computational power of cloud-based geo-computational systems, we applied an algorithm on a planetary scale using countries as administrative boundaries. Our algorithm was applied to each country to investigate vegetation from 2015 onwards, using 2002-2015 as a baseline. We defined areas with a negative cumulative EVI anomaly as locations with vegetation loss, whereas positive numbers were associated with increased vegetation. The total area under stress can be seen in
Figure 3a. It was found that countries in Africa, South America and South-East Asia have large areas with negative trends. Countries in Europe only have small areas with a negative trend, with an exception of Belarus and Ukraine. Similarly, we calculated areas which show a positive trend from the baseline on a country scale. It can be seen in
Figure 3b that East Asia, Central Asia, Europe and North America have relatively large areas which show increased vegetation or greening. Also, countries such as Argentina, Paraguay, Uruguay and Australia show notable positive increase in vegetation. On the other hand, Russia, South East Asia and Africa show a low percentage of areas with positive trends.
Vegetation growth is a highly dynamic process in space and time. to estimate the net changes resulting in either growth or decline of each country, we used results of
Figure 3a,b. The final result was obtained by calculating the difference between vegetation growth (positive trend) and vegetation decline (negative trend) over any given area. Negative numbers indicate a net negative trend whereas positive numbers indicates net greening. These results are shown in
Figure 3c. It can be seen that tropical and sub-tropical regions show mostly negative trends. Also, most countries in Africa show negative numbers. Countries in Europe, Central and East Asia mostly have positive trends, which indicates an overall greening of their local environment. Whereas we have a baseline (before) and study period (after) defined no impact and control were defined.
The results in the previous figures are based on administrative country boundaries for the sake of simplicity. However, with the sort of geospatial technology we have used for this study, one can also draw or select custom geographies to investigate trends in cumulative EVI in relation to other geographies. As noted previously, the ultimate goal of this study was to create a user-friendly interface that would enable policy-makers, land use managers and other non-technical practitioners to use advanced monitoring and imaging techniques. Therefore, we developed an Ecological Monitoring Dashboard (global EcoDash;
http://globalecodash.sig-gis.com/; the link and github repository are in
Supplementary Materials), built on the Google App Engine framework, that communicates with Google Earth Engine.
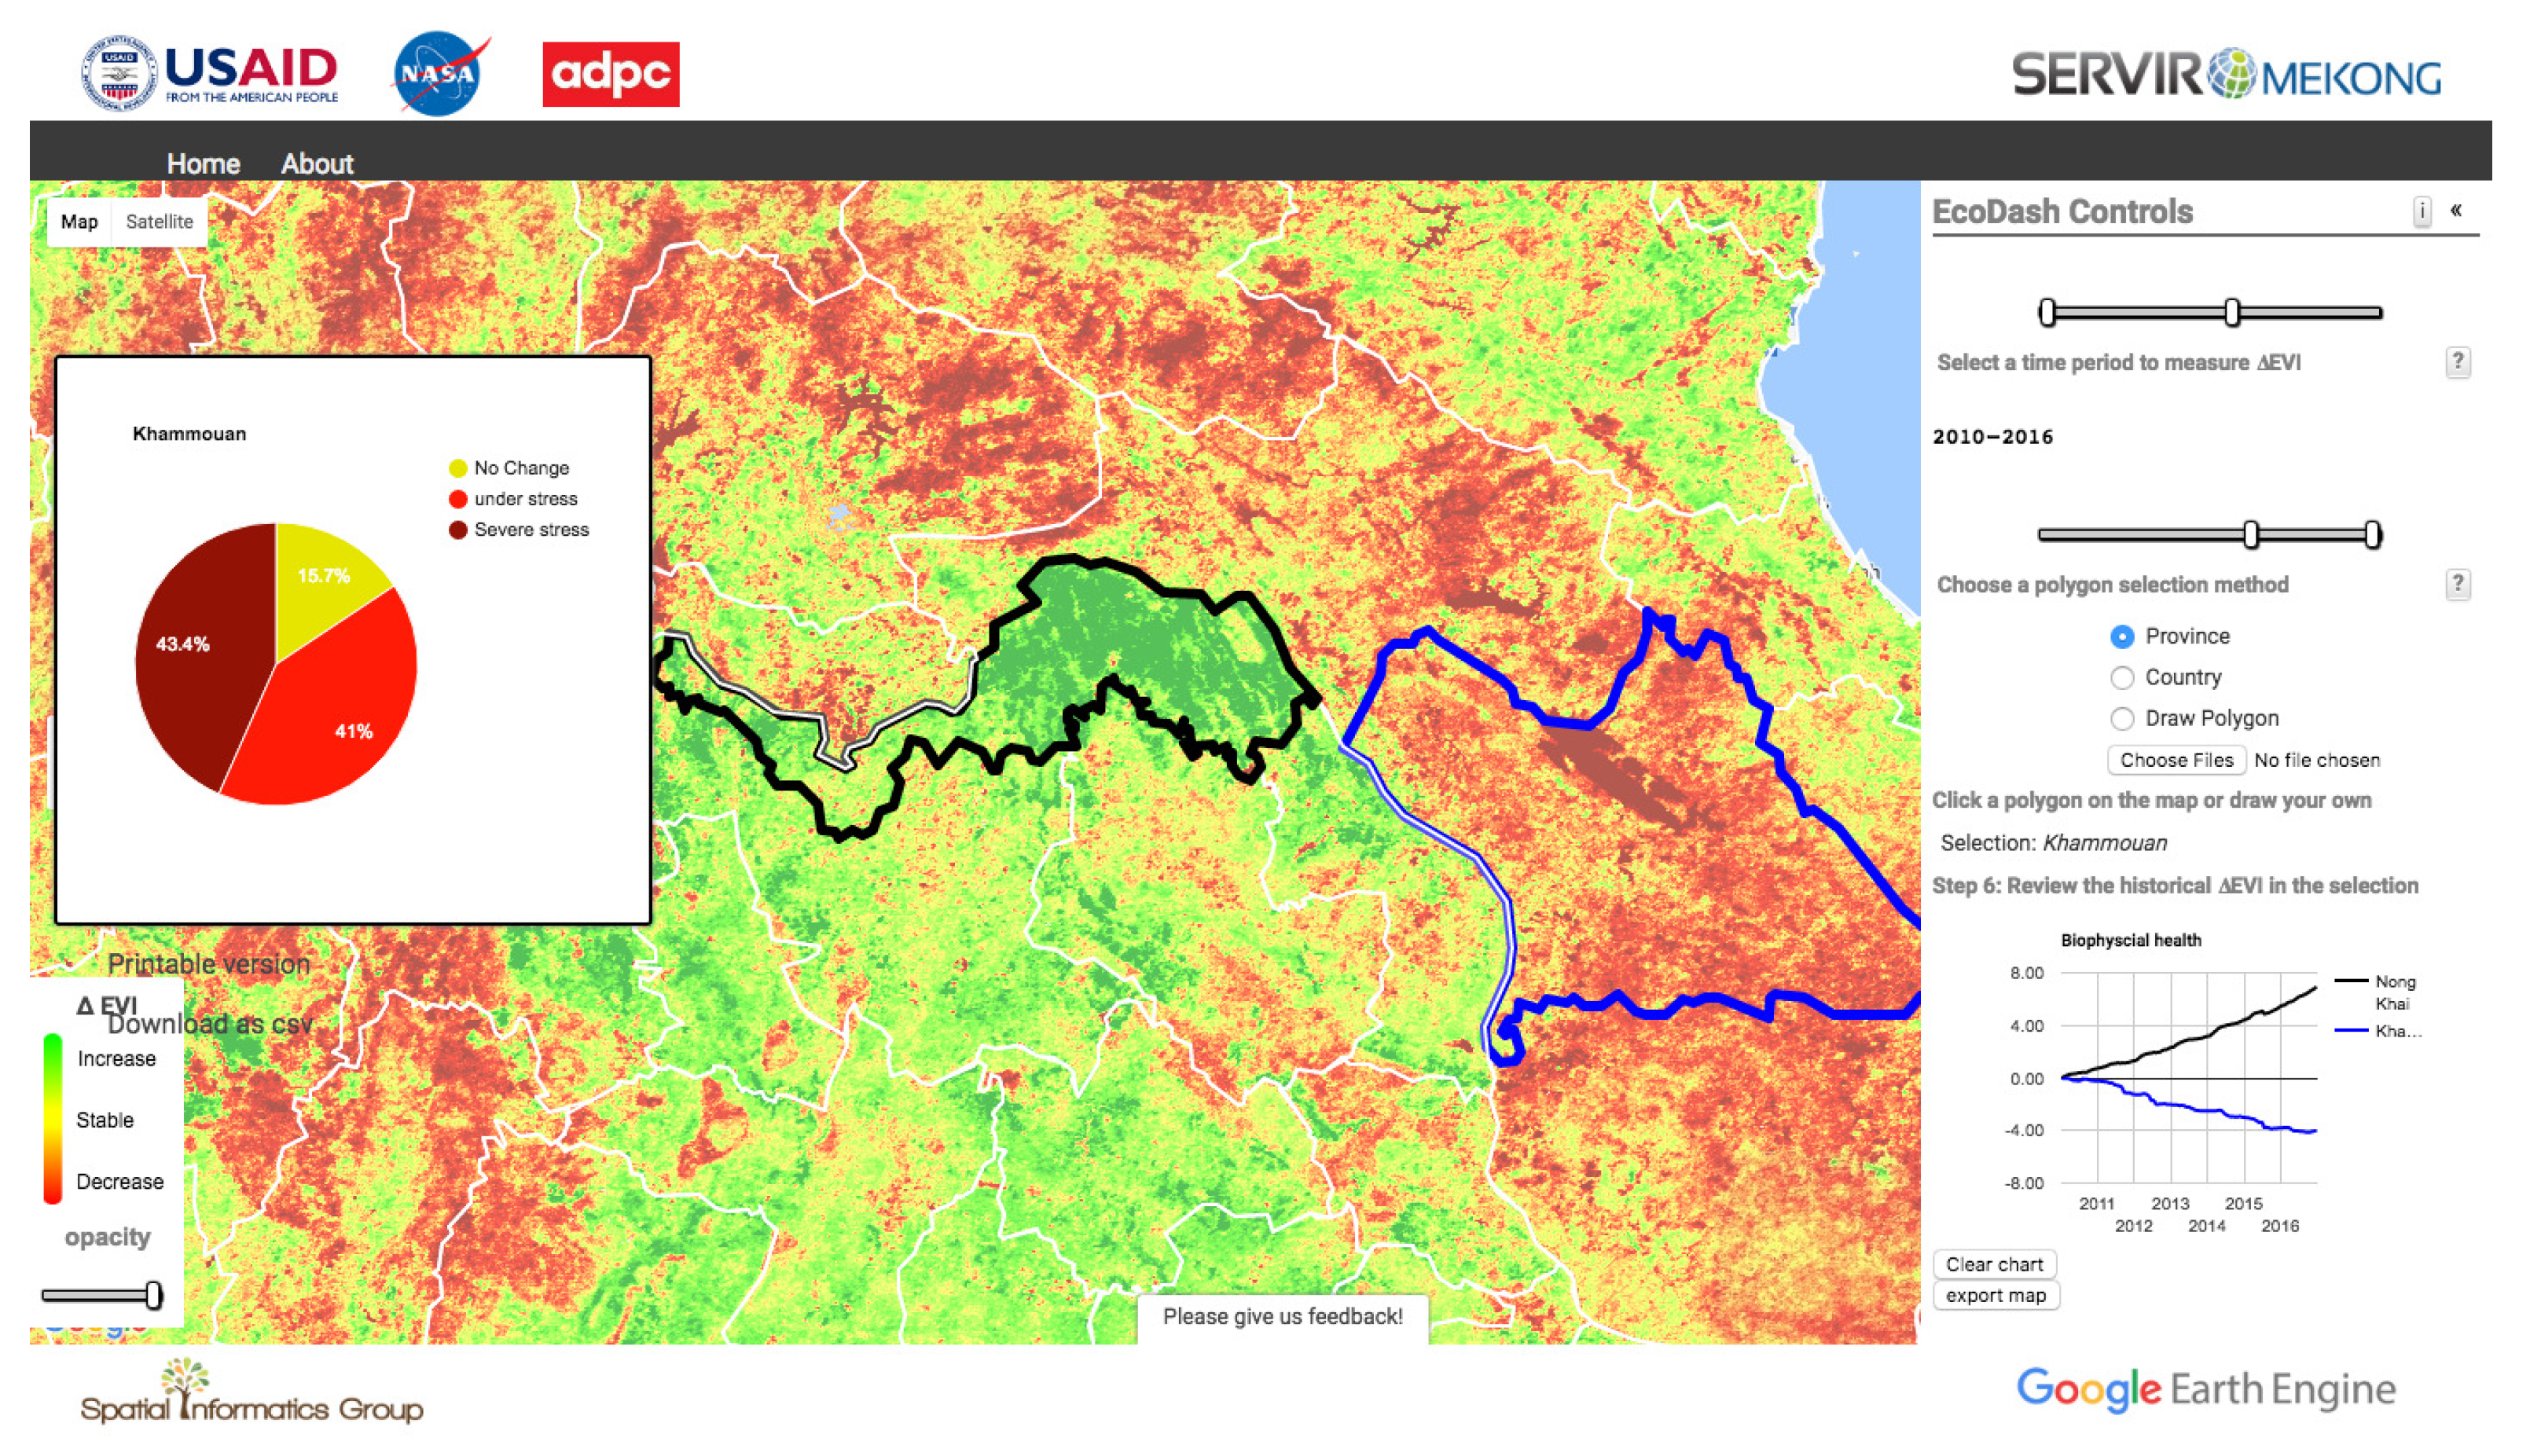
Figure 4 shows the user interface of the EcoDash tool. Users can here define the baseline and analysis time periods, as well as define the geographies they wish to compare or investigate. Users then receive output that includes time series graphs and statistics on the change in bio-physical health for user-defined regions.
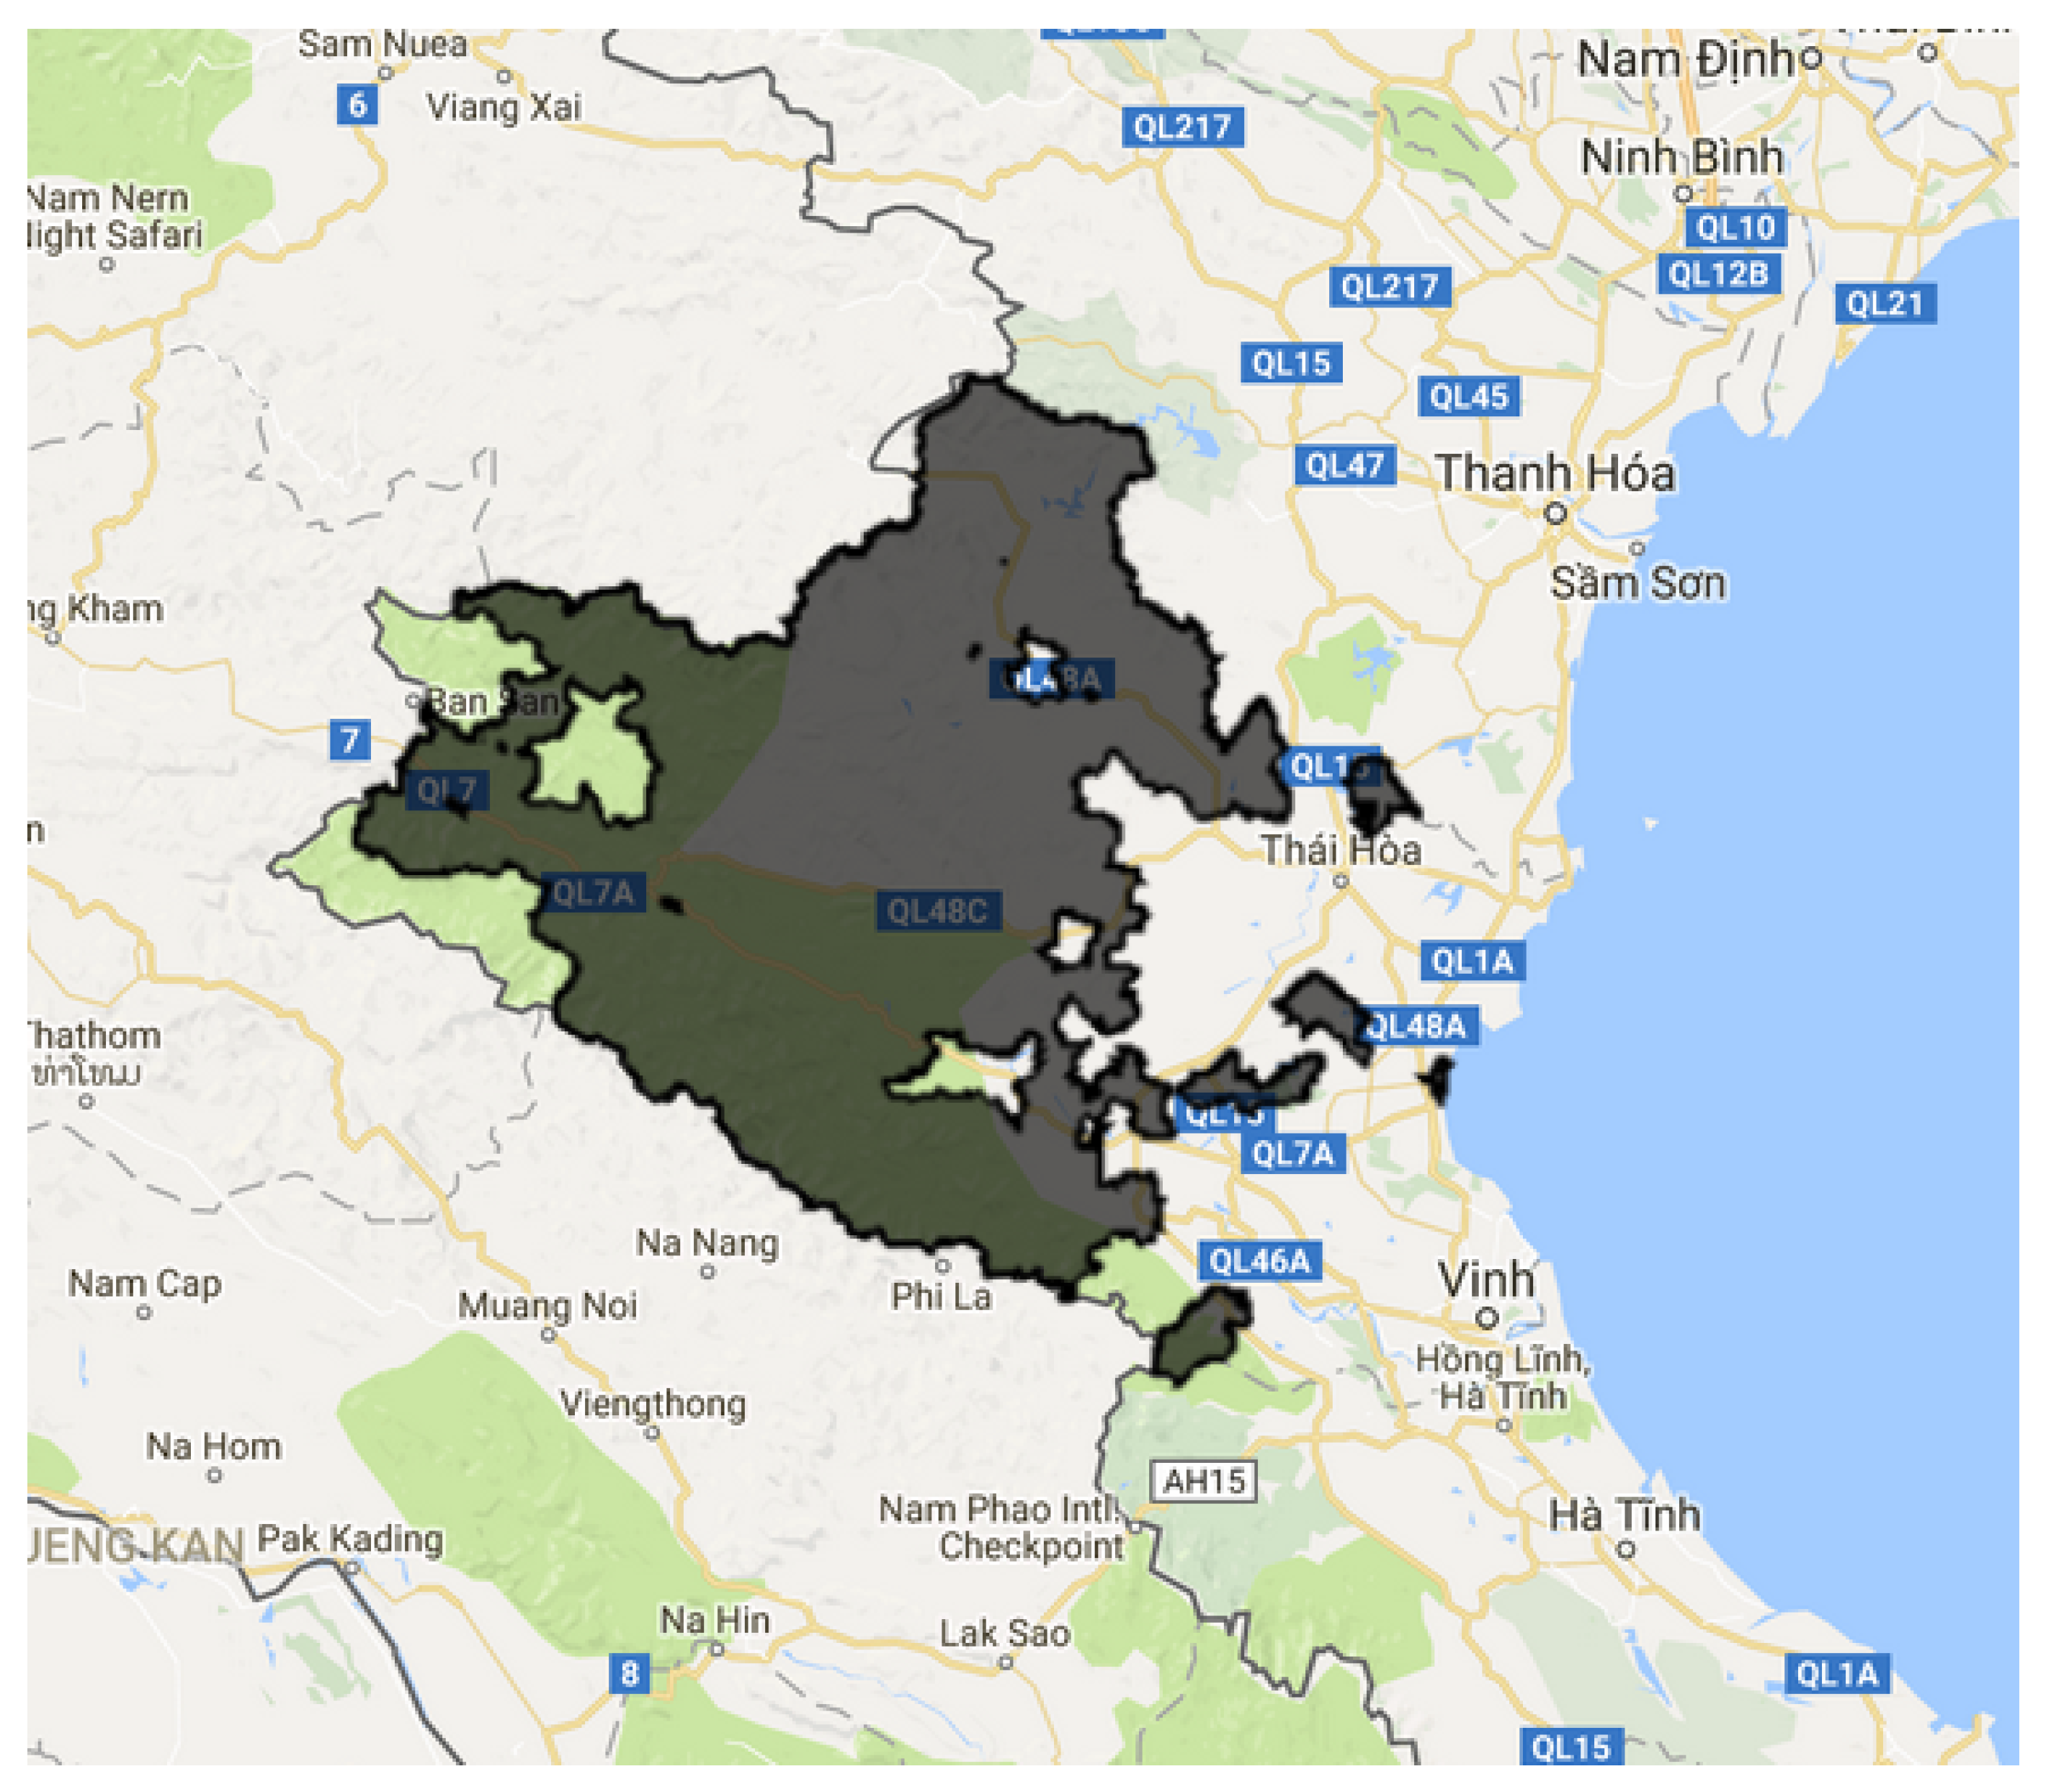
For the final step of this study, EcoDash was applied to demonstrate its usability in a developing country for land monitoring, with the USAID-funded Vietnam Forests and Deltas (VFD) program. Vietnam’s forests remain under development pressure and their deforestation and degradation are a source of emissions, while improved management and restoration programs offers opportunities to sequester carbon and leverage funding to further support management and livelihoods development. The VFD development program is focused on promoting practices which restore degraded landscapes and promote green growth in the forestry and agricultural sectors. The component to support adoption of land use practices and improved and sustainable forest management that slow, stop and reverse emissions from deforestation and degradation of forests and other landscapes, and can leverage mitigation finance opportunities which was started in October 2012 in the Nghe An and Thanh Hoa provinces (
Figure 5). Project impacts should include improved biophysical conditions for the intervention areas, however, no baseline data were available. Then, we used EcoDash to measure and compare EVI indices in order to estimate the impact of the VFD program. We used the period before 2012 as the baseline, and we used the Nghe An and Thanh Hoa provinces as impact areas, and the remainder of Vietnam as control areas.
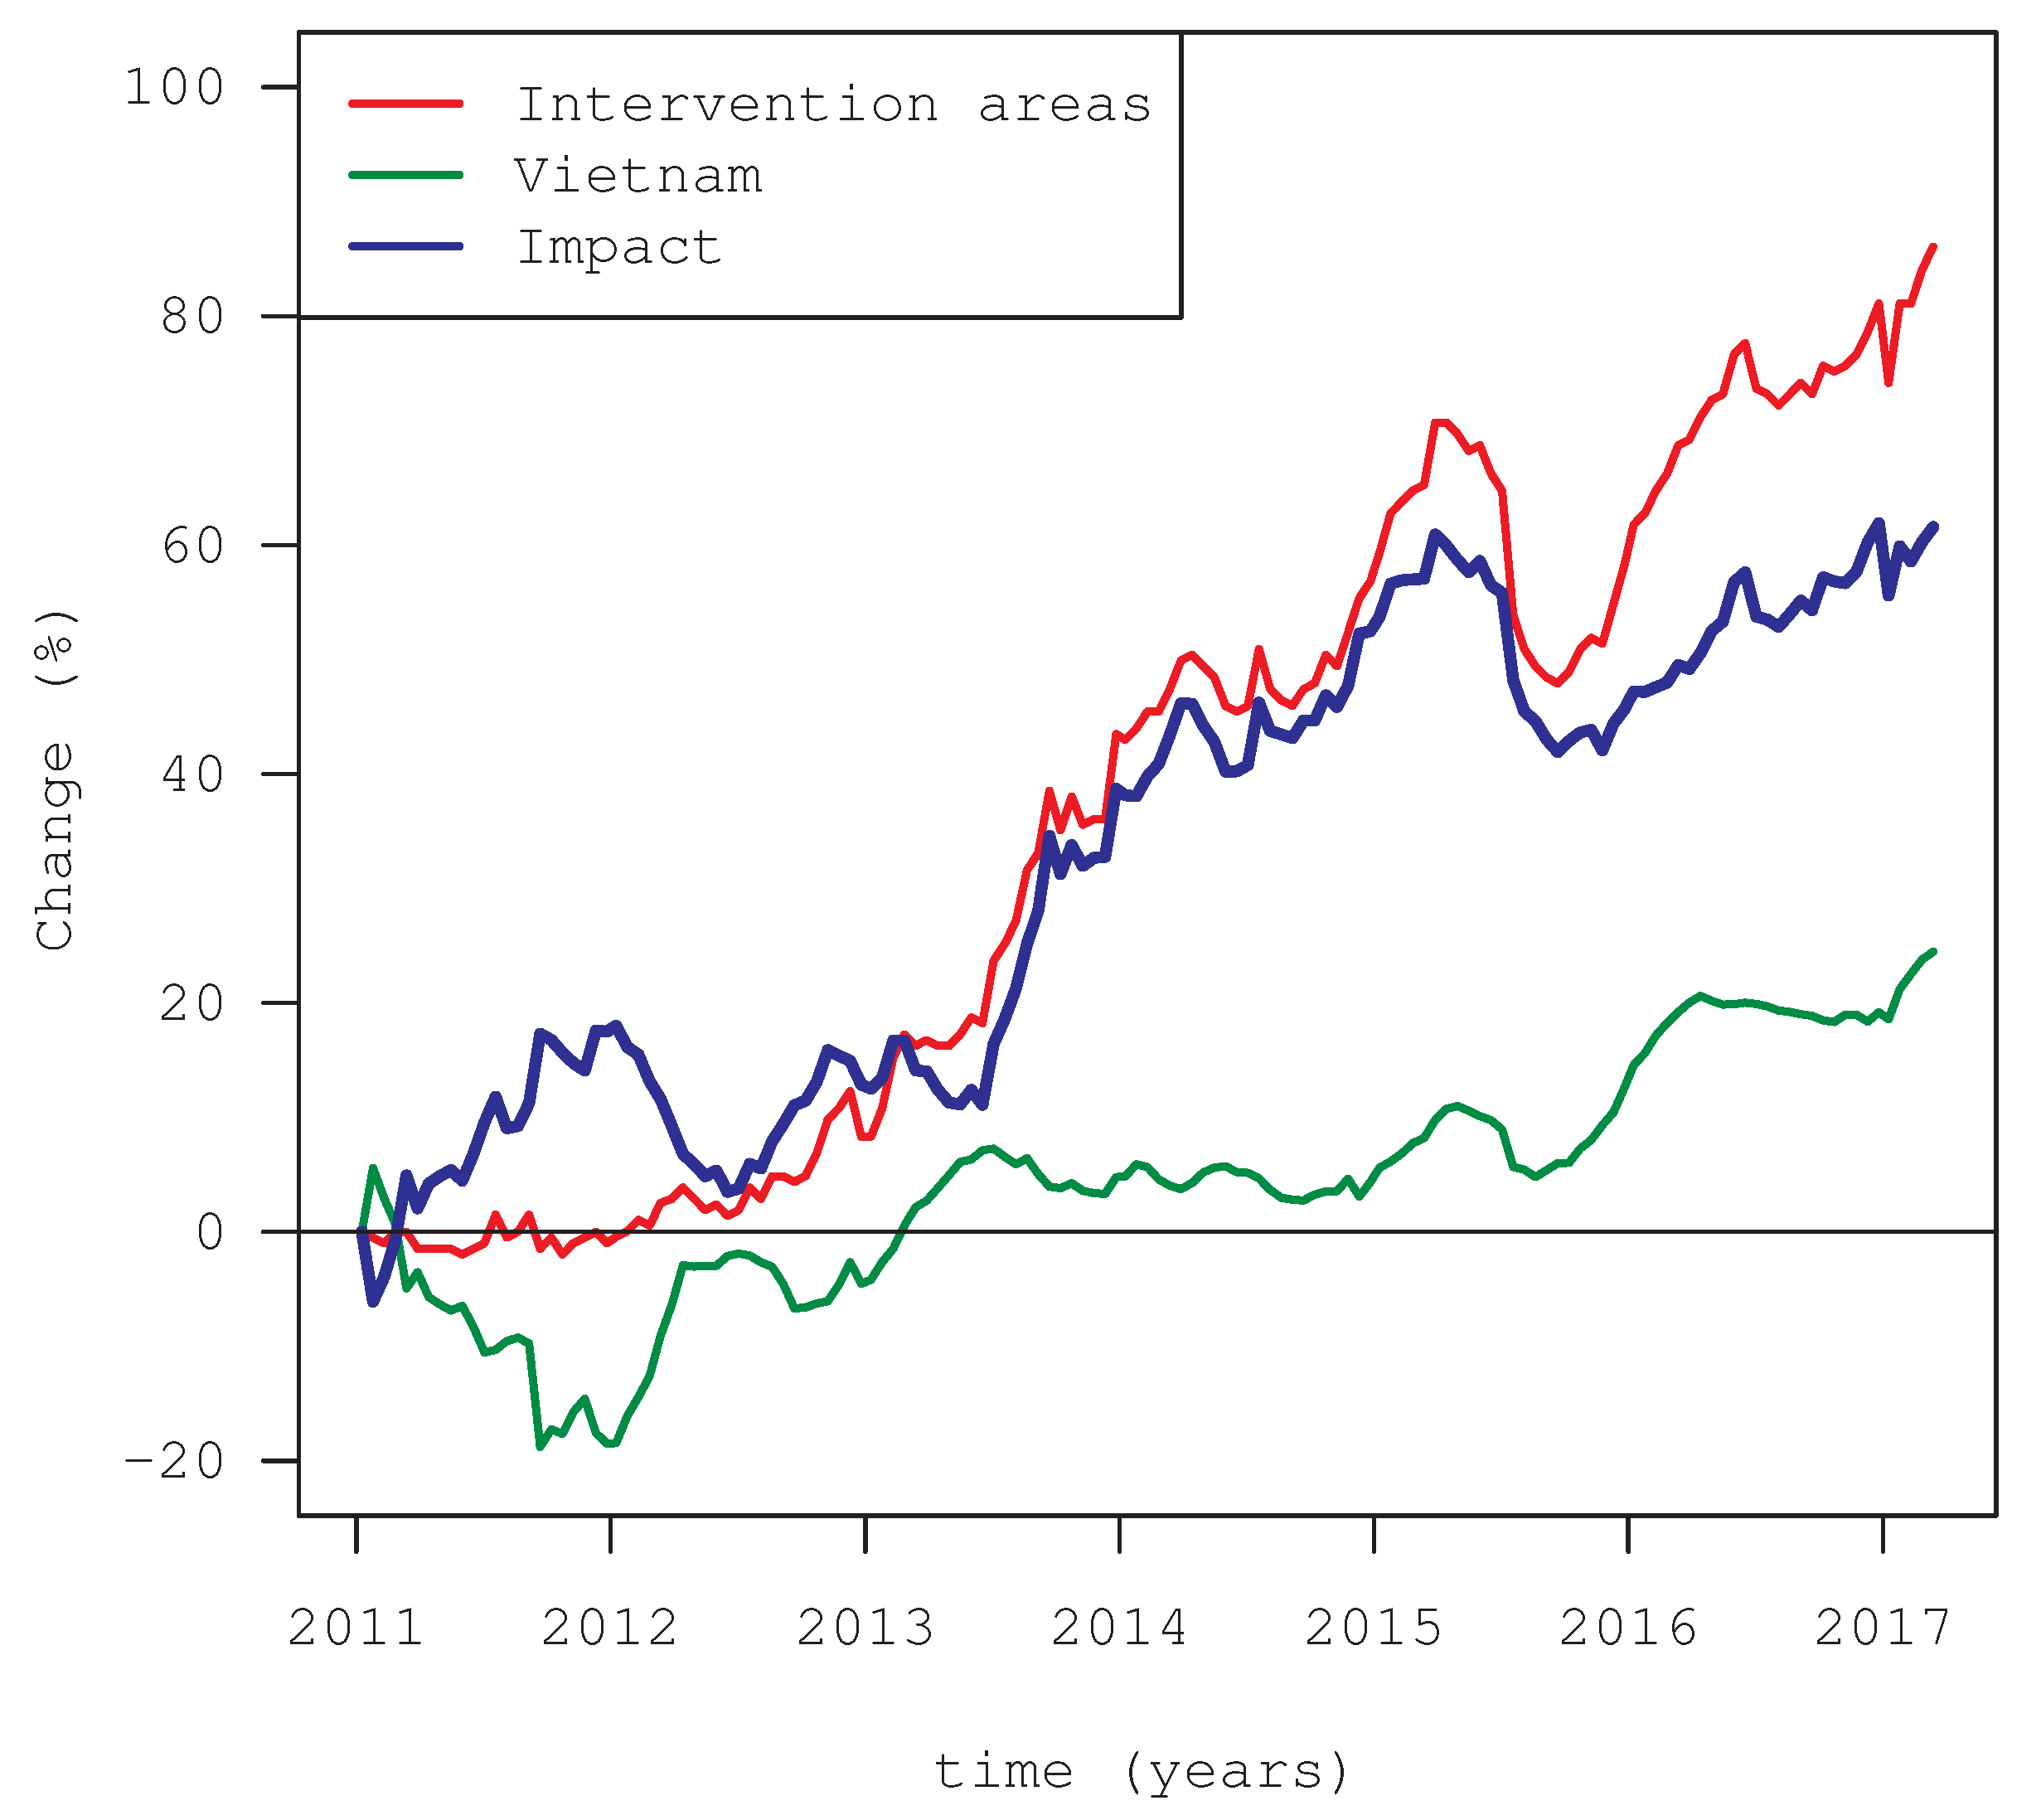
Figure 6 shows the cumulative EVI anomaly for the period 2011–2017 using the previous period as baseline. The green line shows the net change for the whole country (control-after) and the red line for the intervention area (impact -after). The blue line shows the difference between the control and impact topographies/areas. A rapid improvement in vegetation growth can be seen at the onset of the project in the impact areas, whereas negative vegetation growth was found for the control sites.
Figure 6 clearly shows that the impact area under the VFD program experienced increased vegetation growth over the course of the project, as compared to the rest of the provinces in Vietnam, which were under similar environmental conditions such as soil and climate. As of March 2017, 86% of the net area in the intervention zones show increased vegetation cover while the overall increase in vegetation for the rest of Vietnam was only 24%. The 2015 drought event can also be seen in
Figure 6.
4. Discussion
The EcoDash platform for vegetation monitoring at planetary scale enables users to measure the relative change of vegetation in an impact area and compare it with a control area over a period of time. This allows end users to quickly and easily assess impacts of land management projects and enables better future planning based on the effectiveness of the various interventions. EcoDash has limitations that it does not link vegetation dynamics to the biological, climatological, or anthropological drivers behind vegetation change. Ultimately, land use managers and practitioners need data about drivers in order to appropriately plan for remediation, however, that is beyond the scope of this study. Additionally, natural systems are interconnected by feedback between systems [
32] and mapping or measuring such feedback was also beyond the scope of the current study. However, in this study we did attempt to distinguish natural environmental drivers of vegetative change from anthropogenic drivers, by including a user-defined baseline for vegetation cover in a similar climatological and geographical region. The relationship between vegetation growth and ecological feedback loops can be inferred by the users on a case-by-case basis as each ecosystem/region will have varying drivers and feedbacks.
EcoDash and its underlying platform are also limited by the relatively coarse spatial resolution of the products. The spatial resolution for this study was 500 m square image segments. This sort of resolution is cheaper and easier to produce than finer resolution images/senses, and is adequate for end users who want to measure large scale temporal change quickly and cost-effectively. However, it must be noted that many projects related to landscape protection or payment for ecosystem services may require a higher spatial resolution. The Landsat satellite can provide higher spatial resolution products, but at the cost of offering a lower temporal resolution. Users could misinterpret the significance of vegetation change by blindly comparing control and impact areas that are not biophysically similar. Others have begun to addressed such misinterpretations from econometric and geospatial perspectives, but further investment is required to globally scale their methods and to transition data processing to the cloud for global access [
33]. The new Sentinel-2 satellite also offers higher spatial resolution data. However, Sentinel also tends to provide lower temporal resolution data; therefore, even using data from both of these systems together means that there may be data scarcity in regions with high cloud cover, as clouds impede a clear view on the vegetation.
All results in this study were computed from satellite data. Therefore, these methods are highly suitable for areas where on-the-ground data is scarce due to financial limitations and/or inaccessible terrains. The method described here is also transparent, repeatable and suitable for near real-time monitoring. Practitioners using such methods need to be aware that satellite measurements can be affected by atmospheric conditions, errors related to the angle of the sun or sensor characteristics. Therefore, field validation of results will should always be implemented, where possible, in order to corroborate and refine results, allowing practitioners to present a more comprehensive picture of ecological change in their study areas. Finally, it should be noted that the current computational framework is highly effective for pixel-to-pixel calculations, but less suitable in situations where pixels in a single map have dependencies.
5. Conclusions
Forest ecosystems are vital for the overall well-being of our planet, as they provide habitat that maintains biodiversity, they sequester carbon, and they contribute to clean air and water in local communities, and worldwide. Monitoring changes in vegetation and forest cover is a necessary task for conscientious land managers in the wake of extensive deforestation, urban growth and other land use change. Monitoring changes in vegetative cover is also important in the context of various international initiatives, such as REDD+, which allow developing countries to finance other areas of economic growth in exchange for land preservation and the concomitant carbon sequestration and reduction in GHG emissions. Using an interface like EcoDash, previously difficult-to-access earth observations can now be leveraged by non-technical end users using cloud-based computing platforms such as the Google Earth Engine, which provides free access and ease-of-use across a vast diversity of users.
In this study, we demonstrated the practical application of this BACI technical framework and EcoDash user interface both across the globe, and more specifically for the case of the VFD program for the Nghe An and Thanh Hoa provinces in Vietnam.
This framework is therefore usable across a planetary scale, and with EcoDash applied on top of this framework, it is cost-effective and simple to use. This makes it an ideal tool for land use managers, conservationists, and development organizations worldwide who need inexpensive and quick methods to assess progress and results of environmental interventions. Ideally, future technologies will be able to provide higher resolution imagery and sensing so that this framework can be used in applications that require more fine scale data. Additionally, future sensing and computing technologies will also be able to help practitioners determine drivers of change, as well as feedback loops between ecosystems. However, this is an extremely complex topic that will not be easy to solve in the near term. Regardless, the availability of earth observations and cloud computing platforms are ushering in a new era of ways in which environmental impacts and interventions can be cheaply and quickly monitored across vast areas, which should be a boon to development professionals, land managers, urban planners, and other similar practitioners worldwide.
Author Contributions
D.S., N.C., M.F. and A.P. designed the methodology; A.P., N.C., D.S., P.C., F.C. and K.N.M. performed the data analysis; E.R.A., A.T., H.T.L., B.B., Q.N., B.B., G.J. and P.T. contributed to the methodology, analysis tools, website and paper.
Acknowledgments
Support for this work was provided through the joint US Agency for International Development (USAID) and National Aeronautics and Space Administration (NASA) initiative SERVIR, partially through the NASA Applied Sciences Capacity Building Program, NASA Cooperative Agreement NNM11AA01A.
Conflicts of Interest
The authors declare no conflict of interest.
References
- Farber, S.; Costanza, R.; Childers, D.L.; Erickson, J.; Gross, K.; Grove, M.; Hopkinson, C.S.; Kahn, J.; Pincetl, S.; Troy, A. Linking ecology and economics for ecosystem management. Bioscience 2006, 56, 121–133. [Google Scholar] [CrossRef]
- Wilson, M.A.; Troy, A.; Costanza, R. The economic geography of ecosystem goods and services. In Cultural Landscapes and Land Use; Springer: Heidelberg/Berlin, Germany, 2004; pp. 69–94. [Google Scholar]
- Simons, G.; Poortinga, A.; Bastiaanssen, W.; Saah, D.; Troy, D.; Hunink, J.; de Klerk, M.; Rutten, M.; Cutter, P.; Rebelo, L.M.; et al. On Spatially Distributed Hydrological Ecosystem Services: Bridging the Quantitative Information Gap using Remote Sensing and Hydrological Models; FutureWater: Wageningen, The Netherlands, 2017; 45p. [Google Scholar] [CrossRef]
- Costanza, R.; d’Arge, R.; De Groot, R.; Farber, S.; Grasso, M.; Hannon, B.; Limburg, K.; Naeem, S.; O’neill, R.V.; Paruelo, J. The value of the world’s ecosystem services and natural capital. Ecol. Econ. 1998, 25, 3–16. [Google Scholar] [CrossRef]
- Poortinga, A.; Bastiaanssen, W.; Simons, G.; Saah, D.; Senay, G.; Fenn, M.; Bean, B.; Kadyszewski, J. A Self-Calibrating Runoff and Streamflow Remote Sensing Model for Ungauged Basins Using Open-Access Earth Observation Data. Remote Sens. 2017, 9, 86. [Google Scholar] [CrossRef]
- Bui, Y.T.; Orange, D.; Visser, S.; Hoanh, C.T.; Laissus, M.; Poortinga, A.; Tran, D.T.; Stroosnijder, L. Lumped surface and sub-surface runoff for erosion modeling within a small hilly watershed in northern Vietnam. Hydrol. Process. 2014, 28, 2961–2974. [Google Scholar] [CrossRef]
- Wallace, K.J. Classification of ecosystem services: Problems and solutions. Biol. Conserv. 2007, 139, 235–246. [Google Scholar] [CrossRef]
- Markert, K.N.; Griffin, R.E.; Limaye, A.S.; McNider, R.T. Spatial Modeling of Land Cover/Land Use Change and Its Effects on Hydrology Within the Lower Mekong Basin. In Land Atmospheric Research Applications in Asia; Vadrevu, K.P., Ohara, T., Justice, C., Eds.; Springer: Heidelberg/Berlin, Germany, 2018; pp. 667–698. [Google Scholar]
- Suhardiman, D.; Wichelns, D.; Lestrelin, G.; Hoanh, C.T. Payments for ecosystem services in Vietnam: Market-based incentives or state control of resources? Ecosyst. Serv. 2013, 6, 64–71. [Google Scholar] [CrossRef]
- Smith, E.P.; Orvos, D.R.; Cairns, J., Jr. Impact assessment using the before-after-control-impact (BACI) model: Concerns and comments. Can. J. Fish. Aquat. Sci. 1993, 50, 627–637. [Google Scholar] [CrossRef]
- Conquest, L.L. Analysis and interpretation of ecological field data using BACI designs: Discussion. J. Agric. Biol. Environ. Stat. 2000, 5, 293–296. [Google Scholar] [CrossRef]
- Underwood, A. Beyond BACI: The detection of environmental impacts on populations in the real, but variable, world. J. Exp. Mar. Biol. Ecol. 1992, 161, 145–178. [Google Scholar] [CrossRef]
- Moland, E.; Olsen, E.M.; Knutsen, H.; Garrigou, P.; Espeland, S.H.; Kleiven, A.R.; André, C.; Knutsen, J.A. Lobster and cod benefit from small-scale northern marine protected areas: Inference from an empirical before–after control-impact study. Proc. R. Soc. B R. Soc. 2013, 80, 20122679. [Google Scholar] [CrossRef] [PubMed] [Green Version]
- Rochlin, I.; Iwanejko, T.; Dempsey, M.E.; Ninivaggi, D.V. Geostatistical evaluation of integrated marsh management impact on mosquito vectors using before-after-control-impact (BACI) design. Int. J. Health Geogr. 2009, 8, 35. [Google Scholar] [CrossRef] [PubMed]
- Hawkins, S.; Gibbs, P.; Pope, N.; Burt, G.; Chesman, B.; Bray, S.; Proud, S.; Spence, S.; Southward, A.; Langston, W. Recovery of polluted ecosystems: The case for long-term studies. Mar. Environ. Res. 2002, 54, 215–222. [Google Scholar] [CrossRef]
- Center for International Forestry Research. REDD Subnational Initiatives; Center for International Forestry Research: Bogor, Indonesia, 2018. [Google Scholar]
- Stürck, J.; Poortinga, A.; Verburg, P.H. Mapping ecosystem services: The supply and demand of flood regulation services in Europe. Ecol. Ind. 2014, 38, 198–211. [Google Scholar] [CrossRef]
- Troy, A.; Wilson, M.A. Mapping ecosystem services: Practical challenges and opportunities in linking GIS and value transfer. Ecol. Econ. 2006, 60, 435–449. [Google Scholar] [CrossRef]
- Keenan, R.J.; Reams, G.A.; Achard, F.; de Freitas, J.V.; Grainger, A.; Lindquist, E. Dynamics of global forest area: Results from the FAO Global Forest Resources Assessment 2015. For. Ecol. Manag. 2015, 352, 9–20. [Google Scholar] [CrossRef]
- Upton, G.; Cook, I. A Dictionary of Statistics 3e; Oxford University Press: Oxford, UK, 2014. [Google Scholar]
- Carpenter, S.R.; Frost, T.M.; Heisey, D.; Kratz, T.K. Randomized intervention analysis and the interpretation of whole-ecosystem experiments. Ecology 1989, 70, 1142–1152. [Google Scholar] [CrossRef]
- Conner, M.M.; Saunders, W.C.; Bouwes, N.; Jordan, C. Evaluating impacts using a BACI design, ratios, and a Bayesian approach with a focus on restoration. Environ. Monit. Assess. 2016, 188, 555. [Google Scholar] [CrossRef] [PubMed]
- Huete, A.; Didan, K.; Miura, T.; Rodriguez, E.P.; Gao, X.; Ferreira, L. Overview of the radiometric and biophysical performance of the MODIS vegetation indices. Remote Sens. Environ. 2002, 83, 195–213. [Google Scholar] [CrossRef]
- Didan, K.; Huete, A. MODIS Vegetation Index Product Series Collection 5 Change Summary; TBRS Lab, The University of Arizona: Tucson, AZ, USA, 2006. [Google Scholar]
- Rahman, A.F.; Cordova, V.D.; Gamon, J.A.; Schmid, H.P.; Sims, D.A. Potential of MODIS ocean bands for estimating CO2 flux from terrestrial vegetation: A novel approach. Geophys. Res. Lett. 2004, 31, L10503. [Google Scholar] [CrossRef]
- Xiao, X.; Hollinger, D.; Aber, J.; Gholtz, M.; Davidson, E.A.; Zhang, Q.; Moore, B., III. Satellite-based modeling of gross primary production in an evergreen needleleaf forest. Remote Sens. Environ. 2004, 89, 519–534. [Google Scholar] [CrossRef]
- Xiao, X.; Zhang, Q.; Braswell, B.; Urbanski, S.; Boles, S.; Wofsy, S.; Moore, B.; Ojima, D. Modeling gross primary production of temperate deciduous broadleaf forest using satellite images and climate data. Remote Sens. Environ. 2004, 91, 256–270. [Google Scholar] [CrossRef]
- Gorelick, N.; Hancher, M.; Dixon, M.; Ilyushchenko, S.; Thau, D.; Moore, R. Google Earth Engine: Planetary-scale geospatial analysis for everyone. Remote Sens. Environ. 2017, 202, 18–27. [Google Scholar] [CrossRef]
- Klein, T.; Nilsson, M.; Persson, A.; Håkansson, B. From Open Data to Open Analyses—New Opportunities for Environmental Applications? Environments 2017, 4, 32. [Google Scholar] [CrossRef]
- Chen, B.; Xiao, X.; Li, X.; Pan, L.; Doughty, R.; Ma, J.; Dong, J.; Qin, Y.; Zhao, B.; Wu, Z. A mangrove forest map of China in 2015: Analysis of time series Landsat 7/8 and Sentinel-1A imagery in Google Earth Engine cloud computing platform. ISPRS J. Photogramm. Remote Sens. 2017, 131, 104–120. [Google Scholar] [CrossRef]
- Deines, J.M.; Kendall, A.D.; Hyndman, D.W. Annual Irrigation Dynamics in the US Northern High Plains Derived from Landsat Satellite Data. Geophys. Res. Lett. 2017, 44, 9350–9360. [Google Scholar] [CrossRef]
- Bennett, E.M.; Peterson, G.D.; Gordon, L.J. Understanding relationships among multiple ecosystem services. Ecol. Lett. 2009, 12, 1394–1404. [Google Scholar] [CrossRef] [PubMed]
- Blackman, A. Ex-Post Evaluation of Forest Conservation Policies Using Remote Sensing Data: An Introduction and Practical Guide; Technical Report; Inter-American Development Bank: Washington, DC, USA, 2012. [Google Scholar]
© 2018 by the authors. Licensee MDPI, Basel, Switzerland. This article is an open access article distributed under the terms and conditions of the Creative Commons Attribution (CC BY) license (http://creativecommons.org/licenses/by/4.0/).

 ,
, 


