Comparison of SNAP-Derived Sentinel-2A L2A Product to ESA Product over Europe

Canada Centre for Remote Sensing, Natural Resources Canada, 560 Rochester Street, Ottawa, ON K1A 0E4, Canada
*
Authors to whom correspondence should be addressed.
Remote Sens. 2018, 10(6), 926; https://0-doi-org.brum.beds.ac.uk/10.3390/rs10060926
Submission received: 17 April 2018
/
Accepted: 6 June 2018
/
Published: 12 June 2018
(This article belongs to the Collection Sentinel-2: Science and Applications)
Abstract
:Sentinel-2 is a constellation of two satellites launched by the European Space Agency (ESA), respectively on 23 June 2015 and 7 March 2017, to map geophysical parameters over land surfaces. ESA provides Level 2 bottom-of-atmosphere reflectance (BOA) products (ESA-L2A) for Europe, with plans for operational global coverage, as well as the Sen2Cor (S2C) offline processor. In this study, aerosol optical thickness (AOT), precipitable water vapour (WVP) and surface reflectance from ESA-L2A products are compared with S2C output when using identical input Level 1 radiance products. Additionally, AOT and WVP are validated against reference measurement. As ESA and S2C share the same input and atmospheric correction algorithm, it was hypothesized that they should show identical validation performance and that differences between products should be negligible in comparison to the uncertainty of retrieved geophysical parameters due to radiometric uncertainty alone. Validation and intercomparison was performed for five clear-sky growing season dates for each of three ESA-L2A tiles selected to span a range of vegetation and topography as well as to be close to the AERONET measurement site. Validation of S2C (ESA) products using AERONET site measurements indicated an overall root mean square error (RMSE) of 0.06 (0.07) and a bias of 0.05 (0.09) for AOT and 0.20 cm (0.22 cm) and the bias was −0.02 cm (−0.10 cm) for WVP. Intercomparison of S2C-L2A and ESA-L2A showed an overall agreement higher than 99% for scene classification (SCL) maps and negligible differences for WVP (RMSE under 0.09 and R2 above 0.99). Larger disagreement was observed for aerosol optical thickness (AOT) (RMSE up to 0.04 and R2 as low as 0.14). For BOA reflectance, disagreement between products depends on vegetation cover density, topography slope and spectral band. The largest differences were observed for red-edge and infrared bands in mountainous vegetated areas (RMSE up to 4.9% reflectance and R2 as low as 0.53). These differences are of similar magnitude to the radiometric calibration requirements for the Sentinel 2 imager. The differences had minimal impact of commonly used vegetation indices (NDVI, NDWI, EVI), but application of the Sentinel Level 2 biophysical processor generally resulted in proportional differences in most derived vegetation parameters. It is recommended that the consistency of ESA and S2C products should be improved by the developers of the ESA and S2C processors.
1. Introduction
Sentinel-2 is a constellation of satellites, Sentinel-2A and Sentinel-2B, launched by the European Space Agency (ESA) on 23 June 2015 and 7 March 2017, respectively. They carry a virtually identical decametric resolution multi-spectral imager (MSI) having four bands at 10 m, six bands at 20 m, and three bands at 60 m spatial resolution. The latter are dedicated to atmospheric corrections and cloud screening [1].
Together, the Sentinel 2 imagers provide better than 5-day revisits of the Earth’s land surfaces. As a part of the Global Monitoring for Environment and Security (GMES) space segment, they provide satellite data that can be used to map widely used land surface variables including global land cover (GLC), leaf area index (LAI), fraction of absorbed photosynthetically active radiation (fAPAR), leaf chlorophyll A+B concentration (Cab), and leaf water content (Cw) [2].
Sentinel-2 Level 1C Top-Of-Atmosphere reflectance products (L1C-TOA), acquired since July 2015, are provided by ESA on the Copernicus Open Access Hub [3]. L1C-TOA products satisfy or exceed specifications for radiometric performance with typical radiometric calibration uncertainty under ~3% and worst-case uncertainties of ~5% [4,5].
ESA provides bottom of atmosphere (BOA) reflectance products (ESA-L2A) based on an implementation of the Sen2Cor algorithm [6], for estimation of vegetation biophysical parameters. ESA also provides an offline version of the Sen2Cor L2A processor (S2C-L2A) to produce BOA reflectance (S2C-L2A) products [7]. Both ESA-L2A and S2C-L2A products include BOA reflectance as well as maps of aerosol optical thickness at 550 nm (AOT), precipitable water vapor (WVP), scene classification (SCL), quality indicators for cloud (CLW) and snow cover probability (SNW). S2C-L2A products have been used for a variety of studies, including vegetation related studies [8,9], forestry [10,11], geological remote sensing [5], glassier remote sensing [12], land use classification [13], and assessing water quality [14,15]. ESA-L2A products are currently available for Europe with plans for worldwide coverage [16].
In terms of the quality of Level 2 bottom of atmosphere reflectance, Pflug [17] assessed S2C-L2A products with reference measurements from fifteen Aerosol Robotic Network (AERONET, [18]) monitoring stations. They found an overall accuracy of 81% for SLC maps, and a root mean square error (RMSE) of 0.035, 0.29 cm and up to 0.04 respectively for AOT, WVP and BOA reflectance. Clevers [19] reported an RMSE of under ~0.05 when comparing S2C-L2A BOA reflectance to in situ multispectral measurements at four dates at each of 10 agricultural plots. Doxani [20] reported an overall RMSE of 0.013, 0.147 and 0.346 cm respectively for AOT, WVP and BOA reflectance when comparing clear-sky S2C-L2A products to in situ estimates using AERONET measurements over 16 sites worldwide. For BOA reflectance, RMSE was below 0.005 + 0.05xBOA reflectance across all comparisons. They also intercompared eight atmospheric correction algorithms applied to the same L1C-TOA scenes. The average difference between SEN2COR and the other seven algorithms ranged from +0.016/−0.013, +0.018/−0.051, and +0.177/−0.065 cm for BOA reflectance, AOT and WVP, respectively.
Quality assessment of downstream Level 2 and 3 products has been reported by some producers [21,22] and third-party quality assessment is ongoing [see this issue xx]. In most cases, these assessments have been performed using S2C-L2A products as input. However, the forthcoming availability of global ESA-L2A products suggests that it is important to validate both products and to intercompare them to quantify differences that may impact downstream products.
Simultaneous validation and intercomparison ESA-L2A and S2C-L2A products has not been performed. While one may assume that the ESA-L2A products and S2C-L2A products are identical, this has yet to be verified in a systematic manner. The Committee of Earth Observing Systems (CEOS) has identified four validation stages [23]. Here, we perform the first stage corresponding to comparisons using limited sites since we are comparing two implementations of the same algorithm and expect little or no differences a priori. Given that the goal of the Sentinel-2 mission is to provide satellite data to map land surface variables, the impact of different atmospheric correction algorithms on biophysical parameters should also be quantified. Validation, corresponding to comparison with coincident reference measurements of known (presumably better) uncertainty, is one approach to assess product performance. Product intercomparison is also useful to address the issue of limited reference measurements and to identify systematic patterns between products [24,25]. Moreover, as Meroni [25] notes, intercomparison can be used to quantify improvement (or degradation) between algorithm versions. In consideration of these requirements, this study has two objectives:
- To validate (for AOT and WVP) and intercompare (for all L2A parameters) operational Sentinel-2 L2A products generated from the European Space Agency (ESA-L2A) with products generated offline using the SEN2COR tool provided by ESA (S2C-L2A) using identical input Level 1B products and default settings.
- To intercompare geophysical products generated using the European Space Agency Sentinel Level 2 Simplified L2 Product Prototype Processor [26] as well as widely used equations for spectral vegetation indices using, alternatively, ESA-L2A and S2C-L2A products as input.
With respect to validation, our null hypothesis is that both ESA-L2A and S2C-L2A will exhibit similar agreement with in situ AOT and WVP as previously reported for S2C-L2A. With respect to intercomparison, our null hypothesis is that no difference should be observed for any product given that the algorithms are ostensibly identical. The method used for the inter-comparison capitalizes on previous studies of image comparison [25,27,28]. Meroni [25] proposed a framework for remote sensing fAPAR products inter-comparison. This framework included a number of pairwise comparison including regressions between products as pairwise difference metrics. We follow this approach here although we use standardized metrics used for other CEOS L2A product intercomparisons [20,29] based on the Joint Committee Guides in Metrology [30].
The actual study was designed as a simple verification exercise since we expected a priori that there would be no evidence against the null hypotheses irrespective of the L1C-TOA product used. Our validation is limited to AOT and WVP since it is primarily to determine if the ESA and S2C algorithms are performing as previously reported. If the intercompared products validate against AOT and WVP in a manner similar to previously published experiments but exhibit differences in geophysical quantities approaching the magnitude of mission performance requirements [31], there would be a need for a more detailed investigation into both the ESA and S2C processing chains.
The manuscript is organized as follows. The study sites and the used data are presented in Section 2. The processing steps are presented in Section 3. ESA and S2C maps of SLC, AOT and WVP and vegetation parameters are validated and intercompared in Section 4. Section 5 places the observed differences in context of the required and current accuracy of level 2A products derived from Sentinel 2 MSI.
2. Study Sites and Materials
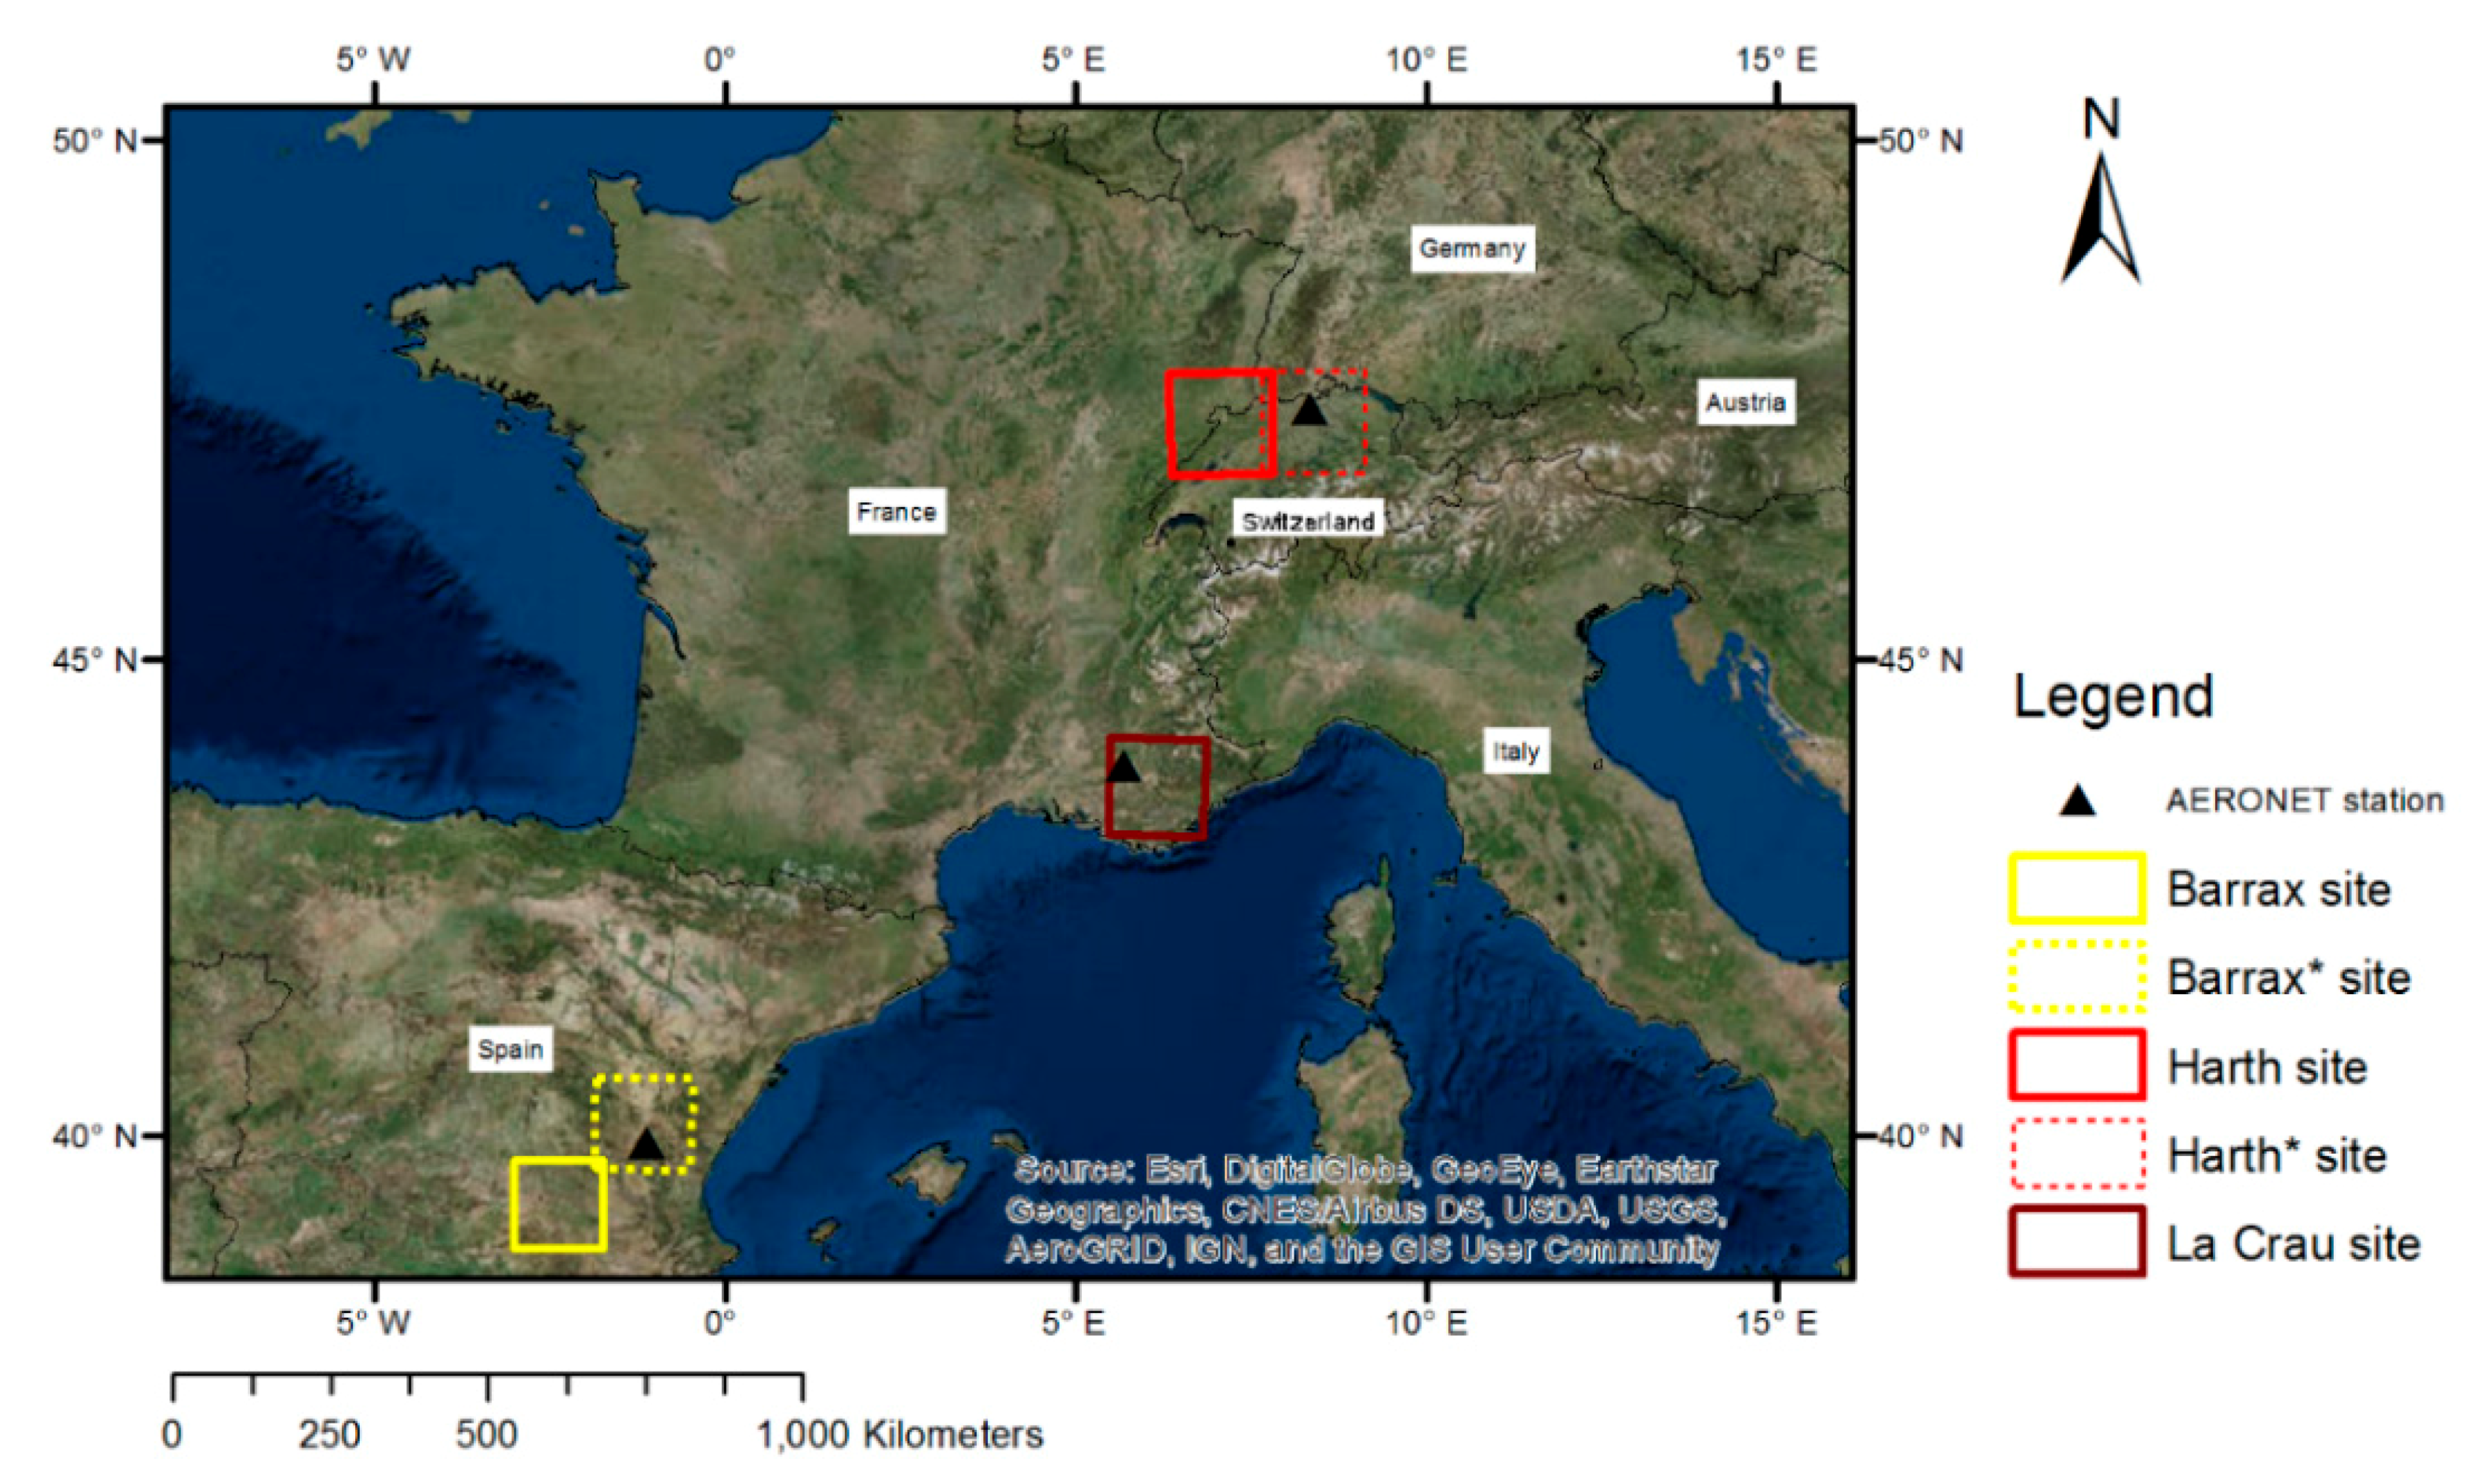
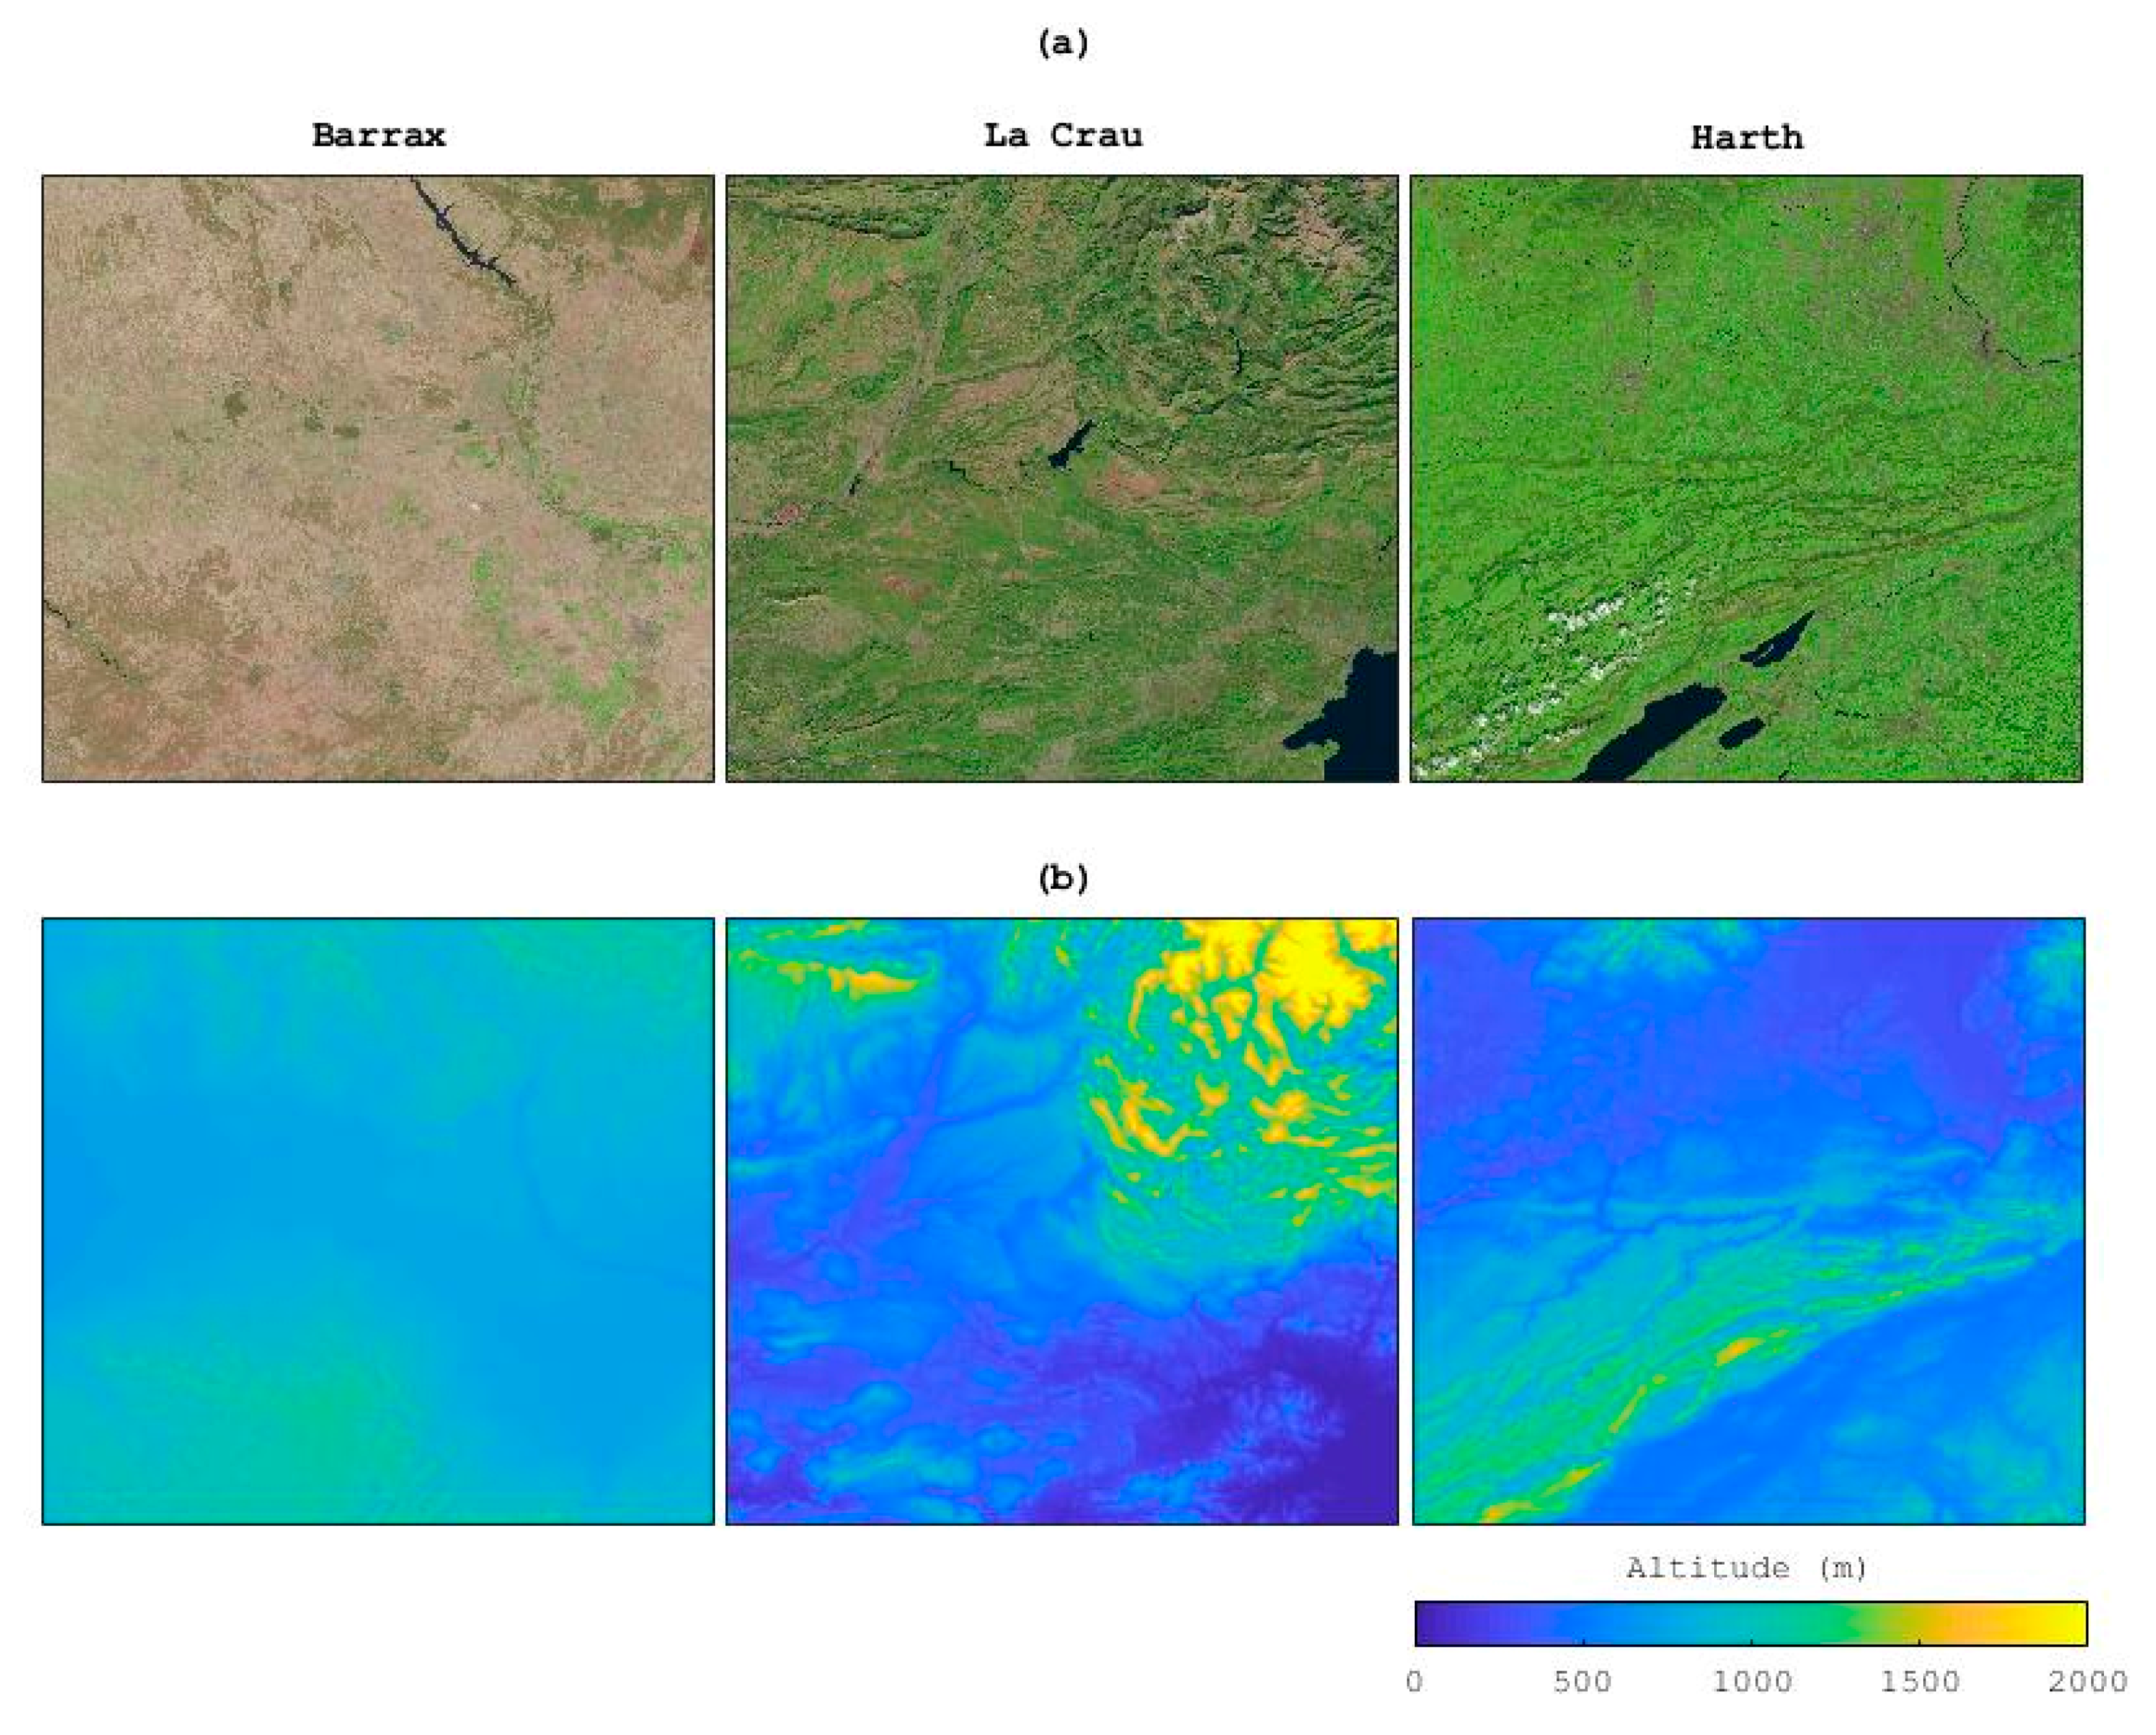
Three study sites, corresponding to existing ESA land products validation sites and available ESA-L2A products, were selected to span a range of terrain and land cover conditions (Figure 1 and Figure 2). Barrax is a sparsely vegetated site located in Spain between 38.76°N and 39.75°N and 1.73°W and 3.00°W. It is predominantly flat with a mean elevation of 850 m above sea level (a.s.l.), although there is some rugged terrain in the northeast and southeast reaching 1185 m a.s.l. Harth is a forested site located in continental France between latitudes 46.83°N and 47.85°N and longitudes 6.32°E and 7.82°E. It has mountainous terrain, with elevations ranging from 245 m and 1670 m and a relatively uniform distribution of aspects. La Crau is a pasture and savannah site located in maritime France between latitudes 43.19°N and 44.22°N and longitudes 5.46°E and 6.87°E. It has mountainous terrain, with elevations ranging between 43 m and 2749 m, but aspects are predominantly oriented north and south facing.
For each site, five clear sky Sentinel-2A L1C products and the corresponding ESA-L2A products (Processing Baseline 02.05) were selected at different periods between April 2017 and October 2017 (Table 1).
AERONET measurements were used to validate AOT and WVP. For La Crau, the Observatoire de Haute-Provence (OHP) station (5.71°E, 43.93°N, 680 m a.s.l.) was used. For Barrax and Harth, AERONET sites with clear sky Sentinel-2 data were only available in adjacent ESA-L2A product grid tiles (Aras de Los Almos at 1.10°W, 39.94°N, 1280 m a.s.l. for Barrax and Laegeren at 8.36°E, 47.48°N, 735 m a.s.l. for Harth) as indicated in Figure 1. For Barrax and Harth, AOT and WVP measurements were extracted from ESA-L2A or S2C-L2A products processed over adjacent reference grid tiles. For all AERONET sites, Level 1.5 cloud cleared spectral AOT and WVP from sun-photometer measurements were used as in situ reference values. Validation experiments indicate a total uncertainty (bias) for clear sky (air mass of one) AERONET measurements of +/−0.015 (+/−0.01) for AOT at 550 nm [32] and +/−15% (6%) for WVP [33]. To math in situ measurements to satellite products, linear temporal interpolation was performed using AERONET measurements within a +/−15 min interval of the nominal overpass time. Following Doxani [20], AOT at 550 nm was spectrally interpolated using the Angstrom exponent, and AERONET measurements were compared to a 9 km × 9 km average of satellite product estimates centred on the AERONET site.
3. Methodology
Sen2Cor (version 2.4.0) was used to generate S2C-L2A products from the L1C products using default Sen2Cor parameters with the Shuttle Radar Topography Mission Digital Elevation Model (SRTM-DEM, version 4.1). An examination of metadata files indicates that both ESA-L2A and S2C-L2A had identical processing parameters including adjacency effect correction, no correction for bidirectional reflectance distribution function (BRDF) effects, and a rugged terrain correction for slopes in excess of 7°. Table 2 describes each BOA reflectance band evaluated here.
The Normalized Difference Vegetation Index (NDVI), Normalized Difference Water Index (NDWI) and Enhanced Vegetation Index (EVI) were computed from Sentinel-2 spectral bands (Table 2) using BOA reflectance products gridded to 20 m resolution according to Equations (1)–(3), respectively. Vegetation biophysical parameters (LAI, LAIxCab, LAIxCw, fAPAR and fcover) were derived at 20 m resolution from each L2A product using the ESA-SL2P [26] integrated in the Sentinel-2 SNAP toolbox:
A 3 × 3 pixel (60 m × 60 m) moving average filter was applied to all products prior to intercomparison to minimize uncertainties due to product gridding. Intercomparisons were performed only for clear sky pixels with the exception of SLC, where all pixels were sampled. Validation and intercomparisons were summarized using scatter plots and by tabulating R2, RMSE and bias statistics for matching retrievals over a given site. For brevity, geophysical quantities derived from a given Level 2 product are described using the same prefix as the product. For example, the AOT from the ESA-L2A product is described as ESA-AOT.
4. Results
4.1. Validation of AOT and WVP Maps
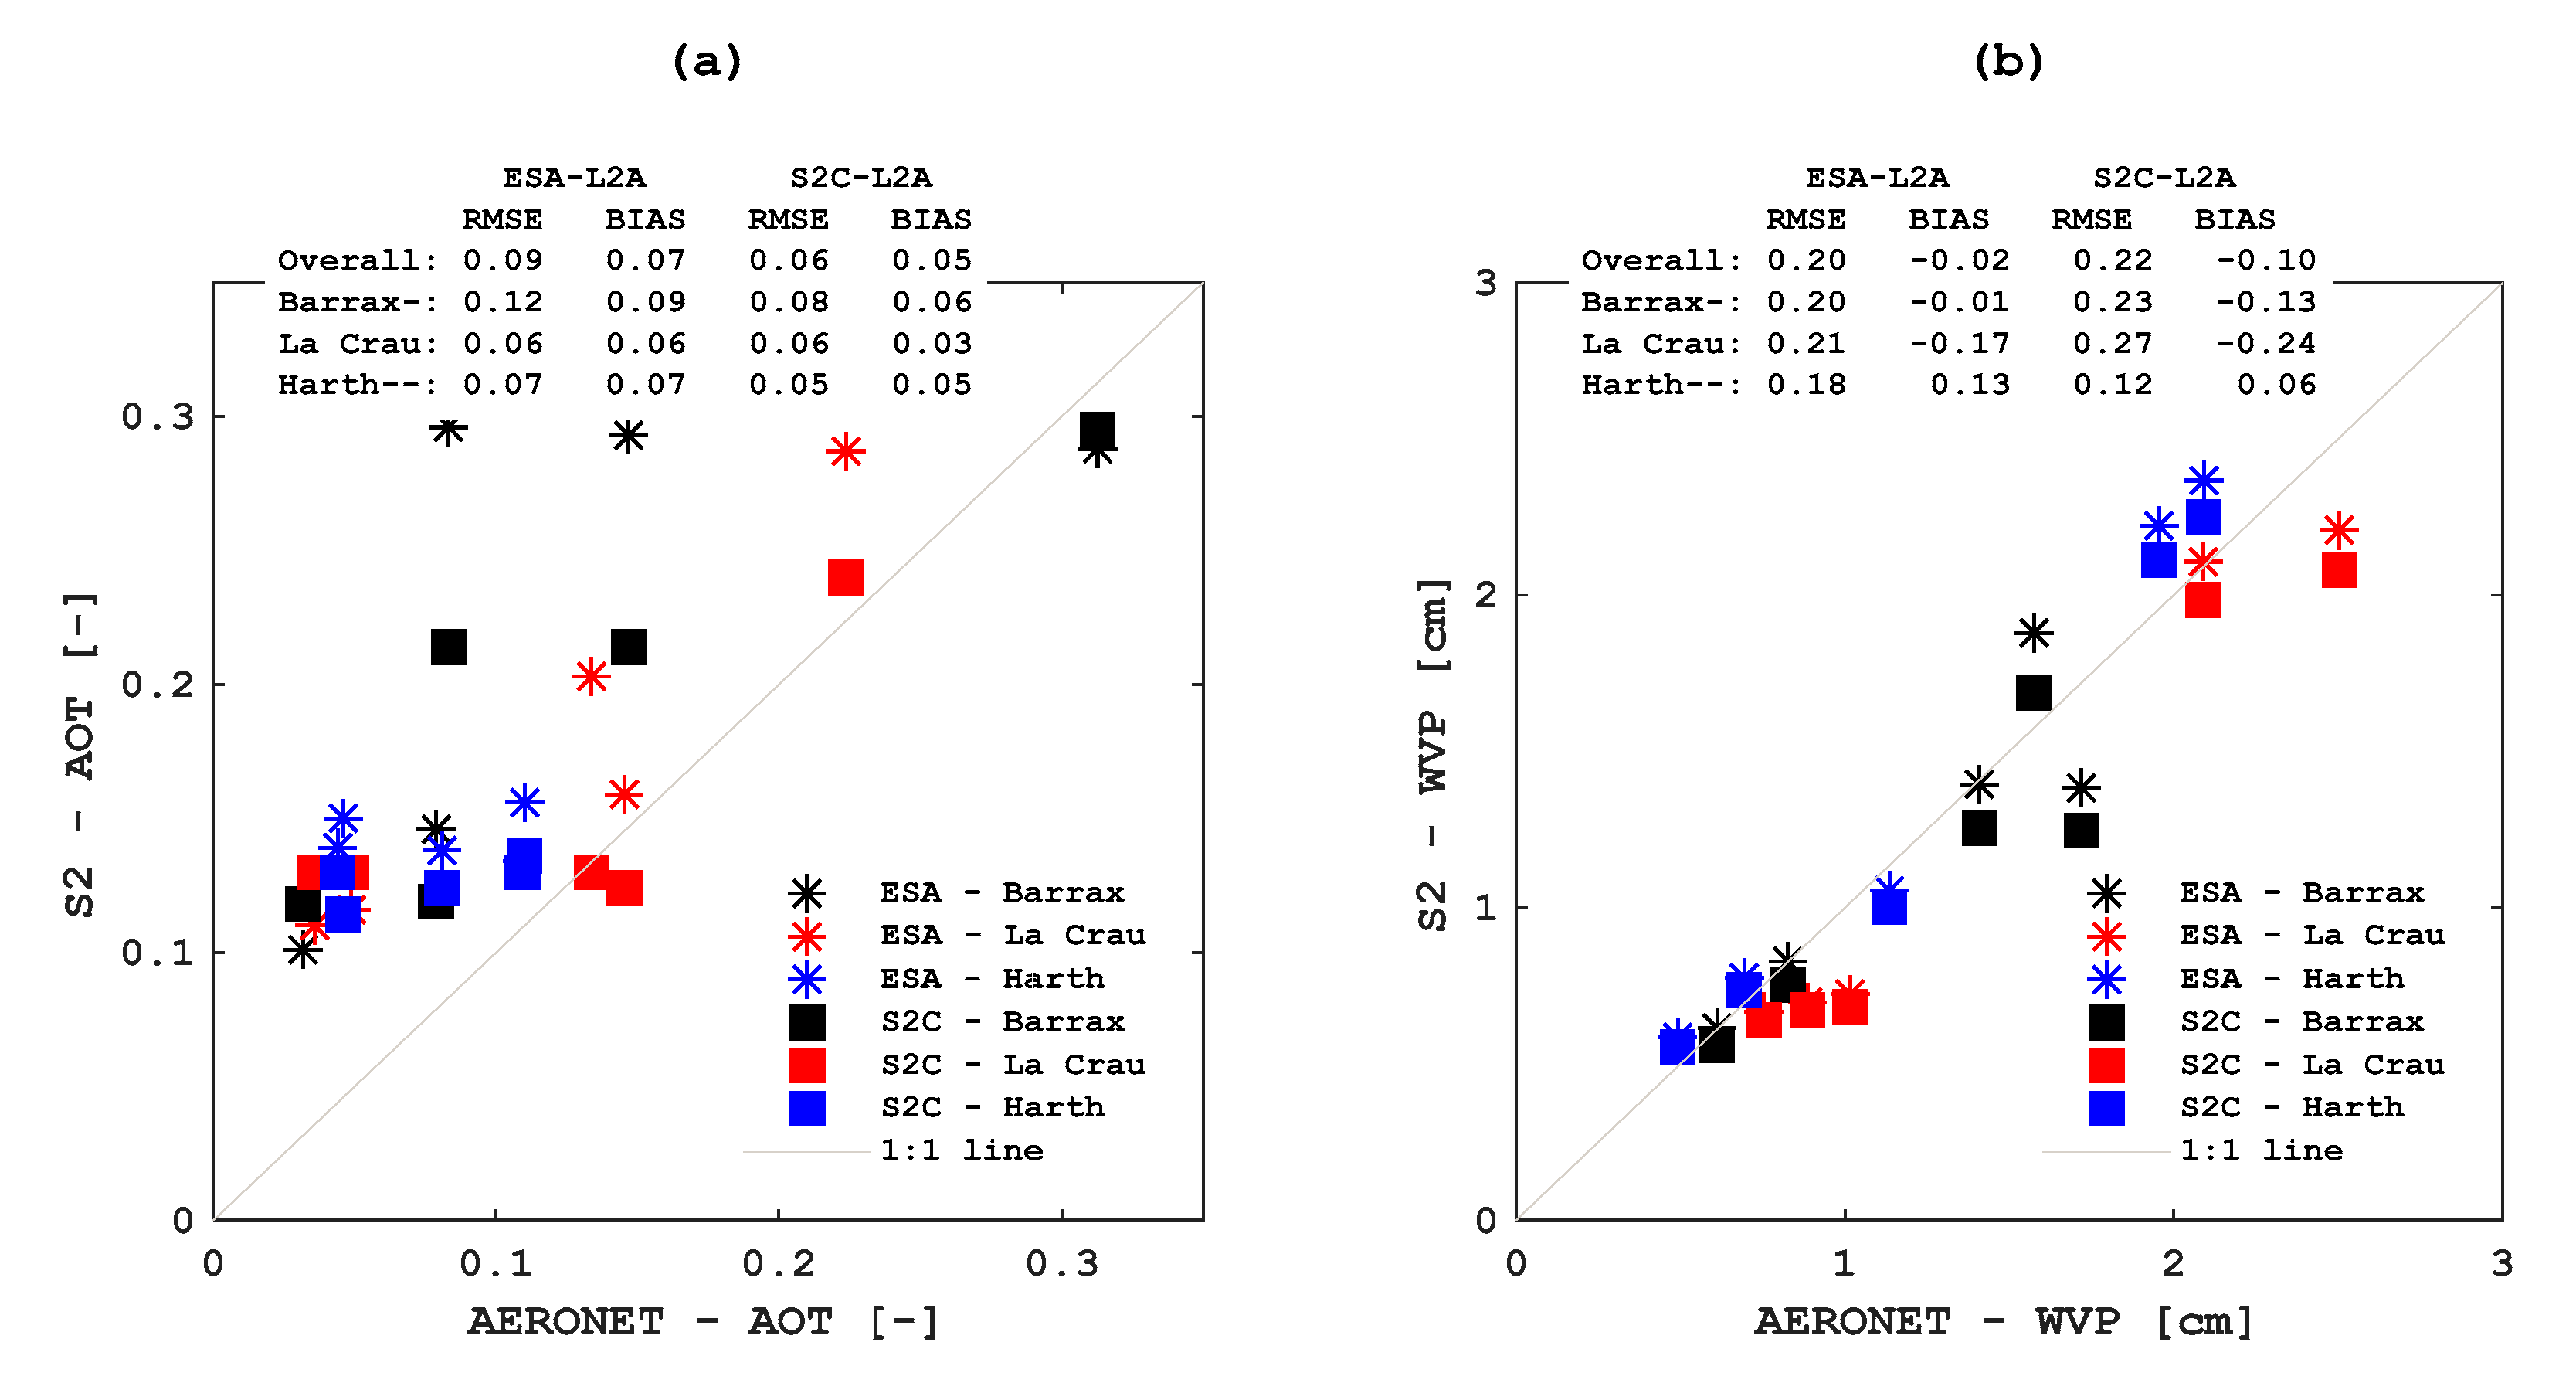
Figure 3a,b present, respectively, validation of AOT and WVP estimates using coincident to reference estimates from AERONET stations. The overall root mean square error (bias) for AOT was 0.06 (0.05) for S2C-AOT and 0.09 (0.07) for ESA-AOT in comparison to AERONET. Site-specific RMSE and bias were higher for Barrax versus La Crau and Harth. S2C-AOT has consistently lower RMSE and bias than ESA-AOT for all sites although, except at Barrax, the difference between products was typically within the uncertainty of AERONET AOT.
For WVP, Figure 3b indicates that, over all sites, the RMSE (bias) was 0.20 cm (−0.02 cm) for ESA-WVP and 0.22 cm (−0.10 cm) for S2C-WVP in comparison to AERONET. RMSE was lowest over Harth (0.18 cm for ESA-WVP and 0.12 cm S2C-WVP) and slightly higher at La Crau (0.21 cm for ESA-WVP and 0.27 cm for S2C-WVP) and Barrax (0.20 cm for ESA-WVP and 0.27 cm for S2C-WVP).
4.2. Intercomparison of SLC, AOT and WVP Maps
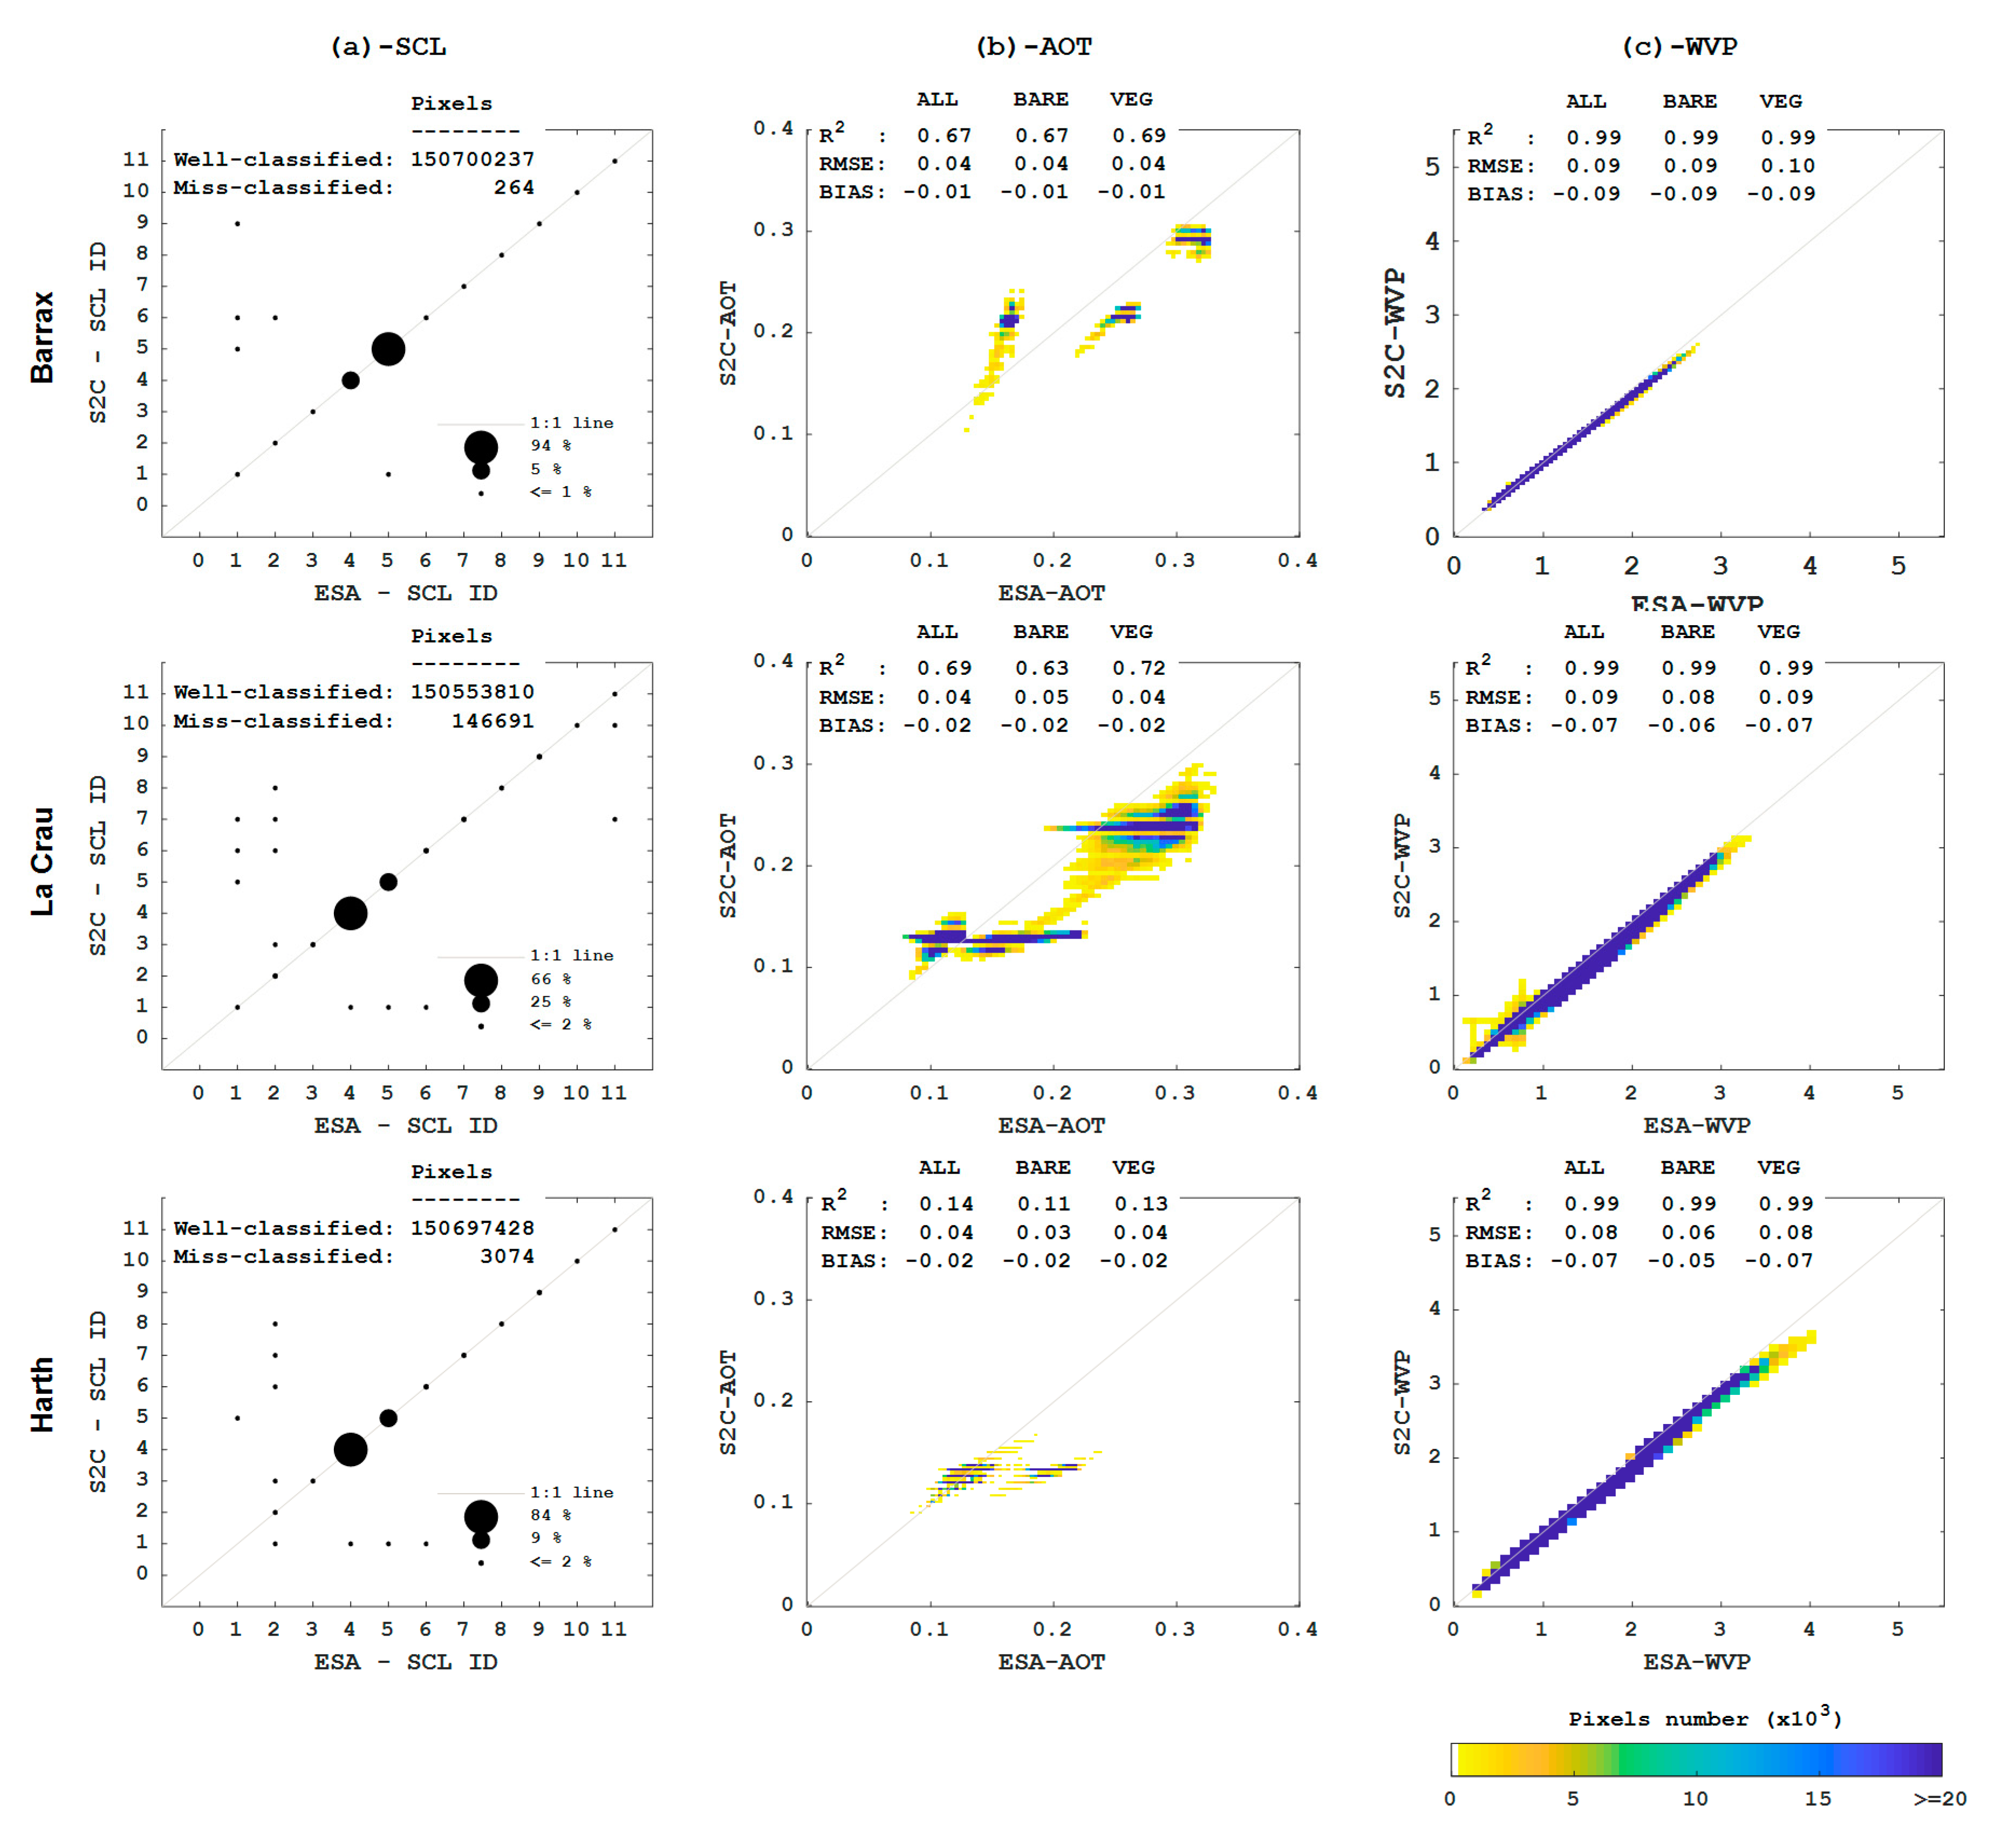
Intercomparisons between SLC, AOT and WVP maps from ESA-L2A and S2C-L2A products for Barrax, La Crau and Harth sites are presented in Figure 4. Data from the five acquisition dates (Table 1) were merged for each site and each parameter.
SCL (Figure 4a) showed an overall agreement exceeding 99% for all sites. The land area classified as clear sky bare soil (clear sky vegetated) was 94% (5%) for Barrax, 25% (66%) for La Crau and 9% (84%) for Harth.
AOT estimates from both products ranged from 0.1 to 0.3 at Barrax and La Crau and from 0.1 to 0.2 at Harth (Figure 4b). AOT estimates were relatively uniform over each image (not shown) resulting in clusters in Figure 4b corresponding to individual product dates. Over all sites, ESA-AOT were positively biased in comparison to S2C-AOT by ~0.02 for La Crau and Harth sites (15% relative to the average AOT for the site across all dates) and by ~0.01 for Barrax (5% relative to the average AOT for the site across all dates). The RMSE was nearly constant (~0.04) across all sites (>15% relative to the average AOT for the site across all dates). This suggests that there are both small systematic and random differences between ESA-AOT and S2C-AOT. Bias and RMSE did not change when considering only vegetated areas. Correlation coefficients varied across sites, although this is likely due to the variation in the range of AOT between sites (R2 from 0.67 to 0.69 for Barrax and La Crau, and R2 = 0.14 for Harth) rather than an indication of actual product differences. This was supported by the absence of spatial structure in maps of residuals (not shown).
WVP estimates from both products ranged from 0.25 cm to 3 cm at Barrax, from 0.10 cm to 3.5 cm at La Crau and from 0.10 cm to 4.5 cm at Harth (Figure 4c). Over all sites, ESA-WVP slightly overestimated S2C-WVP by ~0.08 cm (~6% relative to the mean WVP for the site). The RMSE between ESA-WVP and S2C-WVP was also small and did not vary substantially between sites (~0.09 cm or 7% relative to the mean WVP value). As with AOT, differences in WVP between products were similar for vegetated areas. These observations were confirmed by the absence of spatial structure in maps of residuals (not shown). This is further supported by the almost perfect correlation () when intercomparing WVP at each site.
4.3. Intercomparison of BOA Reflectances
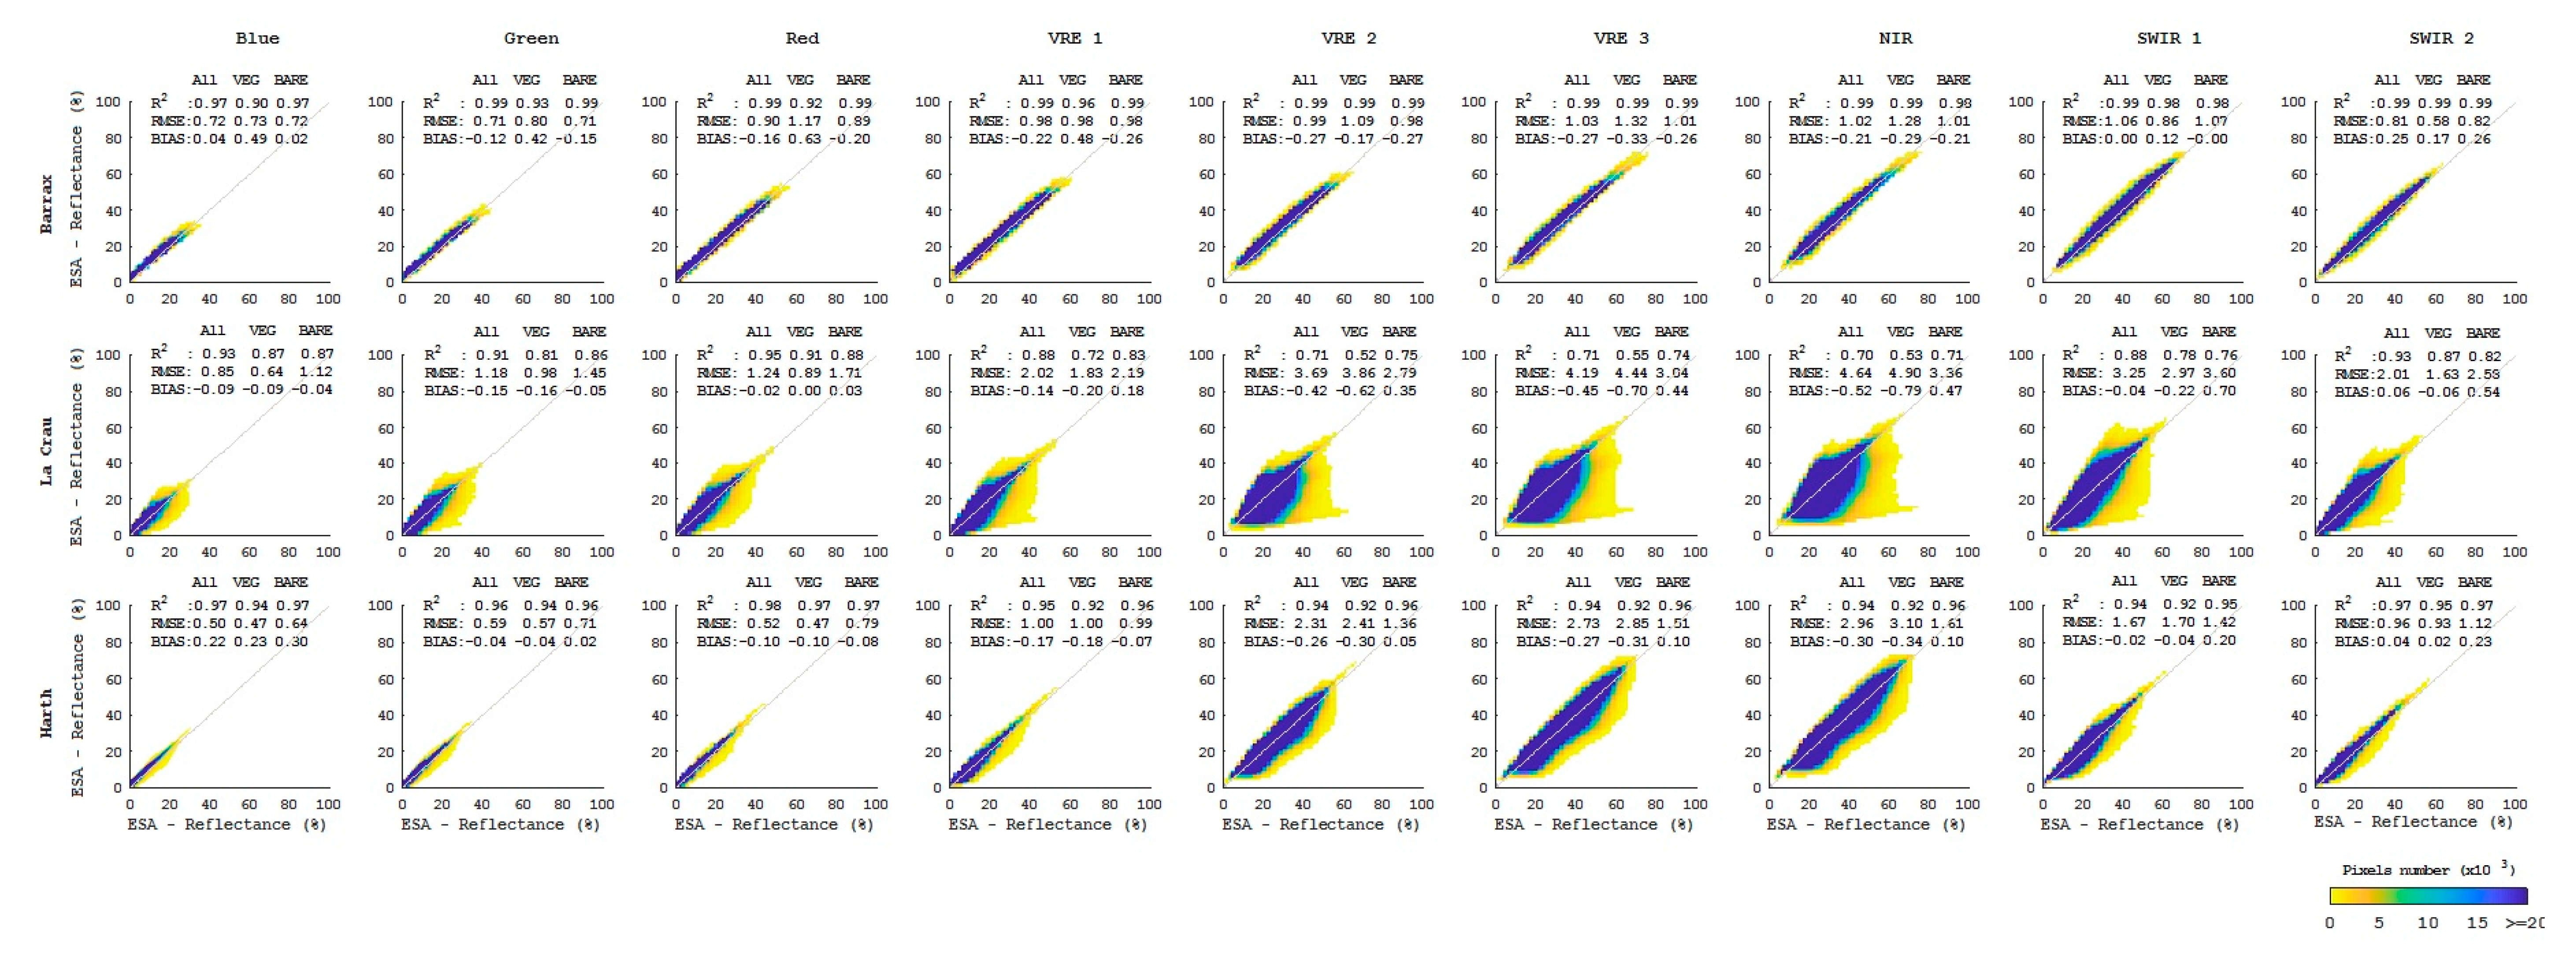
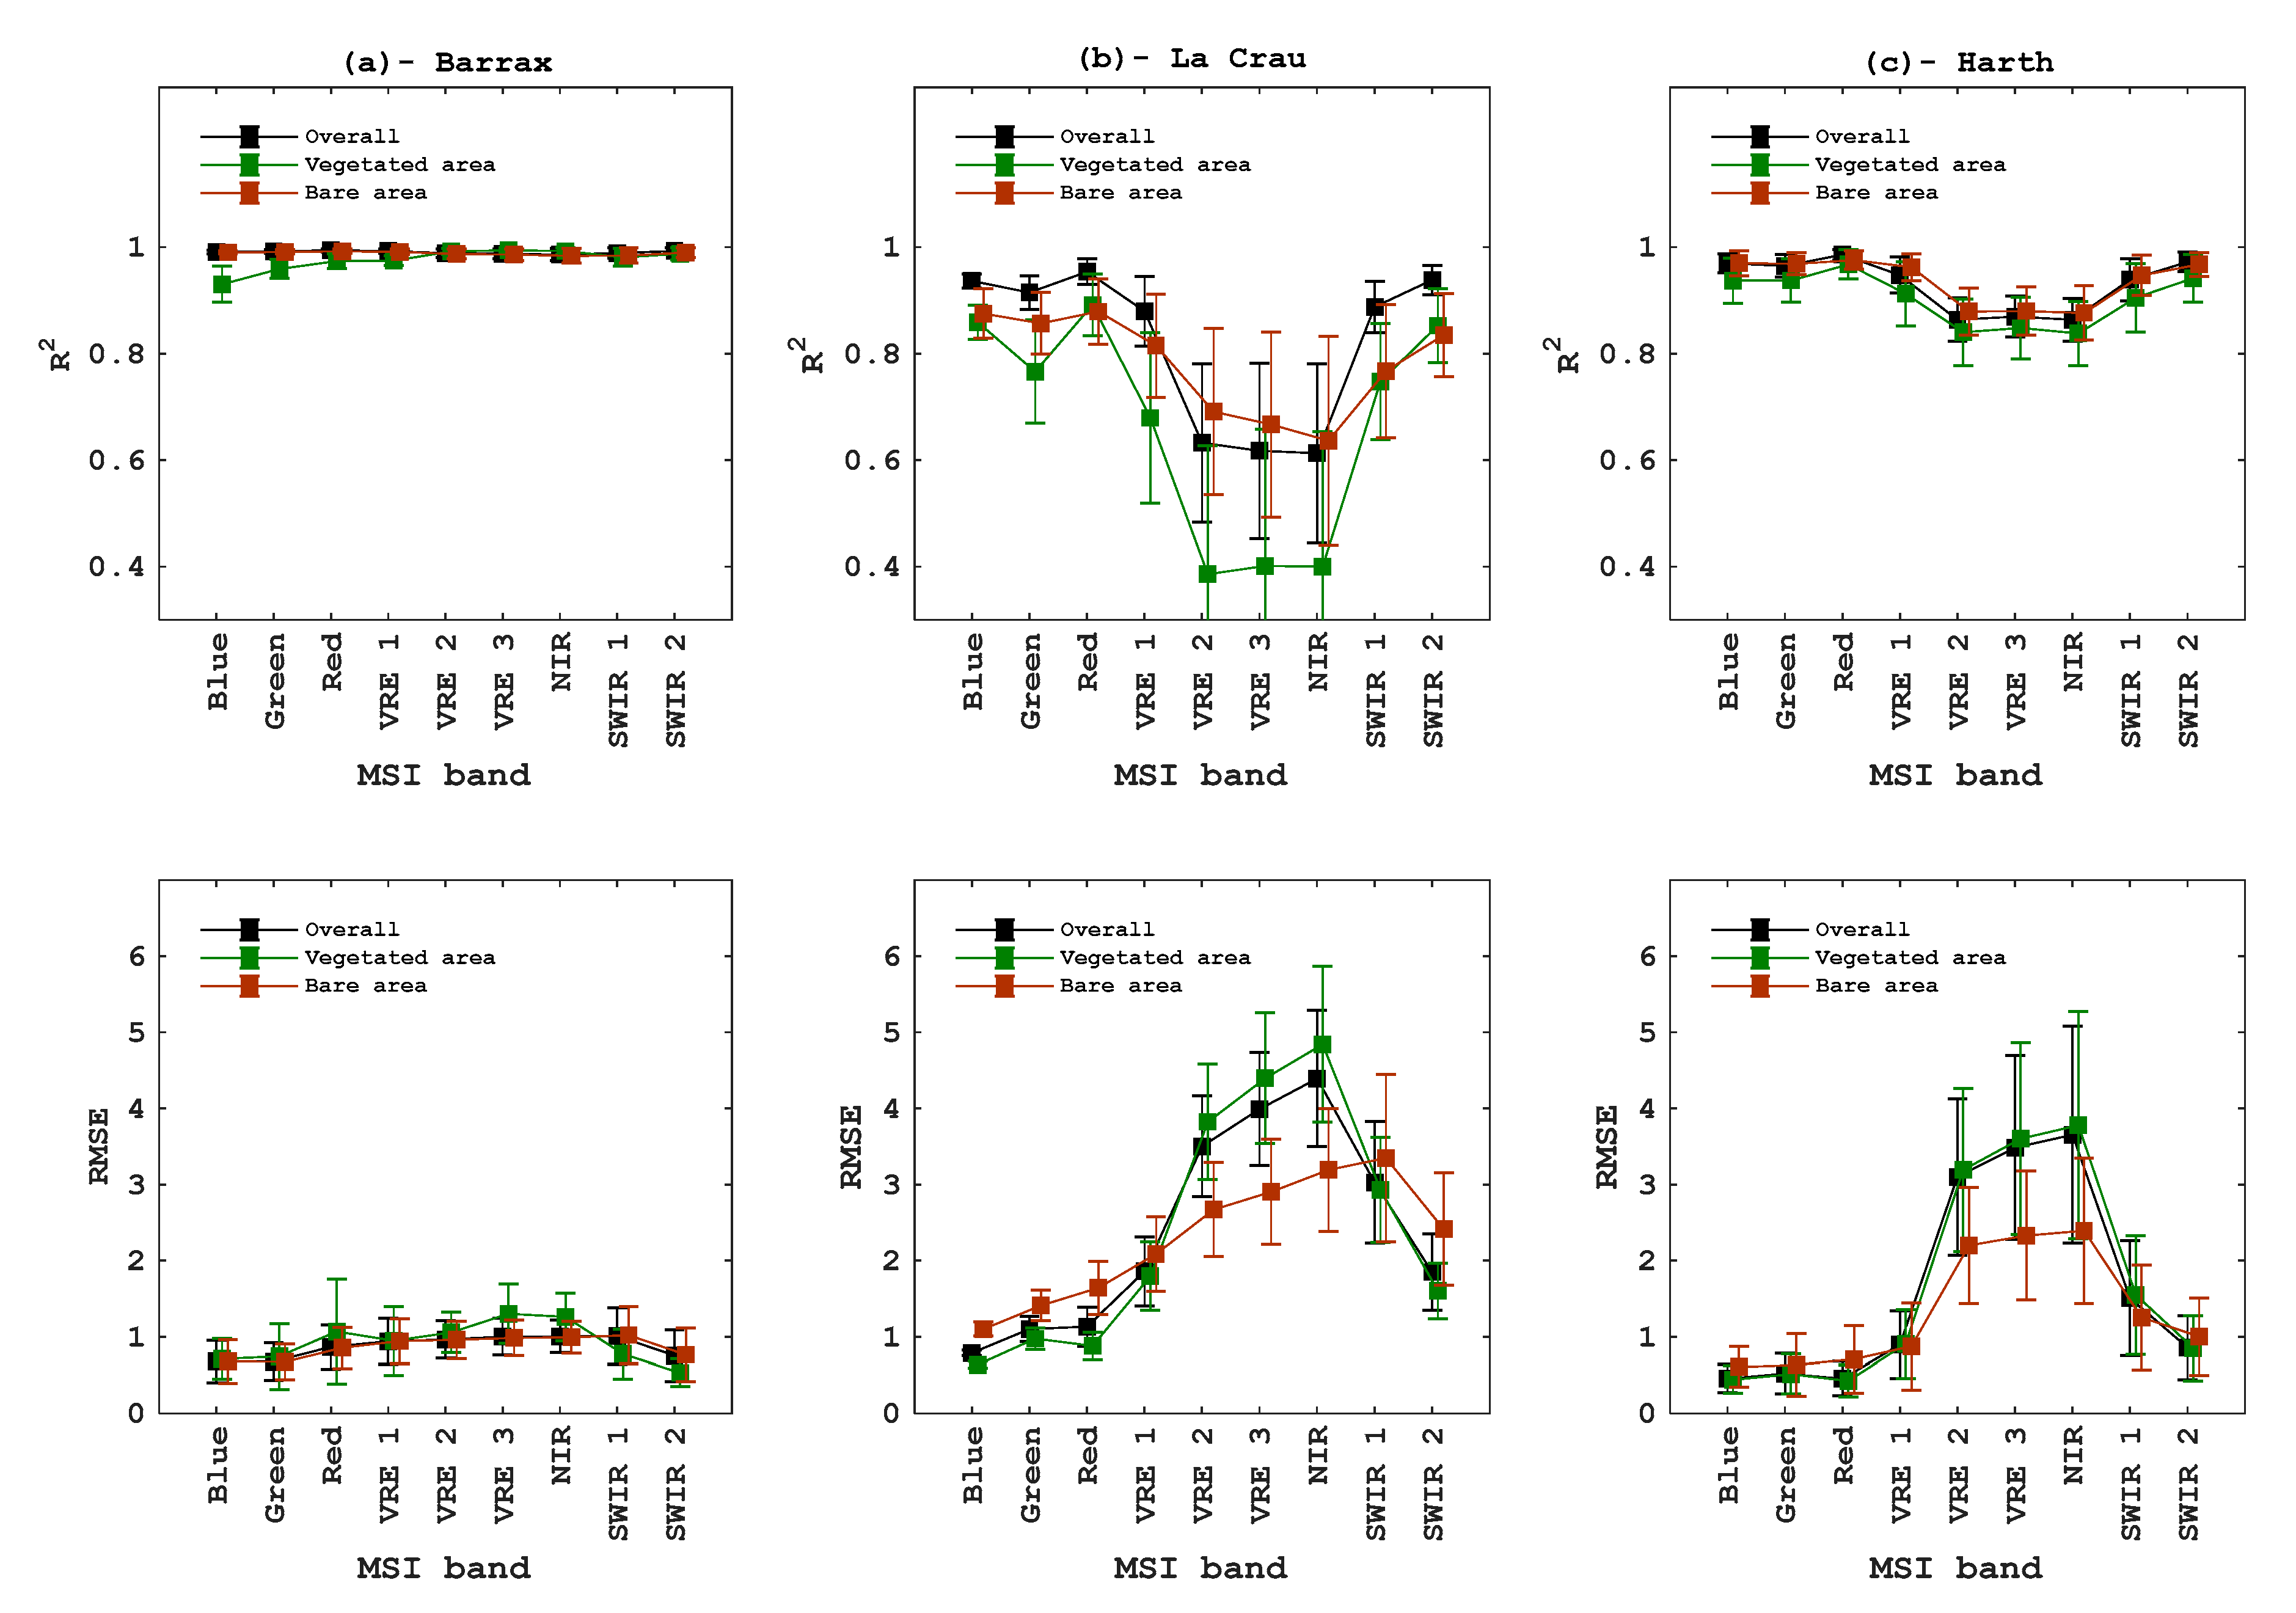
Figure 5 compares ESA-L2A and S2C-L2A reflectance for all dates over areas identified as clear sky land by the SLC map. Statistics are also indicated for vegetated areas only (column 2) and for bare areas only (column 3) over each site. Figure 6 summarizes the mean and the standard deviation values of R2 and RMSE between ESA-L2A and S2C-L2A for each MSI band across all dates for the different sites. All quantities are reported as percent reflectance (%). Tests for statistical difference between statistics are not presented since the large number of sampled pixels results in extremely small confidence intervals for each intercomparison statistic. Rather, difference statistics are interpreted considering the radiometric calibration accuracy (~3%) and the expected accuracy in surface reflectance (~5%) cited in Section 1.
Over Barrax, an almost linear relationship was observed between ESA-L2A and S2C-L2A reflectance data for all bands with an (Figure 5). The RMSE was up to 30% (in relative terms) lower over bare areas in comparison to vegetated areas, although the absolute difference in RMSE between products was much smaller than L1C radiometric calibration uncertainty (Figure 6a).
For La Crau, the scatter between ESA-L2A and S2C-L2A reflectance data was substantially greater than Barrax (Figure 5). S2C-L2A reflectance data have a small negative bias in comparison to ESA-L2A (bias from −0.02% to −0.52%), except for SWIR 2 band (bias = +0.06%). The RMSE ranges from 0.79% to 4.48%, and R2 ranges from 0.67 and 0.95. Blue, Green, Red, VRE 1 and SWIR 2 bands had lower RMSE and higher R2 () than VRE 2, VRE 3, NIR and SWIR 1 bands (,). Unlike Barrax, differences between vegetated and bare areas were only noticeable in VRE-2, VRE-3 and NIR where vegetated areas exhibited slightly lower agreement (Figure 6b).
For Harth, the magnitude of scatter between ESA-L2A and S2C-L2A reflectance data was intermediate between Barrax amd La Crau (Figure 5). S2C-L2A reflectance data were negatively biased in comparison to ESA-L2A (bias from −0.02% to −0.30%), except for Blue and SWIR 2 bands (bias). The RMSE between ESA-L2A and S2C-L2A ranges from 0.50% to 3.56%, and ranges 0.89 and 0.98. As with La Crau, the Blue, Green, Red, VRE 1 and SWIR 2 bands had lower RMSE and higher R2 () than VRE 2, VRE 3, NIR and SWIR 1 bands (, ). In addition, lower agreement was noted over vegetated versus bare areas only for VRE-2, VRE-3 and NIR.
The vertical bars included in Figure 6 indicates that exhibited temporal variation that was on the same order of magnitude as their average levels over the five dates considered. Moreover, the temporal variability was similar for both vegetated and bare areas. In contrast, only exhibited substantial temporal variation in comparison to the temporal average for La Crau.
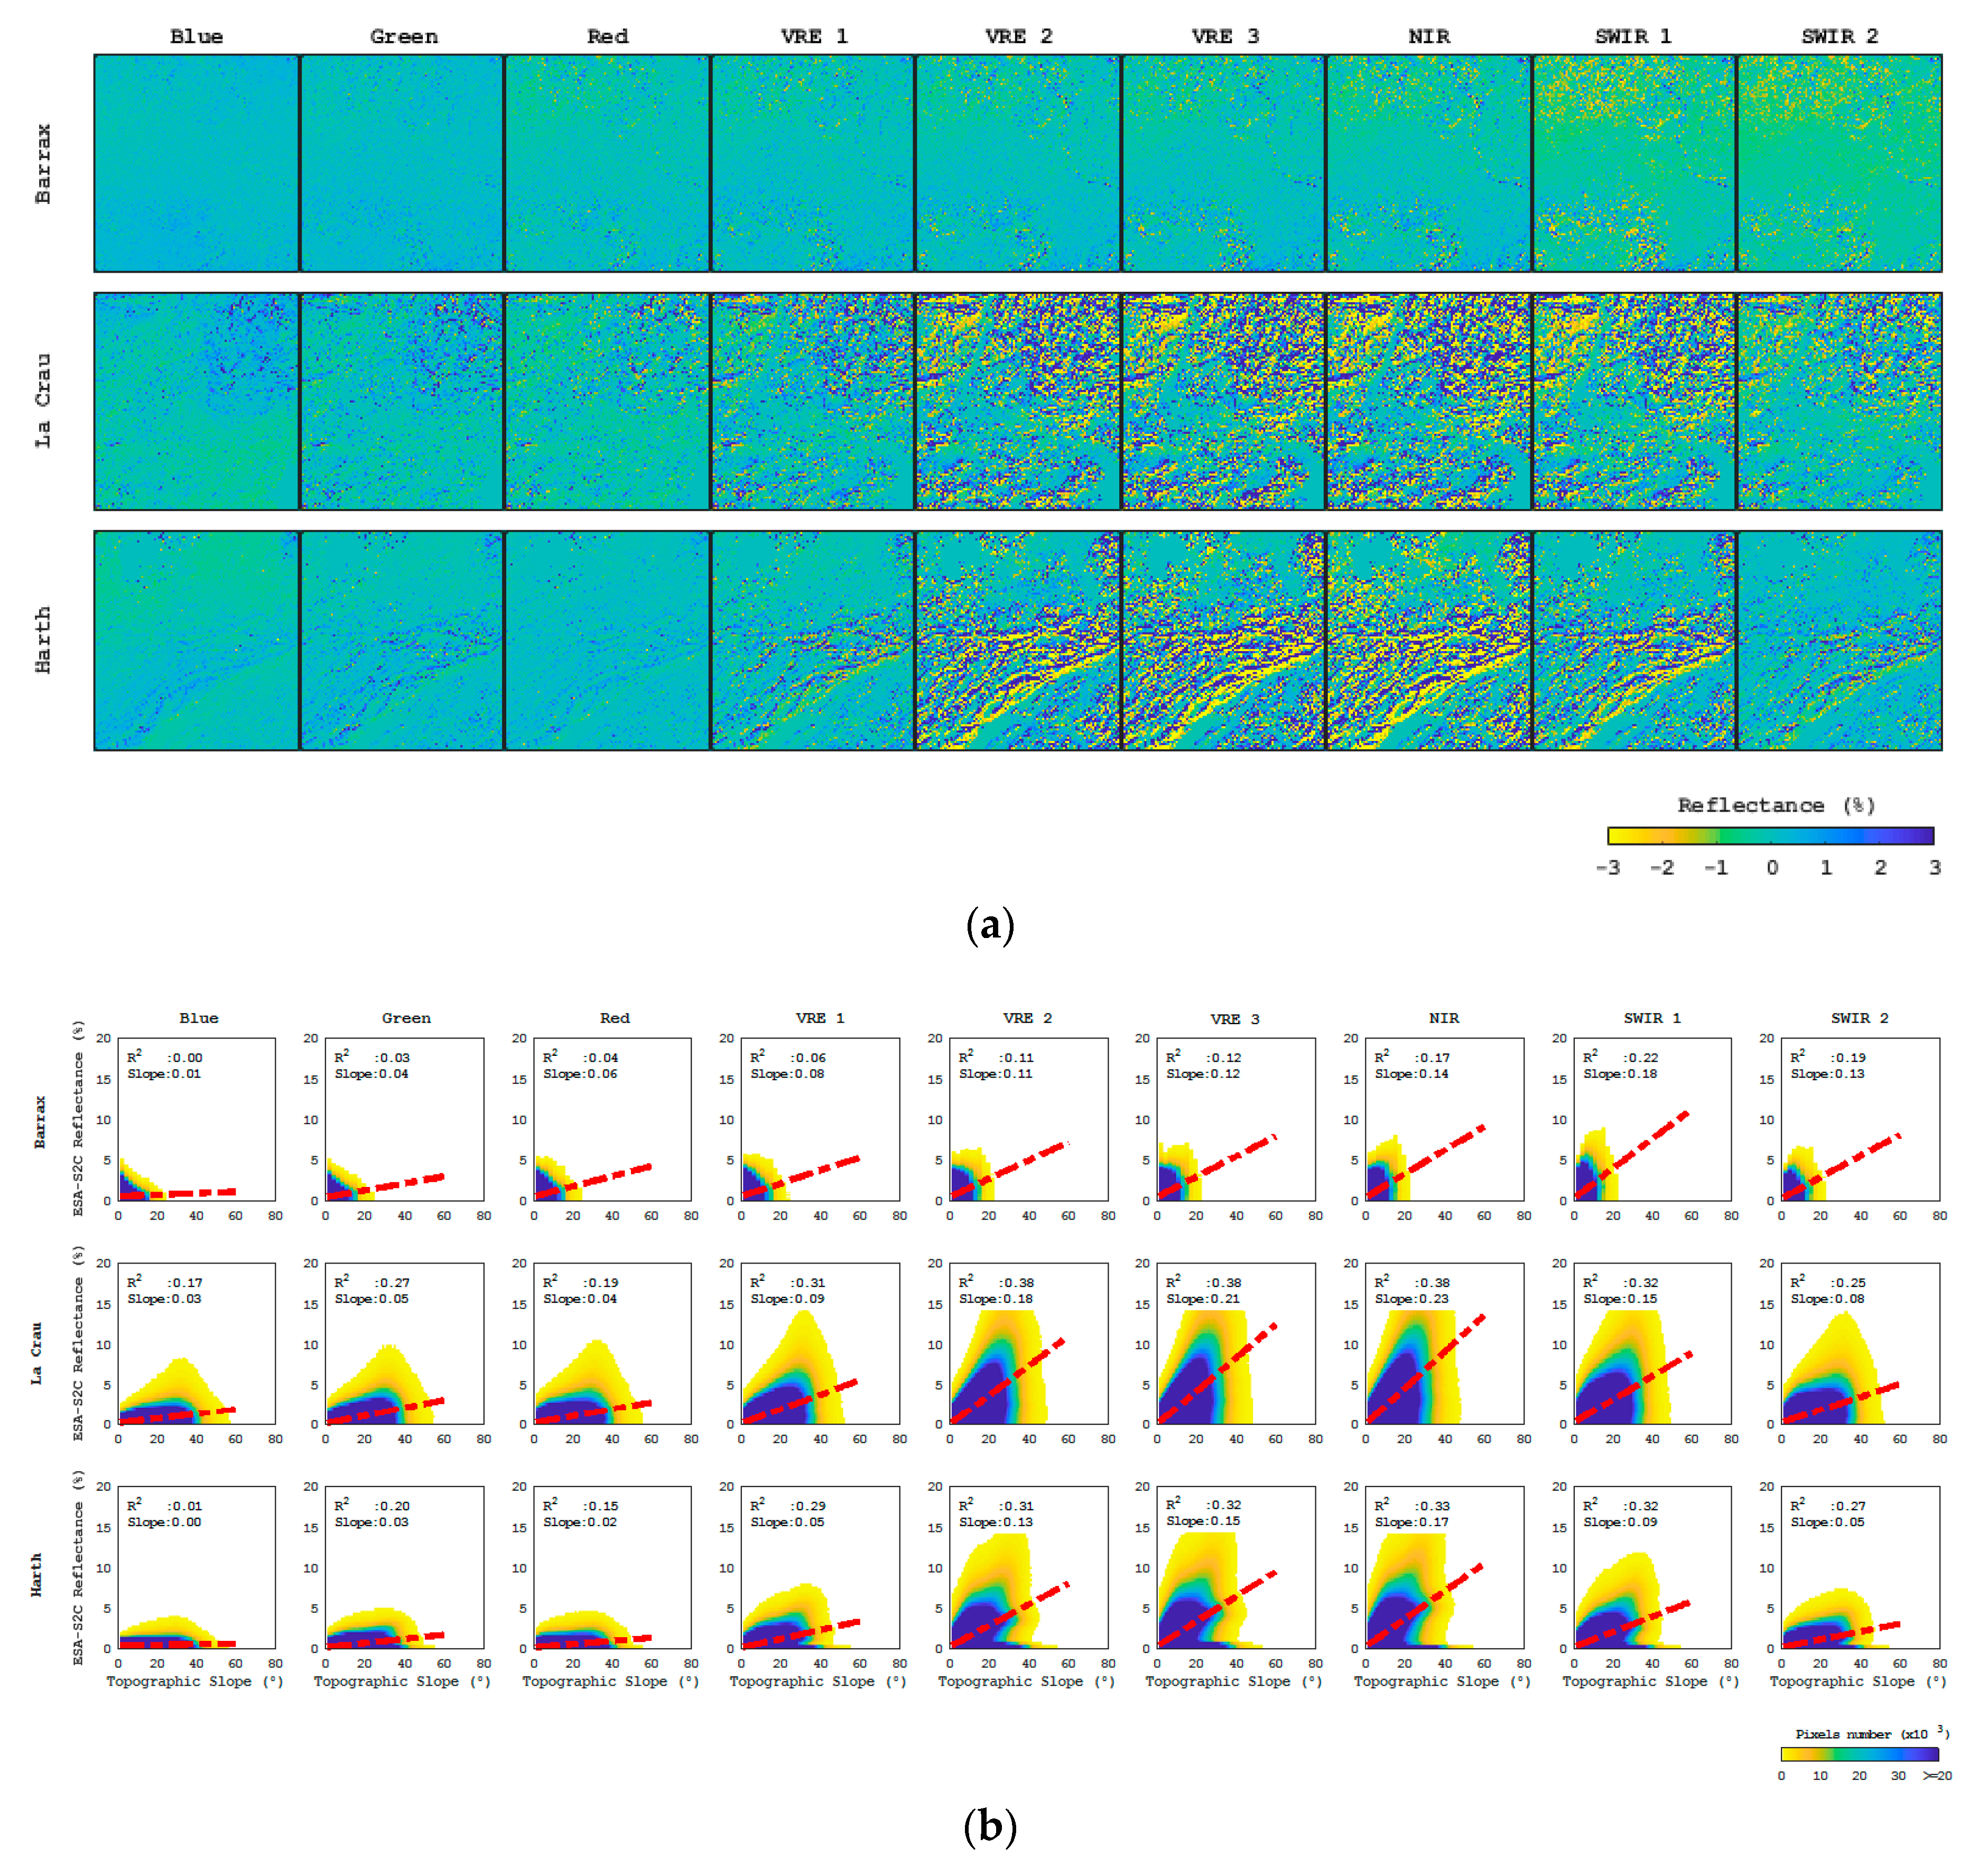
Figure 7a presents difference maps for each MSI band over Barrax, La Crau and Harth for day of year (DOY) 230. An apparent spatial structure was noted, particularly for VRE 2, VRE 3, NIR and SWIR 1 bands at La Crau and Harth, which correlates qualitatively with the DEMs shown in Figure 1. Similar patterns were observed for all dates at La Crau and Harth (not shown). Figure 7b shows that differences between ESA-L2A and S2C-L2A reflectance tend to be proportional to local topographic slope, especially for VRE 2, VRE 3, NIR and SWIR 1 bands. Linear regressions between observed differences in reflectance and topographic slope indicated R2 ranging from 0.29 to 0.38 for these bands at La Crau and Harth. Moreover, the estimated line slopes were similar irrespective of site chosen even though the maximum topographic slope at Barrax was 20° versus 50° for La Crau and Harth. In contrast to BOA reflectance, neither AOT nor WVP difference maps indicated either qualitative spatial structure or correlation to the topographic slope (not shown).
4.4. Comparison of Vegetation Indices and Biophysical Parameters
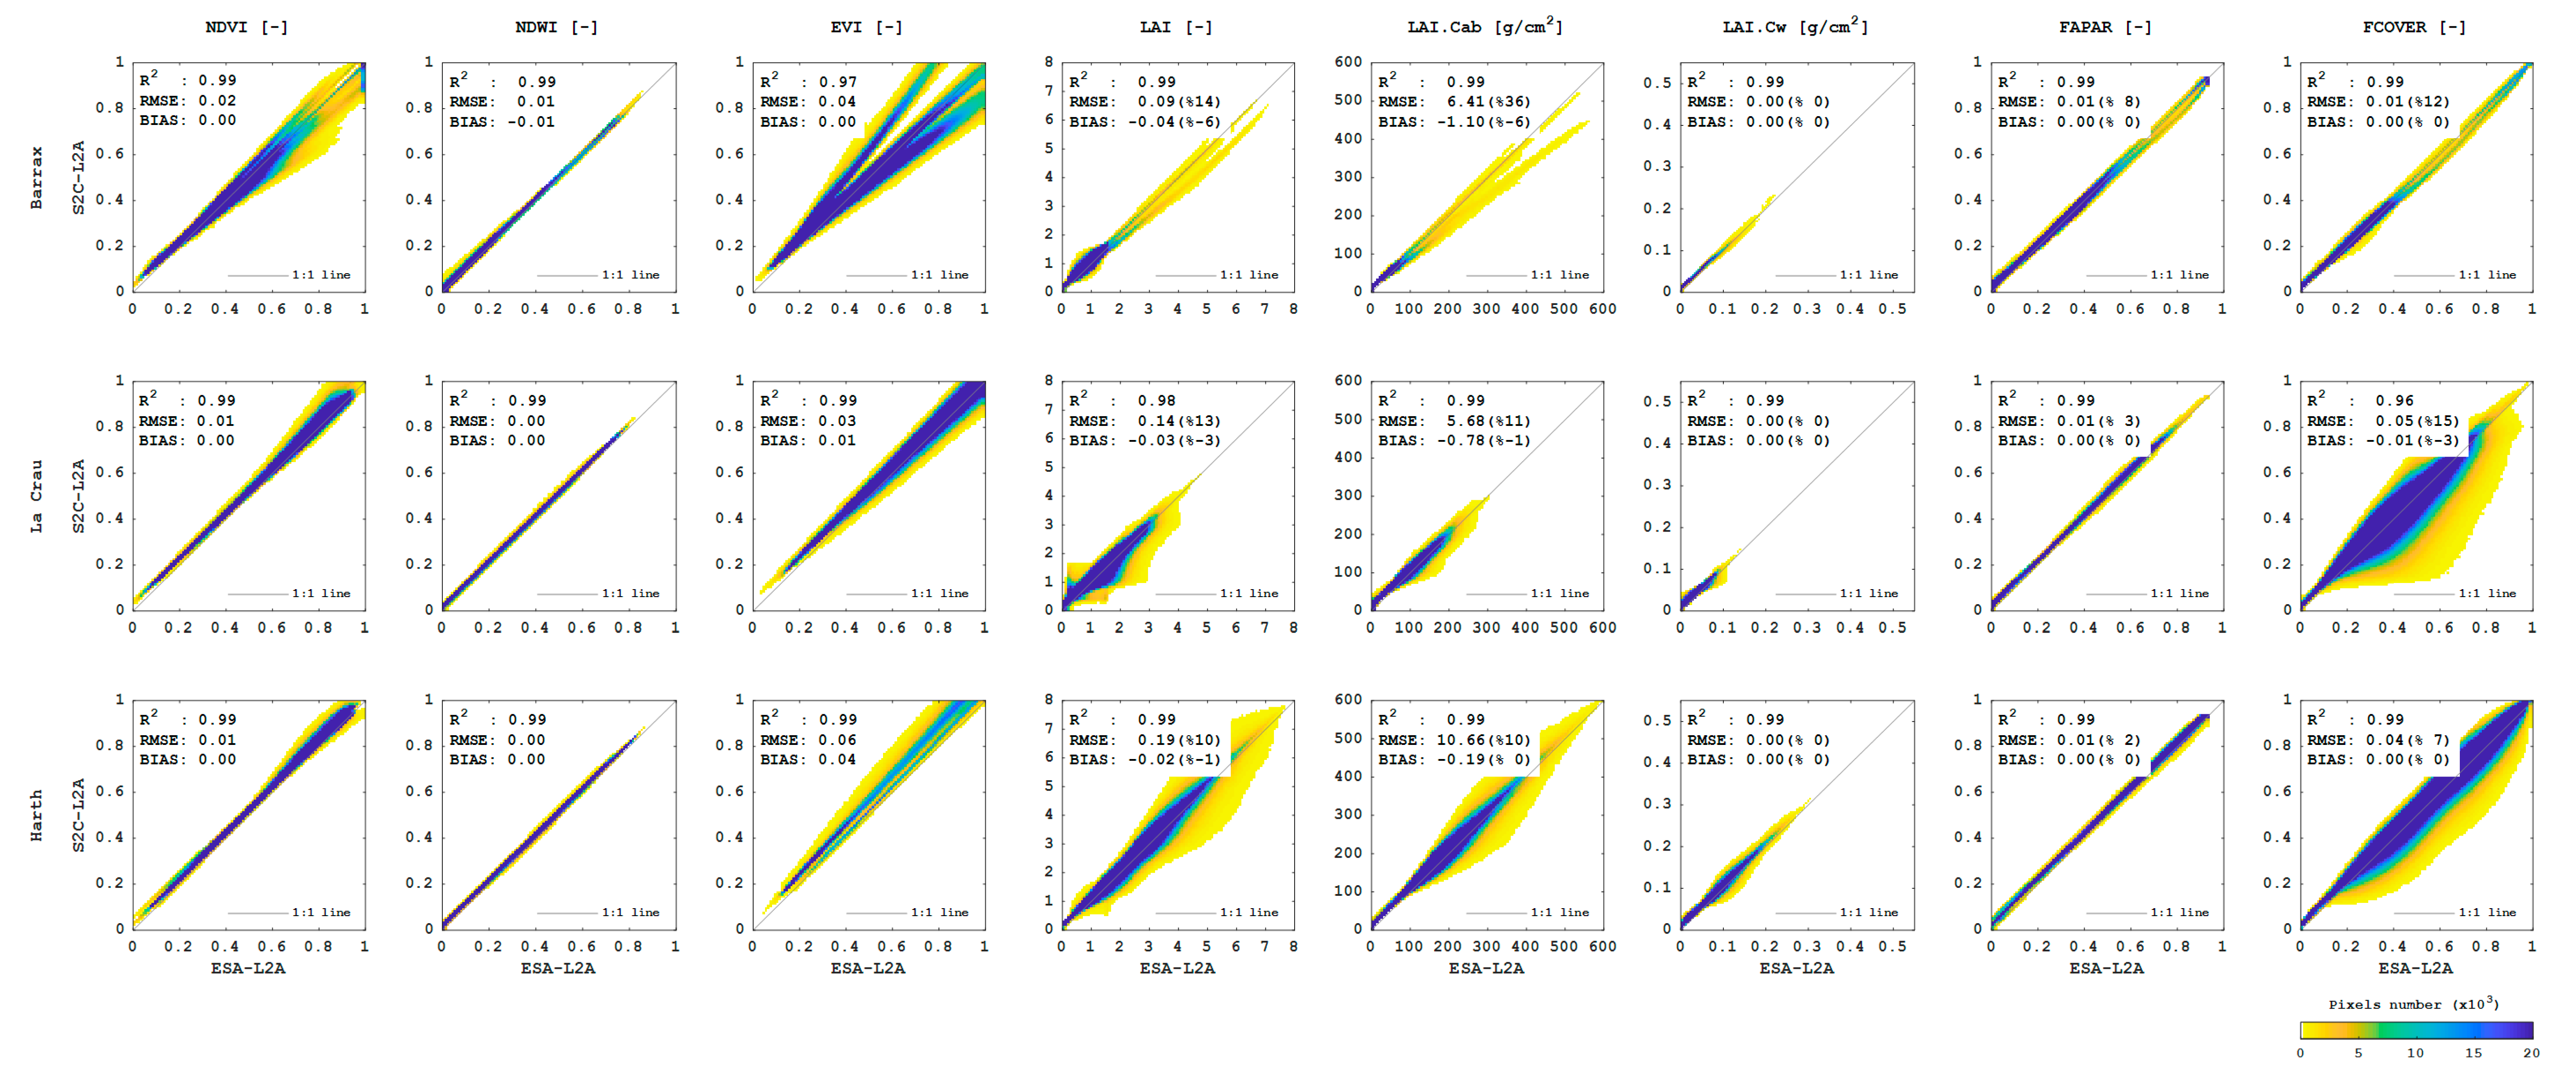
Figure 8 shows scatter plots between VIs (NDVI, NDWI and EVI) as well as vegetation parameters computed from ESA-L2A and S2C-L2A (analysed in Section 4.3) over each site. In addition to R2, RMSE and bias, the RMSE relative to the average parameter value for the site is presented to better analyse the magnitude of generated error on the estimated vegetation parameters.
All three VIs indicated a similar range of ~0.8 units for each site. In contrast to reflectance, the VIs showed strong linear relationships (R2 0.99) between products with low RMSE for NDWI (0) and NDVI (0.01), and slightly higher for EVI (between 0.03 to 0.06). Differences were proportional to VI indicating a multiplicative error source for differences. These may due to numerical differences in algorithm implementations since signal quantization was observed for NDVI > 0.9 and EVI > 0.9.
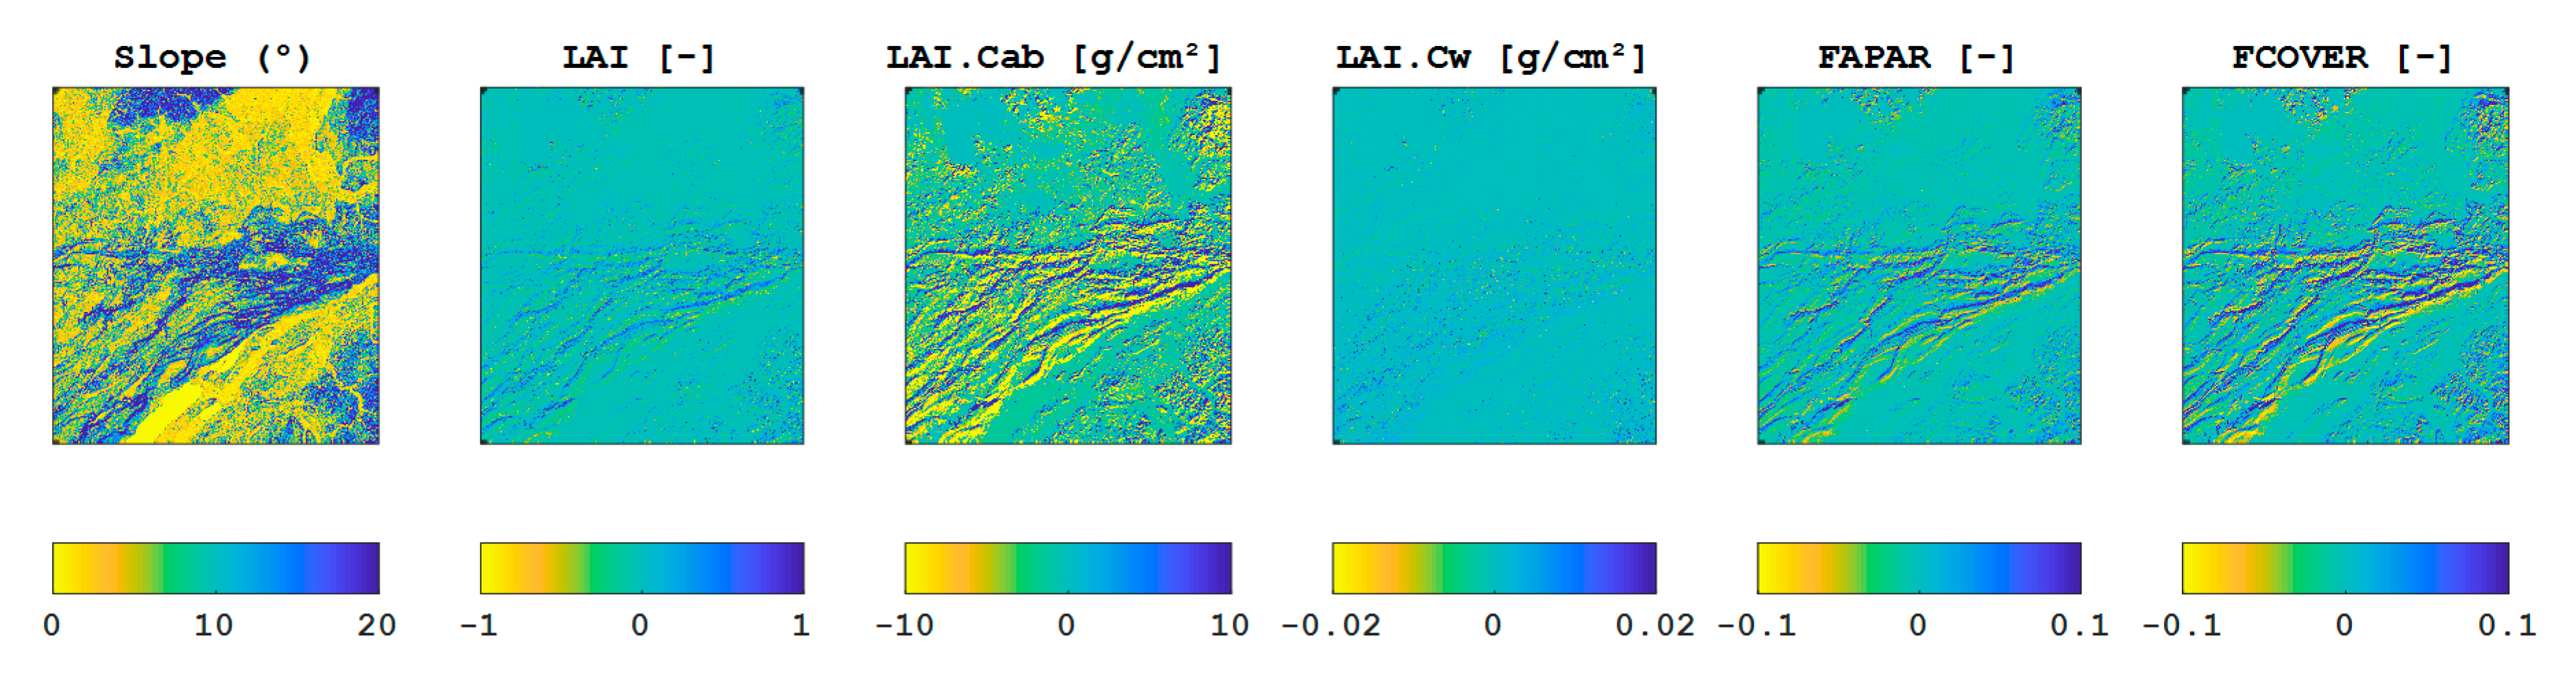
The scatter of ESA-L2A versus S2C-L2A vegetation parameters around the 1:1 line is generally proportional to the parameter. In contrast to LAIxCw, where the difference is very low (R2 = 0.99; RMSE = 0; bias = 0), substantial differences are obtained for other vegetation parameters, with the relative RMSE ranging from 10% to 14% for LAI, 10% to 36% for LAIxCw, 5% to 9% for fAPAR and 7% to 15% for fcover. The bias, relative to the average parameter value for the site, ranged between 0% and −6%. Regressions of differences versus local topographic slope indicated R2 (linear slopes) reaches 0.14 (0.007 units/degree) for LAI, 0.09 (0.308 units/degree) for LAI.Cab, 0.45 (0.002 units/degree) for fAPAR and 0.48 (0.003 units/degree) for fcover.
5. Discussion
Validation of AOT and WVP using AERONET measurements indicated similar levels of RMSE and bias reported in Pflug [17] and Doxani [20]. S2C-AOT exhibted systematically lower bias than ESA-AOT. While this systematic difference was not large overall, it was substantial (0.15 units or 100% of the in situ AOT) for two dates over Barrax corresponding to DOY 169 and 227. Biases in AOT lead us to hypothesize that the S2C and ESA algorithms are using different dark dense vegetation (DDV) targets or assume different values for DDV reflectance during processing. The S2C algorithm theoretical basis document [34] specifies that the L1C input to S2C should correspond to nine 100 km × 100 km product grid tiles centred on the nominal centre product grid tile. The offline S2C processor operates on only the data contained in the nominal centre product grid tile. This data includes granules from the same data take that extend past the grid tile boundary. However, these granules do not contain all data in adjacent tiles within the data take and it is not clear whether the DDV algorithm operates using data past the tile boundary. As such, we hypothesize that there may be different DDV targets used by the ESA-L2A and S2C-L2A products. This is especially critical in areas such as Barrax where there are potentially few DDV targets. Maps of DDV targets are not provided with ESA-L2A or S2C-L2A products so we cannot further assess this concern. A second concern is that DDV targets are used to provide an estimate of BOA reflectance initially assuming a certain (clear sky in this case) atmosphere for infrared wavelength bands. The initial DDV reflectance is then iterated, which will result in sensitivity to differences in the rugged terrain correction induced by differences in input DEM. This second source of differences between ESA-L2A and S2C-L2A is likely small since it would result in substantial differences (e.g., order 0.1) in AOT over vegetated regions while overall biases in AOT at Harth and La Crau were less than 0.02 and less than 0.05 on a scene specific basis.
Intercomparison of reflectance indicated a spatially persistent difference related to the topographic slope. The S2C ATBD indicates a rugged terrain correction is applied where local slope exceeds 7°. This correction increases the incident irradiance on the target by adding a factor proportional to the cosine squared of the local slope and the reflectance of surrounding 500 m × 500 m. We hypothesize that the large differences in BOA reflectance observed over mountainous areas could be due to differences in DEMs used as input to ESA-L2A and S2C-L2A notwithstanding the fact that the ESA-L2A metadata indicates the same DEM was used as we used for S2C-L2A products. Testing this hypothesis is complicated by the rugged terrain correction depending on initial estimates of reflectance of surrounding pixels that will vary with spectral band and with differences in AOT between products. Irrespective of the hypothesized cause, observed differences in the BOA reflectance approach (for bands Blue, Green, Red, VRE 1 and SWIR 2) exceed (for bands VRE 2, VRE 3, NIR and SWIR 1) the uncertainty due to radiometric calibration and have comparable magnitude to the uncertainty in S2C-L2A reflectances cited in Doxani [20] over AERONET sites.
Both NDVI and NDWI rely on bands for which observed differences in BOA reflectance between ESA-L2A and S2C-L2A were similar. As a result, the impact of these differences on NDVI and NDWI was negligible. Indeed, this is what we would have hoped for all bands and parameters. The larger systematic difference for EVI is likely due to the large sensitivity of the blue band to small differences in AOT [35]. For vegetation biophysical parameters, differences between ESA and S2C, especially over rugged terrain, were non negligible and in some cases exceeded 10% in comparison to the site average. As expected, these differences were typically related to slope (Figure 9), although not as clearly as for reflectance. This finding is explained by the fact that the SL2P algorithm used for land surface parameters ingests almost all spectral bands and applies a nonlinear regression to estimate each parameter [26]. As such, the propagation of differences in BOA reflectance to differences in geophysical quantities is non-trivial. Indeed, it is exactly for this reason that the observed differences in reflectance due to slope are of concern. Even if a single operational DEM was used for all processors, the sensitivity to slope implies that there is an additional underlying uncertainty in input reflectance that must be included when developing and evaluating land surface parameter algorithms and their products.
6. Conclusions
The goal of Sentinel-2 constellation is to provide satellite data that can be used to map widely used land surface variables including global land cover and vegetation parameters. ESA has provided both the Sen2Cor processor for offline processing of single L1C products to L2A products and systematic processing of L2A products using the Sen2Cor processor integrated in the ESA Data Hub. While considerable effort has been placed in validating and comparing the offline Sen2Cor processor, the same cannot be said for the operational processor until now.
In terms of validation against reference measurements, AOT and WVP estimates from both S2C and ESA provided similar levels of agreement to AERONET estimates (RMSE from 0.06 to 0.09 for AOT and RMSE from 0.20 to 0.22 for WVP) published in other studies (RMSE 0.14 and for AOT and RMSE 0.30 for WVP [17,20]). However, the ESA-AOT bias was ~100% larger than the S2C-AOT bias for two scenes over the arid Barrax region. These differences are of similar magnitude to the typical error of existing Sentinel-2 atmospheric correction algorithms for clear sky conditions [20]. Intercomparison of AOT and WVP between S2C and ESA indicated that the differences are not substantial over granules with substantial vegetation, leading us to hypothesize that they are due to differences in the selection of dense dark vegetation targets. Indeed, the Sen2Cor ATBD envisions atmospheric correction using nine product tiles while the offline S2C implementation uses only one tile. We recommend that both ESA and S2C L2A products provide a map of DDV targets used during processing. Considering the regional variation of sensitivity to DDV target selection, we also recommend that users be provided with either a local uncertainty estimate of BOA reflectance and AOD based on perturbation of DDVs or based on multi-algorithm intercomparisons.
Intercomparison of SLC and VIs showed negligible differences between ESA and S2C except for EVI. We hypothesize that the bias between S2C and ESA EVI observed over Barrax was due to a bias in AOT. This would be consistent with the hypothesis that AOT estimates were most uncertain over arid regions with few DDV targets. We recommend that the EVI be used with caution in areas with few DDV targets since biases may change over a growing season as vegetation density changes.
Intercomparison of BOA reflectance and vegetation parameters indicated systematic differences related to local slope. The RMSE in BOA reflectance of 4.9% in the red-edge observed over Harth and La Crau sites are of the same magnitude of the L1C radiometric calibration uncertainty and the RMSE relative to reference estimates based on AERONET sites and in situ measurements. Intercomparison of vegetation parameters indicated differences varied by parameter but were not negligible over rugged terrain in comparison to performance requirements (RMSE = 0.23 for LAI; RMSE = 13.27 for LAIxCab, RMSE = 0.05 for fAPAR and RMSE = 0.07 for fcover). We hypothesize that some of the differences in BOA reflectance and subsequently derived vegetation parameters are due to differences in DEMs used during the rugged terrain correction. However, it is not easy to quantify this impact of the DEM without controlling for atmospheric parameters such as AOT and WVP. One could argue that having a standard DEM across all users will eliminate the difference in downstream products due to DEM specification. However, the fact that there is substantial sensitivity of L2A products to the implemented rugged terrain correction suggests that the accuracy and precision of the correction should be quantified. We recommend that this task be accomplished by the data producers prior to considering the ESA-L2A products completely operational. Until that time, we recommend that the rugged terrain correction not be implemented systematically but only provided on demand. Furthermore, regions in each scene impacted directly by rugged terrain correction (versus indirectly from the impact of this correction on AOT or WVP estimates) should be mapped.
This study is indicative but not comprehensive in its evaluation of the consistency of ESA and S2C L2A products. Chiefly, we did not expect to see any differences and were rather surprised that they existed over the three study sites. One could argue that the study does not cover a large number of sites or processor configurations. However, we note that both the ESA L2A products and the Sen2Cor processor are available in the public domain so even some evidence of differences between these sources of L2A products is sufficient to warrant concern. The study could be expanded to more sites, but it seems that the nature of the differences can be better diagnosed by those having access to the processor code. At present, this is in the hands of ESA and the producers of the processors.
Author Contributions
Conceptualization, N.D. and R.F.; Methodology, N.D. and R.F.; Software, N.D.; Validation, N.D.; Formal Analysis, N.D. and R.F.; Investigation, N.D. and R.F.; Resources, R.F.; Data Curation, N.D.; Writing-Original Draft Preparation, N.D.; Writing-Review & Editing, R.F.; Visualization, N.D.; Supervision, R.F.; Project Administration, R.F.; Funding Acquisition, R.F.
Funding
This research was funded by Natural Resources Canada (NRCan), Remote Sensing Science Program (RSSP), Canadian Space Agency (CSA) and Government Related Initiatives Program (GRIP).
Acknowledgments
The authors wish to acknowledge the Canadian Space Agency and Natural Resources Canada for supporting this work and the European Space Agency for provision of datasets and software. We also thank H. Peter White and Rasim Latifovic for their comments on the manuscript in addition to external reviewers and the Editors.
Conflicts of Interest
The authors declare no conflict of interest.
References
- Drusch, M.; Del Bello, U.; Carlier, S.; Colin, O.; Fernandez, V.; Gascon, F.; Hoersch, B.; Isola, C.; Laberinti, P.; Martimort, P.; et al. Sentinel-2: ESA’s Optical High-Resolution Mission for GMES Operational Services. Remote Sens. Environ. 2012, 20, 25–36. [Google Scholar] [CrossRef]
- Martimort, P.; Berger, M.; Carnicero, B.; Del Bello, U.; Fernandez, V.; Gascon, F.; Hoersch, B.; Isola, C.; Laberinti, P.; Martimort, P.; et al. Sentinel-2: The optical high-resolution mission for GMES operational services. ESA Bull. 2007, 131, 18–23. [Google Scholar]
- Copernicus Open Access Hub. Available online: https://scihub.copernicus.eu/dhus/ (accessed on 1 December 2017).
- Gascon, F.; Bouzinac, C.; Thépaut, O.; Jung, M.; Francesconi, B.; Louis, J.; Lonjou, V.; Lafrance, B.; Massera, S.; Gaudel-Vacaresse, A.; et al. Copernicus Sentinel-2A Calibration and Products Validation Status. Remote Sens. 2017, 9, 584. [Google Scholar] [CrossRef]
- Kääb, A.; Winsvold, S.H.; Altena, B.; Nuth, C.; Nagler, T.; Wuite, J. Glacier Remote Sensing Using Sentinel-2. Part I: Radiometric and Geometric Performance, and Application to Ice Velocity. Remote Sens. 2016, 8, 598. [Google Scholar] [CrossRef]
- Mueller-Wilm, U.; Devignot, O.; Pessiot, L. Sen2Cor Configuration and User Manual. S2-PDGS-MPC-L2A-SUM-V2.4. 2017. Available online: http://step.esa.int/thirdparties/sen2cor/2.4.0/ Sen2Cor_240_Documenation_PDF/S2-PDGS-MPC-L2A-SUM-V2.4.0.pdf (accessed on 1 December 2017).
- Louis, J.; Debaecker, V.; Pflug, B.; Main-Knorn, M.; Bieniarz, J.; Mueller-Wilm, U.; Cadau, E.; Gascon, F. Sentinel-2 Sen2Cor: L2A processor for users. In Proceedings of the Living Planet Symposium 2016, Prague, Czech Republic, 9–13 May 2016; ESA SP-740. August 2016. [Google Scholar]
- Belgiu, M.; Csillik, O. Sentinel-2 cropland mapping using pixel-based and object-based time weighted dynamic time warping analysis. Remote Sens. Environ. 2018, 204, 509–523. [Google Scholar] [CrossRef]
- Immitzer, M.; Vuolo, F.; Atzberger, C. First Experience with Sentinel-2 Data for Crop and Tree Species Classifications in Central Europe. Remote Sens. 2016, 8, 166. [Google Scholar] [CrossRef]
- Quintano, C.; Fernández-Manso, A.; Fernández-Manso, O. Combination of Landsat and Sentinel-2 MSI data for initial assessing of burn Severity. Int. J. Appl. Earth Obs. Geoinf. 2018, 64, 221–225. [Google Scholar] [CrossRef]
- Verhegghen, A.; Eva, H.; Ceccherini, G.; Achard, F.; Gond, V.; Gourlet-Fleury, S.; Cerutti, P.O. The Potential of Sentinel Satellites for Burnt Area Mapping and Monitoring in the Congo Basin Forests. Remote Sens. 2016, 8, 986. [Google Scholar] [CrossRef]
- Van del Werff, H.; Van der Meer, F. Sentinel-2A MSI and Landsat 8 OLI Provide Data Continuity for Geological Remote Sensing. Remote Sens. 2016, 8, 883. [Google Scholar] [CrossRef]
- Borràs, J.; Delegido, J.; Pezzola, A.; Pereira, M.; Morassi, G.; Camps-Valls, G. Land use classification from Sentinel-2 imagery. Span. J. Remote Sens. 2017, 48, 55–66. [Google Scholar]
- Toming, K.; Kutser, T.; Laas, A.; Sepp, M.; Paavel, B.; Nõges, T. First Experiences in Mapping LakeWater Quality Parameters with Sentinel-2 MSI Imagery. Remote Sens. 2016, 8, 640. [Google Scholar] [CrossRef]
- Harmel, T.; Chami, M.; Tormos, T.; Reynaud, N.; Danis, P.A. Sunglint correction of the Multi-Spectral Instrument (MSI)-SENTINEL-2 imagery over inland and sea waters from SWIR bands. Remote Sens. Environ. 2018, 204, 308–321. [Google Scholar] [CrossRef] [Green Version]
- Sentinel-2 L2A Products Available on Sentinel Hub. Available online: http://www.sentinel-hub.com/blog/sentinel-2-l2a-products-available-sentinel-hub/ (accessed on 1 December 2017).
- Pflug, B.; Main-Knorn, M.; Bieniarz, J.; Debaecker, V.; Louis, J. Early Validation of Sentinel-2 L2A Processor and Products. In Proceedings of the Living Planet Symposium 2016, Prague, Czech Republic, 9–13 May 2016; ESA SP-740. August 2016. [Google Scholar]
- Aerosol Robotic Network. Available online: https://aeronet.gsfc.nasa.gov/ (accessed on 1 December 2017).
- Clevers, J.G.P.W.; Kooistra, L.; Van den Brande, M.M. Using Sentinel-2 Data for Retrieving LAI and Leaf and Canopy Chlorophyll Content of a Potato Crop. Remote Sens. 2017, 9, 405–420. [Google Scholar] [CrossRef]
- Doxani, G.; Vermote, E.; Roger, J.C.; Gascon, F.; Adriaensen, S.; Frantz, D.; Hagolle, O.; Hollstein, A.; Kirches, G.; Li, F.; et al. Atmospheric Correction Inter-Comparison Exercise. Remote Sens. 2018, 10, 352. [Google Scholar] [CrossRef]
- Pesaresi, M.; Corbane, C.; Julea, A.; Florczyk, A.J.; Syrris, V.; Soille, P. Assessment of the Added-Value of Sentinel-2 for Detecting Built-up Areas. Remote Sens. 2016, 8, 299. [Google Scholar] [CrossRef] [Green Version]
- Vuolo, F.; Żółtak, M.; Pipitone, C.; Zappa, L.; Wenng, H.; Immitzer, M.; Weiss, M.; Baret, F.; Atzberger, C. Data Service Platform for Sentinel-2 Surface Reflectance and Value-Added Products: System Use and Examples. Remote Sens. 2016, 8, 938. [Google Scholar] [CrossRef]
- Taberner, M.; Pinty, B.; Govaerts, Y.; Liang, S.; Verstraete, M.M.; Gobron, N.; Widlowski, J.L. Comparison of MISR and MODIS land surface albedos: Methodology. J. Geophys. Res. 2010, 115, D05101. [Google Scholar] [CrossRef]
- Garrigues, S.; Lacaze, R.; Baret, F.; Morisette, J.T.; Weiss, M.; Nickeson, J.E.; Fernandes, R.; Plummer, S.; Shabanov, N.V.; Myneni, R.B.; et al. Validation and intercomparison of global Leaf Area Index products derived from remote sensing data. J. Geophys. Res. 2008, 113, G02028. [Google Scholar] [CrossRef]
- Meroni, M.; Atzberger, C.; Vancutsem, C.; Gobron, N.; Baret, F.; Lacaze, R.; Eerens, H.; Leo, O. Evaluation of agreement between space remote sensing SPOT-VEGETATION fAPAR time series. IEEE Trans. Geosci. Remote Sens. 2013, 51, 1951–1962. [Google Scholar] [CrossRef]
- Weiss, M.; Baret, F. S2ToolBox Level 2 Products. Version 1.1. Date Issued: 02.05.2016. Available online: step.esa.int/docs/extra/ATBD_S2ToolBox_L2B_V1.1.pdf (accessed on 1 December 2017).
- Ji, L.; Gallo, K. An agreement coefficient for image comparison. Photogramm. Eng. Remote Sens. 2006, 72, 823–833. [Google Scholar] [CrossRef]
- Riemann, R.; Wilson, B.; Tyler, B.; Lister, A.; Parks, S. An effective assessment protocol for continuous geospatial data sets. Remote Sens. Environ. 2010, 114, 2337–2352. [Google Scholar] [CrossRef]
- Fernandes, R.; Plummer, S.; Nightingale, J. Global Leaf Area Index Product Validation Good Practices; Committee of Earth Observing Systems Working Group on Calibration and Validation, Land Product Validation Sub-Group: Geneva, Switzerland, 2014; p. 75. [Google Scholar]
- JCGM. Evaluation of Measurement Data—Guide to the Expression of Uncertainty in Measurement. JCGM-100. 2008. Available online: https://www.bipm.org/utils/common/documents/jcgm/JCGM_100_2008_E.pdf (accessed on 1 May 2017).
- ESA Senitenl-2 Team. GMES Sentinel-2 Mission Requirements Document. EOP-SM/1163/MR-dr. Date Issued: 30/01/2017. Available online: https://earth.esa.int/pub/ESA_DOC/GMES_Sentinel2_MRD_issue_2.0_update.pdf (accessed on 1 December 2017).
- Nyeki, S.; Wehrli, C.; Gröbner, J.; Kouremeti, N.; Wacker, S.; Labuschagne, C.; Mbatha, N.; Brunke, E. The GAW-PFR aerosol optical depth network: The 2008–2013 time series at Cape Point Station, South Africa. J. Geophys. Res. Atmos. 2015, 120, 507–508. [Google Scholar] [CrossRef]
- Pérez-Ramírez, D.; Whiteman, D.N.; Smirnov, A.; Lyamani, H.; Holben, B.N.; Pinker, R.; Andrade, M.; Alados-Arboledas, L. Evaluation of AERONET precipitable water vapor versus microwave radiometry, GPS, and radiosondes at ARM sites. J. Geophys. Res. Atmos. 2014, 119, 9596–9613. [Google Scholar] [CrossRef] [Green Version]
- Richter, R.; Louis, J.; Müller-Wilm, U. Sentinel-2 MSI—Level 2A Products Algorithm Theoretical Basis Document; S2PAD-ATBD-0001; 2012; Issue 2.0, Telespazio VEGA Deutschland GmbH: Darmstadt, Germany, 2012. [Google Scholar]
- Miura, T.; Huete, A.R.; Yoshioka, H.; Holben, B.N. An error and sensitivity analysis of atmospheric resistant vegetation indices derived from dark target-based atmospheric correction. Remote Sens. Environ. 2001, 78, 284–298. [Google Scholar] [CrossRef]
Figure 1.
Nominal L1C-TOA granules corresponding to study sites (boxes) and nearest AERONET station (pyramid). Solid lines indicate intercomparison granules (and also validation for La Crau). The dashed lines indicate validation granules.
Figure 1.
Nominal L1C-TOA granules corresponding to study sites (boxes) and nearest AERONET station (pyramid). Solid lines indicate intercomparison granules (and also validation for La Crau). The dashed lines indicate validation granules.

Figure 2.
(a) Sample L1C-TOA products for intercomparison granules containing Barrax, La Crau and Harth shown as a linearly stretched false colour composite; and (b) the Digital Elevation Model for each tile.
Figure 2.
(a) Sample L1C-TOA products for intercomparison granules containing Barrax, La Crau and Harth shown as a linearly stretched false colour composite; and (b) the Digital Elevation Model for each tile.

Figure 3.
AOT (a) and WVP (b) from ESA-L2A and S2C-L2A products derived from the same input ESA-L1C data compared to measurement from coincident AERONET stations.
Figure 3.
AOT (a) and WVP (b) from ESA-L2A and S2C-L2A products derived from the same input ESA-L1C data compared to measurement from coincident AERONET stations.

Figure 4.
Intercomparison of SCL, AOT and WVP maps between S2C-L2A and ESA-L2A products for five dates over Barrax, La Crau and Harth.
Figure 4.
Intercomparison of SCL, AOT and WVP maps between S2C-L2A and ESA-L2A products for five dates over Barrax, La Crau and Harth.

Figure 5.
Comparison of ESA-L2A and S2C-L2A BOA reflectance for Barrax, La Crau and Harth sites.

Figure 6.
Mean and standard deviation (between dates) values of R2 and RMSE between ESA-L2A and S2C-L2A for each MSI band for Barrax, La Crau and Harth.
Figure 6.
Mean and standard deviation (between dates) values of R2 and RMSE between ESA-L2A and S2C-L2A for each MSI band for Barrax, La Crau and Harth.

Figure 7.
(a) Spatial difference maps between S2C-L2A and ESA-L2A BOA reflectance for Barrax, La Crau and Harth; (b) the difference between S2C-L2A and ESA-L2A BOA reflectance as a function of the topographic slope for for Barrax, La Crau and Harth.
Figure 7.
(a) Spatial difference maps between S2C-L2A and ESA-L2A BOA reflectance for Barrax, La Crau and Harth; (b) the difference between S2C-L2A and ESA-L2A BOA reflectance as a function of the topographic slope for for Barrax, La Crau and Harth.

Figure 8.
Density scatter plot of vegetation indices and vegetation bio-physical parameters derived from ESA-L2A compared to those derived from S2C-L2A for Barrax, La Crau and Harth sites.
Figure 8.
Density scatter plot of vegetation indices and vegetation bio-physical parameters derived from ESA-L2A compared to those derived from S2C-L2A for Barrax, La Crau and Harth sites.

Figure 9.
The slope map and the spatial difference maps between S2C-L2A and ESA-L2A BOA vegetation biophysical parameters over Harth site (DOY: 230).
Figure 9.
The slope map and the spatial difference maps between S2C-L2A and ESA-L2A BOA vegetation biophysical parameters over Harth site (DOY: 230).


Table 1.
ESA Sentinel-2 Products.
| Site | Sentinel-2 Granule ID | Acquisition Date (Day of Year) | Local Overpass Time (hh:mm) |
|---|---|---|---|
| Barrax | T30SWJ | 18 June 2017 (169) | 10:56 |
| Barrax | T30SWJ | 28 July 2017 (208) | 10:56 |
| Barrax | T30SWJ | 17 August 2017 (227) | 10:56 |
| Barrax | T30SWJ | 16 October 2017 (286) | 11:00 |
| Barrax | T30SWJ | 26 October 2017 (295) | 11:01 |
| La Crau | T31TGJ | 19 June 2017 (164) | 10:30 |
| La Crau | T31TGJ | 18 August 2017 (223) | 10:30 |
| La Crau | T31TGJ | 7 September 2017 (242) | 10:30 |
| La Crau | T31TGJ | 7 October 2017 (271) | 10:30 |
| La Crau | T31TGJ | 17 October 2017 (280) | 10:30 |
| Harth | T32TLT | 10 April 2017 (088) | 10:30 |
| Harth | T32TLT | 30 April 2017 (107) | 10:30 |
| Harth | T32TLT | 10 May 2017 (116) | 10:30 |
| Harth | T32TLT | 19 June 2017 (155) | 10:30 |
| Harth | T32TLT | 18 August 2017 (214) | 10:30 |
Table 2.
The Sentinel-2 spectral bands evaluated in this study.
| Sentinel-2 Bands | Central Wavelength (µm) | Resolution (m) |
|---|---|---|
| Band 2—Blue | 0.490 | 10 |
| Band 3—Green | 0.560 | 10 |
| Band 4—Red | 0.665 | 10 |
| Band 5—Vegetation Red Edge (VRE-1) | 0.705 | 20 |
| Band 6—Vegetation Red Edge (VRE-2) | 0.740 | 20 |
| Band 7—Vegetation Red Edge (VRE-3) | 0.783 | 20 |
| Band 8A—NIR | 0.865 | 20 |
| Band 11—SWIR (SWIR-1) | 1.610 | 20 |
| Band 12—SWIR (SWIR-2) | 2.190 | 20 |
© 2018 by the authors. Licensee MDPI, Basel, Switzerland. This article is an open access article distributed under the terms and conditions of the Creative Commons Attribution (CC BY) license (http://creativecommons.org/licenses/by/4.0/).
Share and Cite
MDPI and ACS Style
Djamai, N.; Fernandes, R. Comparison of SNAP-Derived Sentinel-2A L2A Product to ESA Product over Europe. Remote Sens. 2018, 10, 926. https://0-doi-org.brum.beds.ac.uk/10.3390/rs10060926
AMA Style
Djamai N, Fernandes R. Comparison of SNAP-Derived Sentinel-2A L2A Product to ESA Product over Europe. Remote Sensing. 2018; 10(6):926. https://0-doi-org.brum.beds.ac.uk/10.3390/rs10060926
Chicago/Turabian StyleDjamai, Najib, and Richard Fernandes. 2018. "Comparison of SNAP-Derived Sentinel-2A L2A Product to ESA Product over Europe" Remote Sensing 10, no. 6: 926. https://0-doi-org.brum.beds.ac.uk/10.3390/rs10060926
Note that from the first issue of 2016, this journal uses article numbers instead of page numbers. See further details here.