Article

Climate Sensitivity of High Arctic Permafrost Terrain Demonstrated by Widespread Ice-Wedge Thermokarst on Banks Island

1
Canada Centre for Mapping and Earth Observation, Natural Resources Canada, Ottawa, ON K1A 0E4, Canada
2
Northwest Territories Geological Survey, Government of Northwest Territories, Yellowknife, NT X1A 2L9, Canada
3
School of Environmental Studies, University of Victoria, Victoria, BC V8P 5C2, Canada
4
Department of Geography, University of Ottawa, Ottawa, ON K1N 6N5, Canada
*
Author to whom correspondence should be addressed.
Submission received: 29 March 2018 / Revised: 12 May 2018 / Accepted: 12 June 2018 / Published: 15 June 2018
(This article belongs to the Special Issue Remote Sensing of Dynamic Permafrost Regions)

Abstract

:
Ice-wedge networks underlie polygonal terrain and comprise the most widespread form of massive ground ice in continuous permafrost. Here, we show that climate-driven thaw of hilltop ice-wedge networks is rapidly transforming uplands across Banks Island in the Canadian Arctic Archipelago. Change detection using high-resolution WorldView images and historical air photos, coupled with 32-year Landsat reflectance trends, indicate broad-scale increases in ponding from ice-wedge thaw on hilltops, which has significantly affected at least 1500 km2 of Banks Island and over 3.5% of the total upland area. Trajectories of change associated with this upland ice-wedge thermokarst include increased micro-relief, development of high-centred polygons, and, in areas of poor drainage, ponding and potential initiation of thaw lakes. Millennia of cooling climate have favoured ice-wedge growth, and an absence of ecosystem disturbance combined with surface denudation by solifluction has produced high Arctic uplands and slopes underlain by ice-wedge networks truncated at the permafrost table. The thin veneer of thermally-conductive mineral soils strongly links Arctic upland active-layer responses to summer warming. For these reasons, widespread and intense ice-wedge thermokarst on Arctic hilltops and slopes contrast more muted responses to warming reported in low and subarctic environments. Increasing field evidence of thermokarst highlights the inherent climate sensitivity of the Arctic permafrost terrain and the need for integrated approaches to monitor change and investigate the cascade of environmental consequences.

Graphical Abstract

1. Introduction

Ice wedges form due to thermal contraction, cracking of the ground and infilling typically by snowmelt that refreezes to form a vein of ice [1,2]. Over millennia, repeated cracking can cause large ice wedges to develop [3]. Polygonal terrain, the surface expression of ice-wedge networks, is ubiquitous in unconsolidated deposits throughout the circumpolar Arctic [4]. Because wedge ice is typically encountered near the top of permafrost, climate-driven thaw may cause ponding in troughs and in extreme cases thaw lake development [5,6,7], the formation of high-centred polygons [8], and the reconfiguration of hydrological pathways [9,10]. The broad distribution and thaw sensitivity of ice-wedge networks suggests that evolution of polygonal terrain will have a major influence on landscape form and ecological and biogeochemical processes across a warming circumpolar Arctic.
In the Canadian Arctic, hilltops and slopes dissected by large epigenetic and anti-syngenetic ice wedges [3] are proving extremely sensitive to climate warming. Millennia of cooling during the Holocene [11] have favoured the growth of large ice wedges [12]. On Banks Island and in other similar high Arctic landscapes, the absence of surface disturbances, such as fire [13] and the gradual surface denudation of hilltops and slopes by solifluction [14], has produced upland terrain underlain by anti-syngenetic ice-wedge networks that grow downward on receding slopes where there is a net removal of surface material (Figure 1) [3,15]. These conditions increase the likelihood that wedge ice and relict Pleistocene massive ice are encountered at or close to the base of the contemporary active layer (Figure 1; Table S2) [16,17,18]. Sparsely vegetated barrens in the high Arctic lack an organic layer, which would otherwise act to buffer the effects of summer warming on active layer development [19] or drive feedbacks that typically stabilise thermokarst in subarctic and low-Arctic environments [6,7,20]. These factors combine to heighten the sensitivity of cold Arctic permafrost terrain to abrupt climate-driven thaw, contrasting with the more subdued or localised responses of ecosystem protected, low-Arctic permafrost environments [7,16,17,21,22].
In this paper, we integrate several remote-sensing datasets with field-based observations to demonstrate the climate sensitivity of high Arctic permafrost terrain. Specifically, we show that ice-wedge degradation is transforming large areas of upland terrain on Banks Island in the Canadian Arctic Archipelago. Our observations provide the first broad-scale assessment of recent, climate-driven ice-wedge degradation and document the distribution and nature of changes impacting uplands across an archetypal, glaciated high Arctic environment. We integrate fine-scale mapping of change with analysis of 32-year trends in reflectance based on the Landsat satellite archive to show that broad-scale wetting trends have been caused by recent trough subsidence and ponding related to upland ice-wedge thermokarst. We also integrate field data on arctic active layer responses to summer warming with stratigraphic observations of upland ground ice conditions to support a simple geomorphic model to explain the sensitivity of Arctic upland terrain ice-wedge thermokarst. We demonstrate that landscape context can determine the trajectories of ice-wedge thermokarst ranging from high-centred polygon development in well-drained areas to potential thaw-lake initiation on ice-cored moraine in locations where drainage is poor. The research highlights that multiscale remote-sensing techniques integrated with local-scale permafrost observations can provide new insights on the patterns, processes, and drivers of Arctic change.

2. Study Area

Banks Island (70,028 km2) in the western Canadian Arctic Archipelago (Figure 2) is comprised of relatively low-lying, undulating, glaciated terrain underlain by cold, ice-rich permafrost [23,24,25]. Tertiary and Cretaceous bedrock [26] are veneered by till and glaciofluvial deposits [23]. The late Wisconsinan glaciation deposited prominent ice-cored moraine belts and broad glaciofluvial surfaces formed by meltwater from the decaying Laurentide Ice Sheet [24].
Banks Island is characterised by a cold, Arctic climate. Sachs Harbour climate normals (1981–2010) indicate that the mean annual air temperature is −13 °C with an average July temperature of 7 °C and an average February temperature of −28 °C. The total mean annual precipitation is about 200 mm, more than half of which falls as snow that is redistributed by winds from barren uplands into topographic hollows and valleys [25]. The permafrost is cold with mean annual ground temperatures below −12 °C [27]. The widespread distribution of periglacial features, such as sorted stripes, polygonal terrain, thermokarst lakes, and retrogressive thaw slumps reflect cold climate and permafrost conditions that have preserved relict Pleistocene ice and favoured the development of ice-wedge networks [17,25,28].
The extent and composition of the vegetation on Banks Island is the product of topography, parent material, and moisture [29]. Well-drained, partially vegetated upland surfaces are commonly dominated by Arctic willow (Salix arctica), mountain avens (Dryas integrifolia), and dryland sedges [29,30]. In lowlands, the increased moisture supply facilitates continuous vegetation cover dominated by sedges (Carex spp. Eriophorum sp), various herbs, Arctic willow (Salix arctica), mosses, and lichen [29,30].
The climate in the western Canadian Arctic is rapidly changing. Temperature data from Sachs Harbour on the southwestern coast of Banks Island for the period of 1956–2016 indicates a 3.5 °C increase in the mean annual air temperature (MAAT) (Figure S1a), a 1.8 °C increase in the mean June–August summer temperature (MST), and four recent years (1998, 2010, 2011, 2012) with summer thawing degree-days >50% higher than the long-term average of 460 °C (Figure 3a). Temperature trends computed at the centre of Banks (73N, 121W) using the Global Historical Climatology Network (GHCN) v3 dataset also show that MAAT and MST have increased by +2.9 °C and +1.3 °C between 1956–2016 [31]. Long-term changes in total annual precipitation on Banks Island are less apparent. Data from the Climate Research Unit (CRU) TS 2.0 model indicate that the mean annual precipitation increased by 23.2 mm (≈12% of the long-term average) during the period of 1956–2000 [32], while June–August summer precipitation has not changed significantly. Summer precipitation data from the Sachs Harbour airport for 1956–2016 do not show a long-term trend (Figure S1b).

3. Materials and Methods

We analysed several remote-sensing datasets to quantify changes in upland ice-wedge melt pond occurrence on Banks Island. Medium resolution Landsat and Sentinel-2 imagery were used to delineate the island-wide extent of upland terrain with increasing melt pond area and to indicate the timing of pond expansion. Detailed mapping of melt ponds within the eight study areas using high-resolution WorldView images and historical air photos was used to corroborate and more precisely characterise pond changes. The results from these remote-sensing analyses were interpreted using climate data, in situ thaw depth measurements, ground ice stratigraphic observations, oblique air and ground photos, and high-resolution ArcticDEM elevation models.

3.1. Remote-Sensing Datasets and Image Processing

3.1.1. Landsat Imagery

We conducted trend analysis of 30 m resolution Landsat imagery from the 32-year historical archive to map landscapes across Banks Island showing changes in the area of large, ice-wedge melt ponds. Landsat images from the Landsat 5 TM, Landsat 7 ETM+, and Landsat 8 OLI instruments were obtained from the USGS EarthExplorer for 15 overlapping WRS-2 frames covering Banks Island. Adjacent paths at this latitude have high overlap, providing coverage of any given location by 2–3 frames. All images with nominal cloud cover over land less than 70% were acquired from a 14 July to 16 August annual collection window to avoid snow cover or high wetness during spring runoff. This yielded 491 images from the period of 1985–2017. Landsat images with Level-1TP processing level were converted to top-of-atmosphere (TOA) reflectance using Landsat coefficients following [33] and screened for cloud and shadow using the C Function of Mask (CFMask) channel provided with Landsat Collection 1 data. Pixel-level trends for the 1.6 μm shortwave infrared (SWIR) channel were derived using Theil–Sen robust regression and Mann–Kendall trend significance based on an average of 68 nominally clear observations (SD = 10.5).

3.1.2. Copernicus Sentinel-2 Imagery

Sentinel-2 multispectral data were acquired from the USGS Earth Explorer, which provided 10 m resolution visible and near-infrared spectral bands as Level-1C TOA reflectance data. Imagery in Geographic Markup Language JPEG2000 (GMLJP2) format providing 100 km × 100 km tiles for 19 July 2017 were mosaicked to form a continuous, near cloud-free coverage of Banks Island (Figure 2). The Normalised Difference Vegetation Index (NDVI), providing a measure of leaf area or phytomass, was calculated from the normalised difference between Sentinel-2′ s near-infrared and red channels.

3.1.3. High-Resolution WorldView Imagery

Table S1 provides specifications for summer WorldView-1 and WorldView-2 optical satellite images that were used to precisely map the recent distribution and size of melt ponds within the eight study areas (Figure 2). These images were orthocorrected using PCI OrthoEngine software based on rational polynomial coefficients and elevations from the Canadian Digital Elevation Data (CDED) product. Ice-wedge melt ponds within upland areas were delineated in each image using image segmentation followed by interactive thresholding. For segmentation, the mean segment shift function in ArcGIS was used with settings of 20 for spatial and spectral detail and 64 (or 16 m2) for minimum segment size.

3.1.4. Historical Air Photos

The most recent air photo coverage from the Canadian National Air Photo Library for most of Banks Island is limited to 1:100,000 scale panchromatic imagery acquired during the late 1950s to early 1960s. Photos at 1:100,000 scale (1:60,000 for area 4) covering the eight high-resolution study areas (Table S1) were scanned at 1200 dpi and rectified to the high-resolution satellite imagery using 11–17 stable control points and a second-order polynomial warp. The scanned images have a pixel size of 2 m but can effectively resolve water bodies only larger than about 4 m in extent. This would be sufficient to detect the vast majority of new ice-wedge melt ponds mapped using the high-resolution satellite imagery, in which ponds larger than 100 m2 account for 73% of their total area. Ice-wedge melt ponds occurring in the historical air photos were mapped using manual digitization instead of an automated approach to account for sometimes subtle differences in texture and brightness between melt ponds and patches of graminoid vegetation. We tested the repeatability of this approach by having a second analyst independently extract melt ponds within study area 5 that contained the highest density of ponds. This repeat delineation identified 167 ponds (vs. 192) covering a 19% larger total area, which is small in relation to the average tenfold long-term change in area we report here. In cases where the identification of features as ponds was ambiguous, we classified them as ponds to yield a conservative assessment of increases in melt pond extent. To provide a consistent basis for comparing the historical and current high-resolution melt pond areas, only ponds larger than 16 m2 were considered from the analysis of the 0.5 m satellite imagery. This comparison also did not consider any larger ponds included in the National Hydro Network or melt ponds lying within more productive lowland tundra that was classified using the Sentinel-2 imagery.

3.1.5. ArcticDEM Elevation Models

We used two ArcticDEM elevation models to characterise the microtopography of two degraded ice-wedge polygon landscapes (study areas 2 and 3) in eastern Banks Island. The ArcticDEM Strip products downloaded from the Polar Geospatial Center (https://www.pgc.umn.edu/data/arcticdem/) provide 2 m resolution and were generated from stereopairs of 0.5 m resolution panchromatic WorldView satellite images. This DEM resolution is sufficient to quantify topography within the >20 m wide, sloping ice-wedge troughs in the landscapes examined. Although we did not validate the accuracy of the ArcticDEM over this terrain, the high degree of contrast and small, distinct features visible in the WorldView images used in this study (Figure S8) suggest that the auto-correlation feature matching techniques used should perform optimally.

3.2. Climate Data

We downloaded daily temperature data for Sachs Harbour for the period of 1956–2016 from Environment Canada. Gaps in daily temperature data of up to five days were linearly interpolated, and years having gaps longer than five days were discarded (i.e., 1960, 1989–1991, 1993). Thawing degree-days for each year were calculated based on cumulative, mean daily temperatures above 0 °C. Sachs Harbour summer (June–August) precipitation amounts for 1956–2008 were derived from the Environment Canada Adjusted Precipitation for Canada dataset [34]. We adjusted raw precipitation amounts for 2009–2017 using a regression relationship between the raw and corrected 1956–2008 data (assuming similar correction biases), which increased the total June–August precipitation by an average of 13 mm.
Thawing degree-days were also calculated for five, early to mid-July dates during 2010–2014 (Figure 3b) using daily Environment Canada temperature data from Green Cabin, Banks Island (Thomsen River station located at 73°13′51″N, 119°32′18″W). A square root transformation of these values was related to concurrent thaw depth measurements from Green Cabin (Section 3.3) using linear least-squares regression. Temperature data at this station are not available for 2015, so the strong linear relationship between 31 July 2010–2014 Sachs Harbour and Green Cabin thawing degree-days (r2 = 0.975) was used to estimate thawing degree-days for Green Cabin on 3 July 2015.

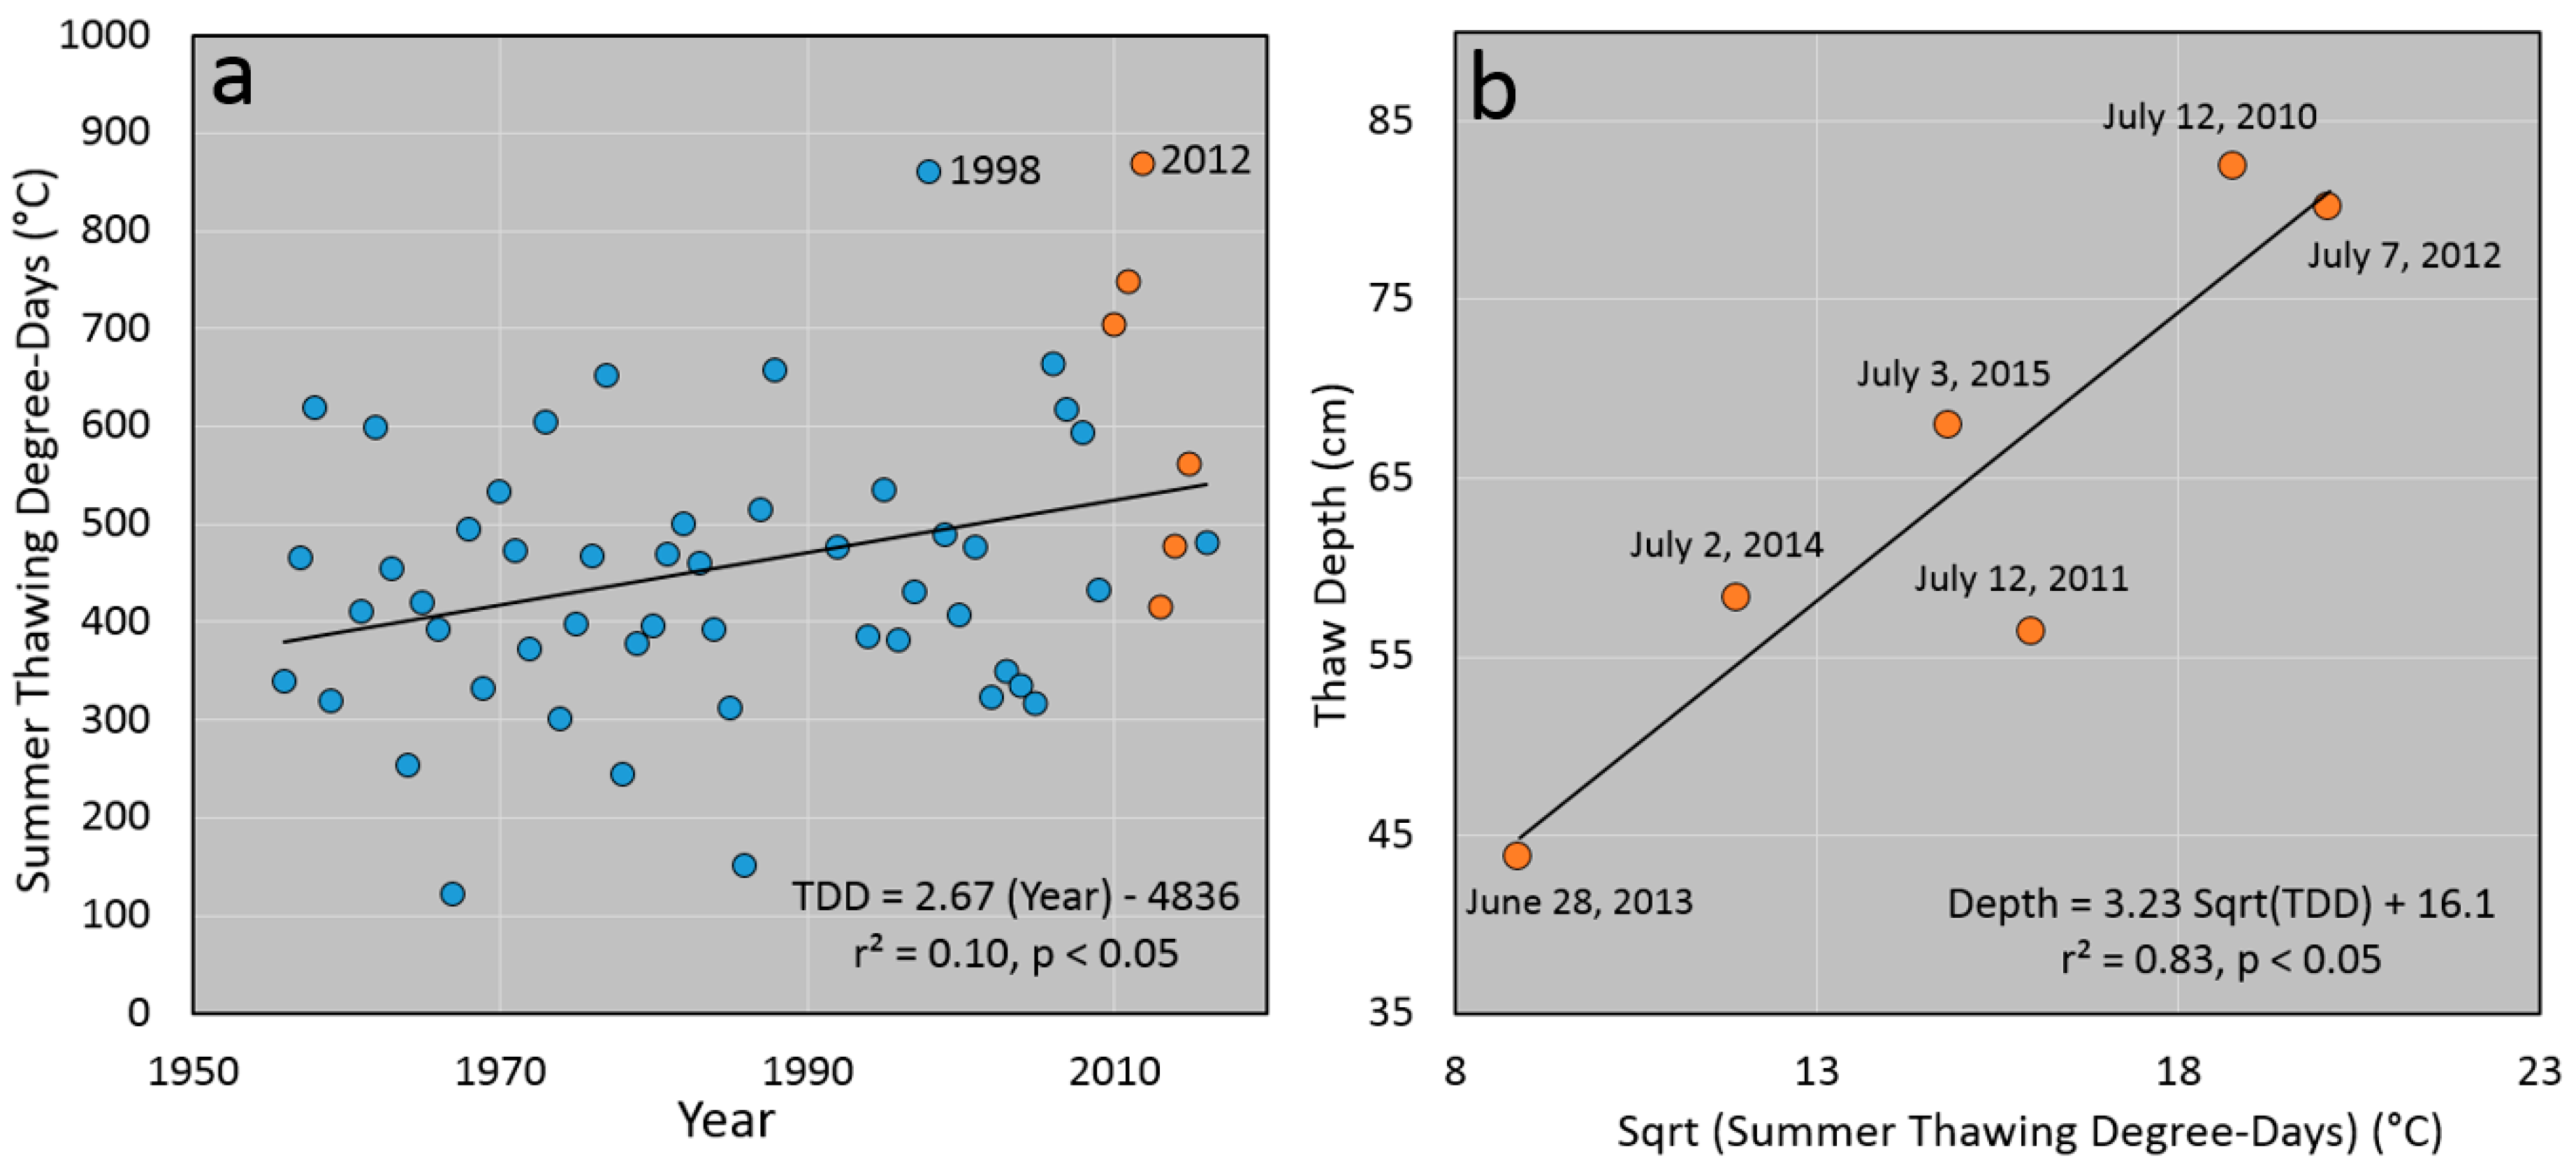
3.3. Thaw Depth Measurements at Green Cabin, Banks Island

Early summer thaw depth measurements were collected by Parks Canada for six years (2010–2015) at Green Cabin, located on north-central Banks Island (73.22°N, 119.56°W) in Aulavik National Park. The sampling area is situated on a flat terrace (30 m elevation) by the Thomsen River, which contains sparse vegetation, hummocky patterned ground, and sandy, gravelly soils. Three active layer probe measurements were taken at each of 36 locations within a 50 m by 50 m grid according to the Circumpolar Active Layer Monitoring (CALM) protocol. We averaged the 108 probe measurements taken each year and compared these depths to cumulative thaw degree-days for each sampling date.

3.4. Ground Ice Stratigraphic Observations

To illustrate the absence of a transient layer and the close proximity of wedge ice and massive ground ice to the terrain surface, we recorded observations of material thickness overlying massive ice in thaw slump and coastal exposures on southern Banks Island during fieldwork in summer 2015. In thaw slump exposures, measurements of overburden thickness were taken at 10–20 m intervals along the top edge of the headwall. Measurement of overburden thickness was taken at all ice wedges (IW) observed in the respective exposures (Table S2). Photographs of thaw slump headwalls from northern Banks Island (Figures S2–S4) illustrate the thin veneer of materials overlying wedge ice hosted in ice-rich permafrost.

3.5. Remote-Sensing Analyses of Melt Pond Changes

The Landsat satellite image archive provides a more than 30-year record of 30 m resolution multispectral imagery [35]. This record has proven valuable to study recent changes in Arctic vegetation [36,37,38], lake area [39], and landscape disturbances [38,40,41]. A general limitation of using Landsat imagery to detect ice-wedge degradation is that changes in the area of melt ponds are typically much smaller than the 900 m2 pixel footprints [7,9,20]. However, on Banks Island, a visual comparison of early archive (~1985) and late archive (~2017) summer Landsat images reveals that new melt ponds are sufficiently large to be widely detectable as a textured, darkening of the land surface (Figure 1). We used Landsat imagery as the foundation for a melt pond change analysis covering all the upland areas of Banks Island. We also analysed the finer resolution WorldView and aerial imagery to corroborate and more precisely characterise pond development in polygonal terrain and conducted fieldwork to describe the terrain sensitivity to climate-driven top-down thaw. These activities involved the following analyses.

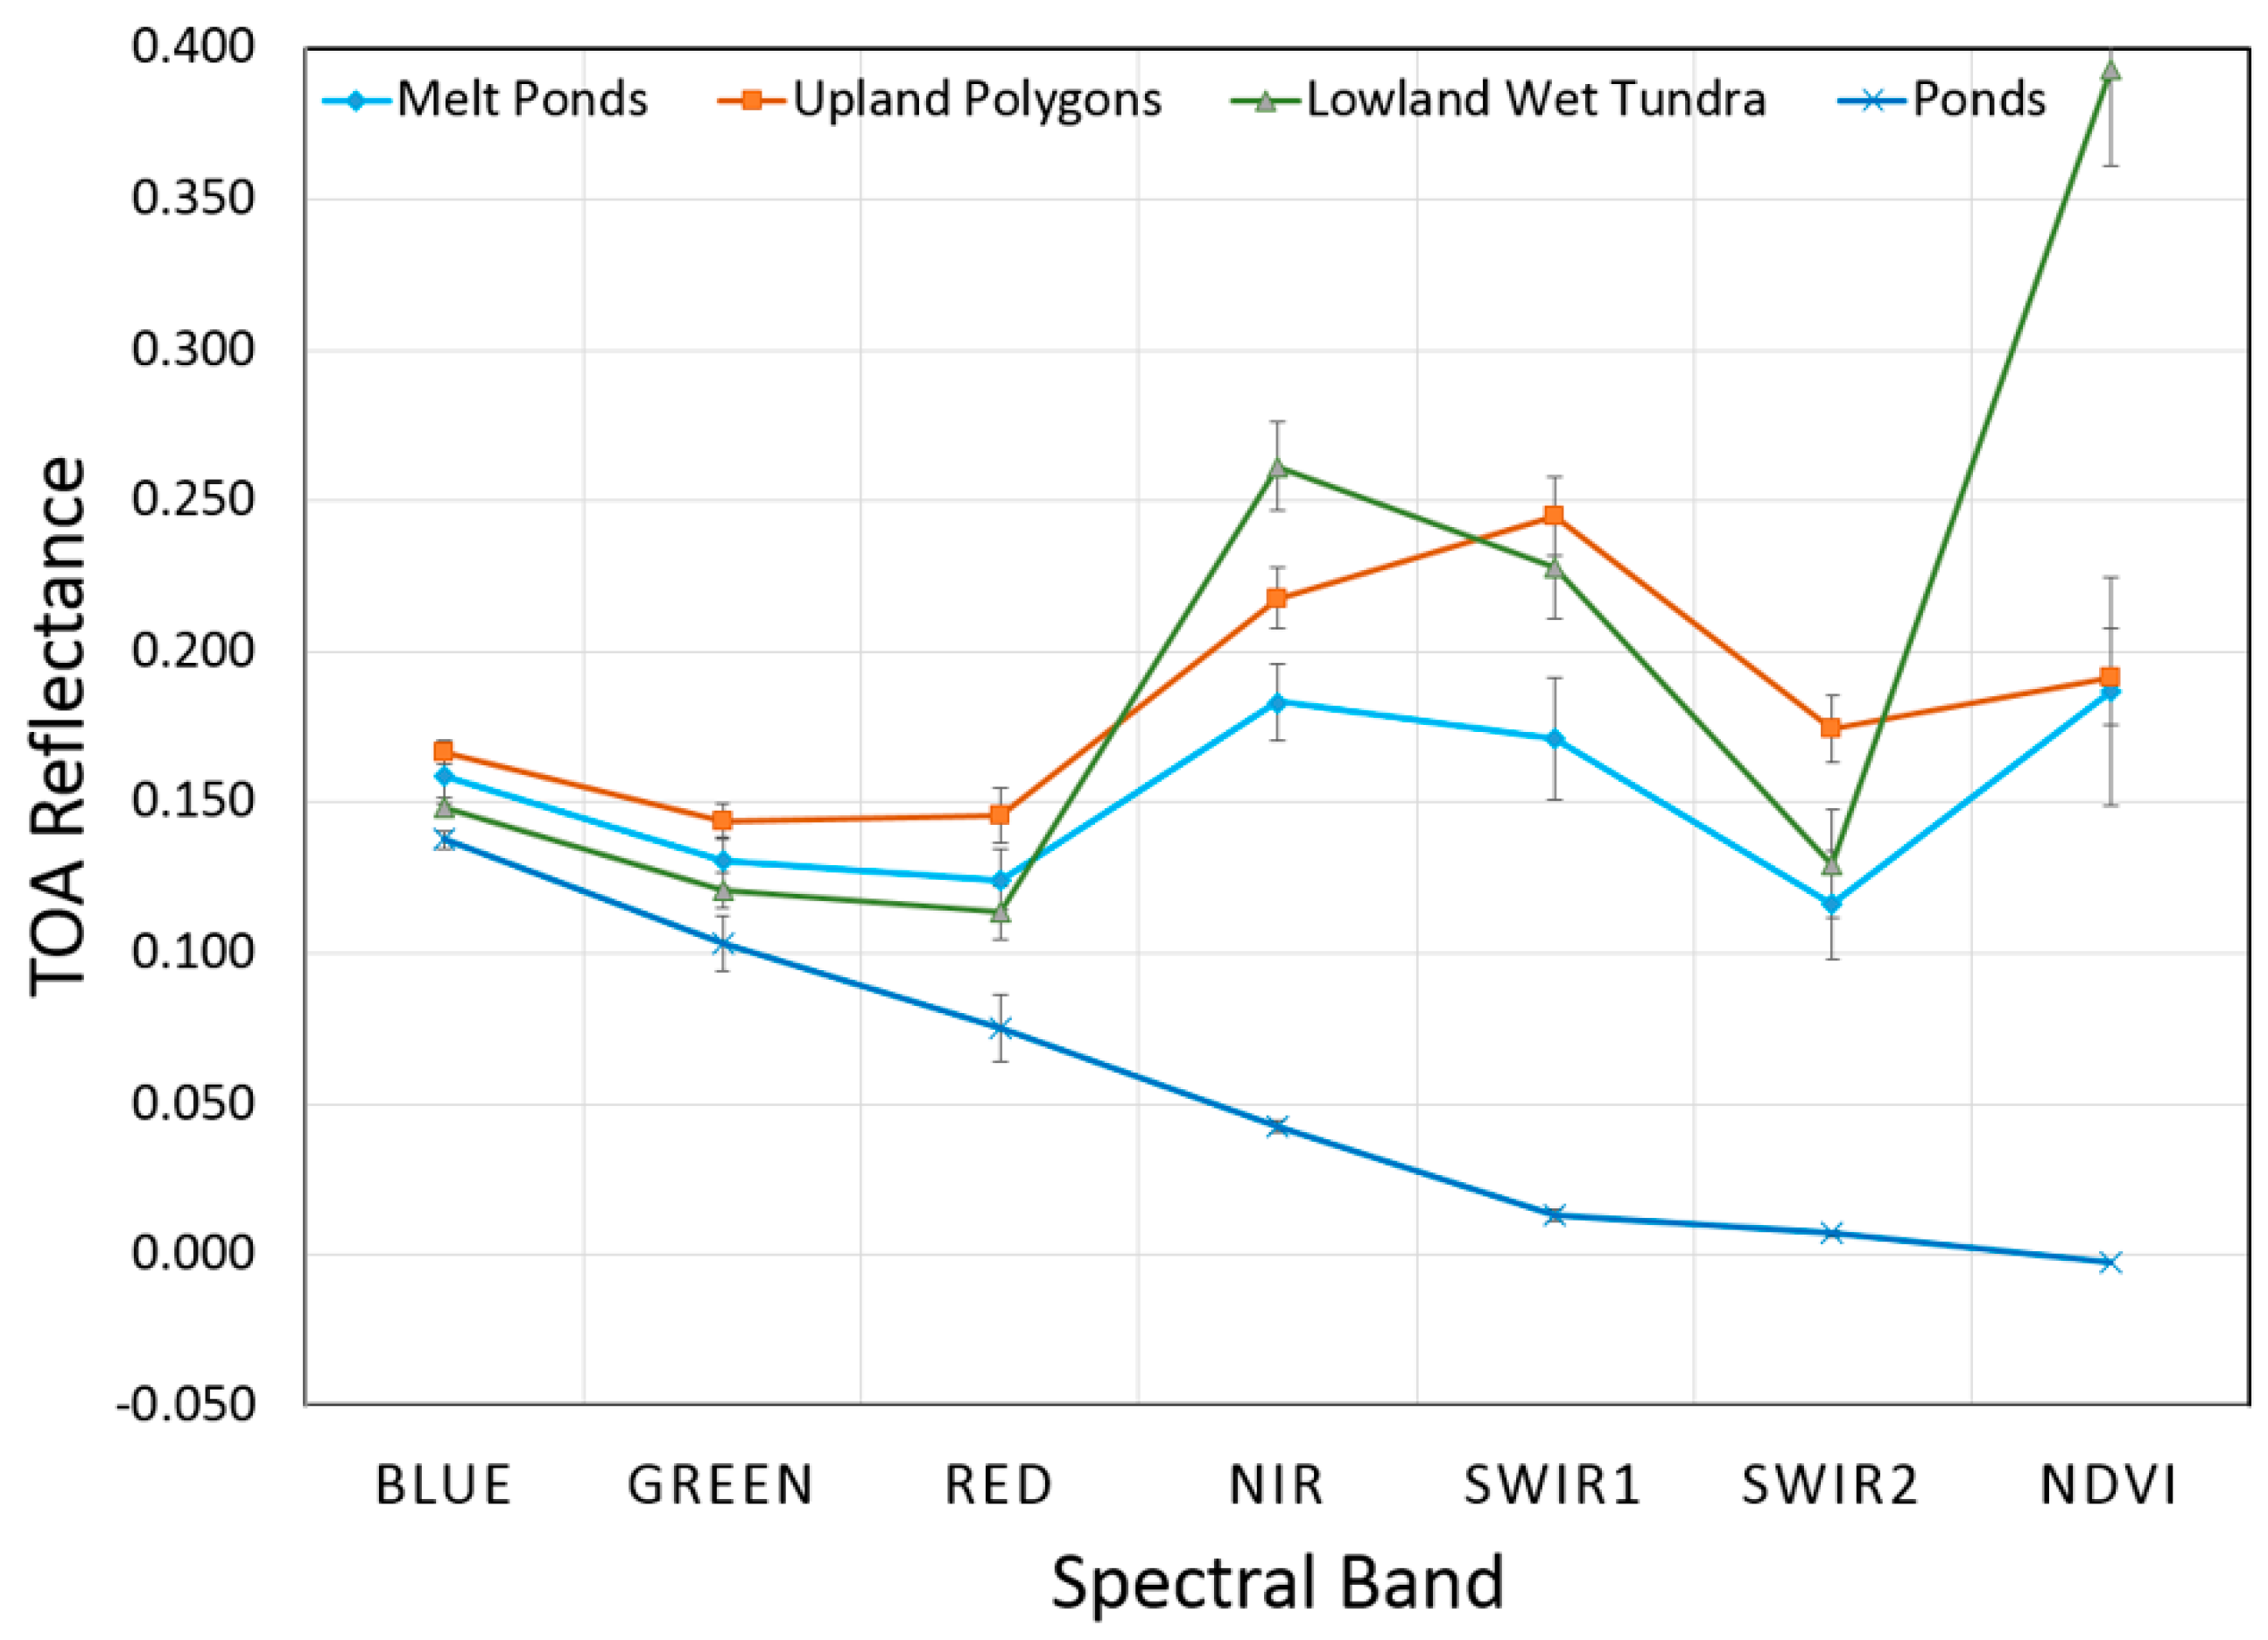
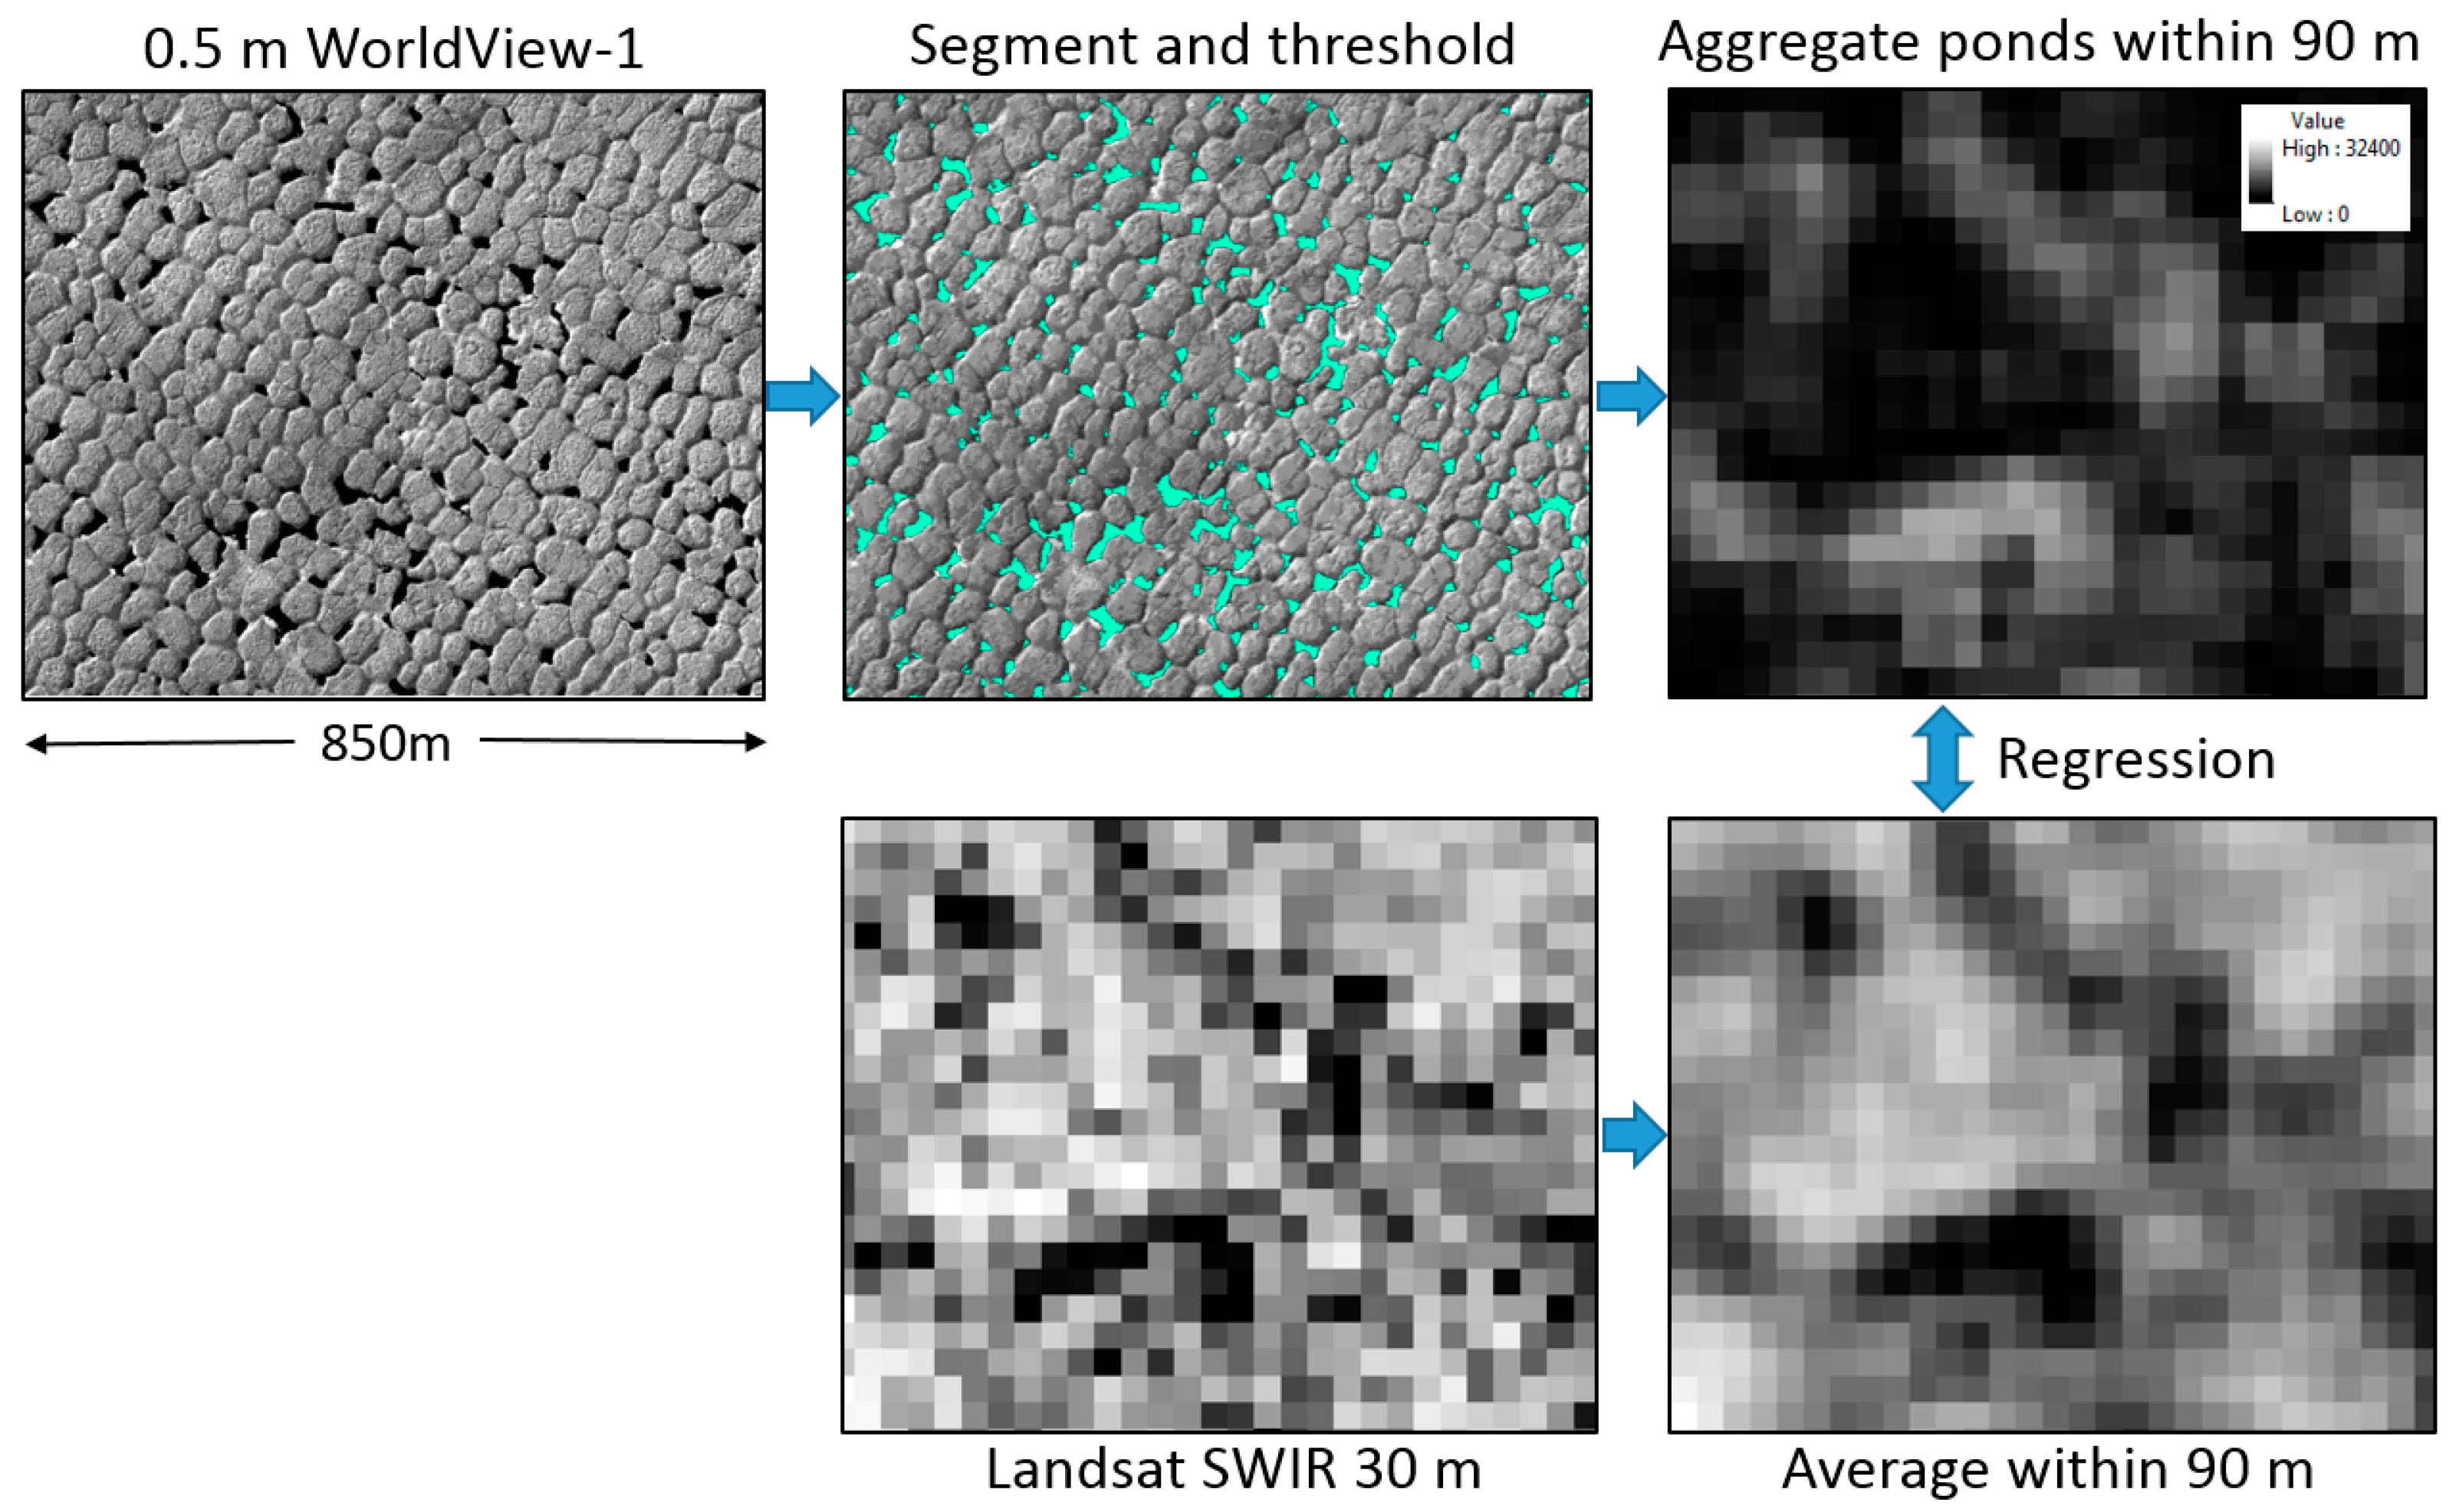
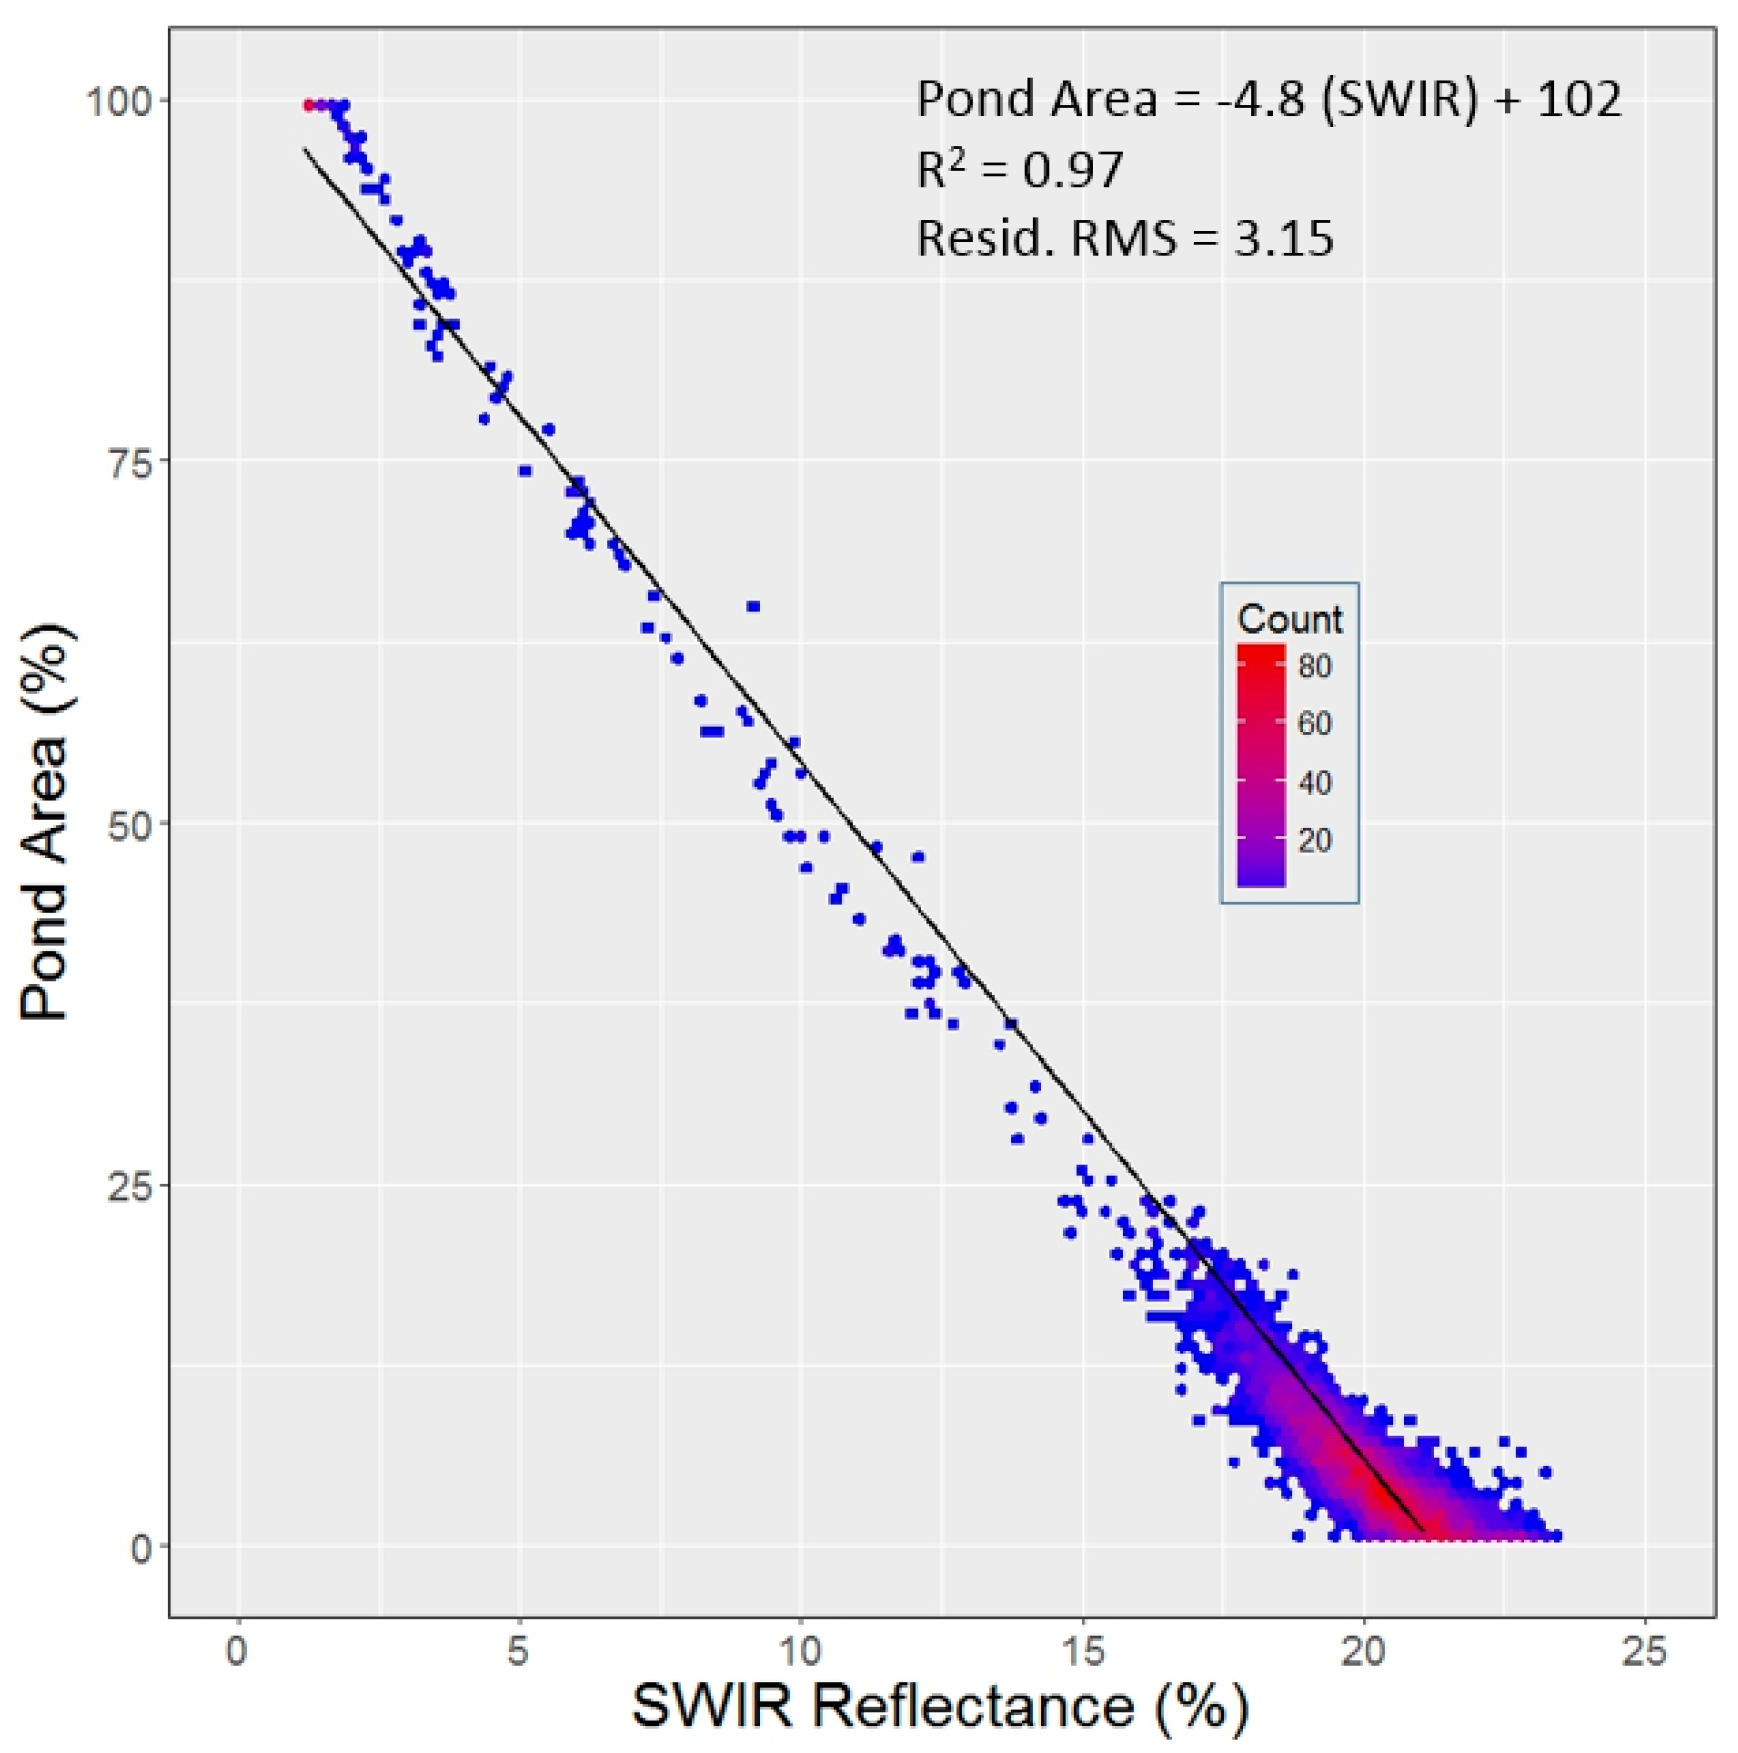
3.5.1. Characterising the Relationship between Ice-Wedge Melt Pond Area and Landsat Reflectance

Water bodies absorb almost all solar radiation in the short-wave infrared (SWIR) wavelengths [42], while tundra vegetation is relatively SWIR-reflective, providing excellent contrast between these two surfaces (Figure A1). The inverse relationship between the ice-wedge melt pond area and SWIR reflectance provided the basis for our Landsat analysis. Melt ponds were mapped within a 5.4 km2 area on eastern Banks Island at 0.5 m resolution by applying spatial segmentation and thresholding to a WorldView optical satellite image from 11 August 2013. The melt pond areas were then summed within 6206 corresponding Landsat 30 m pixel footprints, averaged over 3-by-3 Landsat pixel blocks, and regressed against 1.6 μm SWIR reflectance from a Landsat 8 image acquired one day earlier. Additional details for this comparison are provided in Appendix A.

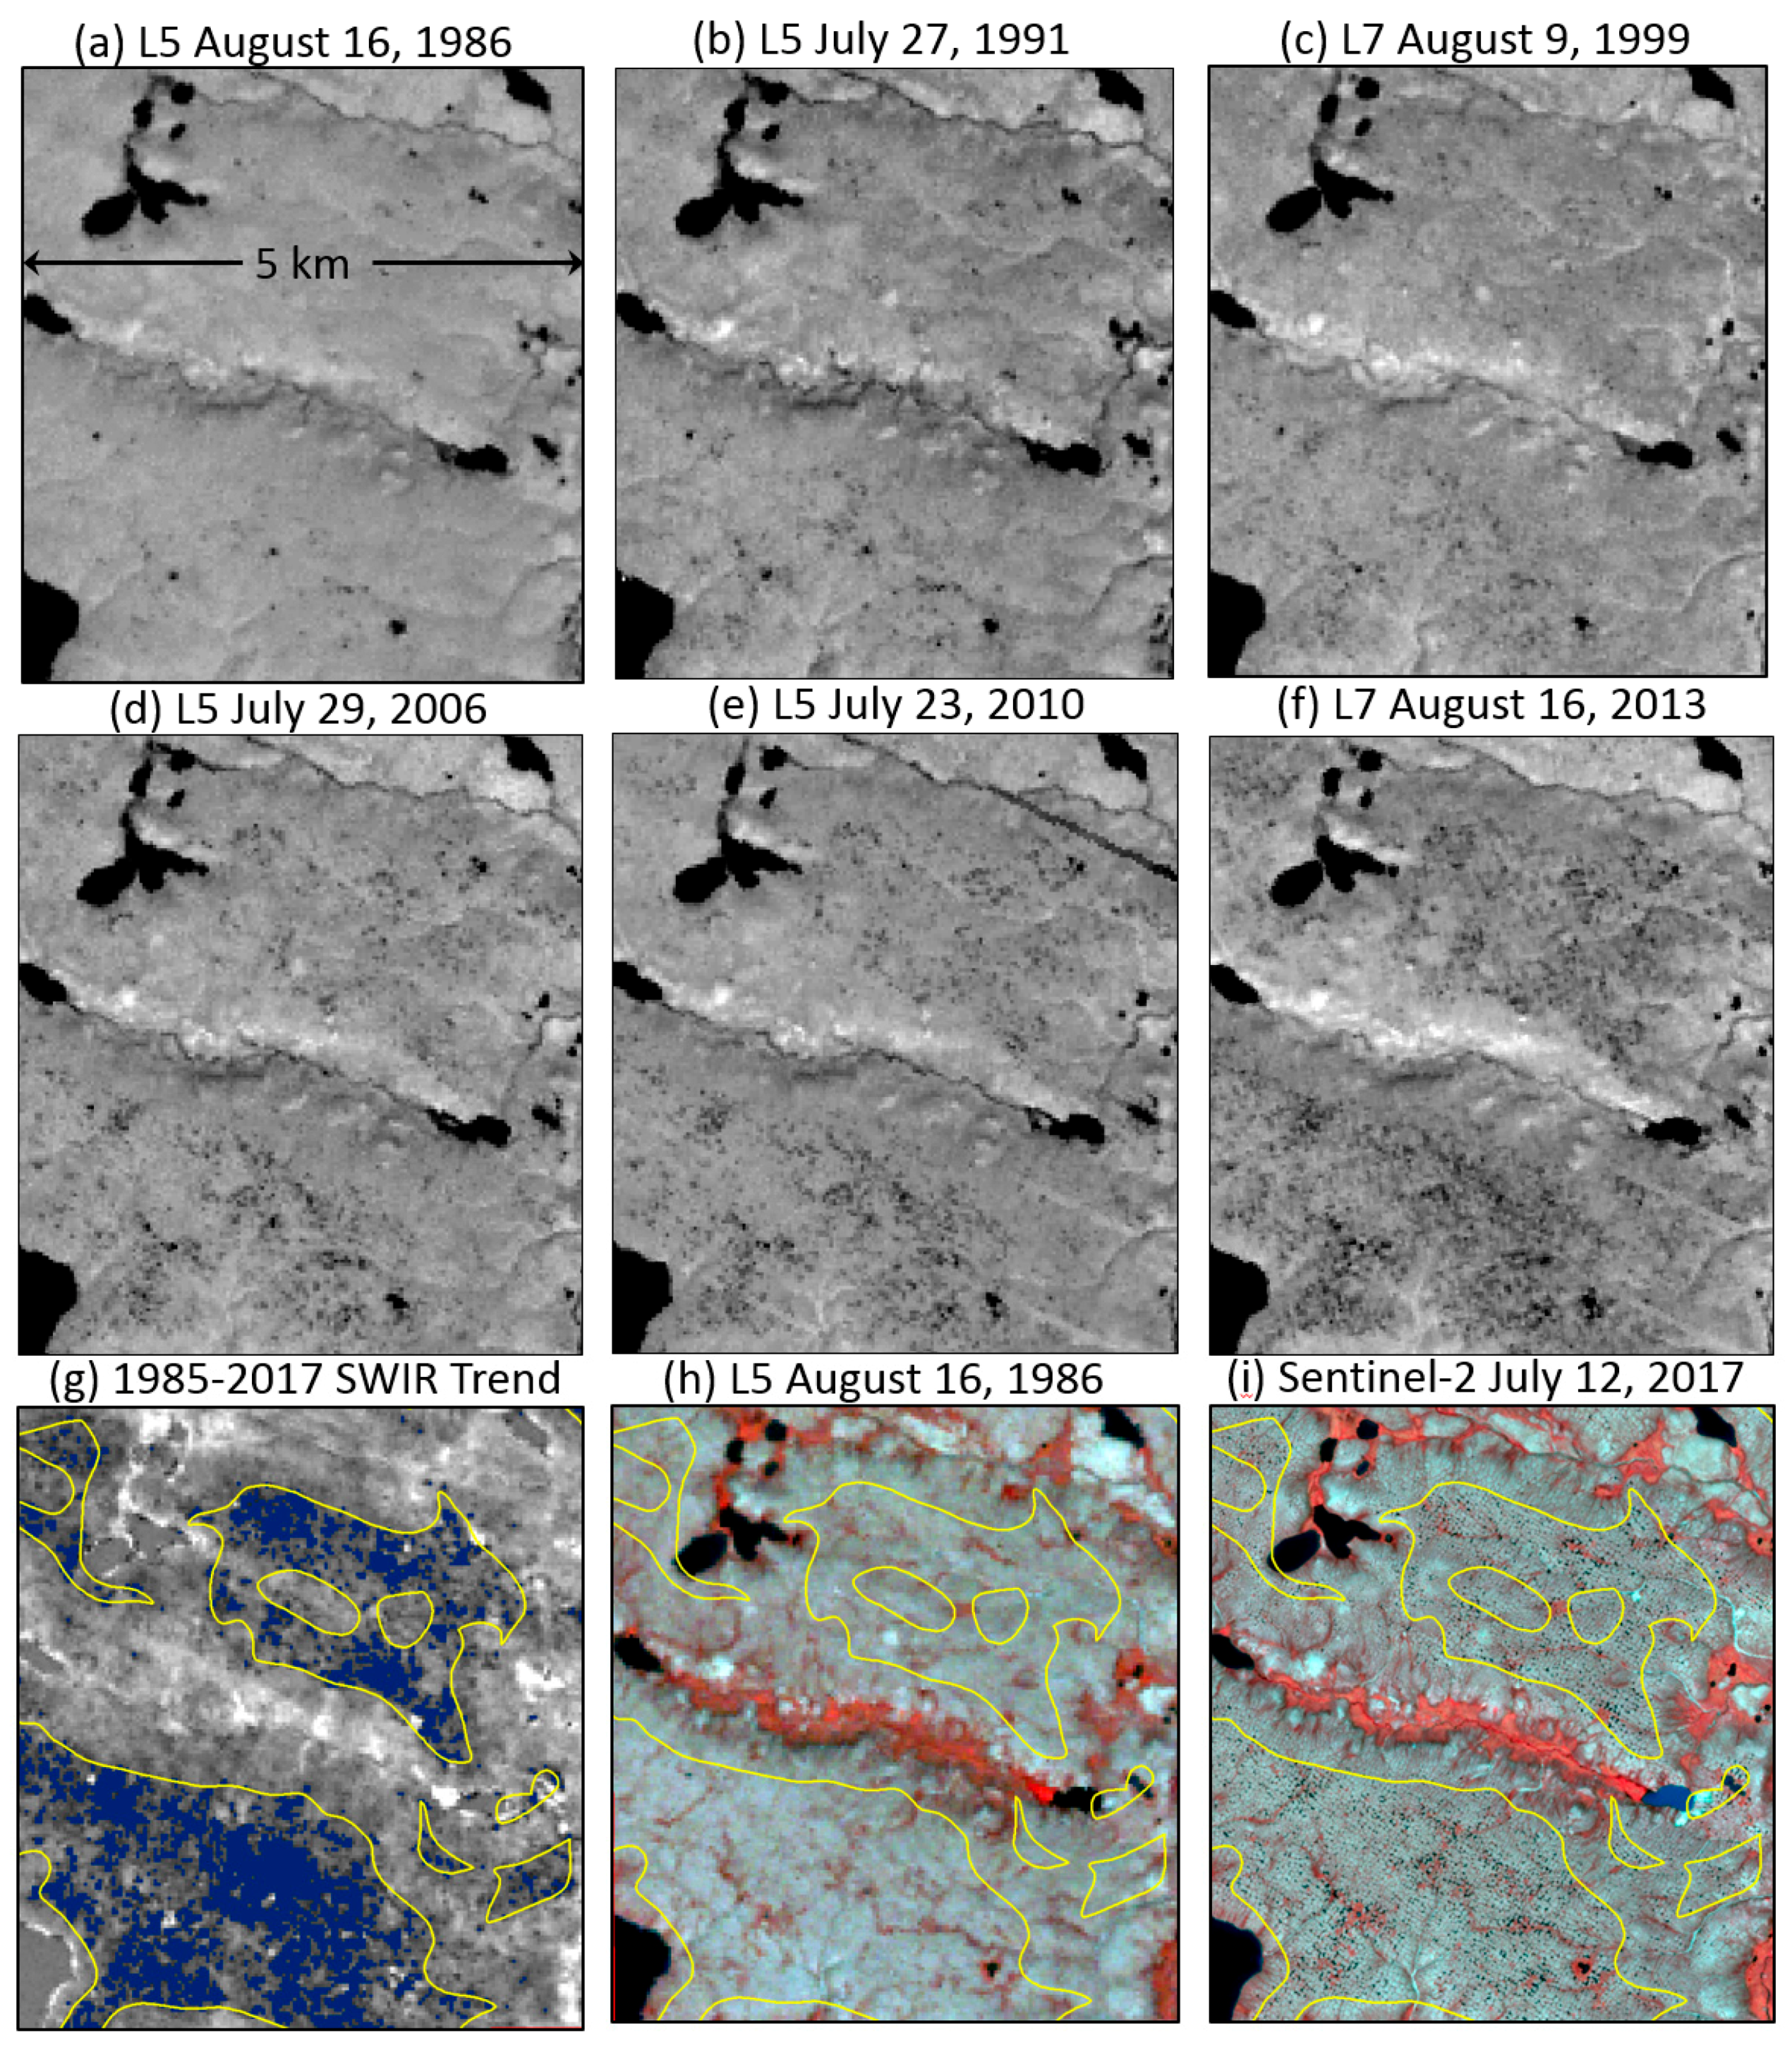
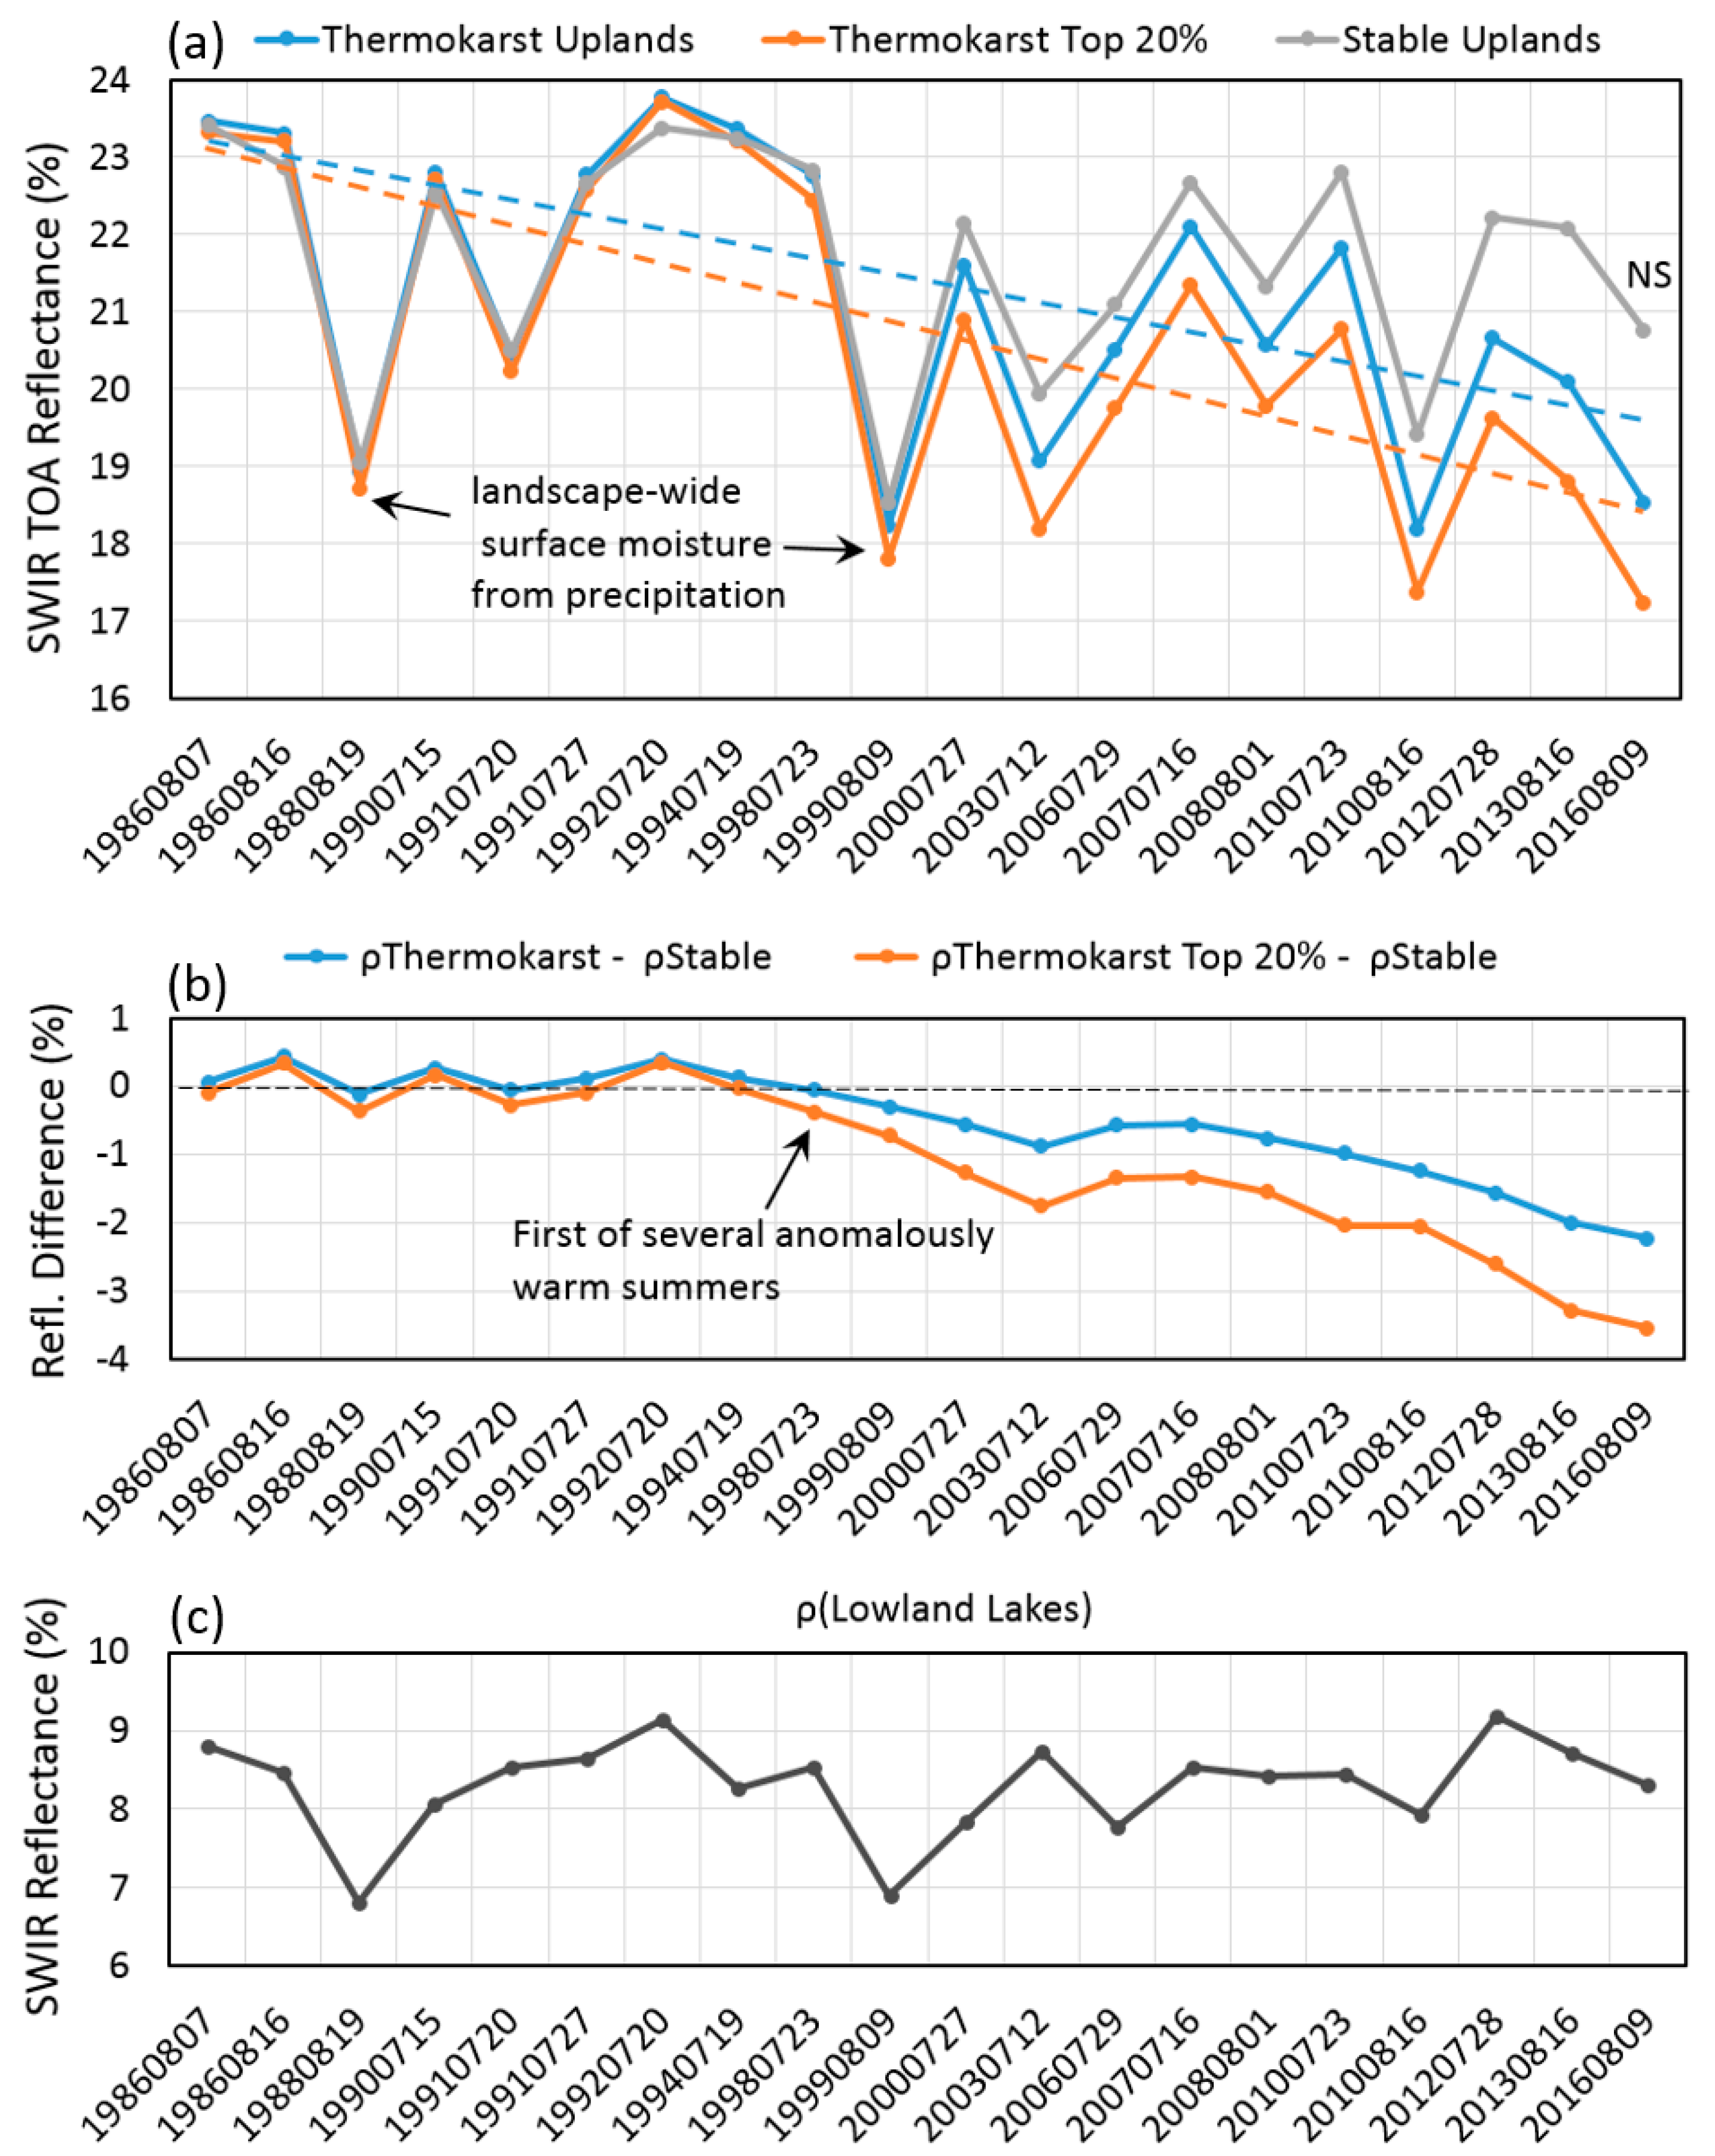
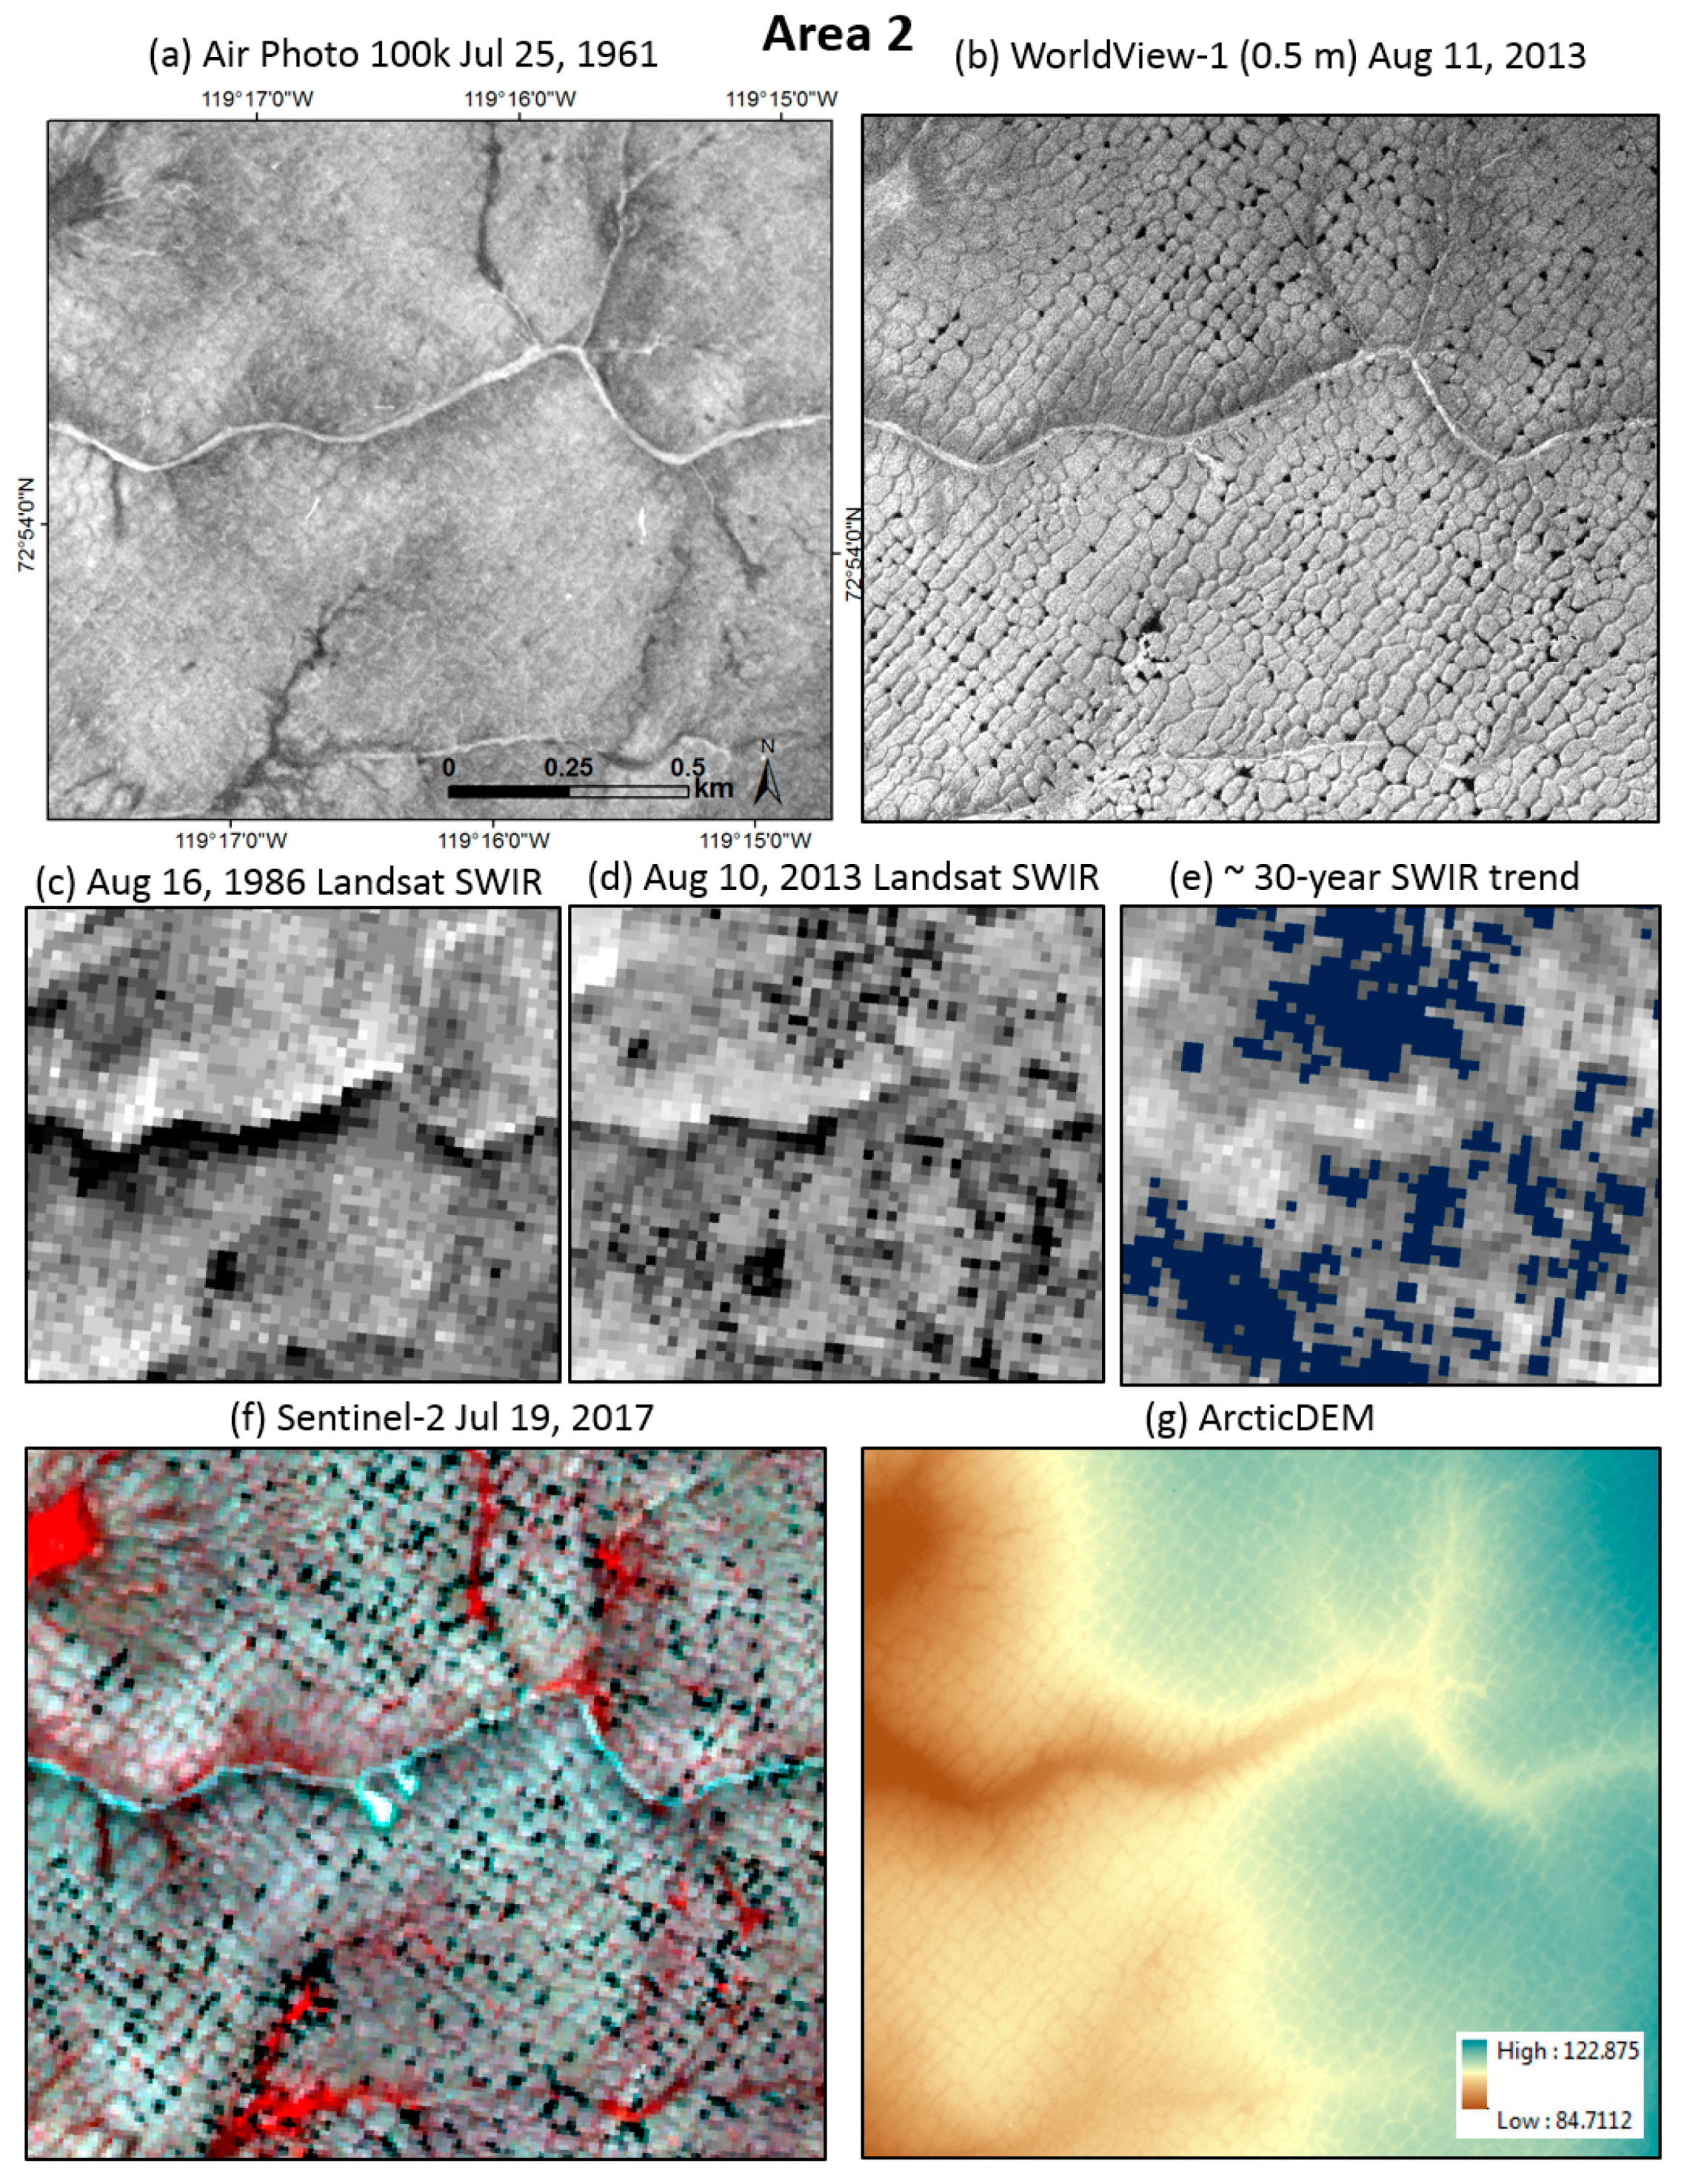
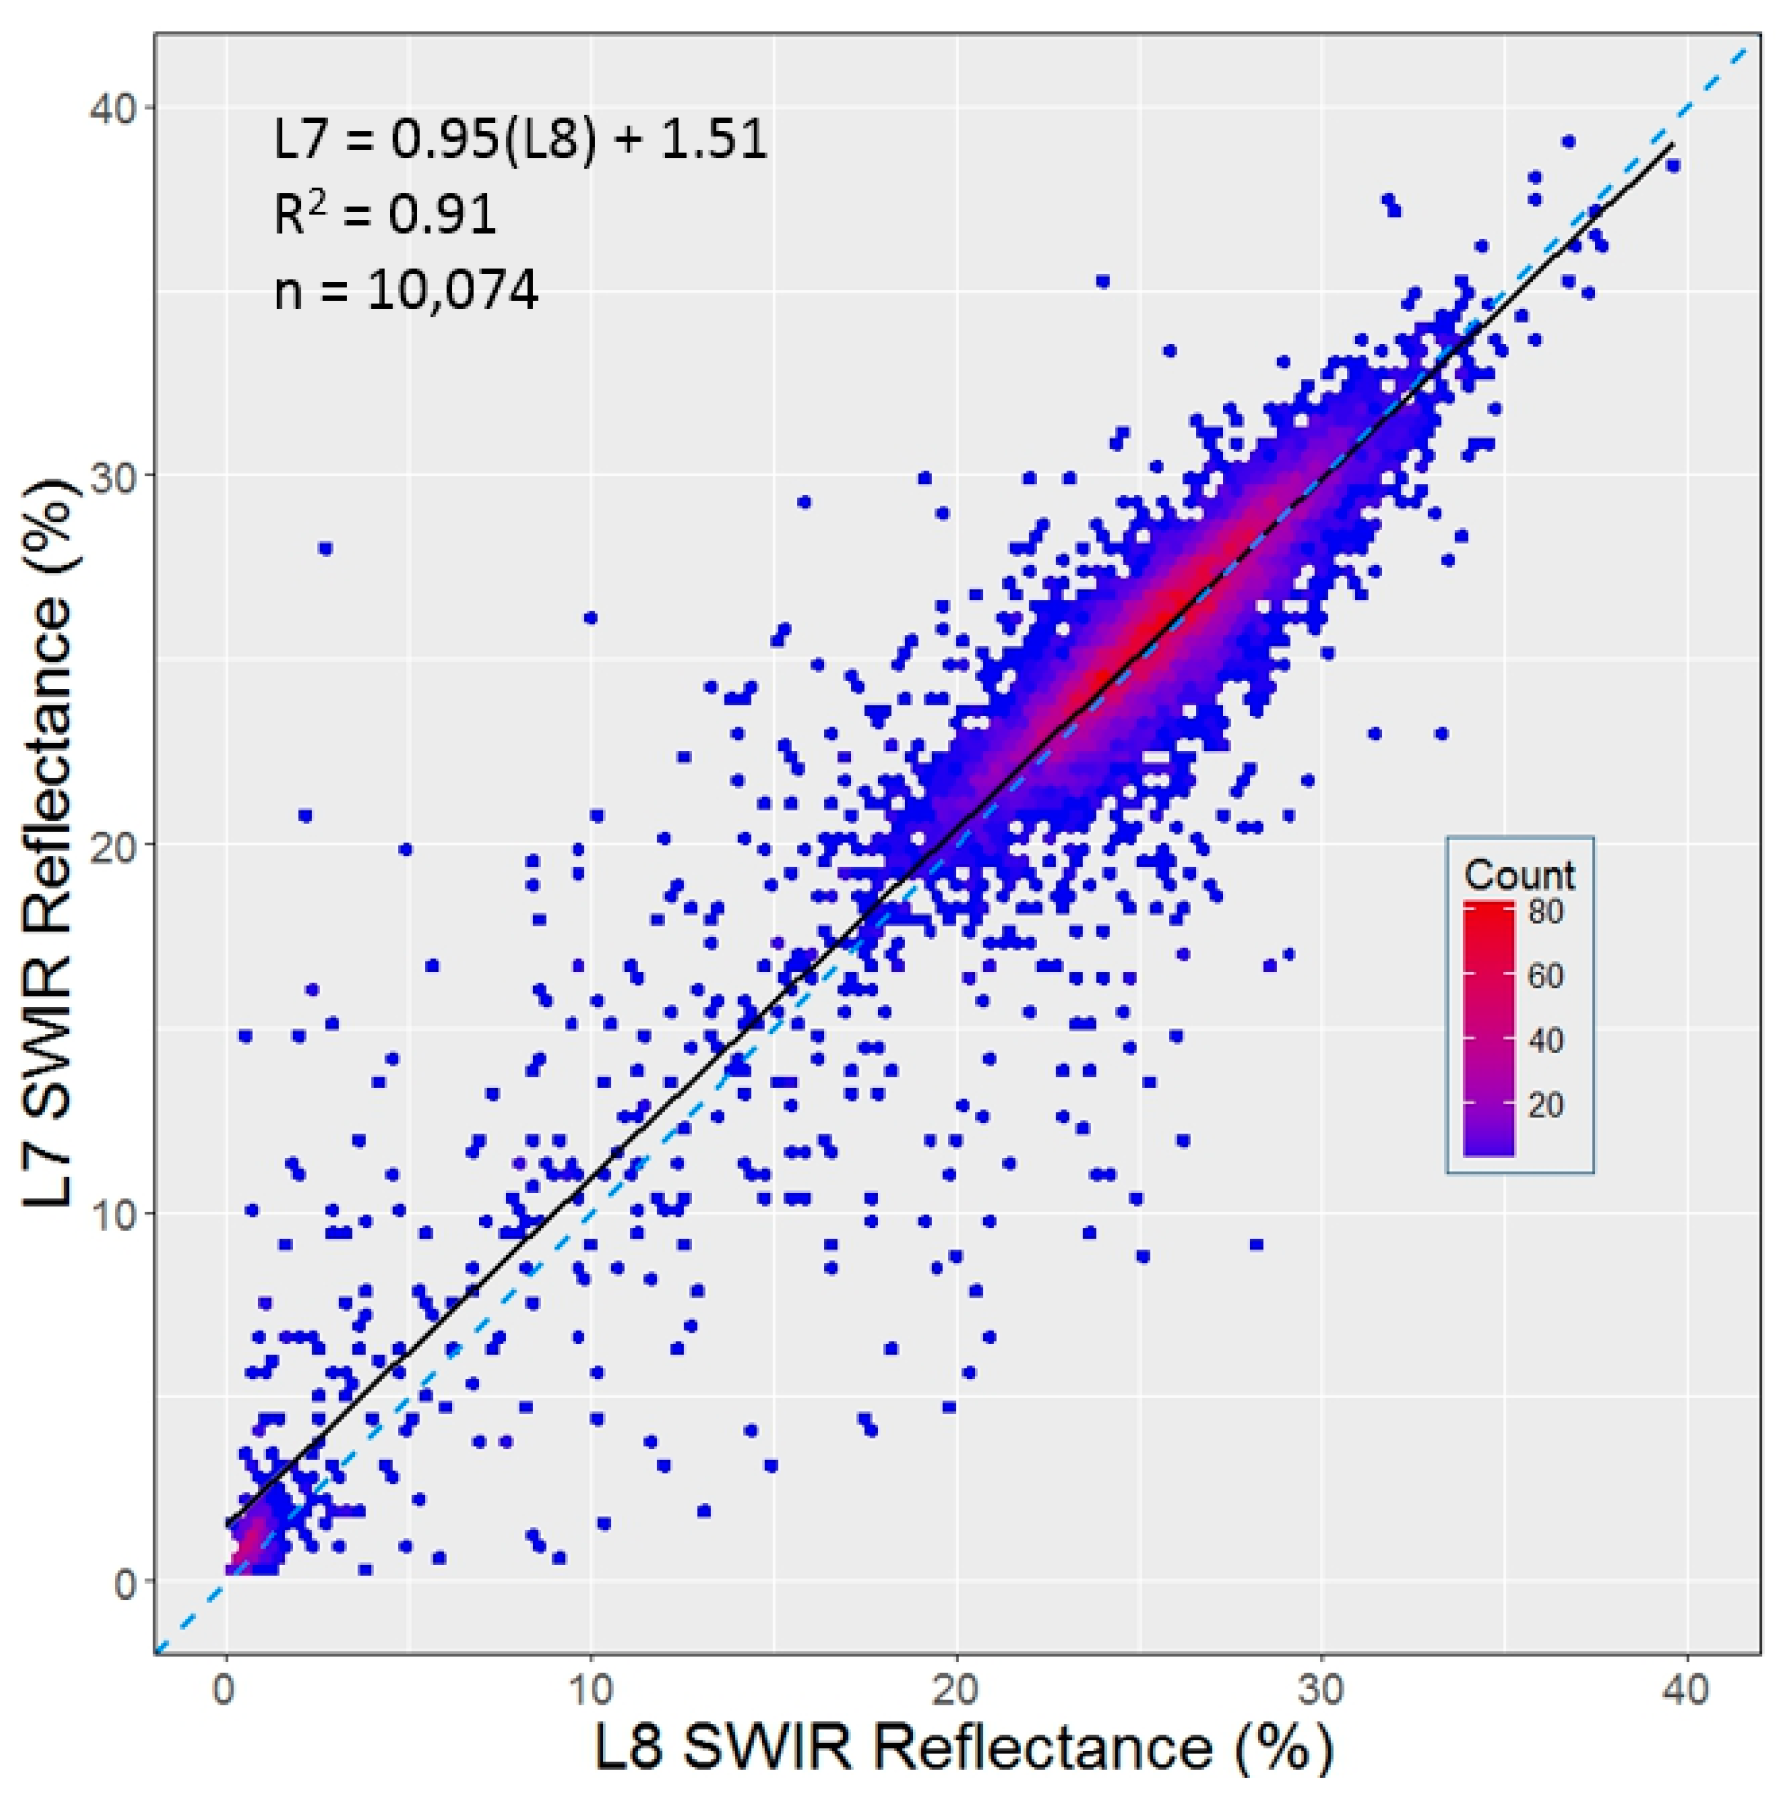
3.5.2. Investigating 30-Year Variability in Landsat SWIR Reflectance in an Area of Ice-Wedge Degradation

Landsat SWIR reflectance measurements were analysed from a sequence of 20 summer images from 1986–2016 that provided clear-sky observations of a 26 km2 area located on eastern Banks Island. This analysis characterised the temporal variability and trajectory of SWIR reflectance in an area with a high density of new upland ice-wedge melt ponds. To indicate changes in surface water, average SWIR reflectance was derived for each date for (1) upland pixels with significant (p < 0.05) negative 30-year trends; (2) upland pixels representing the strongest 20% of significant negative trends; (3) “stable” upland pixels with no significant trends; and (4) lowland lakes identified in the Canadian National Hydro Network [43]. The SWIR trends for lowland lakes were calculated within manually digitised areas representing their largest extents among all 20 Landsat images, plus a surrounding buffer of 1–2 Landsat pixels. These trends were used to assess if lowland water bodies exhibited unidirectional changes related to thermokarst, or were influenced by interannual variability in the seasonal water balance.

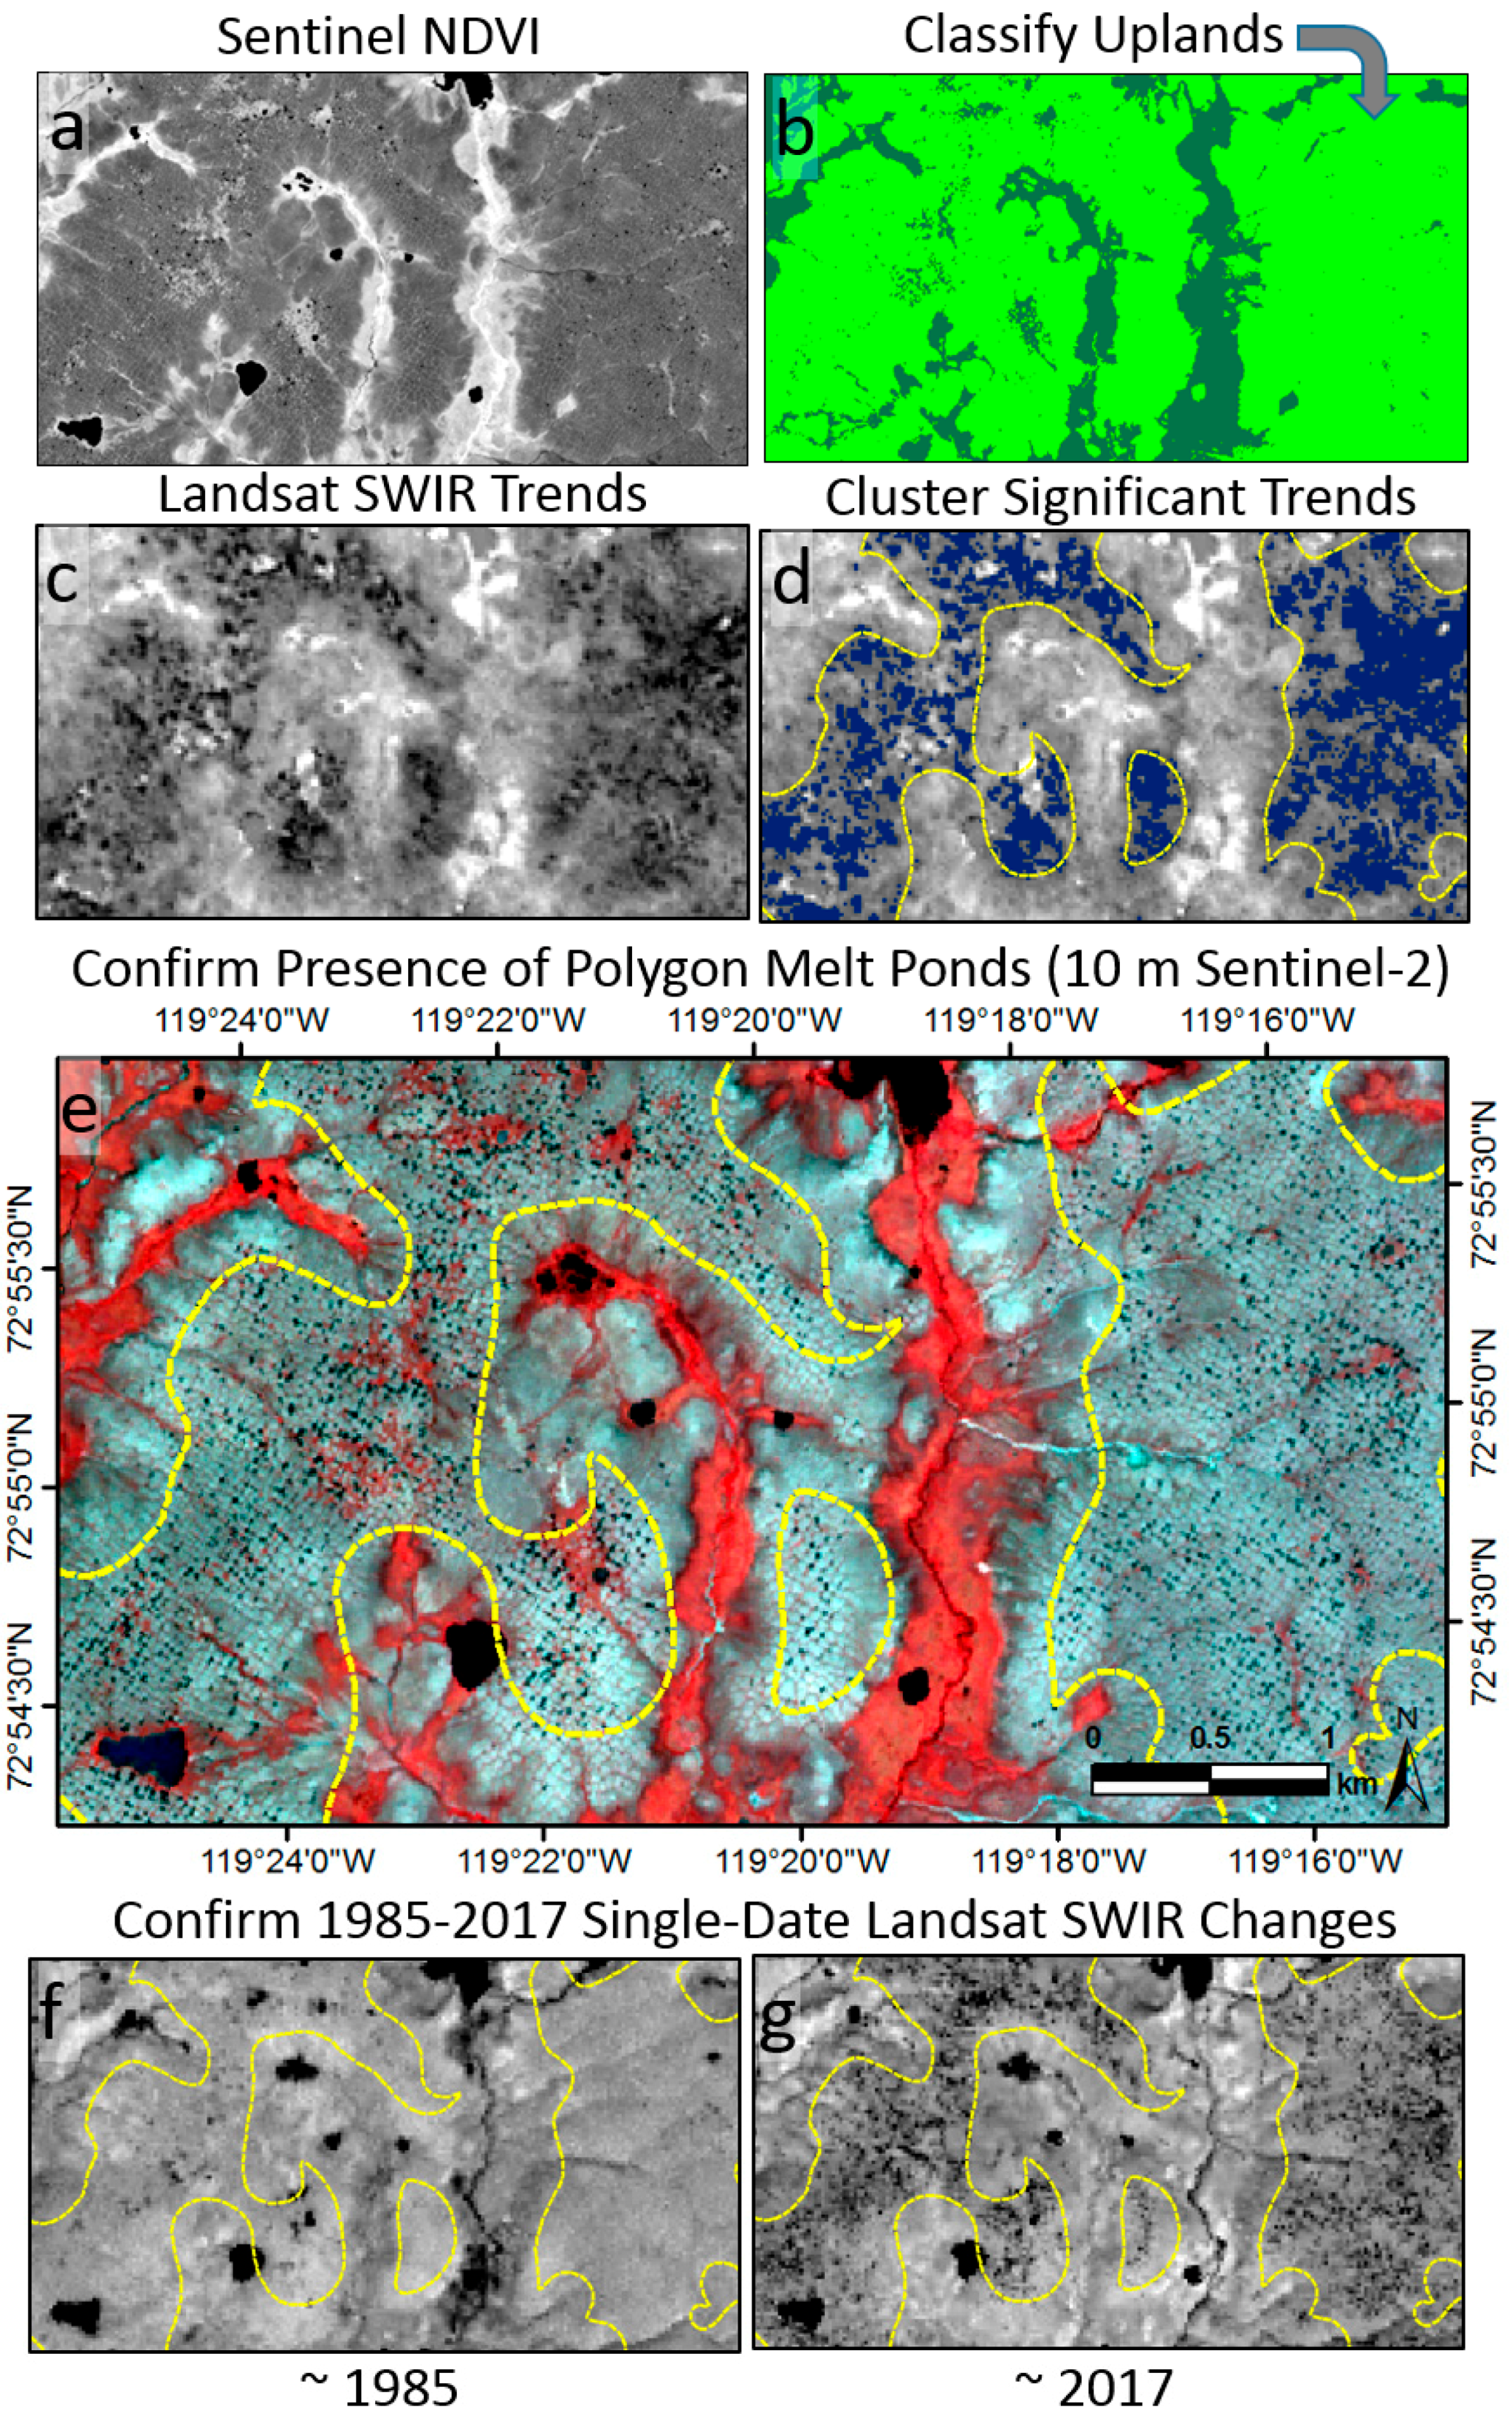
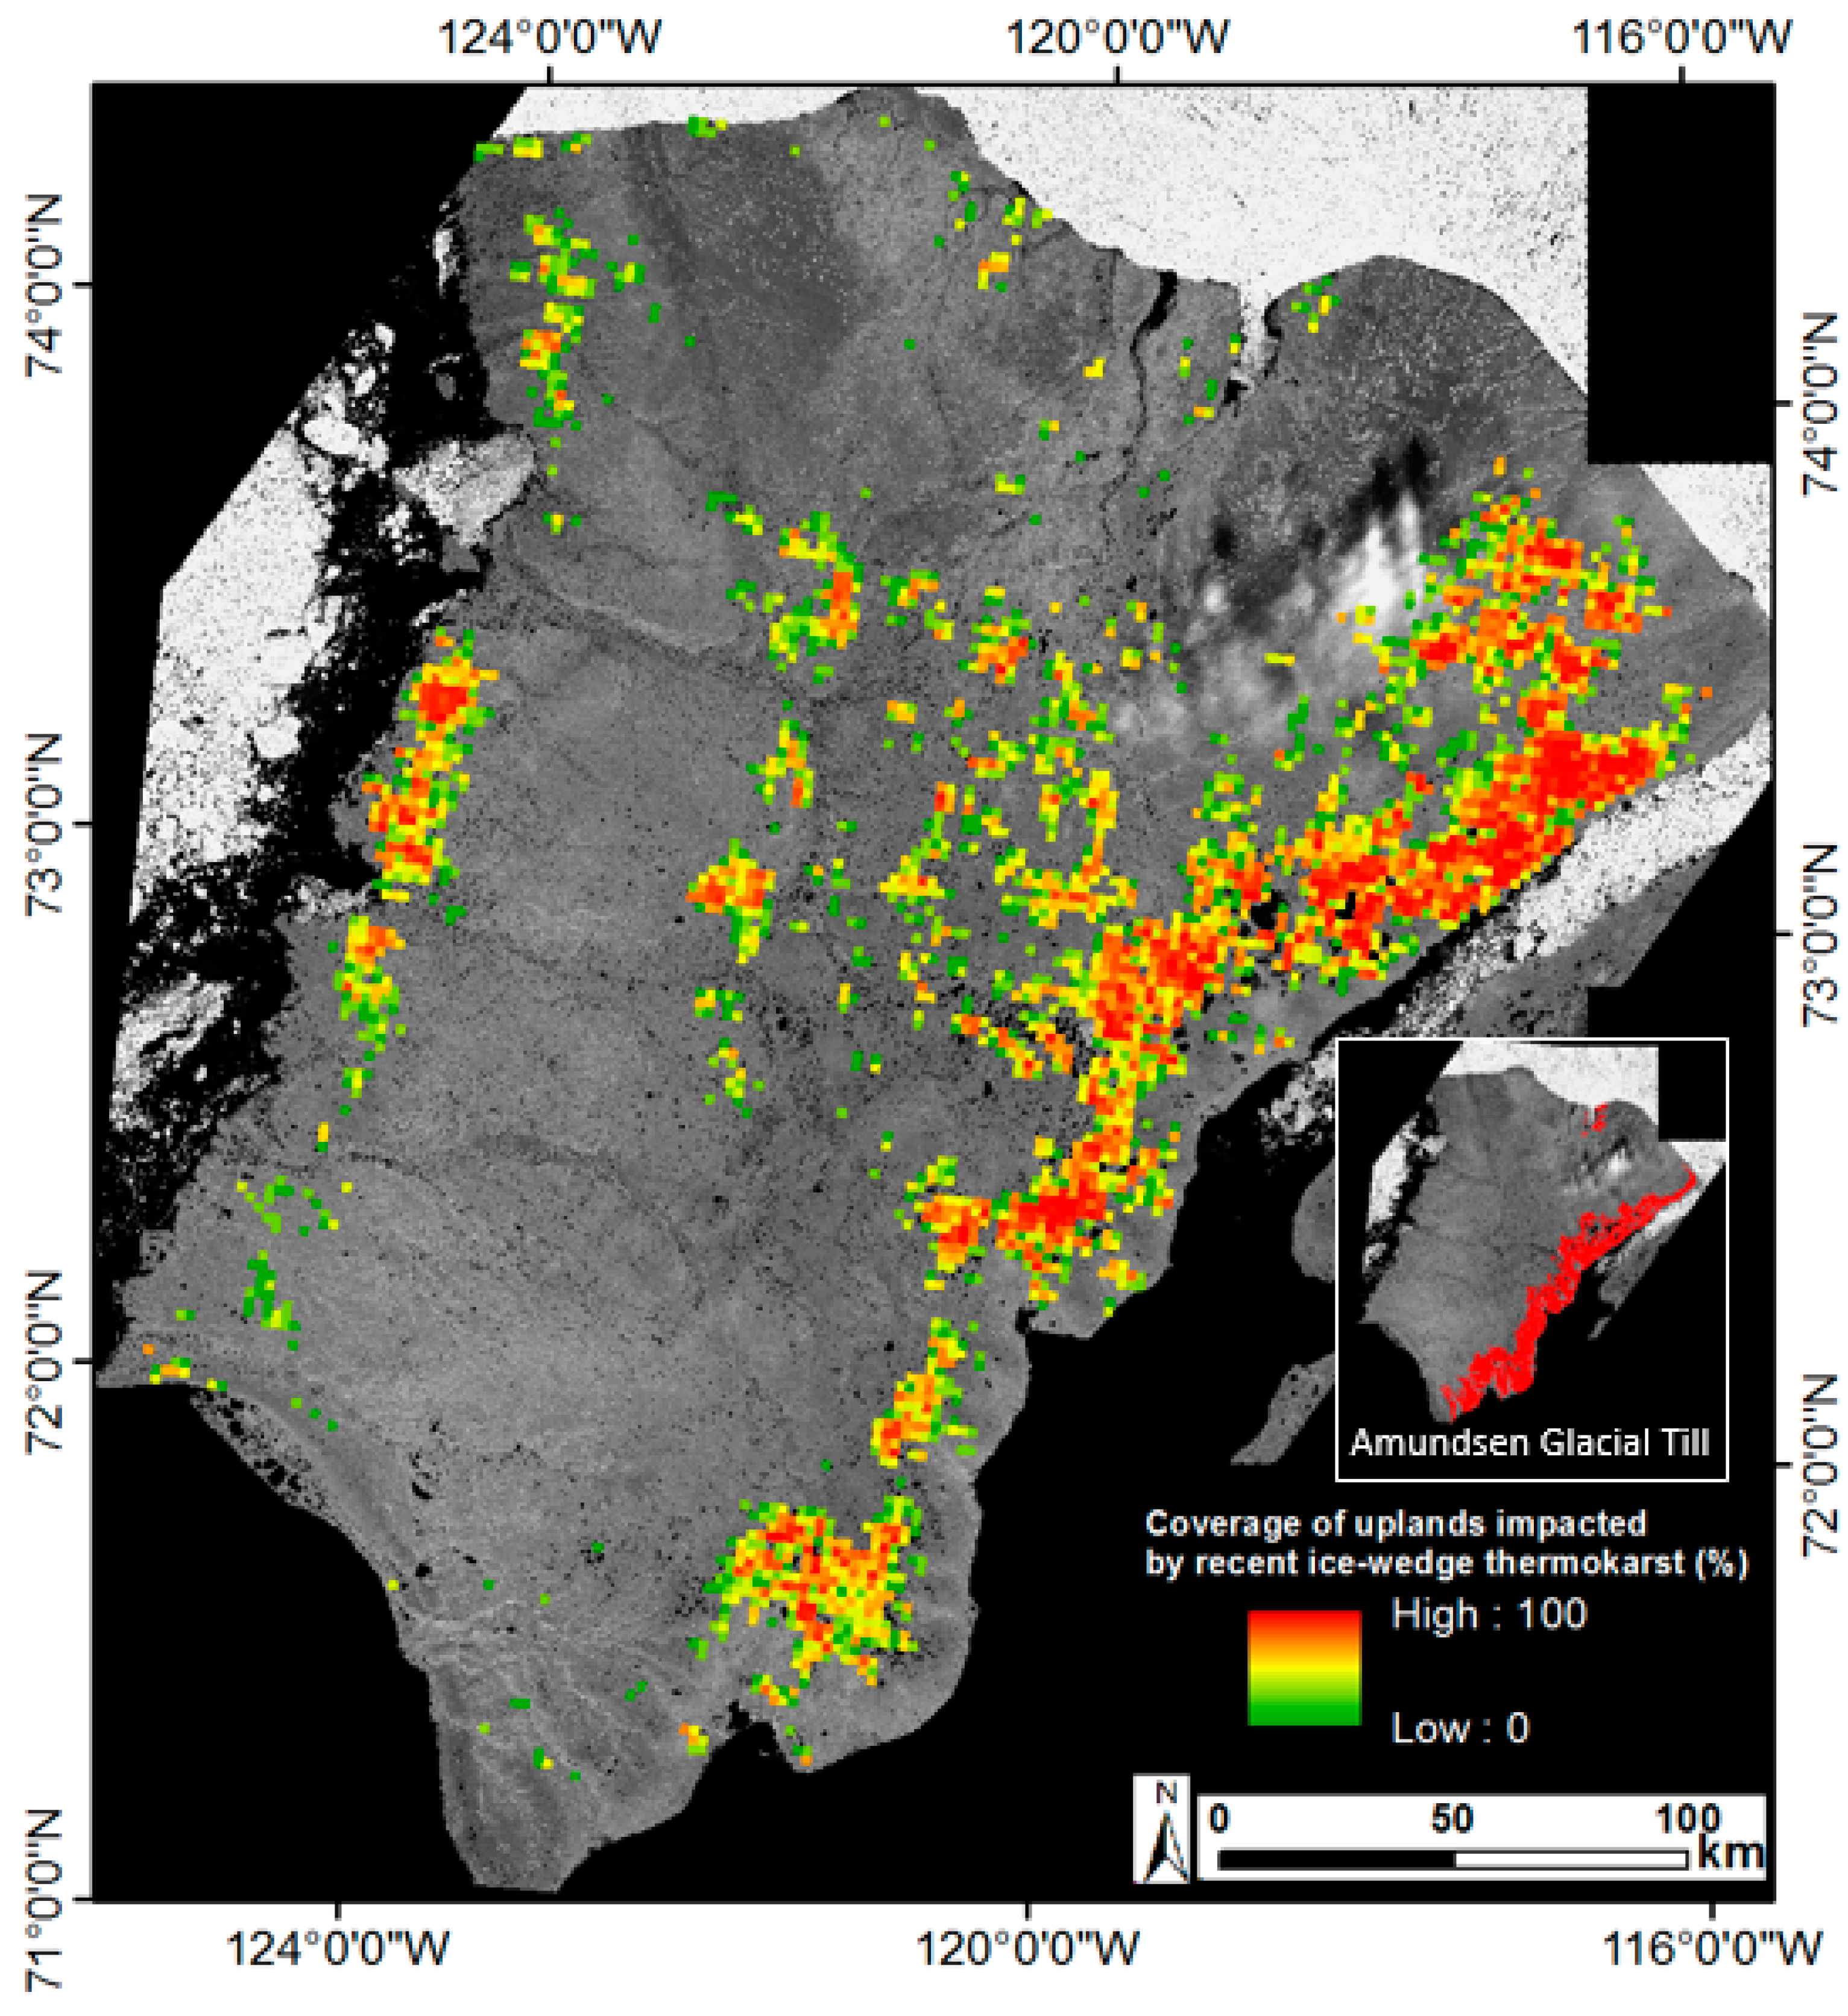
3.5.3. Delineating the Island-Wide Extent of Upland Terrain with Increasing Ice-Wedge Melt Pond Area

Upland areas of Banks Island with significant new ponding since 1985 were delineated by a semi-automated procedure. We first classified all upland areas (ponded and non-ponded) across Banks Island using the Sentinel-2 satellite image mosaic from 17 July 2017. Sparsely vegetated upland areas were distinguished from more productive lowlands supporting continuous graminoid vegetation using an NDVI threshold of 0.3 (Figure 4a,b), representing an intermediate value between these two general vegetation types (Figure A1). Areas with NDVI values lower than 0.1 were also excluded from the analysis, because they represent larger ponds, completely barren surfaces not impacted by melt ponding, and recent retrogressive thaw slumps.
Within this upland area, polygonal terrain where melt ponds formed after 1985 was delineated by using significantly trended (p < 0.05) Landsat SWIR pixels to form vector polygon vertices using the ArcGIS “Aggregate Points” tool, similar to [44] (Figure 4d). This connected all negatively trended pixels lying within 300 m of each other to form the perimeter of concave polygons. A distance of 300 m was chosen based on observations from high-resolution imagery showing that thaw ponds occupy only a portion of troughs within the degraded ice-wedge landscapes. We also created a second set of polygons using a finer aggregation scale of 100 m that was used to delineate trended pixels in some areas where the 300 m distance produced overly generalised delineation of impacted areas. The vector polygons were subsequently smoothed using the ArcGIS “Smooth Polygons” tool.
The next step for delineating the island-wide extent of new melt ponds was to use the 2017 Sentinel-2 image mosaic to manually verify the occurrence of small ponds within each vector polygon (Figure 4e). An inspection of the eight high-resolution study areas indicated that Sentinel-2 imagery provides sufficient resolution to unambiguously identify melt ponds within the degraded ice-wedge polygon landscapes (Figure S6). We therefore excluded all candidate vector polygons delineated using the negative Landsat SWIR trends that did not show any evidence of melt ponds. A final criterion for confirming the selection of vector polygons as containing new melt ponds was the presence of a textured decrease in SWIR when comparing a pair of early (~1985) and late (~2017) Landsat images (Figure 4f,g) that matched the location of melt ponds visible in the Sentinel-2 imagery (Figure 4e).

3.5.4. Corroborating, Characterising, and Explaining the Landsat-Detected Change in Melt Pond Area and Ice-Wedge Thaw

Landscapes identified as having an increased area of melt ponds were corroborated over eight 4–12 km2 study regions (Figure 2) by comparing summer melt pond areas mapped using the 1:100,000 scale 1958–1961 air photos and high-resolution (0.5 m) 2013–2017 satellite images (Table S1, Section 3.1.3 and Section 3.1.4). These high-resolution maps were also used to characterise changes in the size and density of melt ponds. Recent oblique helicopter and ground photos of polygonal landscapes captured by the Government of the Northwest Territories in 2010 and 2011 [29] and field-based observations made in 2015 and 2017 provided additional corroboration of the melt pond landscapes mapped throughout the island and data on the depth to ground ice at several sites. A 2 m resolution digital elevation model (ArcticDEM, Polar Geospatial Center) was used to measure the topography of degraded upland ice-wedge polygons over two transects and to determine the depths and widths of subsided troughs. To explore the relationship between summer temperatures and active layer development in Arctic mineral soils, we regressed thawing degree-days against mean summer thaw-depth determined by probing a 36-point grid from 2010–2015 at Green Cabin, north-central Banks Island (Section 3.3). The implications of increasing summer temperatures on Banks Island for top-down permafrost thaw are considered in this context.

4. Results

The strong linear relationship between the ice-wedge melt pond area and Landsat SWIR reflectance in upland terrain (Figure A4) suggests that SWIR trends can provide a sensitive indicator of long-term, thermokarst-driven changes in the melt pond area. Figure 1 and Figure 5 show increases in the ice-wedge melt pond area, which appear in Landsat SWIR images as a textured darkening of upland landscapes. These reflectance decreases correspond to a similarly textured, negative 30-year SWIR trend (Figure 5g). In the higher resolution 2017 Sentinel-2 image, hundreds of small melt ponds are visible in areas where Landsat SWIR shows significant negative trends (Figure 5i).
The SWIR reflectance trajectory for 20 clear-sky Landsat images analysed over this area (Figure 6a) shows short-term variability due to extensive precipitation-related surface moisture [45,46]. This is superimposed on a long-term decrease in SWIR for negatively trended pixels that correspond to an increase in the upland ice-wedge melt pond area (Figure 5h,i). The SWIR trajectory for lowland areas with small lakes (Figure 6c) shows interannual variability in waterbody size but no long-term trend (Figure 5). From 1986–1998, variation in SWIR in stable uplands and negatively trended pixels is synchronous, but after this, trended pixels show a consistent relative decline in SWIR. The difference in reflectance between stable and negatively trended pixels (Figure 6b) provides a normalised index of ice-wedge melt pond development, which on eastern Banks Island begins in 1998, the first of several years with anomalously warm summers (Figure 3a). Figure 3b shows significant year-to-year variability in early summer active layer development on northern Banks Island and the strong relationship between depth of thaw and thawing degree-days. Although the dataset is limited in length, the analysis demonstrates that summer temperature indices are a strong predictor of mid-thaw season active layer development and that exceptionally warm summers are likely to induce rapid top-down permafrost thaw in highly conductive, barren Arctic upland soils.
The semi-automated procedure to map upland landscapes across Banks Island where ice-wedge melt ponds are expanding was used to delineate 2838 vector polygons covering an area of 1549 km2. These melt pond landscapes occur throughout the island (Figure 7), but the majority are concentrated along north-south bands, with the most prominent area overlapping with the ice-cored, Jesse Moraine complex of eastern Banks Island.
High-resolution mapping of historical (1958–1961) and recent (2013–2017) ice-wedge melt ponds in upland terrain in the eight study areas showed consistently large increases both in the total area and density of ponds (Table S3). The average increase in the total ice-wedge melt pond area and density were 923% and 784%, respectively. However, the size distribution of the melt pond population was similar between the time periods (Figure S5), with means of 120 m2 (historical) and 115 m2 (recent) and medians of 69 m2 (historical) and 71 m2 (recent). These quantitative measurements are supported by visual comparisons of the historical air photos and recent high-resolution satellite images over the eight study areas (Figure 8a,b and Figure S6a,b). The locations of new melt ponds show a close correspondence to single-date Landsat SWIR reflectance changes (Figure 8c,d and Figure S6c,d) and negative SWIR trends (Figure 8e and Figure S6e) that were used to delineate the new melt pond landscapes across Banks Island.
Recent ice-wedge melt pond formation in upland terrain was also corroborated using 2010–2011 ground and oblique air photos covering Banks Island [29], more than 100 of which show evidence of recent pond development in upland terrain. Figure 9 shows air and ground photos for areas on eastern Banks Island where ice-wedge degradation has resulted in new ponds with areas up to several hundred square metres. Analysis of the ArcticDEM (Figure S7) shows that the average trough depth was 1.14 m across two upland transects (range 0.6–1.7 m, n = 31), and the mean distance between polygon tops was 31.3 m (range 20–46 m, n = 31). The vertical relief of ice-wedge troughs in the uplands of eastern Banks Island is generally larger than the sub-metre depths typically measured in previous studies of ice-wedge thermokarst [9] and suggest top-down degradation of large ice wedges and mid- to late-stage evolution of high-centred polygons [4]. Thawing of wedge ice was corroborated by field observations in 2015 indicating that active layer thaw in late July was truncating ice wedges, which were encountered at mean depths of 51.0 cm and 63.3 cm below terrain surface (Table S2). In comparison, on 3 July 2015 the mean depth of thaw at Green Cabin was already 67.9 cm (SD: 5.8 cm). Total thawing degree-days in 2015 was 565, and although this was not an extremely warm year, the total is well above the long-term mean of 461 °C days (Figure 3). Early July thaw depths at Green Cabin ranged from 56.4 in 2011 to mean thicknesses of over 80 cm in 2010 and 2012, highlighting the climate sensitivity of Arctic active-layer development and supporting the idea that recent warming is increasing active layer thicknesses and truncating the tops of ice wedges in Arctic upland terrain.

5. Discussion

5.1. Remote-Sensing Change Detection Reveals Thaw-Driven Modification of Upland Ice-Wedge Networks

Ice-wedge degradation is significantly altering glaciated uplands across Banks Island. The 1985–2017 Landsat-based change analysis showed textured decreases in SWIR reflectance over more than 1500 km2 of upland terrain, indicating that a significant increase in ice-wedge melt ponds is affecting large parts of the island. This interpretation is supported by the strong inverse relationship between SWIR and the sub-pixel melt pond area (Figure A4) and by the spatial association of these trends with melt ponds visible in recent Sentinel-2 satellite imagery (Figure 5 and Figure 8). Comparison of upland ice-wedge melt ponds mapped using 1958–1961 aerial photographs and 2012–2017 high-resolution satellite images over the eight impacted study areas also showed a nearly tenfold increase in the pond area. WorldView satellite images over sites containing larger melt ponds (Figure S8) indicate that narrow ponds along degraded troughs have enlarged and coalesced to form wider ponds with areas >1000 m2 (Table S3), comparable to the size of individual polygons. Where ponding occurs in association with ice-cored terrain, there is potential for the initiation of thermokarst lakes (Figures S5 and S8). The increased ponding reported here is an indicator of a much broader phenomenon of top-down ice-wedge thaw and evolution of upland polygonal terrain, consistent with Inuvialuit observations of surface settlement [49,50], thaw truncation of ice wedges on slopes (Table S2), and trough settlement and sloughing associated with active rampart development (Figure S9) [51].
Ice-wedge thermokarst is increasingly reported in fine-scale studies [7,9,20]. Our island-wide estimate of upland ice-wedge thermokarst (1500 km2) is conservative, because significant Landsat SWIR trends were associated only with large increases (≳100 m2) in the pond area and did not typically capture thaw-driven evolution of high-centred polygons where drainage was promoted by sloping terrain (average slope within the melt pond landscapes was 2.4% but 4.2% for all uplands). Further, some of the ponding visible in the 2017 Sentinel-2 imagery is very recent and did not significantly influence the 30-year trend in SWIR reflectance. Despite the inherent limitations of using Landsat-based trend analysis, the approach can be used to study expansive landscapes, and because it is based on dense summer temporal records, it should be insensitive to intra- and interannual variability in polygon wetness [6,9] that can bias analysis based on only a few observation dates.
The large extent (averaging 115 m2) and high density of new ice-wedge ponds on Banks Island enabled successful implementation of Landsat-based change detection. However, Landsat data are likely too coarse for reliably detecting initial or more limited changes in ice-wedge ponding (5–50 m2) as reported in low-Arctic terrain [7,9,20]. The 30 m image resolution would also not be suitable to study degradation involving local-scale redistribution of surface water that can be associated with the transition of low-centred to high-centred polygons. Where growth of dense aquatic vegetation is stimulated within inundated troughs [6], this would confound the linear association between the pond area and Landsat SWIR reflectance, and make delineation of melt ponds challenging using higher resolution satellite imagery.
The strong absorption of SWIR radiation by water that makes Landsat SWIR reflectance negatively correlated to the area of sub-pixel ponds (Figure A4) also causes it to be sensitive to temporal variability in extensive soil and vegetation surface moisture due to precipitation [45,46]. This variability is evident in the time series of Landsat SWIR reflectance presented in Figure 6, where SWIR reflectance is uniformly reduced across the study area in four of the 20 images. The potential confounding effect of moisture from precipitation for our analysis of SWIR reflectance trends and melt pond changes is mitigated by several factors. Banks Island is classified as a polar desert and receives limited precipitation. In July and August, average precipitation at Sachs Harbour is 38 mm and climate data show no long-term trend in summer precipitation (Figure S1b). Second, the dense collection of SWIR reflectance measurements from a stack of Landsat images provided an average of 68 observations for each pixel. Because these are nominally cloud-free observations, they should be less likely to immediately follow a rainfall event. Finally, Theil–Sen robust regression used to characterise the long-term SWIR trends is insensitive to outliers and can tolerate corruption of up to 29.3% of data points without degrading accuracy (e.g., Figure 6a).
Rapid changes in ice-wedge thermokarst and the potential impacts of these changes on ecological processes underscore the need for integrating optical satellite methods with those that measure changes in elevation driven by subsidence, including interferometric synthetic aperture radar (InSAR) [52,53], LiDAR [54], and stereo photogrammetry [55]. Collaborative approaches that integrate remote-sensing methods and field-based investigations are also needed to better understand the varying modes of ice-wedge thermokarst and to quantify the processes and feedbacks that govern contrasting trajectories of change.
Evidence of upland ice-wedge thermokarst from remote sensing, in conjunction with field observations of climate-driven increases in active layer thaw (Figure 3b), wedge-ice truncation by the active layer (Table S2, Figures S2–S4), and Inuvialuit observations of recent climate-related changes on Banks Island, including increased thaw depths, land subsidence, and ponding of water within flat areas [49,50], indicates that top-down thaw is transforming ice-rich Arctic upland terrain. This conclusion is also consistent with a ground ice meltwater signal in Banks Island streams draining ice-cored terrain [18] and a significant increase in retrogressive thaw slumping [22]. Taken together, these studies demonstrate that top-down thaw of ice-rich, high Arctic permafrost is driving rapid and pervasive surface subsidence on a landscape scale.

5.2. Drivers and Processes Involved in Ice-Wedge Polygon Changes

Our analysis shows that upland ice-wedge degradation is being driven by recent increases in temperature. Climate data for Sachs Harbour indicate that air temperatures on Banks Island have increased by 3 °C since the 1970s. Thawing degree-days have also increased (Figure 3a) from a mean of 415 during the 1956–1976 period to 527 from 1996–2016. The well-drained mineral soils in upland terrain on Banks Island are thermally conductive and lack the surface organic horizon to buffer the effects of summer warming on active layer thaw. Figure 3b shows that active layer development on Banks Island is highly sensitive to variation in thawing degree-days and that a single warm summer can truncate the tops of anti-syngenetic ice wedges (Figure 1) [3,56]. Four summers with anomalously high thawing degree-days have occurred on Banks Island since 1998 (Figure 3a). These episodes are coincident with deeper thaw and increased ice-wedge ponding in upland terrain (Figure 6). Pronounced winter warming (Figure S1a) may have also contributed to thermokarst development by reducing the heat energy required to raise ground temperatures in summer, making more available to thaw the top of permafrost [57].
The absence of any clear trend in precipitation suggests that variation in summer rainfall did not influence ice-wedge melt pond expansion or single-year wetness conditions corresponding to the image acquisition dates (Figure S1b). Maximum snow water equivalent before spring melt for the period 1985–2015 shows only weak, non-significant positive trends over small areas of eastern Banks Island [58]. However, increasingly efficient snow capture within subsiding troughs [9] would raise winter ground temperature above ice wedges and provide a source of ponded water with low albedo to stimulate a positive thermokarst feedback [6,59,60]. The extensive ice-wedge thermokarst we report, concurrent with the dramatic increase in thaw slump activity in ice-cored terrain on Banks Island [18,22], suggests that the recent warming affecting Banks Island is unprecedented in the recent past [61].
Several geologic and geomorphic factors contribute to the thermokarst sensitivity of high Arctic uplands. A cooling temperature trend throughout the Holocene has promoted thermal-contraction cracking and the development of large ice wedges [12]. Millennia of gradual hilltop and slope denudation by solifluction have favoured the development of anti-syngenetic ice-wedge networks that are very close to the top of permafrost (Figure 1, Table S2) [3,15]. The Arctic “climate-driven permafrost regime” (Figure 3b) and the absence of major ecosystem-driven thaw depth fluctuations limit development of a transient layer (a sometimes thawed ice-enriched transition zone between the active layer and long-term permafrost) [16,62] (Figures S2–S4), which could buffer the major geomorphic effects of rapid climate-driven thaw [60]. Taken together, these factors indicate that even minor increases in thaw depth will truncate wedge ice in high Arctic uplands. In contrast, the polygonal terrain in nearby aggrading environments, such as valley-bottoms and organic deposits, underlain by syngenetic ice wedges [3,8], or ice wedges in ecosystem buffered subarctic and low Arctic environments [60], may be less sensitive to the initial stages of top-down climate-driven thaw (Figure 1) [7,63].
The largest contiguous area affected by ice-wedge melt ponds on Banks Island is associated with the Jesse Moraine belt [64], with smaller S-N trending swaths of thermokarst impacted hummocky uplands occurring in central and western Banks Island (Figure 7). The majority (57%) of the ice-wedge melt pond areas mapped in Figure 7 occur in association with the Jesse Moraine, known to host thick deposits of relict massive ice [28,64]. This association is likely related to physical properties and landscape morphometry of ice-cored hummocky moraine. The high contraction coefficient of ice in contrast with ice-bonded mineral soils [65] makes ice-cored deposits particularly conducive to thermal contraction cracking and development of ice-wedge networks. The undulating topography of hummocky moraine contributes to downslope creep of the thin veneer of surface mineral soil (Figure 1), yielding widespread epigenetic and anti-syngenetic ice-wedge networks that are highly susceptible to top-down thaw. The relative absence of ice-wedge ponding on the fluvially-incised eastward slopes of the Jesse Moraine can be attributed to topography that promotes drainage and to the rapid rates of surface denudation [18,22] that obliterate ice-wedge networks or bury them with colluvium (Figure 1).

6. Conclusions

  • Remote-sensing change analyses at two spatial scales show a recent, widespread increase in the density of large ice-wedge melt ponds within upland glaciated terrain of Banks Island.
  • Landscape-scale ice-wedge thermokarst in upland terrain has occurred as the result of a series of anomalously warm summers on Banks Island since 1998 that has thawed the tops of large epigenetic and anti-syngenetic ice wedges.
  • High Arctic uplands underlain by ice-wedge networks are highly sensitive to increased air temperatures, because the large ice wedges are thinly veneered by thermally-conductive mineral soils.
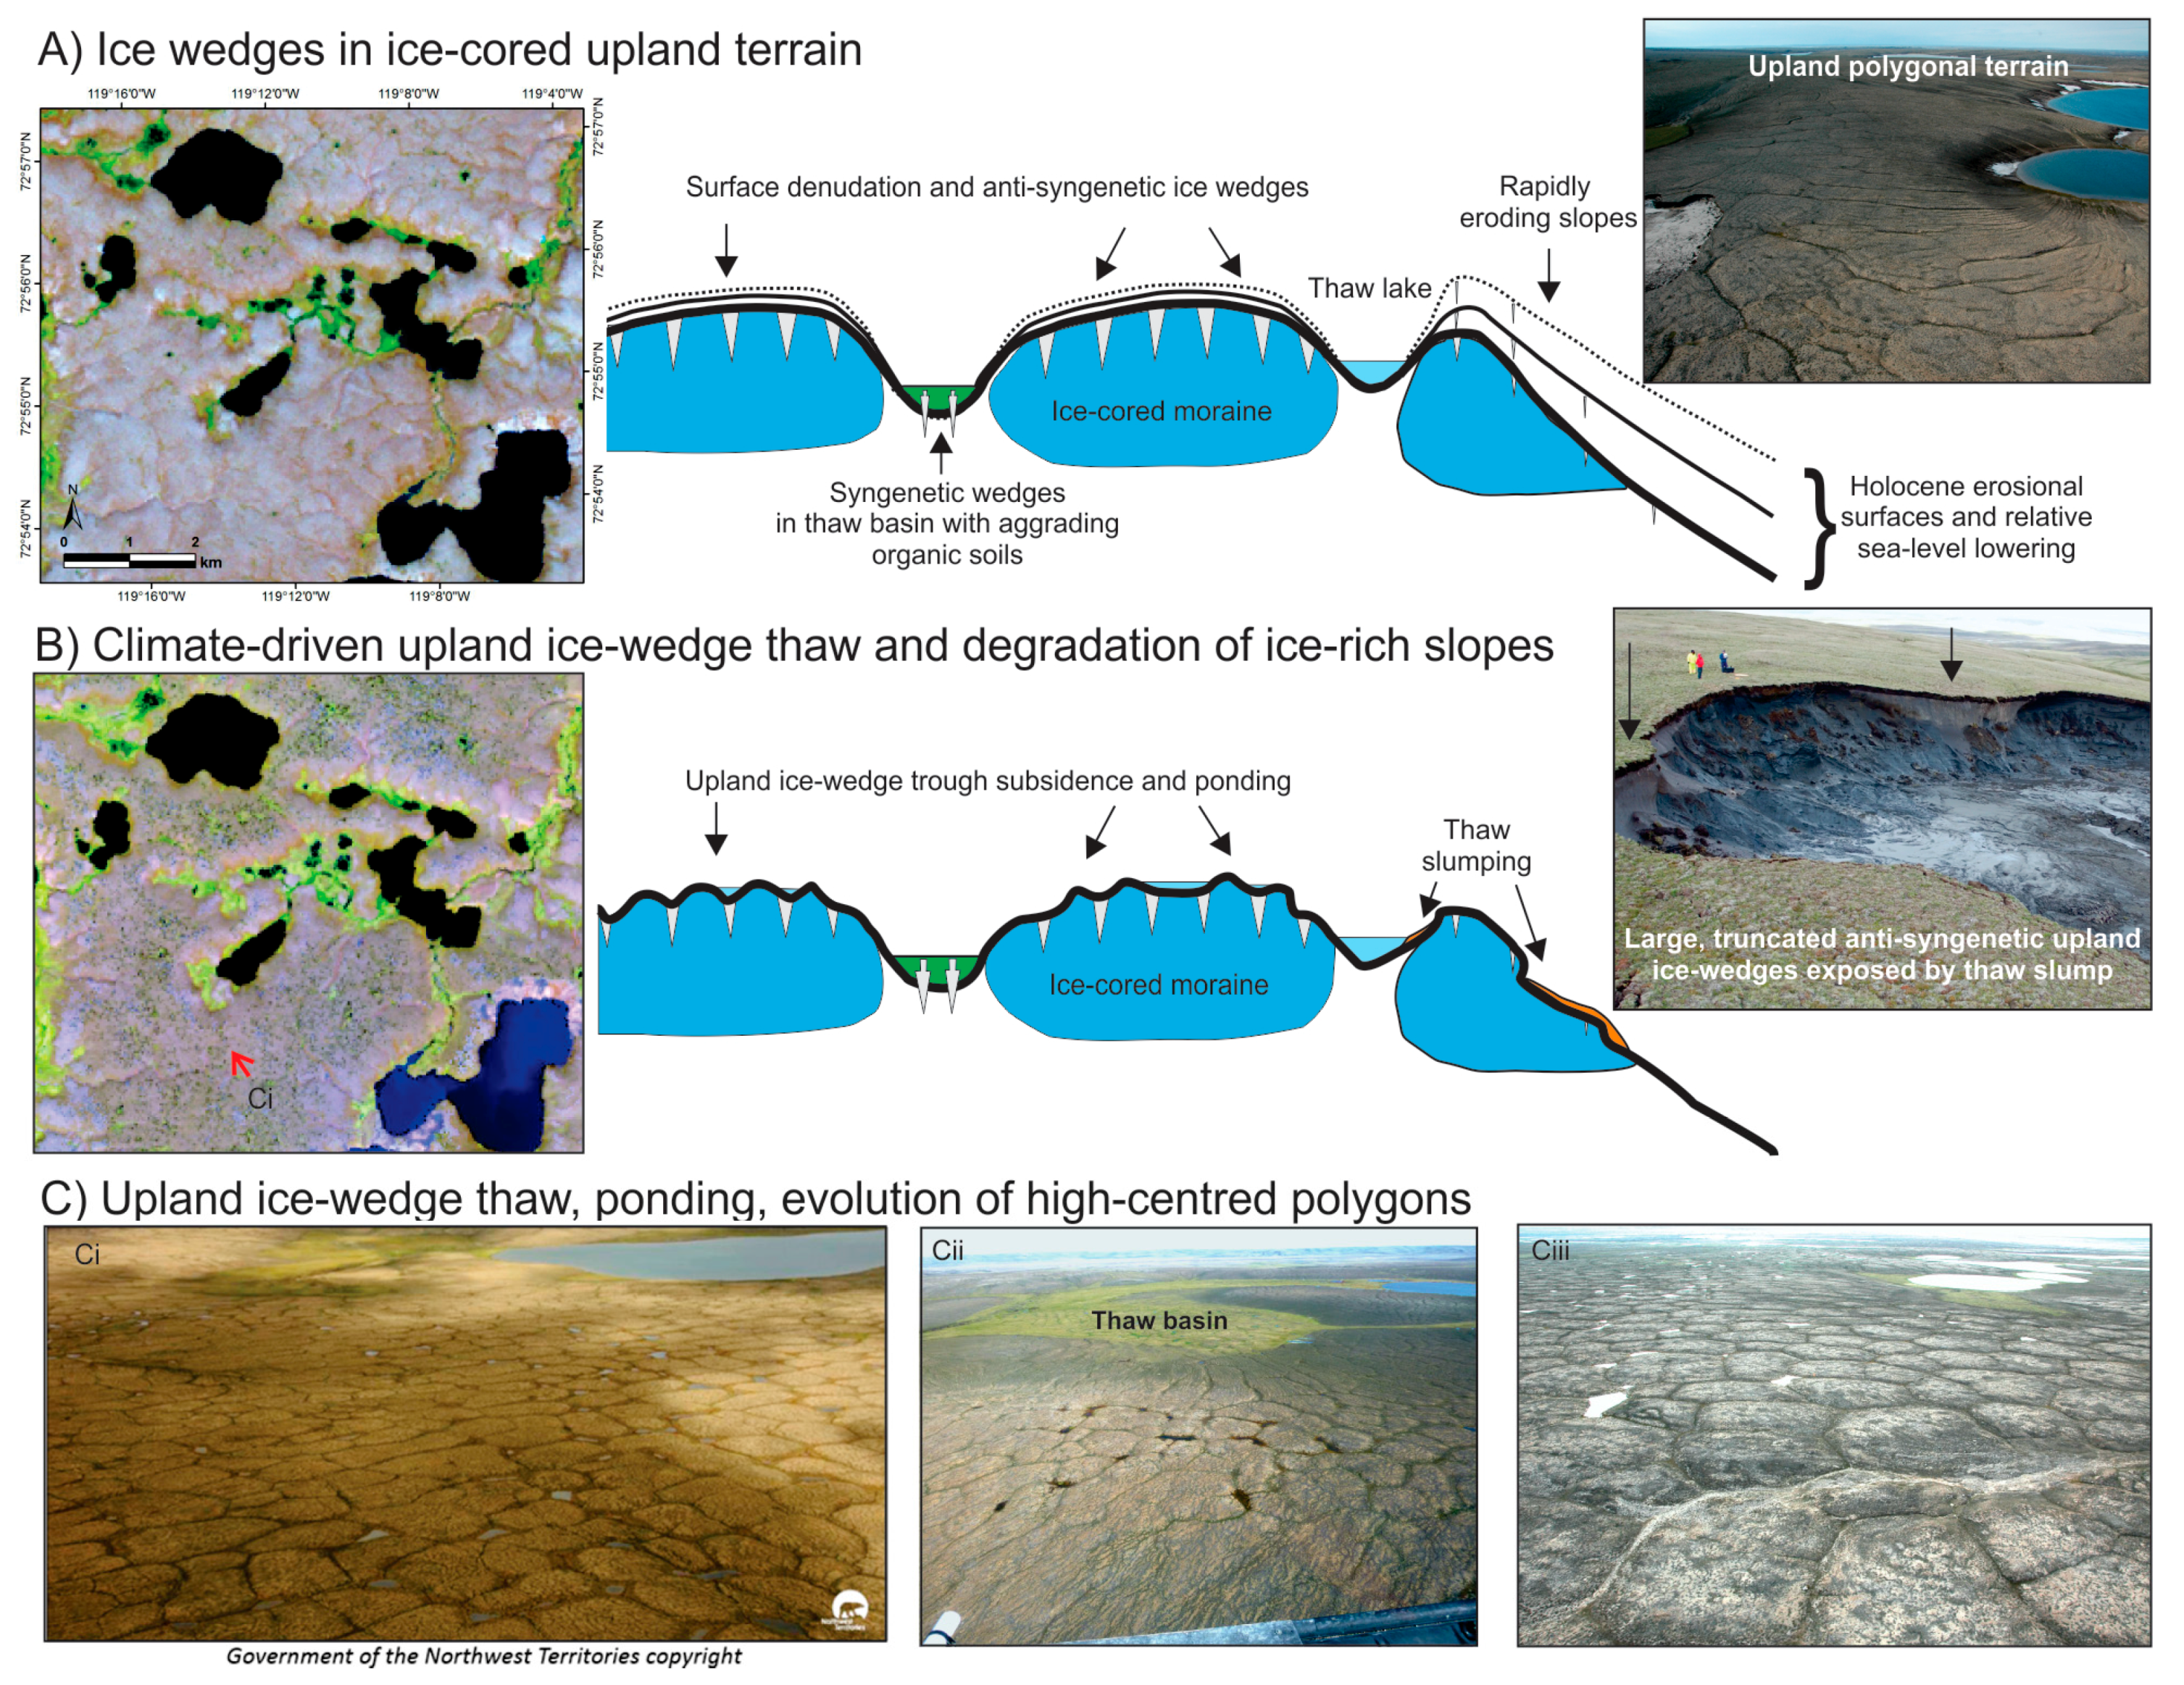
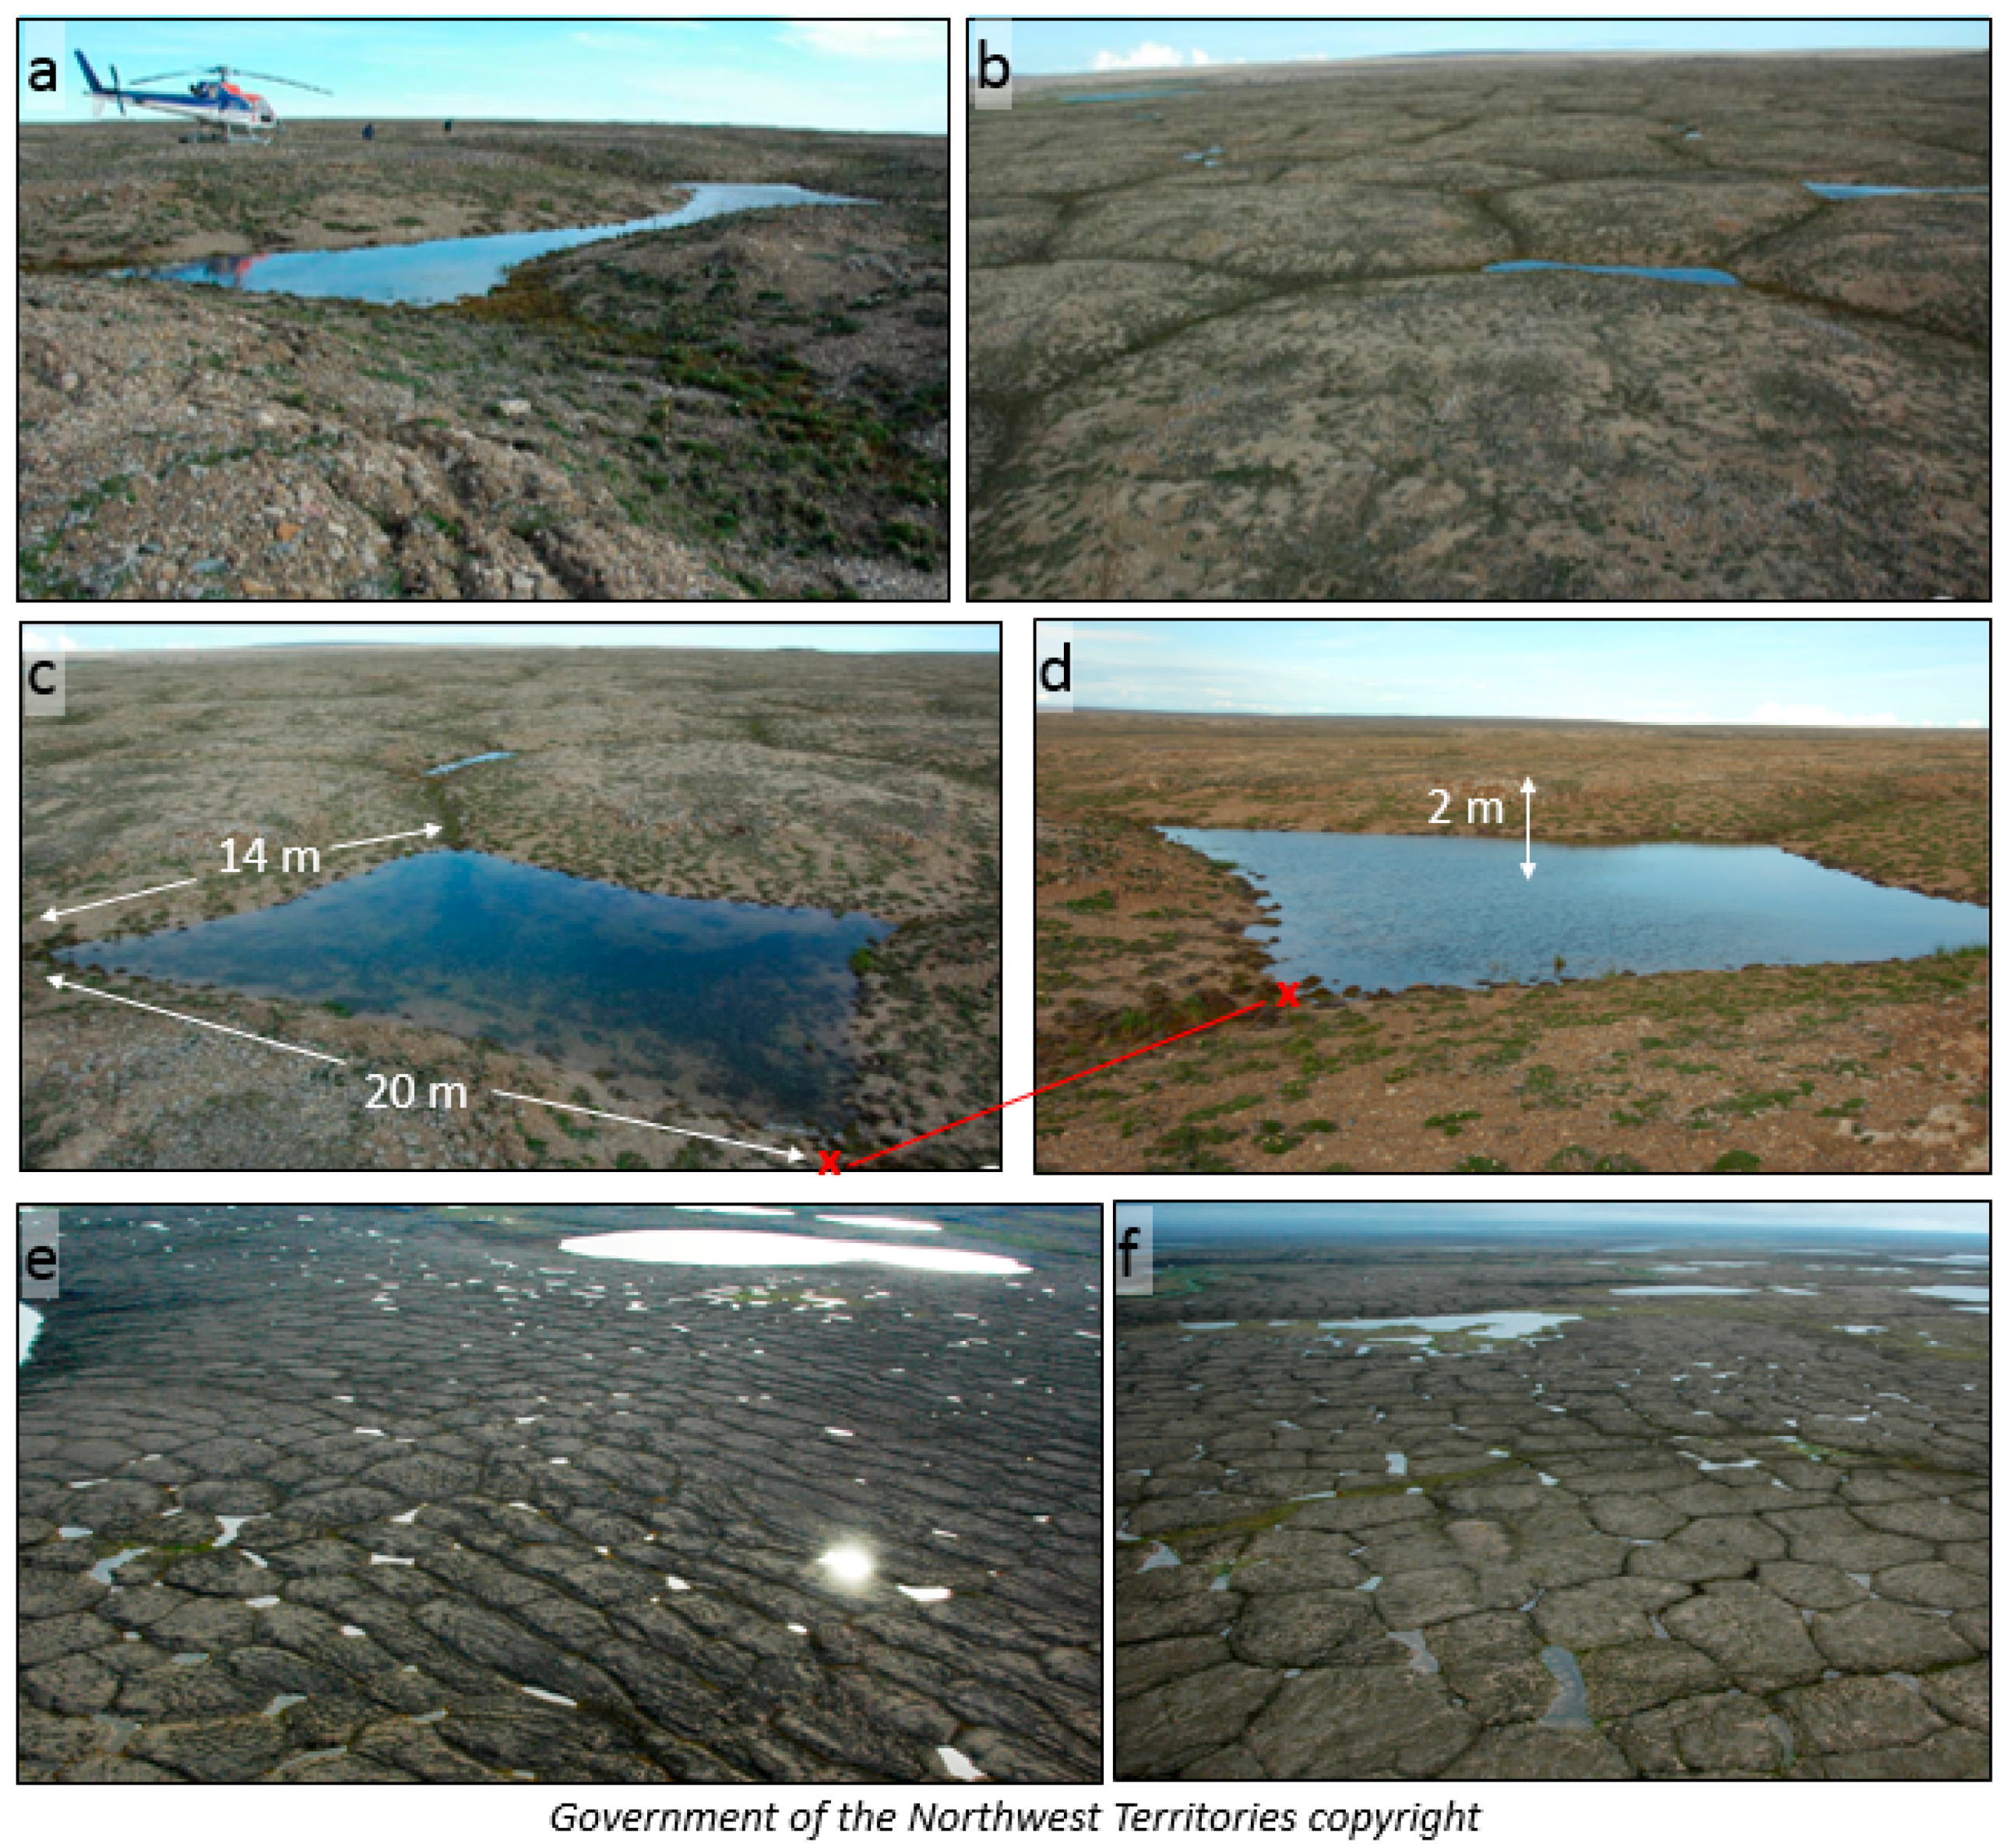
  • The trajectories of change associated with upland ice-wedge thaw and trough subsidence on Banks Island include landscape-scale terrain subsidence, increased micro-relief, the development of high-centre polygons, and in areas of poor drainage, trough ponding and potential initiation of thermokarst lakes, in particular where wedges are hosted by ice-cored terrain.
  • In conjunction with observations of accelerated thaw-slump activity in the high Arctic [18,22], our study demonstrates that ice-rich high Arctic landscapes are amongst the most climate sensitive permafrost environments.
  • The magnitude and extent of the changes we observe has significant implications for ground thermal regimes, patterns of soil moisture, ecological change, and hydrological and geochemical fluxes.

Supplementary Materials

The following are available online at https://0-www-mdpi-com.brum.beds.ac.uk/2072-4292/10/6/954/s1, Figures S1–S9, Tables S1–S3.

Author Contributions

R.F., S.K., I.O., and D.L. conceived of the study; R.F., S.K., M.M.-W., and I.O. analysed the data; R.F. and S.K. wrote the first draft of the paper; all authors helped modify the paper and interpret the results; and S.K., T.L., and D.L. performed the fieldwork.

Acknowledgments

We thank Kathleen Groenewegen of the Government of the Northwest Territories for providing full resolution versions of the Ecosystem Classification Group photos of Banks Island and Hugh French for providing some older Banks Island photos. We thank Naomi Short and Yu Zhang from the Canada Centre for Mapping and Earth Observation for constructive comments on an earlier version of the manuscript. Funding was provided by the Canadian Space Agency Government Related Initiatives Program under the project “Big Data Analytics of Earth Observation Data in Support of Evidence-Based Decision Making for Climate Change”, the Polar Continental Shelf Program (project 654-15), the Northwest Territories Cumulative Impact Monitoring Program, and ArcticNet. The authors would also like to thank the Sachs Harbour Hunters and Trappers Committee, the Western Arctic Research Centre, Parks Canada Agency, and the Canadian Wildlife Service for the assistance with ground reconnaissance on Banks Island. The ArcticDEM products were provided by the Polar Geospatial Center under NSF OPP awards 1043681, 1559691, and 1542736. This is Northwest Territories Geological Survey Contribution 0112.

Conflicts of Interest

The authors declare no conflict of interest.

Appendix A. Details for Characterising the Relationship between Ice-Wedge Melt Pond Area and Landsat Reflectance

In this study, we detected changes in the occurrence of ice-wedge melt ponds based on the inverse relationship between SWIR reflectance and surface water area [39,42]. Figure A1 shows the mean and standard deviation of Landsat TOA reflectance for a sample of four major surface types of interest on Banks Island, delineated within the high-resolution study areas 1 and 3. These surface types are sparsely vegetated upland polygonal terrain, upland polygonal terrain containing larger sub-pixel melt ponds, lowland terrain with continuous graminoid vegetation, and shallow lowland ponds. The 1.6 µm SWIR band has many advantages for this application, including its relative insensitivity to atmospheric aerosols, its strong absorption by shallow or turbid water bodies [42], and its relatively high and similar reflectance for tundra vegetation covers. The similar SWIR reflectance for sparsely (0.245) and more densely vegetated (0.228) tundra from this sample suggests that potential long-term, climate-driven vegetation changes on Banks Island [37] would exert a much smaller influence on SWIR trends than changes in surface water area. By comparison, near-infrared (NIR) reflectance would be expected to shift significantly due to changes in either vegetation density or the pond area.
Figure A1. Average and standard deviation of Landsat channel TOA reflectances and NDVI for a sample of sub-pixel ice-wedge melt ponds (n = 152), upland ice-wedge polygons (n = 200), lowland wet productive tundra (n = 142), and lowland ponds (n = 123). Reflectance was sampled from a Landsat 8 image from 8 August 2013.
Remotesensing 10 00954 g0a1
Another consideration for basing our Landsat melt pond change analysis on the 1.6 µm SWIR channel is that these measurements are more consistent between the Landsat TM/ETM+ and OLI sensors than the NIR channel [65] that is used in the normalised water index, Tasseled Cap Wetness, and other water-sensitive Landsat indices. The new OLI instrument on Landsat 8 captures narrower spectral wavebands, which must be carefully considered for their potential to produce biased trends when combined with TM/ETM+ data [66]. We ensured that the 1.6 µm SWIR measurements were consistent across sensors for our application by comparing SWIR TOA reflectance values over Banks Island extracted from a selection of 10,074 clear-sky pixels from seven pairs of overlapping Landsat 7 and Landsat 8 summer images from one day apart (Figure A2). This comparison indicated that the mean SWIR reflectance difference between sensors was 0.002 and that a linear regression equation in Figure A2 for relating Landsat 8 SWIR TOA values to Landsat 7 values shifts reflectance by less than 1%.
Figure A2. Hexagonal bin density plot showing the relationship between Landsat 8 TOA SWIR reflectance and Landsat 7 TOA SWIR reflectance. The solid line shows the least-squares linear regression line, and the dashed line indicates a 1:1 relationship.
Remotesensing 10 00954 g0a2
To investigate the relationship between Landsat SWIR reflectance and the area of sub-pixel ponds, we used imagery from a 5.4 km2 area on east Banks Island containing melt ponds captured by a recent WorldView-1 image (adjacent to study area 2 in Figure 2) that closely matched a Landsat 8 image acquired one day earlier on 10 August 2013. Co-registration between the 0.5 m and 30 m images was improved by visually determining the offset between the 0.5 m image and the 15 m Landsat panchromatic band. Water bodies within the high-resolution images were classified using image segmentation followed by interactive thresholding (Figure A3). For segmentation, the mean segment shift function in ArcGIS was used as described previously. To account for residual registration mismatch between the 0.5 m panchromatic imagery and the 30 m Landsat imagery, comparisons between the two were performed at 90 m. The high-resolution water masks were summed within 90 m cells, and the Landsat SWIR bands were averaged within these cells (Figure A3) before plotting their relationship (Figure A4).
Figure A3. Illustration of the processing steps used to characterise the relationship between the sub-pixel pond area and Landsat SWIR reflectance. Melt ponds extracted using image segmentation and thresholding are shown in cyan.
Remotesensing 10 00954 g0a3
Figure A4. Hexagonal bin density plot showing the relationship between the Landsat SWIR TOA reflectance and the melt pond area aggregated to 90-m resolution (n = 6206). The linear regression equation indicates that a 1% change in SWIR reflectance corresponds to a 5% (~45 m2) change in the sub-pixel pond area.
Remotesensing 10 00954 g0a4

References

  1. Lachenbruch, A.H. Mechanics of Thermal Contraction Cracks and Ice-Wedge Polygons in Permafrost Geological Society of America Special Papers Volume 70 (Geological Society of America). 1962, pp. 1–66. Available online: https://pubs.geoscienceworld.org/books/book/706/chapter/3808751/ (accessed on 13 June 2018).
  2. Mackay, J.R. Ice-Wedge Cracks, Garry Island, Northwest Territories. Can. J. Earth Sci. 1974, 11, 1366–1383. [Google Scholar] [CrossRef]
  3. Mackay, J.R. Some observations on the growth and deformation of epigenetic, syngenetic and anti-syngenetic ice wedges. Permafr. Periglac. Process. 1990, 1, 15–29. [Google Scholar] [CrossRef]
  4. French, H. The Periglacial Environment, 3rd ed.; John Wiley & Songs, Ltd.: Hoboken, NJ, USA, 2007. [Google Scholar]
  5. Soloviev, P.A. Thermokarst phenomenon and landforms due to frost heaving in Central Yakutia. Biuletyn Peryglac. 1973, 23, 135–155. [Google Scholar]
  6. Jorgenson, M.T.; Kanevskiy, M.; Shur, Y.; Moskalenko, N.; Brown, D.R.N.; Wickland, K.; Striegl, R.; Koch, J. Role of ground ice dynamics and ecological fesedbacks in recent ice wedge degradation and stabilization. J. Geophys. Res. Earth Surf. 2015, 120, 2280–2297. [Google Scholar] [CrossRef]
  7. Steedman, A.E.; Lantz, T.C.; Kokelj, S.V. Spatio-Temporal Variation in High-Centre Polygons and Ice-Wedge Melt Ponds, Tuktoyaktuk Coastlands, Northwest Territories. Permafr. Periglac. Process. 2017, 28, 66–78. [Google Scholar] [CrossRef]
  8. MacKay, J. Thermally induced movements in ice-wedge polygons, western arctic coast: A long-term study. GPQ 2000, 54, 41–68. [Google Scholar] [CrossRef]
  9. Liljedahl, A.K.; Boike, J.; Daanen, R.P.; Fedorov, A.N.; Frost, G.V.; Grosse, G.; Hinzman, L.D.; Iijma, Y.; Jorgenson, J.C.; Matveyeva, N.; et al. Pan-Arctic ice-wedge degradation in warming permafrost and its influence on tundra hydrology. Nat. Geosci. 2016, 9, 312–318. [Google Scholar] [CrossRef]
  10. Fortier, D.; Allard, M.; Shur, Y. Observation of rapid drainage system development by thermal erosion of ice wedges on Bylot Island, Canadian Arctic Archipelago. Permafr. Periglac. Process. 2007, 18, 229–243. [Google Scholar] [CrossRef]
  11. Kaufman, D.S.; Axford, Y.L.; Henderson, A.C.G.; McKay, N.P.; Oswald, W.W.; Saenger, C.; Anderson, R.S.; Bailey, H.L.; Clegg, B.; Gajewski, K.; et al. Holocene climate changes in eastern Beringia (NW North America)—A systematic review of multi-proxy evidence. Quat. Sci. Rev. 2016, 147, 312–339. [Google Scholar] [CrossRef]
  12. French, H.M. Active Thermokarst Processes, Eastern Banks Island, Western Canadian Arctic. Can. J. Earth Sci. 1974, 11, 785–794. [Google Scholar] [CrossRef]
  13. Mackay, J.R. Active Layer Changes (1968 to 1993) Following the Forest-Tundra Fire near Inuvik, N.W.T., Canada. Arct. Alpine Res. 1995, 27, 323–336. [Google Scholar] [CrossRef]
  14. Egginton, P.A.; French, H.M. Solifluction and related processes, eastern Banks Island, N.W.T. Can. J. Earth Sci. 1985, 22, 1671–1678. [Google Scholar] [CrossRef]
  15. Mackay, J.R. Ice wedges on hillslopes and landform evolution in the late Quaternary, western Arctic coast, Canada. Can. J. Earth Sci. 1995, 32, 1093–1105. [Google Scholar] [CrossRef]
  16. Shur, Y.L.; Jorgenson, M.T. Patterns of permafrost formation and degradation in relation to climate and ecosystems. Permafr. Periglac. Process. 2007, 18, 7–19. [Google Scholar] [CrossRef]
  17. Kokelj, S.V.; Lantz, T.C.; Tunnicliffe, J.; Segal, R.; Lacelle, D. Climate-driven thaw of permafrost preserved glacial landscapes, northwestern Canada. Geology 2017, 45, 371–374. [Google Scholar] [CrossRef] [Green Version]
  18. Rudy, A.C.A.; Lamoureux, S.F.; Kokelj, S.V.; Smith, I.R.; England, J.H. Accelerating Thermokarst Transforms Ice-Cored Terrain Triggering a Downstream Cascade to the Ocean. Geophys. Res. Lett. 2017, 44. [Google Scholar] [CrossRef]
  19. Jorgenson, M.T.; Romanovsky, V.; Harden, J.; Shur, Y.; O’Donnell, J.; Schuur, E.A.G.; Kanevskiy, M.; Marchenko, S. Resilience and vulnerability of permafrost to climate change. Can. J. For. Res. 2010, 40, 1219–1236. [Google Scholar] [CrossRef]
  20. Jorgenson, M.T.; Shur, Y.L.; Pullman, E.R. Abrupt increase in permafrost degradation in Arctic Alaska. Geophys. Res. Lett. 2006, 33, L02503. [Google Scholar] [CrossRef]
  21. Olefeldt, D.; Goswami, S.; Grosse, G.; Hayes, D.; Hugelius, G.; Kuhry, P.; McGuire, A.D.; Romanovsky, V.E.; Sannel, A.B.K.; Schuur, E.A.G.; et al. Circumpolar distribution and carbon storage of thermokarst landscapes. Nat. Commun. 2016, 7, 13043. [Google Scholar] [CrossRef] [PubMed] [Green Version]
  22. Segal, R.A.; Lantz, T.C.; Kokelj, S.V. Acceleration of thaw slump activity in glaciated landscapes of the Western Canadian Arctic. Environ. Res. Lett. 2016, 11, 034025. [Google Scholar] [CrossRef] [Green Version]
  23. Vincent, J.-S. The Quaternary History of Banks Island, N.W.T., Canada. GPQ 1982, 36, 209–232. [Google Scholar] [CrossRef] [Green Version]
  24. England, J.H.; Furze, M.F.A.; Doupé, J.P. Revision of the NW Laurentide Ice Sheet: Implications for paleoclimate, the northeast extremity of Beringia, and Arctic Ocean sedimentation. Quat. Sci. Rev. 2009, 28, 1573–1596. [Google Scholar] [CrossRef]
  25. French, H.M. The Banks Island Tundra. In Landscapes and Landforms of Western Canada; World Geomorphological Landscapes; Springer: Cham, Switzerland, 2017; pp. 97–108. ISBN 978-3-319-44593-9. [Google Scholar]
  26. Thorsteinsson, R.; Tozer, E.T. Banks, Victoria and Stefansson Islands, Arctic Archipelago; Department of Mines and Technical Surveys: Ottawa, ON, Canada, 1962.
  27. Taylor, A.E.; Judge, A.S. Canadian Geothermal Data Collection-Northern Wells 1976–1977 Geothermal Series; Earth Physics Branch, Energy, Mines and Resources: Ottawa, ON, Canada, 1977.
  28. Smith, I.R.; Farineau, A. A Reconstruction of Drift Lithostratigraphy on Banks Island, Northwest Territories, Based on Seismic Shothole Drillers’ Logs and Lithogeochemical Sample Records; Technical Report; Natural Resources Canada: Ottawa, ON, Canada, 2015.
  29. Ecosystem Classification Group. Ecological Regions of the Northwest Territories—Northern Arctic; Department of Environment and Natural Resources, Government of the Northwest Territories: Yellowknife, NT, Canada, 2013.
  30. Larter, N.C.; Nagy, J.A. The Distribution of Forage Types among Four Terrestrial Habitats on Southern Banks Island Manuscript Report No. 142 Department of Resources, Wildlife & Economic Development, Government of the Northwest Territories. 2001. Available online: http://www.enr.gov.nt.ca/sites/enr/files/142_manuscript.pdf (accessed on 13 June 2018).
  31. NASA GISS. GISS Surface Temperature Analysis: Global Maps from GHCNv3 Data. 2014. Available online: http://data.giss.nasa.gov/gistemp/maps/ (accessed on 13 June 2018).
  32. NASA GISS. Observed Land Surface Precipitation Data: 1901–2000, CRUTS 2.0. 2003. Available online: http://data.giss.nasa.gov/precip_cru/maps.html (accessed on 13 June 2018).
  33. Chander, G.; Markham, B.L.; Helder, D.L. Summary of current radiometric calibration coefficients for Landsat MSS, TM, ETM+, and EO-1 ALI sensors. Remote Sens. Environ. 2009, 113, 893–903. [Google Scholar] [CrossRef] [Green Version]
  34. Mekis, É.; Vincent, L.A. An Overview of the Second Generation Adjusted Daily Precipitation Dataset for Trend Analysis in Canada. Atmos. Ocean 2011, 49, 163–177. [Google Scholar] [CrossRef] [Green Version]
  35. Wulder, M.A.; White, J.C.; Loveland, T.R.; Woodcock, C.E.; Belward, A.S.; Cohen, W.B.; Fosnight, E.A.; Shaw, J.; Masek, J.G.; Roy, D.P. The global Landsat archive: Status, consolidation, and direction. Remote Sens. Environ. 2016, 185, 271–283. [Google Scholar] [CrossRef]
  36. Fraser, R.H.; Lantz, T.C.; Olthof, I.; Kokelj, S.V.; Sims, R.A. Warming-Induced Shrub Expansion and Lichen Decline in the Western Canadian Arctic. Ecosystems 2014, 17, 1151–1168. [Google Scholar] [CrossRef]
  37. Ju, J.; Masek, J.G. The vegetation greenness trend in Canada and US Alaska from 1984–2012 Landsat data. Remote Sens. Environ. 2016, 176, 1–16. [Google Scholar] [CrossRef]
  38. Raynolds, M.K.; Walker, D.A. Increased wetness confounds Landsat-derived NDVI trends in the central Alaska North Slope region, 1985–2011. Environ. Res. Lett. 2016, 11, 085004. [Google Scholar] [CrossRef] [Green Version]
  39. Olthof, I.; Fraser, R.H.; Schmitt, C. Landsat-based mapping of thermokarst lake dynamics on the Tuktoyaktuk Coastal Plain, Northwest Territories, Canada since 1985. Remote Sens. Environ. 2015, 168, 194–204. [Google Scholar] [CrossRef]
  40. Brooker, A.; Fraser, R.H.; Olthof, I.; Kokelj, S.V.; Lacelle, D. Mapping the Activity and Evolution of Retrogressive Thaw Slumps by Tasselled Cap Trend Analysis of a Landsat Satellite Image Stack. Permafr. Periglac. Process. 2014, 25, 243–256. [Google Scholar] [CrossRef]
  41. Fraser, R.H.; Olthof, I.; Kokelj, S.V.; Lantz, T.C.; Lacelle, D.; Brooker, A.; Wolfe, S.; Schwarz, S. Detecting Landscape Changes in High Latitude Environments Using Landsat Trend Analysis: 1. Visualization. Remote Sens. 2014, 6, 11533–11557. [Google Scholar] [CrossRef] [Green Version]
  42. Li, S.; Sun, D.; Yu, Y.; Csiszar, I.; Stefanidis, A.; Goldberg, M.D. A New Short-Wave Infrared (SWIR) Method for Quantitative Water Fraction Derivation and Evaluation With EOS/MODIS and Landsat/TM Data. IEEE Trans. Geosci. Remote Sens. 2013, 51, 1852–1862. [Google Scholar] [CrossRef]
  43. Natural Resources Canada. National Hydro Network [Digital Data]. 2007. Available online: https://open.canada.ca/data/en/dataset/a4b190fe-e090-4e6d-881e-b87956c07977 (accessed on 13 June 2018).
  44. Swanson, D. Stability of Ice-Wedges in Kobuk Valley National Park and the Noatak National Preserve, 1951–2009; Natural Resource Report; NPS/ARCN/NRR—2016/1248; US National Park Service: Washington, DC, USA, 2016.
  45. Lobell, D.B.; Asner, G.P. Moisture Effects on Soil Reflectance. Soil Sci. Soc. Am. J. 2002, 66, 722–727. [Google Scholar] [CrossRef]
  46. Whiting, M.L.; Li, L.; Ustin, S.L. Predicting water content using Gaussian model on soil spectra. Remote Sens. Environ. 2004, 89, 535–552. [Google Scholar] [CrossRef]
  47. Surficial geology, Banks Island, south, Northwest Territories, NTS 97-H, 98-A, and parts of 88-B, 97-G, 98-B. Available online: http://publications.gc.ca/site/eng/9.832676/publication.html (accessed on 12 June 2018).
  48. Surficial Geology, Banks Island, North, Northwest Territories, NTS 98-D, 88-C, and Parts of 88-D, F, 98-C, E, F. Available online: https://geoscan.nrcan.gc.ca/starweb/geoscan/servlet.starweb?path=geoscan/fulle.web&search1=R=299738 (accessed on 12 June 2018).
  49. Riedlinger, D. Community-Based Assessments of Change: Contributions of Inuvialuit Knowledge to Understanding Climate Change in the Canadian Arctic. Master’s Thesis, University of Manitoba, Winnipeg, Manitoba, 2001. Available online: http://www.collectionscanada.gc.ca/obj/s4/f2/dsk3/ftp04/MQ57574.pdf (accessed on 13 June 2018).
  50. Riedlinger, D.; Berkes, F. Contributions of traditional knowledge to understanding climate change in the Canadian Arctic. Polar Rec. 2001, 37, 315–328. [Google Scholar] [CrossRef]
  51. Pollard, W.H.; Ward, M.K.; Becker, M.S. The Eureka Sound Lowlands: An Ice-Rich Permafrost Landscape in Transition; GeoQuebec 2015—The 68th Canadian Geotechnical Conference and the 7th Canadian Permafrost Conference Proceedings. 2015. Available online: http://members.cgs.ca/documents/conference2015/GeoQuebec/papers/402.pdf (accessed on 13 June 2018).
  52. Short, N.; Brisco, B.; Couture, N.; Pollard, W.; Murnaghan, K.; Budkewitsch, P. A comparison of TerraSAR-X, RADARSAT-2 and ALOS-PALSAR interferometry for monitoring permafrost environments, case study from Herschel Island, Canada. Remote Sens. Environ. 2011, 115, 3491–3506. [Google Scholar] [CrossRef]
  53. Liu, L.; Schaefer, K.M.; Chen, A.C.; Gusmeroli, A.; Zebker, H.A.; Zhang, T. Remote sensing measurements of thermokarst subsidence using InSAR. J. Geophys. Res. Earth Surface 2015, 120, 1935–1948. [Google Scholar] [CrossRef]
  54. Jones, B.M.; Grosse, G.; Arp, C.D.; Miller, E.; Liu, L.; Hayes, D.J.; Larsen, C.F. Recent Arctic tundra fire initiates widespread thermokarst development. Sci. Rep. 2015, 5, 15865. [Google Scholar] [CrossRef] [PubMed] [Green Version]
  55. Lantuit, H.; Pollard, W.H. Temporal stereophotogrammetric analysis of retrogressive thaw slumps on Herschel Island, Yukon Territory. Nat. Hazards Earth Syst. Sci. 2005, 5, 413–423. [Google Scholar] [CrossRef] [Green Version]
  56. Wolfe, S.A.; Nixon, F.M.; Kotler, E. Recent Warming Impacts in the Mackenzie Delta, Northwest Territories, and Northern Yukon Territory Coastal Areas. Current Research 2000-B1 Natural Resources Canada; Geological Survey of Canada, 2000. Available online: http://publications.gc.ca/site/eng/88825/publication.html (accessed on 13 June 2018).
  57. Burn, C.R.; Zhang, Y. Sensitivity of active-layer development to winter conditions north of treeline, Mackenzie delta area, western Arctic coast. In Proceedings of the 6th Canadian Permafrost Conference, Calgary, AB, Canada, 12–16 September 2010; pp. 1458–1465. [Google Scholar]
  58. Mudryk, L.; Derksen, C.; Howell, S.; Laliberté, F.; Thackeray, C.; Sospedra-Alfonso, R.; Vionnet, V.; Kushner, P.; Brown, R. Canadian Snow and Sea Ice: Trends (1981–2015) and Projections (2020–2050). Cryosphere Discuss. 2017, 2017, 1–32. [Google Scholar] [CrossRef]
  59. Osterkamp, T.E.; Jorgenson, M.T.; Schuur, E.A.G.; Shur, Y.L.; Kanevskiy, M.Z.; Vogel, J.G.; Tumskoy, V.E. Physical and ecological changes associated with warming permafrost and thermokarst in Interior Alaska. Permafr. Periglac. Process. 2009, 20, 235–256. [Google Scholar] [CrossRef]
  60. Kokelj, S.V.; Lantz, T.C.; Wolfe, S.A.; Kanigan, J.C.; Morse, P.D.; Coutts, R.; Molina-Giraldo, N.; Burn, C.R. Distribution and activity of ice wedges across the forest-tundra transition, western Arctic Canada. J. Geophys. Res. Earth Surf. 2014, 119, 2032–2047. [Google Scholar] [CrossRef] [Green Version]
  61. Kaufman, D.S.; Schneider, D.P.; McKay, N.P.; Ammann, C.M.; Bradley, R.S.; Briffa, K.R.; Miller, G.H.; Otto-Bliesner, B.L.; Overpeck, J.T.; Vinther, B.M.; et al. 2k P. Recent Warming Reverses Long-Term Arctic Cooling. Science 2009, 325, 1236–1239. [Google Scholar] [CrossRef] [PubMed]
  62. Shur, Y.; Hinkel, K.M.; Nelson, F.E. The transient layer: Implications for geocryology and climate-change science. Permafr. Periglac. Process. 2005, 16, 5–17. [Google Scholar] [CrossRef]
  63. Kanevskiy, M.; Shur, Y.; Jorgenson, T.; Brown, D.R.N.; Moskalenko, N.; Brown, J.; Walker, D.A.; Raynolds, M.K.; Buchhorn, M. Degradation and stabilization of ice wedges: Implications for assessing risk of thermokarst in northern Alaska. Geomorphology 2017, 297, 20–42. [Google Scholar] [CrossRef]
  64. Lakeman, T.R.; England, J.H. Paleoglaciological insights from the age and morphology of the Jesse moraine belt, western Canadian Arctic. Quat. Sci. Rev. 2012, 47, 82–100. [Google Scholar] [CrossRef]
  65. Flood, N. Continuity of Reflectance Data between Landsat-7 ETM+ and Landsat-8 OLI, for Both Top-of-Atmosphere and Surface Reflectance: A Study in the Australian Landscape. Remote Sens. 2014, 6, 7952–7970. [Google Scholar] [CrossRef] [Green Version]
  66. Roy, D.P.; Kovalskyy, V.; Zhang, H.K.; Vermote, E.F.; Yan, L.; Kumar, S.S.; Egorov, A. Characterization of Landsat-7 to Landsat-8 reflective wavelength and normalized difference vegetation index continuity. Remote Sens. Environ. 2016, 185, 57–70. [Google Scholar] [CrossRef]
Figure 1. Schematics showing ice wedges in high Arctic ice-cored terrain and how these landscapes are (A) modified over millennial time periods by solifluction and erosional processes, contributing to (B) heightened sensitivity to climate-driven top-down thaw. Landsat image composites (shortwave infrared (SWIR), near-infrared (NIR), Red = RGB) from 16 August 1986 and 10 August 2013 for an area on eastern Banks Island show widespread, textured decreases in reflectance resulting from the formation of ice-wedge melt ponds. Photographs show upland terrains dissected by ice-wedge polygons and influenced by slow diffusive denudation processes (solifluction) and rapid thaw driven processes [ice-wedge degradation, high centre polygon and trough pond development (Ci–Ciii), and thaw slumping]. Stratigraphic sections show a thin veneer of materials over wedge ice and massive segregated ice (Figures S2–S4). Also, see data in Table S2 for thicknesses of soils over massive ice on Banks Island.
Remotesensing 10 00954 g001
Figure 2. Sentinel-2 10 m resolution mosaic (RGB = NIR, Red, Green) of Banks Island created using images from 19 July 2017. The numbers represent the locations of the eight high-resolution study areas.
Remotesensing 10 00954 g002
Figure 3. (a) Annual thawing degree-days (1959–2016) computed using Environment Canada weather station data from Sachs Harbour, Banks Island, where the long-term mean is 461 °C (orange circles indicate years when thaw depths were measured at Green Cabin); (b) Relationship between average thaw depth and thawing degree-days at the time of measurement during early summer 2010–2015 at Green Cabin, north-central Banks Island (73°13′51″N, 119°32′18″W). The square root of degree-days is plotted according to the Stefan equation for predicting thaw depth. Best-fit linear regression equations and coefficients of determination (r2) are shown on both plots.
Remotesensing 10 00954 g003
Figure 4. Illustration of the method used to delineate upland landscapes containing new ice-wedge melt ponds. Sentinel-2 Normalised Difference Vegetation Index (NDVI) values (a) Less than 0.3 were used to classify sparsely vegetated upland landscapes for analysis and exclude higher biomass, lowland areas shown as dark green in (b); Landsat SWIR trends are shown in (c) and negative SWIR trends within uplands (dark blue pixels) in (d) were used to delineate vector polygons of melt pond landscapes outlined in yellow. Each of these melt pond landscapes was then verified through the presence of melt ponds visible in the 10 m 2017 Sentinel-2 imagery (e) and a visible, textured decrease in SWIR reflectance based on a pair of early (~1985) and late (~2017) Landsat images (f,g).
Remotesensing 10 00954 g004
Figure 5. Time series of Landsat images (1.6 µm SWIR channel top-of-atmosphere (TOA) reflectance) centred at 72.96°N, 119.13°W showing progressive, textured decreases in reflectance in upland terrain due to expanding ice-wedge melt ponds (af). The bottom panel shows the 30-year Landsat SWIR trends with significant negative trends indicated as dark blue (g) and a comparison of 1985 Landsat and 2017 Sentinel-2 imagery (h,i) (RGB = NIR, Red, Green). The yellow polygons were derived from the island-wide delineation of new upland melt-pond landscapes that was based on the Landsat trends and Sentinel-2 imagery.
Remotesensing 10 00954 g005
Figure 6. (a) Time series of Landsat SWIR reflectance for the upland terrain shown in Figure 4 averaged across pixels with significant (p < 0.05) negative trends (blue), the strongest 20% of the negative trends (orange), and stable upland pixels with no significant trends (grey). Significant Theil–Sen slopes (p < 0.05) computed based on observation year for the 20 images are shown as dashed lines. To normalise for the effect of surface moisture from precipitation on SWIR reflectance, the average difference of significantly trended and stable pixels is shown for each Landsat date in (b); average SWIR reflectance for lakes in lowland terrain (including a ~30 m buffer) is shown for each date in (c).
Remotesensing 10 00954 g006
Figure 7. Upland landscapes across Banks Island where ice-wedge melt ponds have expanded since 1985, mapped using a semi-automated approach based on negative Landsat SWIR trends and 2017 Sentinel-2 imagery. The delineated melt pond landscapes are aggregated to represent percent coverage at 2 km resolution, and at this scale cover 12,092 km2 or 17.3% of Banks Island. The inset shows the extent of Amundsen (Jesse) glacial till delineated in [47,48].
Remotesensing 10 00954 g007
Figure 8. Comparison of historical air photo (a); recent 0.5 m resolution WorldView-1 panchromatic satellite imagery (b); Landsat SWIR and SWIR trend imagery (significant negative trends are shown in dark blue) (ce); Sentinel-2 10 m satellite imagery (RGB = NIR, Red, Green) (f); and ArcticDEM elevations (g) for a portion of high-resolution study area 2. Areas with continuous graminoid vegetation appear dark grey in the air photo (red in the Sentinel-2 image), while thermokarst lakes and ponds present a darker tone. WorldView-1 panchromatic imagery integrates both visible and near-infrared wavelengths, which causes this graminoid vegetation to appear brighter than in the air photo. Corresponding sets of images for the other seven high-resolution study areas are presented in Figure S6.
Remotesensing 10 00954 g008
Figure 9. Ground photos (a,d) and low-altitude air photos (b,c) of new melt ponds in upland terrain. Images were captured by the Government of the Northwest Territories on 23 July 2011 [29] at a location just west of study area 3 (72.102°N, 120.90°W). The indicated extents were measured using 0.5 m WorldView Imagery from 31 July 2017 and the 2 m ArcticDEM derived using 0.5 m WorldView imagery from 28 July 2012. Panel (c) shows recently submerged clumps of mountain avens (Dryas integrifolia), an evergreen dwarf shrub. Ice-wedge melt ponds on the eastern portion of Banks Island captured in late July 2011 are shown in (e,f).
Remotesensing 10 00954 g009

