Aerosol and Meteorological Parameters Associated with the Intense Dust Event of 15 April 2015 over Beijing, China


1
Department of Land Management, Zhejiang University, Hangzhou 310058, China
2
School of Life and Environmental Sciences, Schmid College of Science and Technology, Chapman University, One University Drive, Orange, CA 92866, USA
*
Authors to whom correspondence should be addressed.
Remote Sens. 2018, 10(6), 957; https://0-doi-org.brum.beds.ac.uk/10.3390/rs10060957
Submission received: 21 April 2018
/
Revised: 7 June 2018
/
Accepted: 14 June 2018
/
Published: 15 June 2018
(This article belongs to the Special Issue Remote Sensing of Atmospheric Properties)
Abstract
:The northeastern parts of China, including Beijing city, the capital of China, were hit by an intense dust storm on 15 April 2015. The present paper discusses aerosol and meteorological parameters associated with this dust storm event. The back trajectory clearly shows that the dust originated from Inner Mongolia, the border of China, and Mongolia regions. Pronounced changes in aerosol and meteorological parameters along the dust track were observed. High aerosol optical depth (AOD) with low Ångström exponent (AE) are characteristics of coarse-mode dominated dust particles in the wavelength range 440–870 nm during the dusty day. During dust storm, dominance of coarse aerosol concentrations is observed in the aerosol size distribution (ASD). The single scattering albedo (SSA) retrieved from AERONET station shows increase with higher wavelength on the dusty day, and is found to be higher compared to the days prior to and after the dust event, supported with high values of the real part and decrease in the imaginary part of the refractive index (RI). With regard to meteorological parameters, during the dusty day, CO volume mixing ratio (COVMR) is observed to decrease, from the surface up to mid-altitude, compared with the non-dusty days due to strong winds. O3 volume mixing ratio (O3VMR) enhances at the increasing altitudes (at the low-pressure levels), and decreases near the surface at the pressure levels 500–925 hPa during the dust event, compared with the non-dusty periods. An increase in the H2O mass mixing ratio (H2OMMR) is observed during dusty periods at the higher altitudes equivalent to the pressure levels 500 and 700 hPa. The mid-altitude relative humidity (RH) is observed to decrease at the pressure levels 700 and 925 hPa during sand storm days. With the onset of the dust storm event, the RH reduces at the surface level.
1. Introduction
Dust storms are common in many countries in the Northern Hemisphere almost every year. The weather conditions, visibility, air quality, and human health are directly affected due to dust storm, and the impacts are seen for several weeks [1,2,3]. Dust storms also uproot trees and damage standing crops and fruits. Some of the regions are impacted by dust storms every year that indirectly influence long-term weather conditions, and also, the onset of monsoon. Under atmospheric circulation, dust storms have long range transport, and dust could go around the globe [4,5]. If the dust is transported over the ocean water, dust blankets the ocean water, depending upon the mineralogical composition of dust, and iron-rich dust enhances the chlorophyll bloom in the ocean water [6]. Depending upon the wind pattern and wind speed, dust blankets the snow/glaciers in the mountainous areas, affecting the melting of snow/glaciers [7].
Dust storms are frequent in northern China during spring season (March–May) [8,9]. They typically originate from Gobi and sand deserts of arid and semiarid regions in the northwest and north of China [10]. Intense frontal activities, taking place mostly during spring, provide a mechanism for injection of substantial materials into the lower and middle troposphere. The dust uplifted from arid and semiarid regions is transported to downwind regions, including northern China, Korea, Japan, and even the western parts of the United States across the North Pacific Ocean [11,12,13].
Beijing, the capital of China, is one of the most populous cities in the world, with a population of 21.7 million (as of the population census records in 2015) covering an area of 16,800 km2. It has a typical continental monsoon climate with four distinct seasons. Beijing is located at the foothills of Yan Mountains and Taihang Mountains, in the North China Plain [14], and on the pathway of dust outflows [15]. Beijing faces serious air pollution (poor air quality), which is associated with human health problems. In Beijing, the main cause of high particulate matter are industrial emissions, vehicle exhausts, dust, and coal burning [16,17,18]. Dust storms occur annually during the spring season, which cause severe air quality, even for several continuous days, and they generally originate in the primary source regions of Mongolia and Inner Mongolia [2,19]. About 53 dust episodes have impacted Beijing city during 2000–2010 [20]. Three dust storm events having visibility less than 1 km were identified over Beijing during 2005–2010 [2], and 47 dusty days were observed over Beijing during spring time in the period 2001–2014 [21].
Ground observations, including Aerosol Robotic Network (AERONET) [22], and monitoring sites from China National Environmental Monitoring Centre (CNEMC, http://www.cnemc.cn/), combined with multisatellite sensors, including Moderate Resolution Imaging Spectroradiometer (MODIS), Multiangle Imaging Spectroradiometer (MISR), and Ozone Monitoring Instrument (OMI), are capable of monitoring transport and providing optical information about the dust and changes in atmospheric parameters associated with the transport of dust. Based on the AERONET sun photometer measurements over Beijing, the seasonal averaged aerosol optical depth (AOD) at the wavelength of 440 nm during dust periods between 2001 and 2014 was 1.2, with Ångström exponent (AE) 0.44, show high aerosol loading. The single scattering albedo (SSA) on dusty days was much higher compared to other episodes, with an average value of 0.88 at 440 nm [21]. During 2001 to 2007 dust storms, the averaged value of AOD (1.7) and AE (0.48) were observed compared those of 1.26 (AOD) and 1.11 (AE) during haze–fog days. The average of SSA was found to be about 0.92 for dusty days and 0.89 for haze–fog days [23]. During dust events (2004–2006) in Beijing, real and imaginary parts of the dust refractive index (RI) in the wavelength range 440–1020 nm were 1.52–1.56, 0.007–0.010, respectively [1]. Du et al. [24] have analyzed aerosol observational data available for periods 2005–2007 from the Chinese Sun Hazemeter Network (CSHNET) to characterize aerosol particles during dusty and non-dusty days. In spring season, the mean AOD value during non-dust periods was 0.51, and increased to 0.68 during dusty days, and AE decreased from 0.82 during non-dust periods to 0.62 during dusty days. In addition, at dust-source sites, AOD increased from 0.34 during non-dust periods to 0.44 during dust periods, and AE decreased from 0.51 during non-dust periods to 0.40 during dust periods. Using eight ground-based observations from CSHNET, Xin et al. [25] have analyzed the aerosol optical properties during the strong dust event of 16–21 April 2005, and found the mean value of AOD increased from 0.37 to 0.69, and AE decreased from 1.35 to 1.07 at sites in Beijing city.
Different satellite sensors (MODIS, MISR, OMI, and Atmospheric Infrared Sounder—AIRS) are used to obtain large-scale distributions of aerosol optical properties. In addition, a multispectral algorithm for detecting dust aerosols is developed by combining measurements of MODIS reflective solar bands and thermal emissive bands [26]. Enhanced total column water vapor was observed from MODIS data showing a strong association with the AOD along the track of dust storms over Indo-Gangetic (IG) plains [27]. Pronounced changes in water vapor column and meteorological parameters were observed during dusty days, as compared to the days prior to and after dust storm events over Beijing during 2005–2010 [2]. The lidar system, like Cloud-Aerosol Lidar and Infrared Pathfinder Satellite Observations (CALIPSO), has been used widely to study the vertical variability of aerosols [28,29,30,31], and to find the vertical distribution of dust from space [32]. The vertical distribution of total attenuated backscatter (TAB), depolarization ratio (DR), and color ratio (CR) of Cloud-Aerosol Lidar with Orthogonal Polarization (CALIOP) onboard the CALPSO, have been analyzed during the severe dust events from 26 April to 3 May 2012, over Beijing. In the dust layer, the values of TAB vary in the range 0.002–0.0045 km−1sr−1, and DR and CR, respectively, vary in the range 0.1–0.5 and 0.6–1.4 [33].
Numerous studies were carried out to study long range transport, physical, chemical, and optical properties of dust, as well as its influence on meteorological parameters using ground and satellite observations [2,3,34,35,36,37,38,39,40,41,42,43,44,45]. These studies have provided a good understanding of the effect of dust storm on air quality, the global biogeochemical cycle, and environmental change. However, not much study on changes of aerosol and meteorological parameters over Beijing has been carried out. Dust hitting Beijing depends on the sources and tracks of dust, and meteorological conditions during dust events. The detailed analysis of aerosol optical properties and meteorological parameters during dust storm events using combined ground and satellite data will help to provide better understanding of mixing of dust with existing emissions within its surroundings, and qualitative and quantitative evaluation of dust impacts on surface, on various parameters on total column, and at different pressure levels.
In the present study, we have carried out detailed analysis of one of the worst dust events in the last one decade that affected Beijing city and surroundings on 15 April 2015. The main aim of our detailed analysis is to evaluate changes in the aerosol optical properties, air quality, and atmospheric and meteorological parameters. The changes in aerosol properties (AOD, AE, aerosol size distribution—ASD, refractive index—RI, and SSA from AERONET, total attenuated backscatter and depolarization ratio at 532 nm from CALIOP), atmospheric and meteorological parameters (CO, O3, relative humidity—RH, and H2O) clearly show contrast between the dusty day and non-dusty days. The characteristics of aerosol optical properties, and atmospheric and meteorological parameters on the dusty day and non-dusty days, are discussed in detail. In this paper, for the first time, we made efforts to use air quality data from ground network stations, AERONET, and multisatellites (MODIS, AIRS, CALIOP) to study characteristics and differences of aerosol, air quality, and atmospheric and meteorological parameters on the dusty day and non-dusty days.
2. Data and Methods
We have used data from AERONET station, AIRS, MODIS, and CALIOP to study changes in aerosol properties, and atmospheric and meteorological parameters. The Hybrid Single Particle Lagrangian Integrated Trajectory (HYSPLIT) model analysis has been carried out to find out the source of dust reaching to Beijing city. The AERONET is a network of ground-based sun photometers to measure aerosol optical properties and validate aerosol optical properties retrieved from satellite [22]. The aerosol optical properties available in this study were derived from AERONET Beijing station (longitude = 116.317°E, latitude = 39.933°N) run by Chinese Academy of Meteorological Sciences (CAMS). The version 2 of AERONET data include AOD at the wavelength 675 nm, AE (440–870 nm), ASD, SSA, and RI. The AE is inversely related to the average size of the aerosol particles, where the larger particles correspond to lower AE [46]. The AERONET ASD, dV/dlnR (μm3/μm2) is retrieved from the Sun photometer using 22 radius size bins in the size range of 0.05–15 μm. ASD is useful to understand the effect of aerosols on the solar radiation. The amount of light absorbed by each particle is measured by SSA, the ratio between the light extinction due to scattering alone and the total light extinction from both scattering and absorption. The real and imaginary () parts of the complex RI provide information on the scattering or absorbing nature of aerosols. AERONET provides SSA and RI data for the wavelengths 440, 675, 870, and 1020 nm. We have studied diurnal and daily characteristics of aerosol parameters on the dusty day and non-dusty days using AERONET. The accuracy of aerosol parameters retrieved by AERONET is described by Dubovik et al. [47]. For aerosols dominated by coarse particles or desert dust, the accuracy of ASD measurements is 15–25% for the radius ≥0.5 μm, 25–100% for radius <0.5 μm, and the accuracy of SSA is 0.03% and 50% for both and . The accuracy of at 870 nm and 1020 nm is 0.05 and 0.04, respectively [47].
The hourly mass concentration of trace gases (CO and O3) and particulate matter (PM2.5 and PM10) in ground-monitoring sites in Beijing are taken from China National Environmental Monitoring Centre (CNEMC, http://www.cnemc.cn/). CO measurements use a non-dispersive infrared (NDIR) gas filter correlation CO analyzer. The ultraviolet (UV) photometric method was applied for O3 monitoring. Both PM2.5 and PM10 are continuously measured using the gravimetric method [18].
CO and ozone are both important atmospheric trace gases, and are retrieved from AIRS sensors onboard NASA’s Aqua satellite. Both trace gases are considered as greenhouse gases; higher concentrations have serious impacts on human health. CO is produced from biomass burning and industrial emissions, and is also a precursor of the tropospheric ozone in the atmosphere. Ozone is a highly reactive form of oxygen. AIRS provides vertical profile information of CO, ozone, and water vapor on the fixed pressure levels. AIRS products (CO volume mixing ratio—COVMR, O3 volume mixing ratio—O3VMR, RH, H2O mass mixing ratio—H2OMMR) and MODIS products (AOD and AE) were downloaded from NASA Giovanni tools (http://disc.sci.gsfc.nasa.gov/giovanni), and the daily AIRS products were used. Usually, AIRS provides data at different pressure levels, but on the dust days, AIRS does not provide any data product at the surface level, due to the dust storm event. The volume mixing ratio is the ratio of the number density of the gas to the total number density of the atmosphere (density is the number of molecules per unit volume). COVMR and O3VMR are the density of CO and O3, respectively, divided by the density of all constituents in a unit volume. Both of them are given in unit as parts per billion by volume, or ppbv. H2OMMR is the ratio of the mass of water vapor to the mass of only the dry air in the air sample, and units are expressed as grams water per kilogram dry air. As AIRS products are sorted into 1° × 1° cells, the central area of Beijing (longitude 115.4°E–117.5°E, latitude 39.4°N–41.0°N), is studied from 116° to 117° E, and from 40° to 41° N. Preliminary comparisons to in situ aircraft profiles indicate AIRS CO retrievals are approaching the 15% accuracy target set by pre-launch simulations [48]. The AIRS ozone profile retrieval biases with global ozonesonde are less than 5% for both the stratosphere and the troposphere. The root mean square (RMS) differences are less than 20% for the upper stratosphere, and are close to 20% for the lower stratosphere and the troposphere [49]. AIRS retrievals of relative humidity are within the uncertainty of in situ observations based on dedicated radiosondes. This illustrates that AIRS RH retrievals are of high quality, even for difficult conditions in the upper troposphere [50]. The water vapor retrievals from AIRS are in good agreement with the radiosonde measurements. The RMS difference is close to the expected goal accuracies, better than 15% in 2 km layers for the water vapor in the troposphere [51].
CALIOP have provided an unprecedented way to examine the aerosol vertical distribution extensively [29,52], especially for sand-dust storms [53]. The orbit period of CALIPSO is 99 min, with a repeat cycle of 16 days. CALIOP total attenuated backscatter, in km−1sr−1, and volume depolarization ratio at 532 nm of level 1 version 4.1 aerosol layers, were retrieved to study the aerosol vertical characteristics for this dust storm event [54]. Total attenuated backscatter is the sum of the parallel and perpendicular components of attenuated backscatter profiles. CALIOP depolarization ratio is the ratio of perpendicular to parallel polarization components of aerosol scattering. The CALIOP data were obtained from the NASA Langley Research Center Atmospheric Sciences Data Center (https://earthdata.nasa.gov/about/daacs/daac-asdc).
We have run HYSPLIT model (http://ready.arl.noaa.gov/HYSPLIT.php) to study the long-range transport of air mass. The use of surface meteorological variables (ambient temperature, rainfall, relative humidity, and solar radiation flux) on the day of event reduces the uncertainty in HYSPLIT model [55]. The HYSPLIT model [56,57] was used to study the origin of air mass (dust) and track its movements at different altitudes. The executable and meteorological data are provided by the NOAA’s air resources laboratory (ARL) for free for back trajectory analysis, and we have used meteorological archive from the global data assimilation system (GDAS) with 1° by 1° grid in this study.
3. Dust Storm Event of 15 April 2015
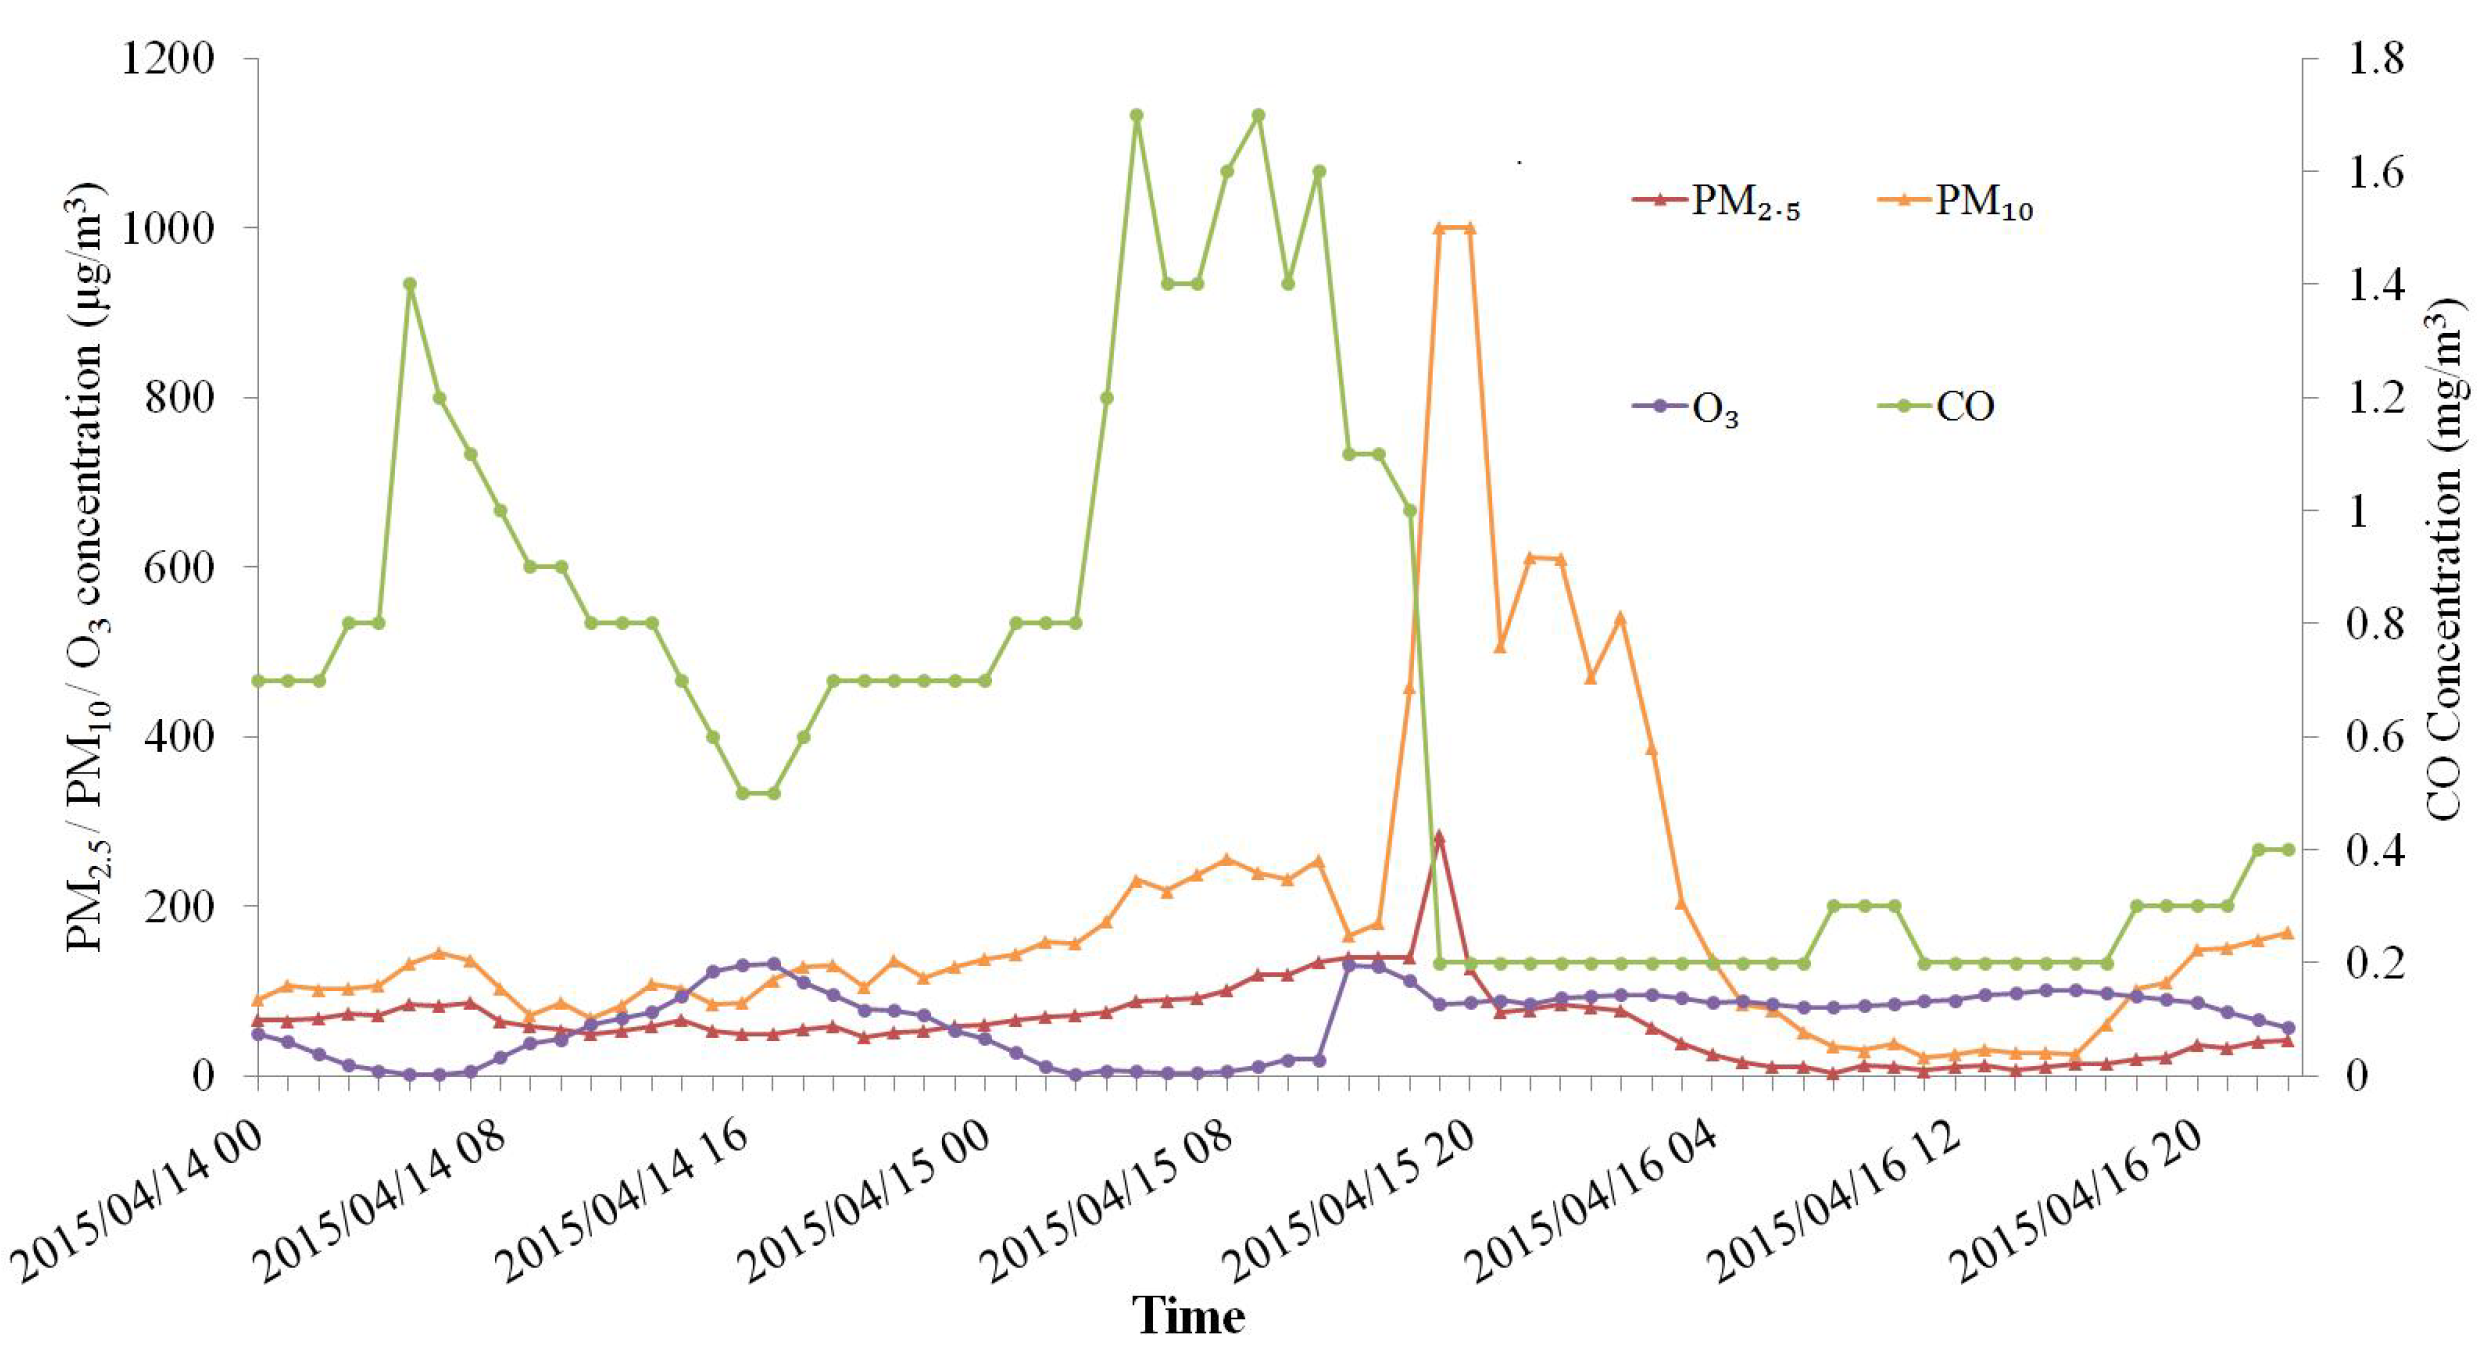
On 15 April 2015, Beijing was hit by one severe dust storm. China’s environmental monitoring center issued a “yellow” sandstorm warning about the poor visibility (below 1000 m). Figure 1 shows hourly variations of particulate matter (PM2.5 and PM10), carbon monoxide (CO) and ozone (O3) concentrations at the ground level in Dongsi station, which is one of the 12 state-controlled ground-monitoring sites in Beijing. With the onset of the dust storm event in Beijing, both PM10 and PM2.5 showed pronounced increases (respectively, above 1000 and 280 μg/m3) around 19:00–20:00 h on 15 April 2015. The concentration of coarse particles increases with the dust storm, furthermore, dust storm particles mix with the local and surrounding emissions of the major city. Recently, Chauhan et al. [58] have shown strong mixing of emissions from a forest fire and dust episode over Bakersfield, California. In the dust event observed over Beijing on 15 April 2015, PM10 and PM2.5 reduced to 35 and 4 μg/m3, respectively, at around 8:00 h on 16 April. As the dust storm began, the surface CO concentration decreased (CO reduced to 0.2 mg/m3 at 19:00 h on 15 April 2015).
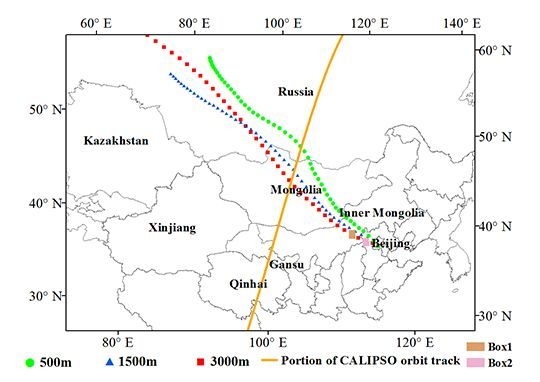
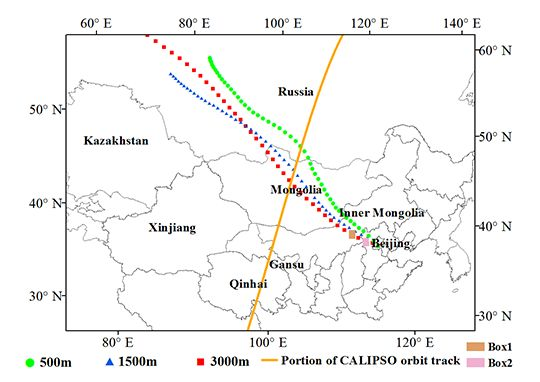
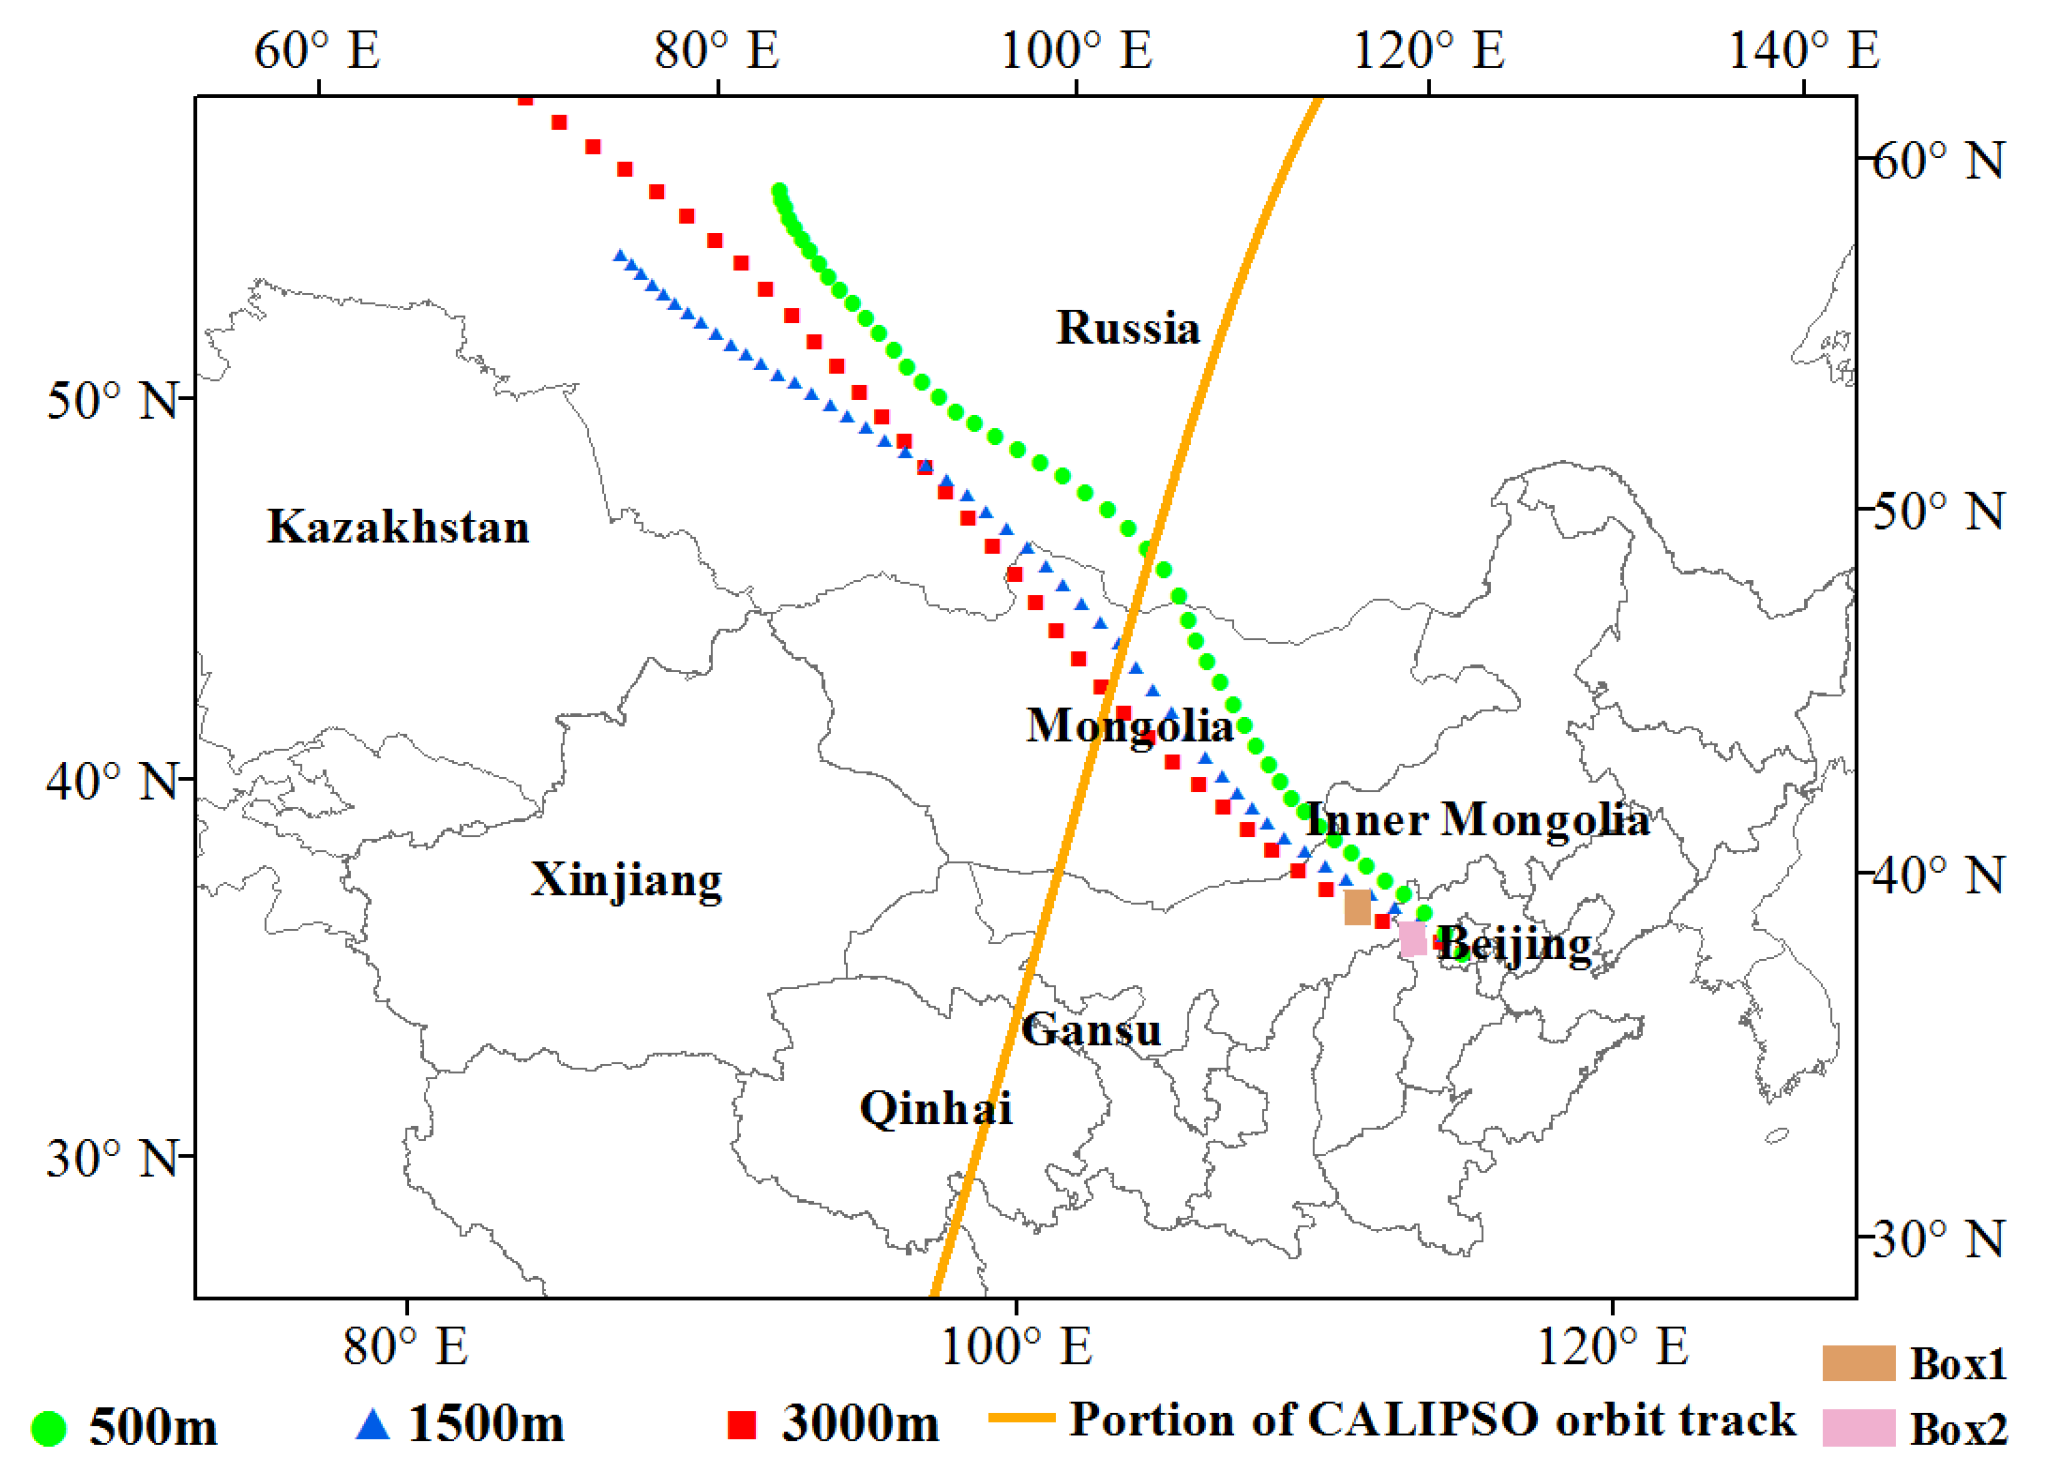
The back trajectories (Figure 2) clearly show the source of dust storm and its track 48 h before the dust arrived in Beijing (17:00 h, 15 April 2015) at three different heights, 500, 1500, and 3000 m. The dust storm mainly originated from the northwest (Inner Mongolia, the border of China and Mongolia regions), which has an arid climate, and is covered by large areas of sandy, Gobi (gravel) deserts and sandy lands [59,60]. Up to more than 80% of the annual dust storm frequency in China occurs during spring (March–May). The large quantities of dust are generated in the northern China by cyclonic activities and cold surges that emerge from Siberia [61].
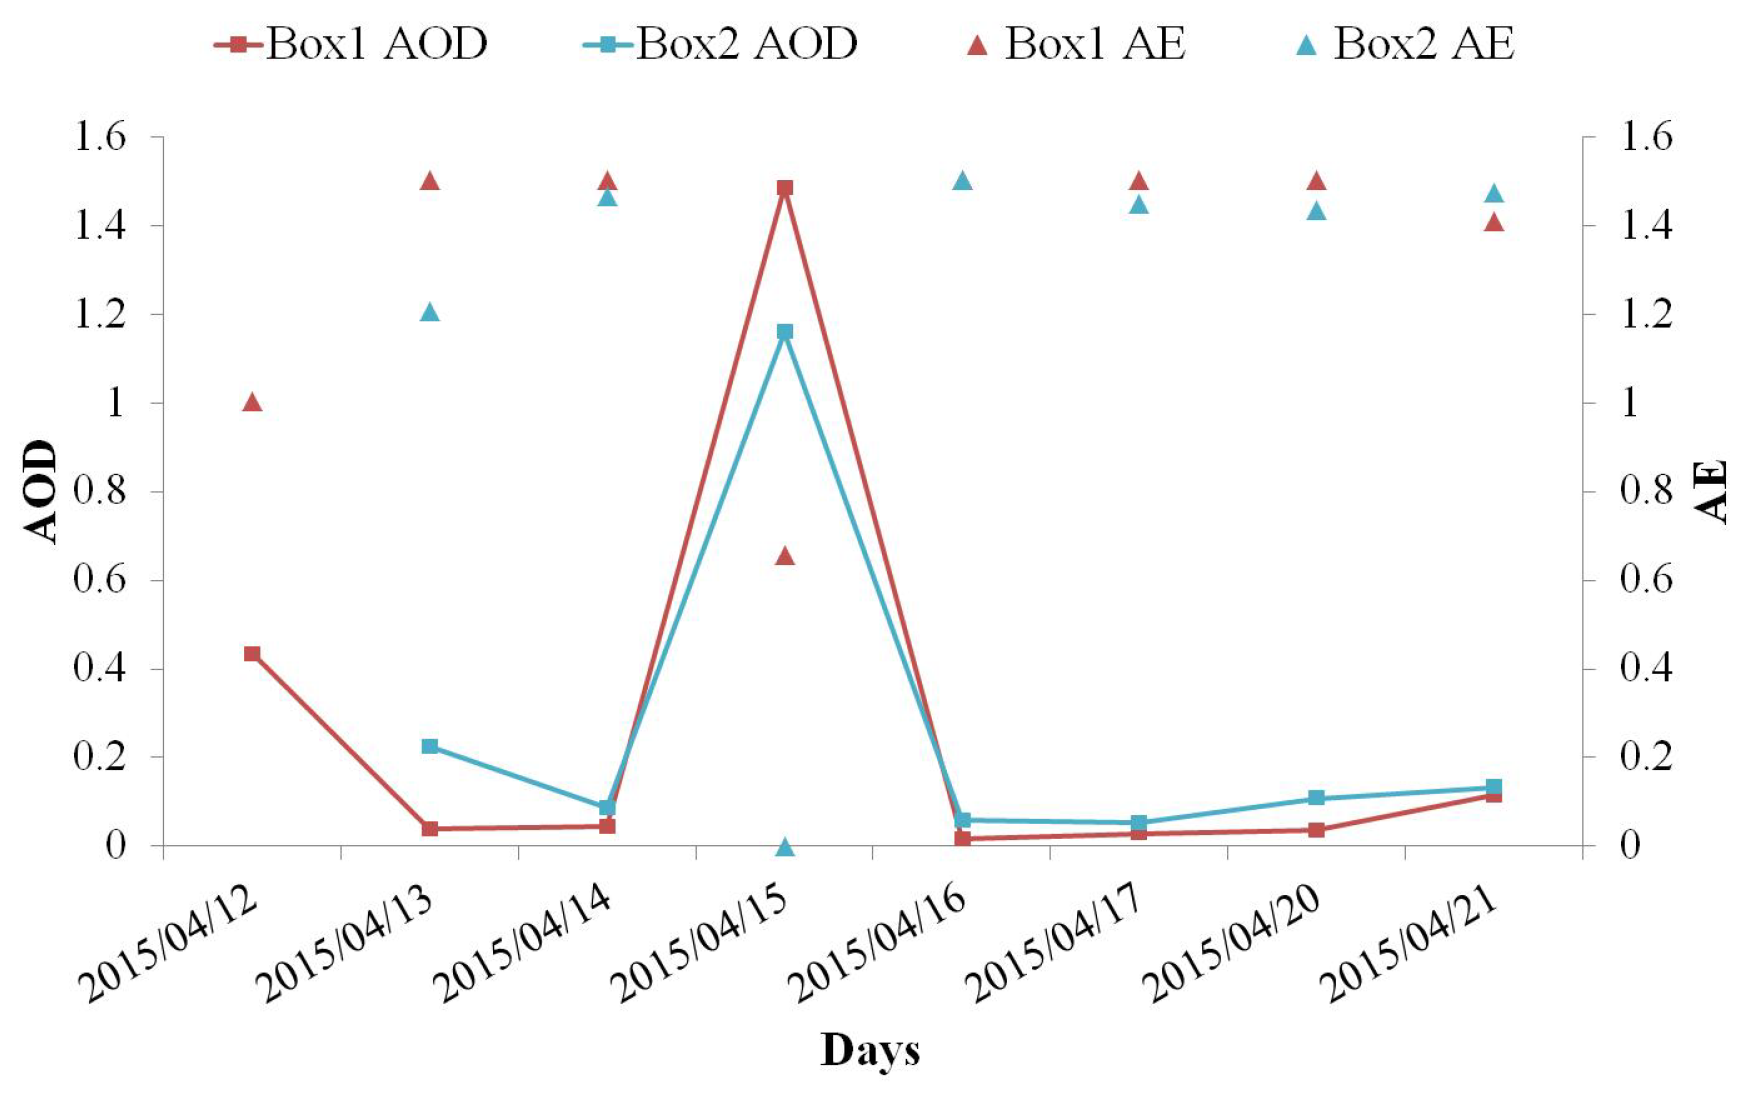
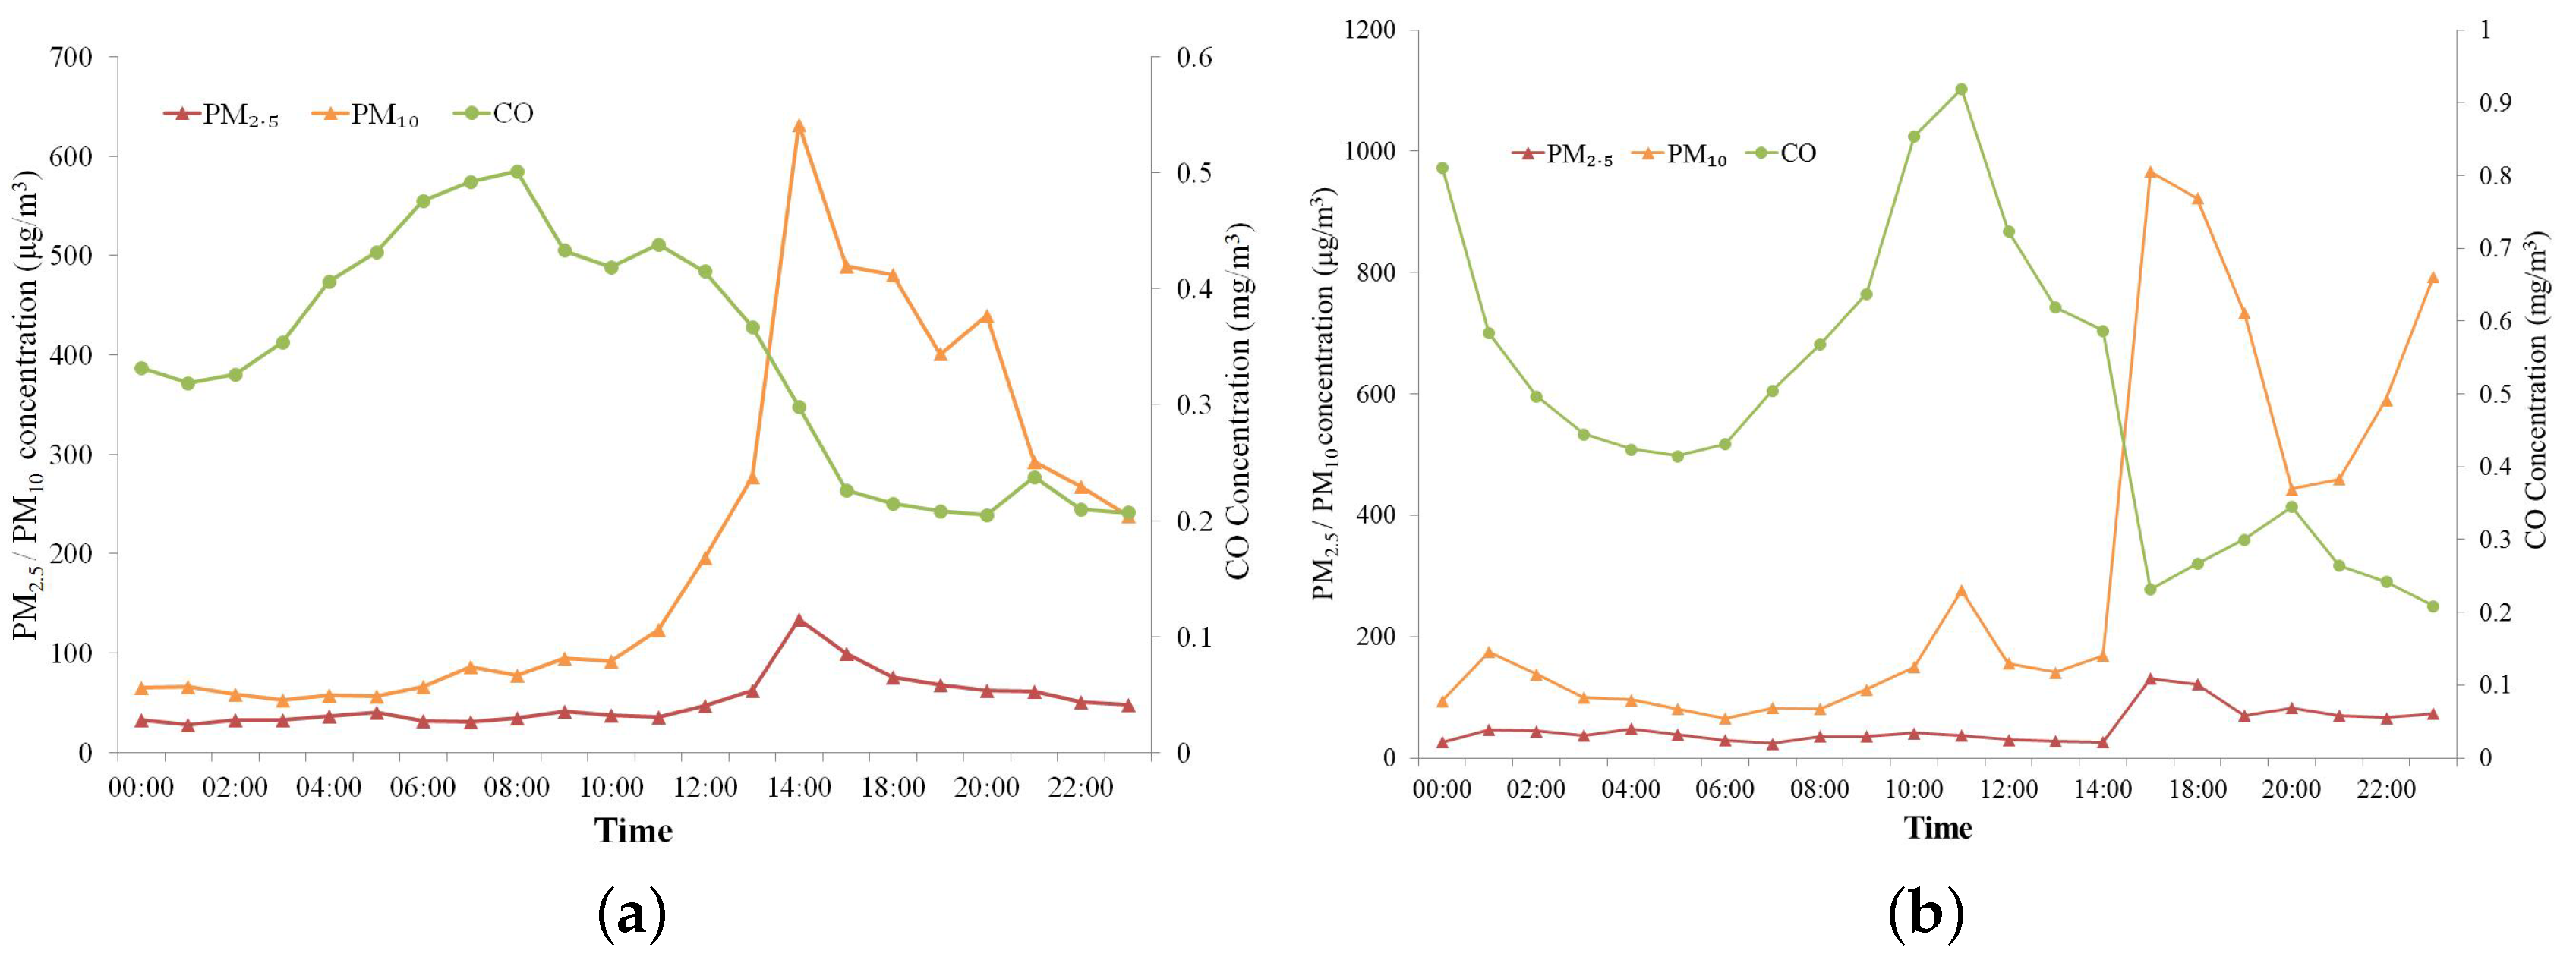
The dust track passes through the city of Ulanqab and Zhangjiakou, before it arrives in Beijing. Two boxes shown in Figure 2 are considered to study the variations of aerosol and meteorological parameters due to dust event. Box 1 (112°E–113°E, 41°N–42°N) is located in Ulanqab city, and Box 2 (114°E–115°E, 40°N–41°N) is located in Zhangjiakou city. The area-averaged AOD and AE acquired from MODIS Level 3 products for the period 12–21 April are shown in Figure 3. Daily AOD and AE in these two regions show similar trends, with the highest AOD and lowest AE on April 15, and clearly indicate the dusty day and the days prior to and after dust event. In addition, the ground observations inside these two boxes are acquired. The hourly variations of PM2.5, PM10, and CO concentrations on 15 April 2015 at the ground level in these two boxes are shown as Figure 4. In Ulanqab (Figure 4a), both PM10 and PM2.5 reached the maximum around 14:00 h, with the value of 632 and 134 μg/m3, respectively. CO shows decrease since 11:00 h, and reduced to 0.2 mg/m3 at 20:00 h. In Zhangjiakou (Figure 4b), both PM10 and PM2.5 have the highest value around 16:00 h, with the value of 967 and 131 μg/m3, respectively, while CO concentration had a fast downward trend (0.9 mg/m3 decreased to 0.2 mg/m3) between 12:00 and 16:00 h.
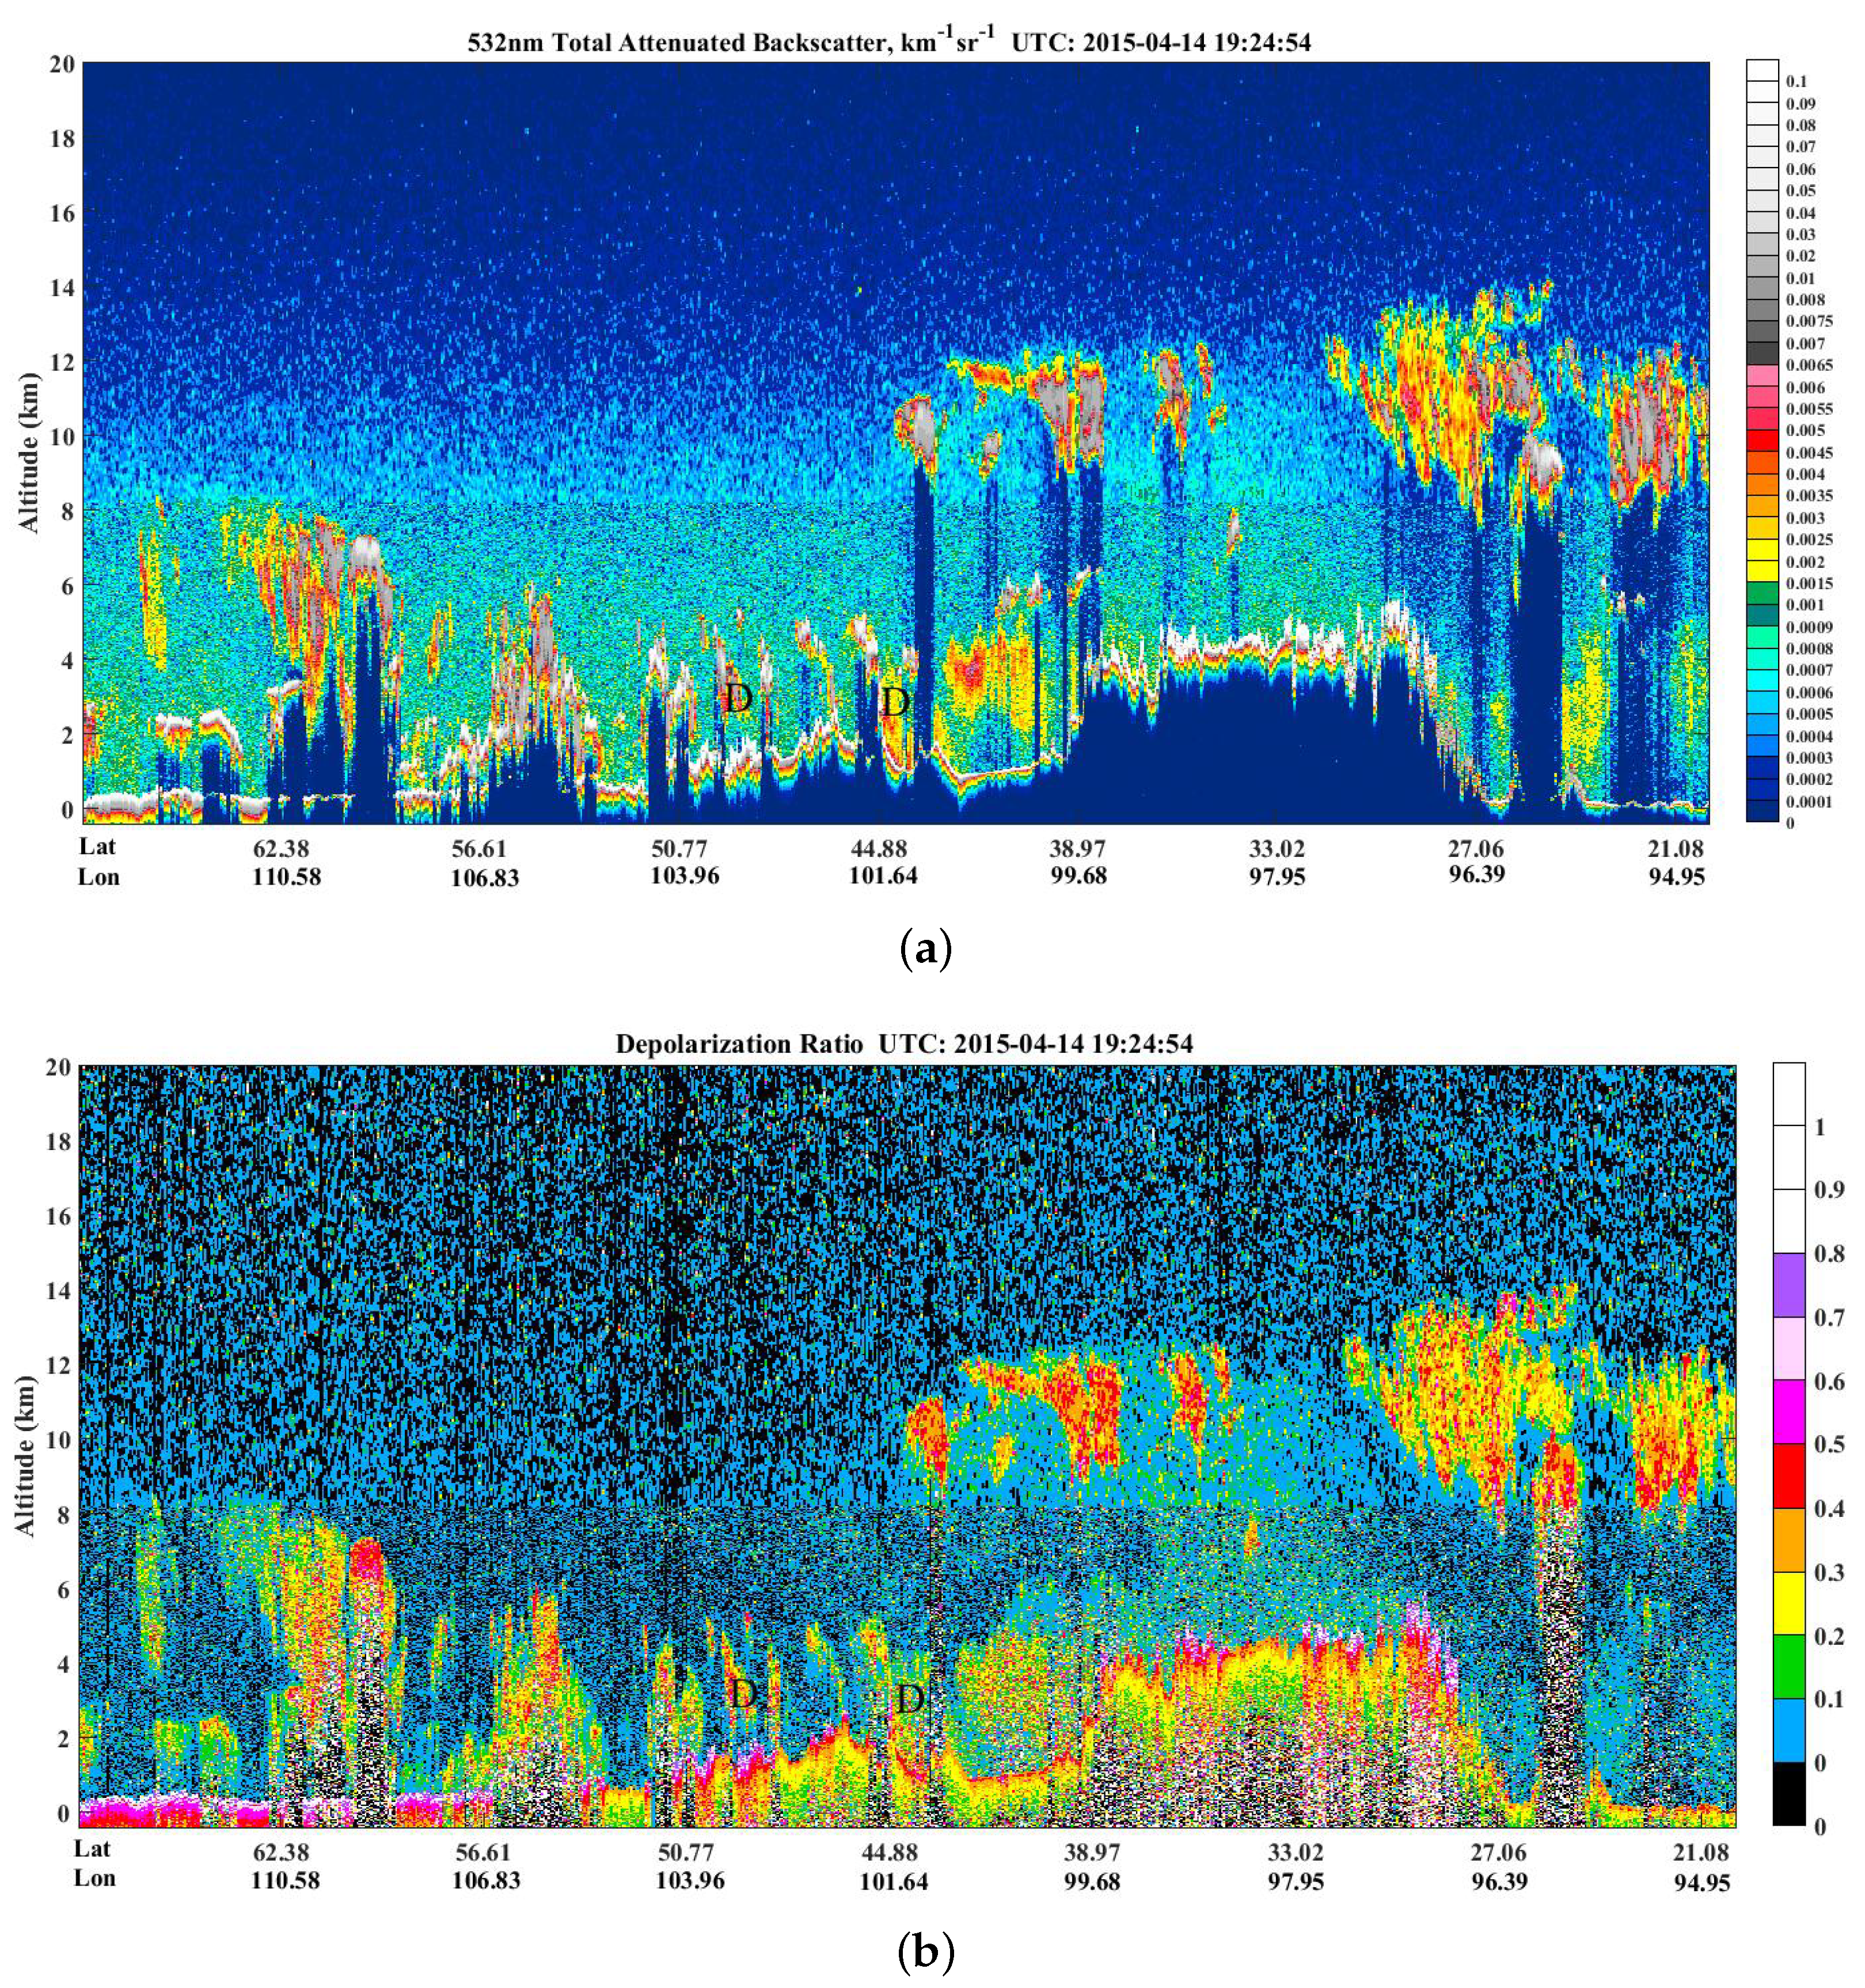
Following the portion of CALIPSO orbit track (i.e., yellow line in Figure 2) passing Mongolia, Inner Mongolia, Gansu, and Qinhai, we have acquired the total attenuated backscatter (Figure 5a) and depolarization ratio (Figure 5b) for the bounding area (20.89°N, 94.9°E) and (68.7°N, 116.72°E) at 19:24 on 14 April 2015 (UTC). Attenuated backscatter is one of the main parameters of CALIOP reflecting the ability of aerosol scattering. The attenuated backscatter is defined as
where and are the backscatter coefficients due to molecular scattering and particulate scattering, at range and the laser wavelength (1064 nm or 532 nm), respectively. is the two-way atmospheric transmittance, is the range-corrected lidar backscatter signal, and is the calibration coefficient [53,62].
Clouds have larger backscatter coefficients compared to aerosols [63]. The total attenuated backscatter at 532 nm in the range 0.0001–0.0008 km−1sr−1, 0.0008–0.0045 km−1sr−1, and 0.0045–0.0100 km−1sr−1, respectively, represent gas molecules, aerosols, and clouds [53]. The red–gray–white color features in Figure 5a are clouds, and green–yellow–orange features are aerosols. Depolarization ratio, one parameter of CALIOP, can distinguish spherical aerosols from non-spherical aerosols. The depolarization ratio for dust aerosol is relatively high due to asymmetry (non-sphericity) and comparatively large size [64,65]. Shen et al. [33] found that in the dust layer, the values of total attenuated backscatter vary in the range 0.002–0.0045 km−1sr−1, and the values of depolarization ratio vary in the range 0.1–0.5 during the dust storm event over Beijing in 2012. In this study, the letter “D” in Figure 5a,b designates the dust layer in CALIOP over Mongolia areas (42.00°N, 100.65°E~50.00°N, 103.63°E). The vertical extent of the dust layer is from 2–4 km.
4. Results and Discussion
4.1. Characteristics of Aerosol Parameters
4.1.1. Aerosol Optical Depth at 675 nm (AOD675) and Ångström Exponent (AE)
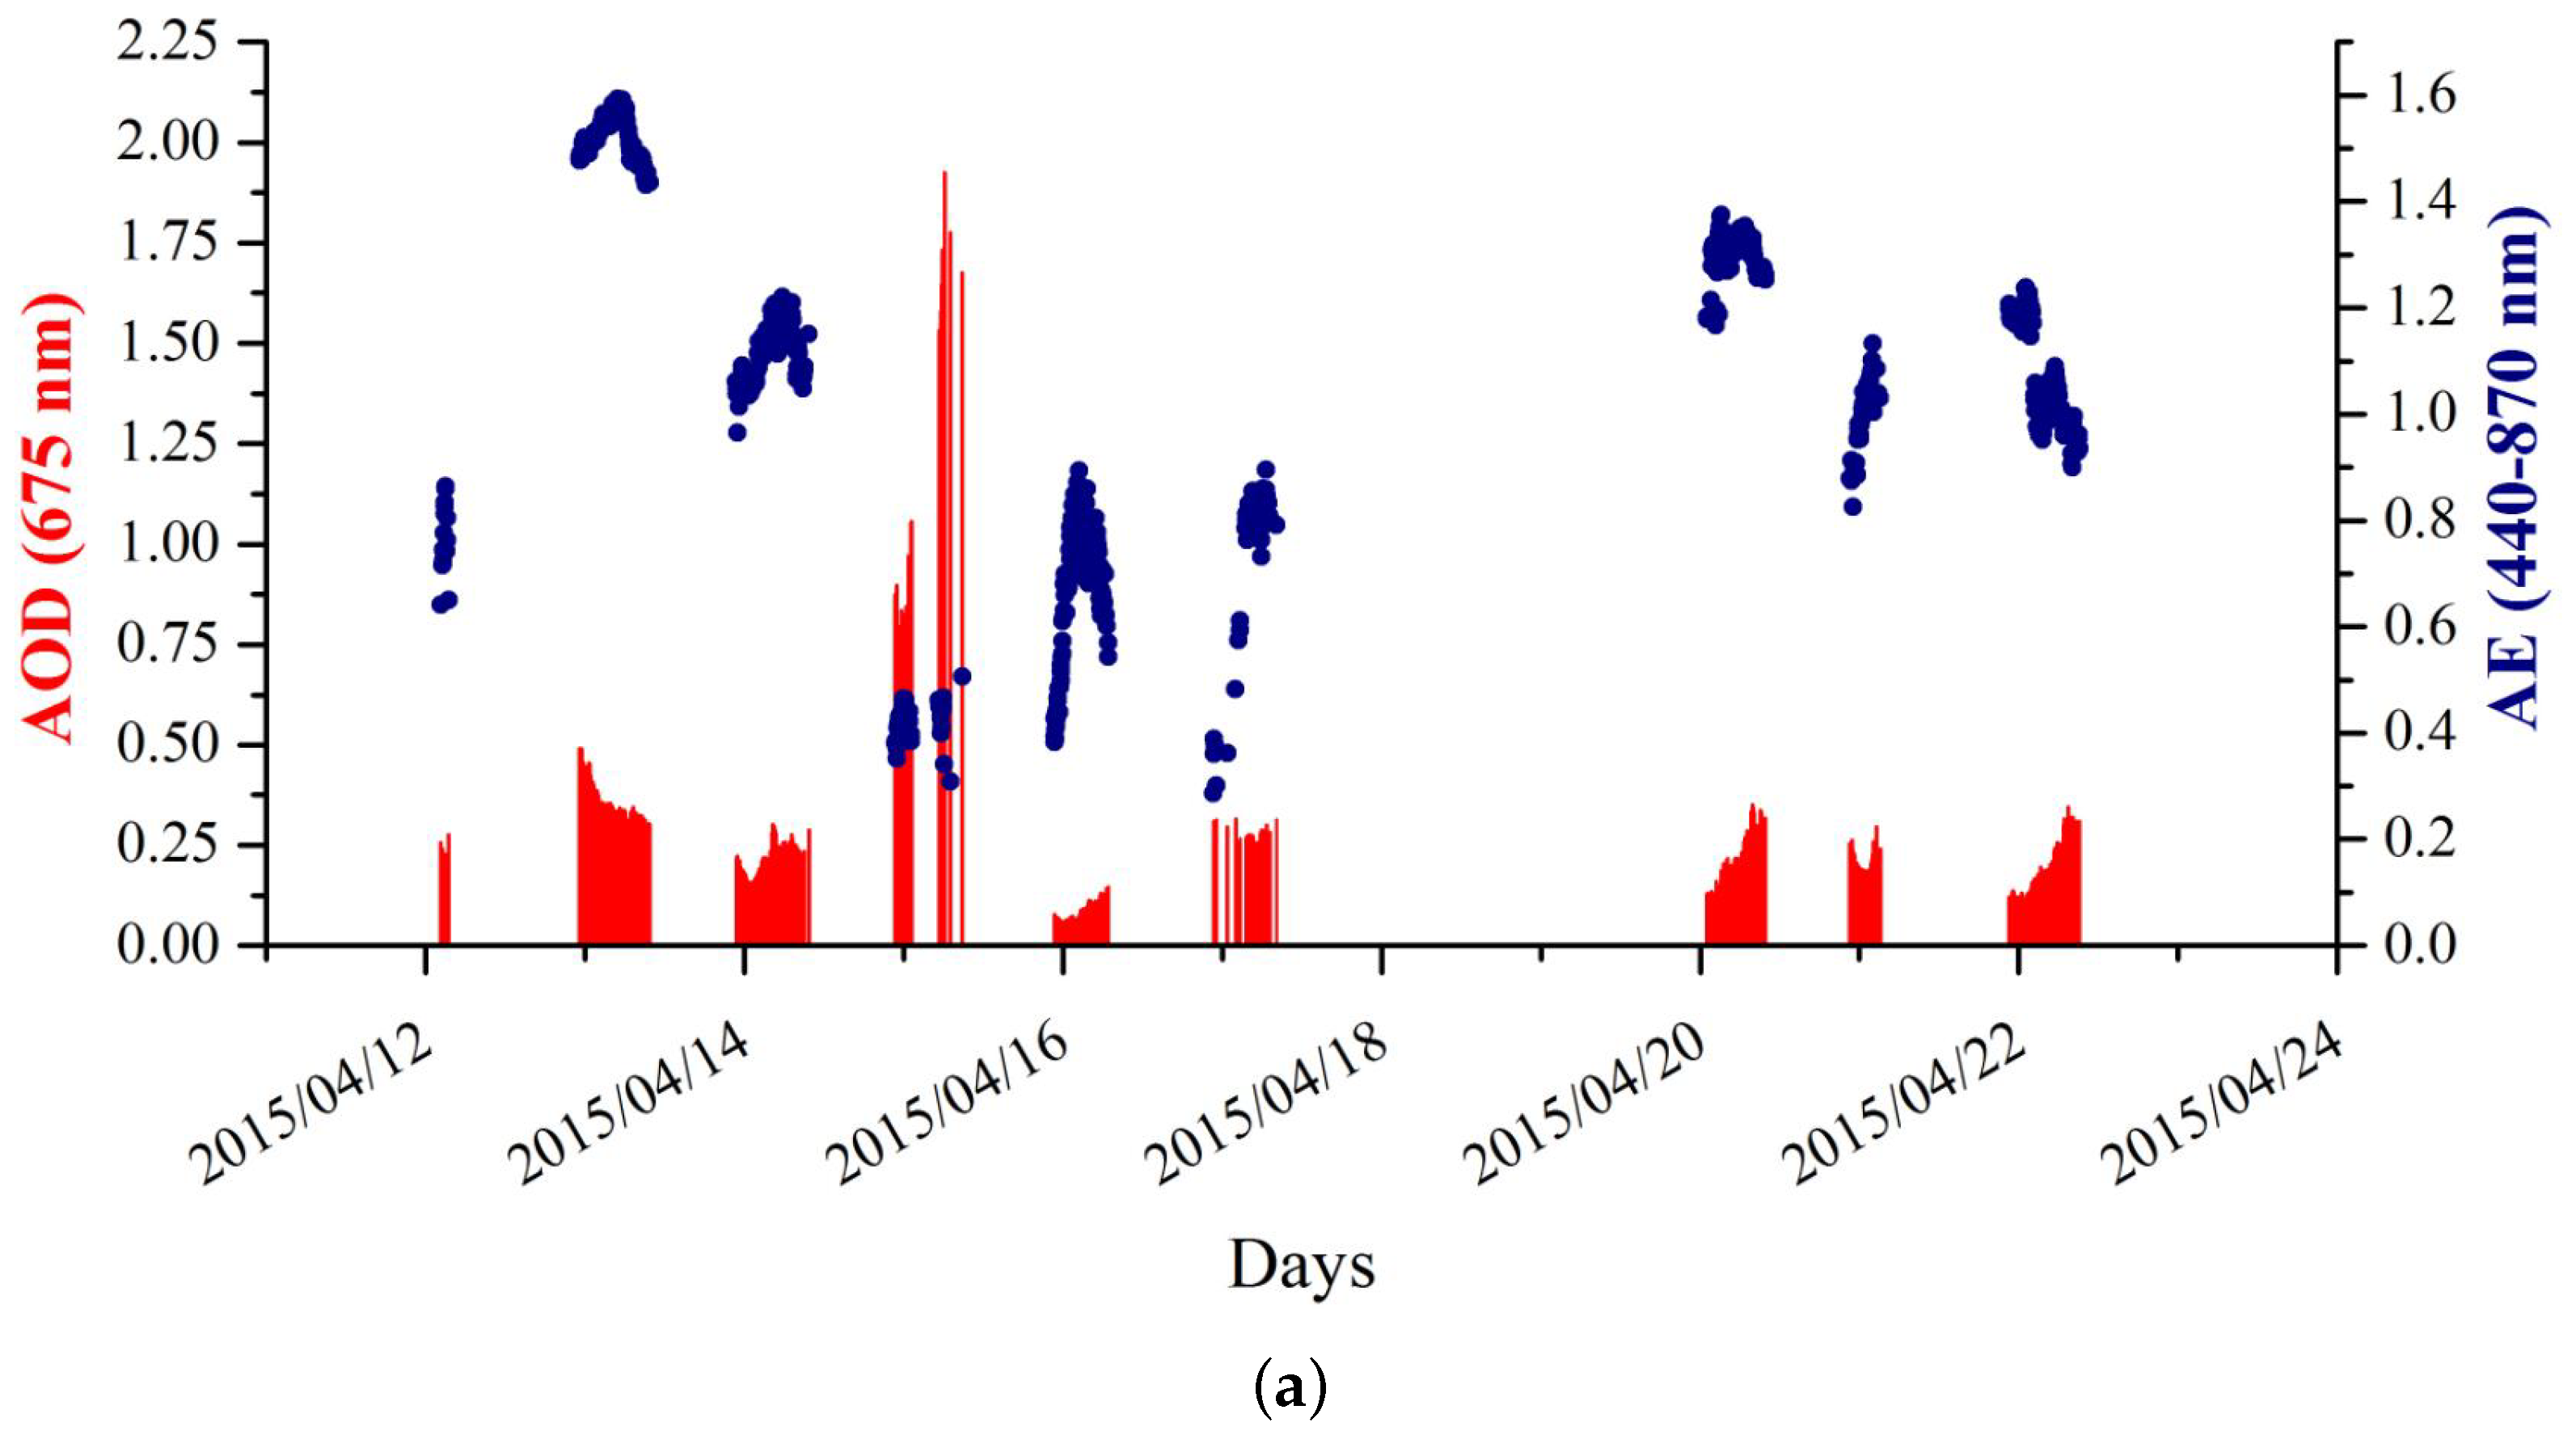
The diurnal and daily variations of AOD at the wavelength 675 nm and AE (440–870 nm) are shown in Figure 6. Due to the weather and data calibration, data show gaps due to non-availability of data in some intervals. High AOD and low AE are found during outbreaks of dust episodes. The diurnal variations shown in Figure 6a, clearly shows highest AOD (2.15), and the lowest AE (0.31) on 15 April 2015. On arrival of the dust storm, AOD rapidly increased to 1.11, which is very high compared to prior to and after the dust storm, with daily average AOD values (0.09–0.36) (Figure 6b), while the AE shows an opposite trend. The extinction of incoming solar radiation at the visible and near-infrared wavelengths by dust particles could result in the rapid decrease of AE to small and even negative values [66]. The pronounced difference in AE values during dusty and non-dusty days could be clearly seen in Figure 6. The minimum value of AE occurred on the dusty day, with an average value of 0.43, much lower compared to 1.02 observed on non-dusty days; such low values reflect a high ratio of coarse aerosol particles to small aerosol particles. These results are in good agreement with the observations reported by many studies [2,21,67]. Yu et al. [21] found the averaged AOD and AE, respectively, around 1.2 and 0.44 for different dust episodes over Beijing during 2001–2014.
4.1.2. Aerosol Size Distribution (ASD)
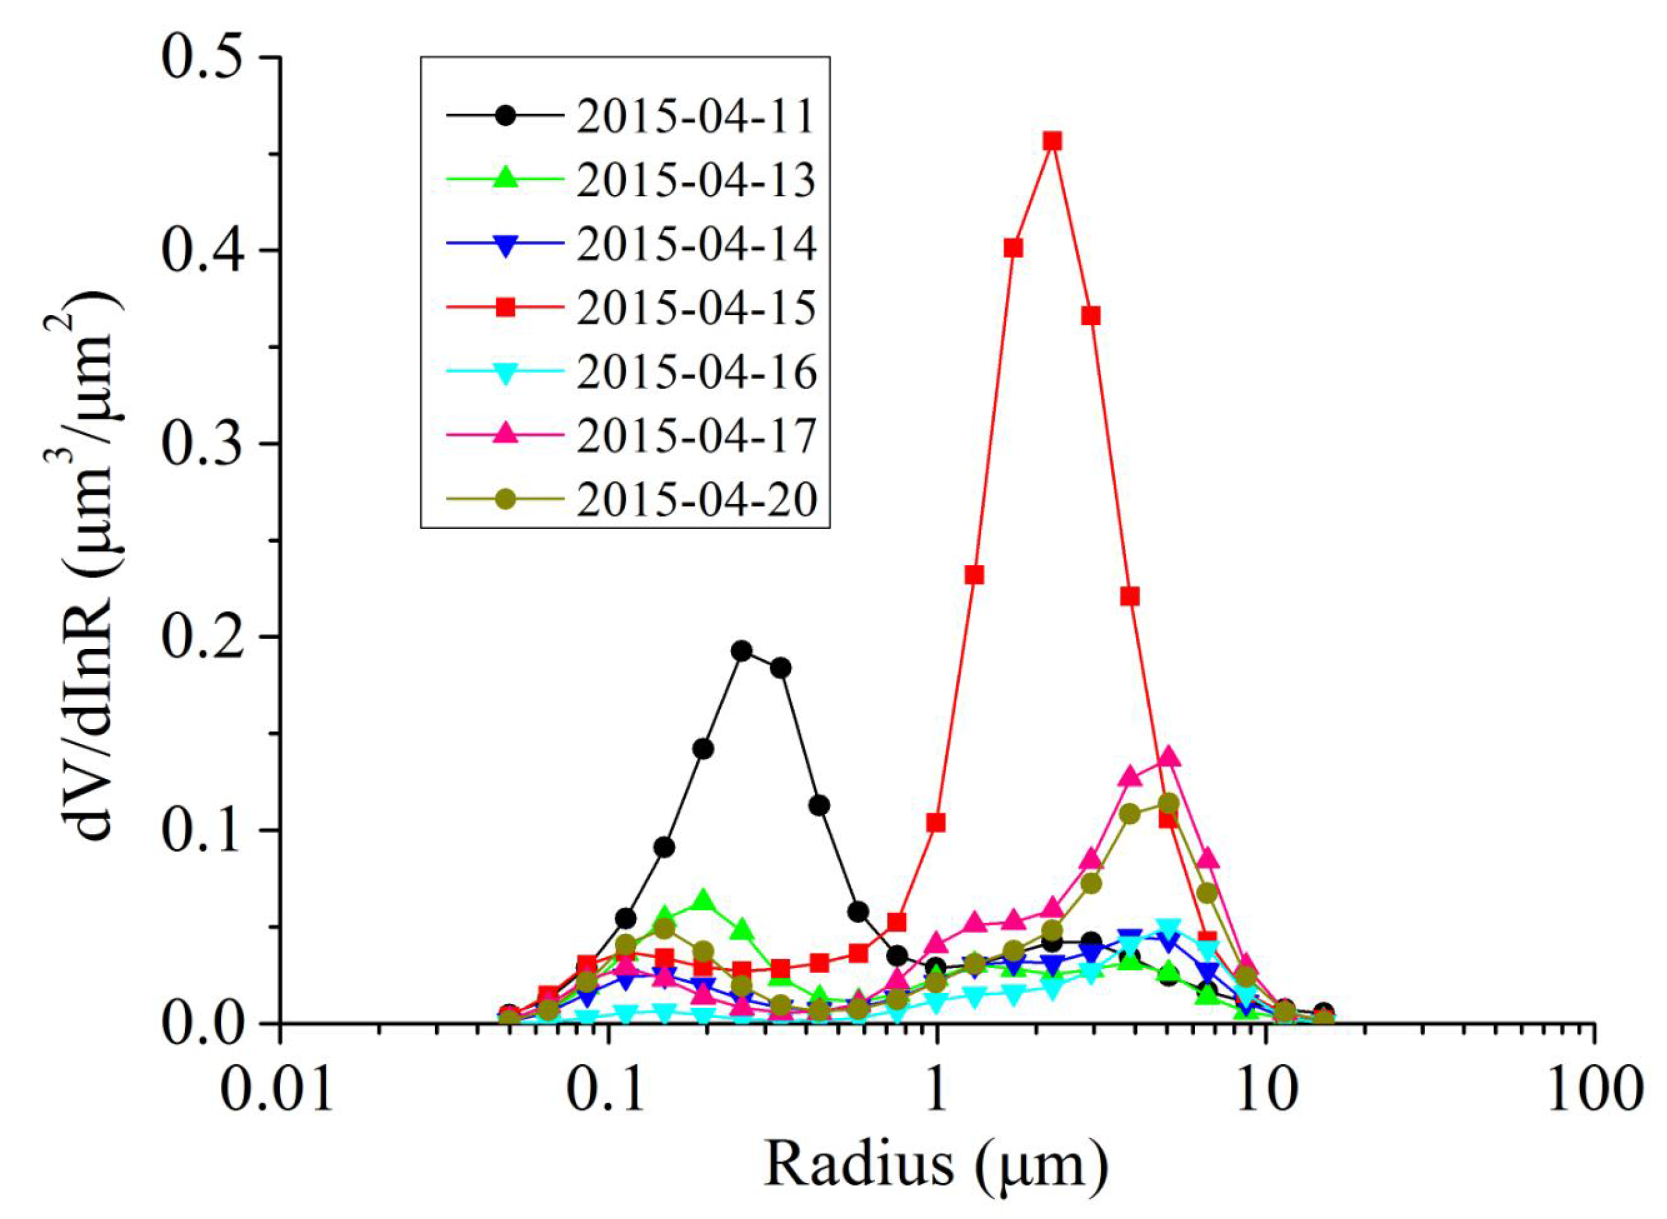
Figure 7 shows daily average variations of ASD in the range 0.05–15 μm during dusty and non-dusty days. The ASD shows bimodal modes with peaks in the range of 0.5–10 μm for coarse and 0.05–0.5 μm for fine modes, respectively. The ASD on 11 April on non-dusty day, shows bimodal mode distribution with a relatively large fraction of fine mode particles. The sources of the fine aerosol particles during non-storm periods are normally the anthropogenic emissions (automobiles and industrial emissions) [17,18]. Whereas, the fine mode was found to shift toward the coarser particles during the outbreak of dust episode. Fractions of coarse mode particles were found to enhance with AOD, due to the dust storm event mainly from the dominance of mineral dust particles. This is consistent with the PM2.5 and PM10 variation during the dust storm event in Beijing (Figure 1), where PM10 shows a pronounced increase. The maximum peak of ASD (dV/dlnR, μm3/μm2) in coarse mode on the dusty day (red line) was observed to be 0.457 at a radius 2.2 μm. However, the maxima peak of ASD prior to and after dust storm was, respectively, 0.193 and 0.137 at the corresponding radius 0.26 and 5.06 μm, on 11 and 17 April 2015. Table 1 provides ASD retrieved from AERONET stations during dusty and non-dusty days.
4.1.3. Single Scattering Albedo (SSA)
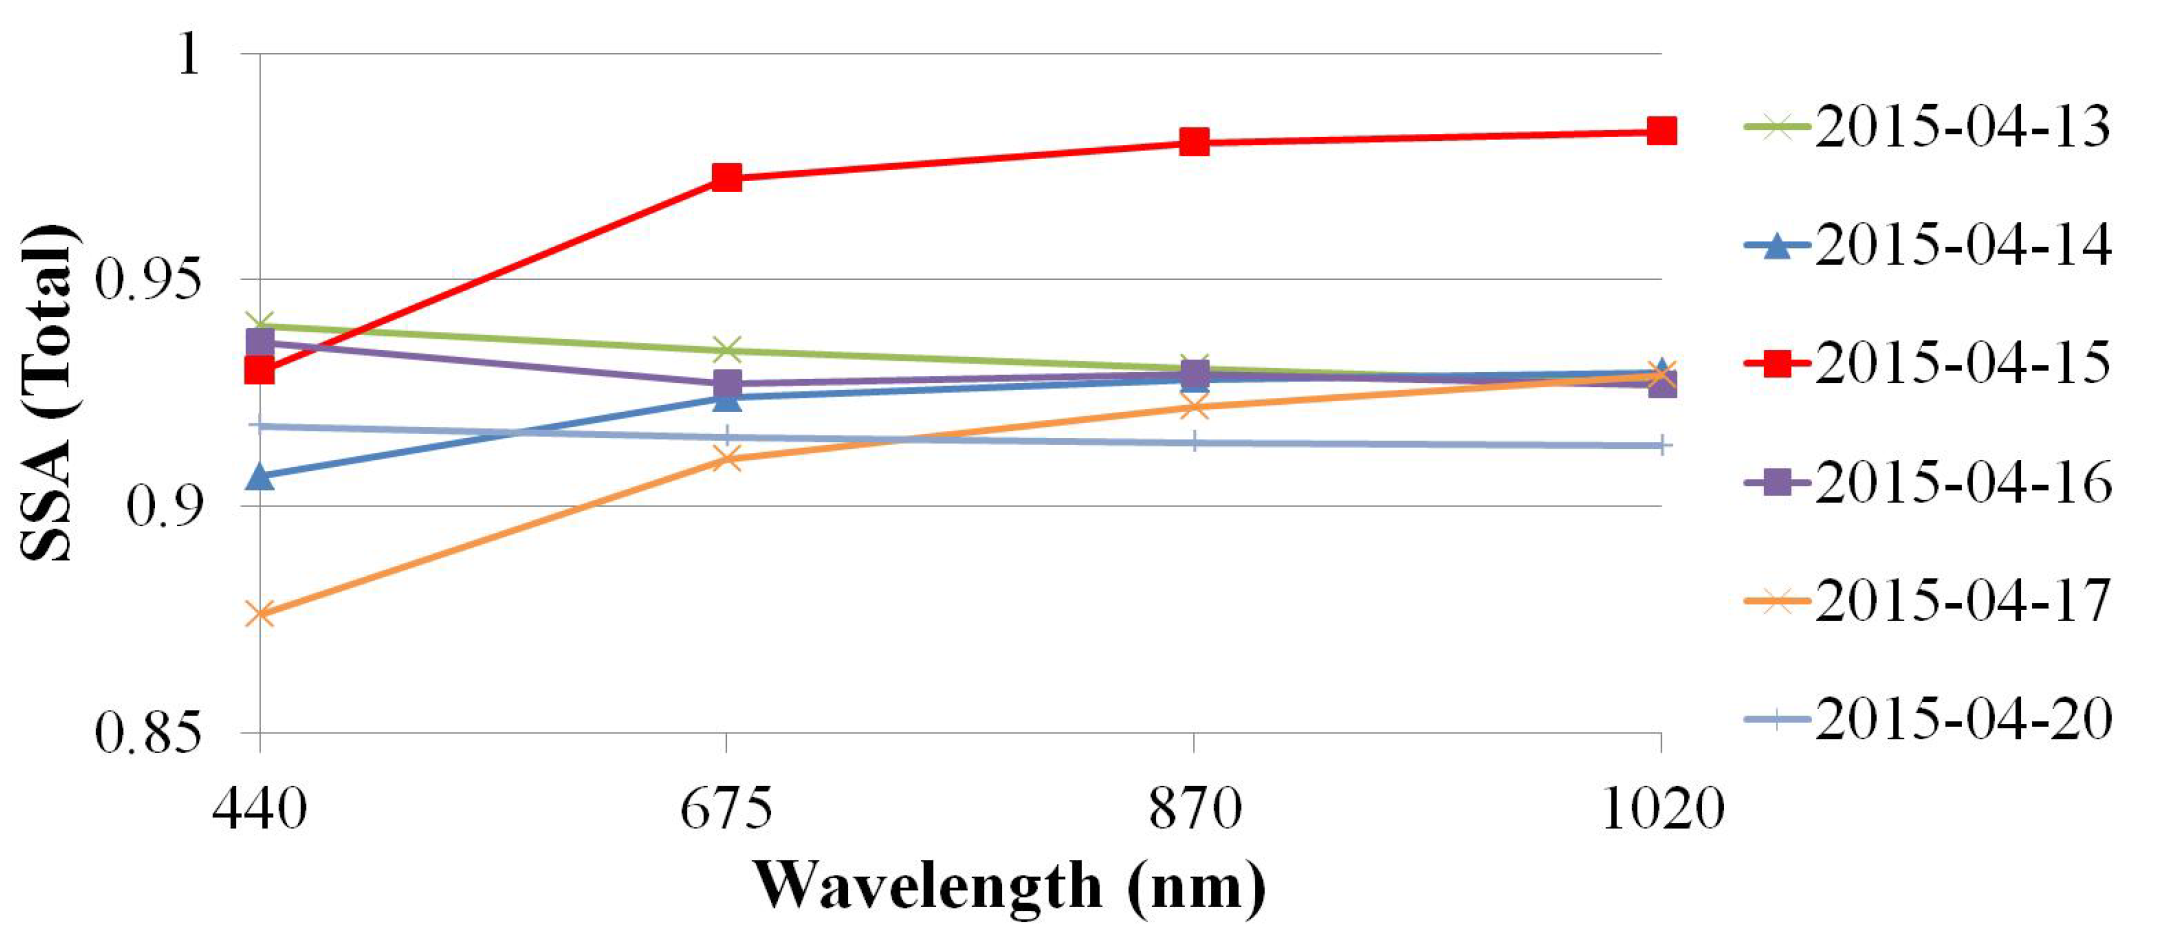
SSA shows a distinct variation with wavelengths for different episodes, providing valuable insight into the scattering and absorption properties of aerosols. Figure 8 shows the daily variation of SSA at four wavelengths (440, 675, 870, and 1020 nm) during a dust storm event. Table 2 summarizes the SSA values during dust storm event. An increasing trend in SSA with higher wavelength was observed during the storm events (red line in Figure 8), showing that aerosol particles are predominantly scattering in nature, instead of absorbing particles [68]. In contrast, as the strong aerosol mixing for dust with anthropogenic aerosol derived from biomass burning and fossil fuel combustion, the SSA was enhanced with lower wavelength prior to and after the dust storm on 13 and 20 April 2015, that shows as a difference on dusty and non-dusty days. In addition, the total model SSA clearly shows enhancement during dusty days compared with non-dusty days. On 15 April 2015, SSA varies in the range 0.930 to 0.983 at the four wavelengths, with an average value of 0.966, much larger than those of 0.933, 0.922, 0.930, 0.909, and 0.915, respectively, on 13, 14, 16, 17, and 20 April. The increase in SSA, and decrease in AE and corresponding increase in AOD, support the presence of coarser scattering particles (mineral dust). For the higher wavelength (), SSA was found to be >0.97 during the dusty days, greater than the average of SSA during the dust storm events (0.89 on on 28 April 2005, 0.96 on 17 April 2006, and 0.92 on 20 March 2010) in an earlier study [2], and systematically lower values during non-dusty days reflect the presence of scattering and larger size particles.
4.1.4. Refractive Index (RI)
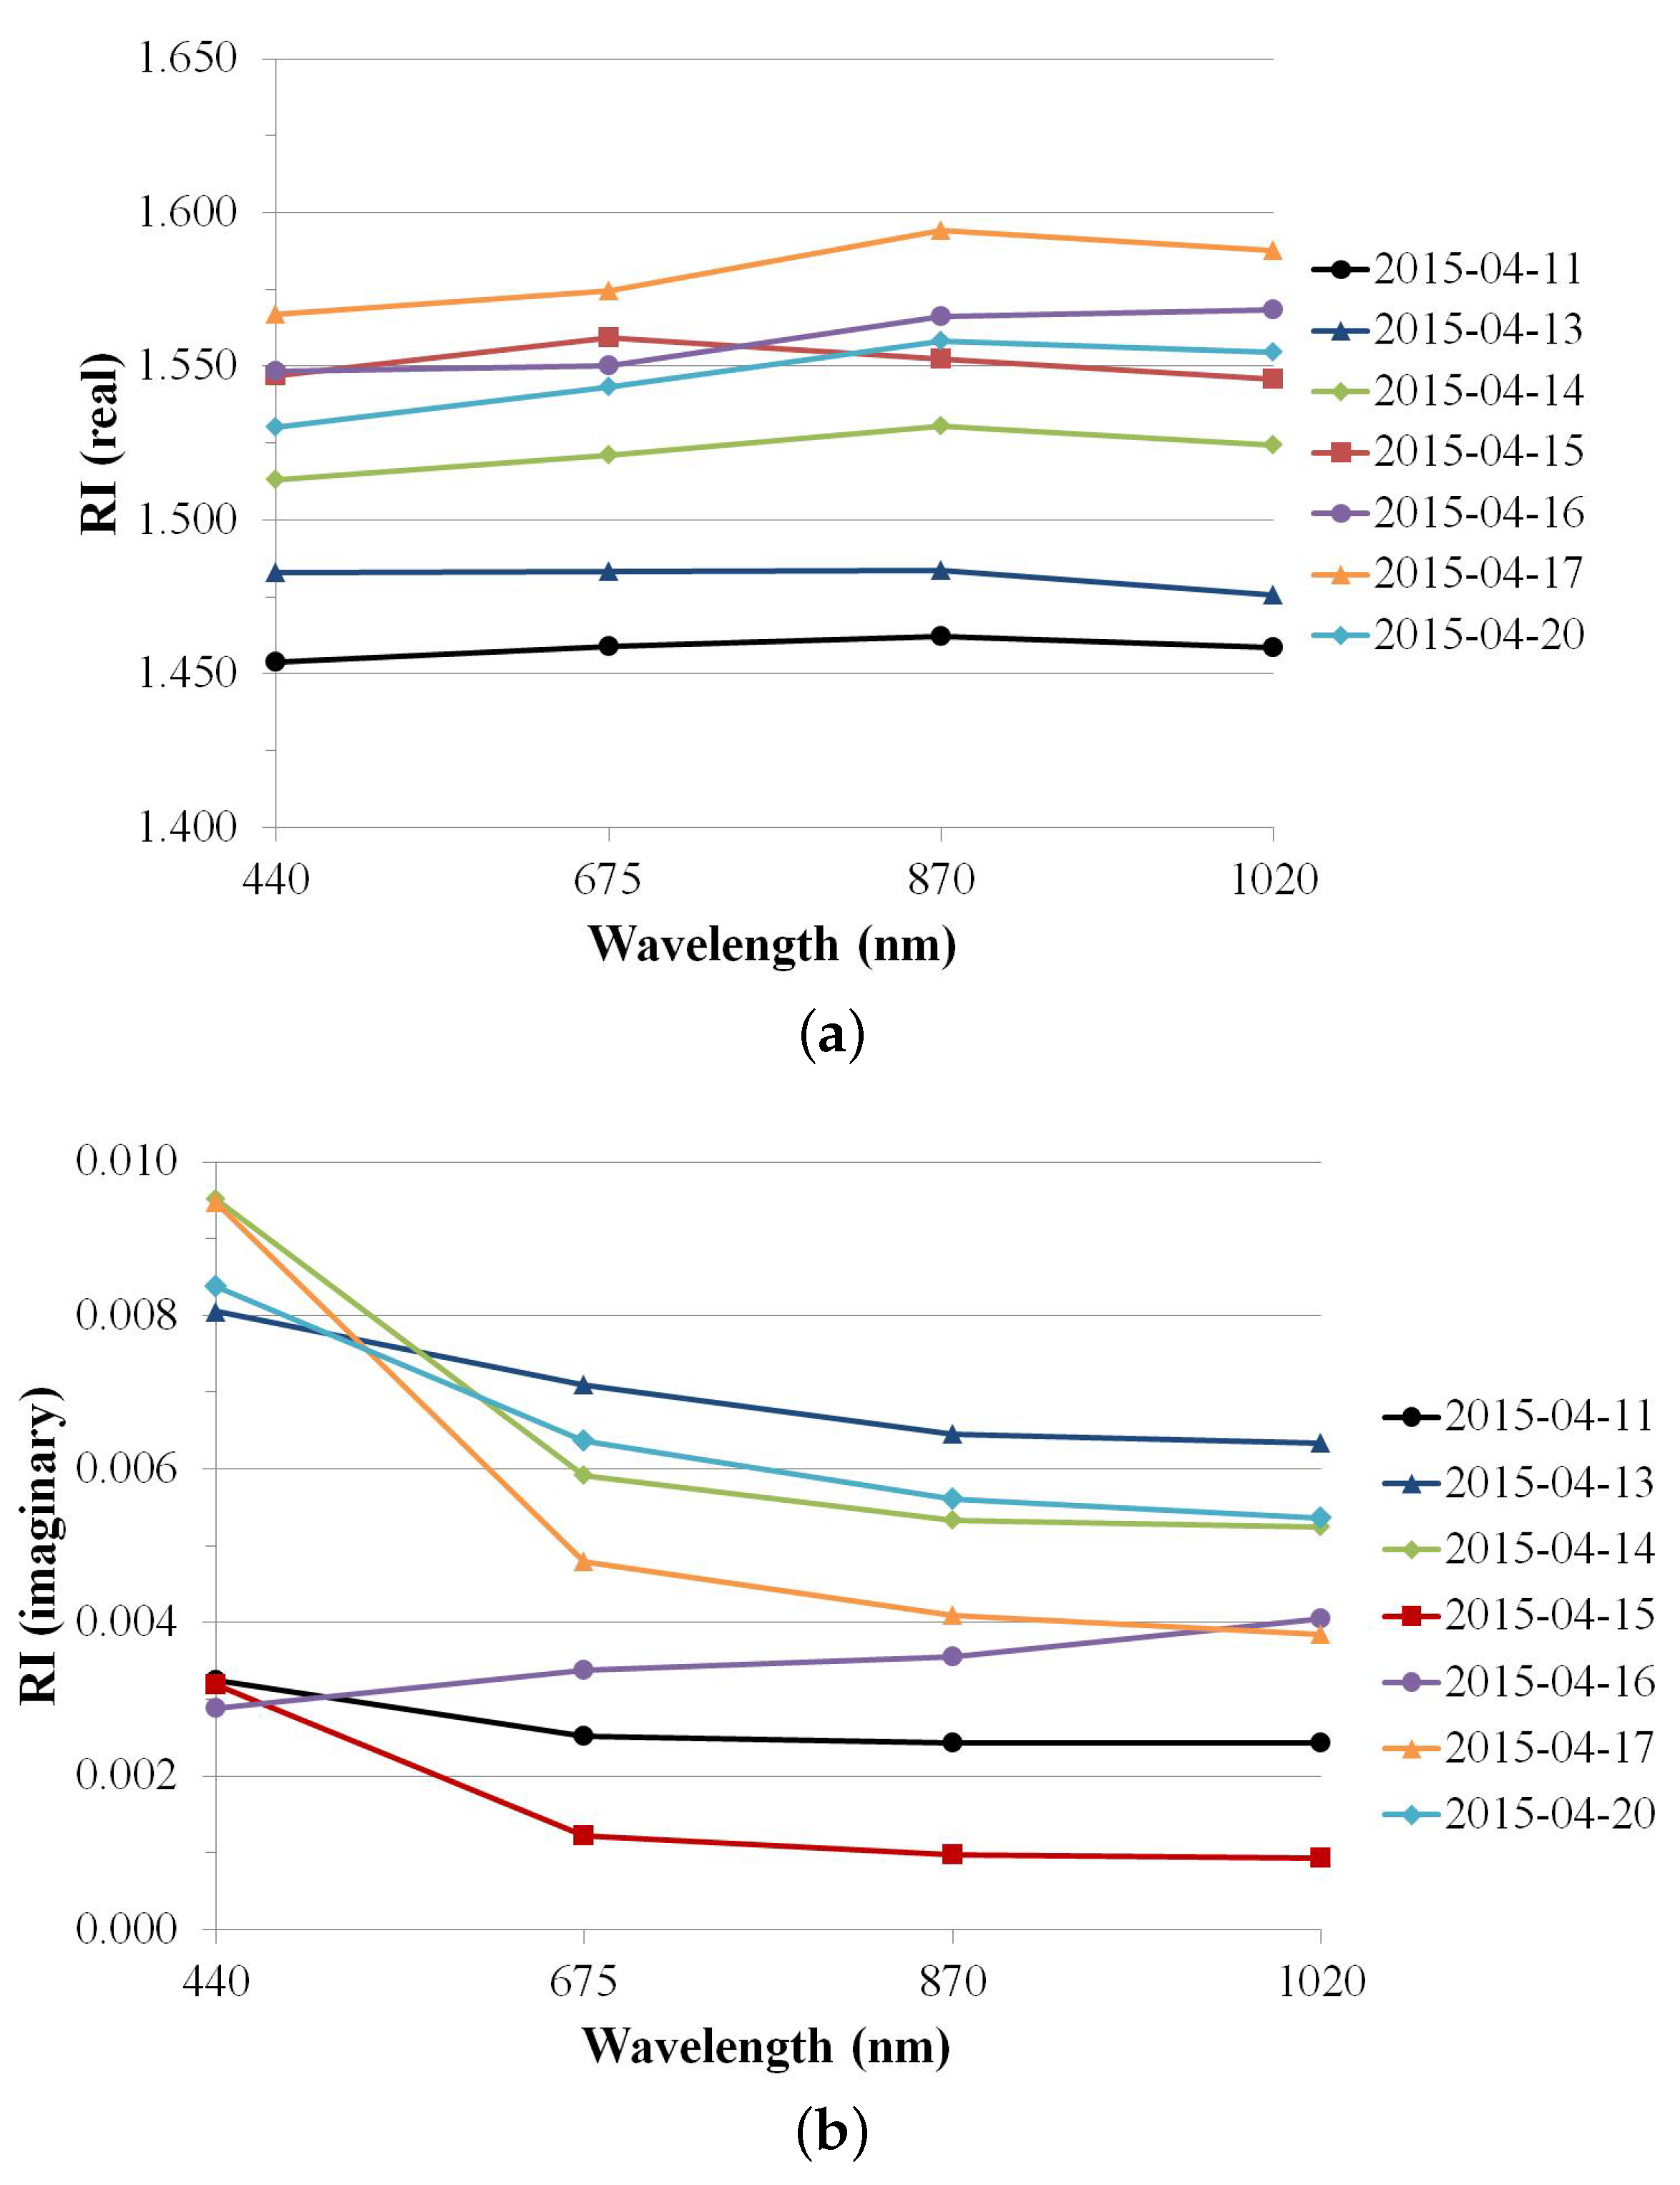
The real and imaginary parts of the RI are dependent on the chemical composition of aerosols. In the visible region, mineral dust typically shows values 1.53 ± 0.05 and less than 0.006 [69]. Higher represents the absorbing type of aerosols, and higher represents scattering type of aerosols [70]. Figure 9 shows daily variations of real and imaginary parts of RI during dust storm event. Table 3 clearly shows the distinction of RI during the dust and non-dusty days. The real shows high values in the range 1.5–1.6, and the imaginary part decreases rapidly for the dusty day compared with non-dusty days. The was >0.004 for non-dusty days. With the occurrence of dust storm event, the gradually decreased to less than 0.004, indicating the dominance of mineral dust aerosols attributed to the decrease in fraction of anthropogenic aerosols. In addition, during the dusty day, the value at 440 nm wavelength was 2–4 times larger compared to those at higher wavelength, which is a characteristic of mineral dust compared to absorbing aerosols, and is in good agreement with the pattern in an earlier study [27,65,71]. Prasad et al. [27] found values are less than 0.005 during dust events over the Indo-Gangetic (IG) plains, and decrease at higher wavelengths. On 11 June 2005, over the IG plains, due to dust storm events, decrease from 0.003 at 440 nm wavelength, to 0.001 at 1020 nm wavelength. The pronounced changes in and characterize the dominance of mineral dust particles due to relatively low fraction of anthropogenic aerosols during the dusty day, which is also reflected by the distinct pattern of SSA (Figure 8).
4.2. Characteristics of Meteorological Parameters
4.2.1. CO Volume Mixing Ratio (COVMR)
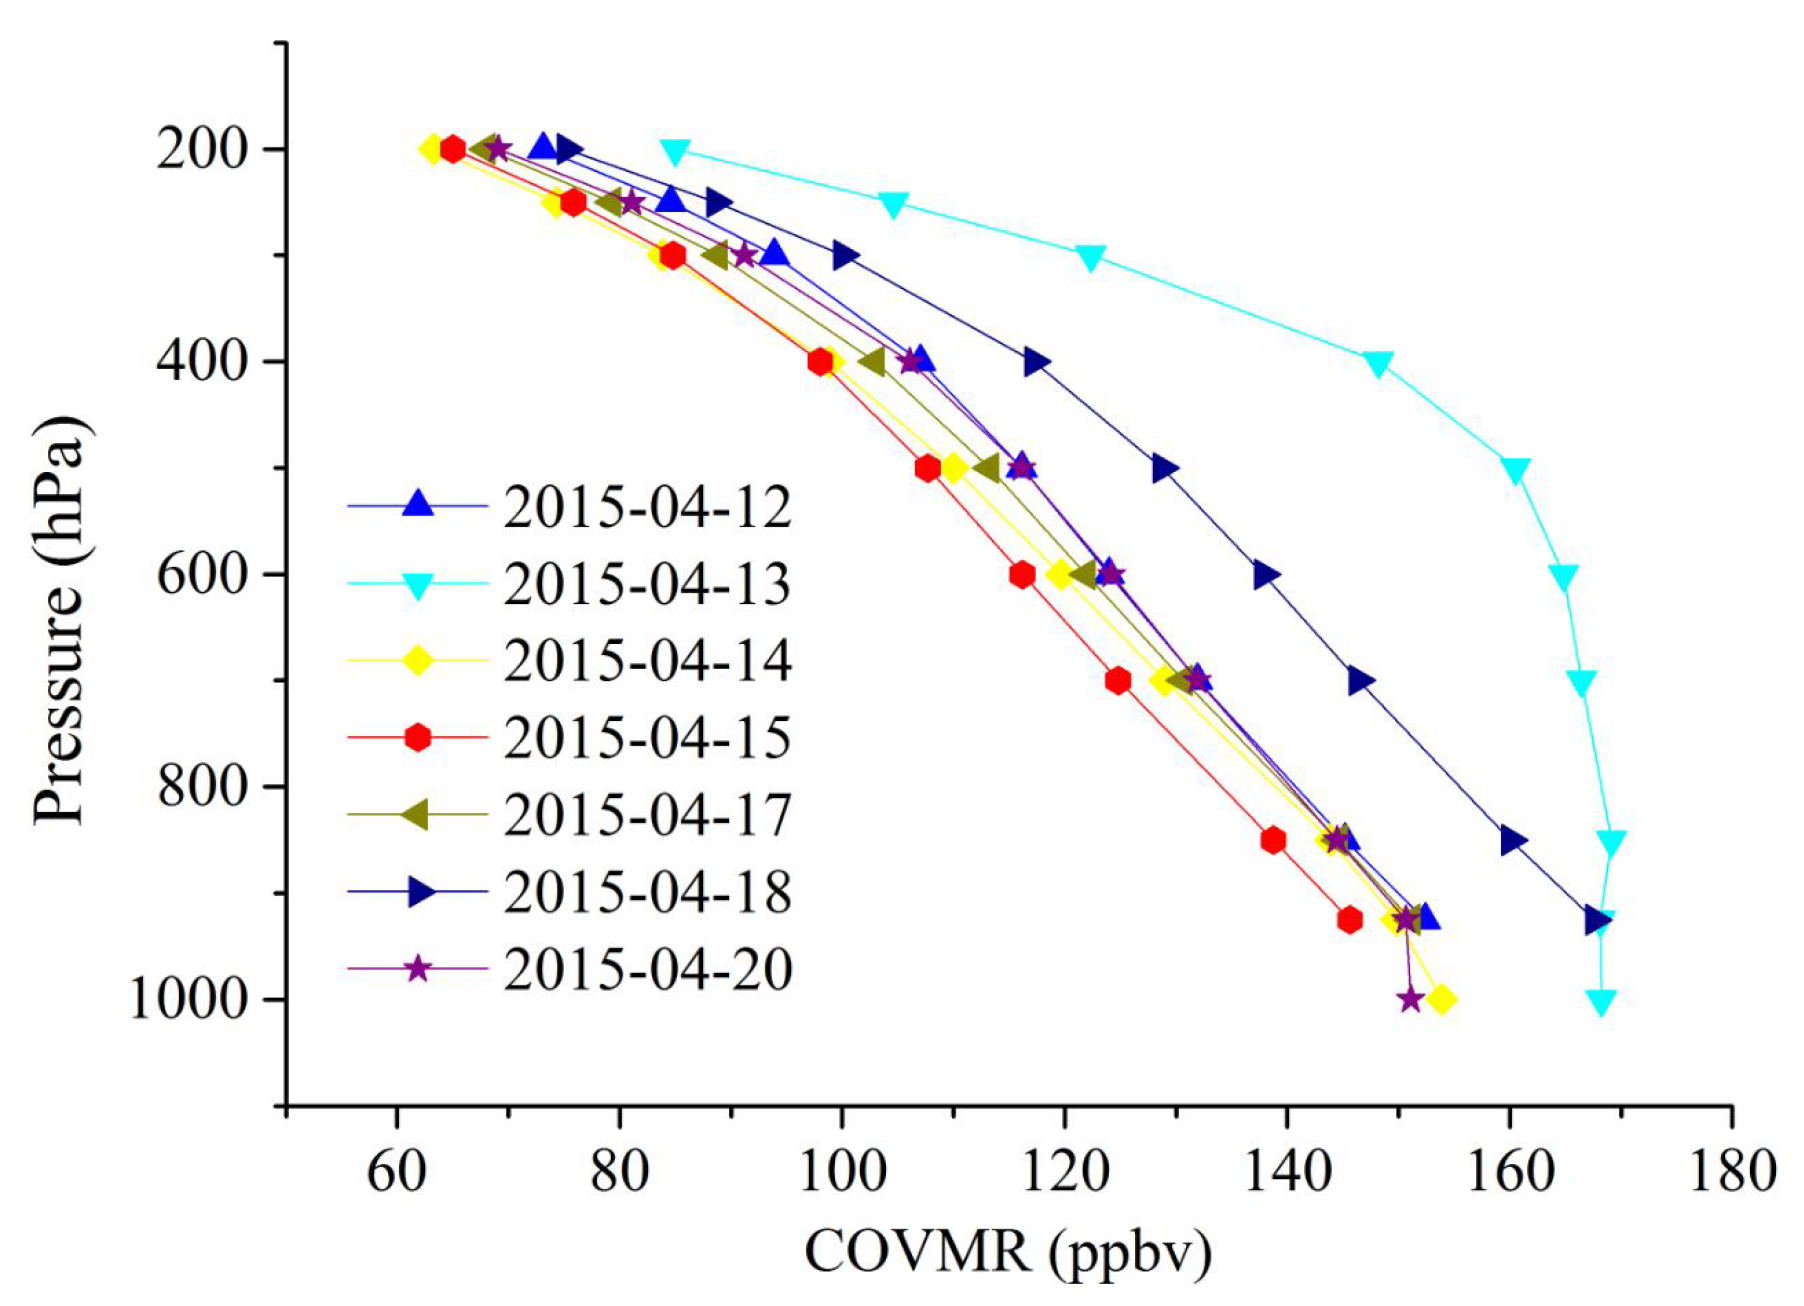
The vertical profiles of COVMR (Figure 10) show an increase in COVMR values with the pressure levels. The maximum value of COVMR (146 ppbv) was observed at the pressure level, 925 hPa, and no data was available at the surface level (1000 hPa) on the dusty day. Due to strong winds during the dust storm event, favorable for the diffusion of trace gases, including CO and O3, the COVMR was observed to be lower at higher pressure levels (>400 hPa), compared to the days prior to and after the dust event. Prior to the dust storm, near-surface (925 hPa) COVMR was found to be over 150 ppbv, with the maximum value of 168 ppbv on 13 April 2015. After the dust storm, the COVMR value was found to be over 151 ppbv, with the maximum value of 168 ppbv on 18 April, while with onset of dust storm COVMR decreased to 146 ppbv. Dust storms are an energetic phenomenon, resulting in strong vertical motion and upward convective activities in their surrounding area. The characteristic of COVMR and its vertical distribution (low values at lower troposphere) is found to be consistent with rapid convective upward movements, which are typical for dust storm events, as reported in early studies [36,72].
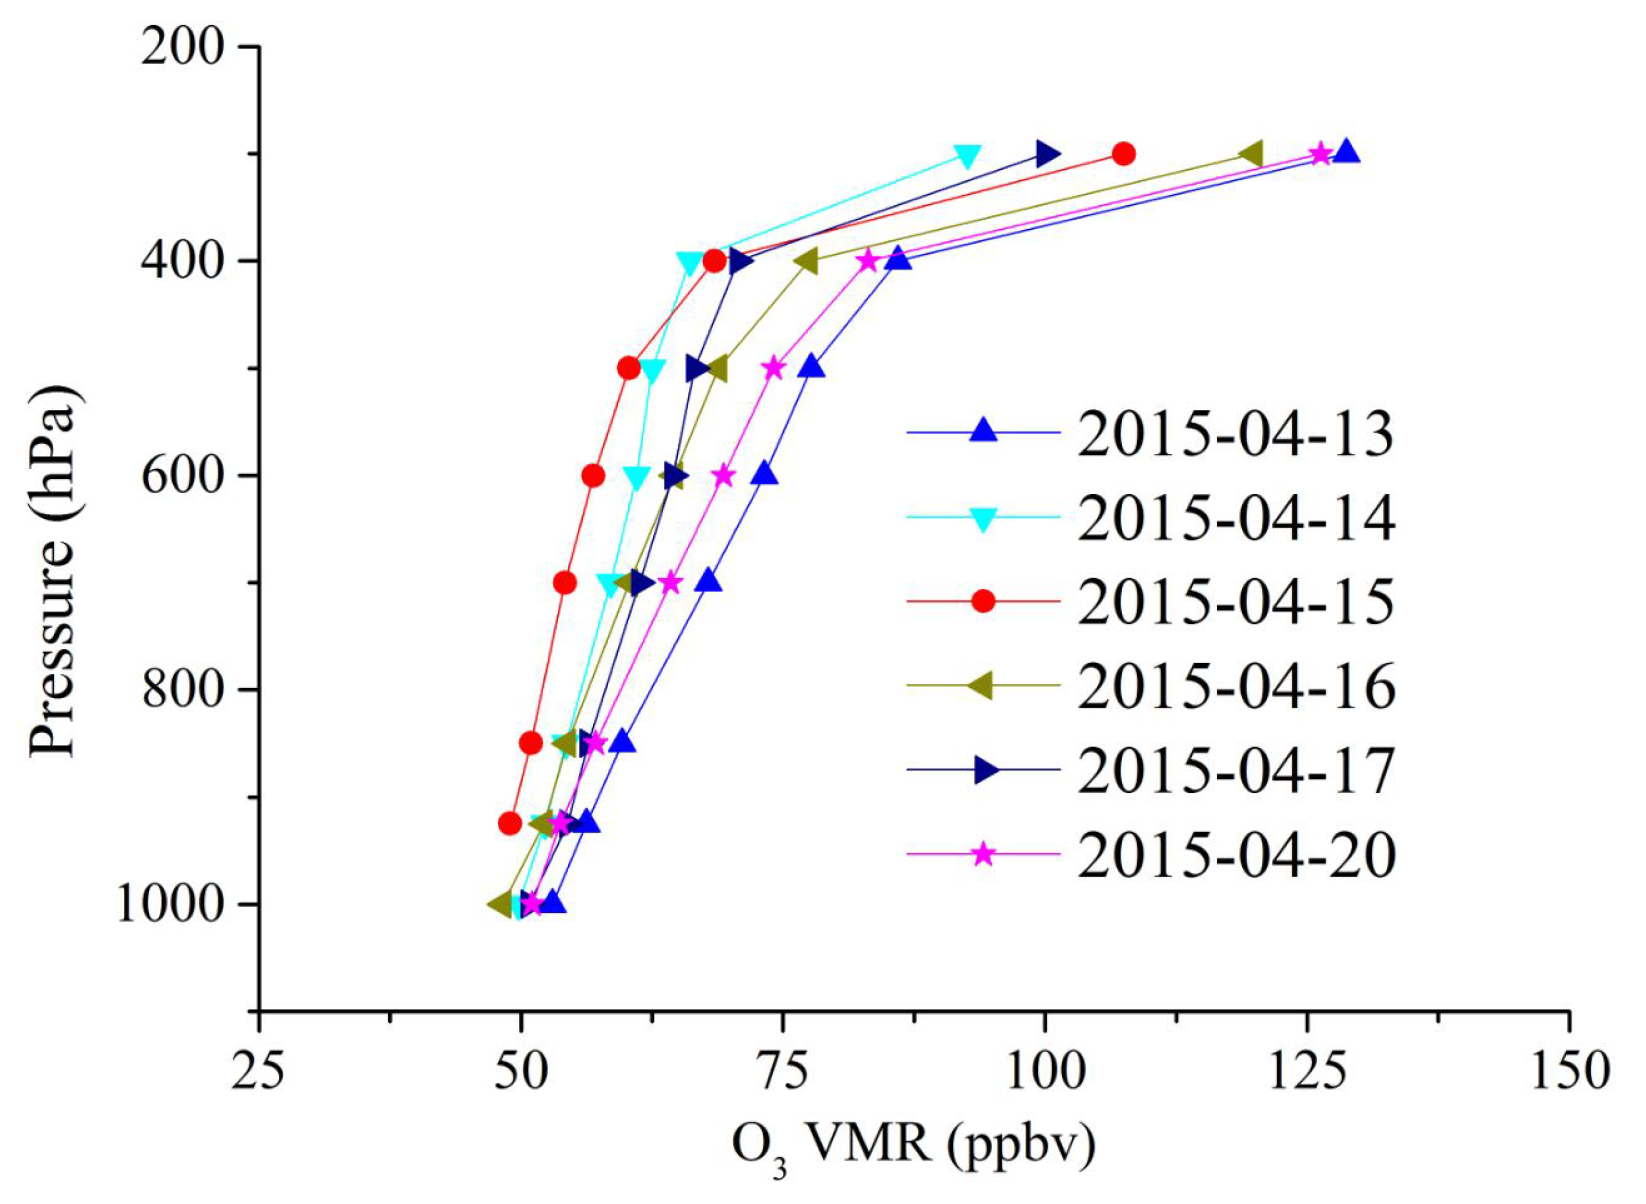
4.2.2. O3 Volume Mixing Ratio (O3VMR)
The vertical profiles of O3VMR (Figure 11) show a decline with the increasing air pressure. During the dusty day, the maximum O3VMR was found to be 108 ppbv at 300 hPa pressure level, while the minimum was 49 ppbv at 925 hPa, and no data was available at the surface level (1000 hPa). The dust may be present near the surface; as a result, the signal is obscured, and the information is only available up the top of the dust layer. With the onset of the dust storm event, the O3VMR was obviously lower at the pressure levels 500–925 hPa, which may be due to the strong winds. The daily average of O3VMR at near surface (925 hPa) during the dusty day was found to be 49 ppbv, lower than values 52–56 ppbv observed during the non-dusty periods.
Strong winds and low temperatures have been considered to be the main factors that result in O3VMR declines during dust storm events. Low temperatures weaken the photochemical reaction, showing less O3 production. The adsorption of O3 by dust aerosols may also be responsible for the decrease in O3 concentrations [73]. In addition, dust storm events could reduce the concentration of O3 by means of the reaction (1), and reduce the concentration of NOx, which is the O3 precursor, through heterogeneous reactions [74].
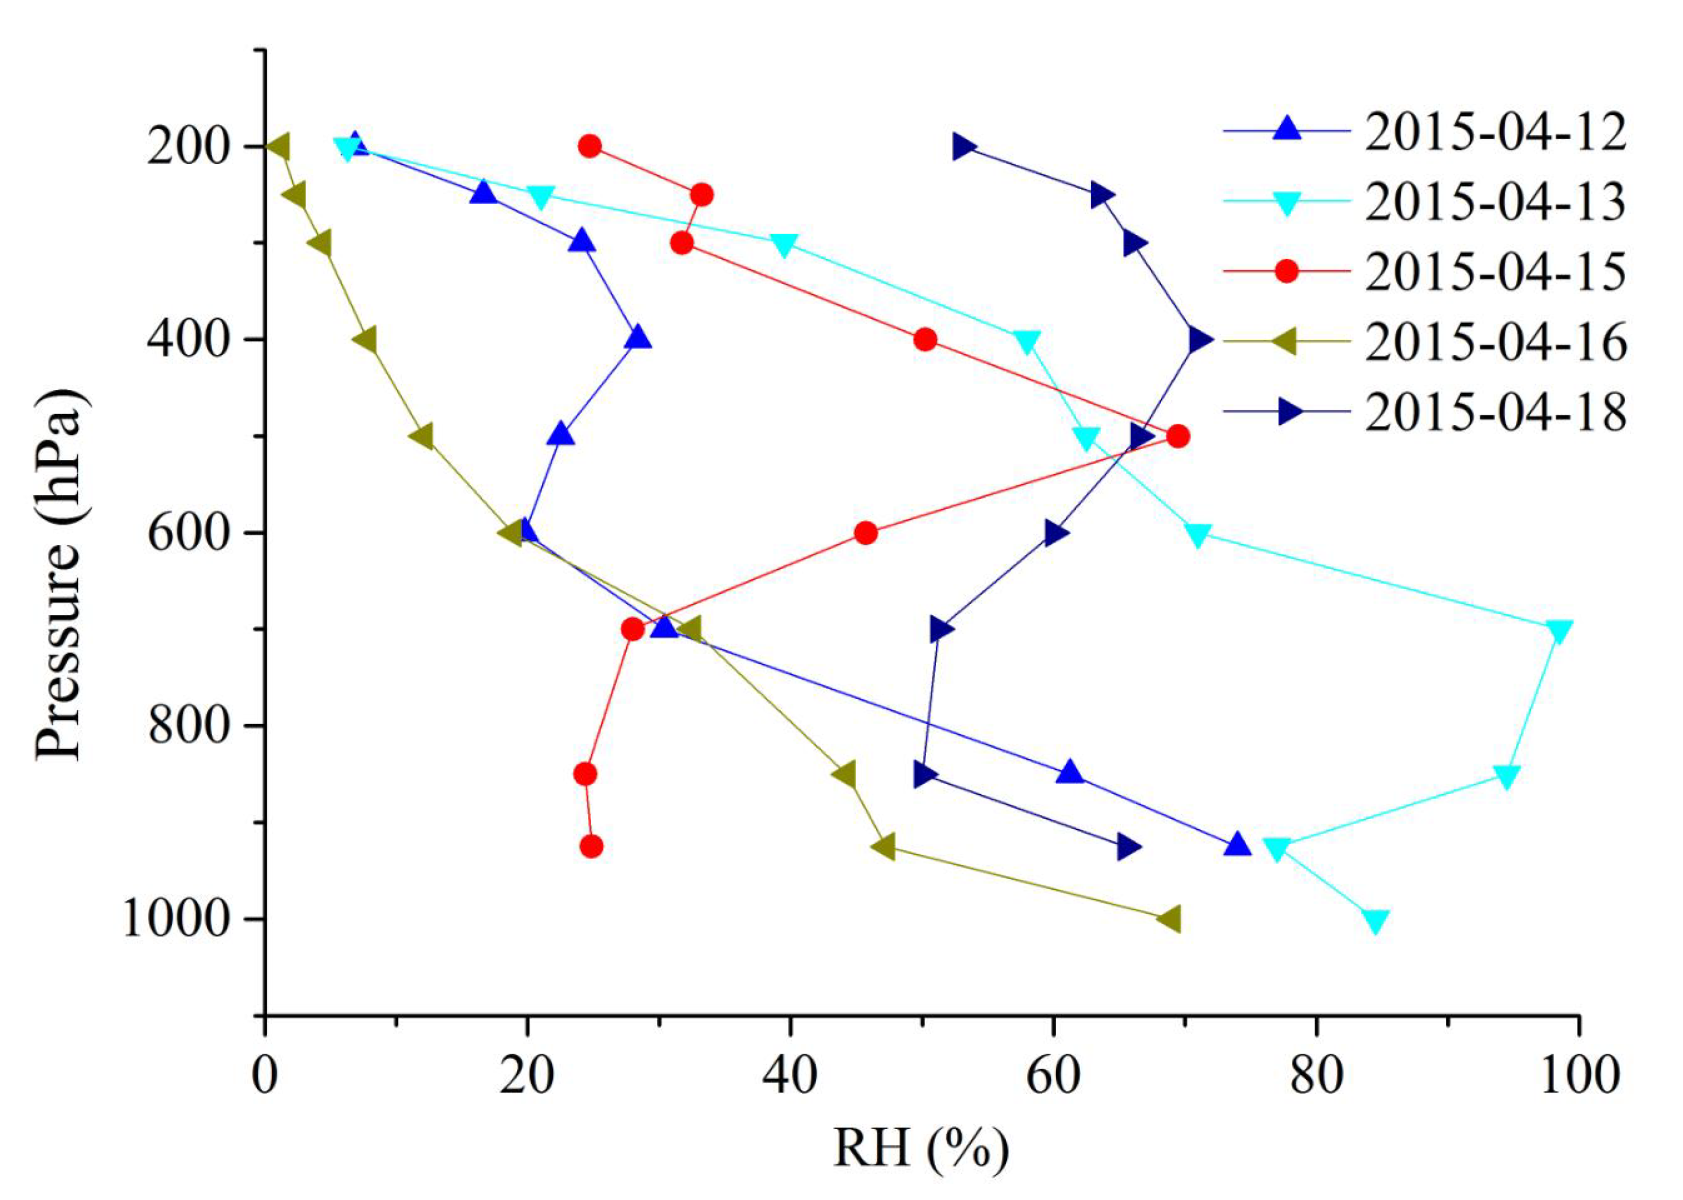
4.2.3. Relative Humidity (RH)
Figure 12 shows vertical profiles of RH, and a decrease in the RH with the increasing air pressure was observed during the dusty day at pressure levels 700–925 hPa. With the onset of the dust storm event, the RH was obviously lower (0.25) at the surface level (925 hPa) during the dusty day, compared to 0.47 to 0.77 observed prior to and after the dust storm. This represents lowering of moisture content due to onset of the dust storm, and likely could be due to arrival of dust aerosol air mass from deserts in Inner Mongolia and Mongolia, and dust aerosol contains more hygroscopic chemical components during the dust storm [75].
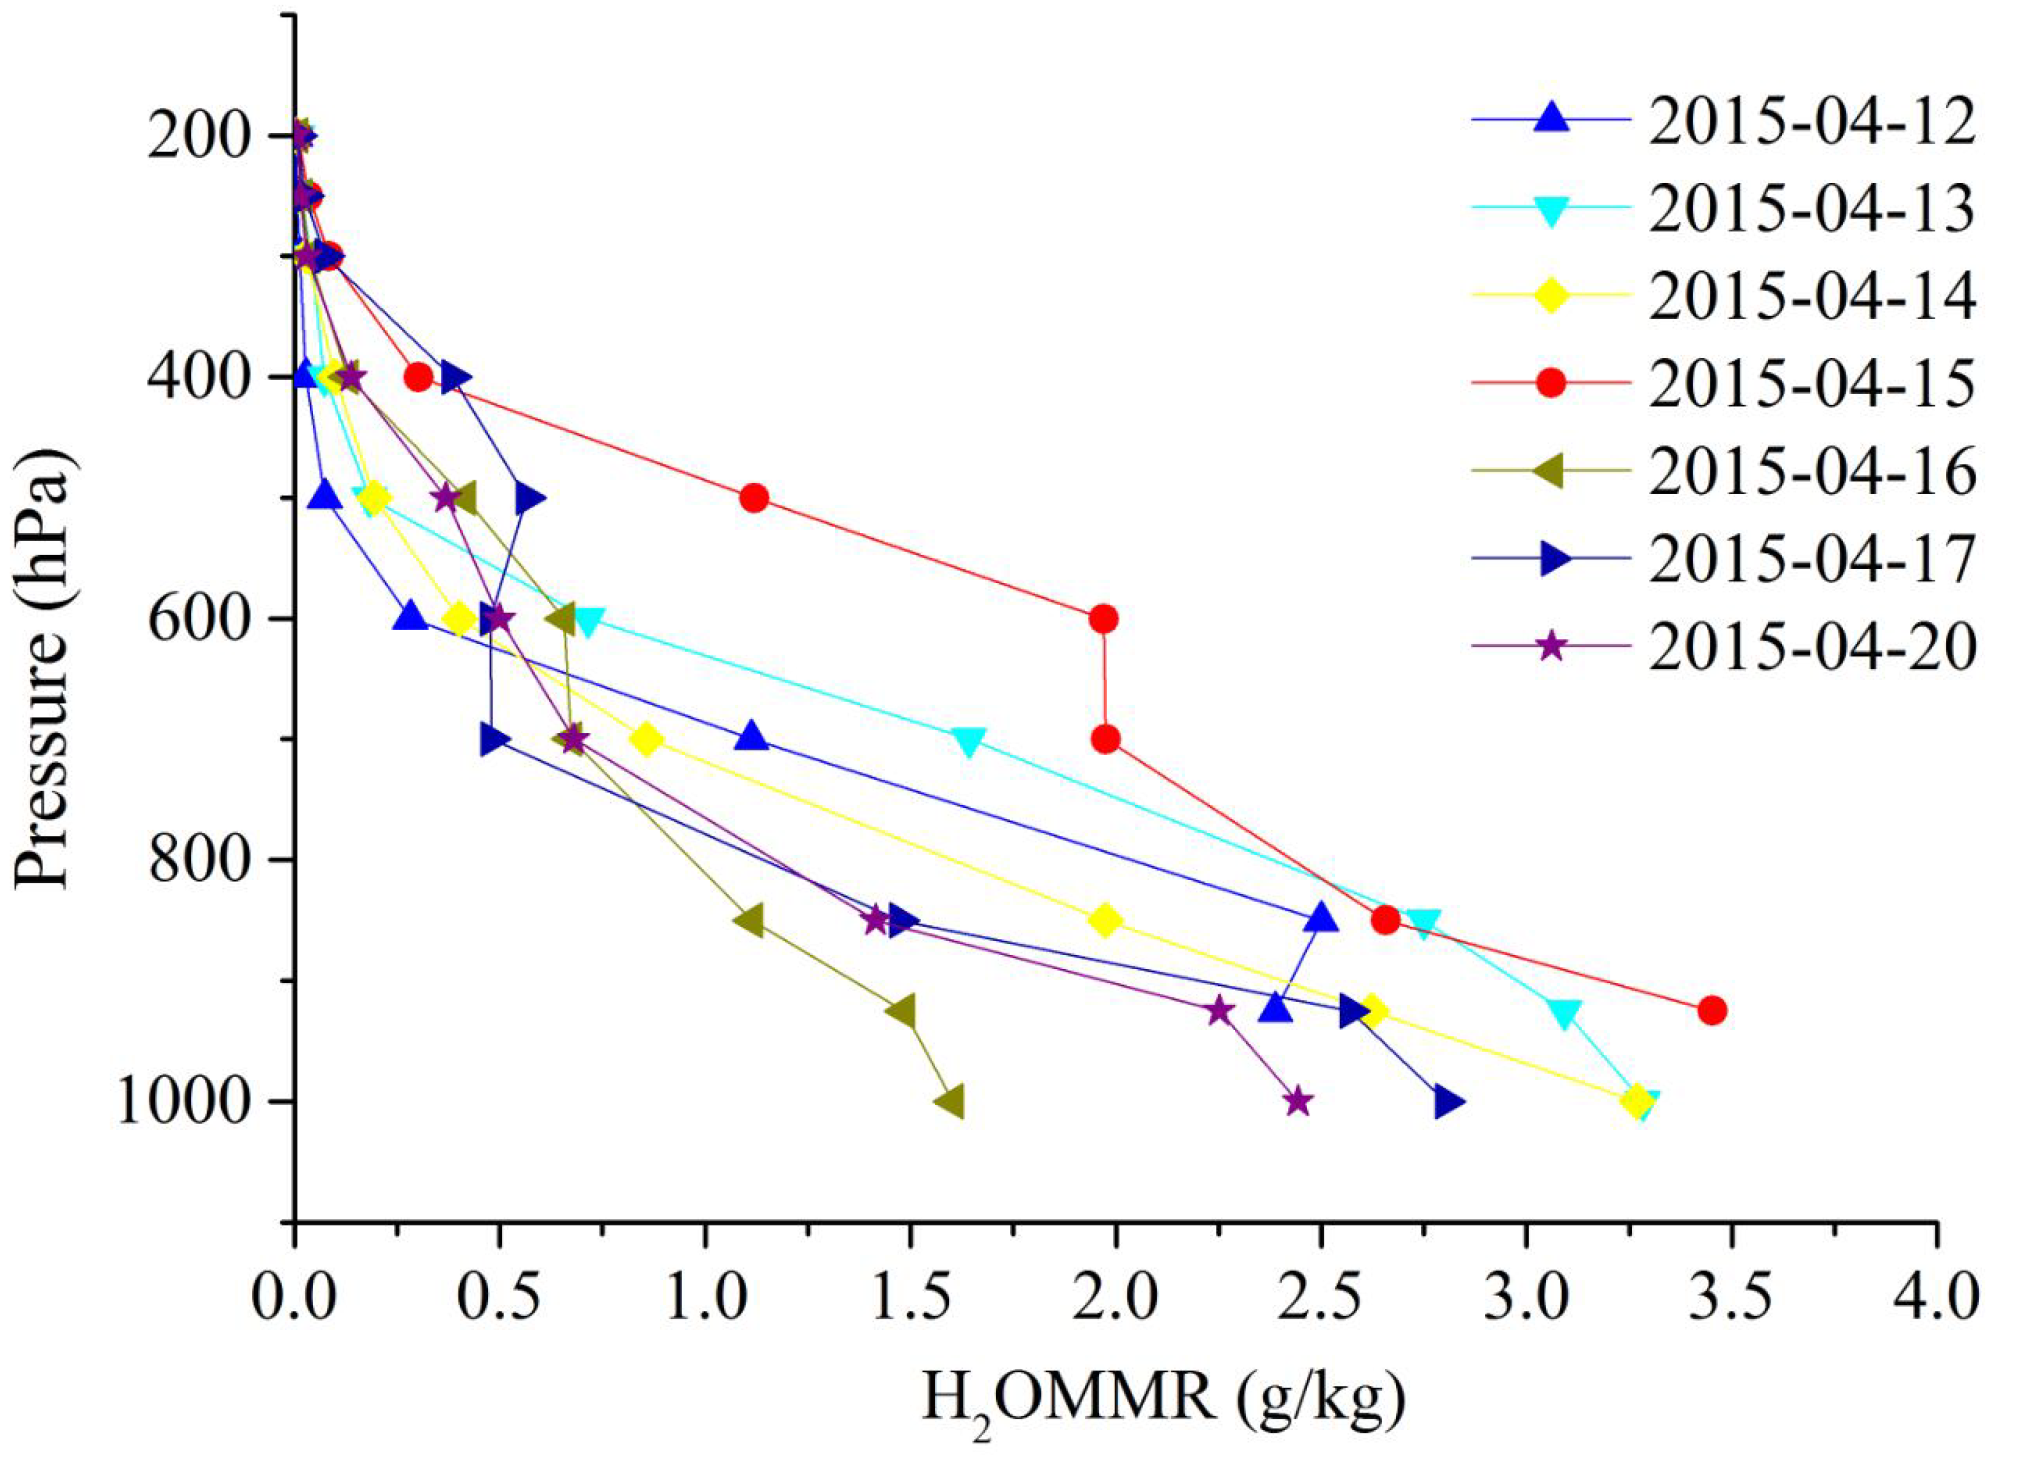
4.2.4. H2O Mass Mixing Ratio (H2OMMR)
The vertical profiles of H2OMMR during dust storm event are shown in Figure 13. Presence of dust aerosols play an important role in radiative heating at short wavelengths, and cooling at long wavelengths, which in turn, influence the thermodynamics and temperature profile in the atmosphere [76]. The change of temperature profile will cause the change of water vapor profile in the atmosphere. The H2OMMR increased during the dust episode at higher atmospheric pressure. An enhancement in the H2OMMR was observed during the dusty day at pressure levels 500–700 hPa. The H2OMMR reached a value of 1.97 g/kg at 600 hPa pressure level during the dusty day, in contrast a lower value (<0.71 g/kg) at the same pressure level prior to and after the dust storm. The near surface (925 hPa) H2OMMR during the dust storm day was about 3.45 g/kg. On the contrary, the H2OMMR value reached to the maximum value of 3.09 g/kg during the non-dusty days. The possible source of water vapor at corresponding pressure levels could be due to advection of ground surface moisture during the dust storm event.
5. Conclusions
In this paper, we have used ground-based AERONET and satellite data (MODIS, AIRS, and CALIOP), and have analyzed the characteristics of aerosol and meteorological parameters during the dust event (15 April 2015) over Beijing, China, which is the worst dust storm event in the last one decade. With the onset of the dust storm event, PM10 and PM2.5 show pronounced increases greater than 1000 and 280 μg/m3, respectively, in Beijing. The back trajectory clearly shows the source of dust particles over Beijing originated from the Inner Mongolia, the border of China and Mongolia regions. Along the dust track (Ulanqab city and Zhangjiakou city), pronounced changes in aerosol and meteorological parameters were observed. With CALIOP total attenuated backscatter and depolarization ratio, airborne dusts are clearly observed over Mongolia regions.
When the dust storm occurs, AOD rapidly increased, while AE shows an opposite trend with the presence of larger fraction of coarser particles. The results show dominance of coarse particles in bimodal distribution of ASD during the dusty day. The SSA shows higher values (>0.93) with higher wavelengths during the dusty day compared to the days prior to and after the dust event, showing the typical nature of desert dust and scattering particles. During the dust storm episode, the real of the RI shows high values in the range 1.5–1.6, and imaginary is found to decrease (<0.004), showing the dominance of mineral dust aerosols attributed to the relatively low fraction of anthropogenic aerosols. Various aerosol parameters (AOD, AE, ASD, SSA, and RI) during the dust storm event support the presence of desert mineral dust.
During the dusty day, the value of COVMR increases with the increasing air pressure, and it is obviously lower at the pressure levels above 400 hPa, particularly at the surface level, which may be due to strong winds. Meanwhile, the O3VMR values decrease with the increasing air pressure. With the dust storm, the O3VMR is obviously lower at the pressure levels 500–925 hPa. Strong winds and low temperature have been considered to be the main contributors that reduce the O3VMR values during the dust storm event. Specifically, the dust storm event reduces the concentration of NOx, which is the O3 precursor through heterogeneous reactions. The value of H2OMMR shows a prominent increase at the pressure levels 500–700 hPa. A decrease in the RH is observed during the dusty day at pressure levels between 700 and 925 hPa, due to the dust aerosols from desert regions, absorbing moisture content. From Figure 10, Figure 11, Figure 12 and Figure 13, it is clear that on the dusty day, AIRS fails to measure CO volume, O3 volume, and H2O mass mixing ratio and RH at surface level (1000 hPa), whereas on non-dusty days, AIRS is sensitive to these parameters.
Previous dust studies in Beijing mainly focus on the changes of a few parameters with limited data, without any information about the vertical distributions of atmospheric and meteorological parameters. For the first time, we have made efforts to integrate ground and multisatellite data to study obvious changes in the atmospheric parameters (such as aerosol optical properties and meteorological parameters) at the surface and at different pressure levels during a severe dust storm, which need to be further investigated, in detail, accounting for all other dust storms. An extensive database of aerosol and meteorological parameters from ground and satellite data during dust storm events will be of great help to quantitative evaluation of its effect on the regional weather and climate and changes in atmospheric and meteorological parameters. The present results will be of great use to the modelling community to refine air quality models [77], and to compute radiative budget [78] during dust events, which are frequently observed in Beijing and surrounding areas. The ground-based active remote sensing, such as lidars and ceilometers, have been proven to be powerful tools for monitoring the vertical distribution of atmospheric aerosols with high temporal resolution [79,80,81,82]. The vertical extent of the dust layer together with the profiles of meteorological parameters will be more helpful for air quality monitoring and analysis.
Author Contributions
S.Z. collected and analyzed the data, and wrote the paper, R.P.S. contributed the central idea, designed the study and edited the paper.
Funding
This research was funded by the MOE (Ministry of Education in China) Project of Humanities and Social Sciences (Grant No. 17YJCZH264); Scientific Research Project of Education Department of Zhejiang Province (Grant No. Y201636214); and the National Social Science Foundation of China (Grant No. 14ZDA039).
Acknowledgments
Concerning AERONET data used in this paper, we thank Huizheng Che for establishing and maintaining Beijing-CAMS site. The authors are grateful to China National Environmental Monitoring Centre for making trace gases and particulate matter data available. The AIRS data used in this effort were acquired as part of the activities of NASA’s Science Mission Directorate, and are archived and distributed by the Goddard Earth Sciences (GES) Data and Information Services Center (DISC). The CALIOP data were obtained from the NASA Langley Research Center Atmospheric Sciences Data Center. We gratefully acknowledge the NOAA Air Resources Laboratory (ARL) for the provision of the HYSPLIT transport and dispersion model and/or READY website (http://www.ready.noaa.gov) used in the present study. The authors are grateful to NASA Giovanni team to access satellite data through Giovanni portal. The authors are grateful to all the four anonymous Reviewers for providing very detailed and useful comments/suggestions to improve earlier version of the paper.
Conflicts of Interest
The authors declare no conflict of interest.
References
- Wu, Z.J.; Cheng, Y.F.; Hu, M.; Wehner, B. Dust events in Beijing, China (2004–2006): Comparison of ground-based measurements with columnar integrated observations. Atmos. Chem. Phys. 2009, 9, 6915–6932. [Google Scholar] [CrossRef]
- Cao, C.; Zheng, S.; Singh, R.P. Characteristics of aerosol optical properties and meteorological parameters during three major dust events (2005–2010) over Beijing, China. Atmos. Res. 2014, 150, 129–142. [Google Scholar] [CrossRef]
- Singh, R.P. Dust storms and their influence on atmospheric parameters over the Indo-Gangetic plains. In Geospatial Technologies and Climate Change; Sundaresan, J., Santosh, K.M., Déri, A., Roggema, R., Singh, R., Eds.; Springer: Cham, Switzerland, 2014; pp. 21–35. ISBN 978-3-319-01689-4. [Google Scholar]
- Duce, R.A.; Unni, C.K.; Ray, B.J.; Prospero, J.M.; Merrill, J.T. Long-range atmospheric transport of soil dust from Asia to the tropical North Pacific-Temporal variability. Science 1980, 209, 1522–1524. [Google Scholar] [CrossRef] [PubMed]
- Sassen, K.; DeMott, P.J.; Prospero, J.M.; Poellot, M.R. Saharan dust storms and indirect aerosol effects on clouds: CRYSTAL-FACE results. Geophys. Res. Lett. 2003, 30, 276–286. [Google Scholar] [CrossRef]
- Singh, R.P.; Prasad, A.K.; Kayetha, V.K.; Kafatos, M. Enhancement of oceanic parameters associated with dust storms using satellite data. J. Geophys. Res.-Oceans 2008, 113, C11008. [Google Scholar] [CrossRef]
- Kayetha, V.K.; Senthil, K.J.; Prasad, A.K.; Cervone, G.; Singh, R.P. Effect of dust storm on ocean color and snow parameters. J. Indian Soc. Remote Sens. 2007, 35, 1–9. [Google Scholar] [CrossRef]
- Chen, G.T. History of strong dust storms in Beijing and ecological environmental change in nearby regions. J. Desert Res. 2001, 21, 402–407. (In Chinese) [Google Scholar]
- Zhou, Z.; Zhang, G. Typical severe dust storms in northern China during 1954–2002. Chin. Sci. Bull. 2003, 48, 2366–2370. [Google Scholar] [CrossRef]
- Choobari, O.A.; Zawar-Reza, P.; Sturman, A. The global distribution of mineral dust and its impacts on the climate system: A review. Atmos. Res. 2014, 138, 152–165. [Google Scholar] [CrossRef]
- Chun, Y.; Kim, J.; Choi, J.C.; Boo, K.O.; Oh, S.N.; Lee, M. Characteristic number size distribution of aerosol during Asian dust period in Korea. Atmos. Environ. 2001, 35, 2715–2721. [Google Scholar] [CrossRef]
- Husar, R.B.; Tratt, D.M.; Schichtel, B.A.; Falke, S.R.; Li, F.; Jaffe, D.; Gasso, S.; Gill, T.; Laulainen, N.S.; Lu, F.; et al. Asian dust events of April 1998. J. Geophys. Res.-Atmos. 2001, 106, 18317–18330. [Google Scholar] [CrossRef] [Green Version]
- Yu, H.; Remer, L.A.; Chin, M.; Bian, H.; Kleidman, R.G.; Diehl, T. A satellite-based assessment of transpacific transport of pollution aerosol. J. Geophys. Res.-Atmos. 2008, 113, 1528–1543. [Google Scholar] [CrossRef]
- Chen, Y.; Zhao, C.; Zhang, Q.; Deng, Z.; Huang, M.; Ma, X. Aircraft study of mountain chimney effect of Beijing, China. J. Geophys. Res.-Atmos. 2009, 114, D8. [Google Scholar] [CrossRef]
- Hu, M.; Guo, S.; Peng, J.F.; Wu, Z.J. Insight into characteristics and sources of PM2.5 in the Beijing-Tianjin-Hebei region, China. Natl. Sci. Rev. 2015, 2, 257–258. [Google Scholar] [CrossRef]
- Han, X.; Zhang, M.; Gao, J.; Wang, S.; Chai, F. Modeling analysis of the seasonal characteristics of haze formation in Beijing. Atmos. Chem. Phys. 2014, 14, 10231–10248. [Google Scholar] [CrossRef] [Green Version]
- Zheng, S.; Pozzer, A.; Cao, C.X.; Lelieveld, J. Long-term (2001–2012) concentrations of fine particulate matter (PM2.5) and the impact on human health in Beijing, China. Atmos. Chem. Phys. 2015, 15, 5715–5725. [Google Scholar] [CrossRef]
- Zheng, S.; Singh, R.P.; Wu, Y.; Wu, C. A comparison of trace gases and particulate matter over Beijing (China) and Delhi (India). Water Air Soil Pollut. 2017, 228, 181–195. [Google Scholar] [CrossRef]
- Zhang, Q.; Laurent, B.; Velay-lasry, F.; Ngo, R.; Derognat, C.; Marticorena, B.; Albergel, A. An air quality forecasting system in Beijing-Application to the study of dust storm events in China in May 2008. J. Environ. Sci.-China 2012, 24, 102–111. [Google Scholar] [CrossRef]
- Li, L.J.; Wang, Y.; Li, J.X.; Xin, L.Z.; Jin, J. The analysis of heavy air pollution in Beijing during 2000–2010. China Environ. Sci. 2012, 32, 23–30. (In Chinese) [Google Scholar]
- Yu, X.; Lü, R.; Kumar, K.R.; Ma, J.; Zhang, Q.; Jiang, Y.; Kang, N.; Yang, S.; Wang, J.; Li, M. Dust aerosol properties and radiative forcing observed in spring during 2001–2014 over urban Beijing, China. Environ. Sci. Pollut. Res. 2016, 23, 15432–15442. [Google Scholar] [CrossRef] [PubMed]
- Holben, B.N.; Eck, T.F.; Slutsker, I.; Tanré, D.; Buis, J.P.; Setzer, A.; Vermote, E.; Reagan, J.A.; Kaufman, Y.J.; Nakajima, T.; et al. AERONET-A federated instrument network and data archive for aerosol characterization. Remote Sens. Environ. 1998, 66, 1–16. [Google Scholar] [CrossRef]
- Yu, X.; Zhu, B.; Yin, Y.; Yang, J.; Li, Y.; Bu, X. A comparative analysis of aerosol properties in dust and haze-fog days in a Chinese urban region. Atmos. Res. 2011, 99, 241–247. [Google Scholar] [CrossRef]
- Du, W.; Xin, J.; Wang, M.; Gao, Q.; Li, Z.; Wang, Y. Photometric measurements of spring aerosol optical properties in dust and non-dust periods in China. Atmos. Environ. 2008, 42, 7981–7987. [Google Scholar] [CrossRef]
- Xin, J.; Du, W.; Wang, Y.; Gao, Q.; Li, Z.; Wang, M. Aerosol optical properties affected by a strong dust storm over central and northern China. Adv. Atmos. Sci. 2010, 27, 562–574. [Google Scholar] [CrossRef]
- Xie, Y.; Zhang, W.; Qu, J.J. Detection of asian dust storm using MODIS measurements. Remote Sens. 2017, 9, 869. [Google Scholar] [CrossRef]
- Prasad, A.K.; Singh, R.P. Changes in aerosol parameters during major dust storm events (2001–2005) over the Indo-Gangetic Plains using AERONET and MODIS data. J. Geophys. Res.-Atmos. 2007, 112, 139–155. [Google Scholar] [CrossRef]
- Winker, D.M.; Hunt, W.H.; McGill, M.J. Initial performance assessment of CALIOP. Geophys. Res. Lett. 2007, 34, 228–262. [Google Scholar] [CrossRef]
- Mishra, A.K.; Shibata, T. Climatological aspects of seasonal variation of aerosol vertical distribution over central Indo-Gangetic belt (IGB) inferred by the space-borne lidar CALIOP. Atmos. Environ. 2012, 46, 365–375. [Google Scholar] [CrossRef]
- Mamouri, R.E.; Ansmann, A.; Nisantzi, A.; Solomos, S.; Kallos, G.; Hadjimitsis, D.G. Extreme dust storm over the eastern mediterranean in september 2015: Satellite, lidar, and surface observations in the cyprus region. Atmos. Chem. Phys. 2016, 16, 13711–13724. [Google Scholar] [CrossRef]
- Ansmann, A.; Rittmeister, F.; Engelmann, R.; Basart, S.; Jorba, O.; Spyrou, C.; Remy, S.; Skupin, A.; Baars, H.; Seifert, P.; et al. Profiling of saharan dust from the caribbean to West Africa—Part 2: Shipborne lidar measurements versus forecasts. Atmos. Chem. Phys. 2017, 17, 14987–15006. [Google Scholar] [CrossRef]
- Marinou, E.; Amiridis, V.; Binietoglou, I.; Solomos, S.; Proestakis, E.; Konsta, D.; Papagiannopoulos, N.; Tsekeri, A.; Vlastou, G.; Zanis, P.; et al. Three-dimensional evolution of saharan dust transport towards europe based on a 9-year EARLINET-optimized CALIPSO dataset. Atmos. Chem. Phys. 2017, 17, 5893–5919. [Google Scholar] [CrossRef]
- Shen, X.; Liu, C.; Shi, R.; Bai, K.; Wang, C.; Gao, W. Preliminary study of a dust event over Beijing by using satellite data and ground-based measurements. In Proceedings of the Remote Sensing and Modeling of Ecosystems for Sustainability X (SPIE 8869), San Diego, CA, USA, 24 September 2013. [Google Scholar]
- Dey, S.; Tripathi, S.N.; Singh, R.P.; Holben, B.N. Influence of dust storms on the aerosol optical properties over the Indo-Gangetic basin. J. Geophys. Res.-Atmos. 2004, 109, D20211. [Google Scholar] [CrossRef]
- Kim, S.W.; Yoon, S.C.; Jefferson, A.; Ogren, J.A.; Dutton, E.G.; Won, J.G.; Ghim, Y.S.; Lee, B.I.; Han, J.S. Aerosol optical, chemical and physical properties at Gosan, Korea during Asian dust and pollution episodes in 2001. Atmos. Environ. 2005, 39, 39–50. [Google Scholar] [CrossRef]
- Bhattacharjee, P.S.; Prasad, A.K.; Kafatos, M.; Singh, R.P. Influence of a dust storm on carbon monoxide and water vapor over the Indo-Gangetic Plains. J. Geophys. Res.-Atmos. 2007, 112, D18203. [Google Scholar] [CrossRef]
- Hu, W.; Niu, H.; Zhang, D.; Wu, Z.; Chen, C.; Wu, Y.; Shang, D.; Hu, M. Insights into a dust event transported through Beijing in spring 2012: Morphology, chemical composition and impact on surface aerosols. Sci. Total Environ. 2016, 565, 287–298. [Google Scholar] [CrossRef] [PubMed]
- Papayannis, A.; Zhang, H.Q.; Amiridis, V.; Ju, H.B.; Chourdakis, G.; Georgoussis, G.; Pe’rez, C.; Chen, H.B.; Goloub, P.; Mamouri, R.E.; et al. Extraordinary dust event over Beijing, China, during April 2006: Lidar, Sun photometric, satellite observations and model validation. Geophys. Res. Lett. 2007, 34, 248–265. [Google Scholar] [CrossRef]
- Papayannis, A.; Amiridis, V.; Mona, L.; Tsaknakis, G.; Balis, D.; Bösenberg, J.; Chaikovski, A.; de Tomasi, F.; Grigorov, I.; Mattis, I.; et al. Systematic lidar observations of Saharan dust over Europe in the frame of EARLINET (2000–2002). J. Geophys. Res.-Atmos. 2008, 113, 523–531. [Google Scholar] [CrossRef]
- Müller, D.; Mattis, I.; Wandinger, U.; Ansmann, A.; Althausen, D.; Dubovik, O.; Eckhardt, S.; Stohl, A. Saharan dust over a central European EARLINET-AERONET site: Combined observations with Raman lidar and Sun photometer. J. Geophys. Res.-Atmos. 2003, 108, D12. [Google Scholar] [CrossRef]
- Müller, D.; Heinold, B.; Tesche, M.; Tegen, I.; Althausen, D.; Arboledas, L.A.; Amiridis, V.; Amodeo, A.; Ansmann, A.; Balis, D.; et al. EARLINET observations of the 14–22-May long-range dust transport event during SAMUM 2006: Validation of results from dust transport modelling. Tellus B 2009, 61, 325–339. [Google Scholar] [CrossRef] [Green Version]
- Wiegner, M.; Groß, S.; Freudenthaler, V.; Schnell, F.; Gasteiger, J. The May/June 2008 Saharan dust event over Munich: Intensive aerosol parameters from lidar measurements. J. Geophys. Res.-Atmos. 2011, 116, D23213. [Google Scholar] [CrossRef]
- Toledano, C.; Wiegner, M.; Garhammer, M.; Seefeldner, M.; Gasteiger, J.; Müller, D.; Koepke, P. Spectral aerosol optical depth characterization of desert dust during SAMUM 2006. Tellus 2009, 61, 216–228. [Google Scholar] [CrossRef] [Green Version]
- Bilbao, J.; Román, R.; Miguel, A. Turbidity coefficients from normal direct solar irradiance in Central Spain. Atmos. Res. 2014, 143, 73–84. [Google Scholar] [CrossRef]
- Groß, S.; Freudenthaler, V.; Schepanski, K.; Toledano, C.; Schäfler, A.; Ansmann, A.; Weinzierl, B. Optical properties of long-range transported saharan dust over barbados as measured by dual-wavelength depolarization raman lidar measurements. Atmos. Chem. Phys. 2015, 15, 11067–11080. [Google Scholar] [CrossRef] [Green Version]
- Ångström, A. Techniques of Determinig the Turbidity of the Atmosphere. Tellus 1961, 13, 214–223. [Google Scholar] [CrossRef]
- Dubovik, O.; Smirnov, A.; Holben, B.N.; King, M.D.; Kaufman, Y.J.; Eck, T.F.; Slutsker, I. Accuracy assessments of aerosol optical properties retrieved from Aerosol Robotic Network (AERONET) Sun and sky radiance measurements. J. Geophys. Res.-Atmos. 2000, 105, 9791–9806. [Google Scholar] [CrossRef] [Green Version]
- McMillan, W.W.; Barnet, C.; Strow, L.; Chahine, M.T.; McCourt, M.L.; Warner, J.X.; Novelli, P.C.; Korontzi, S.; Maddy, E.S.; Datta, S. Daily global maps of carbon monoxide from NASA’s Atmospheric Infrared Sounder. Geophys. Res. Lett. 2005, 32, L11801. [Google Scholar] [CrossRef]
- Divakarla, M.; Barnet, C.; Goldberg, M.; Maddy, E.; Irion, F.; Newchurch, M.; Liu, X.; Wolf, W.; Flynn, L.; Labow, G.; et al. Evaluation of Atmospheric Infrared Sounder ozone profiles and total ozone retrievals with matched ozonesonde measurements, ECMWF ozone data, and Ozone Monitoring Instrument retrievals. J. Geophys. Res.-Atmos. 2008, 113, D15308. [Google Scholar] [CrossRef]
- Gettelman, A.; Walden, V.P.; Miloshevich, L.M.; Roth, W.L.; Halter, B. Relative humidity over Antarctica from radiosondes, satellites, and a general circulation model. J. Geophys. Res. 2006, 111, D09S13. [Google Scholar] [CrossRef]
- Divakarla, M.G.; Barnet, C.D.; Goldberg, M.D.; McMillin, L.M.; Maddy, E.; Wolf, W.; Zhow, L.H.; Liu, X.P. Validation of AIRS temperature and water vapor retrievals with matched radiosonde measurements and forecasts. J. Geophys. Res.-Atmos. 2006, 111, D09S15. [Google Scholar] [CrossRef]
- Guo, J.; Niu, T.; Wang, F.; Deng, M.; Wang, Y. Integration of multi-source measurements to monitor sand-dust storms over North China: A case study. Acta Meteorol. Sin. 2013, 27, 566–576. [Google Scholar] [CrossRef]
- Liu, Z.; Liu, D.; Huang, J.; Vaughan, M. Airborne dust distributions over the Tibetan Plateau and surrounding areas derived from the first year of CALIPSO lidar observations. Atmos. Chem. Phys. 2008, 8, 5045–5060. [Google Scholar] [CrossRef] [Green Version]
- Winker, D.M.; Vaughan, M.A.; Omar, A.; Hu, Y.; Powell, K.A.; Liu, Z.; Hunt, W.H.; Young, S.A. Overview of the CALIPSO mission and CALIOP data processing algorithms. J. Atmos. Ocean. Technol. 2009, 26, 2310–2323. [Google Scholar] [CrossRef]
- Pongkiatkul, P.; Oanh, N.T.K. Assessment of potential long-range transport of particulate air pollution using trajectory modeling and monitoring data. Atmos. Res. 2007, 85, 3–17. [Google Scholar] [CrossRef]
- Stein, A.; Draxler, R.R.; Rolph, G.D.; Stunder, B.J.; Cohen, M.; Ngan, F. NOAA’s HYSPLIT atmospheric transport and dispersion modeling system. Bull. Am. Meteorol. Soc. 2015, 96, 2059–2077. [Google Scholar] [CrossRef]
- Rolph, G.; Stein, A.; Stunder, B. Real-time environmental applications and display system: READY. Environ. Model. Softw. 2017, 95, 210–228. [Google Scholar] [CrossRef]
- Chauhan, A.; Azevedo, S.C.D.; Singh, R.P. Pronounced changes in air quality, atmospheric and meteorological parameters, and strong mixing of smoke associated with a dust event over Bakersfield, California. Environ. Earth Sci. 2018, 77, 115–126. [Google Scholar] [CrossRef]
- Prospero, J.M.; Ginoux, P.; Torres, O.; Nicholson, S.E.; Gill, T.E. Environmental characterization of global sources of atmospheric soil dust identified with the Nimbus 7 Total Ozone Mapping Spectrometer (TOMS) absorbing aerosol product. Rev. Geophys. 2002, 40, 2011–2024. [Google Scholar] [CrossRef]
- Liu, X.; Yin, Z.Y.; Zhang, X.; Yang, X. Analyses of the spring dust storm frequency of northern China in relation to antecedent and concurrent wind, precipitation, vegetation, and soil moisture conditions. J. Geophys. Res.-Atmos. 2004, 109, D16. [Google Scholar] [CrossRef]
- Qian, W.; Quan, L.; Shi, S. Variations of the dust storm in China and its climatic control. J. Clim. 2002, 15, 1216–1229. [Google Scholar] [CrossRef]
- Wiegner, M.; Madonna, F.; Binietoglou, I.; Forkel, R.; Gasteiger, J.; Geiß, A.; Pappalardo, G.; Schäfer, K.; Thomas, W. What is the benefit of ceilometers for aerosol remote sensing? An answer from EARLINET. Atmos. Meas. Tech. 2014, 7, 1979–1997. [Google Scholar] [CrossRef] [Green Version]
- Liu, Z.; Vaughan, M.A.; Winker, D.M.; Hostetler, C.A.; Poole, L.R.; Hlavka, D.; Hart, W.; McGill, M. Use of probability distribution functions for discriminating between cloud and aerosol in lidar backscatter data. J. Geophys. Res. 2004, 109, D15202. [Google Scholar] [CrossRef]
- Kobayashi, A.; Hayashida, S.; Okada, K.; Iwasaka, Y. Measurements of the polarization properties of Kosa (Asian dust-storm) particles by a laser radar in spring 1983. J. Meteorol. Soc. Jpn. Ser. II 1985, 63, 144–149. [Google Scholar] [CrossRef]
- Gasteiger, J.; Wiegner, M.; Groß, S.; Freudenthaler, V.; Toledano, C.; Tesche, M.; Kandler, K. Modelling lidar-relevant optical properties of complex mineral dust aerosols. Tellus B 2011, 63, 725–741. [Google Scholar] [CrossRef] [Green Version]
- Hamonou, E.; Chazette, P.; Balis, D.; Dulac, F.; Schneider, X.; Galani, E.; Ancellet, G.; Papayannis, A. Characterization of the vertical structure of Saharan dust export to the Mediterranean basin. J. Geophys. Res.-Atmos. 1999, 104, 22257–222270. [Google Scholar] [CrossRef]
- Bilbao, J.; Román, R.; Yousif, C.; Mateos, D.; De Miguel, A. Total ozone column, water vapour and aerosol effects on erythemal and global solar irradiance in Marsaxlokk, Malta. Atmos. Environ. 2014, 99, 508–518. [Google Scholar] [CrossRef]
- Singh, R.P.; Dey, S.; Tripathi, S.N.; Tare, V.; Holben, B. Variability of aerosol parameters over Kanpur, northern India. J. Geophys. Res.-Atmos. 2004, 109, 2543–2552. [Google Scholar] [CrossRef]
- Sokolik, I.; Andronova, A.; Johnson, T.C. Complex refractive index of atmospheric dust aerosols. Atmos. Environ. A Gen. Top. 1993, 27, 2495–2502. [Google Scholar] [CrossRef]
- Sinyuk, A.; Torres, O.; Dubovik, O. Combined use of satellite and surface observations to infer the imaginary part of refractive index of Saharan dust. Geophys. Res. Lett. 2003, 30, 53–56. [Google Scholar] [CrossRef]
- Sokolik, I.N.; Toon, O.B. Incorporation of mineralogical composition into models of the radiative properties of mineral aerosol from UV to IR wavelengths. J. Geophys. Res.-Atmos. 1999, 104, 9423–9444. [Google Scholar] [CrossRef] [Green Version]
- Thompson, A.M.; Pickering, K.E.; McNamara, D.P.; Schoeberl, M.R.; Hudson, R.D.; Kim, J.H.; Browell, E.V.; Kirchhoff, V.W.J.H.; Nganga, D. Where did tropospheric ozone over southern Africa and the t ropical Atlantic come from in October 1992? Insights from TOMS, GTE TRACE A, and SAFARI 1992. J. Geophys. Res.-Atmos. 1996, 101, 24251–24278. [Google Scholar] [CrossRef]
- Hanisch, F.; Crowley, J.N. Ozone decomposition on Saharan dust: An experimental investigation. Atmos. Chem. Phys. 2003, 3, 119–130. [Google Scholar] [CrossRef]
- Pusede, S.; Cohen, R. On the observed response of ozone to NOx and VOC reactivity reductions in San Joaquin Valley California 1995–present. Atmos. Chem. Phys. 2012, 12, 8323–8339. [Google Scholar] [CrossRef] [Green Version]
- Gustafsson, R.J.; Orlov, A.; Badger, C.L.; Griffiths, P.T.; Cox, R.A.; Lambert, R.M. A comprehensive evaluation of water uptake on atmospherically relevant mineral surfaces: DRIFT spectroscopy, thermogravimetric analysis and aerosol growth measurements. Atmos. Chem. Phys. 2005, 5, 3415–3421. [Google Scholar] [CrossRef] [Green Version]
- Won, J.G.; Yoon, S.C.; Kim, S.W.; Jefferson, A.; Dutton, E.G.; Holben, B.N. Estimation of direct radiative forcing of Asian dust aerosols with sun/sky radiometer and lidar measurements at Gosan, Korea. J. Meteorol. Soc. Jpn. 2004, 82, 115–130. [Google Scholar] [CrossRef]
- Solazzo, E.; Bianconi, R.; Pirovano, G.; Moran, M.D.; Vautard, R.; Hogrefe, C.; Appel, K.W.; Matthias, V.; Grossi, P.; Bessagnet, B.; et al. Evaluating the capability of regional-scale air quality models to capture the vertical distribution of pollutants. Geosci. Model Dev. 2013, 6, 791–818. [Google Scholar] [CrossRef] [Green Version]
- Pérez, C.; Nickovic, S.; Pejanovic, G.; Baldasano, J.M.; Özsoy, E. Interactive dust-radiation modeling: A step to improve weather forecasts. J. Geophys. Res. 2006, 111, D16206. [Google Scholar] [CrossRef]
- Tsaknakis, G.; Papayannis, A.; Kokkalis, P.; Amiridis, V.; Kambezidis, H.D.; Mamouri, R.E.; Georgoussis, G.; Avdikos, G. Inter-comparison of lidar and ceilometer retrievals for aerosol and Planetary Boundary Layer profiling over Athens, Greece. Atmos. Meas. Tech. 2011, 4, 1261–1273. [Google Scholar] [CrossRef] [Green Version]
- Wiegner, M.; Geiß, A. Aerosol profiling with the Jenoptik ceilometer CHM15kx. Atmos. Meas. Tech. 2012, 5, 1953–1964. [Google Scholar] [CrossRef] [Green Version]
- Pappalardo, G.; Amodeo, A.; Apituley, A.; Comeron, A.; Freudenthaler, V.; Linné, H.; Ansmann, A.; Bösenberg, J.; D’Amico, G.; Mattis, I.; et al. EARLINET: Towards an advanced sustainable European aerosol lidar network. Atmos. Meas. Tech. 2014, 7, 2929–2980. [Google Scholar] [CrossRef]
- Tang, G.; Zhu, X.; Hu, B.; Xin, J.; Wang, L.; Münkel, C.; Mao, G.; Wang, Y. Impact of emission controls on air quality in Beijing during APEC 2014: Lidar ceilometer observations. Atmos. Chem. Phys. 2015, 15, 12667–12680. [Google Scholar] [CrossRef]
Figure 1.
Hourly variations of PM2.5, PM10, CO, and O3 concentrations in Dongsi station, Beijing during the dust storm event.
Figure 1.
Hourly variations of PM2.5, PM10, CO, and O3 concentrations in Dongsi station, Beijing during the dust storm event.

Figure 2.
HYSPLIT 2 days back trajectory of air masses (dots) at three heights arriving at Beijing at 17:00 h on 15 April 2015 (local standard time), the yellow line represents the portion of CALIPSO orbit track on 14 April 2015 (UTC), the orange and pink box, respectively, represents the dust track passing through the city of Ulanqab and Zhangjiakou.

Figure 3.
MODIS, AOD, and AE in the two boxes located in the city of Ulanqab and Zhangjiakou.

Figure 4.
Hourly variations of PM2.5, PM10, and CO concentrations in the city of Ulanqab (a) and Zhangjiakou (b) on 15 April 2015 (local standard time).
Figure 4.
Hourly variations of PM2.5, PM10, and CO concentrations in the city of Ulanqab (a) and Zhangjiakou (b) on 15 April 2015 (local standard time).

Figure 5.
Total attenuated backscatter and depolarization ratio at 532 nm wavelength in the range of (20.00°N, 94.69°E)~(68.00°N, 115.88°E) on 14 April 2015 (UTC). The horizontal coordinate represents the latitude and longitude, the vertical coordinate represents the altitude. The letter “D” designates the dust layer. (a) Total attenuated backscatter, and the blue to white color bar represents the value of the total backscatter at 532 nm wavelength; (b) Depolarization ratio and the black to white color bar represent the value of the depolarization ratio at 532 nm wavelength.

Figure 6.
Diurnal (a) and daily (b) variations of AERONET AOD675 and Ångström exponent during dusty and non-dusty days. The red column represents AOD675, and the blue dot refers to Ångström exponent.
Figure 6.
Diurnal (a) and daily (b) variations of AERONET AOD675 and Ångström exponent during dusty and non-dusty days. The red column represents AOD675, and the blue dot refers to Ångström exponent.


Figure 7.
Variation of aerosol size distributions during dusty and non-dusty days.

Figure 8.
Variations of total mode single scattering albedo during dust storm event.

Figure 9.
Variations of real (a) and imaginary (b) parts of refractive index during dusty and non-dusty days.
Figure 9.
Variations of real (a) and imaginary (b) parts of refractive index during dusty and non-dusty days.

Figure 10.
CO volume mixing ratio (COVMR) during dusty and non-dusty days. The red line represents profile during the dusty day.
Figure 10.
CO volume mixing ratio (COVMR) during dusty and non-dusty days. The red line represents profile during the dusty day.

Figure 11.
O3 volume mixing ratio on dusty day and non-dusty days. The red line represents vertical profile on dusty day.
Figure 11.
O3 volume mixing ratio on dusty day and non-dusty days. The red line represents vertical profile on dusty day.

Figure 12.
Relative humidity during dusty and non-dusty days. The red line represents profile during the dusty day.
Figure 12.
Relative humidity during dusty and non-dusty days. The red line represents profile during the dusty day.

Figure 13.
H2O mass mixing ratio during dusty and non-dusty days. The red line represents profile during the dusty day.
Figure 13.
H2O mass mixing ratio during dusty and non-dusty days. The red line represents profile during the dusty day.


Table 1.
Daily average variations of aerosol size distribution (dV/dlnR (μm3/μm2)) during dusty and non-dusty days.
Table 1.
Daily average variations of aerosol size distribution (dV/dlnR (μm3/μm2)) during dusty and non-dusty days.
| Radius (μm) | 11 April 2015 | 13 April 2015 | 14 April 2015 | 15 April 2015 | 16 April 2015 | 17 April 2015 | 20 April 2015 |
|---|---|---|---|---|---|---|---|
| 0.050 | 0.005 | 0.001 | 0.001 | 0.004 | 0.000 | 0.002 | 0.001 |
| 0.066 | 0.013 | 0.007 | 0.006 | 0.014 | 0.001 | 0.010 | 0.007 |
| 0.086 | 0.029 | 0.019 | 0.015 | 0.030 | 0.003 | 0.023 | 0.022 |
| 0.113 | 0.054 | 0.036 | 0.024 | 0.037 | 0.005 | 0.029 | 0.041 |
| 0.148 | 0.091 | 0.054 | 0.025 | 0.034 | 0.006 | 0.023 | 0.049 |
| 0.194 | 0.142 | 0.063 | 0.020 | 0.029 | 0.004 | 0.014 | 0.037 |
| 0.255 | 0.193 | 0.048 | 0.013 | 0.027 | 0.002 | 0.008 | 0.019 |
| 0.335 | 0.184 | 0.024 | 0.008 | 0.028 | 0.001 | 0.006 | 0.009 |
| 0.439 | 0.113 | 0.013 | 0.007 | 0.031 | 0.002 | 0.006 | 0.006 |
| 0.576 | 0.058 | 0.011 | 0.009 | 0.036 | 0.003 | 0.010 | 0.007 |
| 0.756 | 0.035 | 0.015 | 0.013 | 0.052 | 0.007 | 0.022 | 0.012 |
| 0.992 | 0.029 | 0.023 | 0.021 | 0.104 | 0.012 | 0.041 | 0.021 |
| 1.302 | 0.030 | 0.030 | 0.030 | 0.232 | 0.015 | 0.051 | 0.031 |
| 1.708 | 0.036 | 0.028 | 0.032 | 0.401 | 0.016 | 0.052 | 0.038 |
| 2.241 | 0.042 | 0.025 | 0.032 | 0.457 | 0.019 | 0.059 | 0.048 |
| 2.940 | 0.042 | 0.028 | 0.037 | 0.366 | 0.027 | 0.084 | 0.072 |
| 3.857 | 0.034 | 0.032 | 0.045 | 0.221 | 0.041 | 0.127 | 0.108 |
| 5.061 | 0.025 | 0.026 | 0.043 | 0.106 | 0.050 | 0.137 | 0.114 |
| 6.641 | 0.017 | 0.014 | 0.027 | 0.043 | 0.039 | 0.084 | 0.067 |
| 8.713 | 0.011 | 0.006 | 0.011 | 0.015 | 0.015 | 0.029 | 0.024 |
| 11.432 | 0.007 | 0.003 | 0.003 | 0.005 | 0.003 | 0.006 | 0.006 |
| 15.000 | 0.005 | 0.001 | 0.001 | 0.002 | 0.000 | 0.001 | 0.001 |
Table 2.
Total mode single scattering albedo during dusty day and non-dusty days.
| Days | SSA (Total) at Wavelength (nm) | |||
|---|---|---|---|---|
| 440 | 675 | 870 | 1020 | |
| 13 April 2015 | 0.940 | 0.934 | 0.930 | 0.927 |
| 14 April 2015 | 0.907 | 0.924 | 0.928 | 0.930 |
| 15 April 2015 | 0.930 | 0.972 | 0.980 | 0.983 |
| 16 April 2015 | 0.936 | 0.927 | 0.929 | 0.927 |
| 17 April 2015 | 0.876 | 0.911 | 0.922 | 0.929 |
| 20 April 2015 | 0.918 | 0.915 | 0.914 | 0.913 |
Table 3.
Refractive index during dusty and non-dusty days.
| Days | RI (Real) at Wavelength (nm) | RI (Imaginary) at Wavelength (nm) | ||||||
|---|---|---|---|---|---|---|---|---|
| 440 | 675 | 870 | 1020 | 440 | 675 | 870 | 1020 | |
| 11 April 2015 | 1.454 | 1.459 | 1.462 | 1.459 | 0.003 | 0.003 | 0.002 | 0.002 |
| 13 April 2015 | 1.483 | 1.483 | 1.484 | 1.476 | 0.008 | 0.007 | 0.006 | 0.006 |
| 14 April 2015 | 1.513 | 1.521 | 1.531 | 1.524 | 0.010 | 0.006 | 0.005 | 0.005 |
| 15 April 2015 | 1.547 | 1.559 | 1.552 | 1.546 | 0.003 | 0.001 | 0.001 | 0.001 |
| 16 April 2015 | 1.548 | 1.550 | 1.566 | 1.568 | 0.003 | 0.003 | 0.004 | 0.004 |
| 17 April 2015 | 1.567 | 1.574 | 1.594 | 1.588 | 0.009 | 0.005 | 0.004 | 0.004 |
| 20 April 2015 | 1.530 | 1.543 | 1.558 | 1.555 | 0.008 | 0.006 | 0.006 | 0.005 |
© 2018 by the authors. Licensee MDPI, Basel, Switzerland. This article is an open access article distributed under the terms and conditions of the Creative Commons Attribution (CC BY) license (http://creativecommons.org/licenses/by/4.0/).
Share and Cite
MDPI and ACS Style
Zheng, S.; Singh, R.P. Aerosol and Meteorological Parameters Associated with the Intense Dust Event of 15 April 2015 over Beijing, China. Remote Sens. 2018, 10, 957. https://0-doi-org.brum.beds.ac.uk/10.3390/rs10060957
AMA Style
Zheng S, Singh RP. Aerosol and Meteorological Parameters Associated with the Intense Dust Event of 15 April 2015 over Beijing, China. Remote Sensing. 2018; 10(6):957. https://0-doi-org.brum.beds.ac.uk/10.3390/rs10060957
Chicago/Turabian StyleZheng, Sheng, and Ramesh P. Singh. 2018. "Aerosol and Meteorological Parameters Associated with the Intense Dust Event of 15 April 2015 over Beijing, China" Remote Sensing 10, no. 6: 957. https://0-doi-org.brum.beds.ac.uk/10.3390/rs10060957
Note that from the first issue of 2016, this journal uses article numbers instead of page numbers. See further details here.