Article

Assessment of Irrigation Performance in Large River Basins under Data Scarce Environment—A Case of Kabul River Basin, Afghanistan

by
Fazlullah Akhtar
1,*,
Usman Khalid Awan
2,
Bernhard Tischbein
1 and
Umar Waqas Liaqat
3
1
Center for Development Research (ZEF), University of Bonn, Genscherallee 3, 53113 Bonn, Germany
2
International Center for Agricultural Research in the Dry Areas (ICARDA), P.O. Box 2416 Cairo, Egypt
3
Environment and Remote Sensing Laboratory, Department of Water Resources, Graduate School of Water Resources, Sungkyunkwan University, Suwon 440-746, Korea
*
Author to whom correspondence should be addressed.
Submission received: 10 April 2018 / Revised: 7 June 2018 / Accepted: 11 June 2018 / Published: 18 June 2018

Abstract

:
The Kabul River basin (KRB) of Afghanistan, a lifeline of around 10 million people, has multiplicity of governance, management, and development-related challenges leading to inequity, inadequacy, and unreliability of irrigation water distribution. Prior to any uplifting intervention, there is a need to evaluate the performance of irrigation system on a long term basis to identify the existing bottlenecks. Although there are several indicators available for the performance evaluation of the irrigation schemes, we used the coefficient of variation (CV) of actual evapotranspiration (ETa) in space (basin, sub-basin, and provincial level), relative evapotranspiration (RET), and temporal CV of RET, to assess the equity, adequacy, and reliability of water distribution, respectively, from 2003 to 2013. The ETa was estimated through a surface energy balance system (SEBS) algorithm and the ETa estimates were validated using the advection aridity (AA) method with a R2 value of 0.81 and 0.77 at Nawabad and Sultanpur stations, respectively. The global land data assimilation system (GLDAS) and moderate-resolution imaging spectroradiometer (MODIS) products were used as main inputs to the SEBS. Results show that the mean seasonal sub-based RET values during summer (May–September) (0.37 ± 0.06) and winter (October–April) (0.40 ± 0.08) are below the target values (RET ≥ 0.75) during 2003–2013. The CV of the mean ETa, within sub-basins and provinces for the entire study period, has an equitable distribution of water from October–January (0.09 ± 0.04), whereas the highest inequity (0.24 ± 0.08) in water distribution is during early summer. The range of the CV of the mean ETa (0.04–0.06) on a monthly and seasonal basis shows the unreliability of water supplies in several provinces or sub-basins. The analysis of the temporal CV of mean RET highlights the unreliable water supplies across the entire basin. The maximum ETa during the study period was estimated for the Shamal sub-basin (552 ± 43 mm) while among the provinces, Kunar experienced the highest ETa (544 ± 39 mm). This study highlights the dire need for interventions to improve the irrigation performance in time and space. The proposed methodology can be used as a framework for monitoring and implementing water distribution plans in future.

Graphical Abstract

1. Introduction

The Kabul River Basin (KRB) is strategically very important for its transboundary nature and around 50% flow contribution to the overall outflow of the basin. Irrigated agriculture in the KRB depends mainly on water supplies from the Kabul River and its tributaries. However, there are severe flaws in water distribution systems, which are causing around 40% of the total water loss due to poor operational performance [1]. Recent studies show that climate variability/change will significantly impact the water flow patterns, which will either cause severe droughts or otherwise heavy floods, especially in irrigated areas of the KRB [2,3,4]. The predicted unreliable water supplies [5] coupled with the poor performance of the irrigation system, would strongly impact the irrigated agriculture of the KRB and eventually the livelihoods of the rural population.
The operational and strategic performance of irrigation systems requires the continuous monitoring of an associated set of irrigation performance indicators. There are different sets of indicators used for irrigation performance including relative evapotranspiration, delivery performance ratio, drainage ratio, depleted fraction, overall consumed ratio, field application ratio, annual relative irrigation supply, annual relative water supply, conveyance ratio, etc. [6]. These indicators are used to assess the equity, adequacy, and reliability of the water distribution. Some of these indicators need field data (e.g., field application ratio) whereas others can be assessed by remote sensing without relying totally on ground field measurements (e.g., relative evapotranspiration). Moreover, some of the indicators are used to assess performance at the system level whereas others are used to assess performance at the field level. Due to unrest, insecurity, and under-developed institutions, it is difficult to get the secondary and primary data in the KRB, which is required for assessing irrigation performance. However, recent developments made in remote sensing make it possible to assess irrigation performance at the system level without a total reliance on ground data.
A recently developed backward-averaged iterative two-source surface temperature and energy balance solution algorithm (BAITSSS) [7] incorporated crop and soil stress components using a soil water balance approach, in order to capture the impacts of irrigation and precipitation between satellite overpass times. In the mentioned study, NARR (North American Reanalysis Data) and Landsat data were used to capture the role of irrigation and precipitation between the satellite overpass, which is critical in agricultural dominant areas. Similarly, another study [8] shows the importance of remote sensing-based estimates of water consumption and water stress combined with secondary agricultural production data, which provides better estimates of irrigation performance, together with water productivity at different scales. One of the key benefits of such an approach is that it allows the identification of areas where the agriculture sector performs less than its full potential, thereby providing insights into the necessary improvements of the overall irrigation system’s performance, which is aimed at enhancing water productivity in a sustainable manner. According to Bastiaanssen and Bos [9], remote sensing-based techniques have several advantages that can be complementary to field measurements. Therefore, the measurements derived from remote sensing are objective and can be very accurate compared to certain types of ground measurements. It further states that remote sensing covers a large area while ground studies are often confined to a small pilot area due to expense and logistical constraints. Meanwhile, remote sensing-based measurements could be repetitive and may allow for monitoring water management exercises and the evaluation of the impacts of interventions. Similarly, in another study [10], NOAA (National Oceanic and Atmospheric Administration) satellite images were analyzed through the SEBAL (surface energy balance algorithm for land) algorithm in order to obtain actual and potential evapotranspiration and biomass production, which could be used for the performance evaluation of the irrigation system in the absence of physical data.
The key advantage of the use of remote sensing derived data over in-situ measurements is that it provides scheme/system-level objective and spatially distributed information, which is normally not possible to acquire at such a large level, especially in regions where economic and technological capital is limited with prevailed insecurity as in case of this study, in the KRB, which greatly restricts ground movements for the collection of physical observations. Therefore, in order to fill this gap and evaluate irrigation performance, remote sensing data-based analyses are extremely useful [11], with which one can go back in time and carry out comparative analyses with the present situation. This is usually required for irrigation system uplifting in terms of efficiency and productivity. It therefore provides a low-cost remote sensing-based approach for making a quick analysis of the performance of an irrigation system [11]. Owing to the successful application and implementation of the SEBS in different ecological zones of the world for ETa estimation, it has many benefits in the cases of large temporal and spatial scales. However, there are some limitations to this study too, which affected the overall quality of the results targeted at the performance evaluation of the irrigation system. One of these limitations is that that it did not simulate the irrigation application at farms, and no direct in-situ measurements of the irrigated water use were made. This was driven by the limited resources for sampling across the large basin as well as the prevailed insecurity conditions that didn’t allow for extensive measurements in different irrigated lands. Beside this, the SEBS estimations were in reality a model (SEBS) to model (AA) comparisons where AA estimations were used to validate a SEBS estimated ETa. This is because this study lacks the ability to provide detailed information on the actual field evaporative fraction calculated by means of other methods (i.e., Energy Balance Bowen Ratio, scintillometry, and Eddy Covariance systems). Thus, in the absence of actual field measurements of ETa, the AA method could be used to validate the results of the ETa estimated by energy balance algorithms as performed by the previous studies [12,13].
Equity, reliability, and adequacy are the main challenges in water distribution at the system level for water managers, and not only in the KRB but also in other large irrigation schemes around the world [14,15]. In the current study, we assessed the equity, reliability, and adequacy of KRB at the system level (e.g., provinces and sub-basin scale). We used metrics that require only remote sensing data and have been documented well in other studies. For example, RET was used to assess the adequacy of water distribution at the water user’s association level by using satellite remote sensing [13,15]. Similarly, Ahmad, Bastiaanssen and Usman, et al. [9] used the CV of actual evapotranspiration (ETa) for assessing equity, which is the seasonal evaporative fraction for assessing the adequacy and temporal CV of the evaporative fraction for describing reliability. Thus, the objective of the current study is to assess the irrigation performance of the data-scarce KRB through a set of criteria (equity, adequacy and reliability) across the constituent sub-basins and provinces of the KRB for the period of 2003–2013. The coefficient of variation (CV) of the mean ETa, RET, and CV of RET were the metrics used to assess the equity, adequacy, and reliability, respectively. This study not only provides guidelines for the water managers in the region to optimize the operational and strategical performance of the KRB, but also the proposed set of indicators can be used as part of the monitoring and evaluation criteria for irrigation performance by relevant platforms in the future. The proposed set of indicators could also be helpful for the performance evaluation of the irrigations systems in data-scarce basins where ground-based measurements are missing or otherwise difficult to perform.

2. Materials and Methods

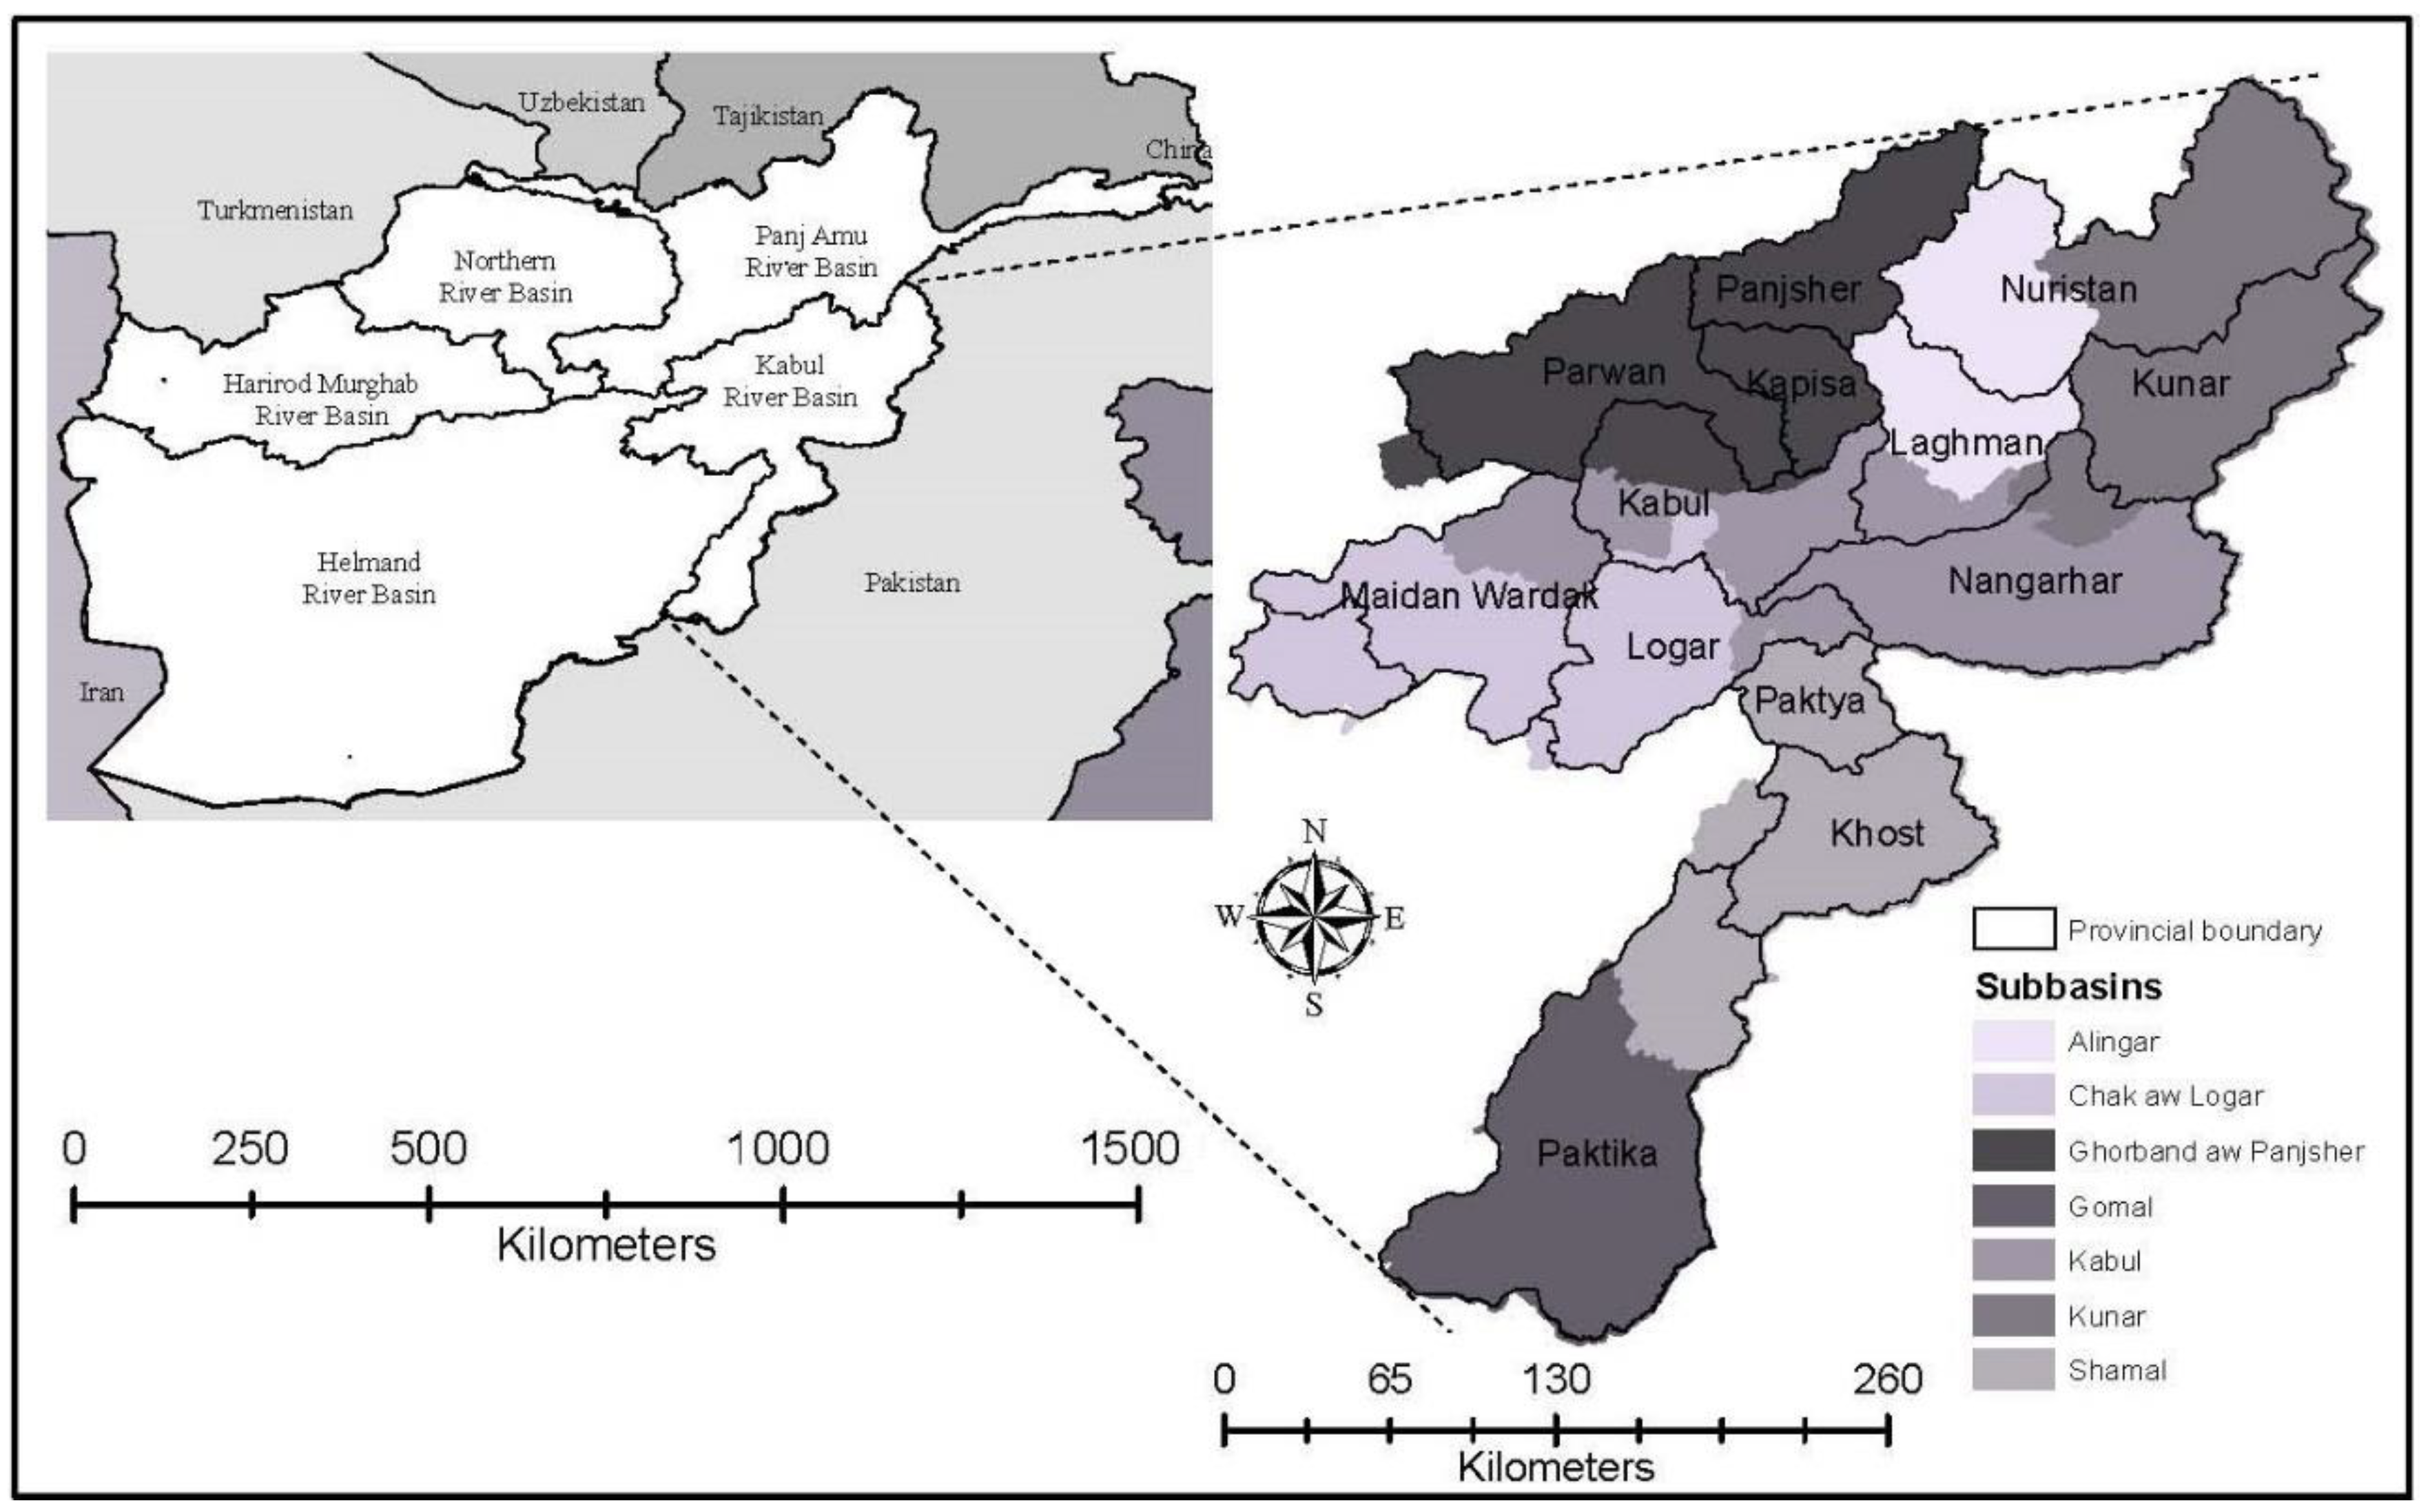
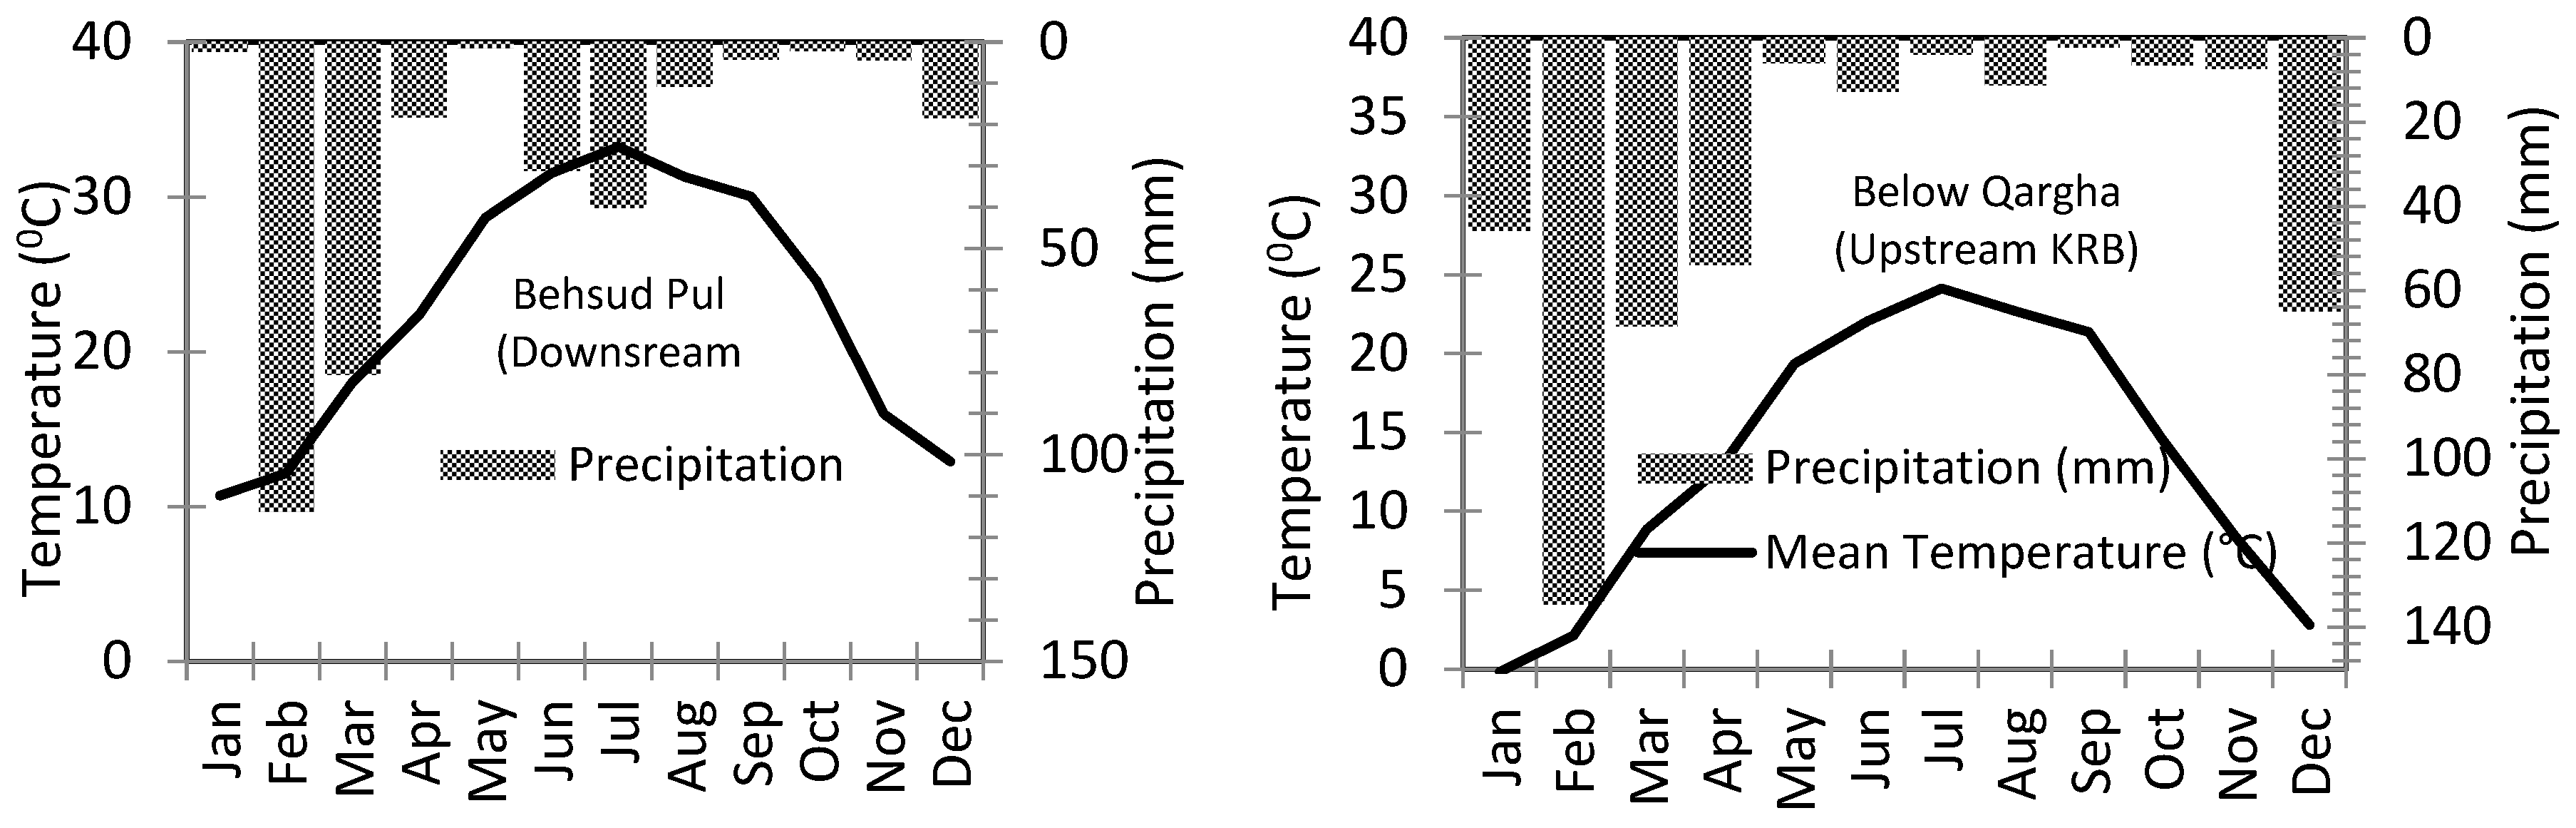
2.1. Description of the Study Site

The Kabul River Basin (KRB) is one of the five major river basins of Afghanistan having around 72,646 km2 of land area. It spans a wide swath of land starting from the central highlands of the country at 6000 m above mean sea level down to the valleys in the east at 400 m above mean sea level (Figure 1).
In 2013, the KRB received an annual precipitation of 327 mm at the downstream with a usual fringe effect of the Indian monsoon coming from the South Asian Himalayas, as well as around 418 mm at the upstream. The mean annual temperature at the central upstream and downstream locations were 13 °C and 23 °C, respectively (Figure 2).
Around 9% of the total land area of the KRB is cropland [16]. The main sources of irrigation of the cropland in the KRB are canals, streams, springs, karezes (underground water channels which exploit unconfined aquifers in alluvial fans which are recharged by snowmelt), as well as groundwater wells. Due to the relatively intensive conventional canal networks developed in the eastern provinces, mainly Nangarhar, Laghman, and Kunar, irrigated agriculture contributes the most to food production in the KRB. There is additional potential for the enhancement of irrigated agriculture [17] provided with modifications in the irrigation infrastructure and economical investment [18]. The existing irrigation system in the KRB is made of conventional schemes usually developed, constructed, operated, and maintained by farmers according to traditional customs and practices with some exceptions of recent interventions by the Afghan government. Most of the farmers are unaware of the actual crop water requirements and scheduled irrigations for the crops that are being grown locally. As a consequence, the delivery of water to the field is based on the rule of maximizing the amount captured, leading to imbalances and water losses at different reaches along the canals with a potential yield and biomass loss.

2.2. Diagnosis of the Irrigation System Performance of the KRB

For the diagnosis of irrigation system performance, researchers use different indicators including overall consumed ratio [19], crop water deficit [20], relative water supply [21], relative evapotranspiration [14,15], delivery performance ratio, drainage ratio and depleted fraction [15], and equity and reliability [8,14], etc. For this study, equity, adequacy, and reliability were used as the primary criteria for the assessment of irrigation performance at administratively important spatial units (sub-basin and provincial) and strategically viable time steps (annual, monthly, and seasonal). The choice of these indicators is mainly due to being required by the mainly remote sensing based ETa data rather than detailed secondary data or field measurements, which were hindered by prevailed insecurity and political instability in the rural irrigated regions of the KRB. Moreover, the selection is also based on the consideration of quantifiability, cost effectiveness, and accuracy required [22].
Equity is an extremely important aspect of irrigation management, which deals with the spatial distribution of water from the system manager’s point of view for large supply-based irrigation systems [23]. But in areas like KRB, suffering from multilateral issues (e.g., infrastructure damage, poor hydro-meteorological network, and water scarcity, etc.), equity in water consumption is more relevant at the system level and therefore can be computed from the remote sensing-based estimates of ETa. The CV of ETa was used as the key indicator to assess this criterion across sub-basins and provinces both in the summer and winter seasons, from 2003 to 2013. The CV used here is a measure of the relative variability which that calculated as the ratio of the standard deviation of the mean monthly ETa (2003–2013) to the mean monthly ETa (Equation (1)):
CV = Standard   Deviation   ( σ )   Mean   ( μ )
The high CV of ETa, across the spatial constituent units of the KRB (i.e., sub-basins and provinces), would reveal high inequity in the irrigation system and vice versa. Adequacy is used to assess the reduction in ETa as well as to evaluate the sufficiency of water delivery to a known command area [21]. For the evaluation of the adequacy, the relative evapotranspiration (RET) was used to detect the areas with water shortages over the time period of 2003–2013. The RET is very important in relation to the monitoring of agricultural drought as well as crop yield forecasting. Relative evapotranspiration is known to be a reliable measure of plant available soil water and is proportional to plant growth [24]. The RET was calculated as a ratio of ETa to ETc as given in Equation (2):
RET = ET a ET c
The crop evapotranspiration (ETc) in this case is determined by the crop coefficient approach, as explained in the FAO irrigation and drainage paper 56 [25], and was calculated using by using Equation (3):
ET c = K c   ×   ET 0
where Kc is the crop coefficient and ET0 is the reference evapotranspiration calculated through the FAO Penman-Monteith method [25].
The higher values of RET in a specific sub-basin shows that this sub-basin is under lesser stress, and vice versa. Usually RET ≥ 0.75 is acceptable for irrigated agriculture, although it is constantly over time [26,27], while RET between 0.75 and 1.0 shows adequate water supply [15]. The value of RET = 0.65 is considered to be the critical value [28] and below that level (RET < 0.65) is considered to be poor performance of the irrigation system, and eventually leads to a loss to the crop yield and biomass. Reliability is the measure that describes the sufficiency of water availability for crops’ consumption throughout the season. Therefore, the temporal CV of RET across the constituent provinces of the KRB was used for the assessment of the water reliability.

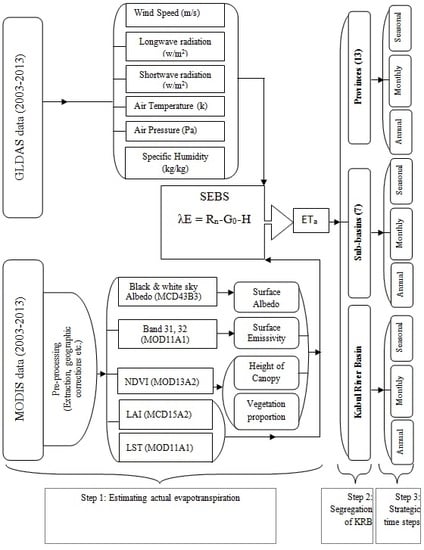
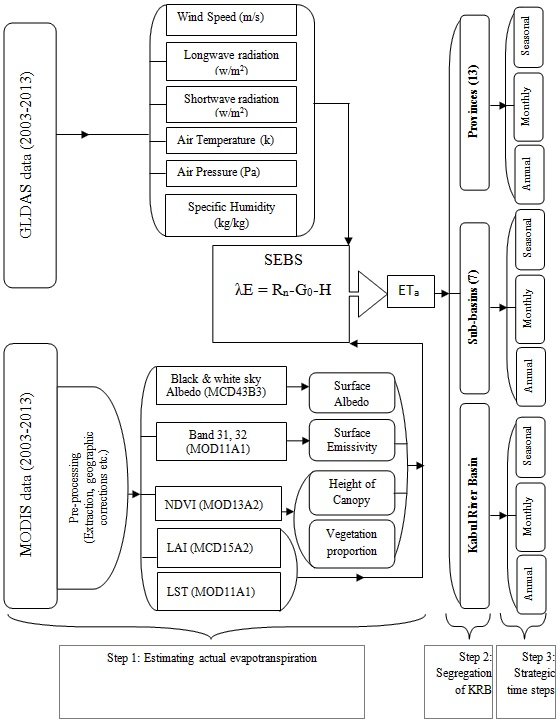
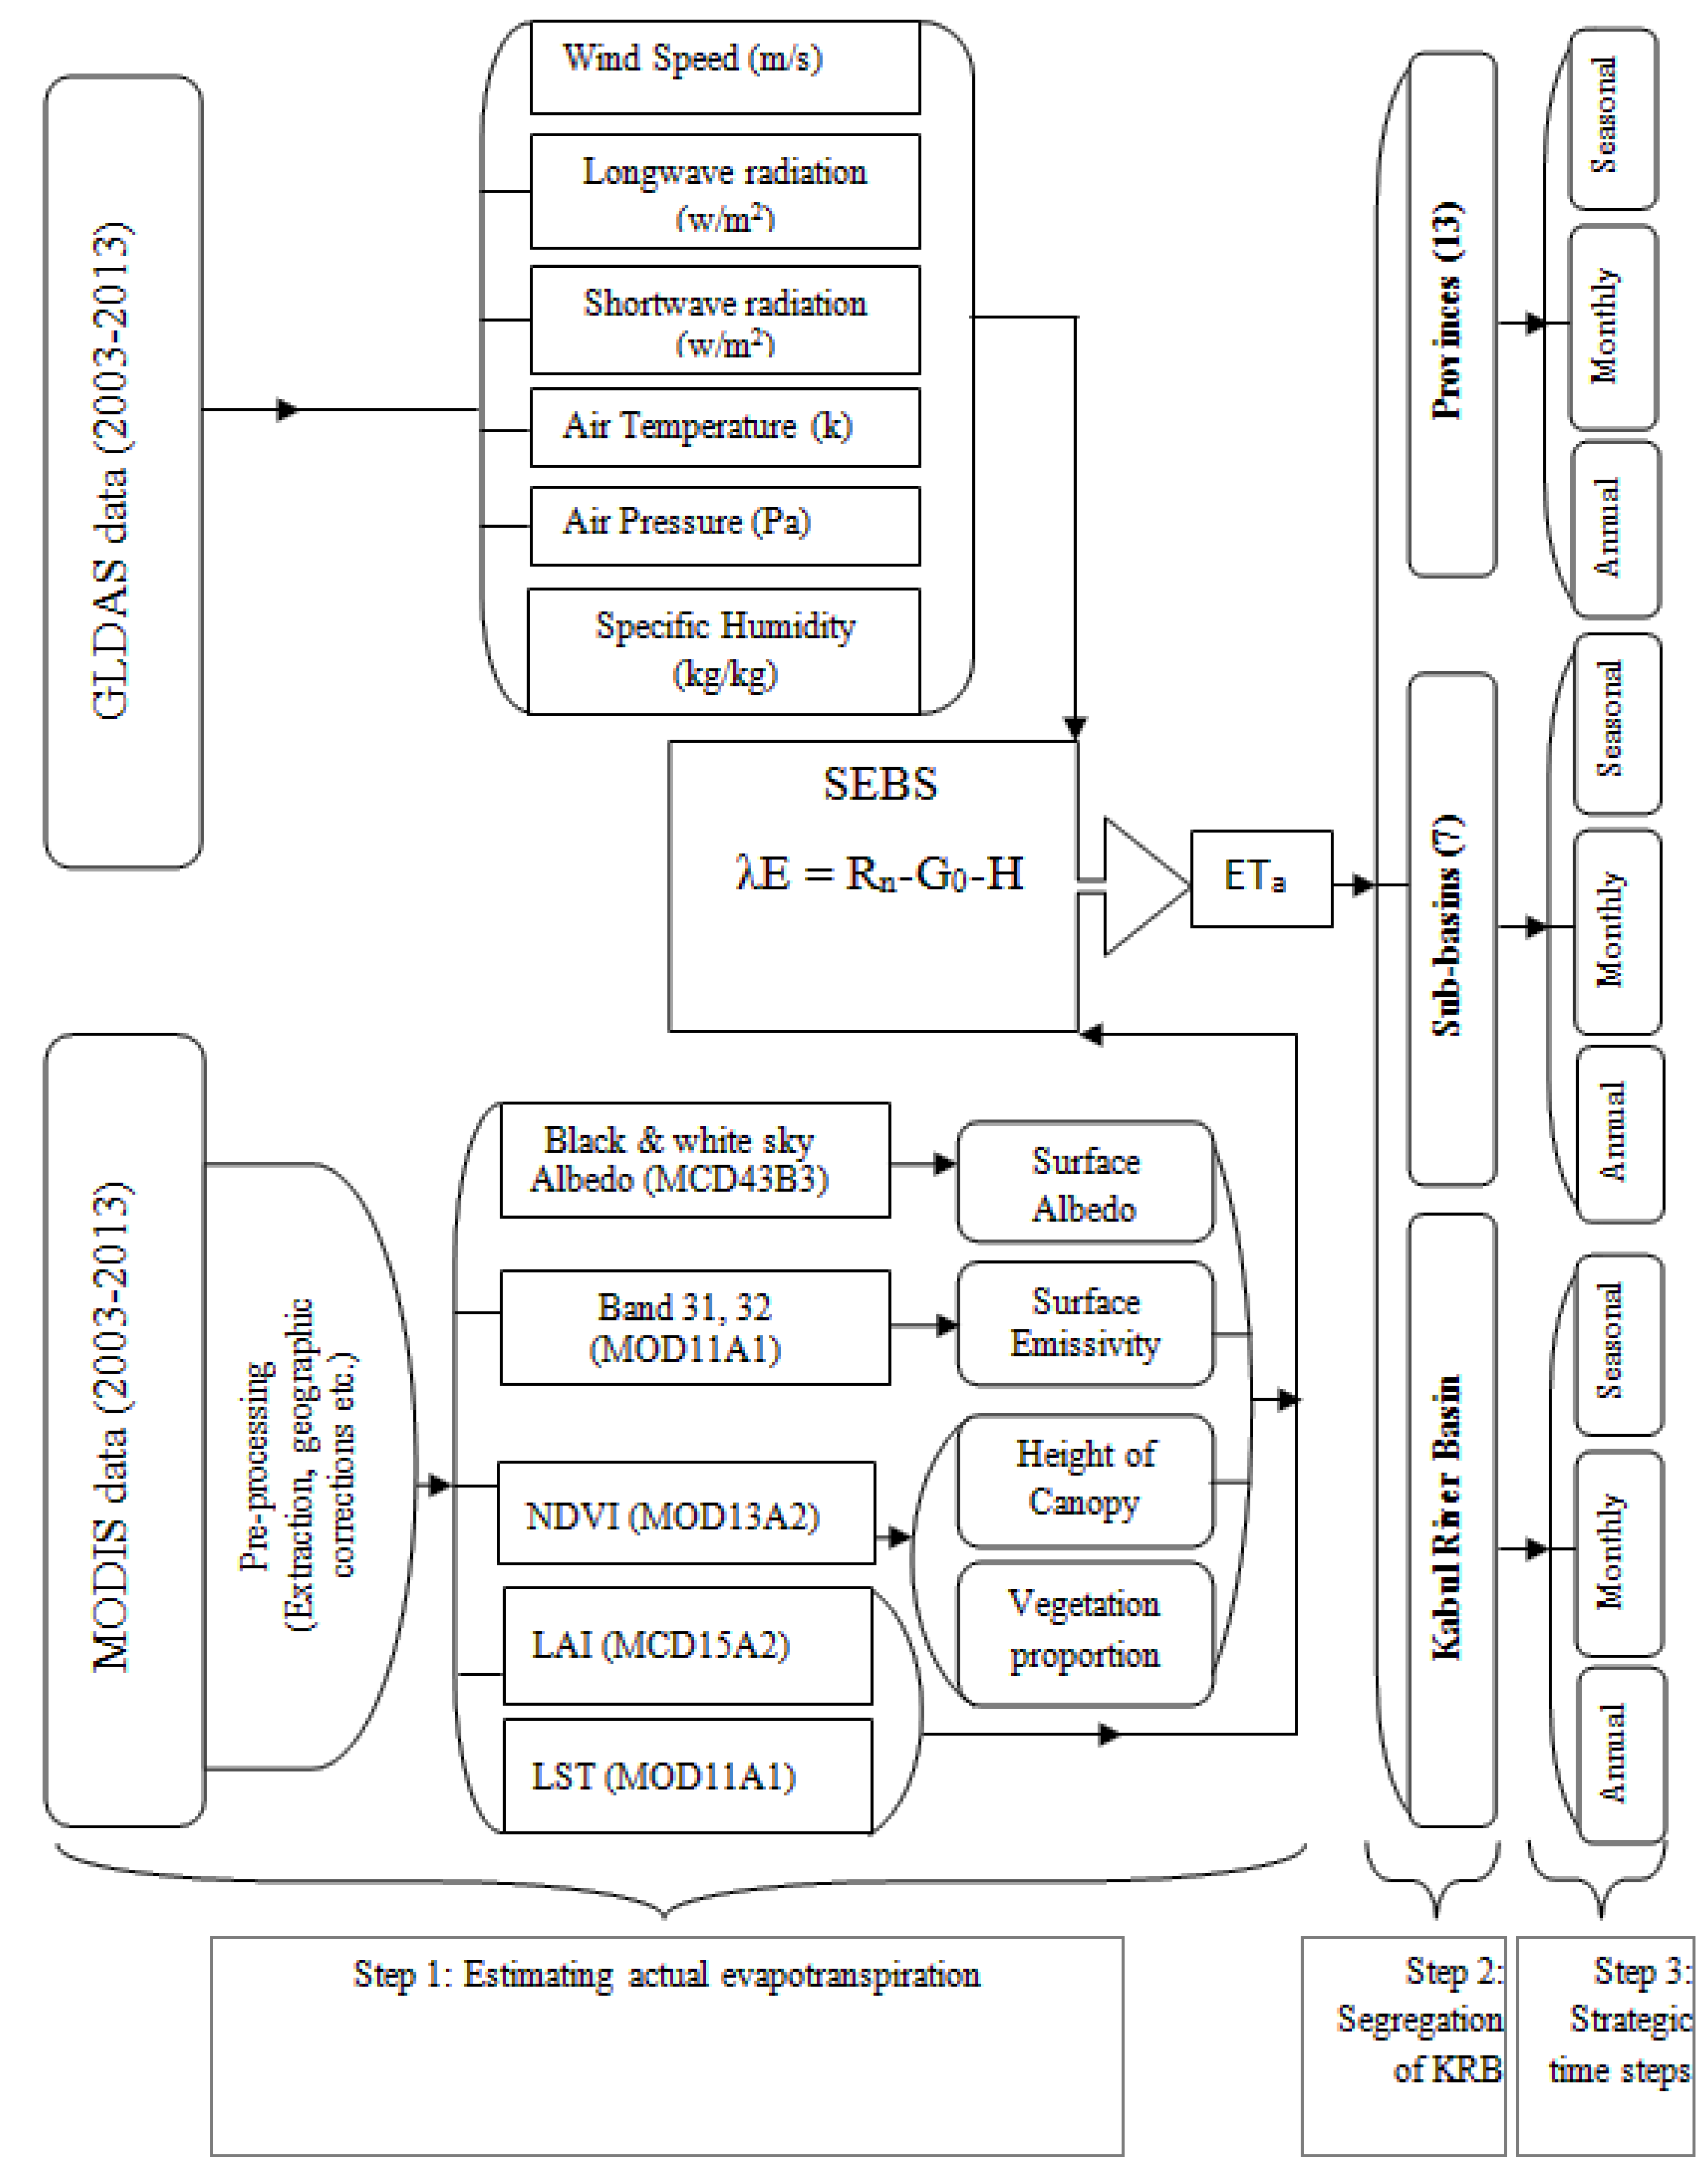
2.3. Actual Evapotranspiration Estimated by Remote Sensing

There are different algorithms for mapping the ETa, but their selection depends on the level of accuracy required, the geographical conditions of the targeted area, model limitations, etc. [29]. Based on the acceptable estimates of the Surface Energy Balance System (SEBS) algorithm [30] used at the Indus Basin and similar regions [12,13], it was also chosen for this study to estimate ETa for the KRB. The GLDAS and MODIS data were used as inputs to the SEBS. Furthermore, it is a well-established model and has been validated under the different agro-climatic conditions of the world. Former studies show that SEBS results, when validated against the observed eddy covariance (EC) technique [31], ground-measured ETa [32], and the ETa estimated with advection aridity (AA) in the Indus Basin [13], yielded an acceptable correlation. In this study, we used the AA method, due to its fewest ground data requirements, high reliability, and successful implementation in the same region (Indus Basin) [13].
Therefore, a methodological framework (Figure 3) was established to estimate the ETa covering the study period (2003–2013) by the SEBS model for administratively important spatial units (basin, sub-basin, and provincial) and strategically viable time steps (annual, monthly, and seasonal).
The SEBS algorithm is a single-source model used for the estimation of atmospheric turbulent fluxes and the surface evaporative fraction derived from the remote sensing data. The SEBS algorithm employs meteorological and satellite spectral reflectance and radiance data for the estimation of the turbulent heat fluxes. It is based entirely on the rationale of the basic equation (Equation (4)) used for the computation of surface energy balance and is given below:
R n = G 0 + H + λ E
where Rn is net radiation (Wm−2) while G0 is soil heat flux (Wm−2), H is the sensible heat flux (Wm−2), λE is the turbulent latent heat flux (Wm−2) with λ being the latent heat of vaporization (Jkg−1), and E is evapotranspiration.
It is worth mentioning that most of the energy balance models differ from each other in the way, they calculate the sensible heat flux. SEBS is basically a single-source algorithm, which uses either the Monin-Obukov Similarity (MOS) theory [33] for atmospheric surface layer (ASL) scaling or the Bulk Atmospheric Similarity (BAS) theory [34] used for atmospheric boundary layer scaling, depending on the height at which the measurements were taken in order to simulate the sensible heat flux used in Energy budget Equation (4). In this study, all measurements were conducted within the ASL. The MOS theory was considered for the allocation of H from the available energy through an iteration procedure in this study [30]. SEBS is a widely used and published model, thus readers are referred to previous studies [13,30,31,35] for a detailed description of the algorithm. But it is important to say that during cloud-free sky situations the evaporative fraction (Λ) (known to be conservative in a diurnal cycle) is considered to be representative of daily energy partitioning. Based on this assumption, an instantaneous evaporative fraction (Λ) during the satellite overpass time was used for the computation of the instantaneous ET at different timescales. The instantaneous ETa (mm s−1) was scaled up to daily values, ETa24 (mm/day), by estimating the averaged 24 h net radiation (RN24) [35,36], and for this reason we summed up the instantaneous ETa values over 24 h. This adaptation was based on the assumption that the evaporative fraction almost remains constant, though the sensible and latent heat fluxes may vary strongly during a day [37].

Main Input Data Characteristics for the SEBS

The Global Land Data Assimilation System (GLDAS) is a unique uncoupled land surface modeling system that drives multiple models and integrates a large quantity of observed data purposed to ingest satellite and ground-based measured data. It runs globally with a spatial resolution of 0.25° with 3 h of step information [38]. The use of GLDAS datasets is very helpful while dealing with areas suffering from data scarcity or the absence of ground meteorological information [39,40]. The meteorological variables (Table 1) extracted from the Goddard Earth Sciences Data and Information Services Center (GES DISC- http://disc.sci.gsfc.nasa.gov/hydrology) for tiles H23V5, which covers the study area, were used in the SEBS for the ETa estimation in the data-scarce KRB.
The MODIS data sets (Table 2) used in the SEBS were downloaded from the Land processes Distributed Active Archive Center (LP DAAC) of the United States Geological Survey (USGS) (https://lpdaac.usgs.gov/products/modis_products_table). The downloaded meteorological variables were interpolated in a linear way to match the MODIS’s temporal resolutions over-pass time over the KRB. While using the MODIS re-projection tool, the downloaded data sets were re-sampled by using the nearest neighbor interpolation method. The MODIS land surface temperature data is produced daily (instantaneous), while the leaf area index (LAI) is an 8-day composite dataset. Because land surface status, defined by LAI and surface reflectance or surface albedo (MCD43B3), does not alter significantly over short periods, the 8-day interval is enough to portray the land surface properties [35]. The land cover map (MCD12Q1) was used in the analysis of the evaporative behavior of different land cover types in the KRB.

2.4. Evaluation of the SEBS Actual Evapotranspiration through Advection-Aridity Model (AA)

The advection-aridity model (AA model) is an energy balance model [41] used in this study to estimate the actual evapotranspiration from the meteorological data of two stations, located at the Nangarhar and Kunar provinces. Both the stations are located at places where there are no major variations in cropping pattern for a few kilometers from the stations. The spatial difference in estimated ET of both methods is small and negligible. The results of the AA model were used to evaluate the ETa estimates of SEBS model. The AA model was chosen because of its suitability under arid and semi-arid conditions [13,42,43]. The main benefit of the AA complementary method is that it does not require any information on plant canopy resistance, stomatal resistance vegetation properties, soil moisture, or other measures of aridity, because it depends mainly on meteorological parameters [41,44]. The details of the AA model have been elaborated in several studies under various geographic and climatic conditions [12,45,46], which states that the AA method was able to produce accurate estimations of the ETa when compared to the eddy covariance measurements or the water balance approach. The AA model [41] for regional evapotranspiration estimation, which is based on Bouchet’s complementary relationship [47], and expresses the ETa as a combination of the wet environment (ETw) and potential evapotranspiration (ETp) (Equation (5)):
ET a = 2 ET w ET p
where ETa is the actual evapotranspiration, ETw is the evapotranspiration under a wet surface, and ETp is the potential evapotranspiration.

2.5. Mann-Kendall Test for Monotonic Trend in Temperature

The trend in the meteorological time-series is complicated because of the skewness, persistence, and seasonal characteristics in the data. Different researchers [48,49] have used the non-parametric Mann-Kendall [50,51] and Sen’s [52] slope estimator. Several researchers [53] prefer the use of the Mann-Kendall test because it provides the best alternative when the observed data is skewed either positively or negatively, or otherwise correlated cyclically or serially [54]. Therefore, to evaluate if there has been a significant monotonic upward or downward trend of the variable (temperature) over time that could trigger possible changes in the ETa trend during 2003–2013, the Mann Kendall (MK) test was used, which is applied to the monthly inputs of the targeted variable. The monthly mean temperature (2003–2013) was used for the MK trend analysis test, and the MK test statistics are calculated on a monthly basis by using Equation (6), while the variance (MK test) is computed by using Equation (7). Besides this, the MK statistic and its variance are used to calculate the cumulative MK statistics and variance by using Equations (8) and (9), respectively, for a specific season/year. Finally, the cumulative MK statistic and variance is used to compute the Z statistic by the set of Equation (10):
S i = k = 1 N 1   l = k + 1 N s g n ( x i l x i k ) ,   i = 1 , , 12
where in Equation (6), k, l = indices representing year k = 1, 2, …, N, l = 2, 3, …, N; i = indices representing month i = 1, 2, …, 12; N = number of years; Si = MK statistic for month i; xil = data point for month i, year l; xik = data point for month i, year k and the function sgn(xil − xik) is defined by:
s g n   ( x i k ,   x i l ) = + 1 ,   i f   x i l > x i k l > k
s g n   ( x i k ,   x i l ) =   0 ,   i f   x i l = x i k for l ≤ k
s g n   ( x i k ,   x i l ) = 1 ,   i f   x i l < x i k
s g n   ( x i k ,   x i l ) = u n d e f i n e d
When each time step is shown by a single data point (with sample size > 10), then the variance of MK statistics is calculated through the following equation:
V A R ( S i ) = 1 18 [ N i ( N i 1 ) ( 2 N i + 5 ) p = 1 g i ( t i p ( t i p 1 ) ) 2 t i p + 5 ) ]
where gi = number of groups with tied data in month i; tip = number of tied data points in group p of month i; and Ni = number of data points (over years) for month i.
After calculating Si and VAR(Si) for individual months, the annual sum was calculated by using equations C and D:
S * = i = 1 k S i
V A R ( S * ) = i = 1 k V A R ( S i )
The standardized ZMK statistics were calculated using the following equation which follows a standard normal distribution and can be related to a P value for testing the significance of the trend [55]:
Z M K = S 1 V A R ( S ) ,   i f   S > 0 Z M K   =   0 ,   i f   S = 0 Z M K = S + 1 V A R ( S ) ,   i f   S < 0

3. Results and Discussion

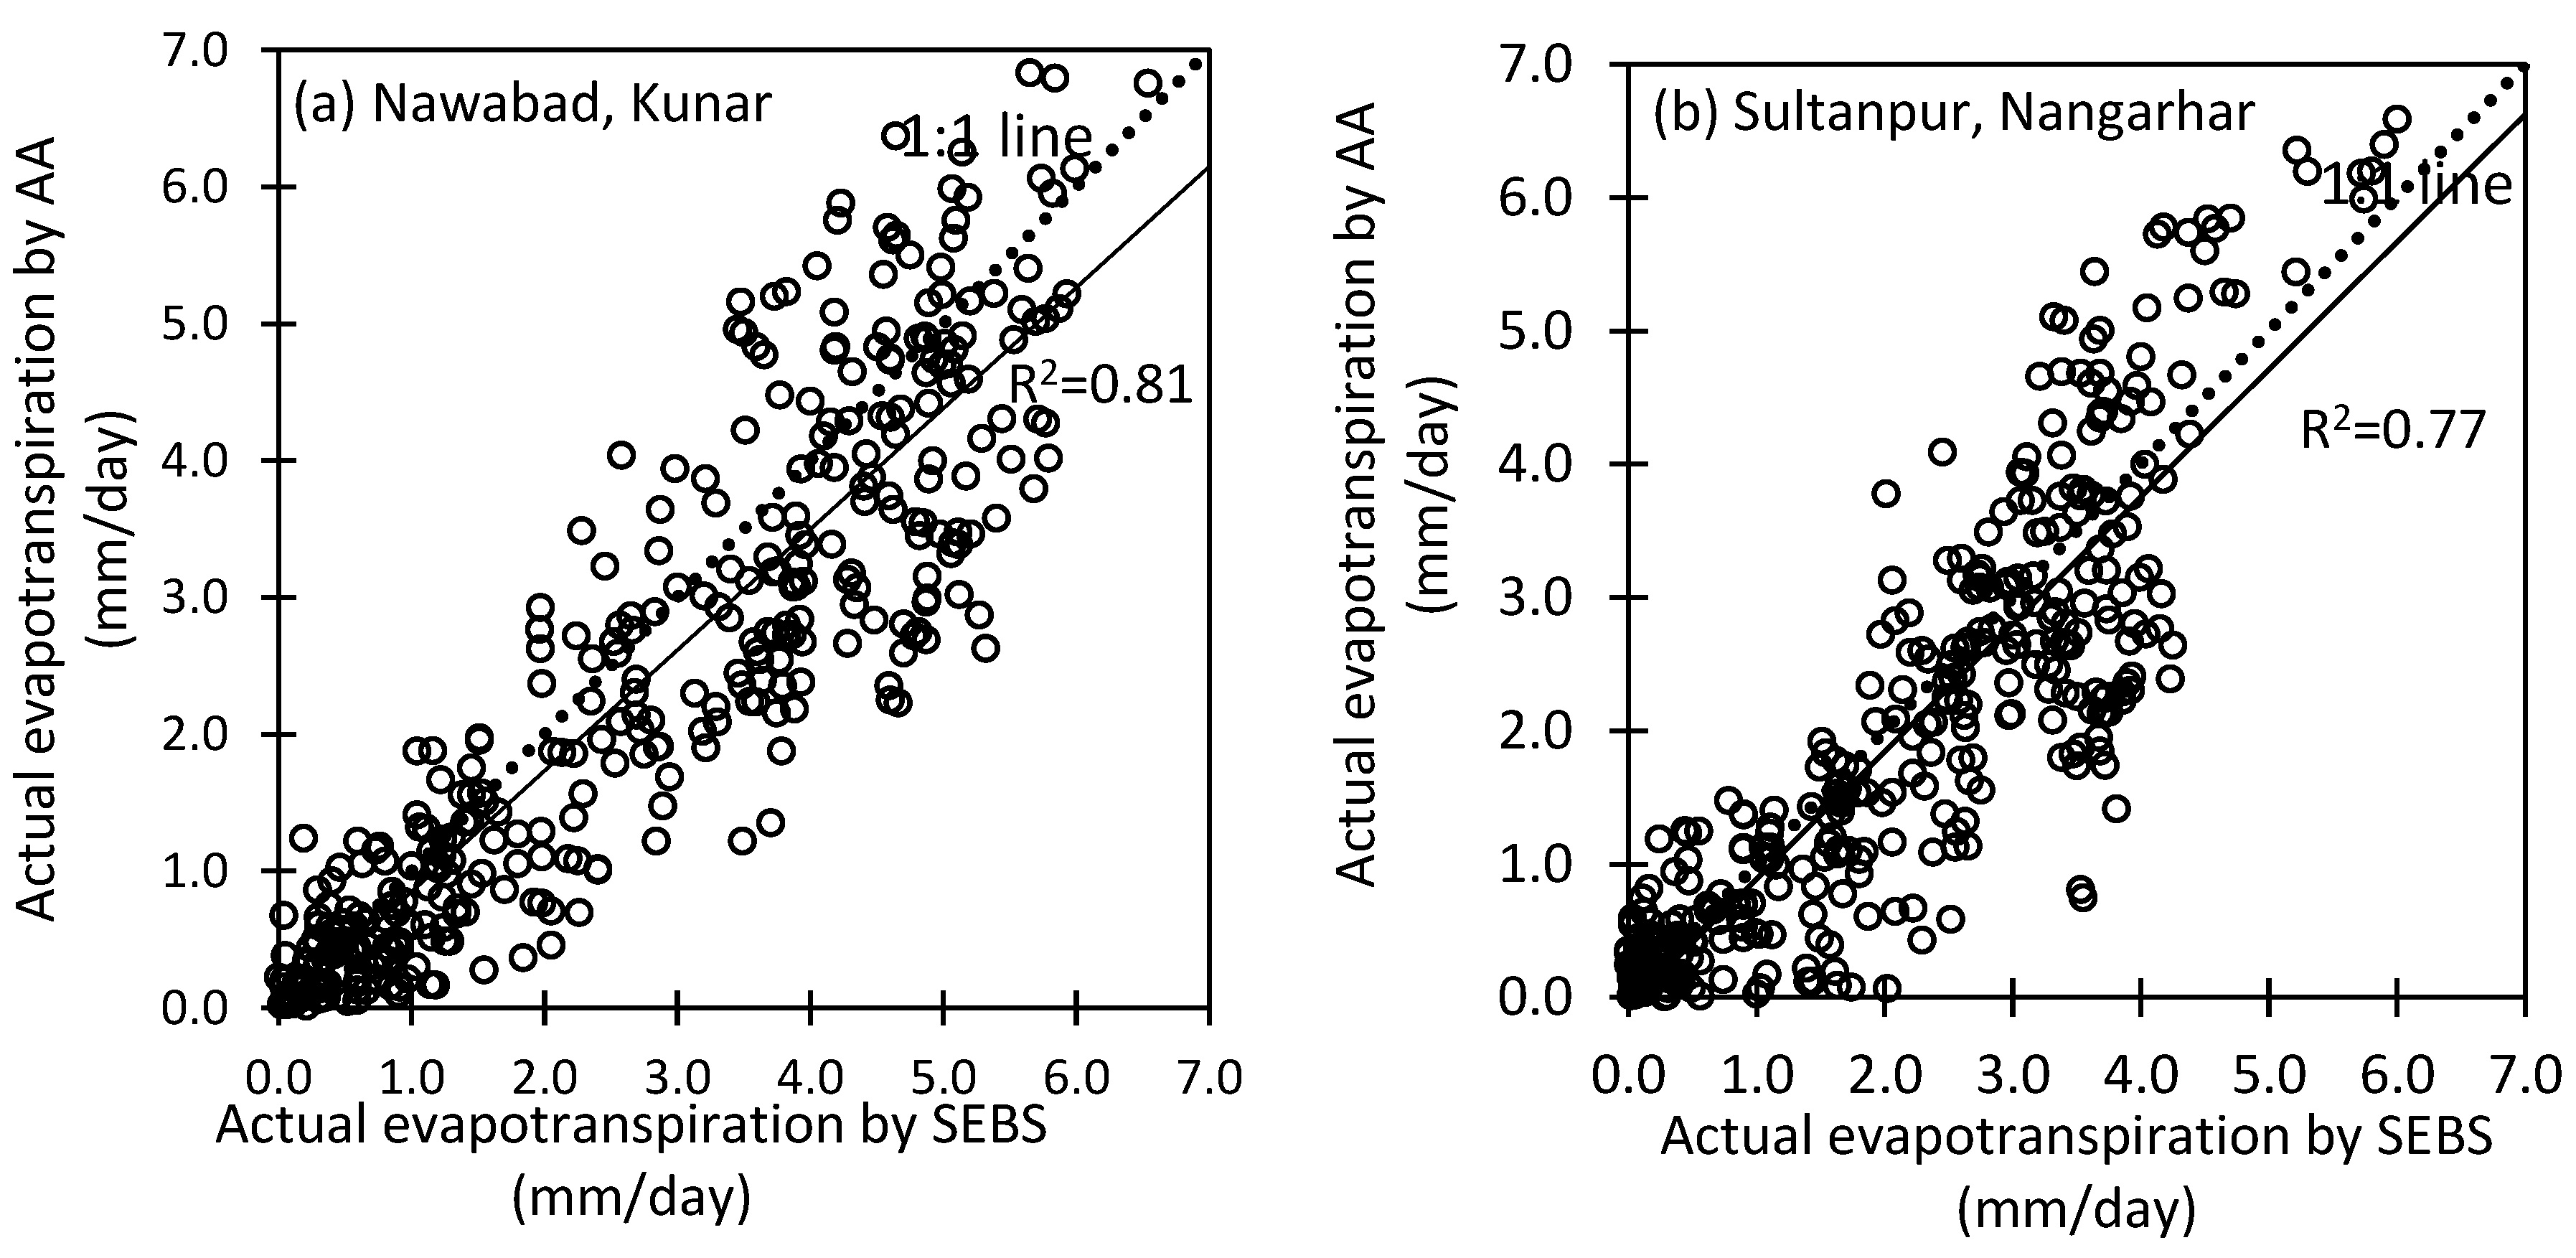
3.1. Validation of the ETa Estimated through SEBS with AA Model Estimates

Based on the validation results shown in Figure 4, there has been a sound fitness between the ETa estimated through SEBS and the ETa estimated through AA at the Kunar and Nangarhar provinces. The coefficients of determination thus obtained were R2 = 0.81 and R2 = 0.77, respectively (Figure 4). For the cool months of the year, the ETa values of the AA model are lower than those of SEBS. The reason behind is that the AA model uses a form of the Penman equation that does not work well for those periods for which the available energy (Rn) is negative or otherwise very close to zero. A similar result has been obtained from another study [56] whereby they estimated ETa through Complementary Relationship Areal Evapotranspiration (CRAE) and AA models, which resulted in lower values by using the AA model against those of CRAE in the cool months of winter. Another study in the Indus Basin [13] also shows that the ETa calculated through AA was lower in the cool months of winter (October to March) compared to ETa estimates through SEBS for the same period. The AA model yields lower value of ETa under high precipitation conditions [43], which goes in line with the result of this study.

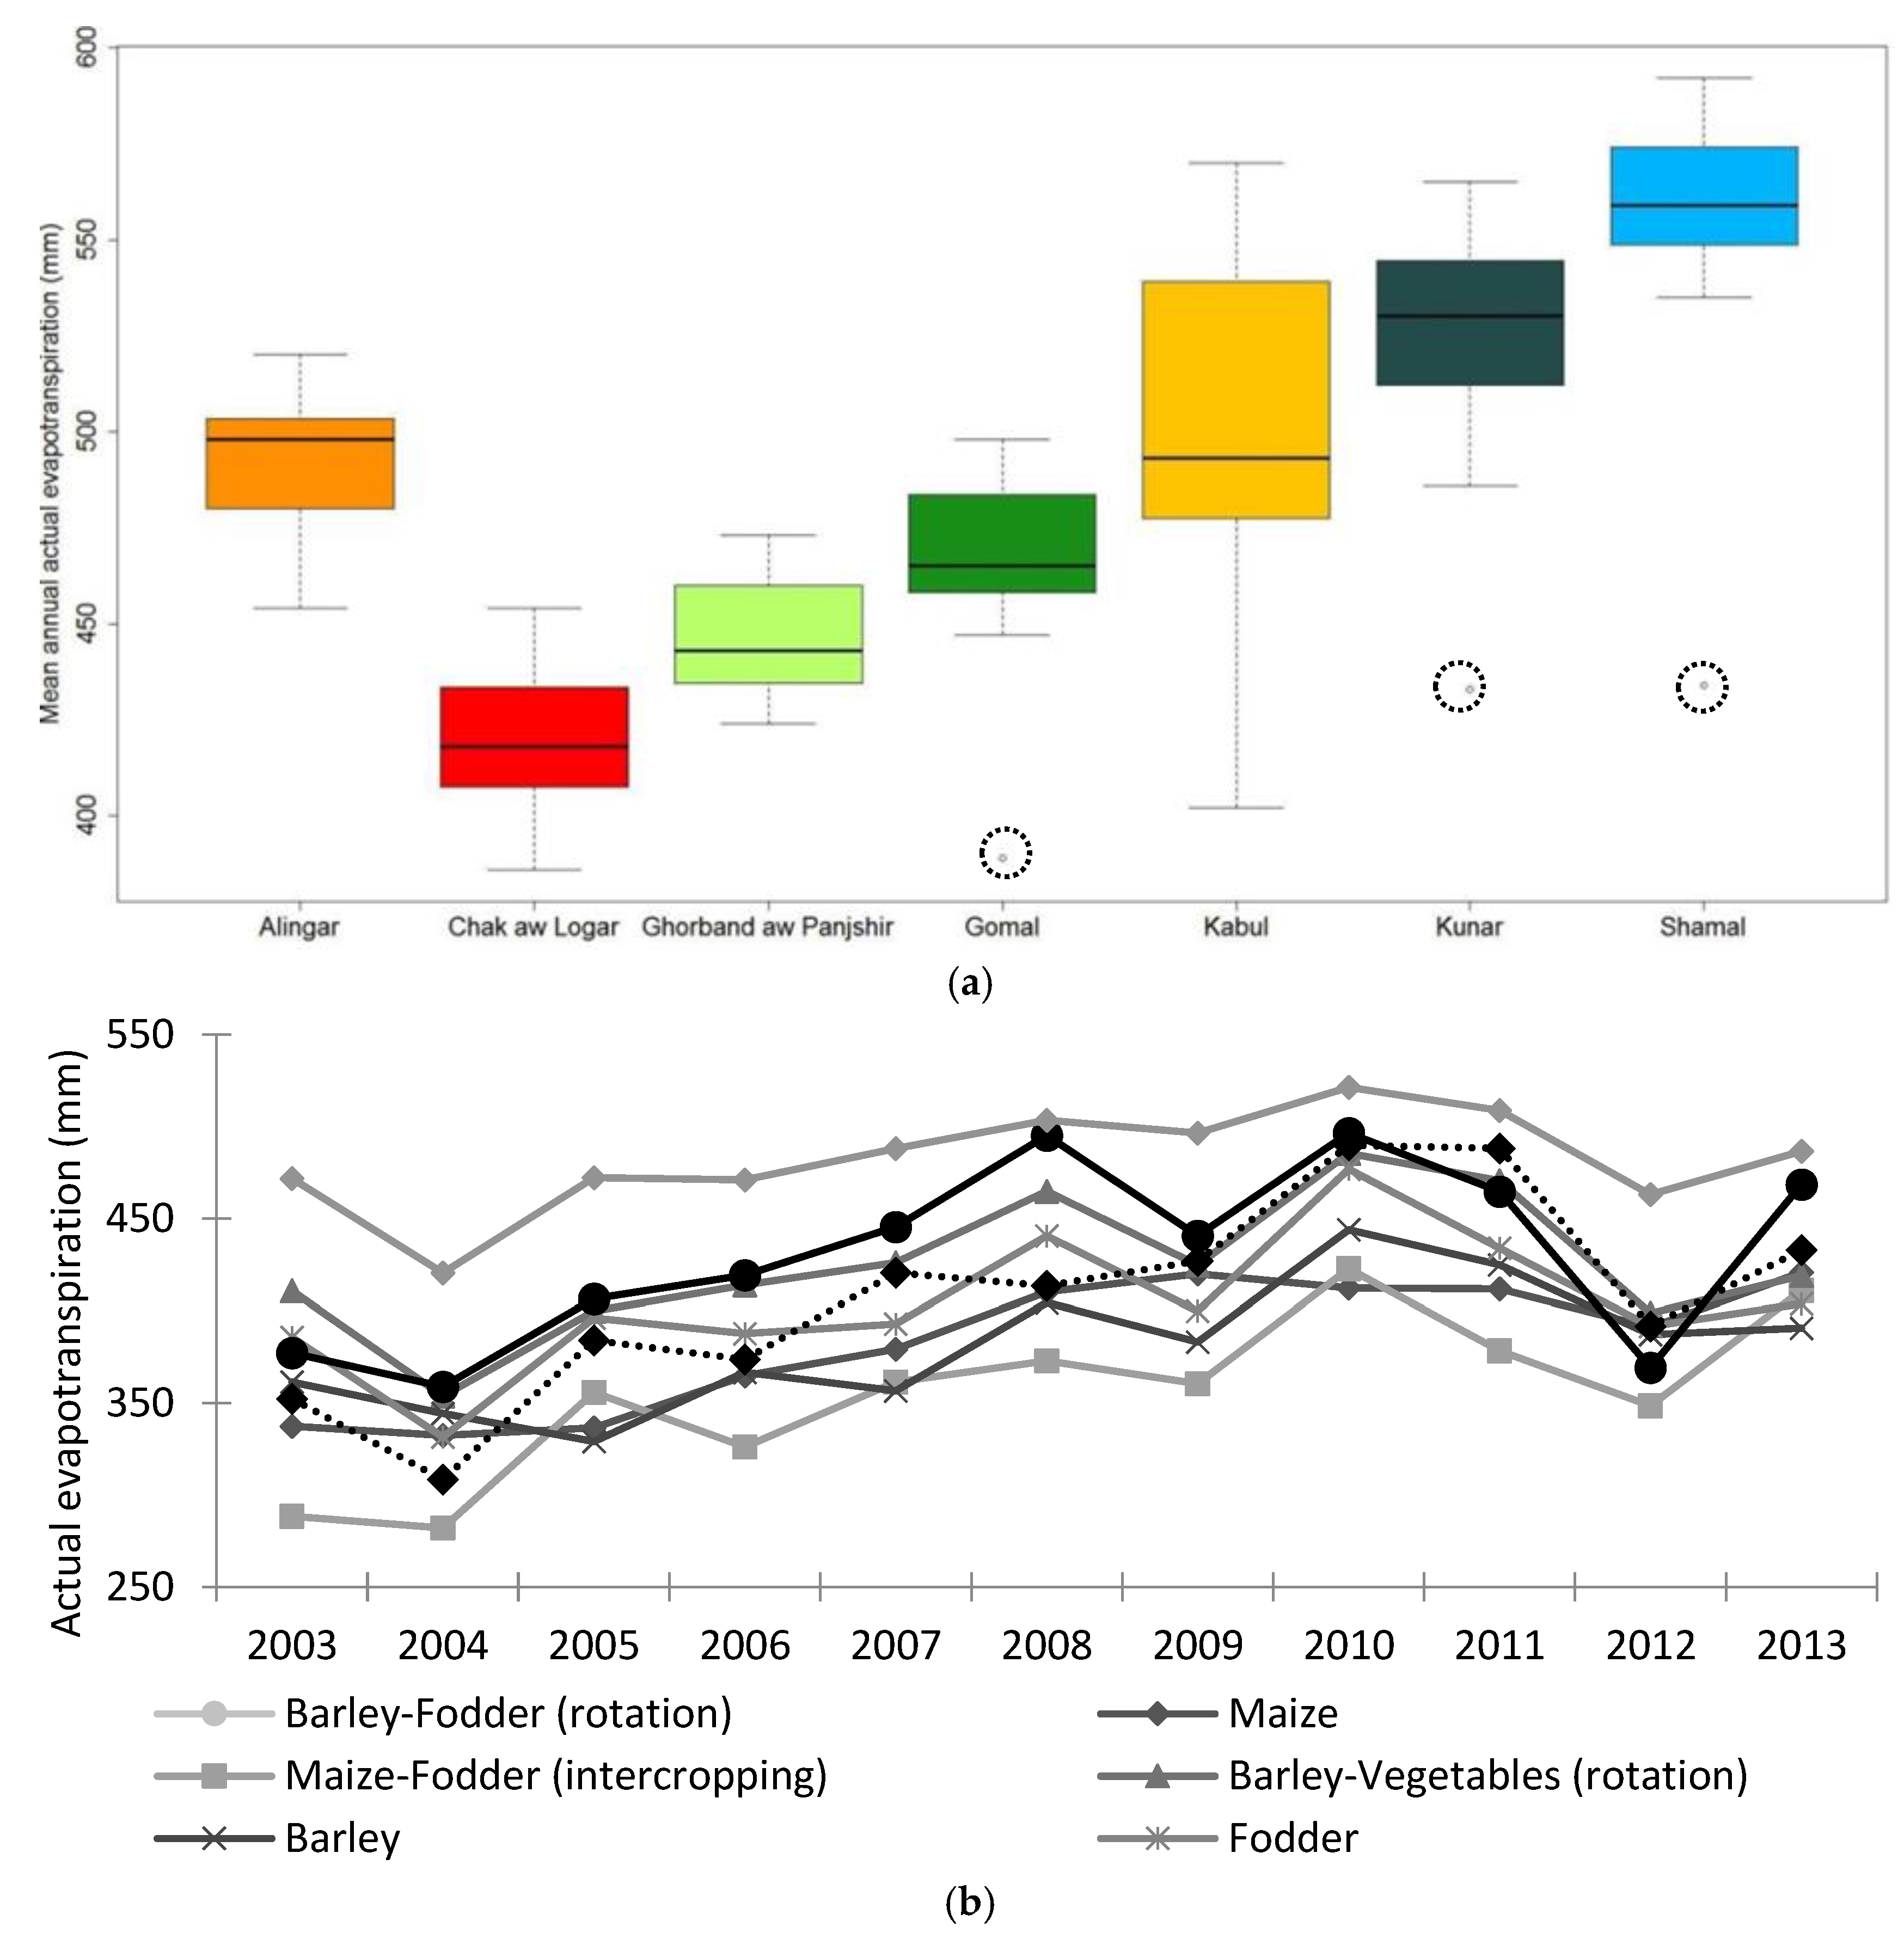
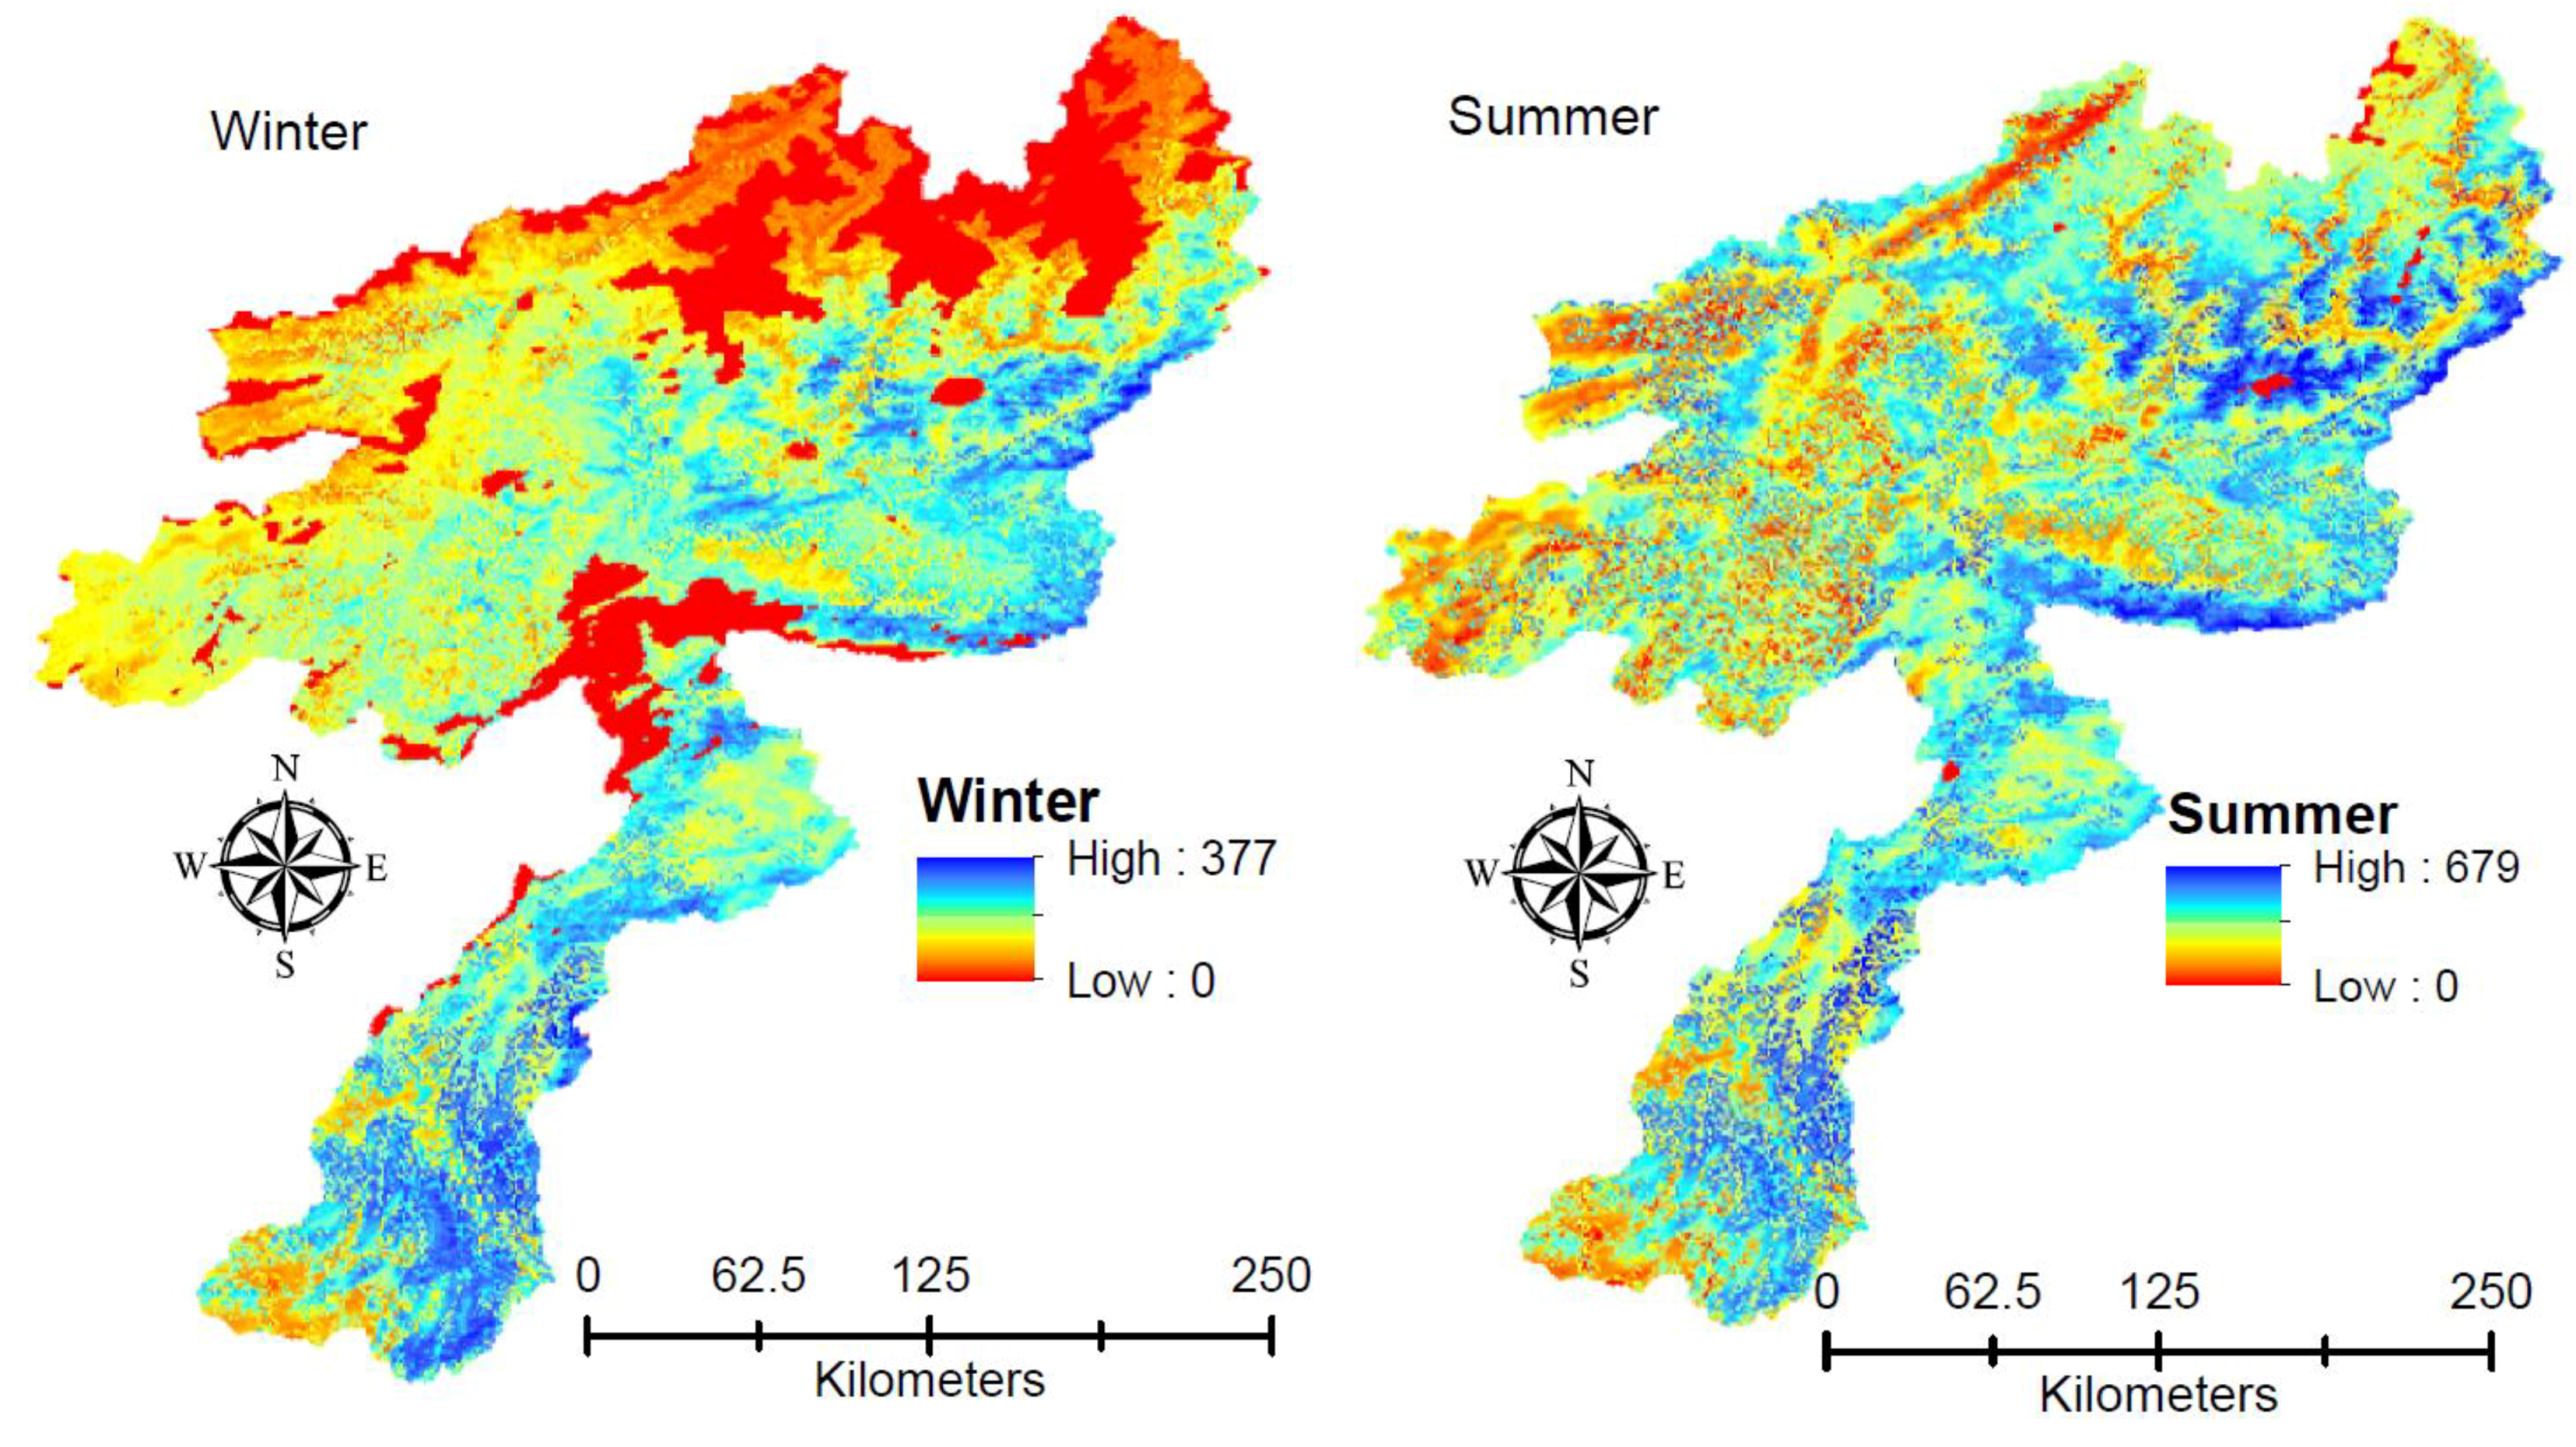
3.2. Annual Distribution of Actual Evapotranspiration across the KRB, Constituent Sub-Basins and Provinces

There is around 9% increment in the mean annual ETa of KRB from 2003 to 2013, with around 2% of agricultural land cover expansion across the KRB [16]. The LULC analysis, as well as the secondary data [57], shows that from 2003 until 2013 there was increase in the cultivation of wheat and rice across the country, which are the main staple foods in Afghanistan. The minimum mean annual ETa was estimated for the Chak aw Logar sub-basin (i.e., 420 ± 21 mm), where the relatively higher standard deviation has been driven by the drought conditions in 2004 that caused a drop of 19% in the ETa in the Shamal sub-basin in comparison to the annual ETa in the preceding year (i.e., 2003). In comparison to 2003, Kunar sub-basin experienced the highest increase (13%) in the mean annual ETa, while Alingar experienced the least increase (4%). The outliers in the box-plot (Figure 5a) for the Shamal, Kunar, and Gomal subbasins show the effects of drought in 2004, which were relatively dominant in the mentioned sub-basins. In reference to 2003, the Nangarhar province experienced the highest increase in the ETa (15%) in 2013, followed by the Khost province (i.e., 12%), while the Paktya province experienced approximately an 8% reduction. The reason for the increase in the Nangarhar and Khost provinces could be attributed to infrastructural development leading to irrigated land area enhancement as well as the resultant increased crop rotation compared to a decade earlier, while the reduction of ETa in the Paktya province is perhaps due to the reduced water supply for irrigation purpose.

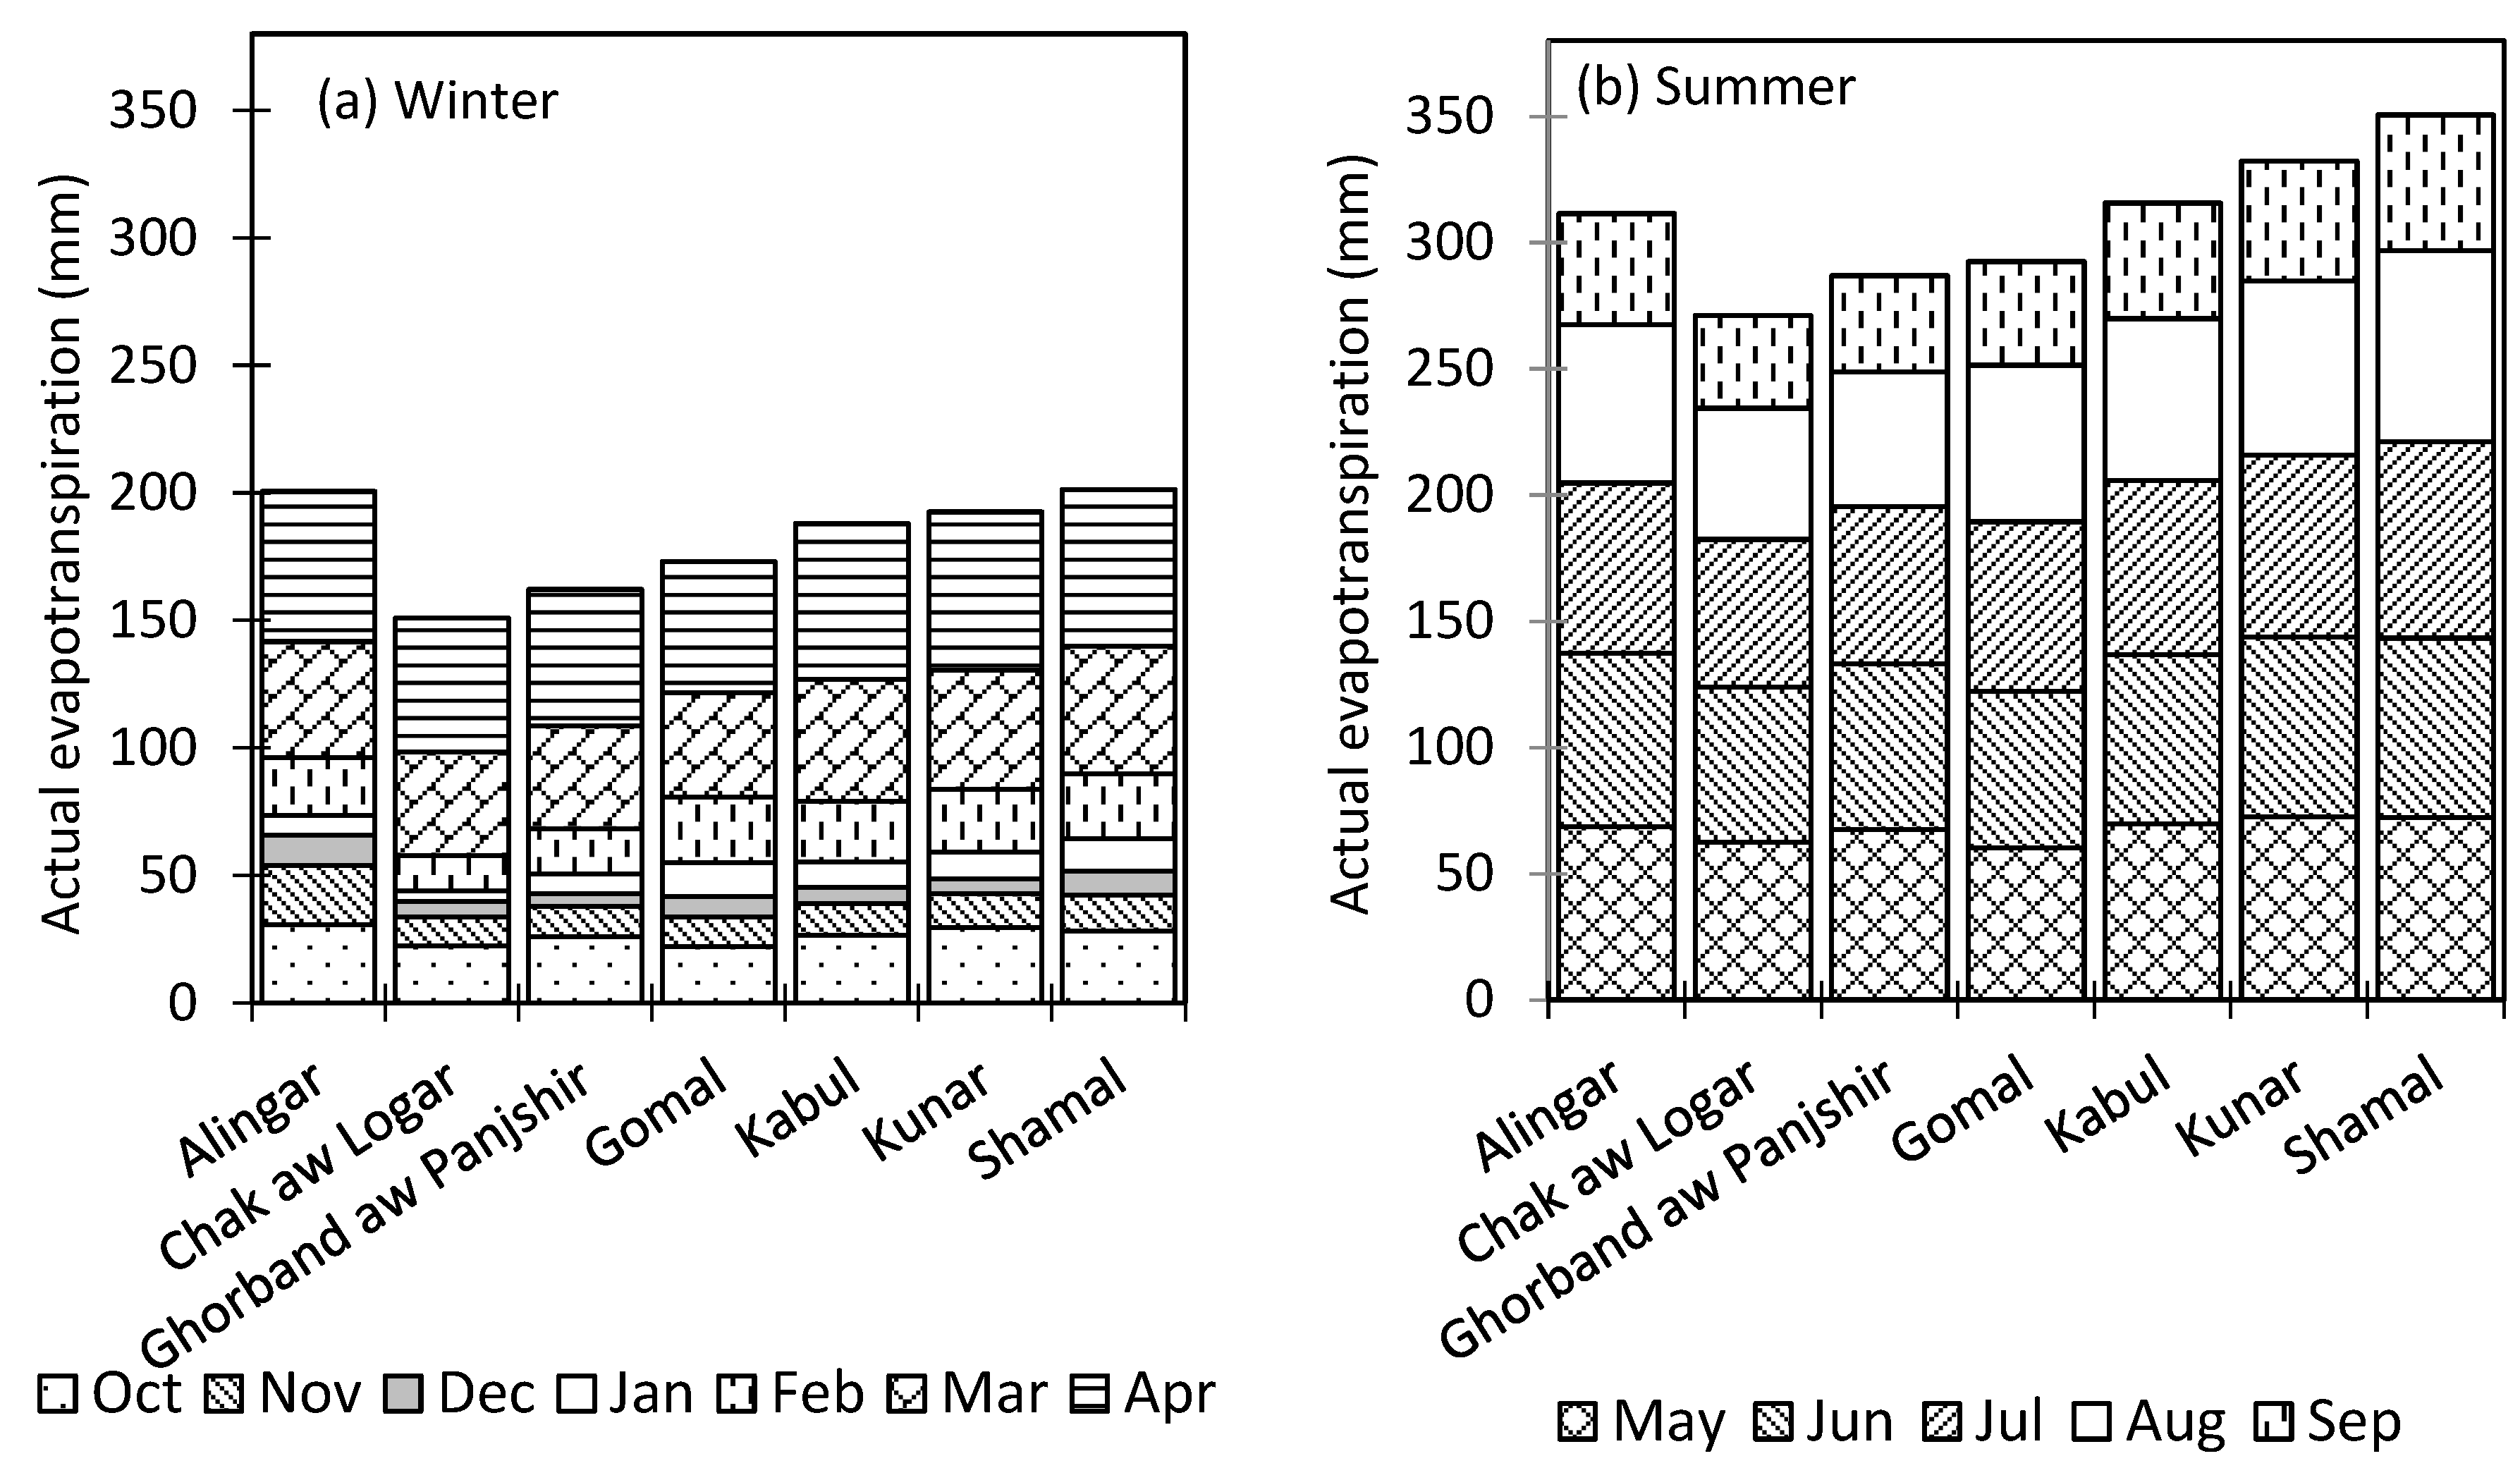
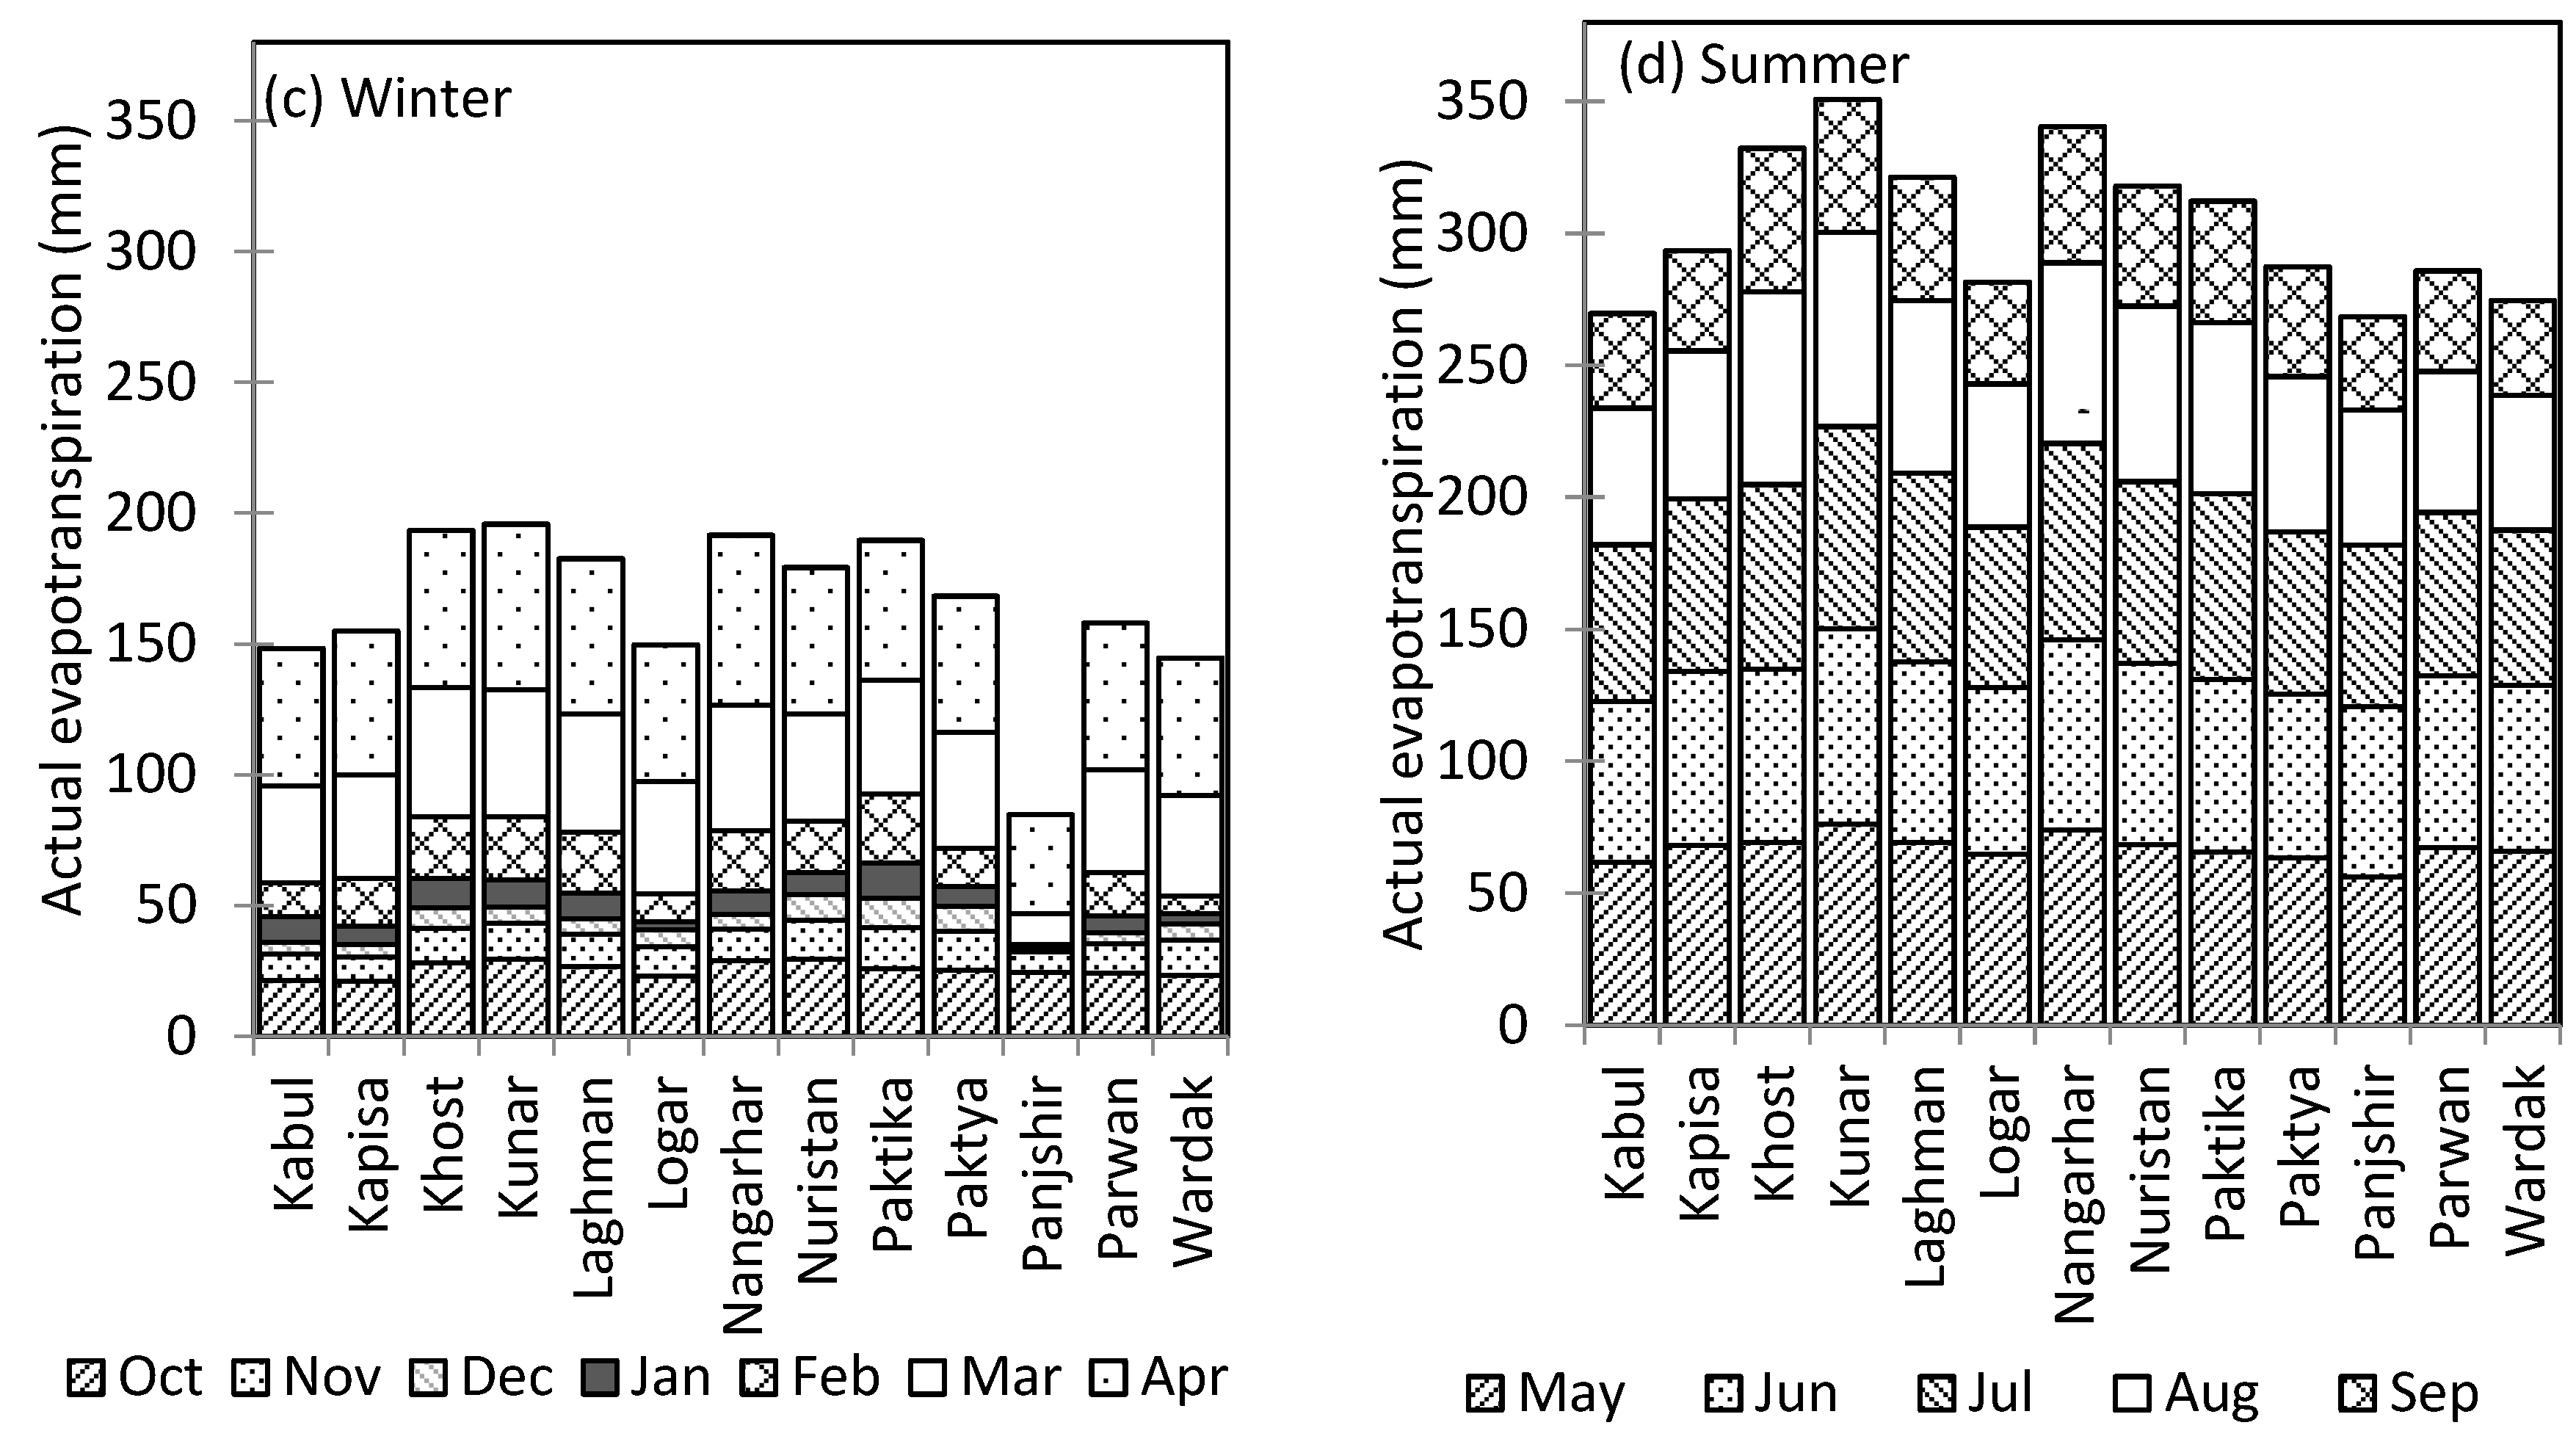
3.3. Monthly Distribution of Actual Evapotranspiration Across the KRB, Constituent Sub-Basins and Provinces

The mean annual ETa shows that the usual highest values of ETa across the KRB are in the months of May–July, which are around 70 ± 1.6 mm. The seasonal variability in the ETa in the summer season (May–September) across the KRB stays almost consistent with a seasonal mean ETa of 333 ± 19 mm. Overall, the least monthly mean ETa for the month of January and December across all the sub-basins was 9 ± 3 mm) and (7 ± 1 mm), respectively (Figure 6a,b).
The Panjshir province experienced the lowest mean ETa in the winter season during the study period (Figure 6c). Similarly the highest ETa in summer season among provinces was observed by Kunar and Nangarhar provinces due to their relatively easier access to river and canal water supplies (Figure 6d). Contrary to these estimations, another study [58] estimated 570 mm as the seasonal ETa (May–September) being an average of 3 years (2003–2005) for which the estimate of the current study for the very period is about 259 mm. The high level of ETa estimations in the Kabul province by another study [58] may be due to the tendency of SSEB’s overestimation of ETa, both at the local and regional scales, probably due to rainfall contributions and abundant soil moisture that naturally supplement crop water needs [59].
A routine inter-seasonal comparison of ETa in summer and winter shows a higher range of ETa in summer 2013 compared to that in the winters of 2012–2013 (Figure 7). The reasons for this include the peak irrigation demand, favorable meteorological conditions for crop growth, diversity and abundance of crops, and the vegetables and fruit orchards mostly in the summer season while winter is limited to fewer crops and is mostly dominated by wheat and barley, etc.

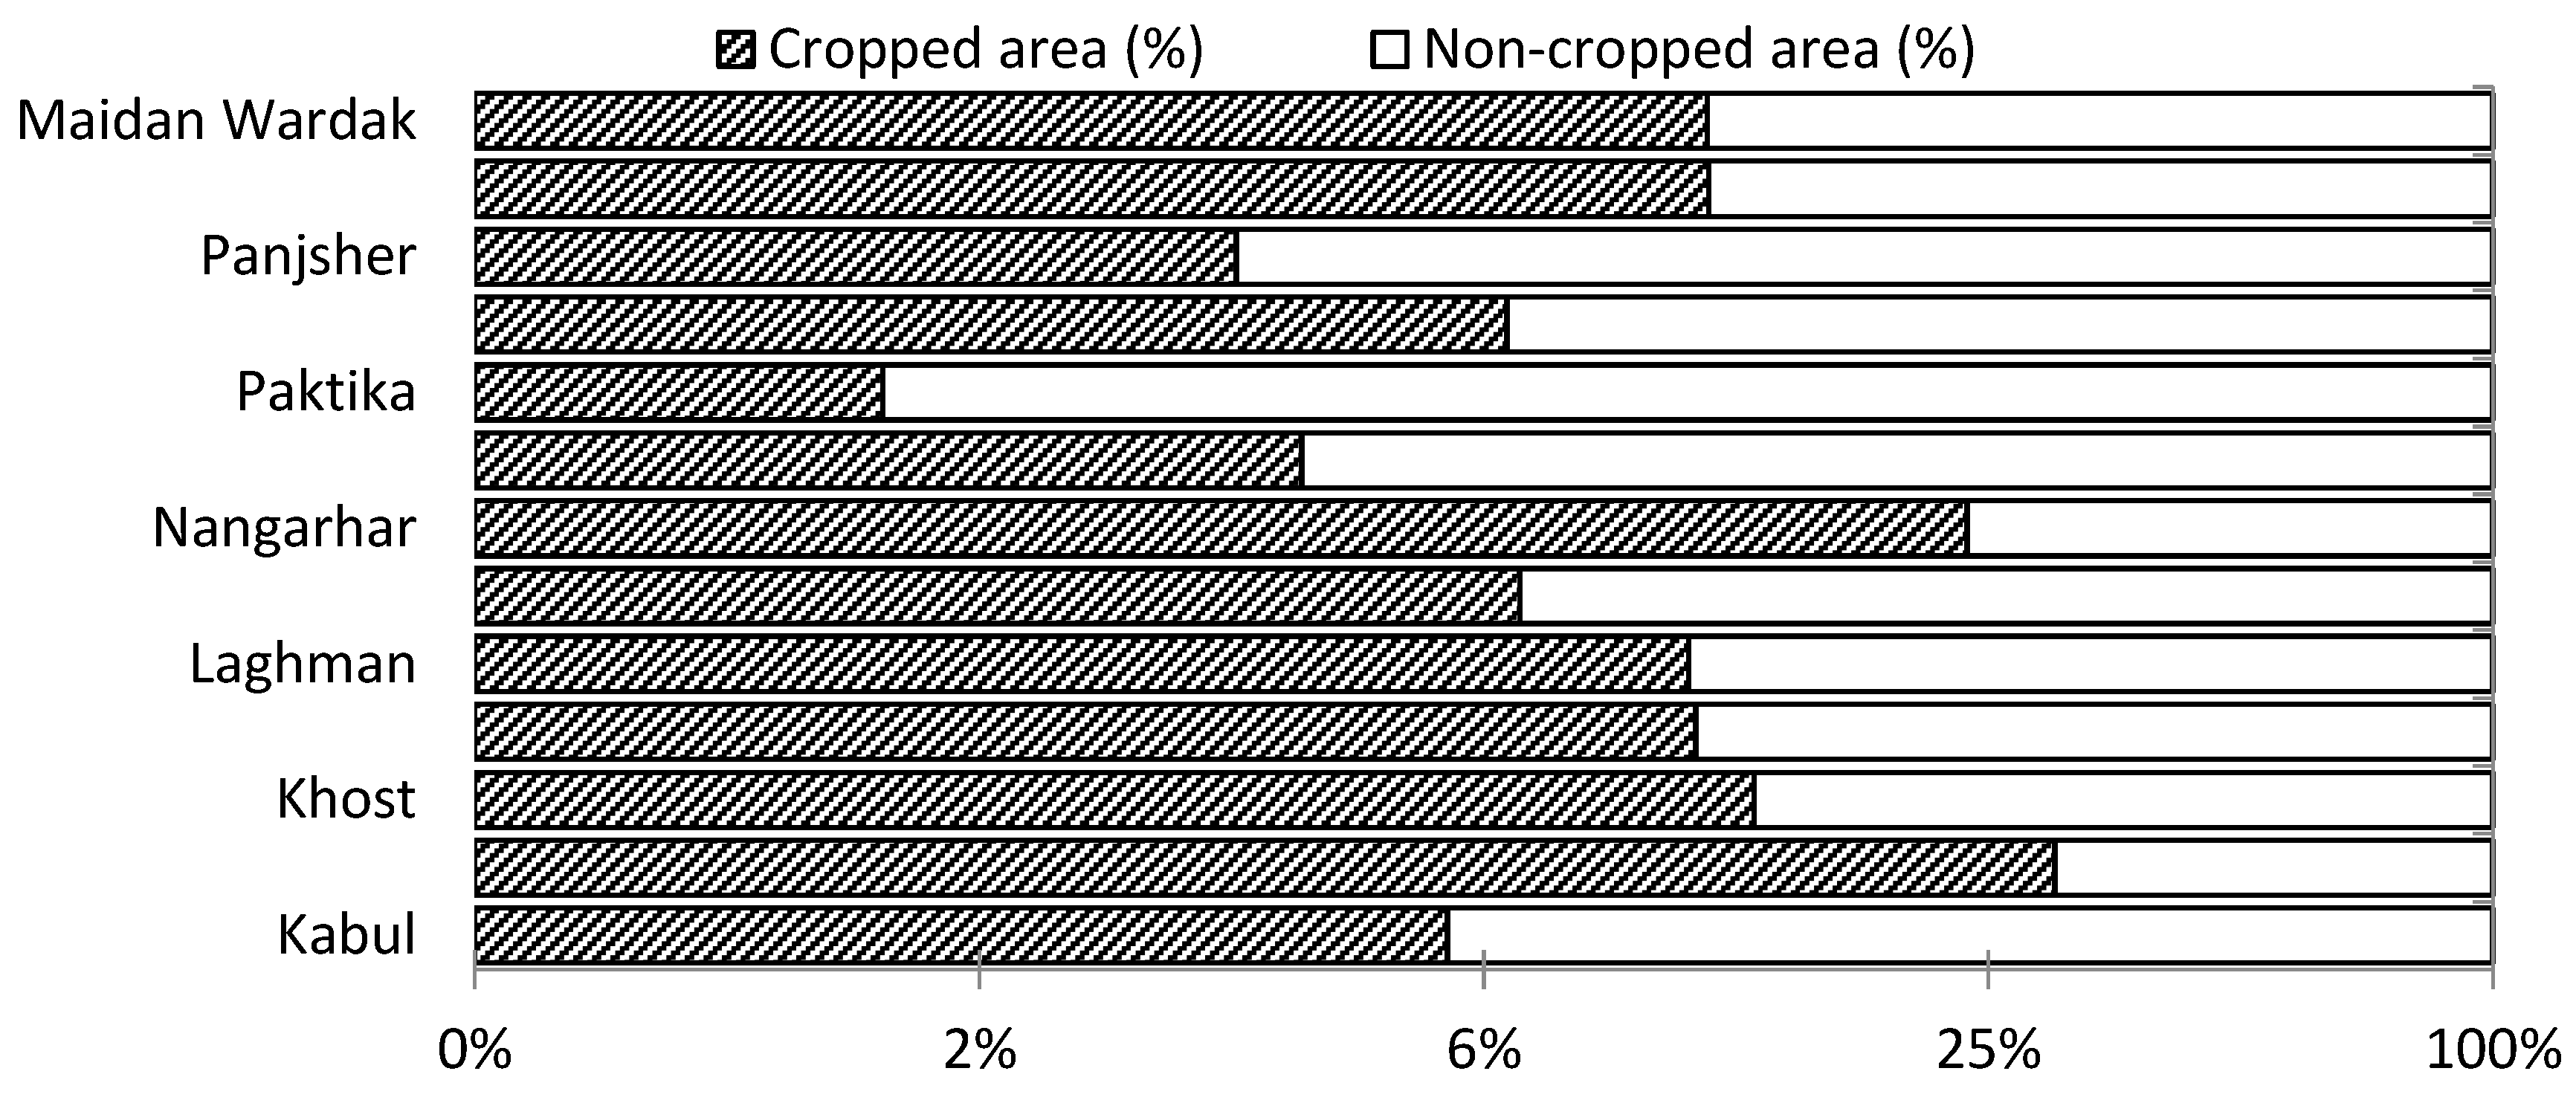
3.4. Land Cover Based Variation of ETa Across the KRB

The land cover-based ETa results (Figure 5b) show a high ETa in the areas with maximum precipitation, which usually falls in the months of November to March, and has been used in the peak irrigation period with various frequencies. Among crops, wheat is the highly consumed and cultivated crop across the KRB. It is normally cultivated in rotation with maize and rice mostly in the downstream of the KRB, dominantly on irrigated lands, while in the central KRB it is cultivated with fruit orchards, in contrast to the downstream regions. Therefore, from 2003–2013 the mean annual ETa of wheat-maize, wheat-rice, and wheat alone across the KRB was 377 ± 49, 472 ± 27, and 352 ± 54 mm, respectively. For wheat, the results from the neighboring Uzbekistan showed the ETa values for wheat to be 397 mm [60].

3.5. Evaluation of the Results of Mann-Kendall Test for Monotonic Trend in Temperature

The Mann-Kendall test has been used for the statistical analyses of trend detection in temperature data from 2003 to 2013 (11 years). It was observed that there is no significance trend found in the temperature time series data of the KRB that could possibly influence the monthly ETa values in a trending way. The resultant mean P-value for the entire study period was 0.53, greater than the significance level (α = 0.05) that lead us to accept the null hypothesis (H0) (Table 3).

3.6. Evaluation of the Irrigation Performance

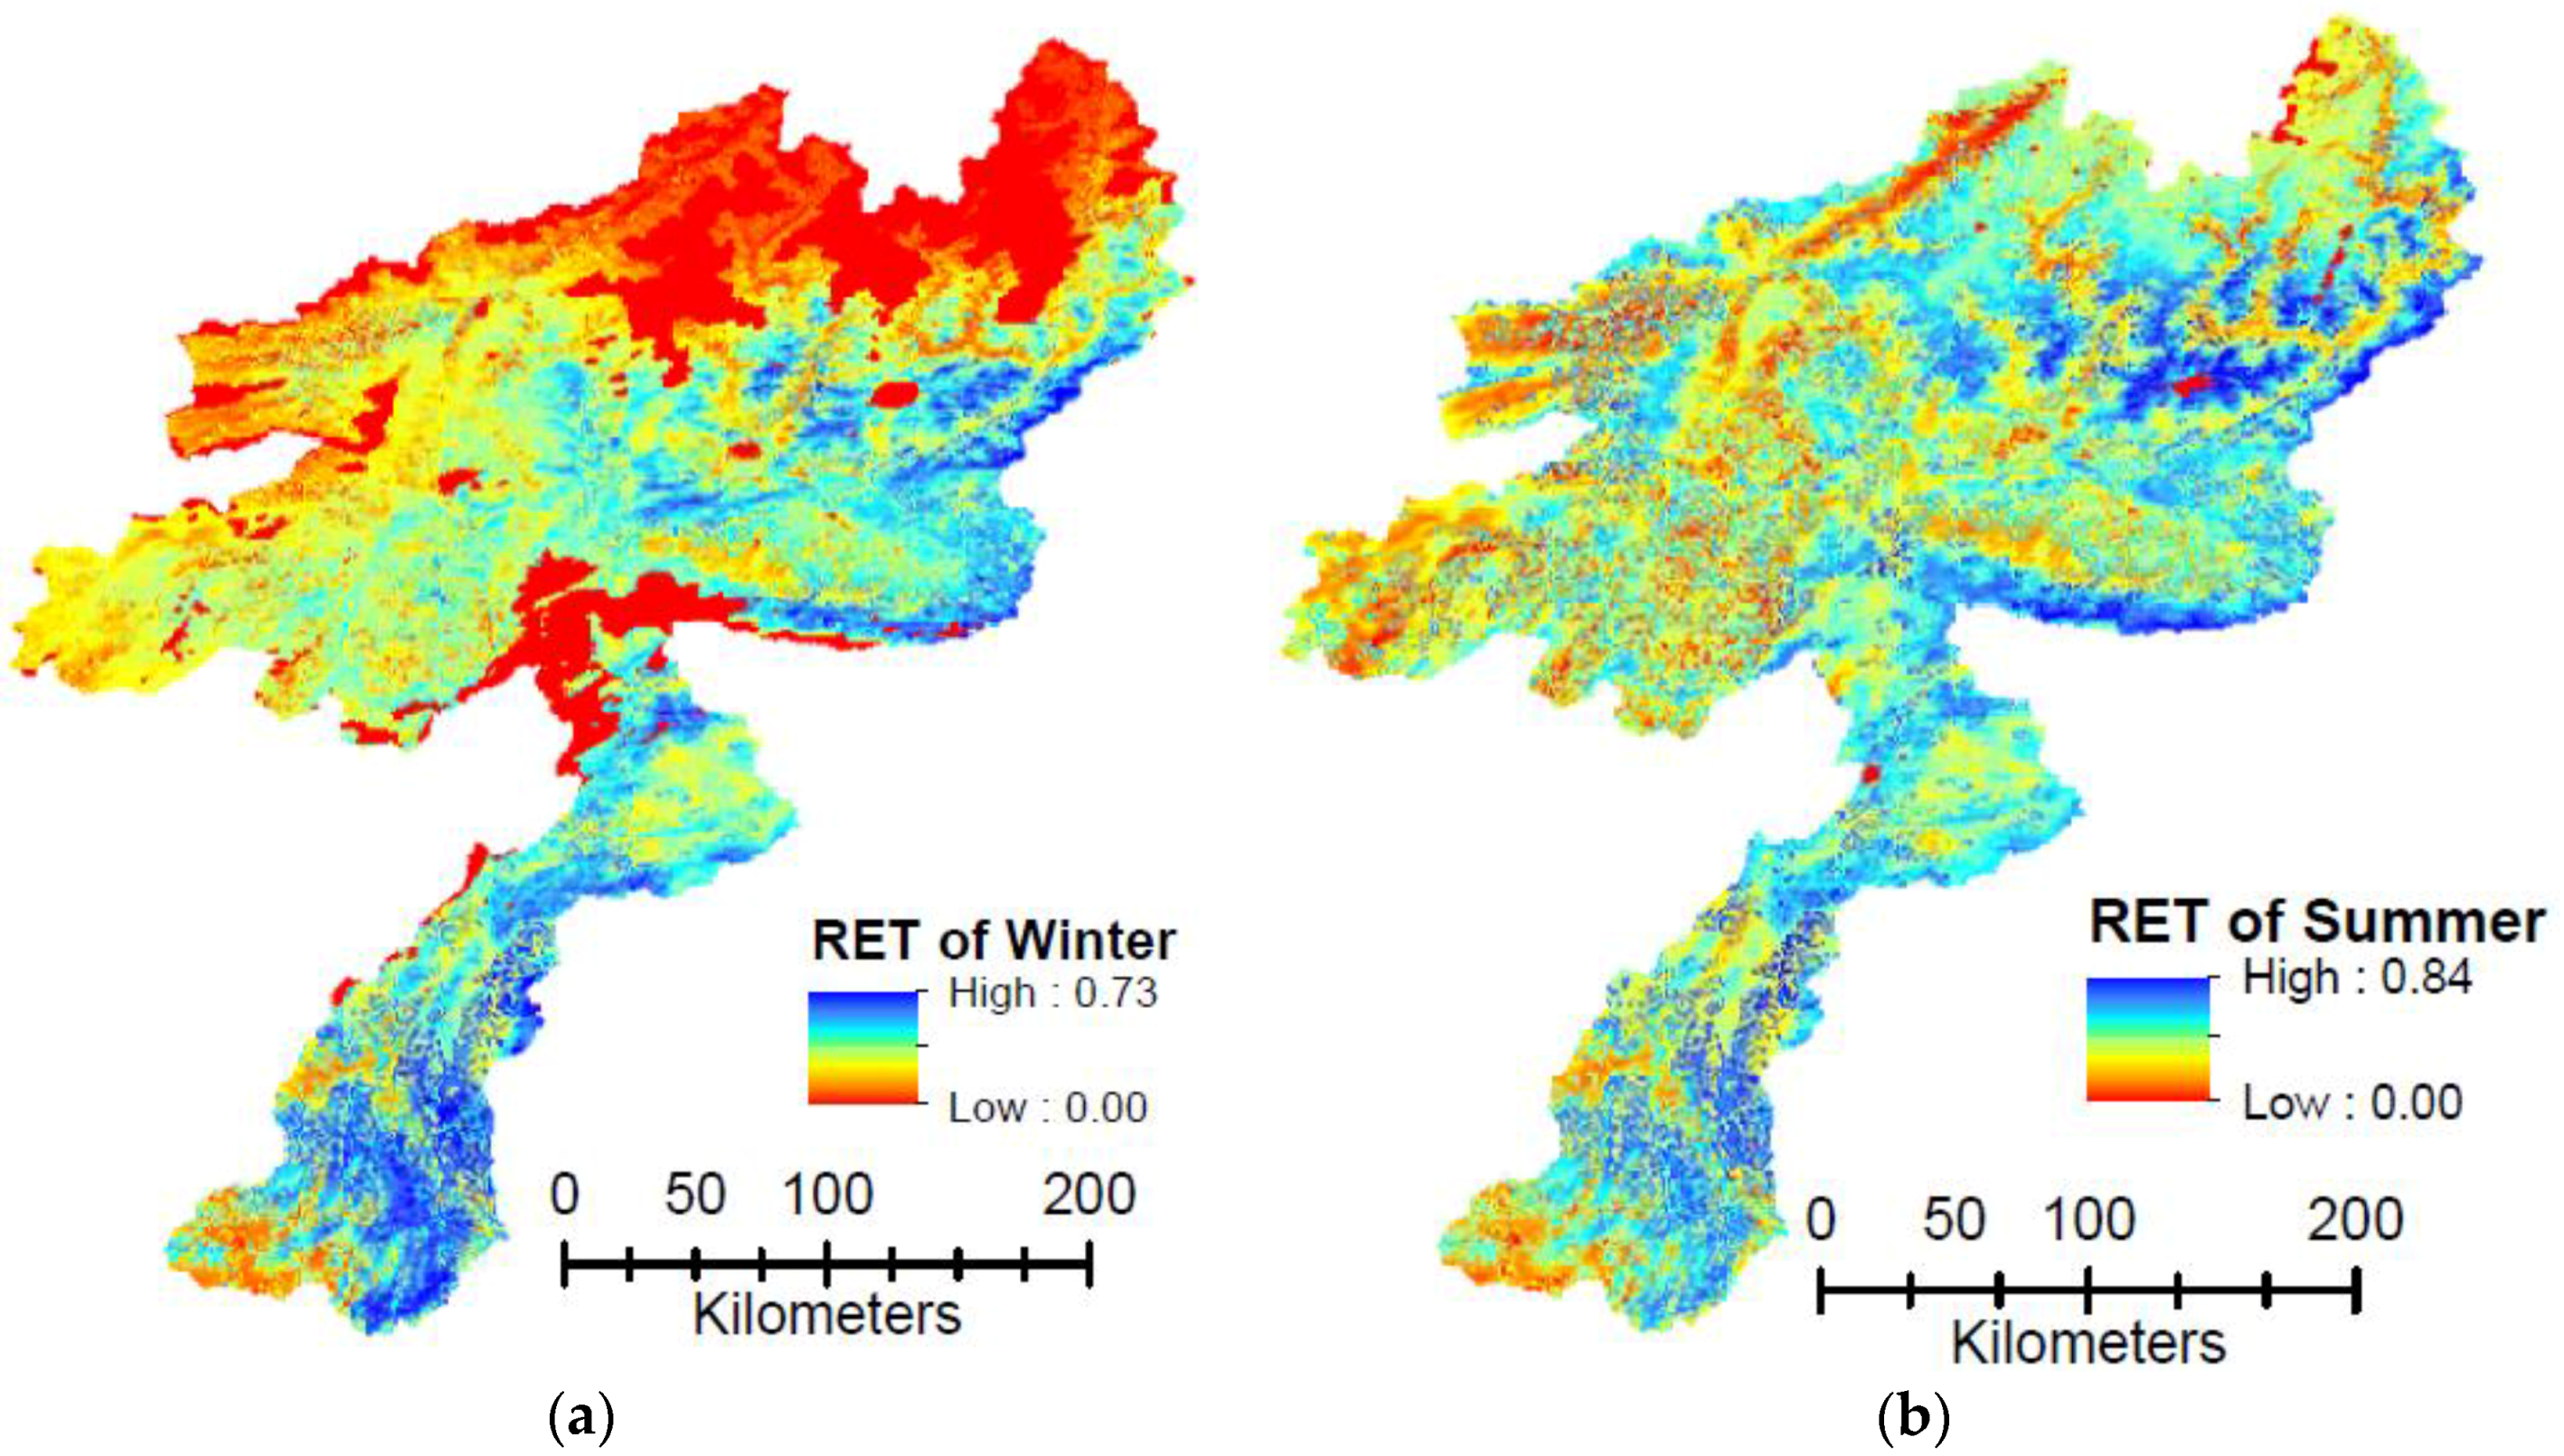
3.6.1. Analysis of Spatial Equity

A recent study in the KRB [16] shows that the ratio of cropped to non-cropped area varies substantially among different provinces and sub-basins. Thus, comparing the ETa for total area by considering cropped and non-cropped areas between the provinces and sub-basins will be misleading. We, therefore, delineated the cropped area from the non-cropped area and hence used the ETa from the cropped area among different provinces. (Figure 8). Moreover, different cropping patterns in different sub units would result in different RET values and hence the comparison of adequacy will be misleading. However, the irrigation system of KRB is supply-based rather than demand-based. The supply-based irrigation system provides a thin layer of an equal amount of water to different sub units regardless of the cropping pattern [15]. Therefore, the limited and equitable water amounts to all sub units restricting the farmers to grow similar crops. The results of [16] also show that the cropping patterns in KRB do not vary substantially in different sub-basins and provinces.
The results in Figure 9 show that, generally, in winter seasons the CV of mean the ETa in the months of October to January are the least (0.09 ± 0.04) for all the sub-basins, which shows that greater equity exists among the sub-basins during the colder months of the year where there is no irrigation required. The highest CV was assessed for Chak aw Logar (0.41) in the month of February, followed by the second highest CV in the Shamal (0.35) and Kabul (0.33) sub-basins during the peak irrigation period (e.g., in the month of April) (Figure 9a). The reason behind the highest CV in the month of February is the earlier season warm up and raised temperatures that melt down the snow and contribute to the irrigation period. The high CV values for the Kabul and Shamal sub-basins are perhaps due to the steady melting of the snow packs on the tops and contributions to the peak irrigation season, which is usually from February to May.
Moreover, this sub-basin hosts the most irrigated area compared to the remaining sub-basins of the KRB. During summer seasons, there is high inequity in the Kabul sub-basin compared to the others (Figure 9b). Similarly, the spatial variation of CV in the Panjshir province among the provincial units shows the highest CV for the months of October, November, and April (Figure 9c). Generally, the CV for areas with larger irrigation areas was higher than those with more rainfed agriculture, which shows high inequity among the spatial units of the KRB (Figure 9c,d).

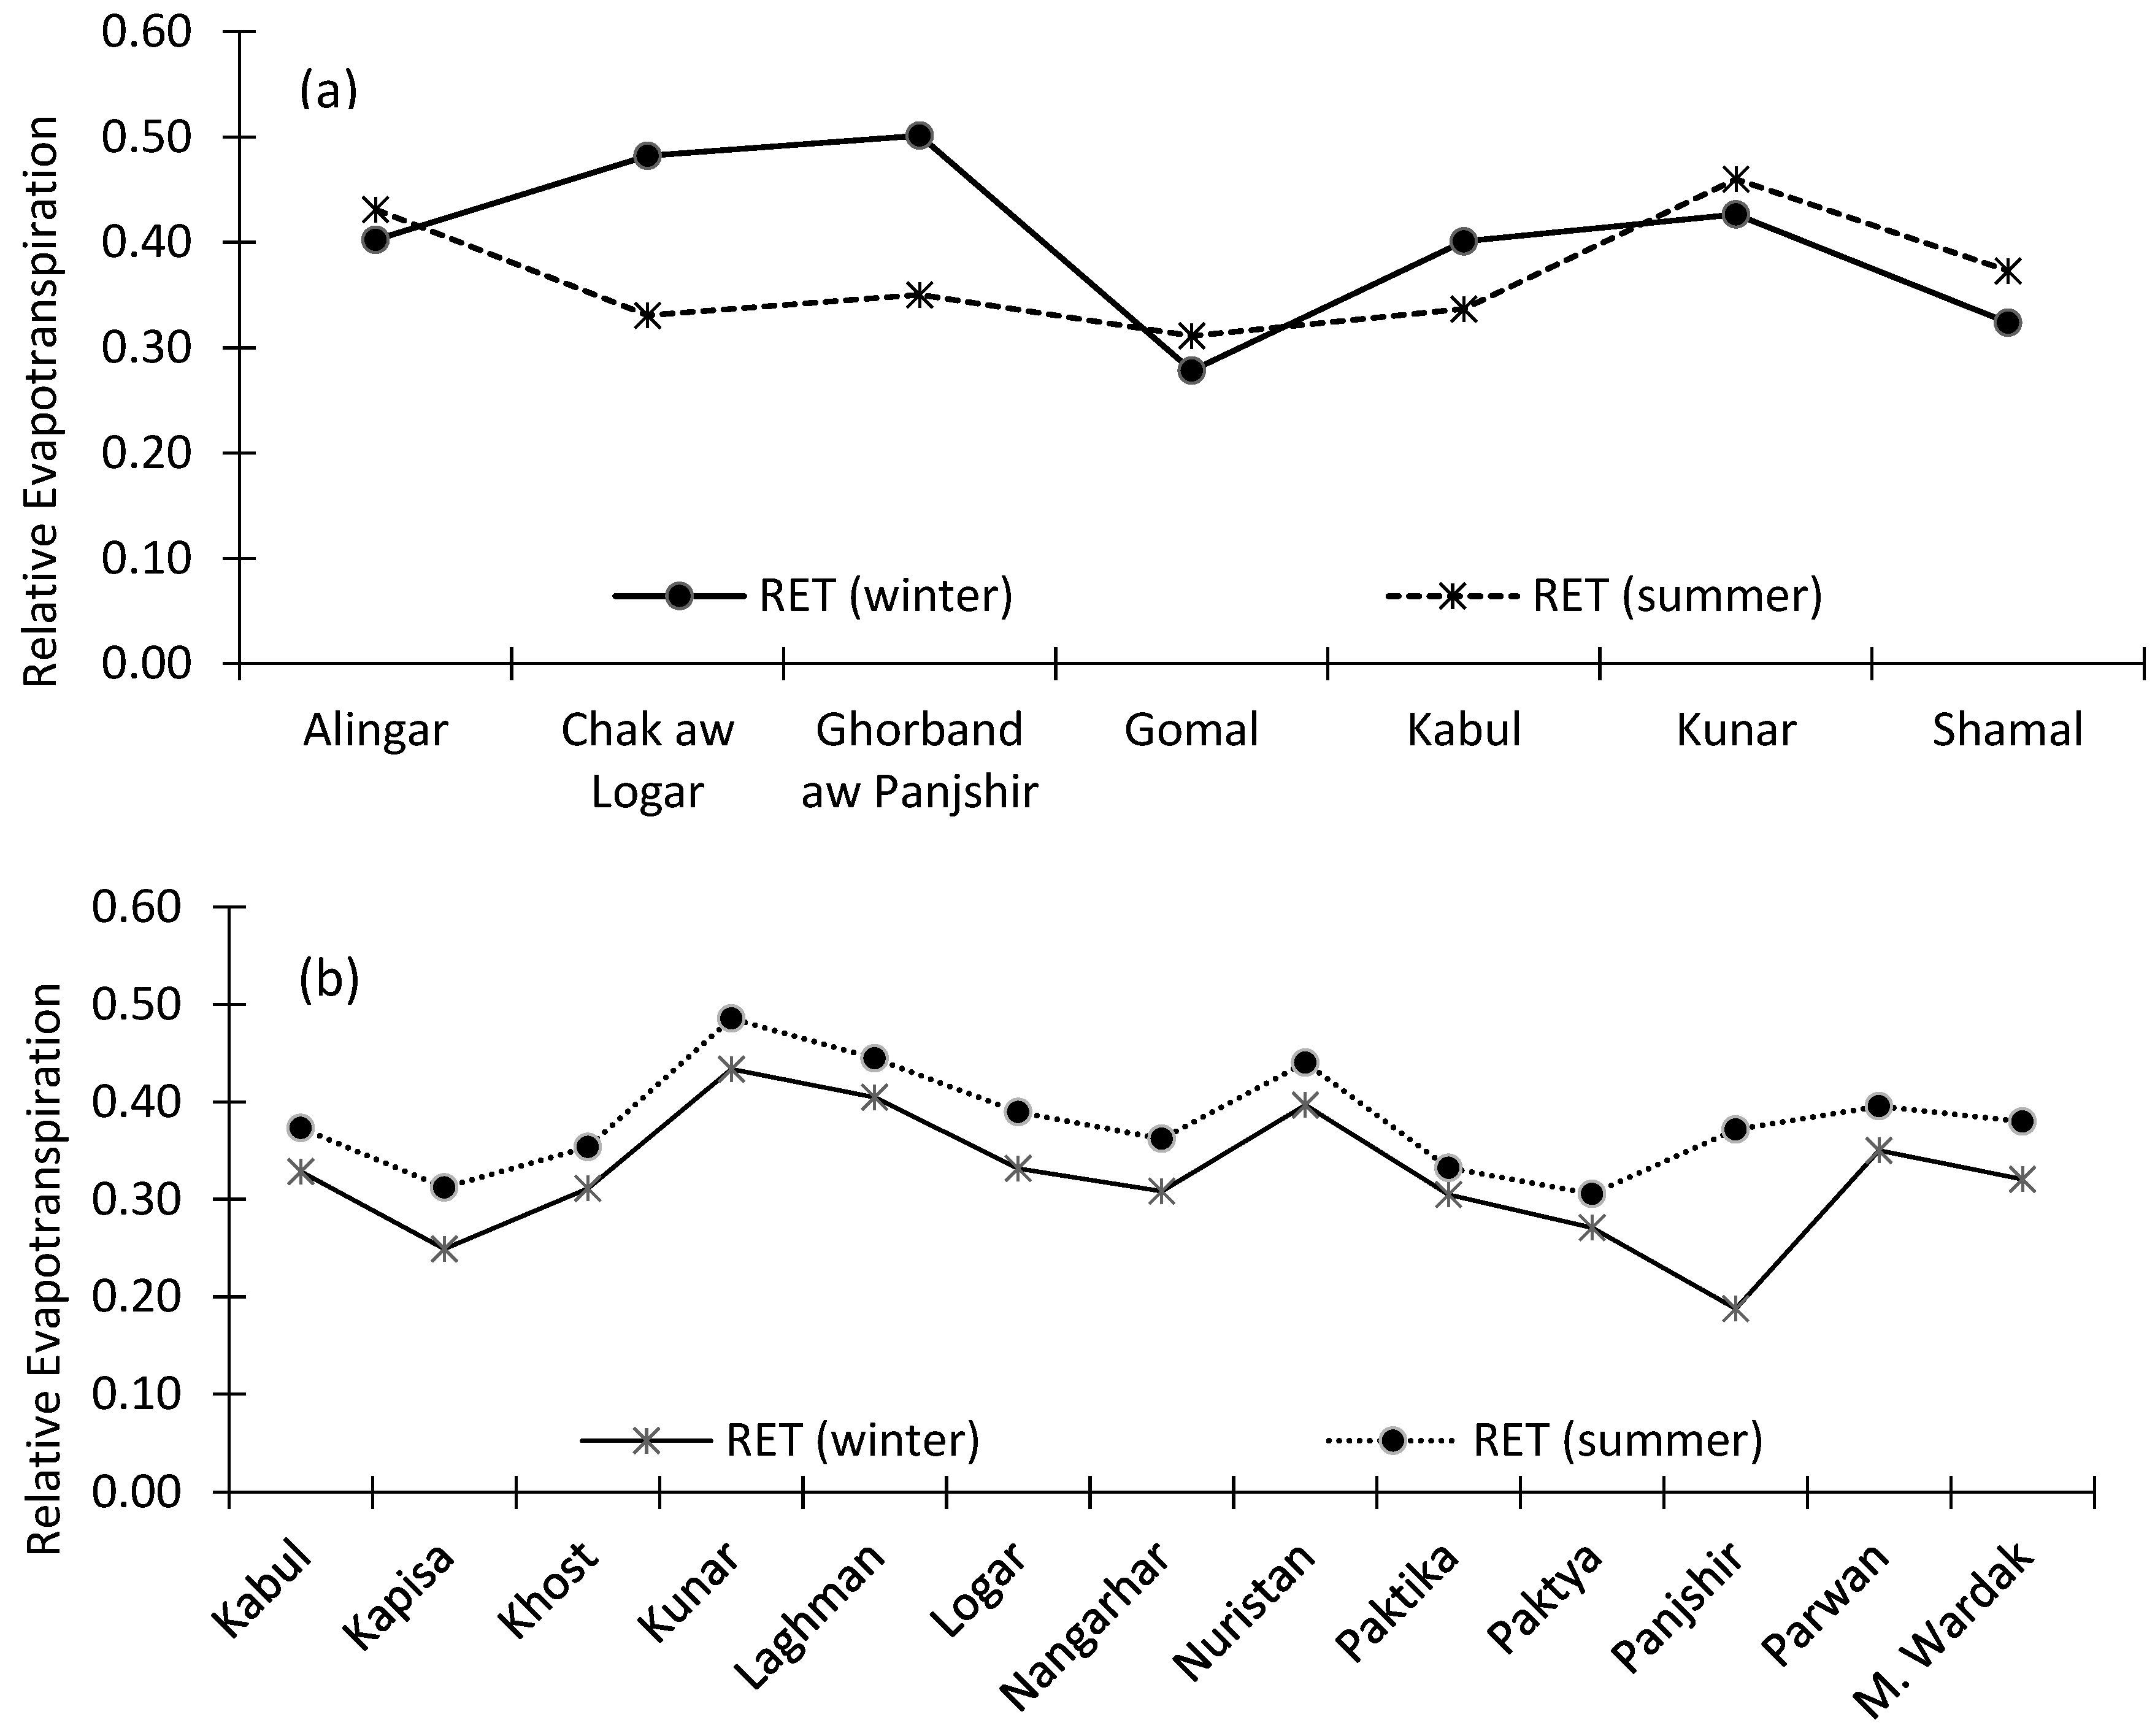
3.6.2. Analysis of Seasonal Adequacy

Throughout the KRB, the mean maximum RET for summer (May–September) and winter (October–April) was 0.84 and 0.73, respectively (Figure 10). In the irrigated parts of the KRB, the RET, estimated both for summer and winter, was below the critical value (i.e., RET ≤ 0.65). Similarly, in areas where ETa and ETc are closer to each other (RET > 0.65), they are elevated at higher altitudes with either snow cover or otherwise forested.
For winter season, the highest RET for Ghorband aw Panjshir and Chak aw Logar sub-basins was 0.50 and 0.48, respectively, while the lowest RET was in the Gomal sub-basin (i.e., 0.28) (Figure 11). The reason for the higher RET in the Ghorband, Panjshir, and Chak aw Logar sub-basins might be the lower temperatures, and also low irrigation that is a consequence of the early stages of crop development with low water demand.
Overall, the RET for the winter season is higher than that of in summer. For the summer season the highest RET values were experienced by the Kunar and Alingar sub-basins, which were 0.46 and 0.43, respectively. While for the remaining sub-basins the RET was in the range of almost 50% of the critical value of RET and include the following: Chak aw Logar (0.33), Ghorband aw Panjshir (0.35), Gomal (0.31), Kabul (0.34), and Shamal (0.37). The comparative higher RET in Kunar and Alingar could be attributed to the presence of the less irrigated areas compared to the rest because the Kabul sub-basin hosts the highest irrigated land area compared to the rest and therefore stays under stress during the peak irrigation season, which takes place from month of April onwards.

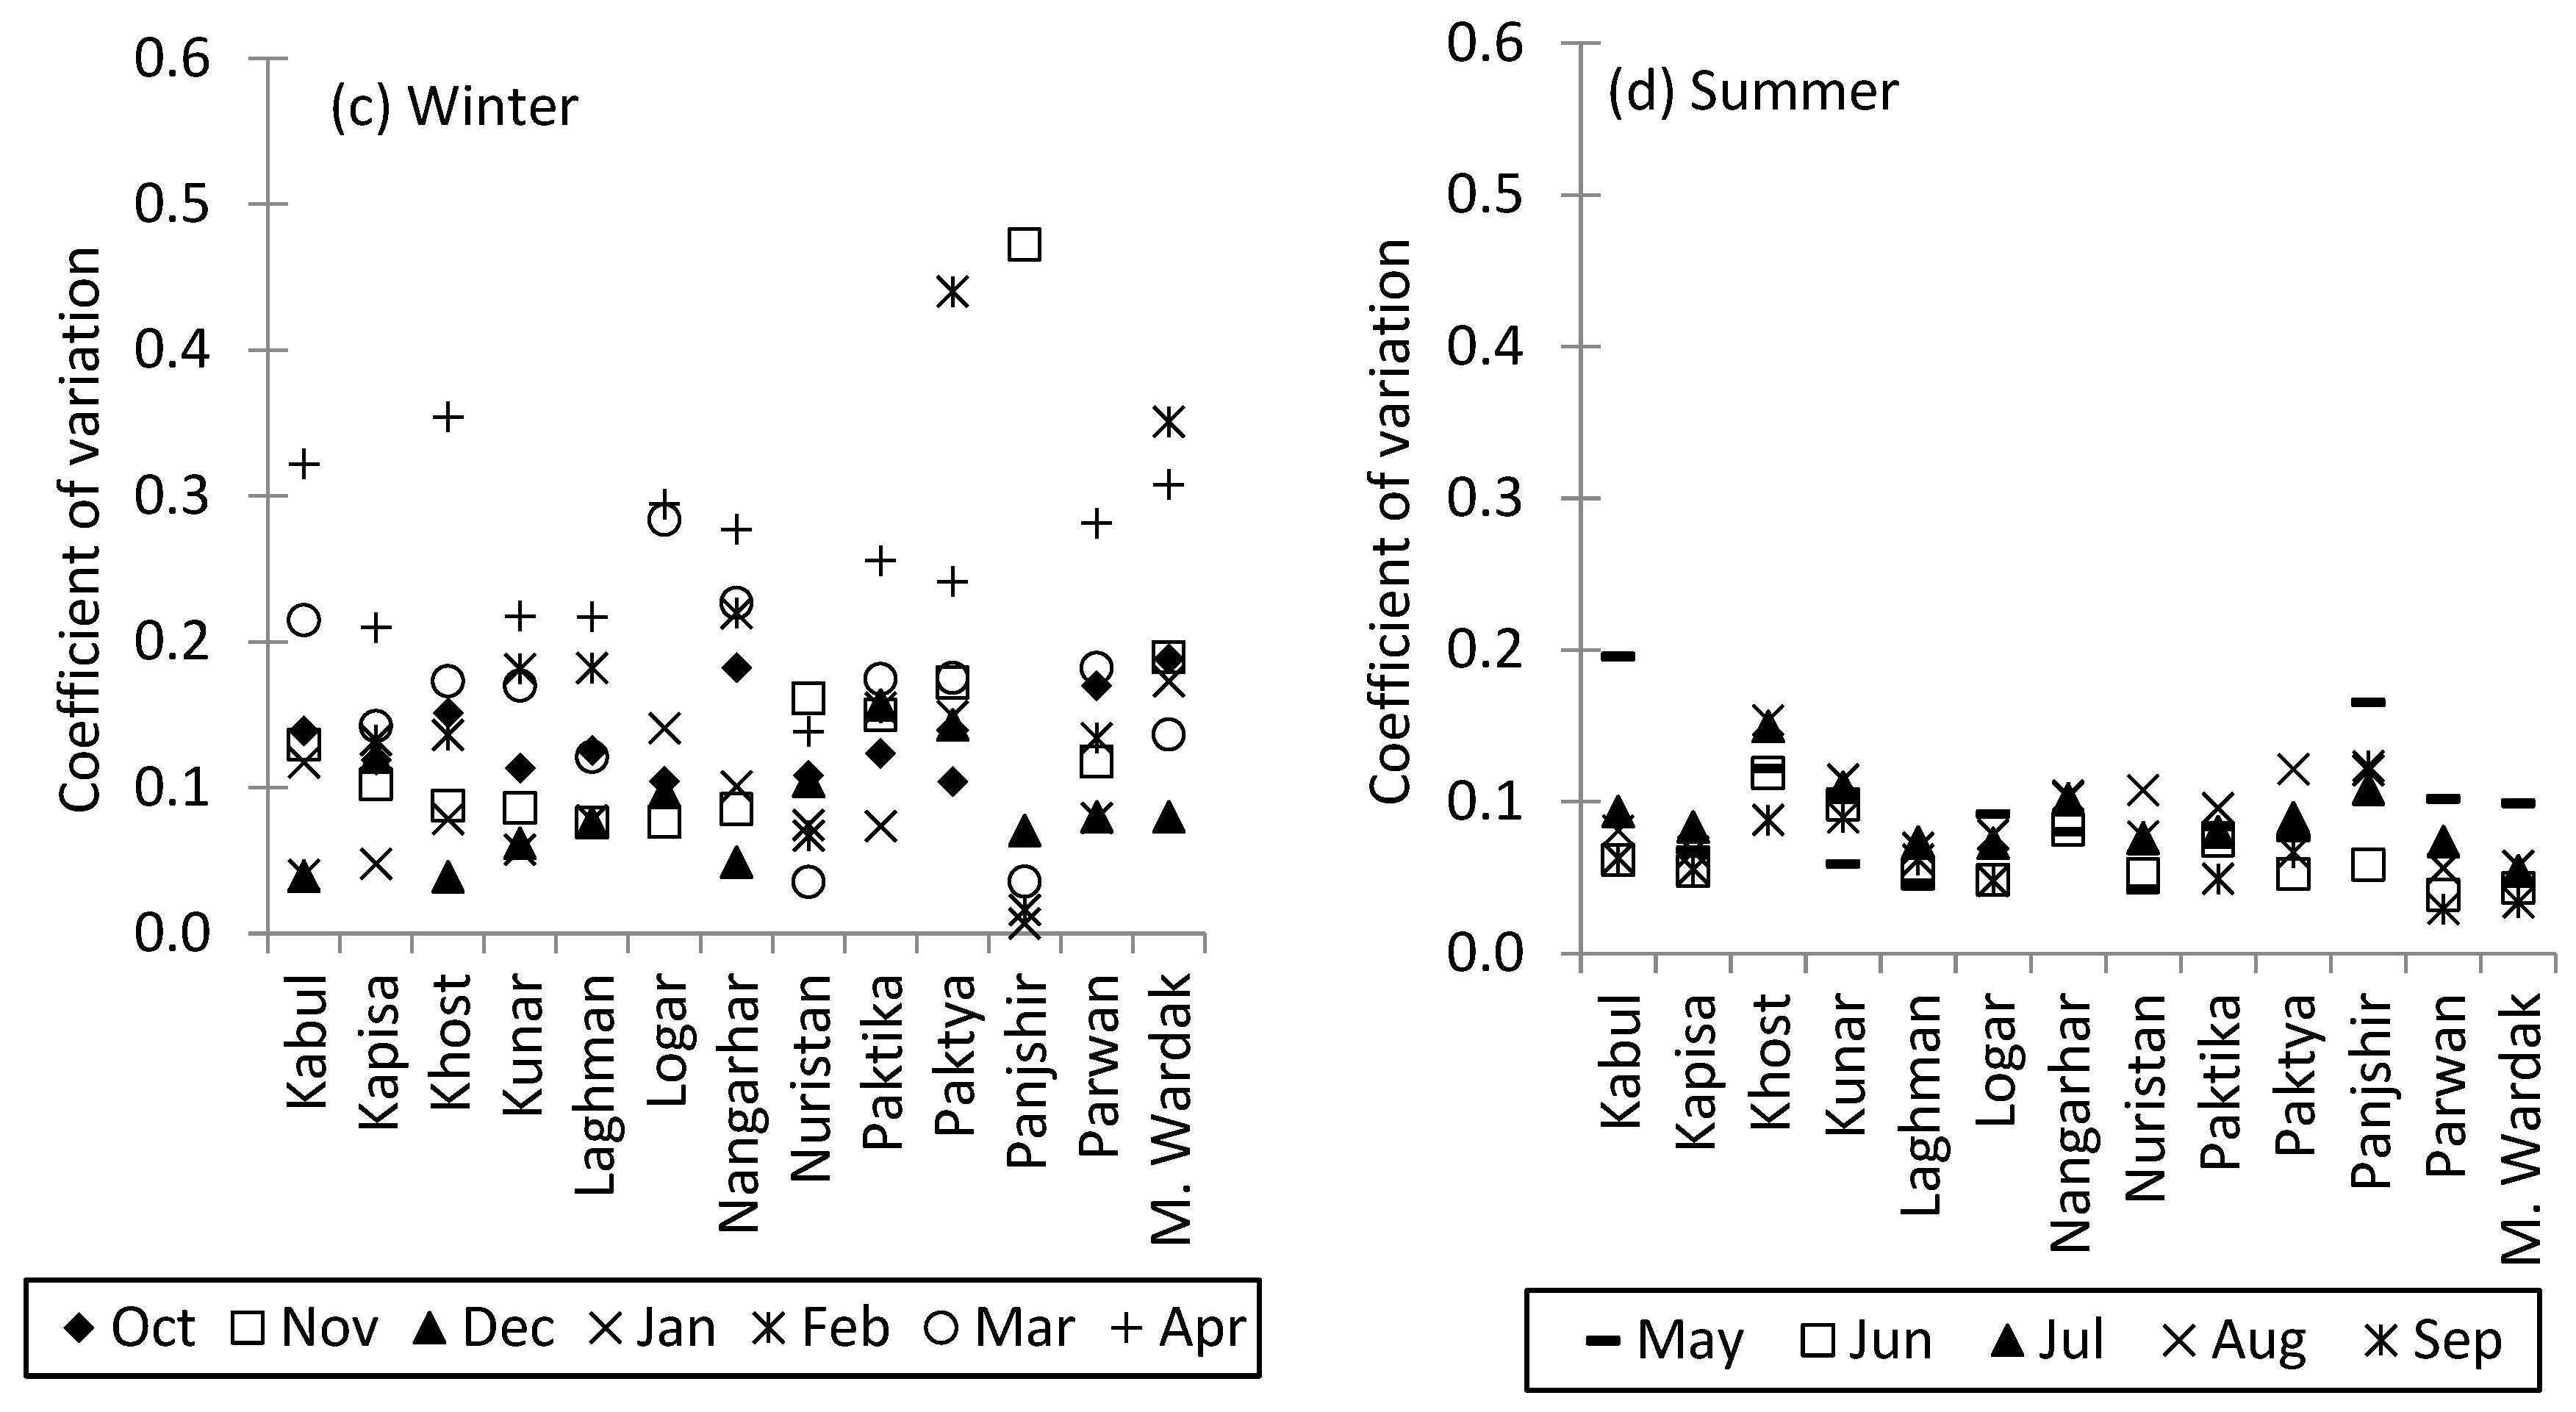
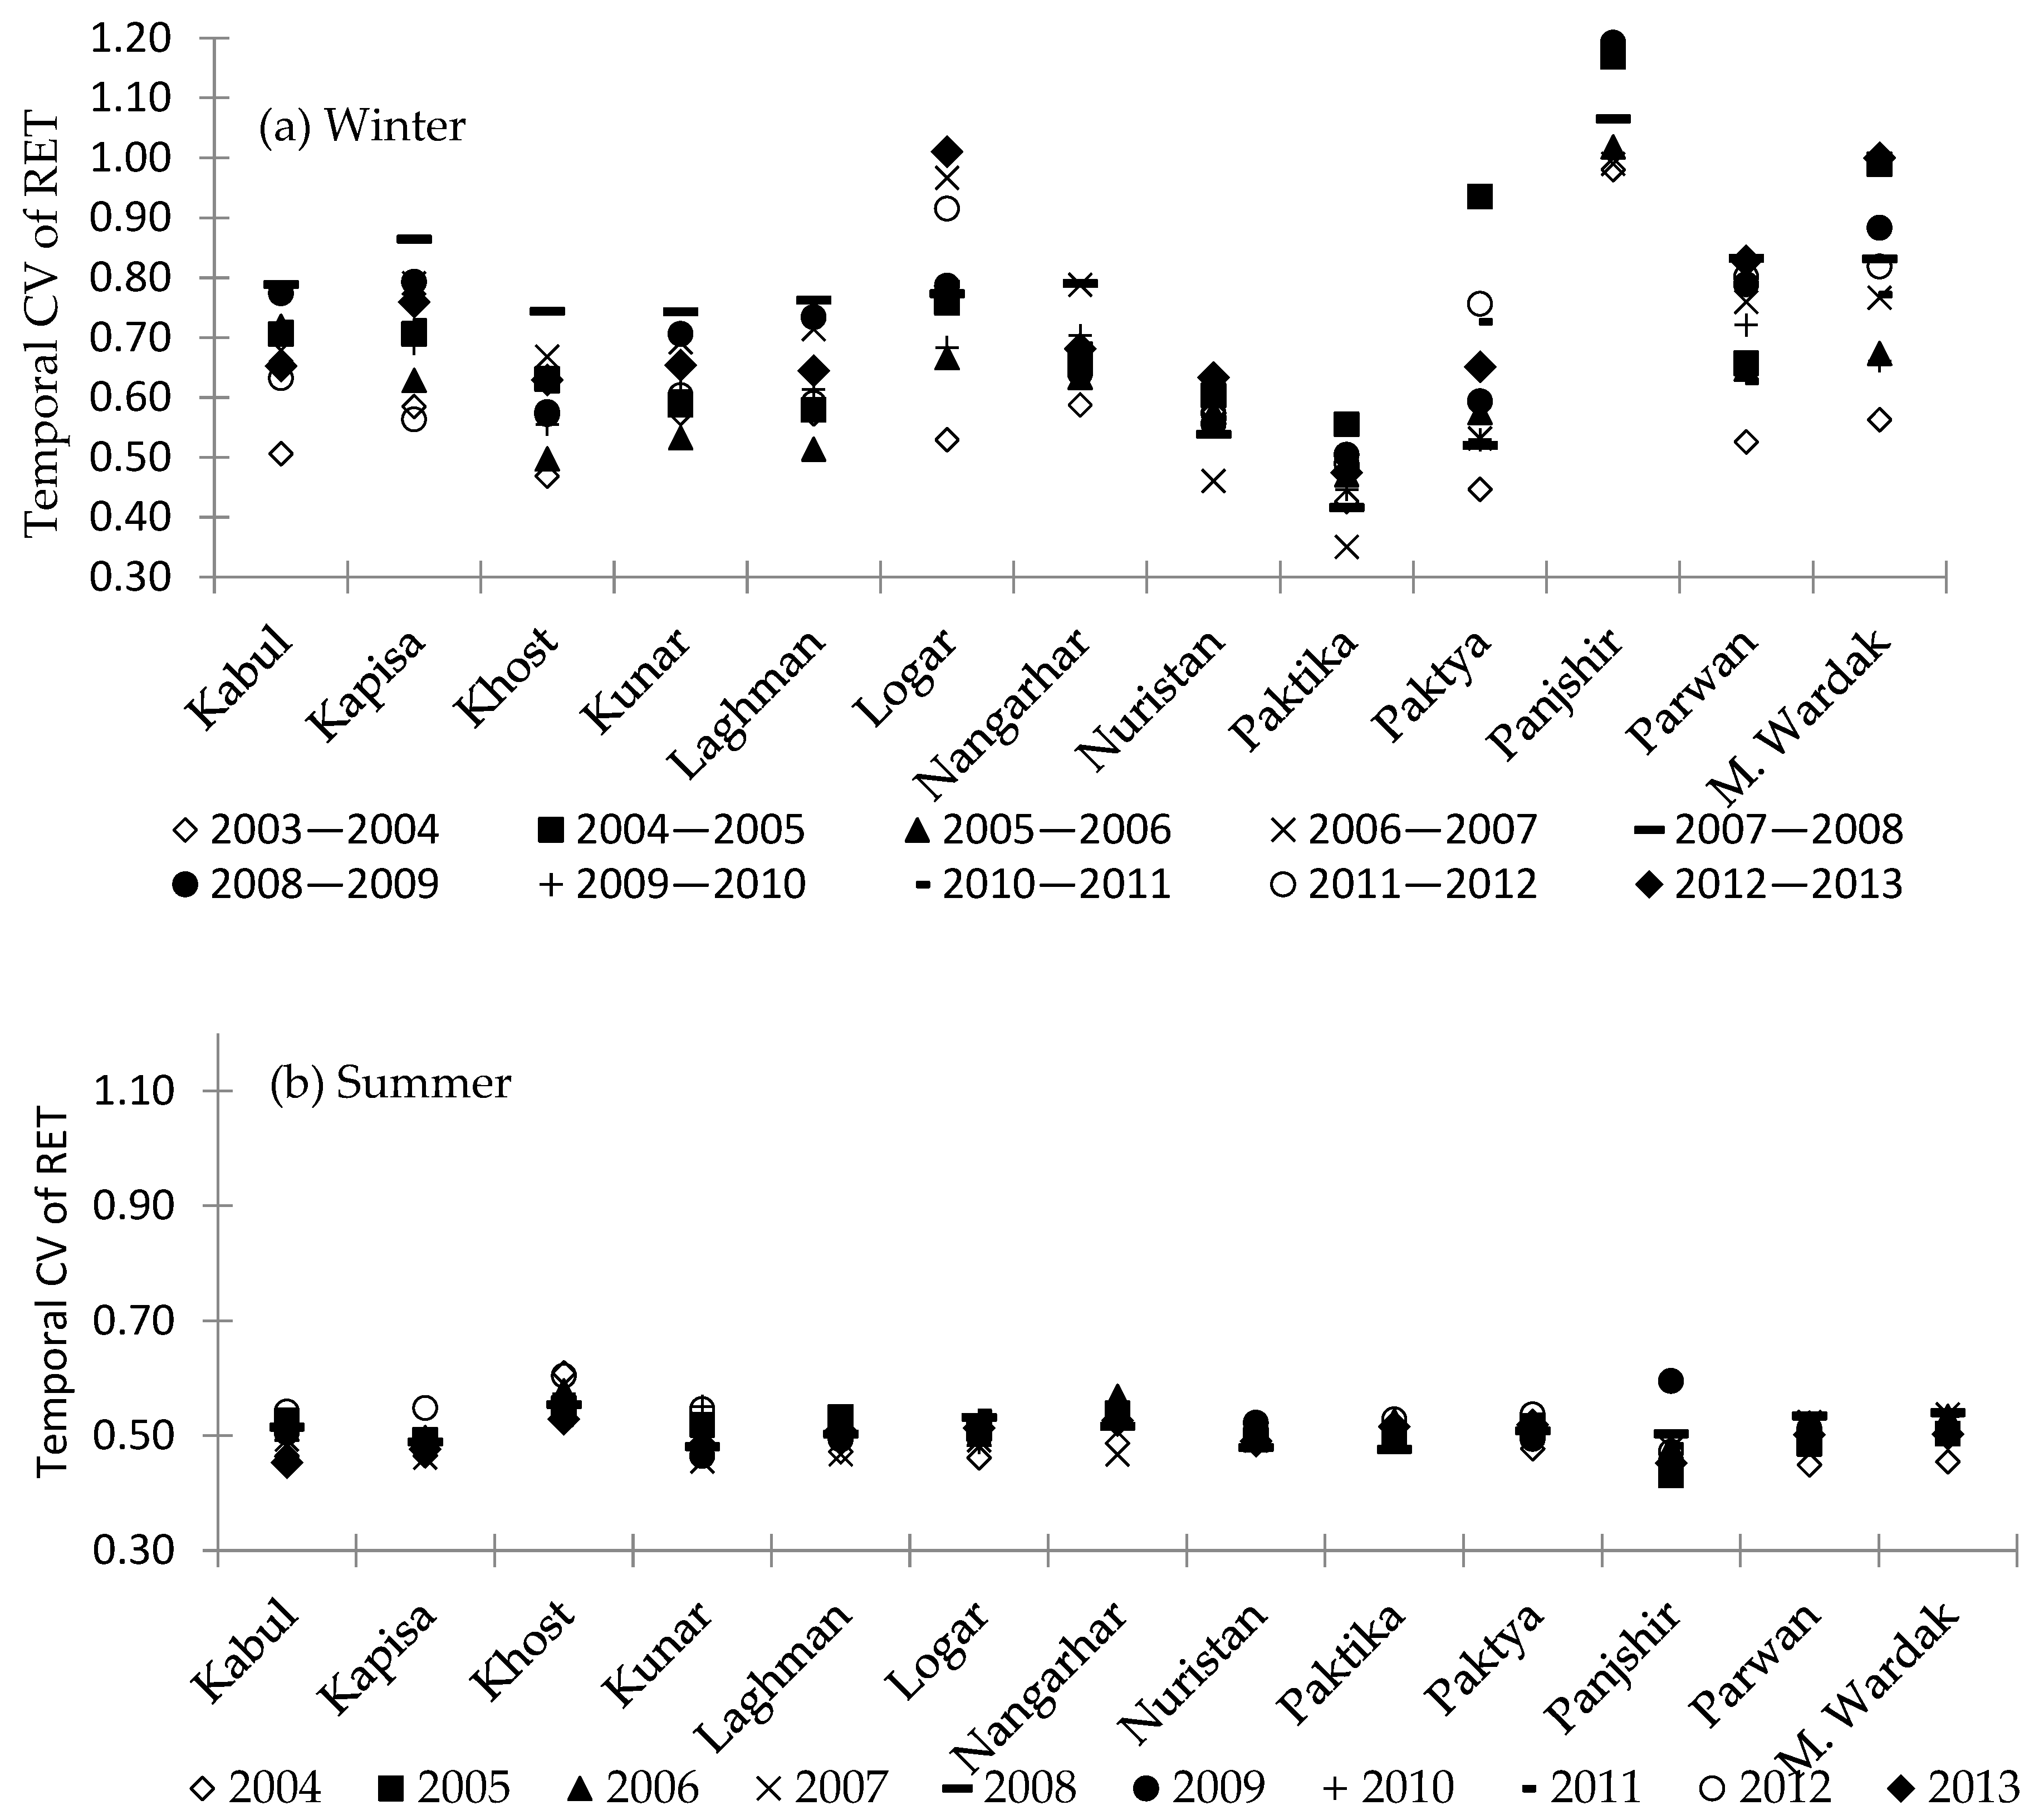
3.6.3. Analysis of Temporal Reliability

The temporal reliability of water supplies for irrigation purposes in the KRB was evaluated by using the CV of RET at all the constituent provinces of the KRB, which shows that the CV of RET in winter (October–April) is usually higher than in the winter season. The higher CV in winter is strongly driven by the higher CV of RET, especially in the months of February to April (winter) and May (summer) (Figure 12) because it is the time where irrigation starts based on the irrigation water demand and temperatures on the rise, and therefore the unreliability of water supplies are experienced for the crops grown across the basin.
The temporal expression (2003–2013) of the CV of RET in the winter season showed a large variation in the provinces of Panjshir (CV ≥ 0.98), Paktya (CV = 0.45–0.94), and Logar (CV = 0.53–1). Perhaps one of the reasons for the large variation in the CV of RET in these provinces is because of their relatively small irrigated land holding. Besides this, the effect of wet (2003, 2005, 2007, 2009, and 2013) and dry (2000, 2001, 2002, 2004, 2006, and 2008) years (Pervez et al., 2014) might be also driving the temporal variation in the RET across the provinces of the KRB.
Similarly, in the summer season (May–September), throughout the study period, the fluctuation in the CV of RET has largely been affected by the higher CV in the month of May. It is perhaps due to the fact that maize and some local vegetables are being grown in this month where fields are irrigated to bring them to a field capacity level for creating a germination-friendly crop-soil-moisture atmosphere.
The CV of RET varied within a range of 43–60% throughout 2003–2013 across all the constituent provinces of the KRB, which is quite narrow compared to that of winter season. Likewise, in winter season, the range of CV of RET in the summer was high in the Panjshir province whereas the highest CV of RET was 0.60 in the year 2009, which is considered to be a wet year due to receiving more precipitation than during a normal year. The Panjshir province is located at the upstream heights of the KRB, which receives a larger share of the annual precipitation that is a result of melt that is flown downstream and contributes to the irrigation network in the KRB. After the Panjshir province, Nangarhar has the highest range of the CV of RET during 2003–2013, as it receives snow-melt from upstream in the form of streamflow and therefore is the largest irrigated land-holding province in the KRB, and thus enjoys crop rotation (i.e., usually two crops per year). It shows that the largest irrigated part of the KRB is suffering from unreliable water supplies both in summer and winter. Nuristan province has the narrowest range of the CV of RET (0.49–0.52), as it can be justified with its mountainous terrain with dominant forests and limited cropped area, which receives rainfall (other than winter precipitation in the form of snow) that contribute to its canals for irrigation purposes each year due to the fringe effects of monsoon from Himalayas.
In general, the higher range of the CV of RET shows that the supply-based irrigation system in the KRB delivers unreliable water supplies to the users, which require management interventions for raising water productivity across the KRB which hosts the highest population of the country compared to any other basin in Afghanistan. The different ranges of the CV of RET at different provinces is driven by various factors, e.g., geographic location (upstream receives the snowfall as the winter precipitation while downstream is the recipient of snow-melt), topographic relief and canal network existence, and certainly management interventions by the relevant department and ministry plays a role too.

4. Conclusions and Recommendations

Decades of political instability and conflicts caused infrastructural damage that ultimately led to data scarcity on land and water resources in Afghanistan. The agriculture sector consumes around 98% of the total water withdrawn for irrigation purposes. Having consumed such a high amount of water for agriculture, the country’s dependency on foreign food imports highlights the inefficiency of the irrigation system as well as the responsible institutions. In order to sustainably manage these water resources, it is extremely important to analyze the long-term operational and strategical performance of the irrigation system. To assess the irrigation performance for around a decade (2003–2013), we identified those sets of indicators that requires minimum secondary data, which is very effective in data-scarce basins like the KRB. The irrigation performance assessment in the KRB shows that the irrigation system in the KRB is experiencing inequity, inadequacy, and unreliability, especially during the peak demand period that results in inefficient irrigated agriculture and poor crop-water productivity. It therefore leads to larger voids between water demand and supply, and ultimately leads to failure to meet growing food demand across the country. Besides the water losses that occur during conveyance and application, it affects other water consuming sectors too that are deemed to have increased water needs in the case of industrial and municipal developments in the near future. The relevant platforms need to strategically invest in the development of irrigation infrastructure (e.g., canal lining, water storage structures, etc.) as well as the capacity development of the local manpower at the Ministries of Agriculture, Irrigation, and Livestock, as well as the Ministry of Energy and Water to safeguard the irrigation quota for the dominant crops, especially in the peak demand period. As shown in the study, the relative evapotranspiration across all the sub-basins shows the entire KRB, hosting around one-third of the country’s population, to be under water stress, which needs to be addressed and managed in order to meet the growing water and food demand in the country. The ETa, derived under this research could also be used in comparisons to future studies over the effects/impacts of climate change on ETa. Furthermore, the results of this study will considerably contribute to the investment plans addressing water resources management issues in the Kabul River Basin.

Author Contributions

The correspondent author of this research paper, F.A., wrote the manuscript and analyzed the data sets used in this study; U.K.A., B.T. and U.W.L. reviewed, edited and provided valuable suggestions and inputs for the final manuscript.

Funding

This research received no external funding other than what is acknowledged below.

Acknowledgments

This paper is part of the doctoral study of Fazlullah Akhtar funded by BMZ (Federal Ministry for Economic Cooperation and Development, Germany) via DAAD (German Academic Exchange Service), thanks to Hermann Eiselen Doctoral Program of the Foundation Fiat Panis for economical support in carrying out the ground data collection, Centre for Development Research (ZEF) for academic guidance and platform provision. The author is also thankful to International Centre for Agricultural Research in the Dry Areas (ICARDA) for technical insights in carrying out this study.

Conflicts of Interest

The authors declare no conflict of interest.

References

  1. Qureshi, A.S. Water Resources in Afghanistan: Issues and Options (Working Paper 49). 2002. Available online: http://www.iwmi.cgiar.org/Publications/Working_Papers/working/WOR49.pdf (accessed on 20 May 2015).
  2. Farrell, G.; Thorne, J. Where have all the flowers gone? Evaluation of the Taliban crackdown against opium poppy cultivation in Afghanistan. Int. J. Drug Policy 2004, 16, 81–91. [Google Scholar] [CrossRef]
  3. Roe, A. Swords into plowshares? Accessing natural resources and securing agricultural livelihoods in rural Afghanistan. In Livelihoods, Natural Resources, and Post-Conflict Peacebuilding; Routledge: London, UK, 2015; p. 41. [Google Scholar]
  4. Shi, P.; Zhang, X.; Yu, H.; Lin, D.; Wu, Y. Mapping Drought Risk (Maize) of the World. In World Atlas of Natural Disaster Risk; Springer: Berlin/Heidelberg, Germany, 2015; pp. 211–226. [Google Scholar]
  5. Akhtar, F.; Tischbein, B.; Awan, U.K. Optimizing Deficit Irrigation Scheduling under Shallow Groundwater Conditions in Lower Reaches of Amu Darya River Basin. Water Resour. Manag. 2013, 27, 3165–3178. [Google Scholar] [CrossRef]
  6. Bos, M.G.; Murray-Rust, D.H.; Merrey, D.J.; Johnson, H.G.; Snellen, W.B. Methodologies for assessing performance of irrigation and drainage management. Irrig. Drain. Syst. 1994, 7, 231–261. [Google Scholar] [CrossRef]
  7. Dhungel, R.; Allen, R.G.; Trezza, R.; Robison, C.W. Evapotranspiration between satellite overpasses: Methodology and case study in agricultural dominant semi-arid areas. Meteorol. Appl. 2016, 23, 714–730. [Google Scholar]
  8. Ahmad, M.D.; Turral, H.; Nazeer, A. Diagnosing irrigation performance and water productivity through satellite remote sensing and secondary data in a large irrigation system of Pakistan. Agric. Water Manag. 2009, 96, 551–564. [Google Scholar] [CrossRef]
  9. Bastiaanssen, W.G.M.; Bos, M.G. Irrigation Performance Indicators Based on Remotely Sensed Data: A Review of Literature. Irrig. Drain. Syst. 1999, 13, 291–311. [Google Scholar] [CrossRef]
  10. Akbari, M.; Toomanian, N.; Droogers, P.; Bastiaanssen, W.; Gieske, A. Monitoring irrigation performance in Esfahan, Iran, using NOAA satellite imagery. Agric. Water Manag. 2007, 88, 99–109. [Google Scholar] [CrossRef]
  11. Zwart, S.J.; Leclert, L.M.C. A remote sensing-based irrigation performance assessment: A case study of the Office du Niger in Mali. Irrig. Sci. 2010, 28, 371–385. [Google Scholar] [CrossRef]
  12. Rwasoka, D.T.; Gumindoga, W.; Gwenzi, J. Estimation of actual evapotranspiration using the Surface Energy Balance System (SEBS) algorithm in the upper Manyame catchment in Zimbabwe. Phys. Chem. Earth Parts A/B/C 2011, 36, 736–746. [Google Scholar] [CrossRef]
  13. Liaqat, U.W.; Choi, M.; Awan, U.K. Spatio-temporal distribution of actual evapotranspiration in the Indus Basin Irrigation System. Hydrol. Process. 2015, 29, 2613–2627. [Google Scholar] [CrossRef]
  14. Usman, M.; Liedl, R.; Awan, U.K. Spatio-temporal estimation of consumptive water use for assessment of irrigation system performance and management of water resources in irrigated Indus Basin, Pakistan. J. Hydrol. 2015, 525, 26–41. [Google Scholar] [CrossRef]
  15. Awan, U.K.; Tischbein, B.; Conrad, C.; Martius, C.; Hafeez, M. Remote Sensing and Hydrological Measurements for Irrigation Performance Assessments in a Water User Association in the Lower Amu Darya River Basin. Water Resour. Manag. 2011, 25, 2467–2485. [Google Scholar] [CrossRef]
  16. Akhtar, F.; Awan, U.K.; Tischbein, B.; Liaqat, U.W. A phenology based geo-informatics approach to map land use and land cover (2003–2013) by spatial segregation of large heterogenic river basins. Appl. Geogr. 2017, 88, 48–61. [Google Scholar] [CrossRef]
  17. King, M.; Sturtewagen, B. Making the Most of Afghanistan’s River Basins: Opportunities for Regional Cooperation; EastWest Institute: New York, NY, USA, 2010. [Google Scholar]
  18. Ward, C.; Mansfield, D.; Oldham, P.; Byrd, W. Afghanistan: Economic Incentives and Development Initiatives to Reduce Opium Production; World Bank: Washington, DC, USA, 2008. [Google Scholar]
  19. Bos, M.G.; Nugteren, J. On Irrigation Efficiencies; ILRI: Nairobi, Kenya, 1990; p. 117. [Google Scholar]
  20. Bastiaanssen, W.G.M.; Brito, R.A.L.; Bos, M.G.; Souza, R.A.; Cavalcanti, E.B.; Bakker, M.M. Low cost satellite data for monthly irrigation performance monitoring: Benchmarks from Nilo Coelho, Brazil. Irrig. Drain. Syst. 2001, 15, 53–79. [Google Scholar] [CrossRef]
  21. Perry, C.J. Quantification and Measurement of a Minimum Set of Indicators of the Performance of Irrigation Systems; International Irrigation Management Institute: Colombo, Sri Lanka, 1996. [Google Scholar]
  22. Bandara, K.M.P.S. Monitoring irrigation performance in Sri Lanka with high-frequency satellite measurements during the dry season. Agric. Water Manag. 2003, 58, 159–170. [Google Scholar] [CrossRef]
  23. Svendsen, M.; Small, L.E. Farmer’s perspective on irrigation performance. Irrig. Drain. Syst. 1990, 4, 385–402. [Google Scholar] [CrossRef]
  24. Doorenbos, J.; Kassam, A.H. Yield response to water. Irrig. Drain. Paper 1979, 33, 257. [Google Scholar]
  25. Allen, R.; Pereira, L.S.; Raes, D.; Smith, M. Crop Evapotranspiration—Guidelines for Computing Crop Water Requirements; FAO: Rome, Italy, 1998; Volume 56. [Google Scholar]
  26. Asaana, J.; Sadick, A. Assessment of Irrigation Performance Using Remote Sensing Technique at Tono irrigation Area in the Upper East Region of Ghana. Int. Res. J. Agric. Food Sci. 2016, 1, 79–91. [Google Scholar]
  27. Roerink, G.J.; Bastiaanssen, W.G.; Chambouleyron, J.; Menenti, M. Relating Crop Water Consumption to Irrigation Water Supply by Remote Sensing. Water Resour. Manag. 1997, 11, 445–465. [Google Scholar] [CrossRef]
  28. Bandara, K.M.P.S. Assessing Irrigation Performance by Using Remote Sensing; Wageningen University: Wageningen, The Netherlands, 2006; p. 156. [Google Scholar]
  29. Marshall, L.; Nott, D.; Sharma, A.C.W. Hydrological model selection: A Bayesian alternative. Water Resour. Res. 2005, 41, 1–11. [Google Scholar] [CrossRef]
  30. Su, Z. The Surface Energy Balance System (SEBS) for estimation of turbulent heat fluxes. Hydrol. Earth Syst. Sci. Discuss. 2002, 6, 85–100. [Google Scholar] [CrossRef] [Green Version]
  31. Pardo, N.; Sánchez, M.L.; Timmermans, J.; Su, Z.; Pérez, I.A.; García, M.A. SEBS validation in a Spanish rotating crop. Agric. For. Meteorol. 2014, 195, 132–142. [Google Scholar] [CrossRef]
  32. Ma, W.; Hafeez, M.; Rabbani, U.; Ishikawa, H.; Ma, Y. Retrieved actual ET using SEBS model from Landsat-5 TM data for irrigation area of Australia. Atmos. Environ. 2012, 59, 408–414. [Google Scholar] [CrossRef]
  33. Monin, A.S.; Obukhov, A. Basic laws of turbulent mixing in the surface layer of the atmosphere. Contrib. Geophys. Inst. Acad. Sci. USSR 1954, 151, 163–187. [Google Scholar]
  34. Brutsaert, W. Aspects of bulk atmospheric boundary layer similarity under free—Convective conditions. Rev. Geophys. 1999, 37, 439–451. [Google Scholar] [CrossRef]
  35. Jia, L.; Xi, G.; Liu, S.; Huang, C.; Yan, Y.; Liu, G. Regional estimation of daily to annual regional evapotranspiration with MODIS data in the Yellow River Delta wetland. Hydrol. Earth Syst. Sci. 2009, 13, 1775–1787. [Google Scholar] [CrossRef]
  36. Hou, J.; Jia, G.; Zhao, T.; Wang, H.; Tang, B. Satellite-based estimation of daily average net radiation under clear-sky conditions. Adv. Atmos. Sci. 2014, 31, 705–720. [Google Scholar] [CrossRef]
  37. Sugita, M.; Brutsaert, W. Daily evaporation over a region from lower boundary layer profiles measured with radiosondes. Water Resour. Res. 1991, 27, 747–752. [Google Scholar] [CrossRef]
  38. Rodell, M.; Houser, P.R.; Jambor, U.E.A.; Gottschalck, J.; Mitchell, K.; Meng, C.J.; Arsenault, K.; Cosgrove, B.; Radakovich, J.; Bosilovich, M.; et al. The Global Land Data Assimilation System. Bull. Am. Meteorol. Soc. 2004, 85, 381–394. [Google Scholar] [CrossRef] [Green Version]
  39. Cai, M.; Yang, S.; Zhao, C.; Zeng, H.; Zhou, Q. Estimation of daily average temperature using multisource spatial data in data sparse regions of Central Asia. J. Appl. Remote Sens. 2013, 7, 073478. [Google Scholar] [CrossRef] [Green Version]
  40. Kiptala, J.K.; Mohamed, Y.; Mul, M.L.; Zaag, P. Mapping evapotranspiration trends using MODIS and SEBAL model in a data scarce and heterogeneous landscape in Eastern Africa. Water Resour. Res. 2013, 49, 8495–8510. [Google Scholar] [CrossRef] [Green Version]
  41. Brutsaert, W.; Stricker, H. An advection-aridity approach to estimate actual regional evapotranspiration. Water Resour. Res. 1979, 15, 443–450. [Google Scholar] [CrossRef]
  42. Yang, Z.; Zhang, Q.; Yang, Y.; Hao, X.; Zhang, H. Evaluation of evapotranspiration models over semi-arid and semi-humid areas of China. Hydrol. Process. 2016, 30, 4292–4313. [Google Scholar] [CrossRef]
  43. Szilagyi, J.; Hobbins, M.T.; Jozsa, J. Modified advection-aridity model of evapotranspiration. J. Hydrol. Eng. 2009, 14, 569–574. [Google Scholar] [CrossRef]
  44. Brutsaert, W. Hydrology: An Introduction; Cambridge University Press: Cambridge, UK, 2005. [Google Scholar]
  45. Crago, R.D.; Brutsaert, W. A comparison of several evaporation equations. Water Resour. Res. 1992, 28, 951–954. [Google Scholar] [CrossRef]
  46. Liu, S.; Sun, Z.; Sun, R.; Zhang, X. Comparison of Different Complementary Relationship Models for Regional Evapotranspiration Estimation. Acta Geogr. Sin. 2004, 59, 331–340. [Google Scholar]
  47. Bouchet, R.J. Evapotranspiration Réelle et Potentielle, Signification Climatique; IAHS Publication: Wallingford, UK, 1963; Volume 62, pp. 134–142. [Google Scholar]
  48. Koffi, D.; Komla, G. Trend analysis in reference evapotranspiration and aridity index in the context of climate change in Togo. J. Water Clim. Chang. 2015, 6, 848–864. [Google Scholar] [CrossRef]
  49. Yue, S.; Pilon, P.; Cavadias, G. Power of the Mann–Kendall and Spearman’s rho tests for detecting monotonic trends in hydrological series. J. Hydrol. 2002, 259, 254–271. [Google Scholar] [CrossRef]
  50. Mann, H.B. Nonparametric test against trend. Econometrica 1945, 13, 245–259. [Google Scholar] [CrossRef]
  51. Kendall, M.G. Rank Correlation Methods; Griffin: London, UK, 1975. [Google Scholar]
  52. Sen, P.K. Estimates of the Regression Coefficient Based on Kendall’s Tau. J. Am. Stat. Assoc. 1968, 63, 1379–1389. [Google Scholar] [CrossRef]
  53. Ahmad, W.; Fatima, A.; Awan, U.K.; Anwar, A. Analysis of long term meteorological trends in the middle and lower Indus Basin of Pakistan—A non-parametric statistical approach. Glob. Planet. Chang. 2014, 122, 282–291. [Google Scholar] [CrossRef]
  54. Hirsch, R.M.; Slack, J.R.; Smith, R.A. Techniques of trend analysis for monthly water quality data. Water Resour. Res. 1982, 18, 107–121. [Google Scholar] [CrossRef]
  55. Pearson, E.S.; Hartley, H.O. Biometrika Tables for Statisticians; Cambridge University Press: Cambridge, UK, 1966. [Google Scholar]
  56. Xu, C.Y.; Singh, V.P. Evaluation of three complementary relationship evapotranspiration models by water balance approach to estimate actual regional evapotranspiration in different climatic regions. J. Hydrol. 2005, 308, 105–121. [Google Scholar] [CrossRef]
  57. CSO-IRoA. Agriculture Development. 2014. Available online: http://cso.gov.af/Content/files/Agriculture%20Development%281%29.pdf (accessed on 21 April 2015).
  58. Senay, G.B.; Budde, M.; Verdin, J.P.; Melesse, A.M. A coupled remote sensing and simplified surface energy balance approach to estimate actual evapotranspiration from irrigated fields. Sensors 2007, 7, 979–1000. [Google Scholar] [CrossRef]
  59. Maupin, M.A.; Senay, G.B.; Kenny, J.F.; Savoca, M.E. A Comparison of Consumptive-Use Estimates Derived from the Simplified Surface Energy Balance Approach and Indirect Reporting Methods; US Geological Survey: Reston, VA, USA, 2012.
  60. Awan, U.; Tischbein, B.; Martius, C. A GIS-based approach for up-scaling capillary rise from field to system level under soil-crop-groundwater mix. Irrig. Sci. 2014, 32, 449–458. [Google Scholar] [CrossRef]
Figure 1. Location of the Kabul River Basin with its sub-basins and provincial.
Remotesensing 10 00972 g001
Figure 2. Climatograph of the downstream (left) and the central upstream (right) of the Kabul River Basin.
Remotesensing 10 00972 g002
Figure 3. Methodological framework to estimate actual evapotranspiration in different spatial units of Kabul River Basin with strategic time steps.
Remotesensing 10 00972 g003
Figure 4. Comparison of the daily actual evapotranspiration estimated through SEBS algorithm and AA model (1 January 2013–31 December 2013) at (a) Nawabad (Kunar) and (b) Sultanpur (Nangarhar) stations of the Kabul River Basin.
Remotesensing 10 00972 g004
Figure 5. (a) Box and whiskers plot of annual evapotranspiration (ETa), showing the temporal (2003–2013) and spatial variation of the ETa. The horizontal line inside each box represents the median, the lower and upper whiskers show the ETa range during the study period. The outliers are encircled with a dotted line. (b) Temporal variation (2003–2013) of actual evapotranspiration of main land covers across the Kabul River Basin.
Remotesensing 10 00972 g005
Figure 6. Mean seasonal (2003–2013) variation of actual evapotranspiration in winter and summer seasons at the (a) and (b) sub-basins and (c) and (d) provinces of the Kabul River Basin (Note: The statistical details have been explained in the text).
Remotesensing 10 00972 g006aRemotesensing 10 00972 g006b
Figure 7. Seasonal distribution of actual evapotranspiration (mm) during winter (October–April, 2012/2013) and summer (May–September 2013) in the Kabul River Basin.
Remotesensing 10 00972 g007
Figure 8. Physical distribution of cropped and non-cropped area of the KRB.
Remotesensing 10 00972 g008
Figure 9. Coefficient of variation of mean actual evapotranspiration at the spatial administrative units of (a) and (b) inter and intra sub-basin and (c) and (d) provincial level.
Remotesensing 10 00972 g009
Figure 10. Seasonal relative evapotranspiration in (a) Winter and (b) Summer across the Kabul River Basin.
Remotesensing 10 00972 g010
Figure 11. Inter-seasonal distribution of relative evapotranspiration across (a) sub-basins and (b) provinces of the Kabul River Basin in winter and summer seasons.
Remotesensing 10 00972 g011
Figure 12. Temporal coefficient of variation (2003–2013) of relative evapotranspiration during (a) winter and (b) summer.
Remotesensing 10 00972 g012
Table 1. Characteristics of the climate parameters downloaded from Global Land Data Assimilation System (GLDAS) for a period (2003–2013) across the Kabul River Basin.
S. No.Data TypeSourceVariablesSpatial ResolutionTemporal ResolutionTemporal Coverage
1GLDASNOAHWind Speed (m/s)25 km3-h2003–2013
2Long-wave Radiation (W/m2)25 km3-h2003–2013
3Air Temperature (K)25 km3-h2003–2013
4Short-wave Radiation (W/m2)25 km3-h2003–2013
5Air Pressure (Pa)25 km3-h2003–2013
6Specific Humidity (Kg/Kg)25 km3-h2003–2013
Table 2. Characteristics of the Moderate Resolution Imaging Spectroradiometer (MODIS) products used in the estimation of ETa for a period (2003–2013) across the Kabul River Basin.
S. No.Data TypeSourceVariablesSpatial ResolutionTemporal GranularityTemporal Coverage
1Satellite Land Surface DataMODISEmissivity/LST (MOD11A1) 1 km Instantaneous 2003–2013
2NDVI (MOD13A2) 1 km 16-day 2003–2013
3LAI (MCD15A2) 1 km 8-day 2003–2013
4Albedo (MCD43B3) 1 km 8-day 2003–2013
5Land Cover (MCD12Q1)500 mYearly2003–2013
Table 3. Mann-Kendall test statistics for monotonic trend in temperature.
ObservationsStd. DeviationKendall’s TauSVar (S)p-Value
(Two-Tailed)
Alpha
(α)
ZMK
Jan111.00.29.0165.00.530.050.70
Feb110.70.15.0165.00.760.050.39
Mar112.50.15.0165.00.760.050.39
Apr111.90.13.0165.00.880.050.23
May111.90.213.0165.00.350.051.01
Jun111.5−0.1−5.0165.00.760.050.39
Jul110.70.213.0165.00.350.051.01
Aug110.70.525.0165.00.060.051.95
Sep110.70.17.0165.00.640.050.54
Oct111.40.213.0165.00.350.051.01
Nov111.20.211.0165.00.440.050.86
Dec110.90.211.0165.00.440.050.86
Mean 1.30.29.17165.00.530.050.78

