How Well Can Global Precipitation Measurement (GPM) Capture Hurricanes? Case Study: Hurricane Harvey


1
Department of Civil and Environmental Engineering, University of Texas at San Antonio, San Antonio, TX 78249, USA
2
Coastal and Hydraulics Laboratory, U.S. Army Engineer Research and Development Center, 5825 University Research Ct suite 4001, College Park, MD 20740, USA
*
Author to whom correspondence should be addressed.
Remote Sens. 2018, 10(7), 1150; https://doi.org/10.3390/rs10071150
Submission received: 12 June 2018
/
Revised: 18 July 2018
/
Accepted: 18 July 2018
/
Published: 20 July 2018
(This article belongs to the Special Issue Remote Sensing of Precipitation)
Abstract
:Hurricanes and other severe coastal storms have become more frequent and destructive during recent years. Hurricane Harvey, one of the most extreme events in recent history, advanced as a category IV storm and brought devastating rainfall to the Houston, TX, region during 25–29 August 2017. It inflicted damage of more than $125 billion to the state of Texas infrastructure and caused multiple fatalities in a very short period of time. Rainfall totals from Harvey during the 5-day period were among the highest ever recorded in the United States. Study of this historical devastating event can lead to better preparation and effective reduction of far-reaching consequences of similar events. Precipitation products based on satellites observations can provide valuable information needed to understand the evolution of such devastating storms. In this study, the ability of recent Integrated Multi-satellitE Retrievals for Global Precipitation Mission (GPM-IMERG) final-run product to capture the magnitudes and spatial (0.1° × 0.1°)/temporal (hourly) patterns of rainfall resulting from hurricane Harvey was evaluated. Hourly gridded rainfall estimates by ground radar (4 × 4 km) were used as a reference dataset. Basic and probabilistic statistical indices of the satellite rainfall products were examined. The results indicated that the performance of IMERG product was satisfactory in detecting the spatial variability of the storm. It reconstructed precipitation with nearly 62% accuracy, although it systematically under-represented rainfall in coastal areas and over-represented rainfall over the high-intensity regions. Moreover, while the correlation between IMERG and radar products was generally high, it decreased significantly at and around the storm core.
1. Introduction
Reliable and high-quality precipitation measurements provide indispensable information for water resources investigation and play a substantial role in various applications such as weather prediction and climatic modeling, water resources and hydrologic modeling, global water cycle analysis, and agricultural development planning [1,2,3,4,5,6,7]. However, obtaining accurate and authoritative data such as precipitation products has always been a challenging issue for scientists due to the great heterogeneity across uneven spatiotemporal distribution of water resources on both continental and regional scales [8,9,10,11]. The amount of precipitation is mainly recorded via three methods: ground observations (gauges), weather radars, and satellite-based products [12,13]. Conventionally, rain gauge networks, as the most straightforward and reliable measurement method, provide the surface precipitation amount with high temporal frequency [8,14,15]. However, uneven and sparse distribution of gauges causes lower spatial coverage of larger watersheds. Moreover, high data latency in an obstacle to the wide use of gauge networks [11,16,17]. Ground-based weather radars generally estimate precipitation with higher spatiotemporal resolution which can significantly lead to better understanding of storm structure and their real-time monitoring [18,19,20,21]. Despite some constraints such as limited spatial coverage, inaccuracy in mountainous regions, range-dependent and random systematic errors; radar precipitation products are currently one of the most trusted sources for precipitation measurements [22,23,24]. Multi-Satellite precipitation measurements can be potentially the most comprehensive products due to their vast spatial coverage (almost globally), regular and constant temporal measurements, and moderately synchronized performance [25,26,27,28,29]. For nearly two decades, the Tropical Rainfall Measuring Mission (TRMM) Multi-satellite Precipitation Analysis (TMPA) has been providing high quality precipitation records which have been used in various applications [30]. This product is recently integrated with some other semi-global satellite products such as Climate Prediction Center Morphing (CMORPH) and Precipitation Estimation from Remotely Sensed Information using Artificial Neural Networks (PERSIANN) to generate a high resolution and advanced satellite product, called, Integrated Multi-satellitE Retrievals for the Global Precipitation Mission (IMERG) [8,30].
The Global Precipitation Measurement (GPM) mission is an international network of satellites using a core satellite combined with ancillary ones and an advanced passive microwave radiometer paired with dual-frequency radar system to measure rain and snow from space. Data are collected from a constellation of satellites such as MetOp B/C (operated by European Organization for the Exploitation of Meteorological Satellites (EUMESAT)), Global Change Observation Mission-Water (GCOM-W) (operated by Japan Aerospace Exploration Agency (JAXA)), Megha-Tropiques (mutually operated by Indian Space Research Organization (ISRO) and French Centre National d’Etudes Spatiales (CNES) and some other satellites, mainly managed by NASA [31,32]. Similar to previous evaluation studies of GPM predecessors such as CMORPH [33,34], PERSIANN [35,36], GSMaP [37,38], CHIRPS [39], and TRMM [40,41], some efforts have been made to evaluate and to characterize uncertainties and errors of this satellite-based product [12,42,43,44,45]. A significant improvement of GPM over other satellite-based products is its ability to detect light and solid precipitation by combining the GPM Microwave Imager (GMI) and Dual-Frequency Precipitation Radar (DPR) instruments [12].
Some of the previous verification studies for IMERG products were mainly conducted over very large regions in China e.g., [15] or India e.g., [30]. Consequently, China Gauge-based Daily Precipitation Analysis (CGDPA) (0.25° × 0.25°), hourly gridded precipitation data from the China Meteorological Administration (CMA) (0.1° × 0.1°), and the gridded Indian Meteorological Department (IMD) gauge-based rainfall data have been used as trustable sources (benchmark or ground truth) of observational precipitation records. These gauge-based products undergo a strict quality control process before publishing [5,15]. However, by comparing them to IMERG products can cause some computing issues. Since the Inverse Distance Weighting (IDW) method is generally used to interpolate precipitation values among gauge observations to produce gridded data for large areas, it can cause uncertainty in precipitation records estimates over regions with sparse gauge networks [15]. Moreover, spatiotemporal resolutions for these products are generally coarser than IMERG spatiotemporal resolutions. As a result, some data will be missed while matching products with finer resolution with products with relatively coarser resolution [46]. Therefore, applying a more robust gridded source of precipitation (higher spatiotemporal resolutions) can lead to a better assessment of IMERG product comparing to previous studies.
Moreover, to perform a comprehensive validation, there is a need to evaluate the IMERG satellite product performance at regional and local scales and under adverse weather conditions such as hurricanes or thunderstorms. During May 2015, natural disasters in the U.S. caused more than $1 billion in damages, while Texas was among the most vulnerable States [12,47]. In August 2017, Hurricane Harvey, as a category 4 major hurricane event, inflicted more than $125 billion in damages to Texas in a week [48,49]. Texas will likely experience similar events during future years. Hence, it is critical to have a powerful tracing mechanism to detect events and their characteristics from space. The objective of this study was to evaluate IMERG product at a regional scale in an area which is extremely vulnerable to flood and hurricane events and show how the GPM core satellite can capture hurricane events. It should be noted that other two GPM satellite products (Early- and late-run products) can also be utilized in near real-time applications for forecasting purposes. To fulfill this goal, weather radar data as observational data was compared with an open-source satellite-based precipitation product. Section 2 provides the study area, utilized datasets and methodology. In Section 3, results are provided and comprehensively discussed while Section 4 represents the conclusion.
2. Materials and Methods
2.1. Study Area
Texas, the largest state in the contiguous United States of America (268,597 mi2), is one of the most flood-prone and hurricane affected regions in the world [50]. It is generally divided into three major climatic zones with different hydrometeorological conditions, topographic/physiographic characteristics, and land use/land cover (LULC) types: (1) wet (eastern region) (2) semi-wet (central region) (3) dry (western region) [51]. The western region is typically covered by arid deserts while the central and eastern districts are generally more humid covered by forest, agricultural lands, and rangelands. The southeast is dominantly under the effect of subtropical weather condition which causes this region to be renowned as one of the most vulnerable regions to natural disasters such as hurricanes, tornados and flash-floods [52]. The majority of Texas population resides in the central and eastern regions causing growth demand for more infrastructures in this area. Additionally, due to the natural disasters, Texas suffers a significant financial loss every year across these regions. Consequently, the study area covers from 93.4°–106.7° West in longitude and 25.7°–36.6° North in latitude.
2.2. Precipitation Data
2.2.1. NWS/NCEP Stage-IV Radar Data
The National Weather Service/National Centers for Environmental Prediction (NWS/NCEP) River Forecast Center (RFC) Stage-IV Quantitative Precipitation Estimates (QPEs) gridded radar-rainfall (http://data.eol.ucar.edu/) was employed as the source of precipitation observation data. The operational stage IV precipitation radar data production began in 2001 and has been continued since then [53]. It contains adjusted hourly rain-gauge precipitation records with a 4 × 4-km spatial resolution and hourly temporal resolution. The measurements are in cumulative hourly format at the end of each hour.
2.2.2. IMERG Satellite Product
The level 3 IMERG data was downloaded from the Precipitation Measurement Missions website (http://pmm.nasa.gov/data-access/downloads/gpm). Version 05-B of IMERG product was used with the half-hourly temporal resolution and 0.1° × 0.1°(11 × 11 km) spatial resolution. The final-run product is adjusted with gauge-network which converts it to more accurate product relative to two other early and late-run products. It is produced almost 3 months after the date of preliminary records and mainly used for research purposes. Since the radar products have an hourly temporal resolution, the IMERG products used in this study were also converted to hourly format at the end of each hour.
2.3. Methodology
Hurricane Harvey predominantly affected the southern and eastern counties in the state of Texas. Therefore, to better track hurricane Harvey and accurately detect the spatial extent of the event; only those grids with more than 10 mm cumulative precipitation captured by radar product were evaluated over the entire state during the event. The gridded final-run IMERG product was compared to the nearest NCEP Stage IV gridded radar product at hourly temporal resolution for five consecutive days during hurricane Harvey. The nearest radar grid to each satellite product was identified based on the Euclidean distance and paired to each satellite grid. Since the spatial resolution of satellite product is almost three times the radar grids, for each satellite product, there is a unique nearest radar grid. Afterward, the precipitation records from the IMERG grids were compared with that corresponding to the nearest radar grids at hourly temporal resolution to calculate the statistical comparative metrics. There are 45, 509 NWS/NCEP radar grids versus 6502 IMERG satellite grids inside Texas. However, just 2508 grids are included in the region with cumulative precipitation magnitude of over 10 mm.
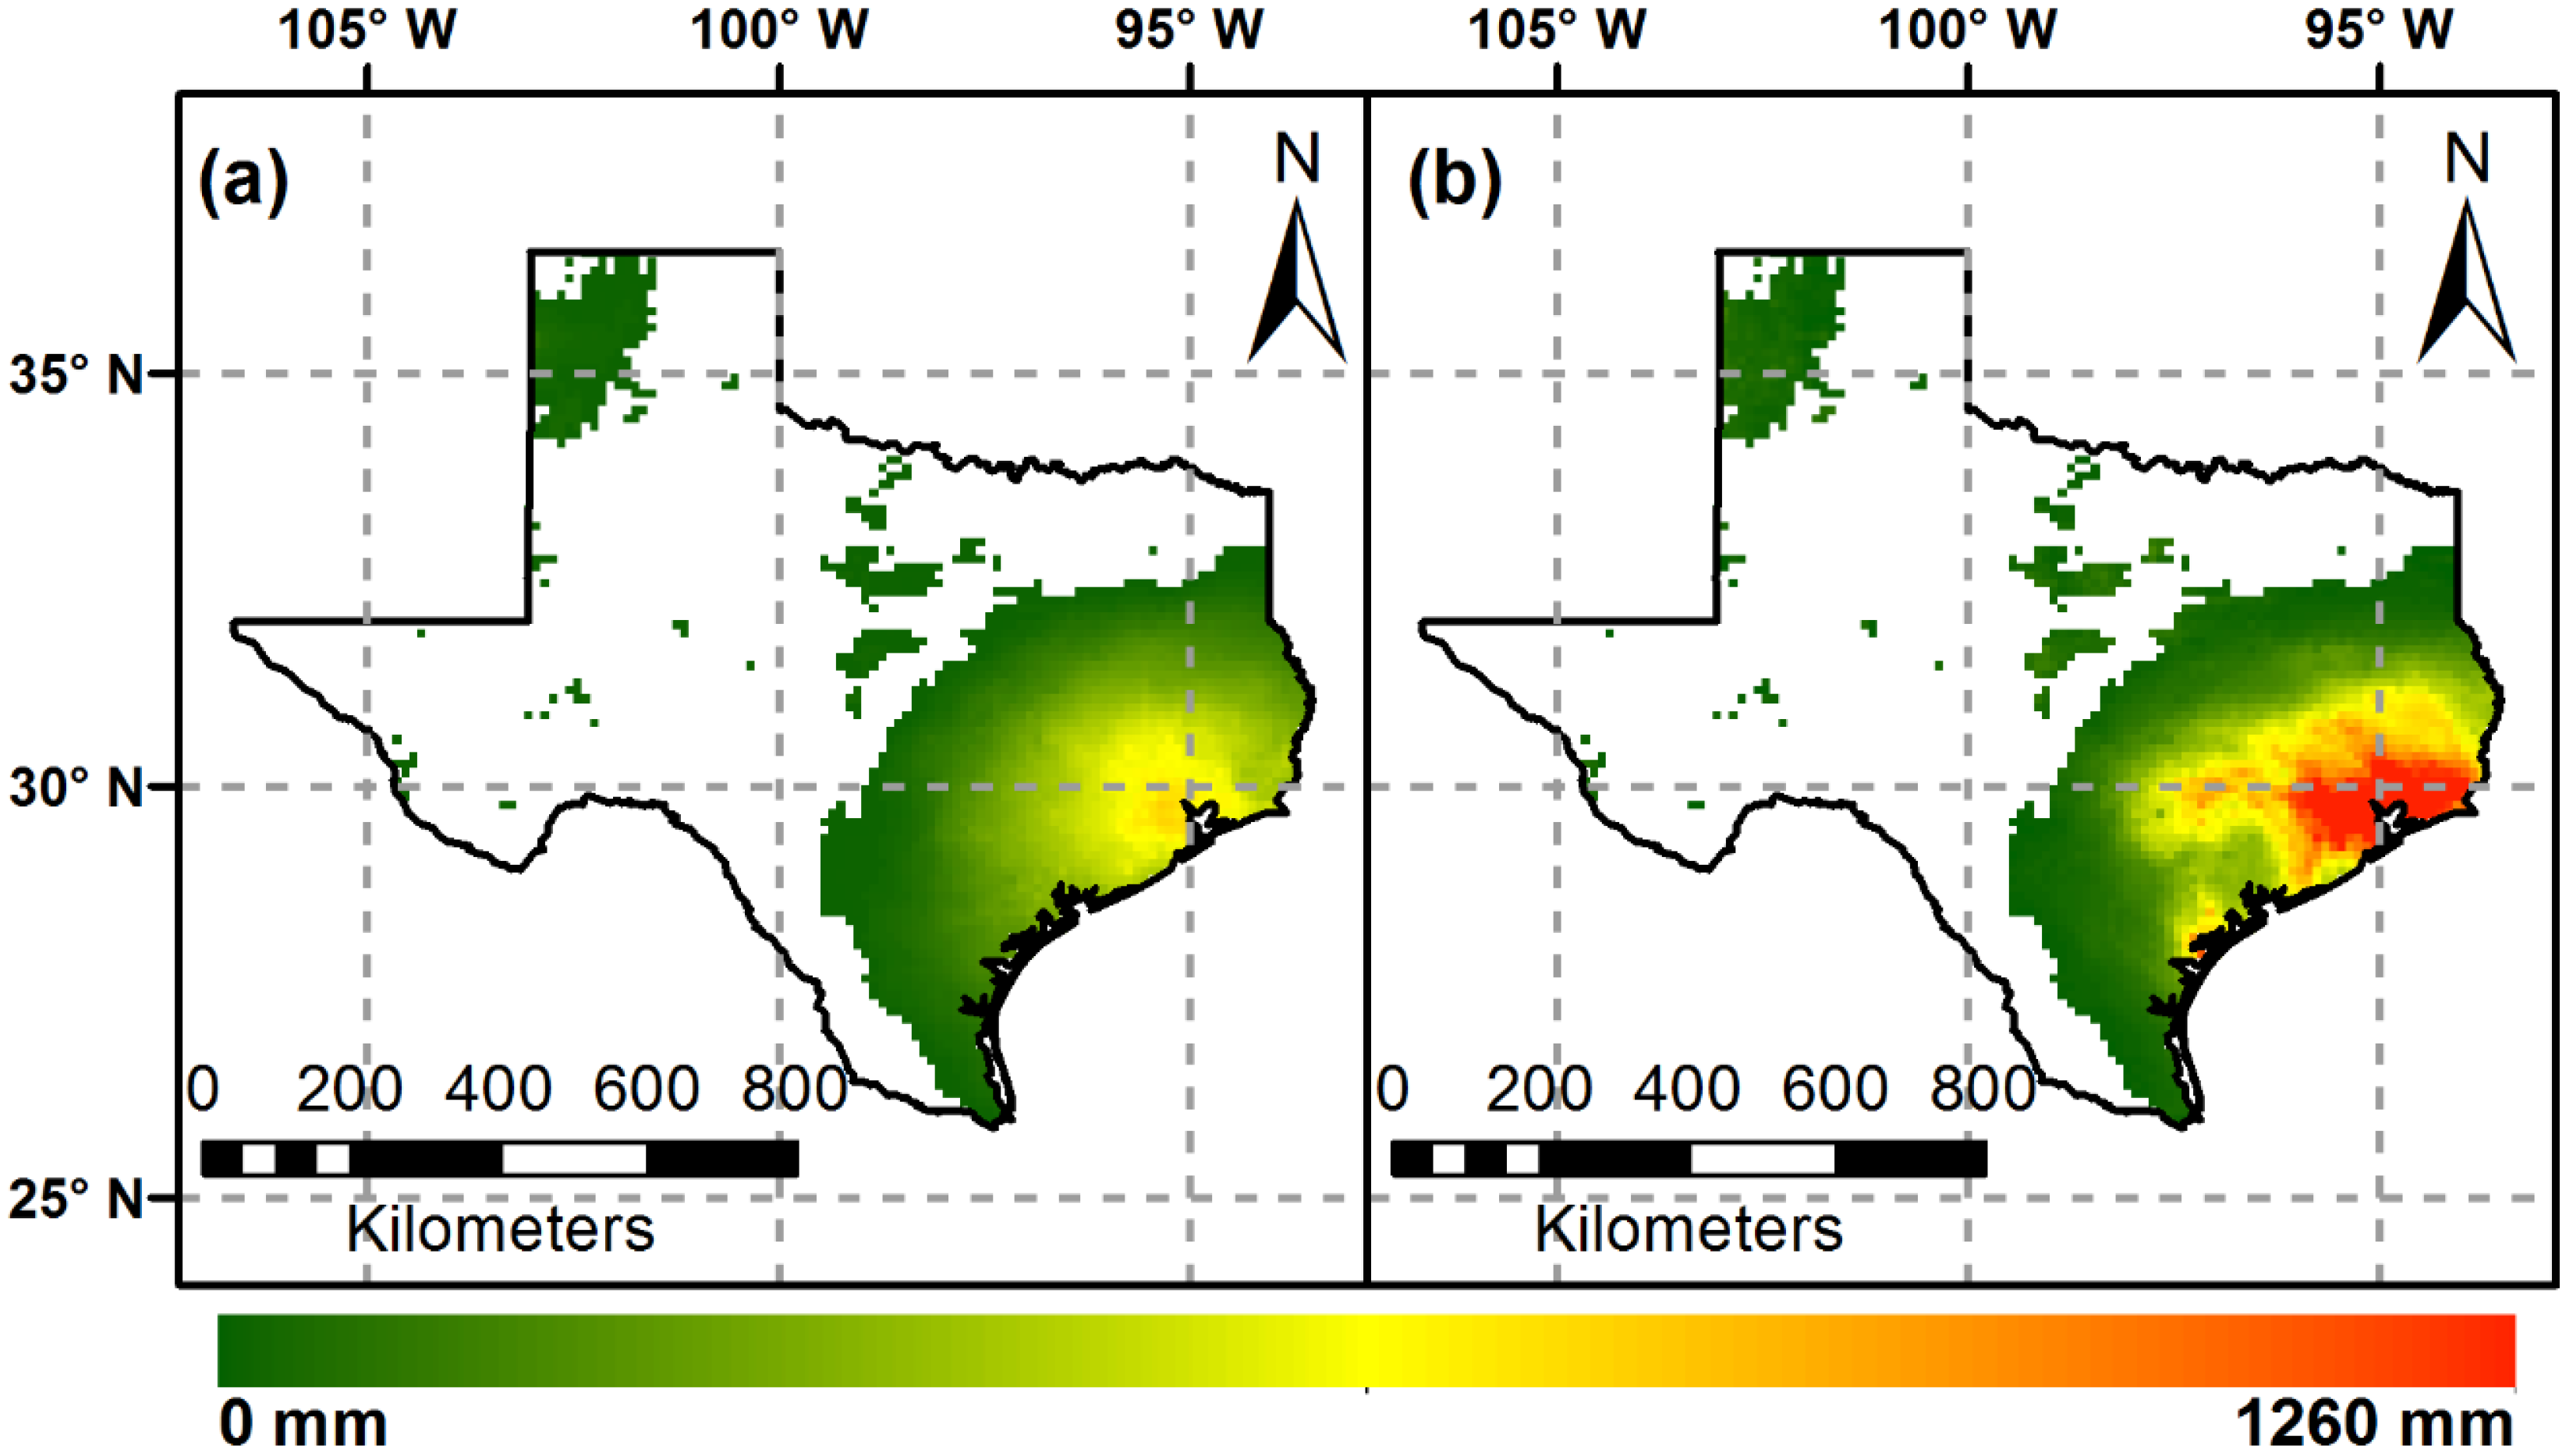
Cumulative rainfall rates show discrepancies in spatial patterns between the stage IV gridded product and the IMERG satellite product for the same grids during the study period (Figure 1). IMERG reveals the total precipitation approximately twice the NCEP stage-IV radar over the southeast of the state.
Index Classification
Two sets of performance measures were used for assessment of the IMERG product (Table 1). The first set includes Pearson Correlation Coefficient (CC), Mean Error (ME), Relative Bias (BIAS), Mean Bias Factor (MBF), and Root Mean Squared Error (RMSE). These statistical criteria mainly investigate the consistency of data based on reference precipitation radar data. The second set of indices provides information about the probability and accuracy of precipitation detection by IMERG product compared to reference radar products. Probability Of (rainfall) Detection (POD), False Alarm Ration (FAR), Critical Success Index (CSI), and Peirce Skill Score (PSS) are widely used to assess the probabilistic quality of satellite products in this category [12,30]. POD indicates the probability of rainfall detection by satellite while reference radar data reports the precipitation. FAR index explains the inaccuracy of the satellite falsely detecting rainfall, when radar has not detected the rainfall. CSI combines all events captured by both satellite and radar, including the satellite’s missed and false events according to reference radar observations. It shows more harmony between radar and satellite rainfall detection, while providing more deterministic vision of satellite data based on various spatiotemporal resolutions [12]. PSS is a difference between probability of detection and probability of false detection and indicates the system’s ability to capture rainfall values. The perfect value is 1 for this index while it can range between −1 and 1 [54,55].
3. Results and Discussion
The cumulative precipitation spatial pattern for both products provides more insight on how satellite and radar products can capture extreme rainfall (Figure 1). The cumulative precipitation rate captured by radar product ranged between 10 and 770 mm; while, the IMERG product ranged between 0 and 1260 mm for the same regions (Figure 1). Comparison of the two data products shows that the satellite product generally overestimated the precipitation rate while it failed to detect precipitation records in some regions. Both products detected the hurricane center at the east side of Texas, near Harris County (Houston Metropolitan), while their spatial patterns showed some discrepancies. In general, while radar products are more concentrated over the hurricane core; satellite products have broader extent and detected more southern cities (Rockport, Port Aransas and Corpus Christi) affected by the hurricane. Based on local observations and reports, satellite products may be able to trace the hurricane’s spatial pattern and path more reliably than radar products. Moreover, it showed that satellite products have generally better performance over grids with higher precipitation rates compared to grids with lower rates.
3.1. Basic Statistical Indices
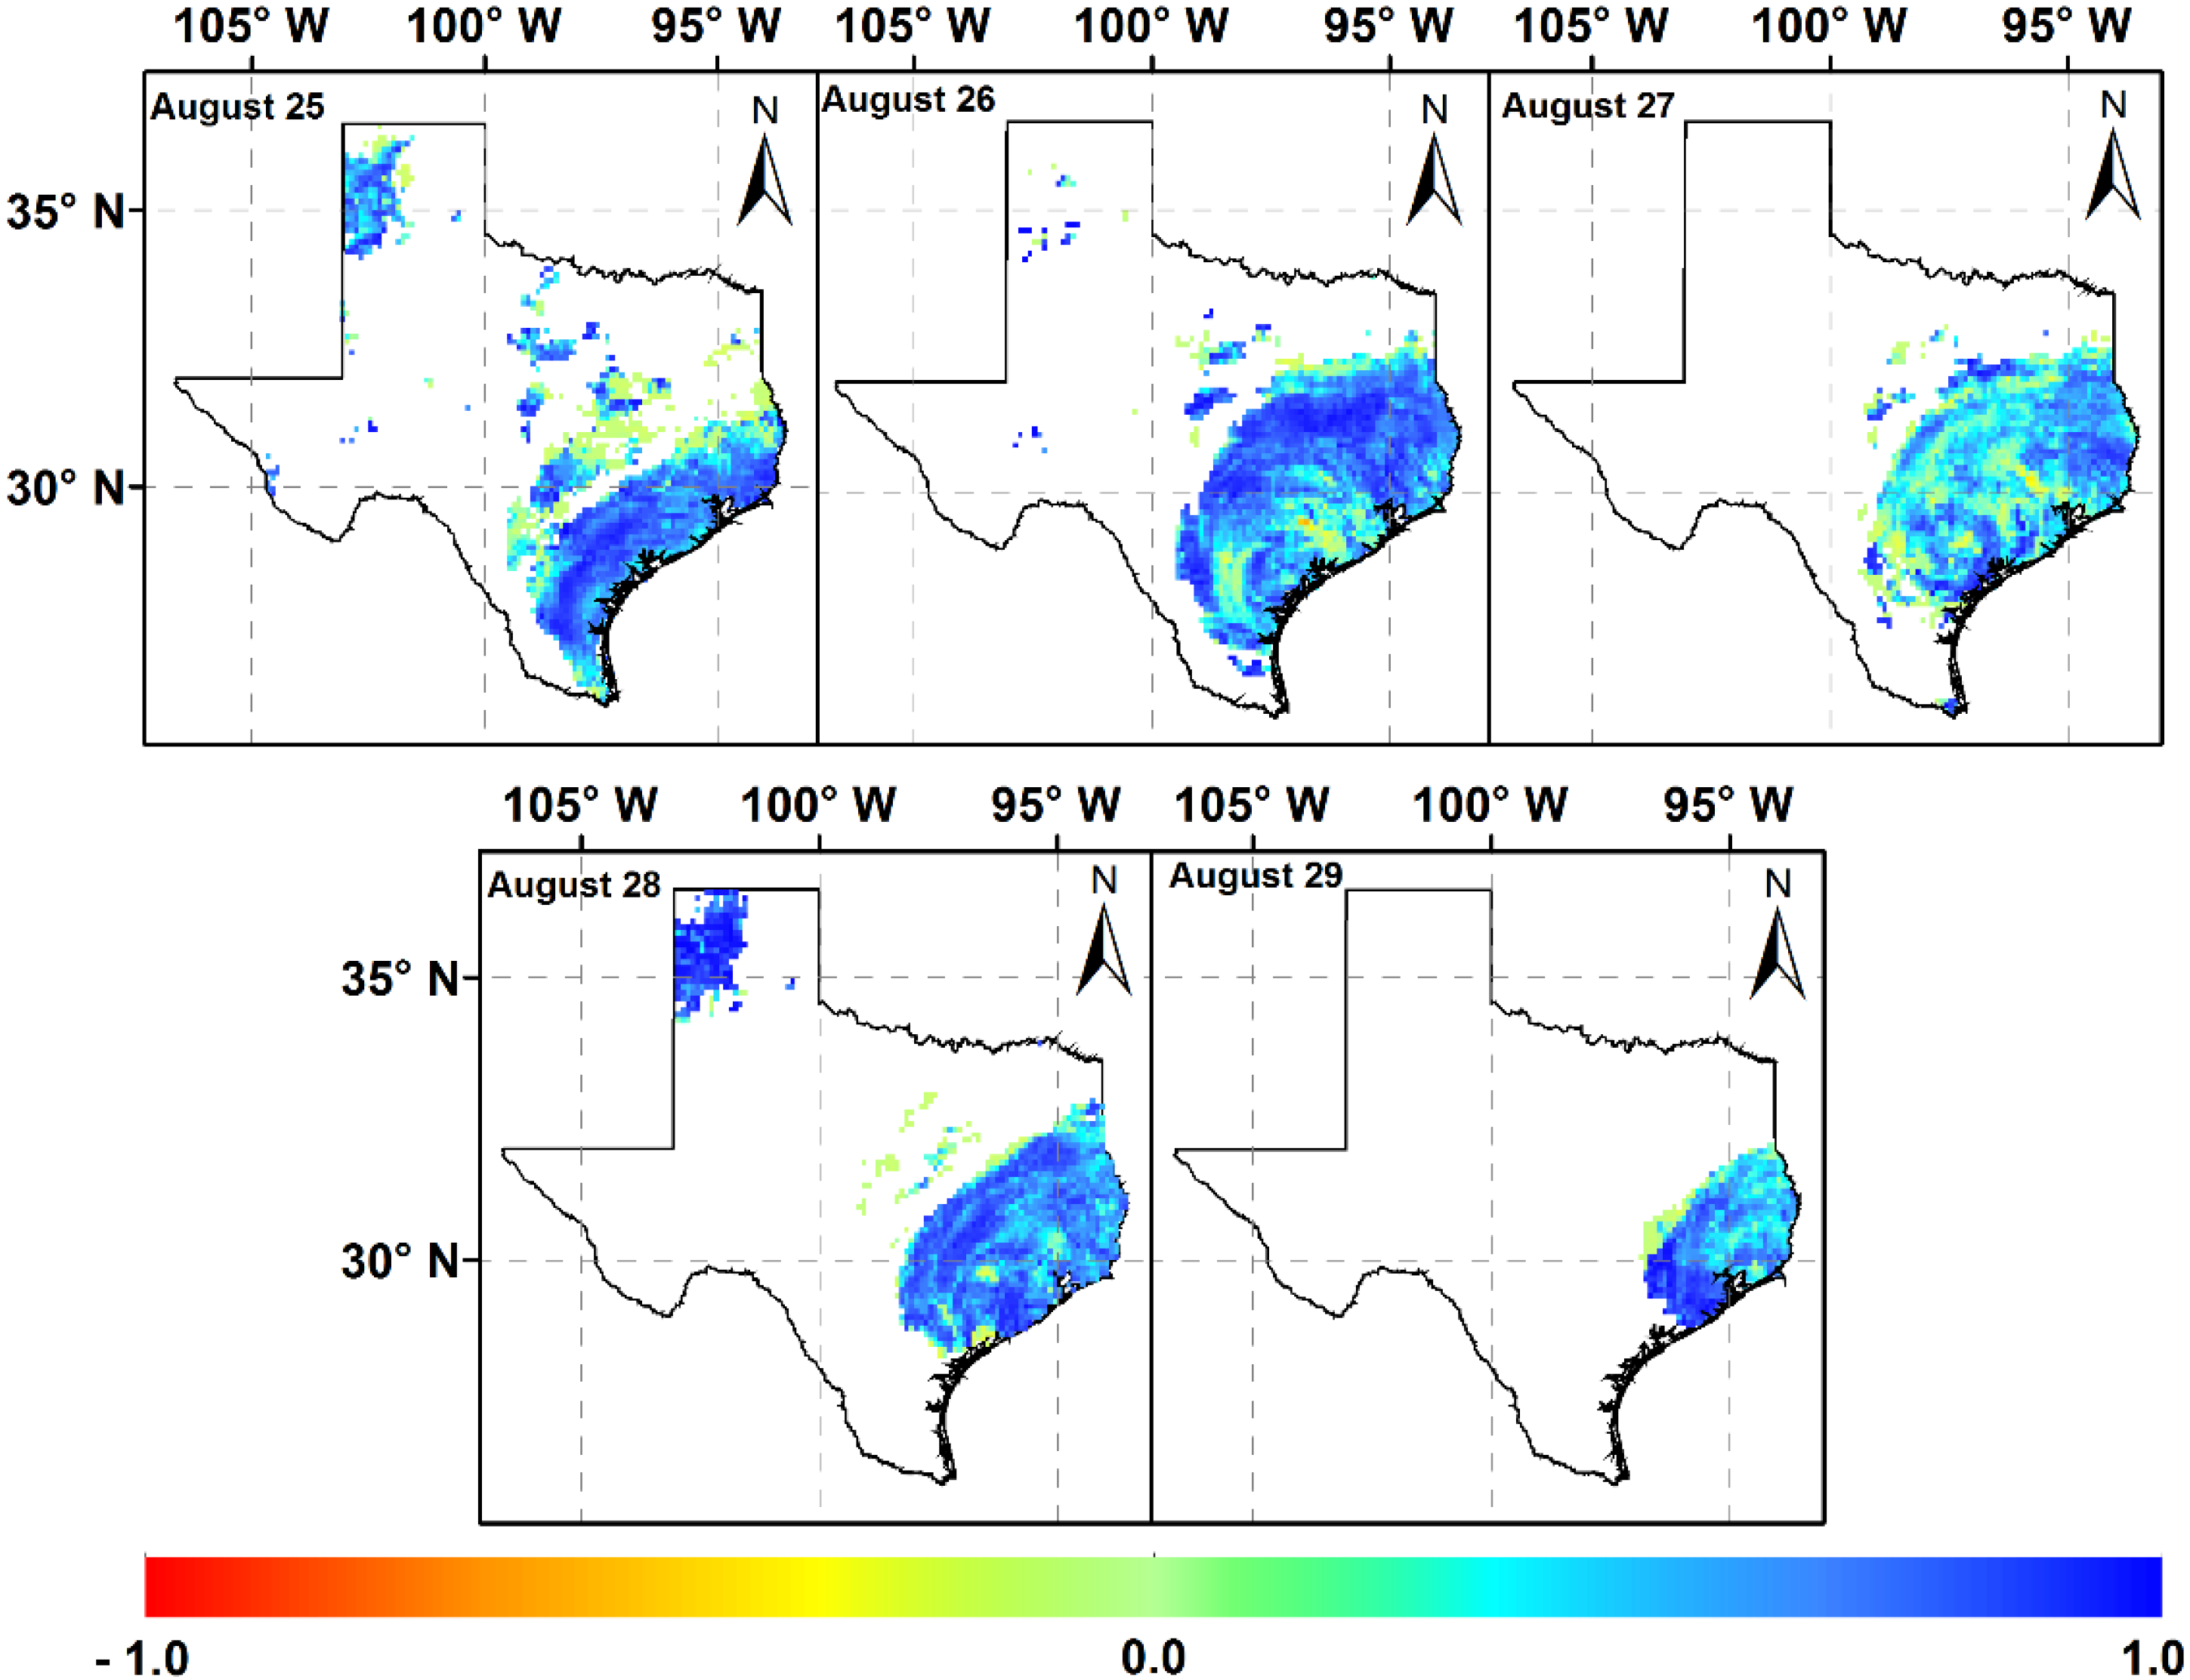
The CC spatial pattern between radar and satellite products during hurricane Harvey (25–29 August 2018) provides more details of satellite product consistency (Figure 2). Due to the higher spatial variability rate during hurricanes, tracking the correlation coefficient can reveal the performance of satellite products and illustrates hurricane characteristics.
Satellite products had lower consistency with the radar products near the center of hurricane; while, moving away from the center, the consistency improved (Figure 2). Additionally, it illustrates that although number of grids with the perfect CC value (1) is higher during day two, a higher level of inconsistency with the lowest recorded CC values for satellite product (−0.57) also occurred. It can reveal that a complex storm structure may cause inconsistency in measuring precipitation rates by IMERG product even during the same day and nearby cells. Two important issues should be noted: (1) the perfect value for CC was obtained for the first two days with higher rates of precipitation compared to the three days in which the precipitation rate decreased around 50% and (2) the hurricane complex structure can substantially affect the satellite performance especially at the hurricane core.
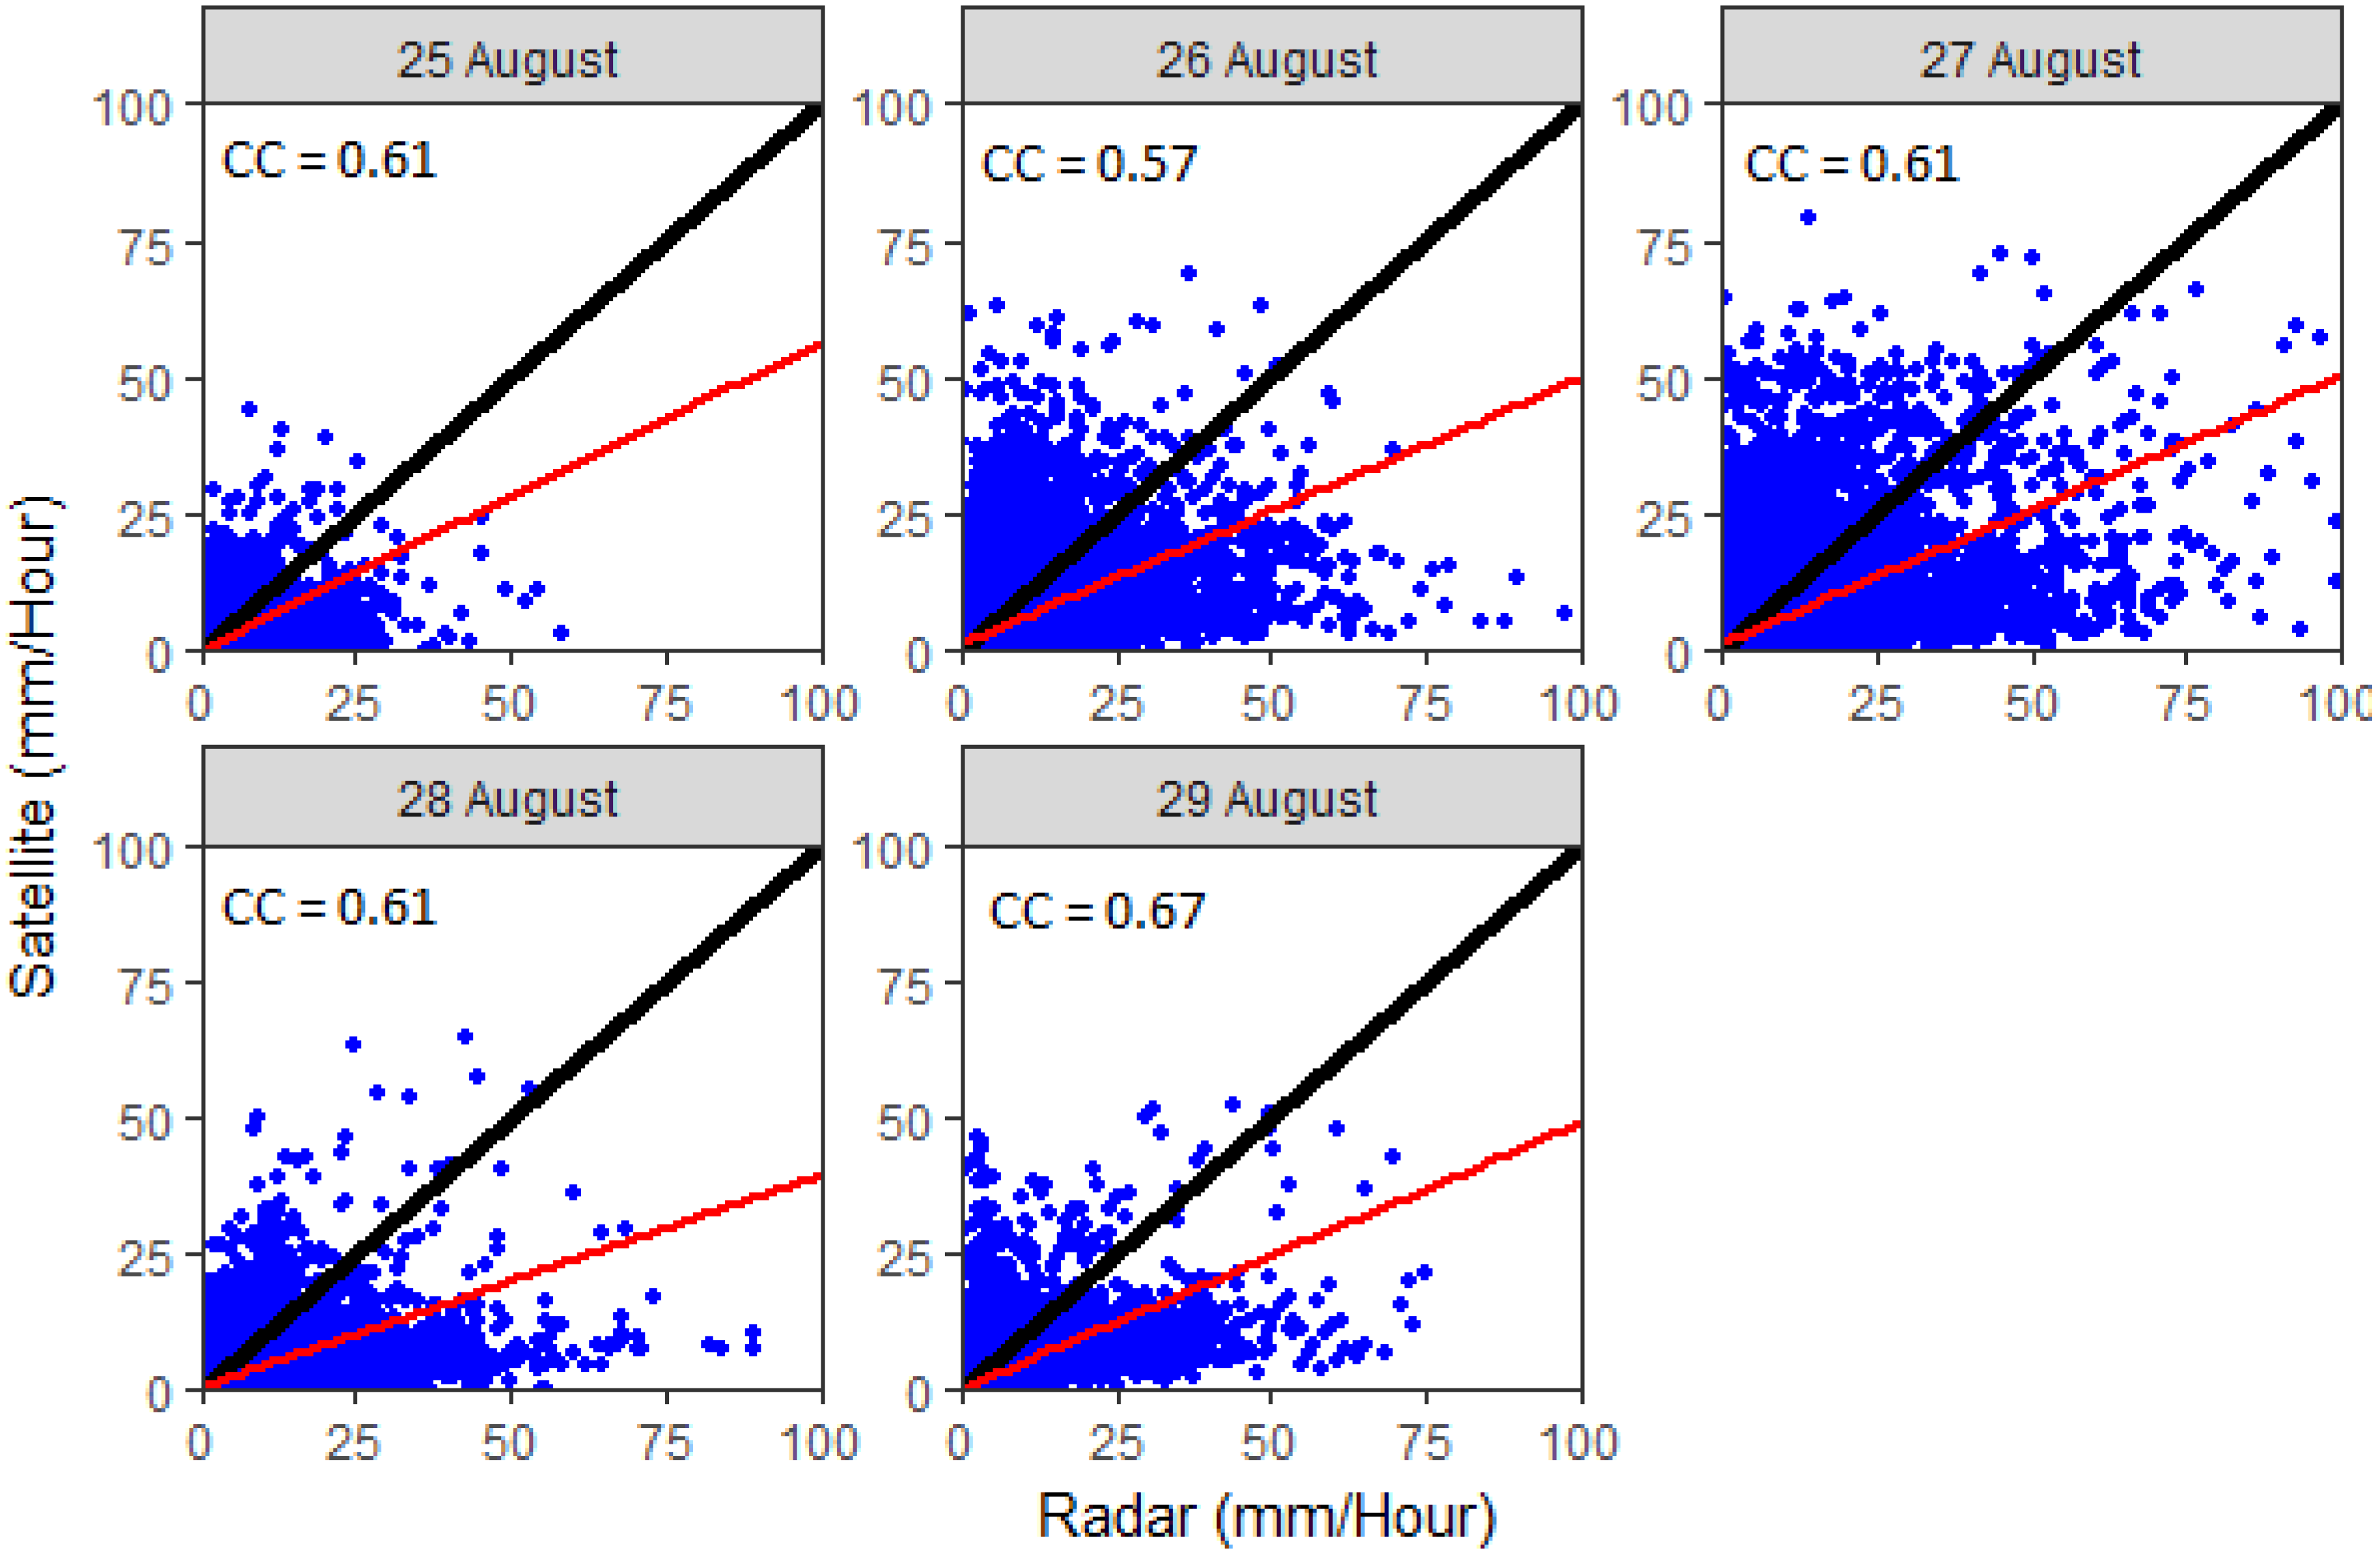
The scatterplot between IMERG satellite product and NCEP stage-IV radar product during hurricane Harvey provides more details of consistency between the two products during the event (Figure 3). It represents the correlation among the observations and estimations for each day during the hurricane span. Higher intensity rates during 26 and 27 August caused more expansion in scatter plots and lower correlation rates among the satellite data and the observations. Hence, the scatterplot provides a better vision on how the hurricane advanced to the category IV storm during this span and subsequently was recognized as one of the most destructive hurricanes in the United States. On 26 August, the day that the event advanced to the category IV hurricane with the maximum intensity and duration, the satellite product demonstrated the lowest correlation to the radar observations (Figure 3). It shows that satellite product has lower efficiency while capturing an excessive amount of rainfall due to the hurricane. At the end of the 5-day span (29 August), the correlation slightly improved. It reveals that IMERG product algorithm still needs improvement to fully capture the extreme rainfall events.
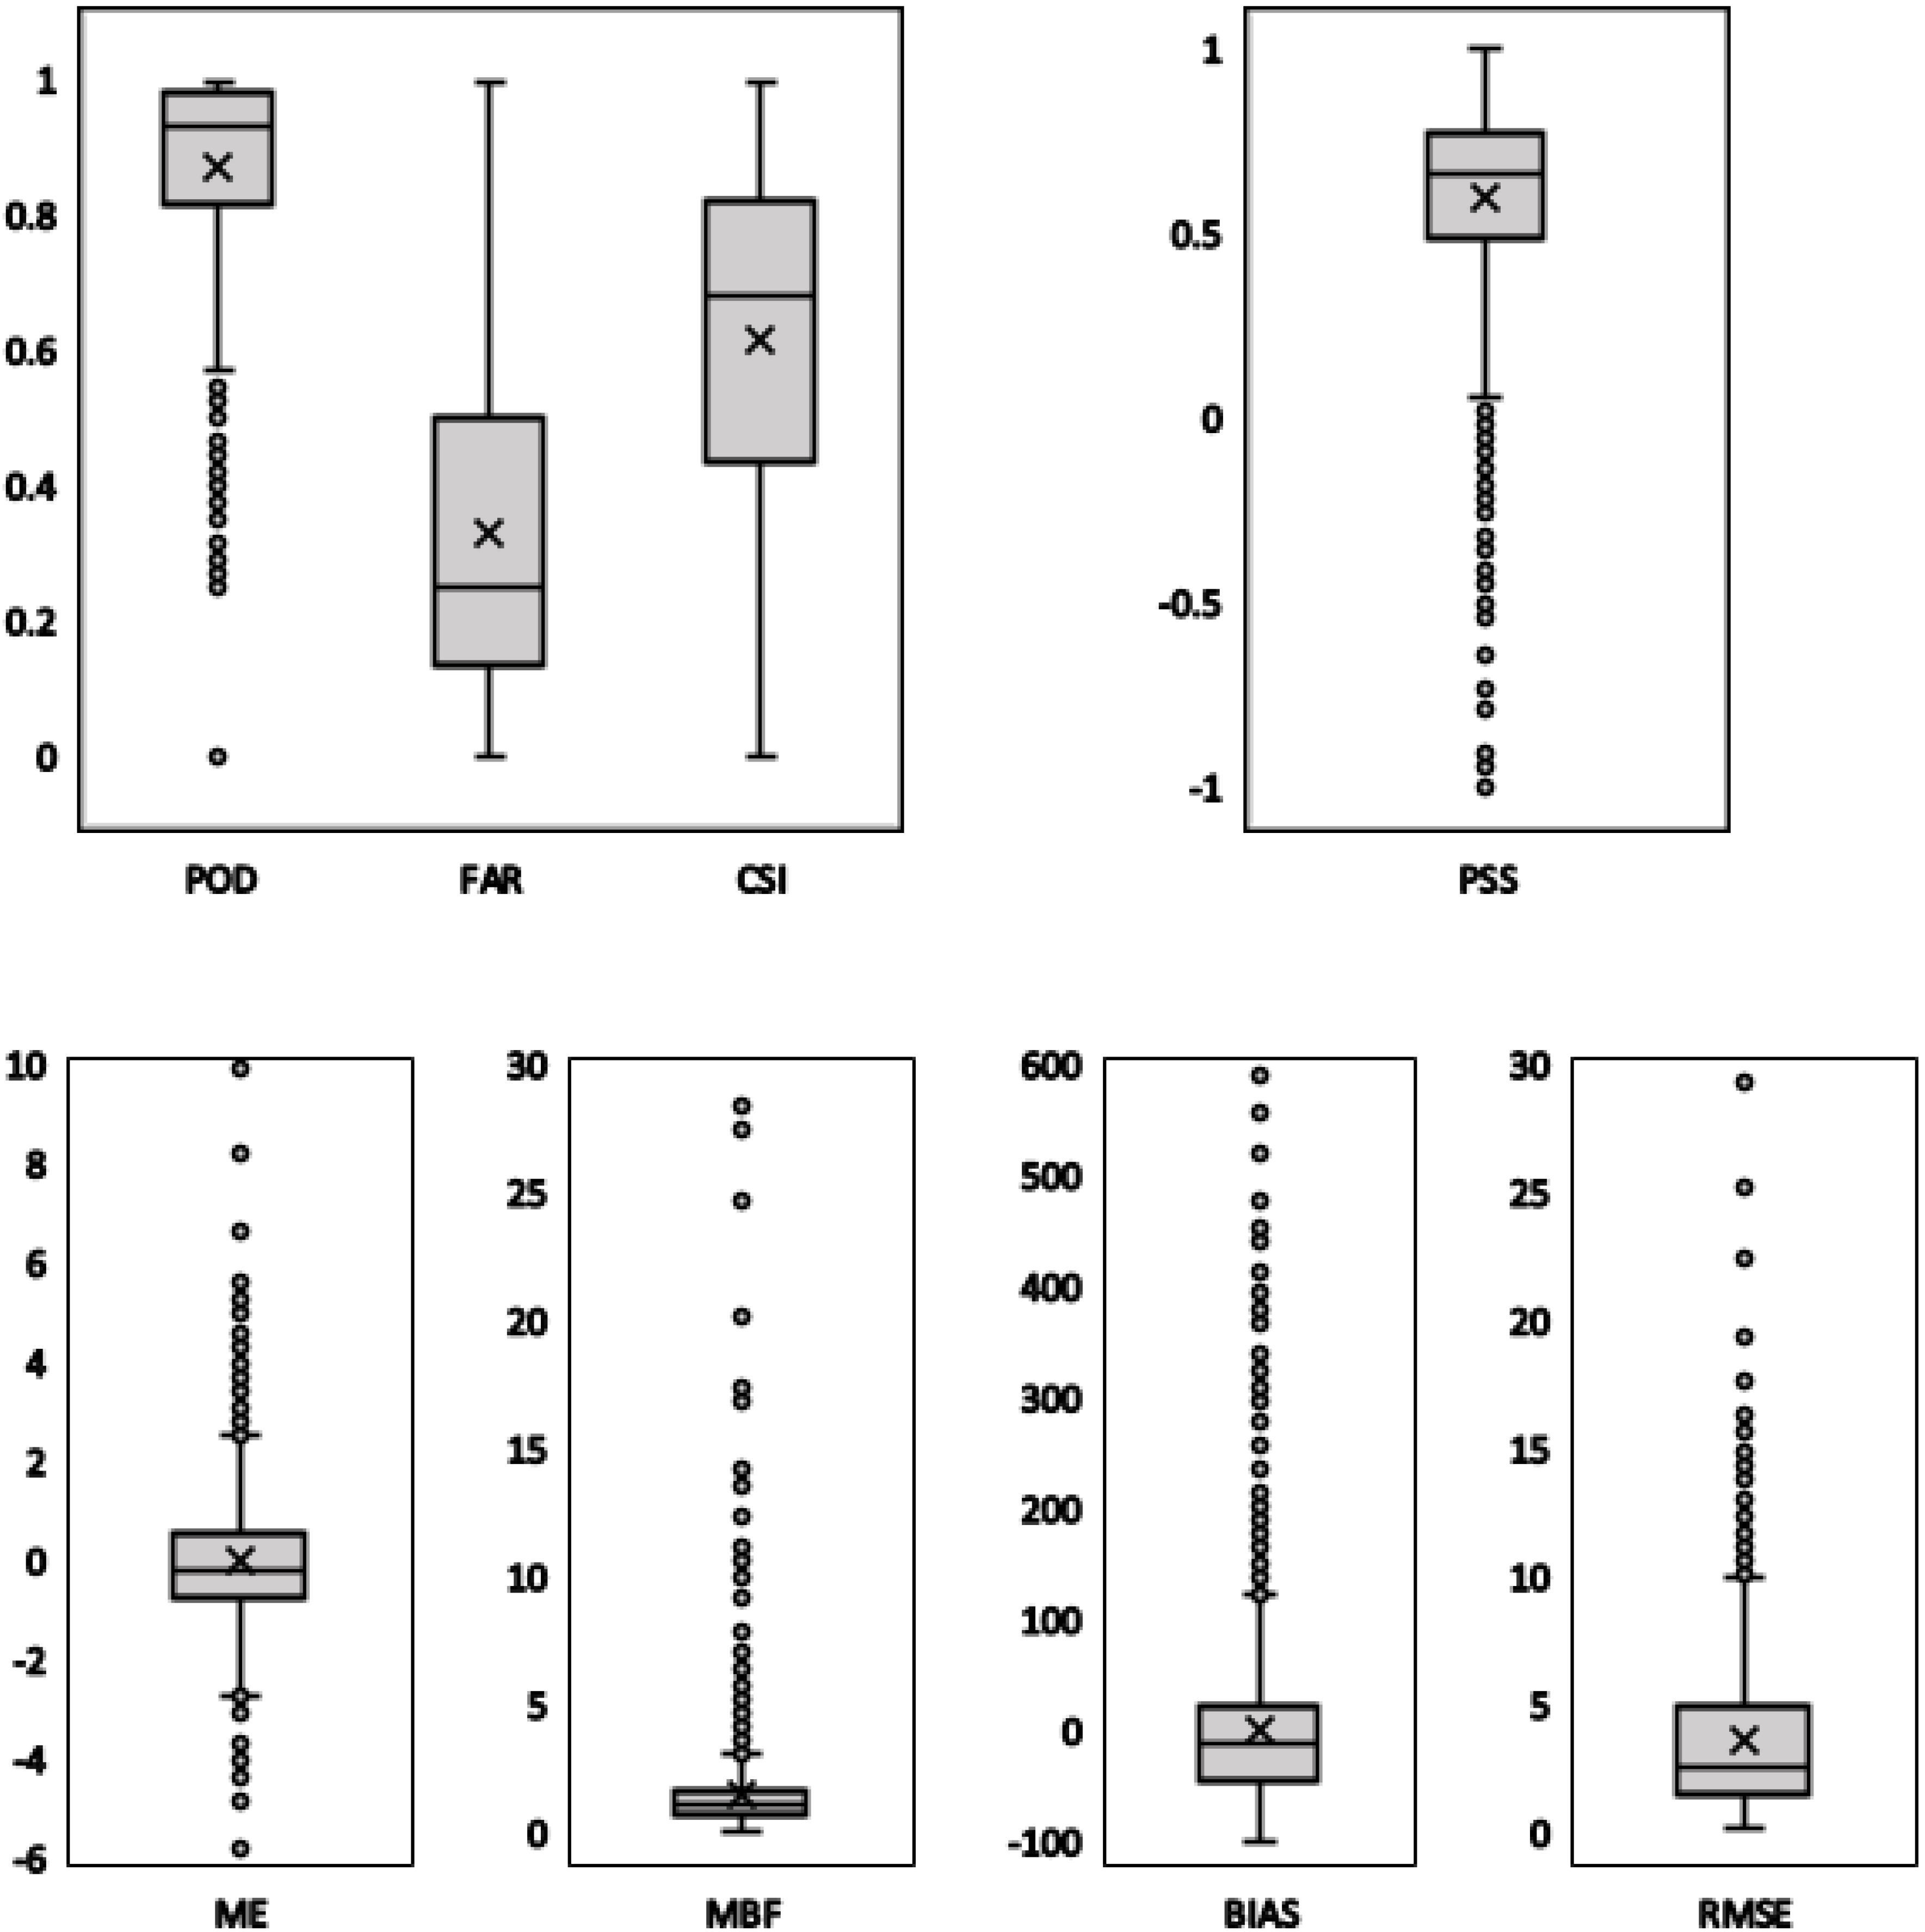
Box plots of probabilistic (POD, FAR, CSI and PSS) and basic (ME, MBF, BIAS and RMSE) statistical indices over grid boxes of the IMERG hourly precipitation product provide more details of satellite data distribution (Figure 4). The upper and lower edges of the central box are the first (25%) and third (75%) quantiles that represent the interquartile range (IQR), while the central inside band and cross sign represents the median and mean values respectively. The minimum and maximum observations which are usually selected among 10 to 90 percent of measurements are 1.5x(IQR) from the upper and lower quartiles. Farther observations show the outliers which can reveal inconsistency level between satellite and radar observations. Basic indices have strong symmetry toward the median band while probabilistic indices show wider distribution ranges. However, basic indices have more outliers compared to probabilistic ones. Additionally, basic indices have generally upper-band outliers (except ME), while probabilistic indices are commonly associated with lower-band outliers (Figure 4). It explains that satellite product overestimated precipitation values while they commonly underestimated event’s frequency and missed events. There are no outliers for FAR and CSI, while the POD and PSS have only lower outliers. The results show that although IMERG product may falsely report non-existing events or misses true events, its general performance was acceptable in detecting precipitation events as the POD’s upper quantile, median and mean values are very close to their perfect thresholds. In the case of basic indices, the distributions are wider but more symmetric. The distance between upper and lower quantiles are smaller while the outliers show that, during heavy events like hurricanes, the performance of IMERG can be weaker compared to more frequent events. While ME shows two-way outliers, MBF, BIAS and RMSE just have upper outliers and generally shows overestimation of satellite products. The general view to the box plots shows that during hurricanes IMERG generates more truncated data and dominantly overestimates the measurements.
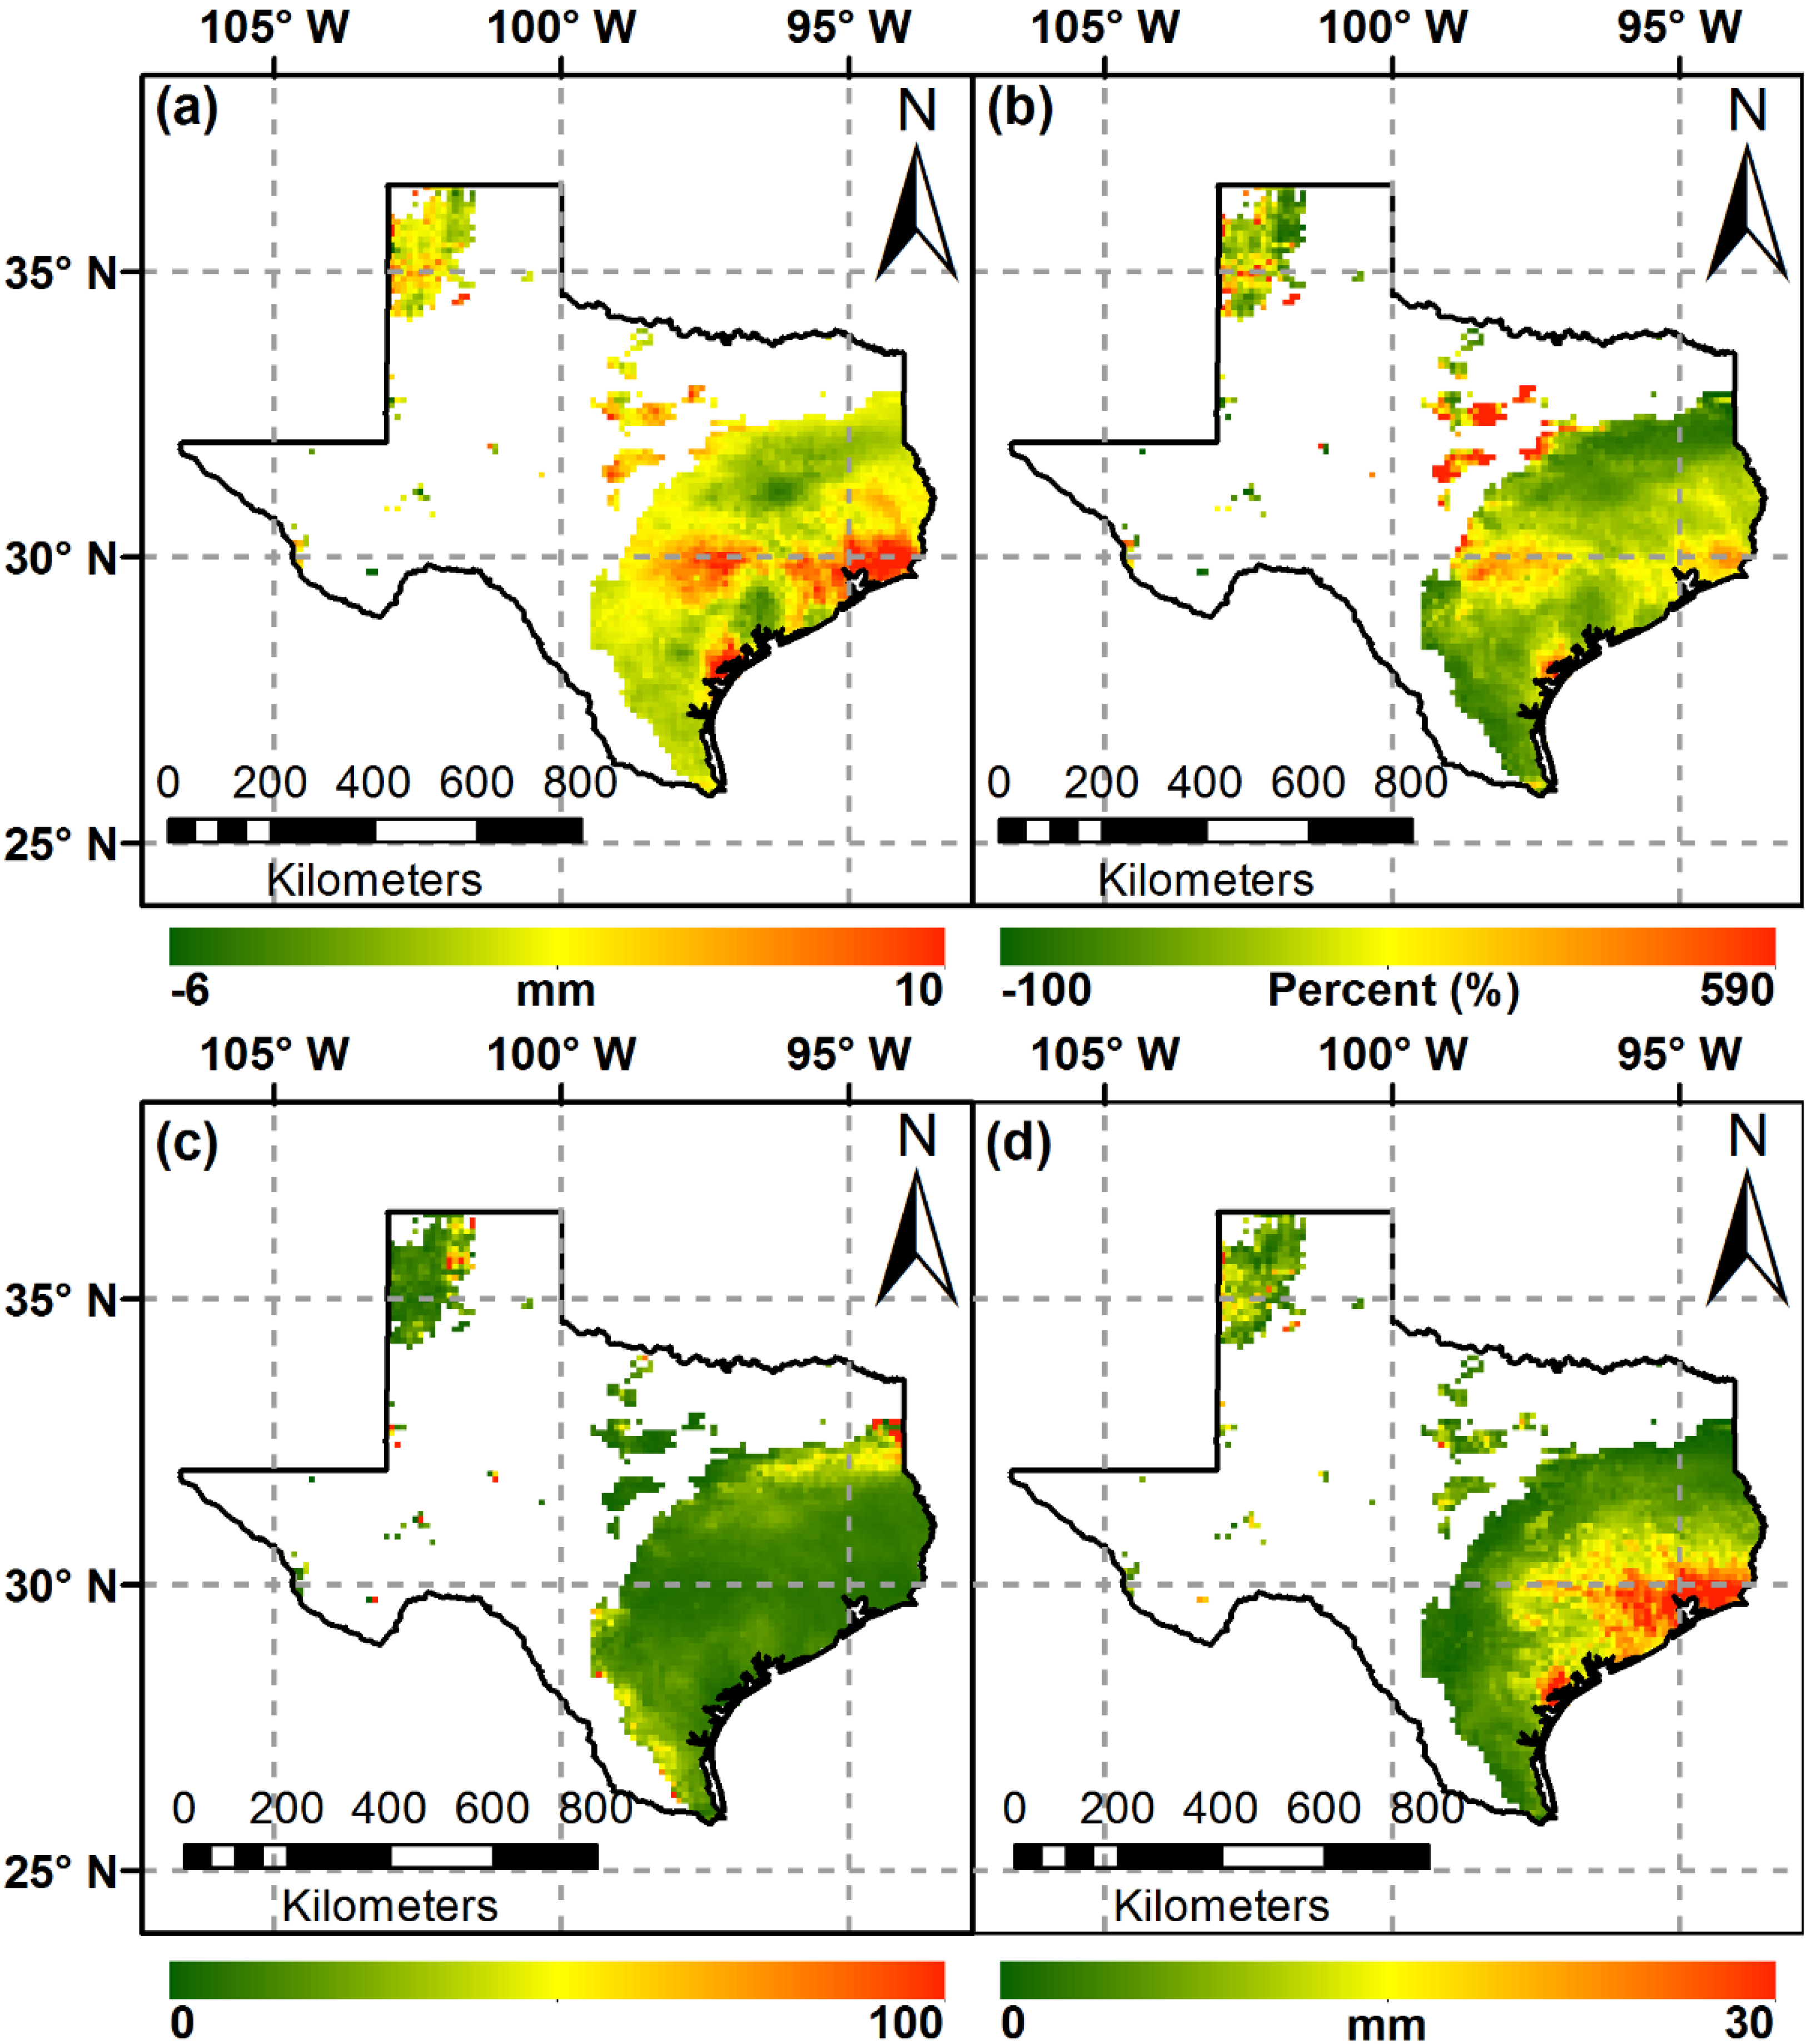
ME, BIAS, MBF and RMSE spatial variability and their values illustrates more details for IMERG product during hurricane Harvey (Figure 5).
The Mean Error (ME) index provides the estimation performance of the satellite product over the affected area by the hurricane (Figure 5a). It generally reveals that the satellite product overestimated precipitation over the regions with higher precipitation rates (mainly near Gulf of Mexico). For the regions with lower precipitation rates, the ME was mostly near its perfect value (0) or had negative values which shows some underestimation by the satellite product. Based on hurricane Harvey spatial variability (Figure 1), ME spatial variability shows that IMERG final-run product generally follows the same pattern. Moreover, although IMERG indicated over- and under-estimations during hurricane Harvey, the range (−6 to 10 mm) is within a reasonable range, which indicates the good performance of the IMERG product during the hurricane event. Figure 5b shows spatial variability of BIAS over the area affected by hurricane Harvey. This index also follows the same pattern as ME index, while it shows very good performance over regions with supercritical precipitation. The BIAS index was near zero or had positive values in more affected areas by hurricane, while other regions mainly had negative values. The mean bias factor (MBF) generally shows the good performance of IMERG product based on radar observations (Figure 5c). It shows that the IMERG product had generally reasonable estimation of precipitation rate. Figure 5d provides spatial distribution of root mean square error (RMSE) during the event. It presents the higher RMSE error rates over more eastern part with supercritical precipitation and near the Mexican Gulf. RMSE spatial pattern also strengthens this requirement/finding that IMERG final-run product algorithm needs improvement to better estimate precipitation rate during hurricanes.
3.2. Probabilistic Statistical Indices
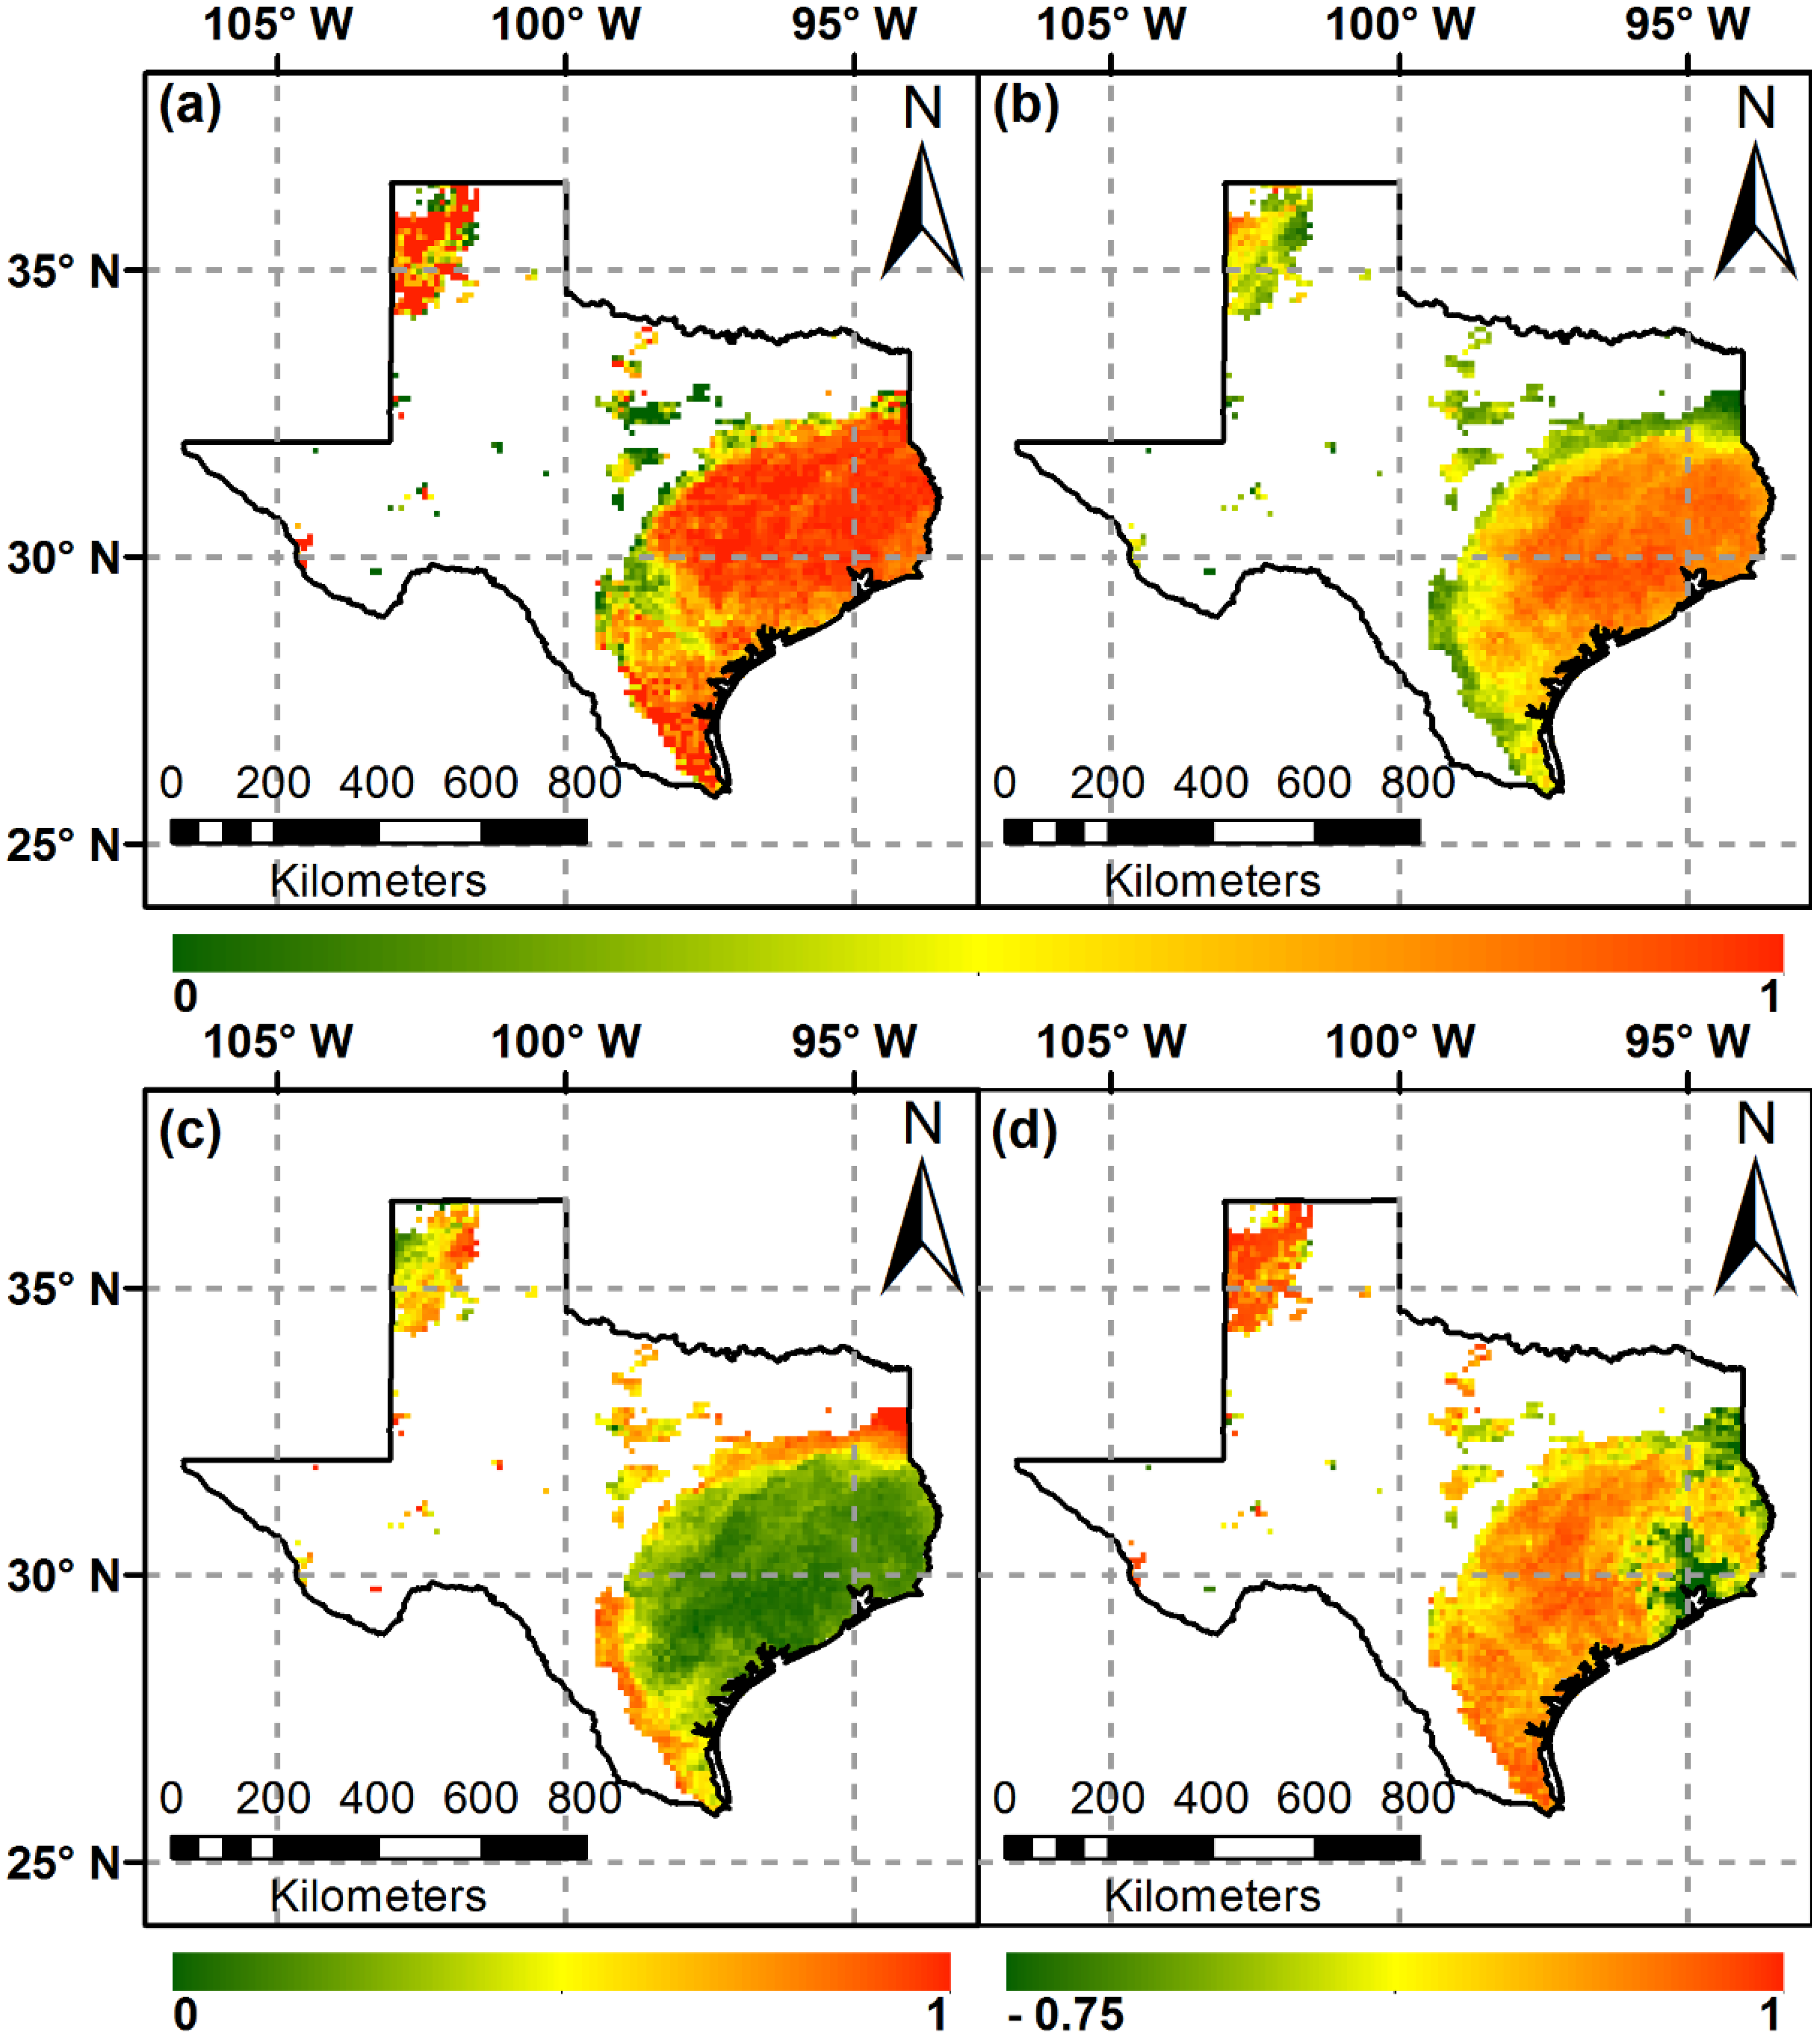
POD, CSI, FAR and PSS spatial patterns and their values for IMERG product during hurricane Harvey provide more details of probabilistic characteristics of satellite products (Figure 6).
IMERG products can satisfactorily detect precipitation in most parts hit by the event (Figure 6a). Most of the grids showed (nearly) perfect POD values. However, between southern and central regions (between Austin and San Antonio), the probability of detection rate was less than the others which may be due to the lower rate of precipitation in these areas and the weaker capability of IMERG in detecting lower precipitation rates. Moreover, POD values beyond the border line (grids with less than 10 mm precipitation during the hurricane event) are significantly lower, which shows that satellite products cannot correctly detect the precipitation events with lower intensities during hurricane events. Figure 6b shows the CSI values. It almost followed the same spatial pattern as POD with the smoother values. CSI values (contrary to POD values) are not close to their perfect amount in southern districts. POD and CSI values demonstrate that IMERG product can significantly capture hurricane events at the regions with higher intensities comparing to regions farther from the hurricane core. FAR values over the hurricane affected areas are near their perfect value, 0 (Figure 6c). It shows that in other regions most of the hits detected by satellite were also captured by radar. It shows that the IMERG product has the general ability to correctly detect precipitation hits during hurricanes. PSS values are shown in Figure 6d. It generally shows that the IMERG product has a reasonable performance in estimating rainfall. However, negative PSS values in the regions with the higher rate of precipitation (eastern parts-hurricane eye) illustrates the relative weakness of IMERG algorithm to capture extreme precipitation rates. Additionally, farther from the hurricane center, the PSS values are closer to their perfect value. It can lead to the conclusion that IMERG ability in estimating rainfall over the majority of affected areas by the hurricane is reasonable.
4. Conclusions
In this study, the performance of GPM-IMERG satellite final-run product regarding precipitation monitoring during hurricane events was analyzed. Hurricane Harvey, recognized as a Category 4 storm by National Hurricane Center (NHC), National Oceanic and Atmospheric Administration (NOAA), occurred during 25–29 August 2017. The quality of IMERG product at hourly and 0.1° × 0.1° resolutions to capture precipitation during the hurricane event was evaluated. For this purpose, hourly precipitation observation data from NCEP stage IV radar product adjusted by ground gauges, was used. To better capture the hurricane event, the analysis was only done over radar grids with cumulative rainfall records of over 10 mm. Due to the high rate of hurricane spatial variability, the data was comprehensively analyzed during five consecutive days. The hurricane increased to category 4 during 26 and 27 August. The results suggest that IMERG can appropriately detect and trace hurricane spatial path and variability while a better performance for the precipitation rates is needed. The main conclusions are given as follows:
- The general evaluation demonstrates that IMERG product can accurately detect and trace hurricane spatial pattern while the estimation algorithm needs to be improved to better measure the precipitation intensity.
- The IMERG hourly precipitation product shows significant overestimation over the storm’s peak regions dominantly near to the coast. This overestimation gradually decreases away from the hurricane center. The basic statistical indices generally reflect this overestimation of the satellite product, however, the small bias (±10%) over regions with the precipitation peak can smooth the unsatisfactory performance of satellite products based on these metrics.
- Statistical indices demonstrate an adequate performance of satellite products in detection of precipitation over the area affected by hurricane. Most of the area shows high POD (>0.8) value associated with low FAR (<0.2) which validates the satellite performance regarding the predictability of rainfall hits and not reporting false hits.
- CC spatial distributions during five consecutive days reveal that when the hurricane advanced to the category 4 storm (2nd day/26 August); although most of the sub-regions showed high CC values, near the center of the hurricane (hurricane eye), there is negative correlation. It indicates the complex internal structure and spatial variability of the storm was not well captured by the satellite. Additionally, lower quality input data from multiple sensors can intensify the inconsistency of the satellite products. Therefore, deeper understanding of IMERG product’s diurnal cycle may help to generate better algorithm for estimating precipitation records in future.
- The CSI and PSS indices generally reflected a satisfactory performance by the satellite products, however, for the sub-regions especially near to the eastern coast, IMERG could not capture the storm appropriately.
Based on the results of this study, the quality of IMERG product can be improved to estimate precipitation during extreme events such as hurricane or over sub-regions with extreme intensity rainfall. The results of the detailed analysis in this study can be utilized by atmospheric and earth scientists to better evaluate satellite products’ performance during hurricane events and improve forecasting algorithms. Accurate estimates of hurricanes (Category IV/V) can undoubtedly help to increase society’s safety and plan for better optimized evacuation of residents from areas affected by hazardous storms.
Author Contributions
E.O. and H.O.S. conceived and designed the methodology; E.O. analyzed the data; A.A.T. provided reviews and suggestions; E.O. prepared and wrote the paper with the multiple inputs and reviews by H.O.S. and A.A.T.
Funding
This research was partially funded by U.S. Army Research Office (Grant W912HZ-14-P-0160) and a grant from UTSA (University of Texas at San Antonio) Open Cloud Institute (OCI) entitled “Prediction of Crash Incidence and Severity on Texas Roadways”.
Acknowledgments
These supports are cordially acknowledged.
Conflicts of Interest
The authors declare no conflict of interest.
References
- Kidd, C.; Huffman, G. Global precipitation measurement. Meteorol. Appl. 2011, 18, 334–353. [Google Scholar] [CrossRef] [Green Version]
- Kidd, C.; Bauer, P.; Turk, J.; Huffman, G.J.; Joyce, R.; Hsu, K.L.; Braithwaite, D. Intercomparison of high-resolution precipitation products over northwest europe. J. Hydrometeorol. 2011, 13, 67–83. [Google Scholar] [CrossRef]
- Ma, Y.; Zhang, Y.; Yang, D.; Farhan, S.B. Precipitation bias variability versus various gauges under different climatic conditions over the third pole environment (tpe) region. Int. J. Climatol. 2015, 35, 1201–1211. [Google Scholar] [CrossRef]
- Ma, Y.; Tang, G.; Long, D.; Yong, B.; Zhong, L.; Wan, W.; Hong, Y. Similarity and error intercomparison of the gpm and its predecessor-trmm multisatellite precipitation analysis using the best available hourly gauge network over the tibetan plateau. Remote Sens. 2016, 8, 569. [Google Scholar] [CrossRef]
- Prakash, S.; Mitra, A.K.; AghaKouchak, A.; Liu, Z.; Norouzi, H.; Pai, D.S. A preliminary assessment of gpm-based multi-satellite precipitation estimates over a monsoon dominated region. J. Hydrol. 2018, 556, 865–876. [Google Scholar] [CrossRef]
- Afshari, S.; Tavakoly, A.A.; Rajib, M.A.; Zheng, X.; Follum, M.L.; Omranian, E.; Fekete, B.M. Comparison of new generation low-complexity flood inundation mapping tools with a hydrodynamic model. J. Hydrol. 2018, 556, 539–556. [Google Scholar] [CrossRef]
- Lane, J.; Kasparis, T.; Michaelides, S.; Metzger, P. A phenomenological relationship between vertical air motion and disdrometer derived a-b coefficients. Atmos. Res. 2018, 208, 94–105. [Google Scholar] [CrossRef]
- Guo, H.; Chen, S.; Bao, A.; Behrangi, A.; Hong, Y.; Ndayisaba, F.; Hu, J.; Stepanian, P.M. Early assessment of integrated multi-satellite retrievals for global precipitation measurement over china. Atmos. Res. 2016, 176, 121–133. [Google Scholar] [CrossRef]
- Liu, G.; Schwartz, F.W. Climate-driven variability in lake and wetland distribution across the prairie pothole region: From modern observations to long-term reconstructions with space-for-time substitution. Water Resour. Res. 2012, 48. [Google Scholar] [CrossRef]
- Javaheri, A.; Nabatian, M.; Omranian, E.; Babbar-Sebens, M.; Noh, J.S. Merging real-time channel sensor networks with continental-scale hydrologic models: A data assimilation approach for improving accuracy in flood depth predictions. Hydrology 2018, 5. [Google Scholar] [CrossRef]
- Michaelides, S.; Levizzani, V.; Anagnostou, E.; Bauer, P.; Kasparis, T.; Lane, J.E. Precipitation: Measurement, remote sensing, climatology and modeling. Atmos. Res. 2009, 94, 512–533. [Google Scholar] [CrossRef]
- Omranian, E.; Sharif, H.O. Evaluation of the global precipitation measurement (gpm) satellite rainfall products over the lower colorado river basin, texas. J. Am. Water Resour. Assoc. 2018. [Google Scholar] [CrossRef]
- Afshari, S.; Omranian, E.; Feng, D. Relative sensitivity of flood inundation extent by different physical and semi-empirical models. Natl. Water Center Innov. Program Summer Inst. Tech. Rep. 2016, 19–24. [Google Scholar] [CrossRef]
- Xie, P.; Arkin, P.A. Analyses of global monthly precipitation using gauge observations, satellite estimates, and numerical model predictions. J. Clim. 1996, 9, 840–858. [Google Scholar] [CrossRef]
- Tang, G.; Ma, Y.; Long, D.; Zhong, L.; Hong, Y. Evaluation of gpm day-1 imerg and tmpa version-7 legacy products over mainland china at multiple spatiotemporal scales. J. Hydrol. 2016, 533, 152–167. [Google Scholar] [CrossRef]
- Li, Z.; Yang, D.; Hong, Y. Multi-scale evaluation of high-resolution multi-sensor blended global precipitation products over the yangtze river. J. Hydrol. 2013, 500, 157–169. [Google Scholar] [CrossRef]
- Mishra, A.K.; Coulibaly, P. Developments in hydrometric network design: A review. Rev. Geophys. 2009, 47. [Google Scholar] [CrossRef] [Green Version]
- Germann, U.; Galli, G.; Boscacci, M.; Bolliger, M. Radar precipitation measurement in a mountainous region. Q. J. R. Meteorol. Soc. 2006, 132, 1669–1692. [Google Scholar] [CrossRef] [Green Version]
- Heinselman, P.L.; Priegnitz, D.L.; Manross, K.L.; Smith, T.M.; Adams, R.W. Rapid sampling of severe storms by the national weather radar testbed phased array radar. Weather Forecast. 2008, 23, 808–824. [Google Scholar] [CrossRef]
- Aksoy, A.; Dowell, D.C.; Snyder, C. A multicase comparative assessment of the ensemble kalman filter for assimilation of radar observations. Part i: Storm-scale analyses. Mon. Weather Rev. 2009, 137, 1805–1824. [Google Scholar] [CrossRef]
- Gabella, M.; Morin, E.; Notarpietro, R.; Michaelides, S. Winter precipitation fields in the southeastern mediterranean area as seen by the ku-band spaceborne weather radar and two c-band ground-based radars. Atmos. Res. 2013, 119, 120–130. [Google Scholar] [CrossRef]
- Sharif, H.O.; Ogden, F.L.; Krajewski, W.F.; Xue, M. Numerical simulations of radar rainfall error propagation. Water Resour. Res. 2002, 38, 15-11–15-14. [Google Scholar] [CrossRef]
- Mei, Y.; Anagnostou, E.N.; Nikolopoulos, E.I.; Borga, M. Error analysis of satellite precipitation products in mountainous basins. J. Hydrometeorol. 2014, 15, 1778–1793. [Google Scholar] [CrossRef]
- Sharif, H.O.; Ogden, F.L. Mass-conserving remapping of radar data onto two-dimensional cartesian coordinates for hydrologic applications. J. Hydrometeorol. 2014, 15, 2190–2202. [Google Scholar] [CrossRef]
- Tapiador, F.J.; Turk, F.J.; Petersen, W.; Hou, A.Y.; García-Ortega, E.; Machado, L.A.T.; Angelis, C.F.; Salio, P.; Kidd, C.; Huffman, G.J.; et al. Global precipitation measurement: Methods, datasets and applications. Atmos. Res. 2012, 104, 70–97. [Google Scholar] [CrossRef]
- Hossain, F.; Katiyar, N. Advancing the use of satellite rainfall datasets for flood prediction in ungauged basins: The role of scale, hydrologic process controls and the global precipitation measurement mission. In Quantitative Information Fusion for Hydrological Sciences; Cai, X., Yeh, T.C.J., Eds.; Springer: Berlin/Heidelberg, Germany, 2008; Volume 79, pp. 163–181. [Google Scholar]
- Hobouchian, M.P.; Salio, P.; García Skabar, Y.; Vila, D.; Garreaud, R. Assessment of satellite precipitation estimates over the slopes of the subtropical andes. Atmos. Res. 2017, 190, 43–54. [Google Scholar] [CrossRef]
- Salio, P.; Hobouchian, M.P.; García Skabar, Y.; Vila, D. Evaluation of high-resolution satellite precipitation estimates over southern south america using a dense rain gauge network. Atmos. Res. 2015, 163, 146–161. [Google Scholar] [CrossRef]
- Retalis, A.; Tymvios, F.; Katsanos, D.; Michaelides, S. Downscaling chirps precipitation data: An artificial neural network modelling approach. Int. J. Remote Sens. 2017, 38, 3943–3959. [Google Scholar] [CrossRef]
- Prakash, S.; Mitra, A.K.; Pai, D.S.; AghaKouchak, A. From trmm to gpm: How well can heavy rainfall be detected from space? Adv. Water Resour. 2016, 88, 1–7. [Google Scholar] [CrossRef]
- Karbalaee, N.; Hsu, K.; Sorooshian, S.; Braithwaite, D. Bias adjustment of infrared-based rainfall estimation using passive microwave satellite rainfall data. J. Geophys. Res.-Atmos. 2017, 122, 3859–3876. [Google Scholar] [CrossRef]
- Sharifi, E.; Steinacker, R.; Saghafian, B. Assessment of gpm-imerg and other precipitation products against gauge data under different topographic and climatic conditions in iran: Preliminary results. Remote Sens. 2016, 8, 135. [Google Scholar] [CrossRef]
- Gaona, M.F.R.; Overeem, A.; Leijnse, H.; Uijlenhoet, R. First-year evaluation of gpm rainfall over the netherlands: Imerg day 1 final run (v03d). J. Hydrometeorol. 2016, 17, 2799–2814. [Google Scholar] [CrossRef]
- Wang, Z.; Zhong, R.; Lai, C.; Chen, J. Evaluation of the gpm imerg satellite-based precipitation products and the hydrological utility. Atmos. Res. 2017, 196, 151–163. [Google Scholar] [CrossRef]
- Xu, R.; Tian, F.; Yang, L.; Hu, H.; Lu, H.; Hou, A. Ground validation of gpm imerg and trmm 3b42v7 rainfall products over southern tibetan plateau based on a high-density rain gauge network. J. Geophys. Res.-Atmos. 2017, 122, 910–924. [Google Scholar] [CrossRef]
- Li, N.; Tang, G.; Zhao, P.; Hong, Y.; Gou, Y.; Yang, K. Statistical assessment and hydrological utility of the latest multi-satellite precipitation analysis imerg in ganjiang river basin. Atmos. Res. 2017, 183, 212–223. [Google Scholar] [CrossRef]
- Habib, E.; Haile, A.T.; Tian, Y.; Joyce, R.J. Evaluation of the high-resolution cmorph satellite rainfall product using dense rain gauge observations and radar-based estimates. J. Hydrometeorol. 2012, 13, 1784–1798. [Google Scholar] [CrossRef]
- Chen, S.; Liu, H.; You, Y.; Mullens, E.; Hu, J.; Yuan, Y.; Huang, M.; He, L.; Luo, Y.; Zeng, X.; et al. Evaluation of high-resolution precipitation estimates from satellites during july 2012 beijing flood event using dense rain gauge observations. PLoS ONE 2014. [Google Scholar] [CrossRef] [PubMed]
- Miao, C.; Ashouri, H.; Hsu, K.; Sorooshian, S.; Duan, Q. Evaluation of the persiann-cdr daily rainfall estimates in capturing the behavior of extreme precipitation events over china. J. Hydrometeorol. 2015, 16, 1387–1396. [Google Scholar] [CrossRef]
- Katiraie-Boroujerdy, P.-S.; Nasrollahi, N.; Hsu, K.; Sorooshian, S. Evaluation of satellite-based precipitation estimation over iran. J. Arid Environ. 2013, 97, 205–219. [Google Scholar] [CrossRef]
- Chen, Z.; Qin, Y.; Shen, Y.; Zhang, S. Evaluation of global satellite mapping of precipitation project daily precipitation estimates over the chinese mainland. Adv. Meteorol. 2016, 2016. [Google Scholar] [CrossRef]
- Tian, Y.; Peters-Lidard, C.D.; Adler, R.F.; Kubota, T.; Ushio, T. Evaluation of gsmap precipitation estimates over the contiguous united states. J. Hydrometeorol. 2009, 11, 566–574. [Google Scholar] [CrossRef]
- Katsanos, D.; Retalis, A.; Tymvios, F.; michaelides, S. Analysis of precipitation extremes based on satellite (chirps) and in situ dataset over cyprus. Nat. Hazards 2016, 83, 53–63. [Google Scholar] [CrossRef]
- Chen, S.; Hong, Y.; Cao, Q.; Gourley, J.J.; Kirstetter, P.; Yong, B.; Tian, Y.; Zhang, Z.; Shen, Y.; Hu, J.; et al. Similarity and difference of the two successive V6 and V7 TRMM multisatellite precipitation analysis performance over China. J. Geophys. Res.-Atmos. 2013, 118, 13–060. [Google Scholar] [CrossRef]
- Chen, Y.; Ebert, E.E.; Walsh, K.J.E.; Davidson, N.E. Evaluation of trmm 3b42 precipitation estimates of tropical cyclone rainfall using pacrain data. J. Geophys. Res.-Atmos. 2013, 118, 2184–2196. [Google Scholar] [CrossRef]
- Shrestha, R.; Houser, P.R.; Anantharaj, V.G. An optimal merging technique for high-resolution precipitation products. J. Adv. Model. Earth Syst. 2011, 3. [Google Scholar] [CrossRef] [Green Version]
- Wolter, K.; Eischeid, J.K.; Cheng, L.; Hoerling, M. What history tells us about 2015 US daily rainfall extremes. Bull. Am. Meteorol. Soc. 2016, 97, S9–S13. [Google Scholar] [CrossRef]
- Craig, R.K. Harvey, Irma, and the NFIP: Did the 2017 Hurricane Season Matter to Flood Insurance Reauthorization? Available online: https://ssrn.com/abstract=3129088 (accessed on 23 February 2018).
- Costliest U.S. Tropical Cyclones Tables Updated. Available online: https://www.nhc.noaa.gov/news/UpdatedCostliest.pdf (accessed on 26 January 2018).
- Omranian, E.; Sharif, H.; Dessouky, S.; Weissmann, J. Exploring rainfall impacts on the crash risk on texas roadways: A crash-based matched-pairs analysis approach. Accid. Anal. Prev. 2018, 117, 10–20. [Google Scholar] [CrossRef] [PubMed]
- Nielsen-Gammon, J.W.; Zhang, F.; Odins, A.M.; Myoung, B. Extreme rainfall in texas: Patterns and predictability. Phys. Geogr. 2005, 26, 340–364. [Google Scholar] [CrossRef]
- Furl, C.; Sharif, H.; Zeitler, J.W.; Hassan, A.E.; Joseph, J. Hydrometeorology of the catastrophic Blanco river flood in South Texas, May 2015. J. Hydrol. Reg. Stud. 2018, 15, 90–104. [Google Scholar] [CrossRef]
- Lin, Y.; Mitchell, K.E. The NCEP Stage II/IV Hourly Precipitation Analysis: Development and Applications. Available online: https://ams.confex.com/ams/Annual2005/techprogram/paper_83847.htm (accessed on 12 June 2018).
- Dos Reis, B.J.; Rennó, D.C.; Lopes, S.E. Validation of satellite rainfall products over a mountainous watershed in a humid subtropical climate region of brazil. Remote Sens. 2017, 9. [Google Scholar] [CrossRef]
- Manzato, A. A note on the maximum peirce skill score. Weather Forecast. 2007, 22, 1148–1154. [Google Scholar] [CrossRef]
Figure 1.
Cumulative precipitation measurement (mm) and spatial pattern captured by (a) NCEP stage-IV Radar (b) GPM-IMERG satellite final-run product, during Hurricane Harvey from 25 to 29, August 2018.
Figure 1.
Cumulative precipitation measurement (mm) and spatial pattern captured by (a) NCEP stage-IV Radar (b) GPM-IMERG satellite final-run product, during Hurricane Harvey from 25 to 29, August 2018.

Figure 2.
Spatial distributions of the Correlation Coefficient (CC) factor for hourly IMERG precipitation product at 0.1° × 0.1° resolution over Texas from 25 to 29 August 2017.
Figure 2.
Spatial distributions of the Correlation Coefficient (CC) factor for hourly IMERG precipitation product at 0.1° × 0.1° resolution over Texas from 25 to 29 August 2017.

Figure 3.
Scatterplots of IMERG satellite product and stage-IV NCEP radar precipitation product with an hourly temporal resolution between 25th and 29th August 2017.
Figure 3.
Scatterplots of IMERG satellite product and stage-IV NCEP radar precipitation product with an hourly temporal resolution between 25th and 29th August 2017.

Figure 4.
Box plots of probabilistic (POD, FAR, CSI and PSS) and basic (ME, MBF, BIAS and RMSE) statistical indices over grid boxes for IMERG hourly precipitation products.
Figure 4.
Box plots of probabilistic (POD, FAR, CSI and PSS) and basic (ME, MBF, BIAS and RMSE) statistical indices over grid boxes for IMERG hourly precipitation products.

Figure 5.
Spatial distribution of basic statistical indices for the final-run IMERG hourly product during Hurricane Harvey (a) ME (b) BIAS (c) MBF (d) RSME.
Figure 5.
Spatial distribution of basic statistical indices for the final-run IMERG hourly product during Hurricane Harvey (a) ME (b) BIAS (c) MBF (d) RSME.

Figure 6.
Spatial distribution of probabilistic statistical indices for the final-run IMERG during hurricane Harvey (a) POD (b) CSI (c) FAR (d) PSS.
Figure 6.
Spatial distribution of probabilistic statistical indices for the final-run IMERG during hurricane Harvey (a) POD (b) CSI (c) FAR (d) PSS.


Table 1.
Statistical Performance Measures used in evaluation and comparison.
| Index | Formula | Range | Perfect Value |
|---|---|---|---|
| Category 1 1 (Basic Statistical Indices) | |||
| Correlation Coefficient (CC) 2 | (−1)–(+1) | 1 | |
| Mean Error (ME) | 0 | ||
| Relative Bias (RBIAS) | 0 | ||
| Mean Bias Factor (MBF) | 0–+∞ | 1 | |
| Root Mean Square Error (RMSE) | 0–+∞ | 0 | |
| Category 2 1 (Probabilistic Statistical Indices) | |||
| Probability of detection (POD) | 0–1 | 1 | |
| False Alarm Ration (FAR) | 0–1 | 0 | |
| Critical Success Index (CSI) | 0–1 | 1 | |
| Peirce Skill Score | (−1)–(+1) | 1 | |
1 n: number of samples; : satellite rainfall estimate; : radar-observed rainfall; : averaged satellite rainfall; : averaged radar rainfall; : standard deviations of satellite rainfall; : standard deviations of radar rainfall; : events captured by satellite and radar; events captured by satellite and missed by radar; : events captured by radar and missed by satellite; : events missed by radar and satellite (no event). 2 The CC usually ranges from 0 to 1. However, to better show the discrepancies, the negative correlation coefficients were utilized in this study.
© 2018 by the authors. Licensee MDPI, Basel, Switzerland. This article is an open access article distributed under the terms and conditions of the Creative Commons Attribution (CC BY) license (http://creativecommons.org/licenses/by/4.0/).
Share and Cite
MDPI and ACS Style
Omranian, E.; Sharif, H.O.; Tavakoly, A.A. How Well Can Global Precipitation Measurement (GPM) Capture Hurricanes? Case Study: Hurricane Harvey. Remote Sens. 2018, 10, 1150. https://0-doi-org.brum.beds.ac.uk/10.3390/rs10071150
AMA Style
Omranian E, Sharif HO, Tavakoly AA. How Well Can Global Precipitation Measurement (GPM) Capture Hurricanes? Case Study: Hurricane Harvey. Remote Sensing. 2018; 10(7):1150. https://0-doi-org.brum.beds.ac.uk/10.3390/rs10071150
Chicago/Turabian StyleOmranian, Ehsan, Hatim O. Sharif, and Ahmad A. Tavakoly. 2018. "How Well Can Global Precipitation Measurement (GPM) Capture Hurricanes? Case Study: Hurricane Harvey" Remote Sensing 10, no. 7: 1150. https://0-doi-org.brum.beds.ac.uk/10.3390/rs10071150
Note that from the first issue of 2016, this journal uses article numbers instead of page numbers. See further details here.