Panoramic Image and Three-Axis Laser Scanner Integrated Approach for Indoor 3D Mapping


1
School of Remote Sensing and Information Engineering, Wuhan University, No. 129, Luoyu Road, Wuhan 430079, China
2
School of Cyber Science and Engineering, Wuhan University, No. 129, Luoyu Road, Wuhan 430079, China
3
State Key Laboratory of Information Engineering in Surveying, Mapping, and Remote Sensing, Wuhan University, No. 129, Luoyu Road, Wuhan 430079, China
*
Author to whom correspondence should be addressed.
Remote Sens. 2018, 10(8), 1269; https://0-doi-org.brum.beds.ac.uk/10.3390/rs10081269
Submission received: 7 June 2018
/
Revised: 4 August 2018
/
Accepted: 10 August 2018
/
Published: 12 August 2018
(This article belongs to the Special Issue Mobile Laser Scanning)
Abstract
:High-precision indoor three-dimensional maps are a prerequisite for building information models, indoor location-based services, etc., but the indoor mapping solution is still in the stage of technological experiment and application scenario development. In this paper, indoor mapping equipment integrating a three-axis laser scanner and panoramic camera is designed, and the corresponding workflow and critical technologies are described. First, hardware design and software for controlling the operations and calibration of the spatial relationship between sensors are completed. Then, the trajectory of the carrier is evaluated by a simultaneous location and mapping framework, which includes reckoning of the real-time position and attitude of the carrier by a filter fusing the horizontally placed laser scanner data and inertial measurement data, as well as the global optimization by a closed-loop adjustment using a graph optimization algorithm. Finally, the 3D point clouds and panoramic images of the scene are reconstructed from two tilt-mounted laser scanners and the panoramic camera by synchronization of the position and attitude of the carrier. The experiment was carried out in a five-story library using the proposed prototype system; the results demonstrate accuracies of up to 3 cm for 2D maps, and up to 5 cm for 3D maps, and the produced point clouds and panoramic images can be utilized for modeling and further works related to large-scale indoor scenes. Therefore, the proposed system is an efficient and accurate solution for indoor 3D mapping.
1. Introduction
Humans spend at least 70% of their time indoors, but the cognition of indoor space is far less than that of outdoor space. With the continuous improvement of the quality of life, 3D spatial information regarding indoor environments is increasingly demanded in various applications, such as risk and disaster management, human trajectory identification, and facility management. Building an accurate indoor map quickly is a prerequisite for building information modelling/management (BIM), indoor location-based service (LBS), and augmented and virtual reality applications [1,2,3,4].
In the traditional indoor surveying workflow, the instrument is placed on a tripod at several pre-determined stations, and the data from separate stations is registered into a common reference frame by homonymous points with distinctive features. While this procedure is expected to provide the best accuracy for the resulting point cloud, it has some obvious drawbacks. The migration between multiple stations results in the waste of time and manpower consumption, and the scan results often contain many blind areas due to the limited number of observation stations. Furthermore, the surveying process requires skilled personnel and sufficient knowledge of the survey area to pick optimal stations, good network design for marker placement, etc. [5,6,7,8].
Mobile measurement technology integrates positioning, attitude determination, and measurement, which realizes the measurement in motion, improves the degrees of freedom of the measurement platform, and greatly reduces the time and labor costs. A typical mobile measurement system (MMS) consists of laser scanners, optical cameras, the global navigation satellite system (GNSS) and a high-grade inertial measurement unit (IMU) mounted on a vehicle. The trajectory of the vehicle is determined using GNSS and IMU, and the measurement results of scanners and cameras are reconstructed to a unified geographic frame by the relative position and attitude between units. The acquisition technology of large-scale outdoor point clouds using MMS has matured, and this type of system has been commercially available for several years and can achieve good accuracy [9,10,11,12]. Unfortunately, such a system cannot be directly used for indoor applications due to its reliance on GNSS, which obviously is not available indoors.
With the boom of machine vision and the robotics industry, simultaneous location and mapping (SLAM) is extensively studied. SLAM solves the chicken-and-egg problem in an unknown environment by positioning according to the motion estimation and the existing map while simultaneously building an incremental map on the basis of positioning results in the process of moving. Compared with MMS using GNSS to obtain a unified mapping reference frame, SLAM addresses the measurement visibility via a cumulative measurement process, which is bound to cause accumulation error. Thus, SLAM is also committed to solving the problem of error accumulation. Some indoor mobile measurement systems (IMMS) based on SLAM technology have been presented in recent years, such as NavVis M3, Leica Pegasus backpack, GeoSLAM ZEB-REVO, etc. A variety of exteroceptive sensor sources have been suggested, and they can be roughly divided into laser SLAM and visual SLAM.
The current approaches of visual SLAM include monocular, stereo, and fisheye cameras, among others. Visual SLAM is still in a stage of further research and application scenario expansion; it has the advantages of low cost, no maximum range limitation, and extractable semantic information, but it also has many disadvantages, such as limited sunlight, large amount of calculation, and poor stability [13,14,15]. Its process is relatively complex, and an additional step to reconstruct the camera position and attitude through parallax is needed compared with laser SLAM. Moreover, range cameras, such as the Kinect, would have an advantage in that they capture a part of a scene in 3D at an instant. However, their limited field of view and relatively short maximum range—typically no more than 5–10 m—make range cameras unsuitable for data acquisition in larger indoor spaces (airports, hospitals, museums), and it is those types of public indoor spaces in particular for which the demand for indoor modeling is apparent [16,17].
Laser SLAM started early with relatively mature theory and technology. Although the cost is very high, its excellent accuracy and stability, especially the results with the capability of direct modeling and navigation, make it the best method for indoor mapping and modeling. Common laser SLAM systems are listed as follows:
- Gmapping is the most widely used SLAM algorithm [18]. It simulates the position and attitude of the equipment by a Rao-Blackwellized particle filter (PF), with odometer data as the initial value. This method has good robustness due to the maximum likelihood principle of probability statistics, but the reliance on odometer data limits the use scenarios.
- Konolige, et al., proposed the sparse pose adjustment method [19], which breaks the computational bottleneck of optimizing large pose graphs when solving SLAM problems. The graph-based SLAM system named kartoSlam was implemented as an open-source package on the Robot Operating System (ROS), which is a set of software libraries and tools that help developers create robot applications.
- In the Hector Slam [20], inertial data and laser data are fused using unscented Kalman filtering (UKF) to give it the ability of 3D positioning and mapping. At same time reliable localization and mapping capabilities in a variety of challenging environments are realized by using a fast approximation of map gradients and a multi-resolution grid.
- Google’s latest shared algorithm, Cartographer [21], integrates excellent filtering methods and graph optimization ideas and is capable of mapping in a wide range of scenes through variform vehicle platforms. It optimizes local error by the extended Kalman filtering and distributes global error by the graph optimization arithmetic.
The panoramic image and point cloud are the basic data support for indoor scene display. There are many forms in which to express the 3D scene, including multi-view depth map, point cloud, voxel, mesh, and primitive-based CAD models. The textured CAD model with additional information is one of the most conforming to human knowledge. To build the textured model, the common process is to build a model from point clouds and then map images to the model. There are many literature entries that discuss the construction of structured models from point clouds [7,22,23,24]. Additionally, it is the most widely used method for fitting and segmenting point clouds by relying on the systematic surfaces of artificial buildings. The registration of images and models to the textural mapping can be solved by equipment calibration and iterative optimization of the color map [25]. Some novel methods generate rough models directly by understanding panoramic images [26,27], which is useful for a panoramic image display system as an auxiliary. The work [28] does provide a good idea for showing indoor spaces via panoramic images and point clouds. However, in general, there is still no simple and effective method to build satisfactory textured models automatically.
Based on the above analysis, indoor 3D mapping equipment is designed with a panoramic camera and three-axis laser scanners, and a corresponding workflow is proposed in this paper. The software for controlling the operations and the calibration of spatial relationships between sensors is developed after finishing the hardware design. This solution obtained the optimized trajectory of the carrier using the horizontally placed laser scanner data and inertial data via our excellent SLAM technology framework described in Section 2.2, which consists of the EKF algorithm and the closed-loop adjustment. Then, the 3D point cloud of the measurement area is reconstructed according to the relative rigid transformation between the three laser scanners, and the synchronized panoramic images are also associated. Experimental results show that the accuracy of the indoor 3D point cloud can reach 5 cm, and the textures are abundant using the proposed prototype system. Therefore, the proposed system is an efficient and accurate solution for 3D modeling and further works in large-scale indoor scenes.
2. Materials and Methods
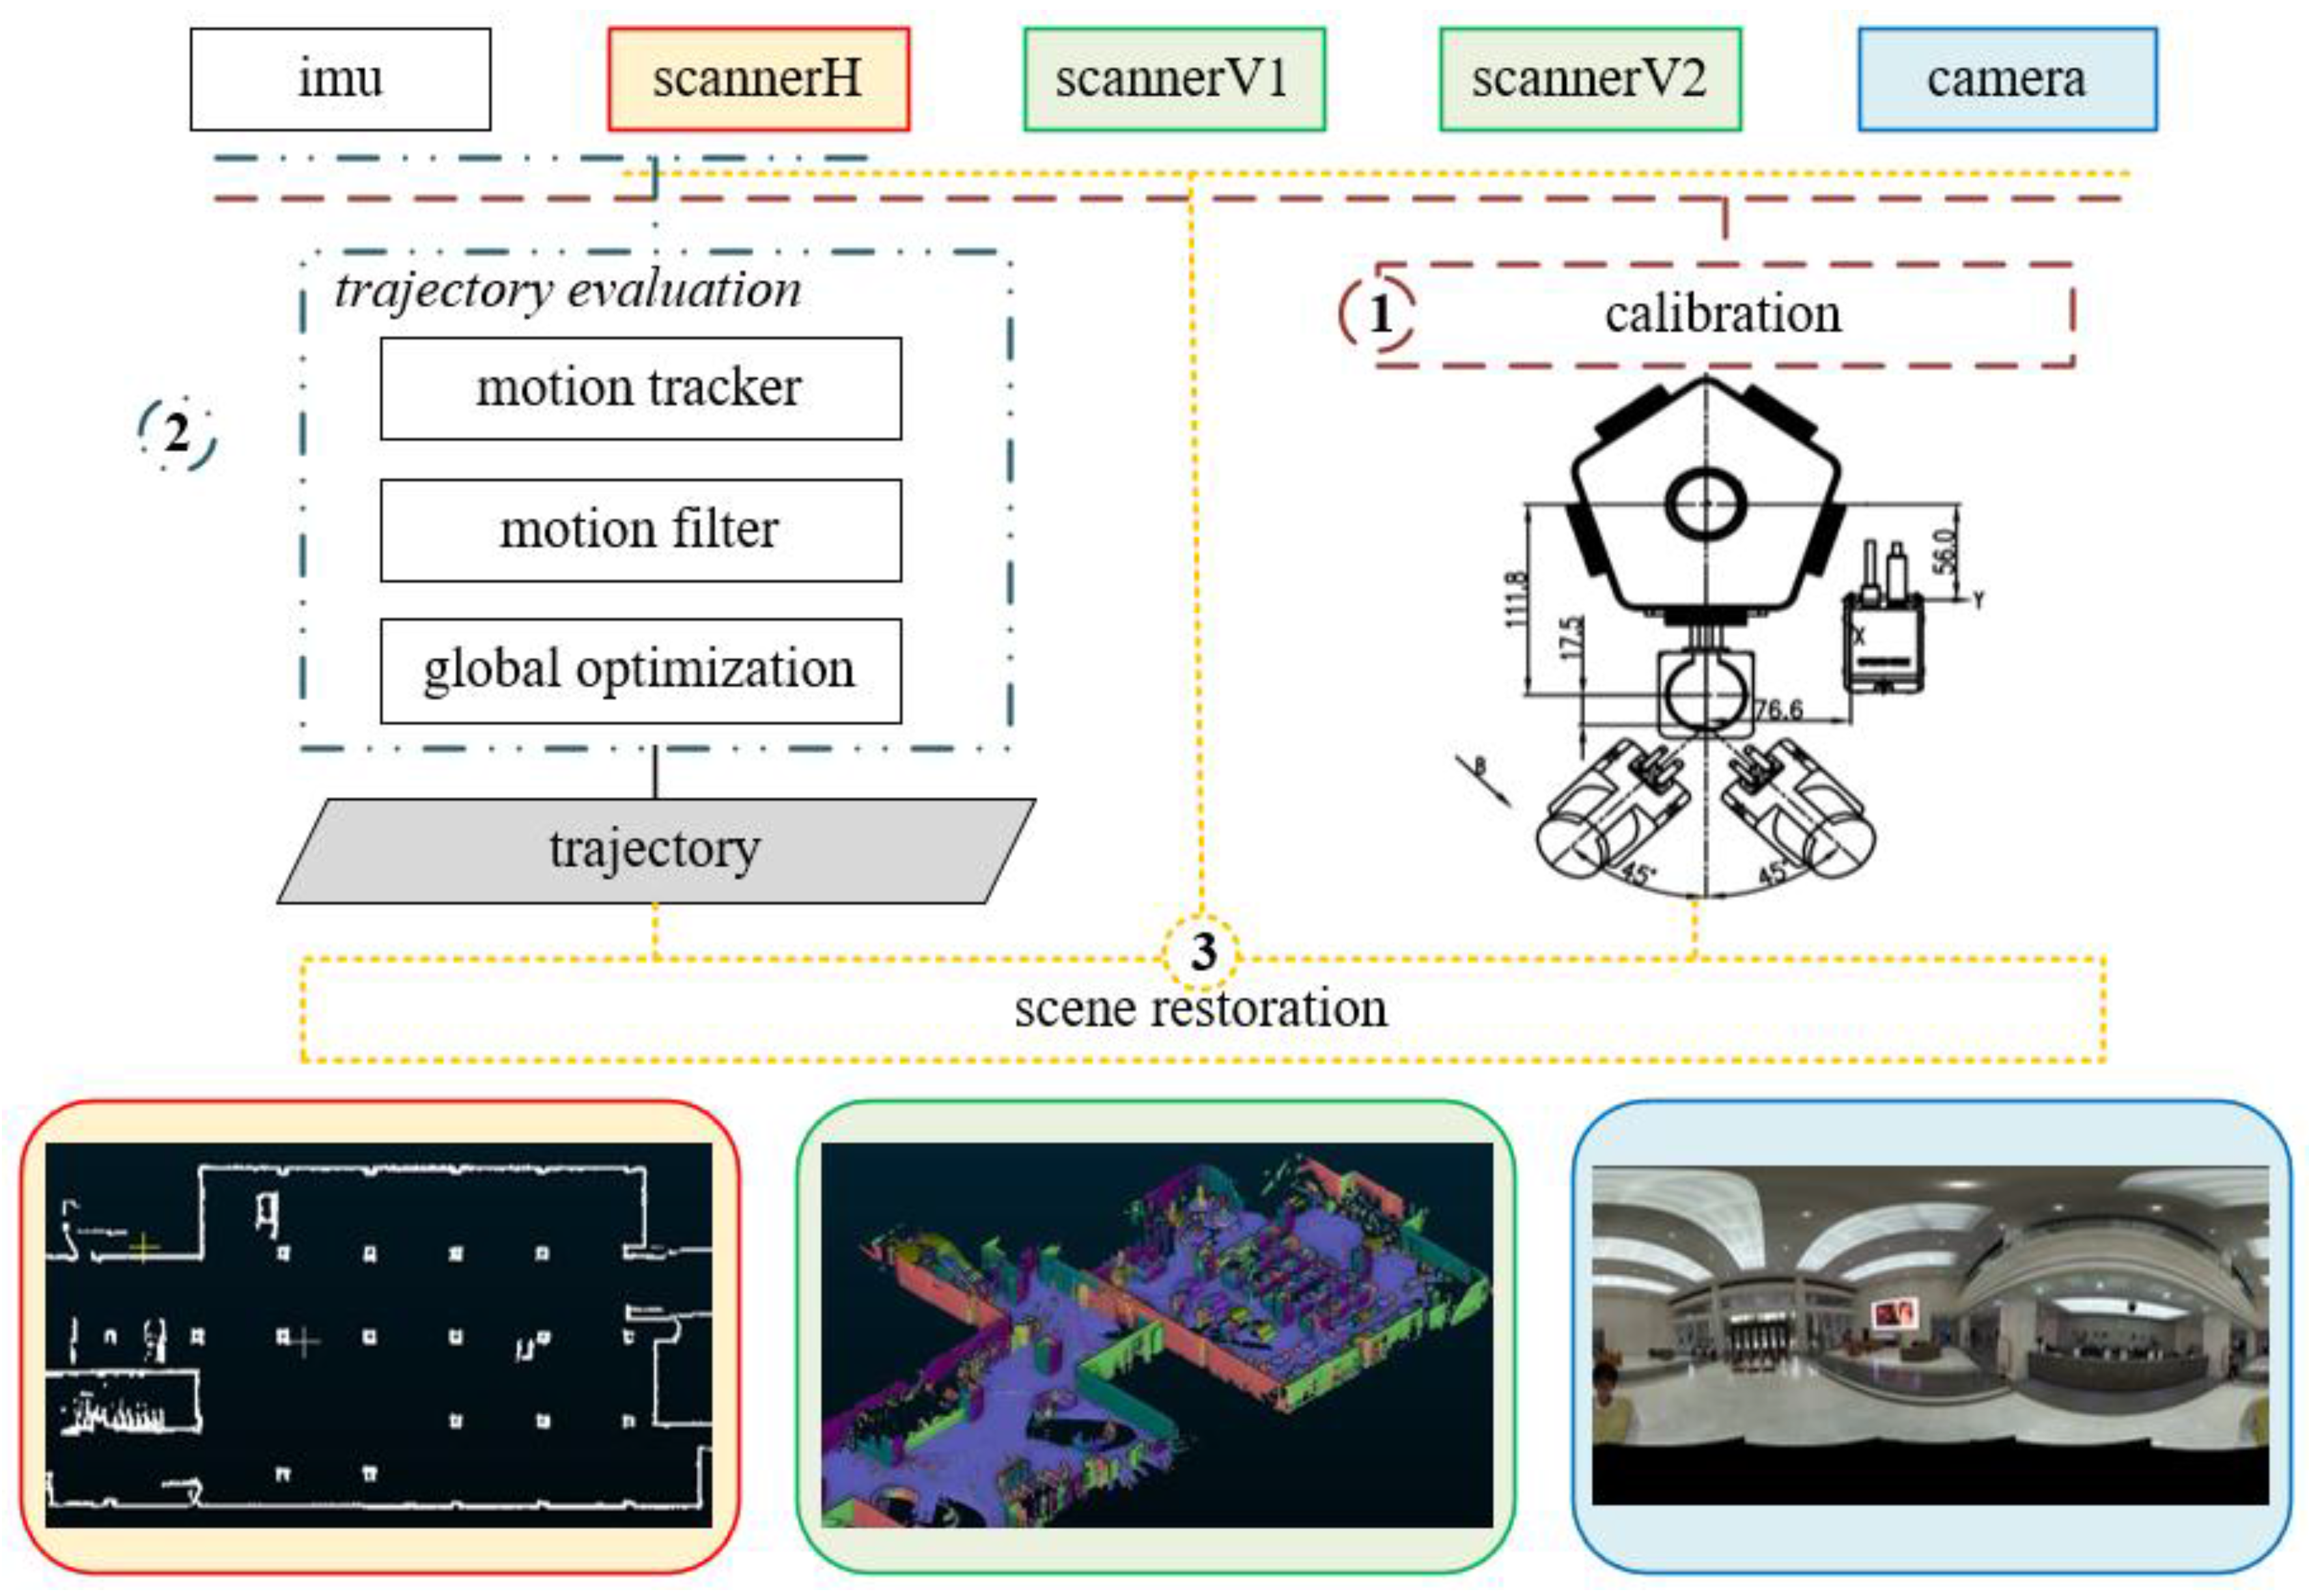
This research designs and assembles indoor surveying and mapping equipment with three 2D laser scanners and an integrated panoramic camera and proposes an indoor 3D mapping approach that integrates panoramic images and three-axis laser scanners according to the working principle of MMS and the art in SLAM. The solution is shown in Figure 1.
First, a system overview regarding the device design and calibration is described in Section 2.1. Then, the horizontal laser scanner data and IMU data generate an optimized trajectory through a SLAM technology flow proposed in Section 2.2.1, which include motion tracking by point cloud matching as described in Section 2.2.2, data fusion by UKF as explained in Section 2.2.3, and closed loop optimization as discussed in Section 2.2.4. Finally, the 2D map and 3D point clouds are reconstructed according to the relative position and attitude between the three laser scanners, and the panorama with position and attitude is stitched in Section 2.3.
2.1. Device Design and Calibration
2.1.1. Device Design
We design a mapping system with three 2D laser scanners and an integrated panoramic camera in a configuration as shown in Figure 2. Common vehicles that can carry the indoor mapping equipment include unmanned aerial vehicles, backpacks, trolleys, and handles. Considering the applicability, the equipment proposed in this paper can work either as a trolley or as a backpack due to the detachable structure between the pedestal and vertical support.
It employs three Hokuyo UTM-30LX 2D scanners with an opening angle of 270° and can perform 40 scans per second with 1080 range measurements per scan. The maximum range is 30 m, and the ranging noise is 3 cm according to the scanner manufacturer. The three scanners are arranged as in the magnification in Figure 1, and the spatial distribution of the scan lines is shown on the right [29]. The horizontal scanner is used to locate and track the device, and the two slanted scanners are used to map the 3D scene. Based on the experience in MMS and the knowledge mentioned in [29,30], the main reason the two scanners are placed aslant instead of vertically is so the slanted scan line can obtain a more uniform distribution of point clouds than vertical lines, especially on both sides of the corner.
It employs an integrated panoramic camera made up of six Xiaomi cameras. One is vertically upward mounted, and the others are evenly mounted in a horizontal circle. Each camera can take a 4608 × 3456 image every 2 s, and a 8192 × 4096 panoramic image can be stitched together from six synchronic images after data acquisition. A consumer micro-electro-mechanical system for inertial measurement unit (MEMS-IMU) is placed at the camera and scanner connection to track the device movement as an auxiliary. The ADIS16488 iSensor MEMS IMU can provide a simple and efficient method of obtaining a full set of inertial data with an in-run bias stability of 6°/h.
There is an industrial personal computer (IPC) at the bottom of the backpack and the top of the trolley. A control service runs on the IPC to control the power supply, data acquisition, and data storage. It ensures that all data recorded—including scan lines, images, and IMU data—are labeled with a unified time stamp. In addition, a real-time 2D map is provided on the tablet computer to the operator to plan the route via the sparsely sampled data.
2.1.2. Device Calibration
Intrinsic and extrinsic sensor calibration are indispensable for a measuring tool. The internal parameters, such as the calibration matrix of a camera, affect how the sensor samples the scene. The external calibration parameters are the position and orientation of the sensor relative to some fiducial coordinate system. For a multi-sensor integrated mapping equipment, the extrinsic calibration between sensors is crucial to produce the high-precision measurement data. In our device, the extrinsic parameters between the two slanted scanners directly affect the accuracy of the point cloud, and finding the geometric relationship between the laser scanners and the camera is vital to creating metric depth estimates to build textured 3D models.
The distortion model of non-wide-angle images is relatively simple, and the intrinsic and extrinsic calibration technology of cameras is relatively mature. For a 2D laser range finder, the intrinsic parameters are provided by the manufacturer, but it is slightly difficult to determine the extrinsic parameters relative to other equipment. In 2004, Q. Zhang & Pless first proposed the extrinsic calibration method between a camera and laser range finder [31], which sets up a bridge between the 2D laser range finder and other rigidly connected devices. In 2010, Underwood, etc., thoroughly analyzed and built an error model to minimize the systematic contradiction between sensors to enable reliable multi-sensor data fusion [32].
Zhang’s method is adopted in our calibration process. The world coordinate system is set as the coordinate system of the calibration board, and the calibration plane is the plane Z = 0 in the world coordinate system.
First, the extrinsic parameters of the camera (R, t) can be determined by the space resection
where p and P are the image coordinates and the world coordinates of feature points on the calibration board, K is the camera intrinsic matrix, R is a 3 × 3 orthonormal matrix representing the camera’s orientation, and t is a three-vector representing its position.
Then, in the camera coordinate system, the calibration plane can be parameterized by a three-vector N such that N is parallel to the normal of the calibration plane, and its magnitude, ‖N‖, equals the distance from the camera to the calibration plane. It can be derived that
where is the third column of the rotation matrix R and t is the center of the camera in world coordinates.
Suppose that a point in the laser coordinate system is located at a point in the camera coordinate system; the rigid transformation from the camera coordinate system to the laser coordinate system can be described by
where Φ is a 3 × 3 orthonormal matrix representing the camera’s orientation relative to the laser ranger finder and Δ is a three-vector corresponding to its relative position.
Because the point is on the calibration plane defined by N, it satisfies
and thus, it constraints on Φ and Δ when a laser point exists on the measured calibration plane.
The rigid transformation from a camera to a scanner can be calibrated using Equation (5). For our device, the extrinsic parameters between three scanners and six cameras are calculated, and an approximate mean from multiple results is determined to be the relative position and attitude. Figure 3 shows our calibration field, which has been scanned by a fine 3D laser scanner to obtain its fine model. We place the device on several known position and attitude, divide the calibration field into multiple calibration boards according to different planes, establish transformation equations from the obtained image pixels and laser points, and finally solve the optimal transformation matrix iteratively.
To facilitate 3D point cloud reconstruction and texture mapping in the future, the unified reference coordinate system of this device is set to the coordinate system of the horizontal scanner. Table 1 lists the errors between the two tilted laser scanners and the horizontal laser scanner, as well as the error between the two tilted laser scanners.
2.2. Trajectory Evaluation
2.2.1. Framework of Trajectory Evaluation
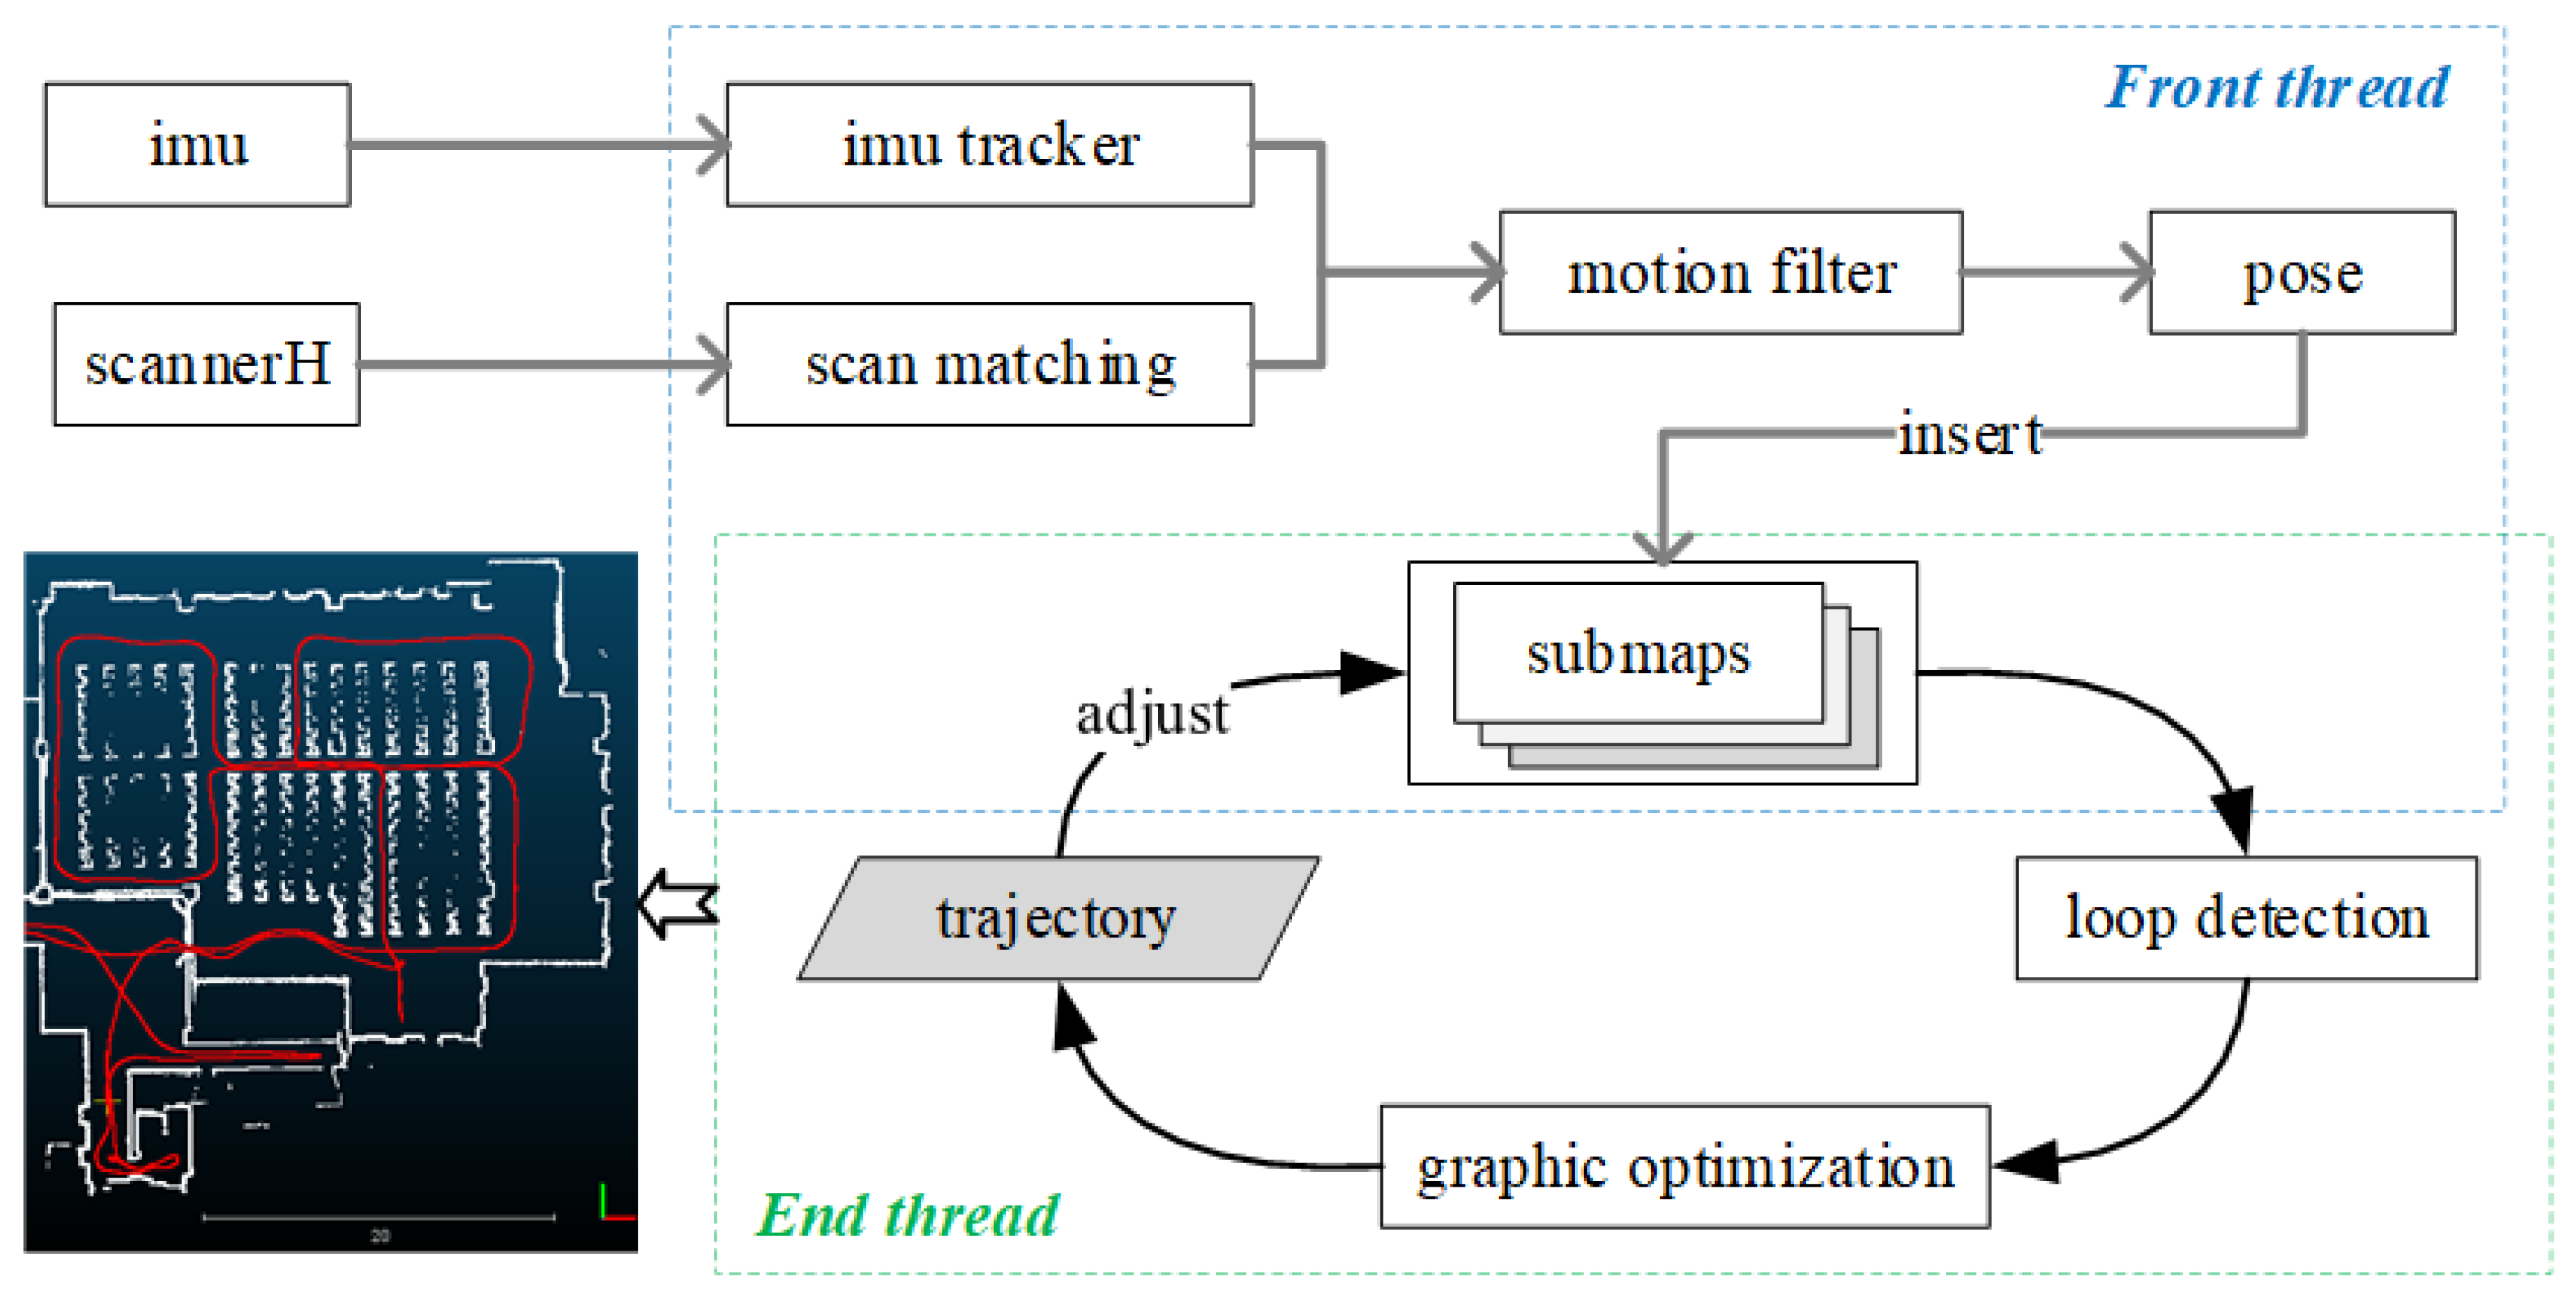
Considering the real-time requirements and computational complexity of SLAM applications, a complete SLAM system consists of a front-end thread and a simultaneously running back-end thread. The front-end is responsible for real-time point cloud matching and local filtering optimization, and the back-end is responsible for the closed-loop detection and the elimination of closing errors. Referring to the existing SLAM algorithm framework [15,21], the framework of the trajectory evaluation of this paper is designed as shown in Figure 4.
The front-end and back-end algorithms of trajectory evaluation mentioned in Figure 4 can be implemented by Algorithm 1 and Algorithm 2, respectively.
| Algorithm 1: Front-end algorithm of trajectory evaluation |
| while (scan and inertial[]) ← + recursion (inertial[]) ← match (scan, submap, ); ← fusion (, ); insert (scan, , submap); if (submap is large enough) Algorithm 2 (submap); takedown this submap, and new an empty submap; end |
While a scan line and the inertial records within the corresponding time range fall into the framework, the front-end gets the device pose by adding the last pose and the inertial records’ recursive value first. Then, the device pose is obtained by matching the scan line to the submap with the initial value . Next, the optimized pose is obtained by EKF fusing the pose form motion deduction and the pose form scan matching . Next, the scan line is inserted into the submap using the optimized pose . Finally, if the submap is large enough, it is taken off from the front-end and inserted into the back-end, and a new submap is created to run next.
| Algorithm 2: Back-end algorithm of trajectory evaluation |
| while (submap) for (variant in possible rotation and translation of submap) score ← probe (variant, maps); if (score > threshold) errors ← match (submap, maps); constraints.add (maps, errors); [poses, maps] ← optimize (constraints); Algorithm 1 (poses); end |
While a submap from the front-end is received, multiple possible rotations and translations are applied to the submap to detect closed loops. First, a score of the coincidence degree between each variant and existing submaps is probed by a fast-rough matching method (matching between low-resolution submaps). If a score is greater than the threshold, the submap’s relative pose is obtained by a fine matching (matching between high-resolution submaps), and the relative pose can be called edges in a graph or cumulative errors. Then, an optimization is executed after all errors are loaded into the solver. Finally, an accurate map and optimized trajectory are obtained, and the front-end is notified simultaneously.
In summary, there are three key technologies that support the implementation of Laser SLAM. (1) Point cloud matching is the basic one to track movement. (2) Multi-sensor fusion based on a filtering algorithm guarantees the robustness of the local smooth trajectory. (3) Graph optimization based on measurement of the closed loop suppresses and divides cumulative errors.
2.2.2. Motion Tracking
Point cloud matching is the basic one to track movement. The relative motion can be obtained by matching the current frame with the previous one; the relative position and attitude can be obtained by matching the current frame with the existing map; the global map and accumulative error can be obtained by matching local maps. The matching method can be divided into dense matching and feature-based sparse matching according to the number and attribute of the points participating in the matching.
The most widely used method of point cloud matching is ICP (Iterative Closest Point), which iteratively refines the transform by repeatedly generating pairs of corresponding points on two meshes and minimizing an error metric. Many variants of ICP have been proposed, which affect all phases of the algorithm from the selection and matching of points to the minimization strategy. Q. C. Li, Muller, & Rauschenbach analyzes the ICP algorithm in detail and lists and compares the possible variants of each step [33]. ICP has very strong universality for aligning 3D models based purely on the geometry, and sometimes color, of the meshes. However, it is limited by the reliance of an initial estimate of the relative position and attitude, and the slow convergence speed.
Getting the inspiration from the image matching method, the feature-based point cloud matching algorithm is designed based on extracted feature points, lines, and planes from a raw point cloud such as [34,35]. This method employs and extends some image feature extraction methods, such as SIFT, split-and-merge algorithm, and histogram cluster. This is very meaningful because it can be applied not only to local matching but also to global matching, which detects closed loops quickly. However, this method has poor applicability in the natural environment, especially in the vegetation environment, due to the scarcity of feature points, lines, and planes.
In this paper, the incremental probabilistic grid is used to represent the 2D map from existing measurement information. When a scan line fills in the process, an ICP is used, which takes the sum of the relative movement from IMU and the pose of the last moment as the initial relative pose, and takes the discrepancy of each cell’s probabilistic value as the error metric. Finally, the relatively rigid transformation is obtained by minimizing the error metric.
2.2.3. Local Optimization
Multi-sensor fusion based on a filtering algorithm guarantees the robustness of the local smooth trajectory. The random errors in the positioning process can be effectively reduced by fusing inertial data, odometer data, and scanning data using probabilistic methods. The existing filtering methods have advantages and disadvantages according to their probability theories and principles [36,37].
Kalman filtering considers the state assessment of the robot as the process of finding the optimal solution of the motion equation and observation equation. The equations are described as
where is the position and attitude of the equipment at time k, is the laser scanning point at time k, A are the motion values from IMU, H is the observation model of the scanner, and w and v are the random noise. Under the assumptions that the error obeys the Gauss distribution, and that the minimum mean square error is the criterion, Kalman filters can obtain the local optimal estimation by Bayesian iteration. For application to nonlinear problems, the extended Kalman filtering (EKF) and unscented Kalman filtering (UKF) were proposed.
The particle filtering (PF) uses a genetic mutation-selection sampling approach, with a set of particles to represent the posterior distribution of the position and attitude of sensors. It can express the posterior probability distribution more precisely due to the non-parametric characteristics, and it has strong robustness since the pose state of the device is represented by multiple particles. It is widely used in early robot localization, and the Gmapping is also the most widely used SLAM system.
An unscented Kalman filter is used for fusion of the motion from the MEMS-IMU and the rigid transformation form point cloud matching in our workflow. On the one hand, the UKF has better performance than other KFs and better efficiency than PF. On the other hand, the requirements are not strict in the SLAM framework with closed-loop optimization due to the small-scale local map (submap).
2.2.4. Global Optimization
The optimization of closed-loop measurement suppresses and divides cumulative errors. Loop detection is the first step, followed by calculation of the cumulative error by adding revisit constraints and redistribution using a back-propagation algorithm.
It is a challenging job for the machine to recognize whether the scene has been accessed, especially using a point cloud, which only has geometric information of the scene. There are some strategies proposed in existing studies to reduce the time consumption of closed-loop detection by avoiding uniform traversal of the map space. In most visual SLAM systems, the bags of words method is used to detect effective matching [38], which uses a hierarchical data structure and efficient traversal algorithm. Based on the same idea, a strategy using multiresolution probabilistic grids is proposed to solve the problem of rapid matching detection in laser SLAM [21]. Another way is noted by Dubé et al., in 2016 [39], in which the large feature units with semantic information are extracted to reduce the candidate set. It also reiterates that the real-time machine learning will be a good way out for closed loop detection problems through scene understanding and recognition.
After a revisited scene is confirmed, the cumulative error is added to the graph as an edge. Then, the graph optimization solver distributes the cumulative errors to associated vertices using a back-propagation algorithm. The optimization question can be described as
where the expression is known as a residual block, where is a cost function that depends on the parameter blocks . There are several available libraries for graph optimization, such as g2o and Ceres-solver. Ceres-solver is employed in our work because of its flexibility to solve Non-linear Least Squares problems with bound constraints and general unconstrained optimization problems [40].
2.3. Scene Reconstruction
Time synchronization of trajectories and measured data is the key to the recovery of a 3D scene. The rigid transformation () at time t can be calculated by an interpolation of and , where f and b are the time before t and after t, respectively, in the trajectory file.
where the function is uncertain for a transformation matrix due to the unclosed property of the addition operation of a matrix. To obtain the interpolation, the transformation matrixes must be written into quaternions, and a linear averaging is performed on the quaternions according to the properties of quaternions [41].
The 3D point cloud can be reconstructed by the relative position and attitude of the slanted scanner in the reference frame of the device and the movement trajectory of the device. Suppose that the calibration of the rigid transformation from the slanted scanner to the horizontal scanner coordinate system is (), that the position and attitude of the device in the world space is () at time t, that is the coordinate of a scanning point at time t in the self-coordinate system, and that its coordinates in world space can be described by
A pretreatment including denoising and thinning is indispensable to the reconstructive point cloud. First, outliers caused by glass or highly reflectivity surfaces, sparse point cloud bands—caused by pedestrians and other moving objects and point clouds close to the device—need to be eliminated. Then, after a uniform space sampling, not only are redundant points due to the uneven scanning removed, but the subsequent processing is also convenient. Of course, some small objects need to be deleted manually before modeling or displaying scenes using the point cloud.
The technology for stitching multiple images with the intrinsic and extrinsic parameters into a 360-degree panorama is relatively mature, and there is a large amount of research regarding the rational arrangement of stitching lines, the elimination of visual differences on both sides of stitching lines, etc. In the process of indoor mapping, one problem that needs to be addressed is the image deformation and stitching error caused by the short shooting distance. Therefore, the scale of the measurement scene should be considered when calibrating cameras. A more accurate and complex interior and relative orientation parameters calibration for camera heads is required, on a small-scale measurement scene.
As in the reconstruction of the 3D point cloud, the position and attitude information at the shooting time t can be appended to the panoramic image. The position T and the attitude R can be calculated by
where is the calibration rigid transformation of the integrated camera in the horizontal scanner coordinate system. An additional instruction is needed in that the attitude of the integrated camera is defined as the attitude of the camera in front of the device, and the position of the integrated camera is defined as the geometric center of the six cameras’ positions.
3. Results
3.1. Experimental Area and Data Acquisition
The experiment was carried out in a library covering an area of 3000 m2 with five floors and an underground garage. The underground garage is almost empty due to less parking. The first floor contains the hall and two self-study rooms on both sides. Both have a simple space structure and spacious field of vision. The scenes of the second and third floors are complicated due to dense book shelves, which leads to various discontinuities and poor visibility. The fourth and fifth floors contain typical long corridors with meeting rooms on both sides.
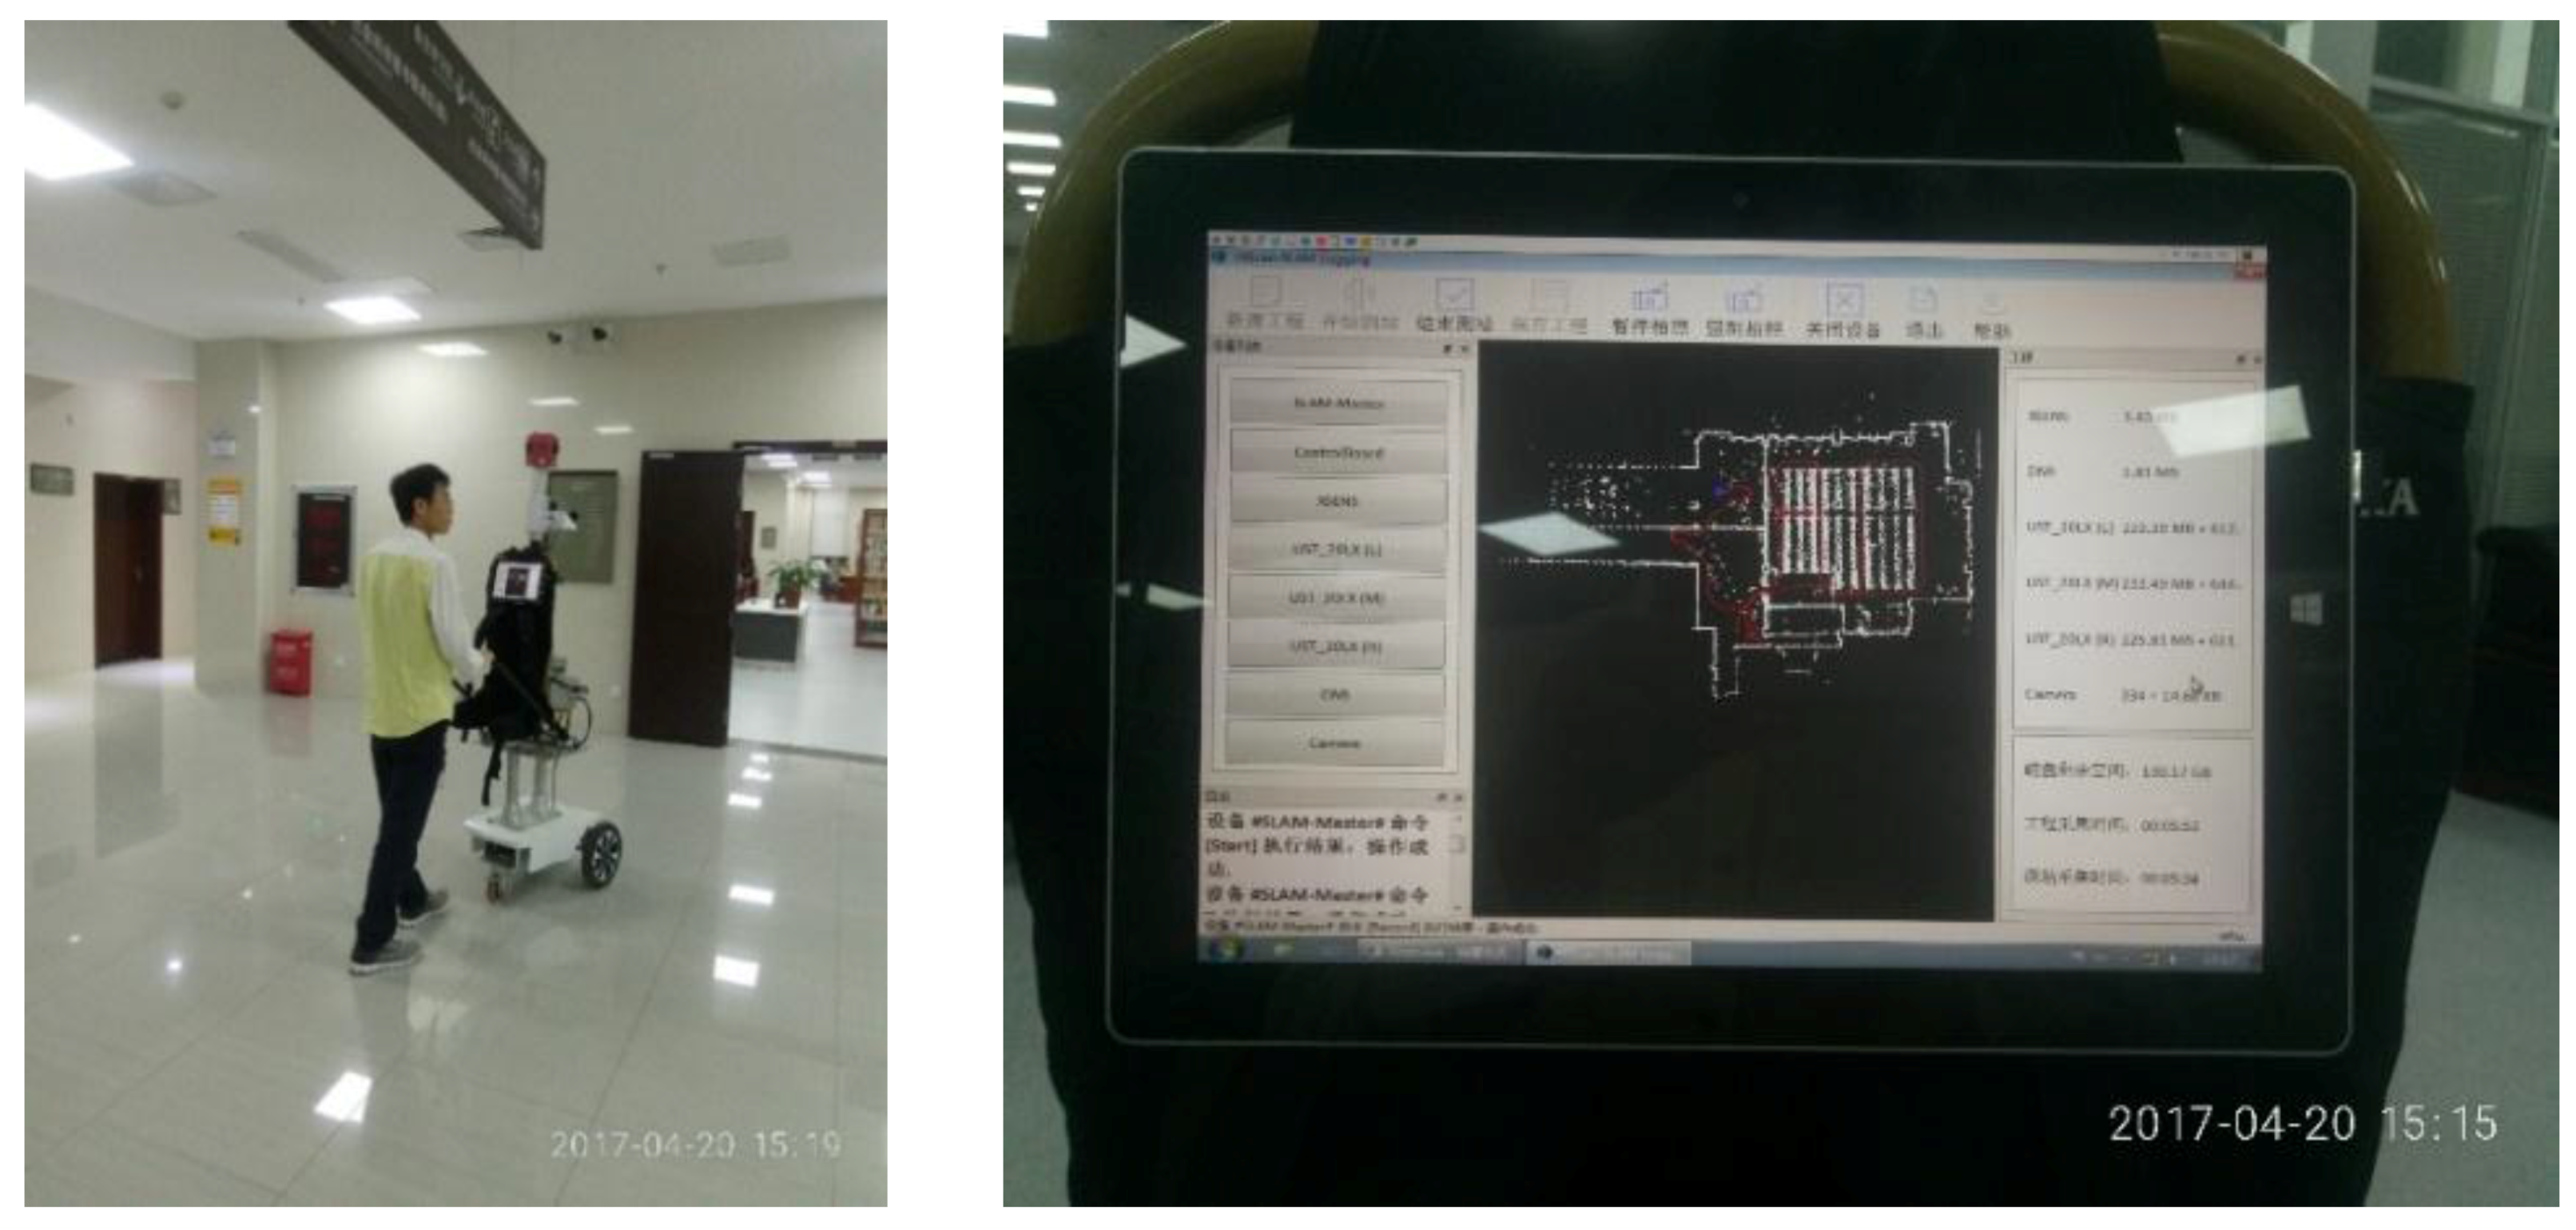
The indoor point clouds and panoramas can be accessed by pushing equipment through the observation area. It took one operator to complete the task in two hours, including migration between floors. In Figure 5, the picture on the left records the actual acquisition process, and the picture on the right shows the rough real-time measurement results provided by manipulation software. This real-time reveal can help the operator to master the progress of existing measurements and plan the next walking route. It is very helpful in obtaining a minimized full coverage measurement data in an unfamiliar complex environment.
After the acquisition, a total of approximately 570,000 laser scan lines from three scanners were recorded in the form of ASCII code, and a total of more than 7000 images of 4608 × 3456 pixels from six lenses were obtained by synchronous exposure every 4 s. On the whole, the number of point clouds and images is relatively dense and is sufficient to meet the needs of space modeling. The point cloud is neat because of the smooth movement and smaller flow. Most images are clear, and only a few show motion blurs.
3.2. Trajectory Results and Accuracy Evaluation
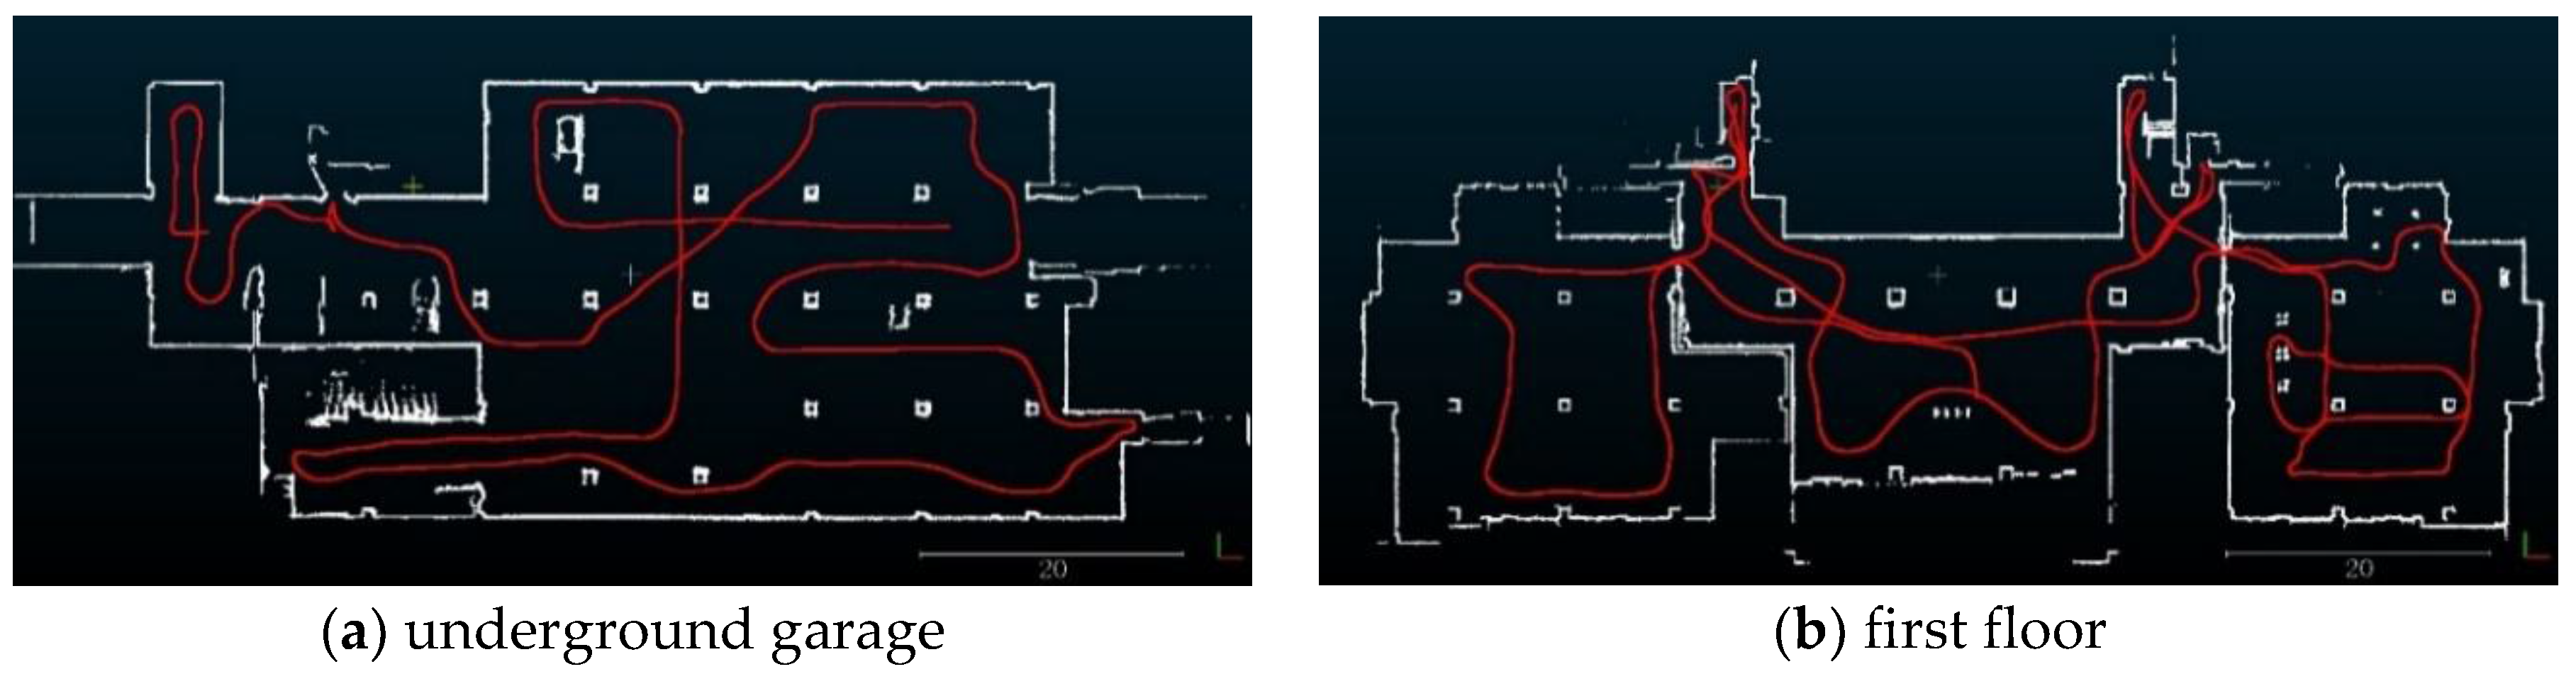
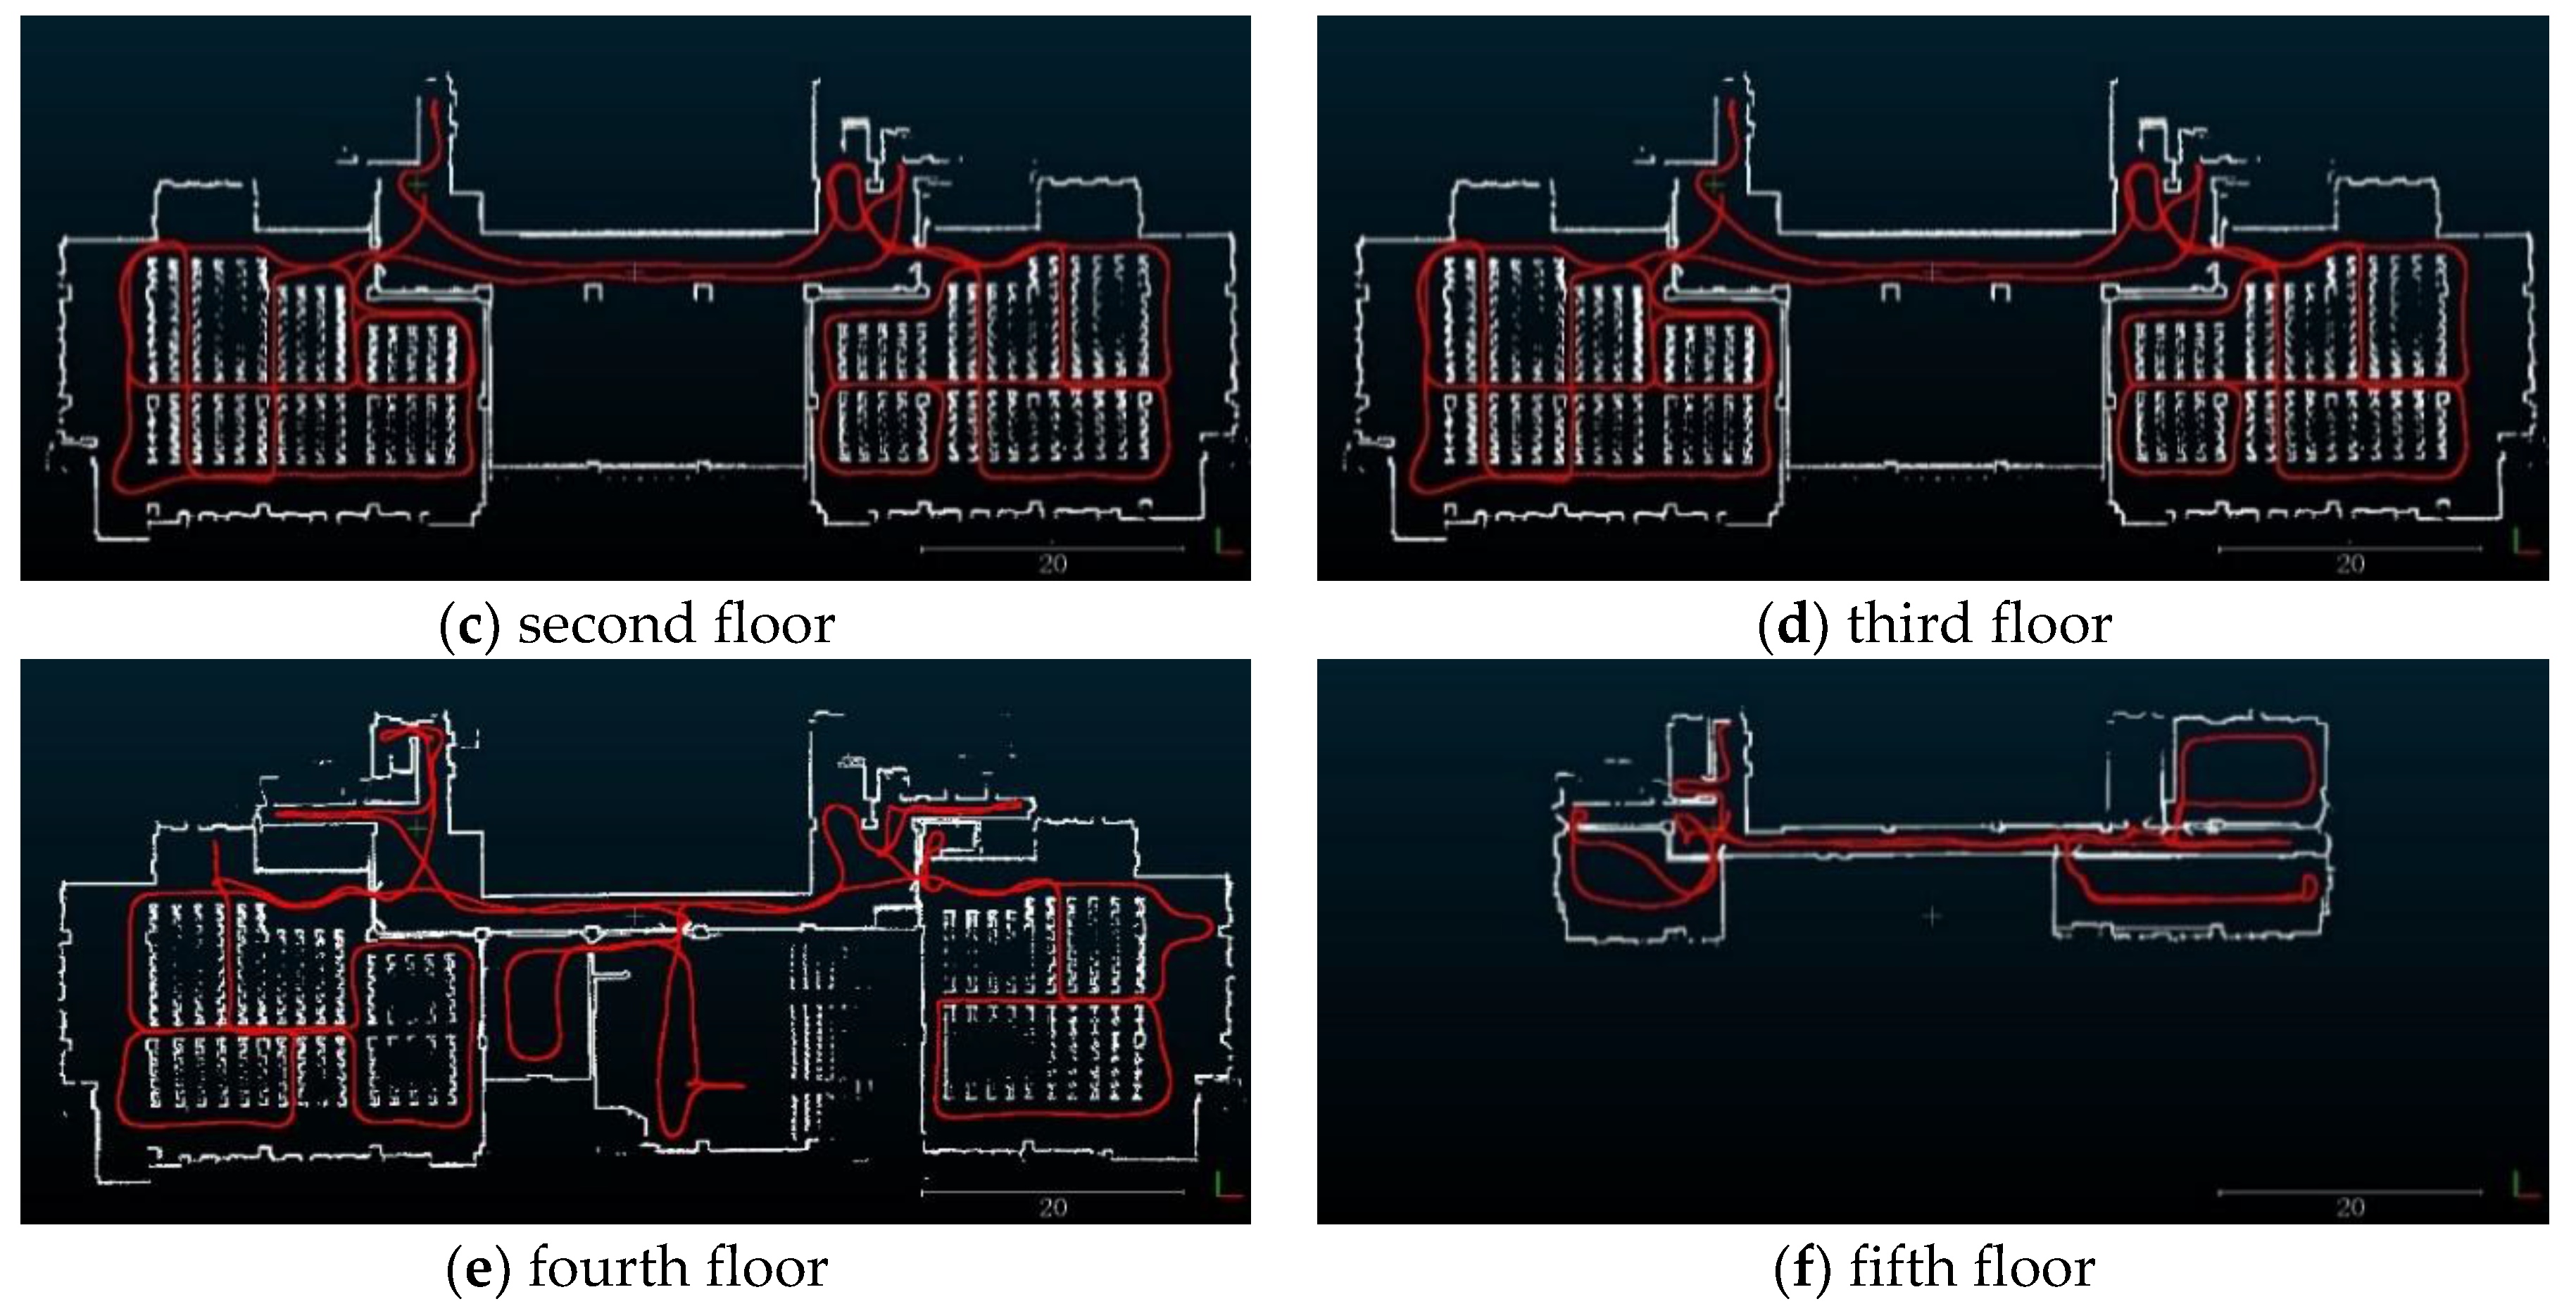
After the field measurement, a complete trajectory evaluation process needs to be executed, because the real-time reveal is too rough for a space reconstruction. The accurate scanning trajectory of each floor is produced by pushing the data from the horizontal scanner and the MEMS-IMU into the SLAM framework described in this paper. On a desktop computer with an Intel i5 CPU running at 3.2 GHz and 12 GB of memory, the SLAM framework takes approximately 2 h to finish the six floors’ work. Figure 6 shows the trajectory and 2D map. Through the red track point, we know that the measurement route is very rugged, which is caused by the narrow space and poor visibility.
By observing the dynamic process of trajectory evaluations on the second floor, the third floor and the fourth floor, it is found that a larger tracking failure occurred when turning in the bookshelf groups. The reasons can be traced to the narrow corridor formed by two rows of bookshelves and the uneven bookshelf side. Therefore, when the equipment has to be pulled into the bookshelf group for measurement, it is necessary to return to the broad space for a good relocation in time.
The detailed accuracy results are listed in Table 2. The most common accuracy index of”map error” is measured by the wall thickness in the 2D map in cm, which can be considered as the accuracy of the trajectory evaluation technology after finishing the closed-loop optimization. The ”track error“ is the bearing error in degrees, showing the final tracking result without a closed-loop optimization. It can reflect the stability of tracking. The ”real error“ is measured by the angle between two parallel walls of the two sides of the left and the right in the building. It can reflect the credibility of the global optimization.
It shows that the accuracy is up to 3 cm for the underground garage and the first floor, which have a clear-cut spatial layout. The accuracy is between 3 cm and 6 cm on the other floors. The worst case of 8 cm occurred on the fourth floor due to the simultaneous occurrence of the typical long corridor and the complex room layout. The maximum value of the track error occurred on the third floor due to the corridor with a translucent glass wall on one side and a wall with uneven bookcases on the other side. The real errors are small enough to be considered a byproduct of the map error, and the 1.1 degrees of the fifth floor may be caused by an insufficient closed loop.
3.3. Point Clouds and Panoramic Images
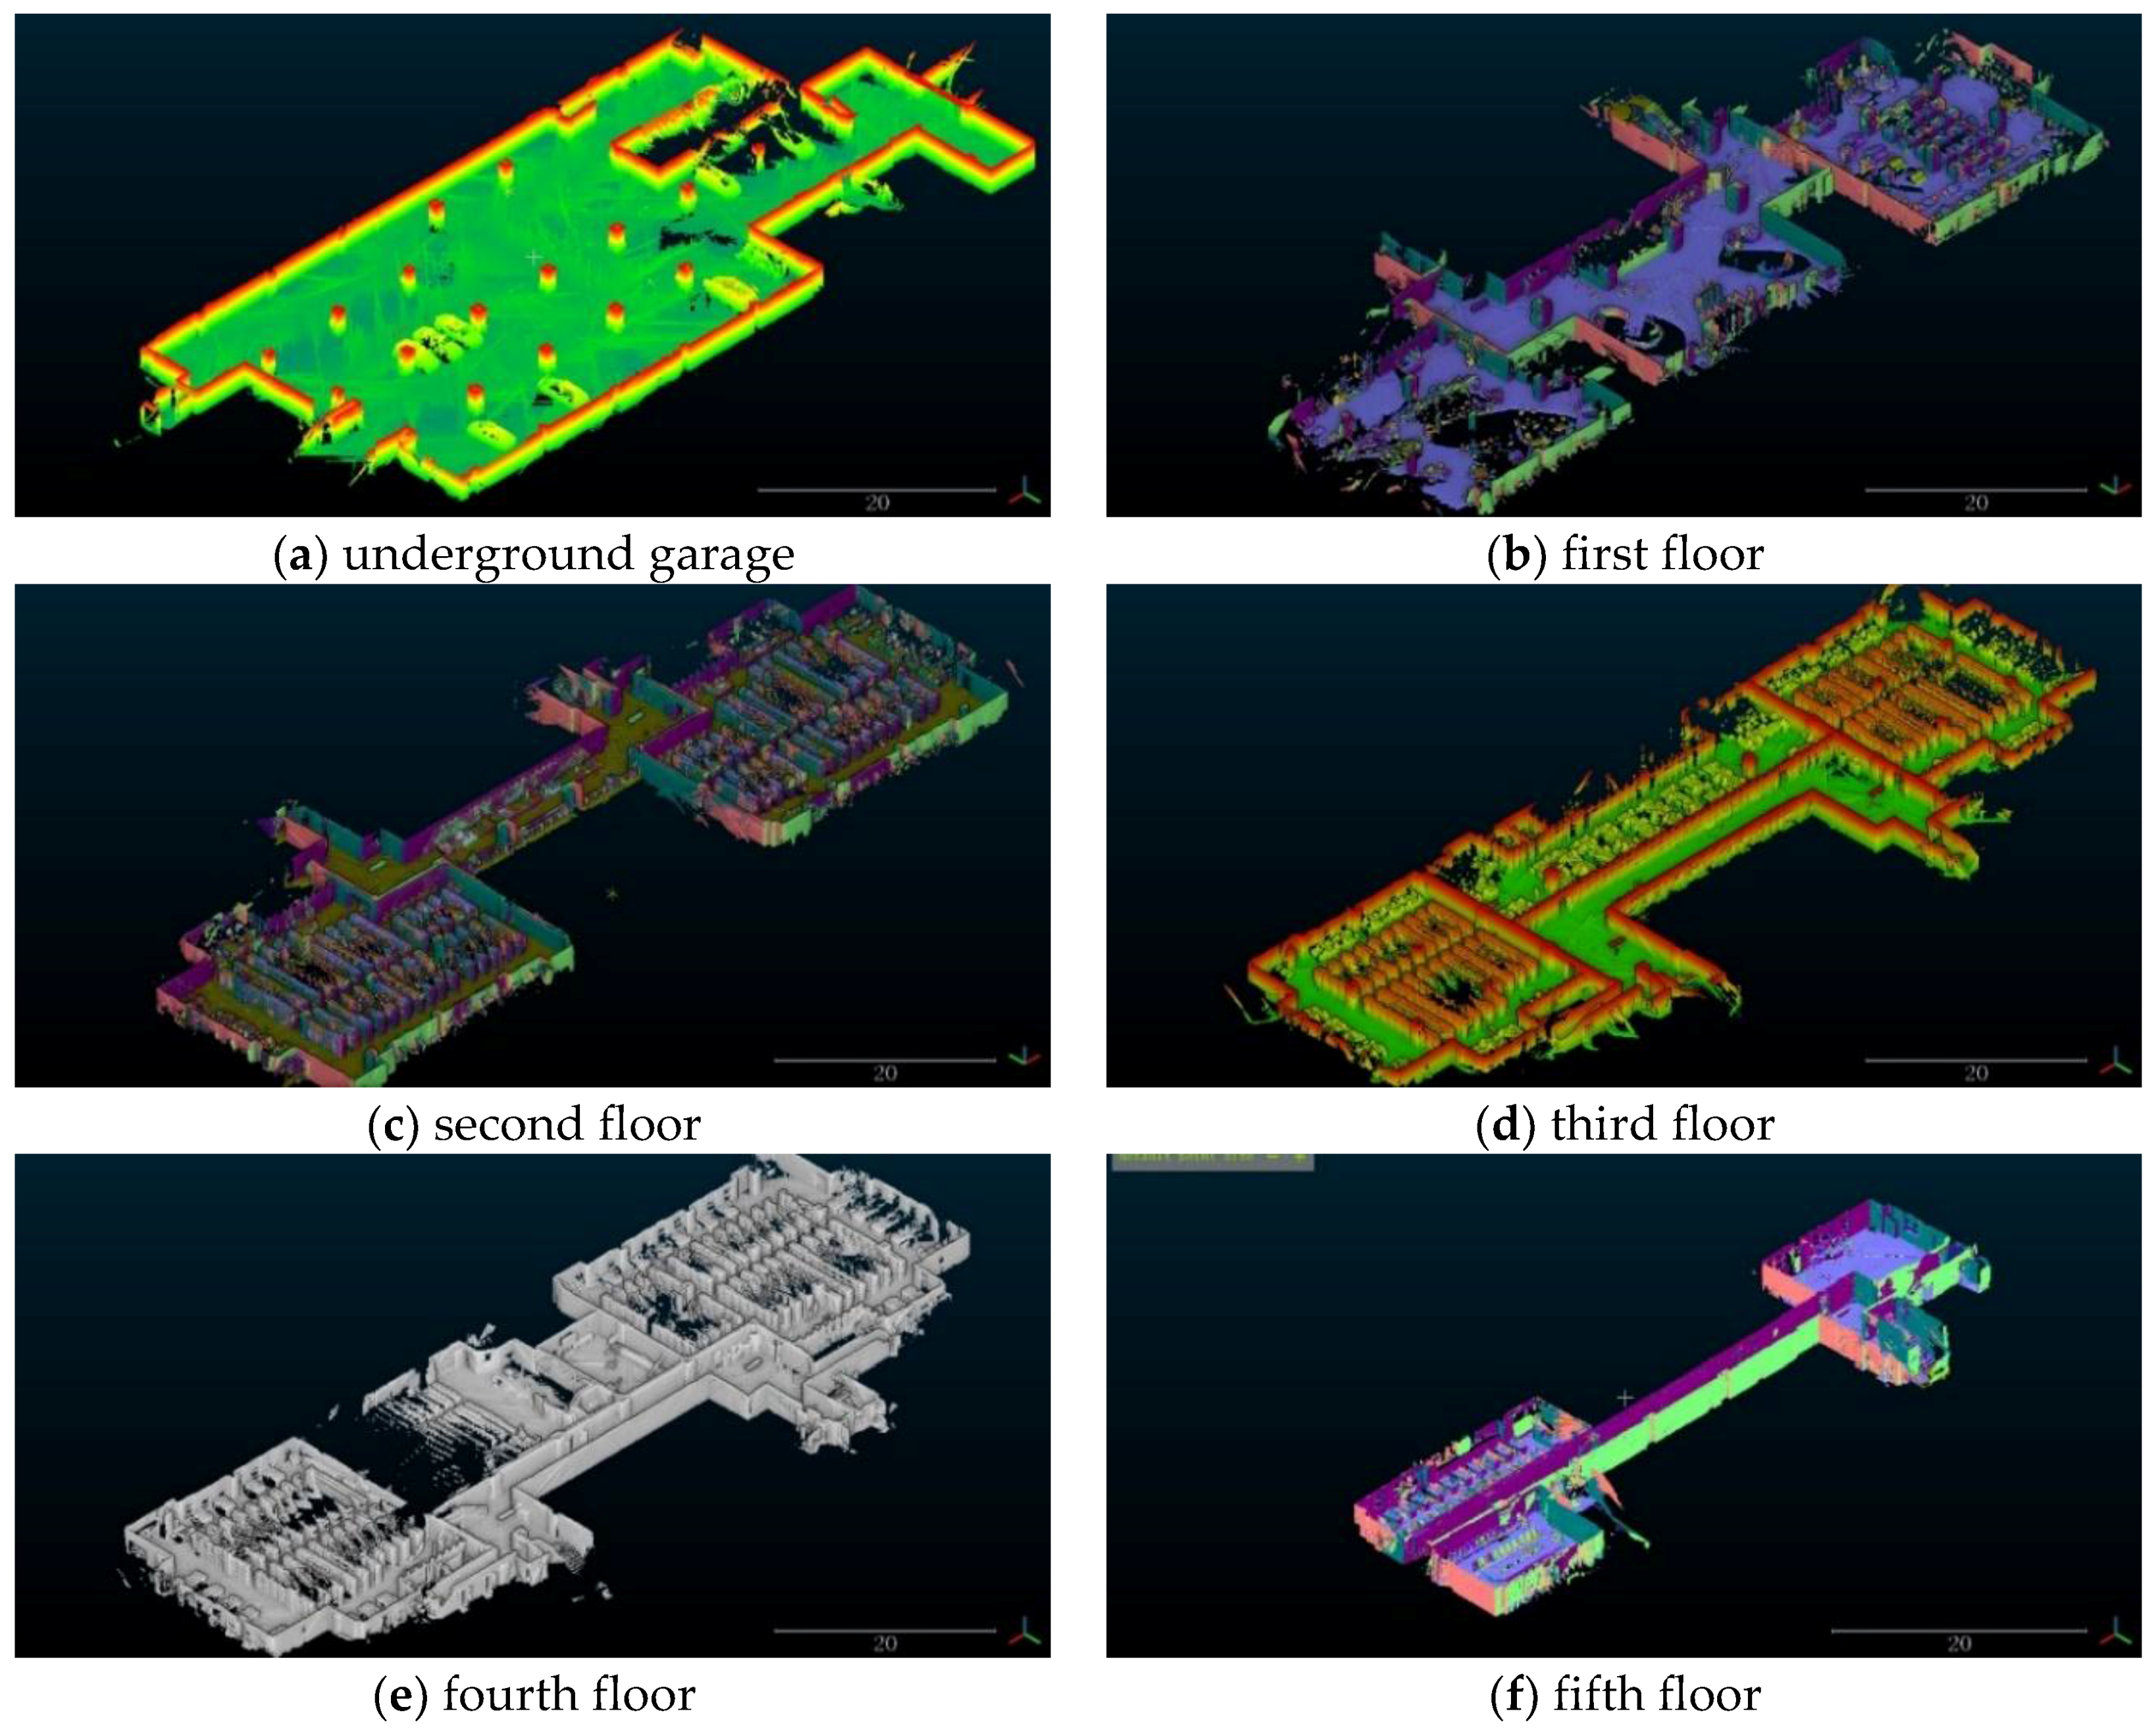
The reconstructive 3D point cloud from two slant laser ranging is processed by statistical outlier removal and a denoising using eight-neighbor filtering. For fast rendering and post-processing, the point cloud is uniformly down-sampled to 1 cm.
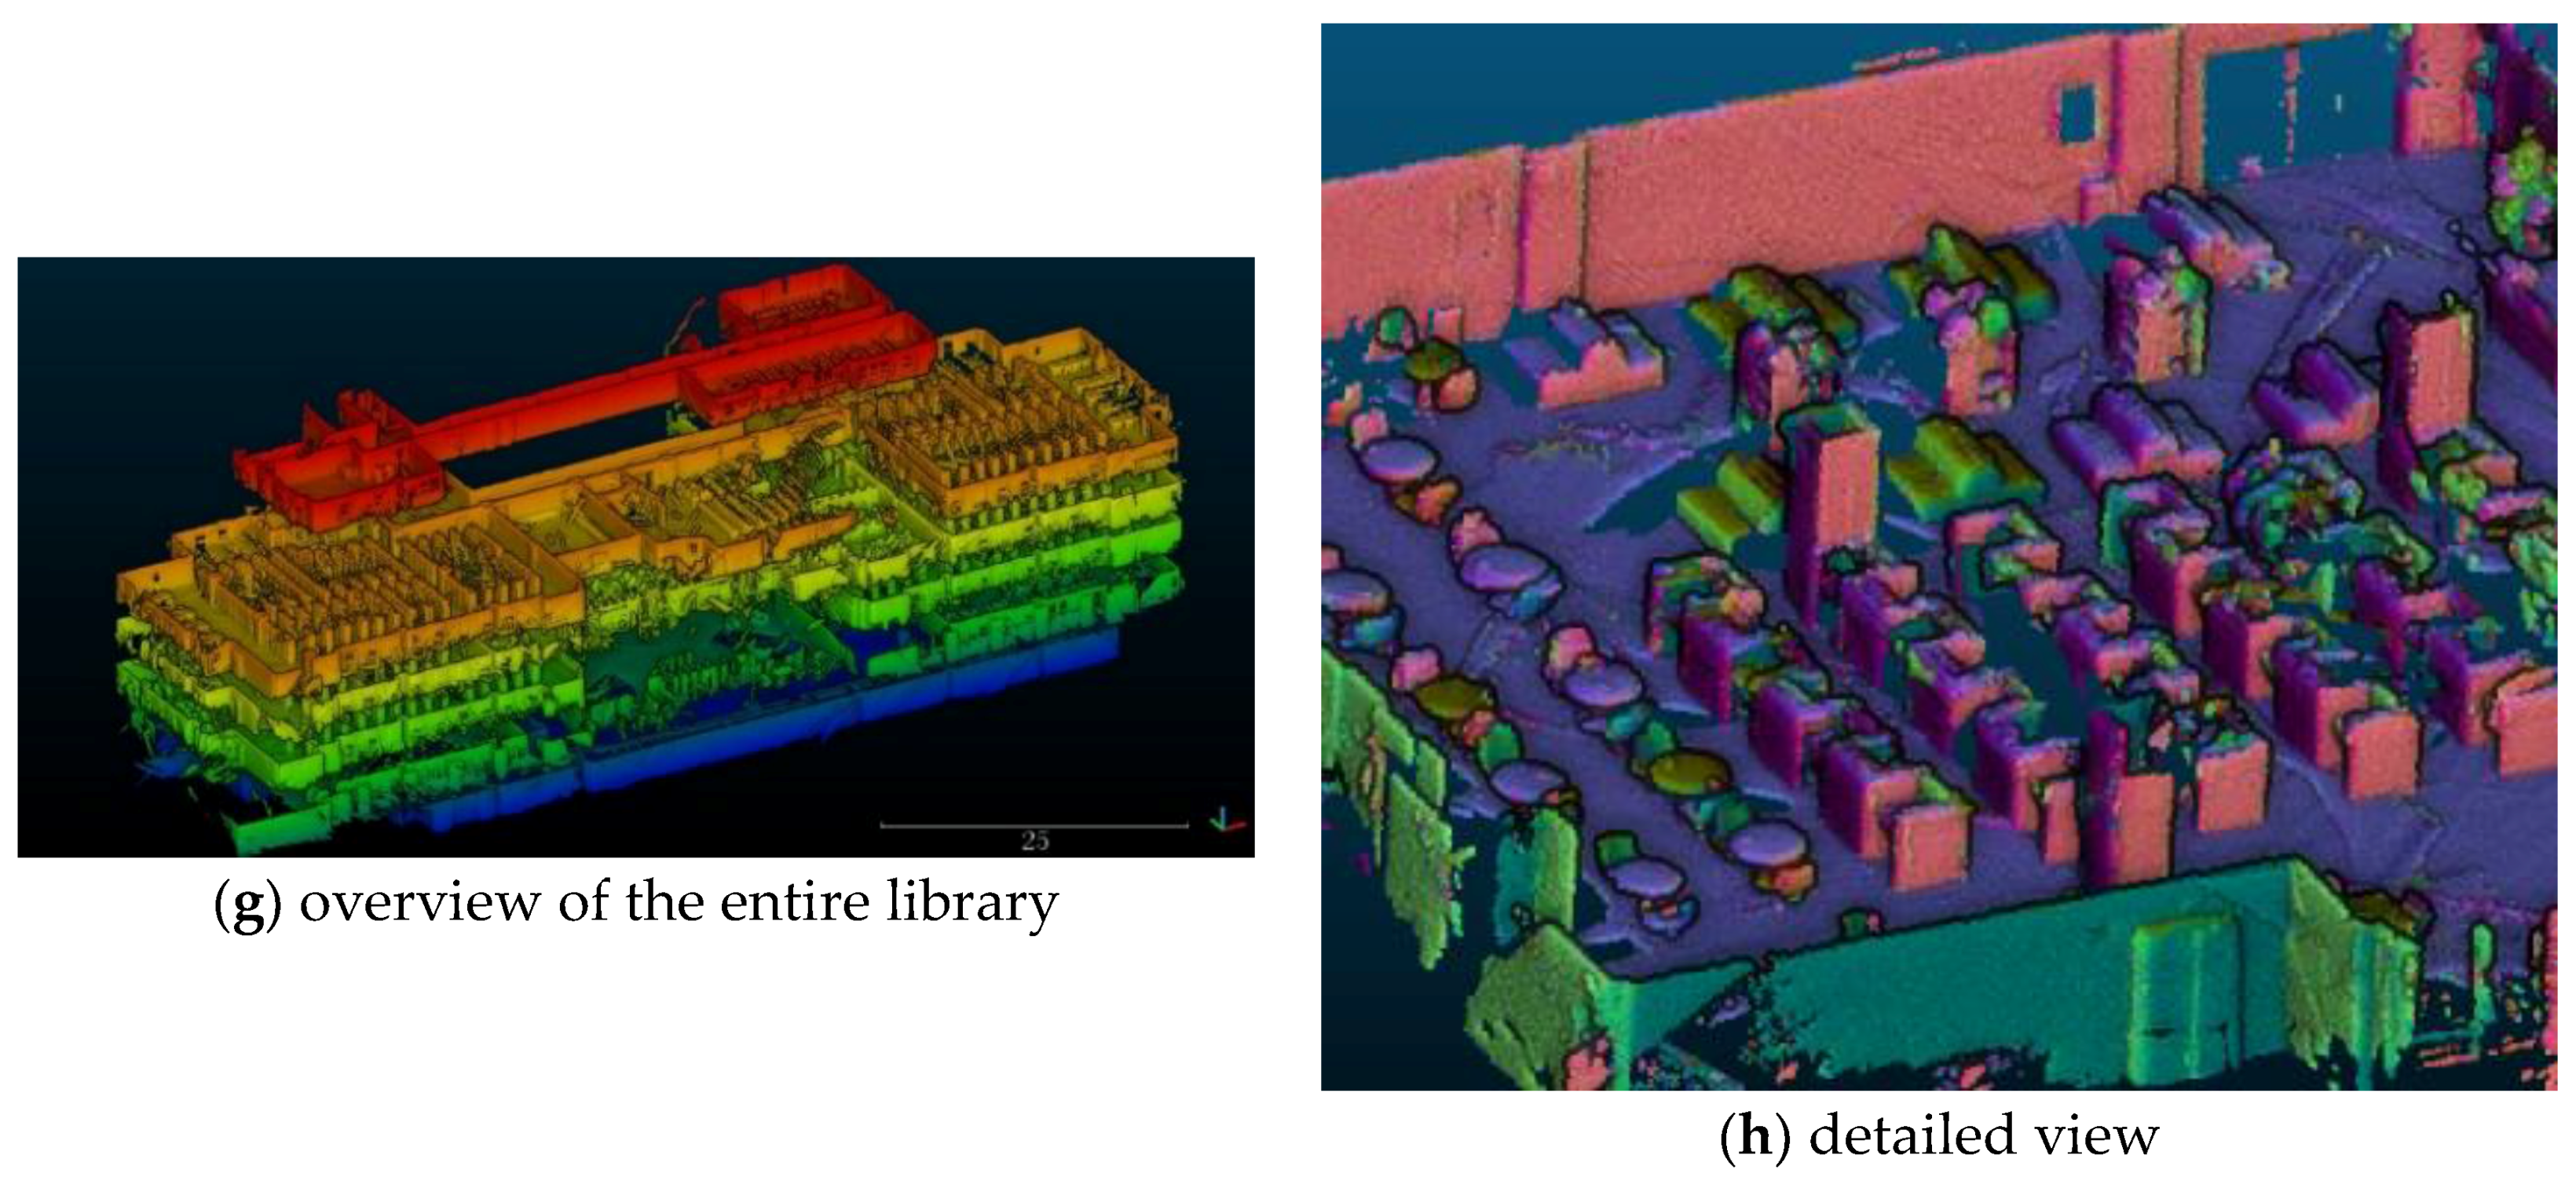
Figure 7 shows point clouds of the library, and the point cloud on the roof was removed. It is clear that the utilization of the underground garage is too low with only eight cars. The point cloud of the first floor shows more hollows compared with the others because it only contains the data from one slant scanner. It can be found that most bookshelves have been scanned fully, although there is still occlusion from the second floor, third floor, and fourth floor. The overview of the entire library is formed by stacking point clouds of the six floors together based on the floor height. The detailed view of the self-study room on the first floor shows that walls, garden tables, chairs, back-to-back sofas, and computer desks with baffles are displayed clearly after segmenting point clouds by the normal vector.
One hundred 3D distances measurements between special targets are carried out randomly in the reconstructive three-dimension point clouds, and the accuracy is determined by the difference between the measured values and the real values. The results show an average error of 6 cm, and the maximum is 12 cm. There is an unavoidable error of 5~6 cm in the 3D point cloud because the trajectory obtained by SLAM has errors, as mentioned in Section 3.2. Thus, the extra error may be caused by some subtle differences between the real 3D trajectory and the 2D trajectory obtained by SLAM, which has only three degrees of freedom. We assume that the ground is sufficiently flat and that there is no offset in the vertical direction, no pitching angle, and no roll angle as the equipment moves.
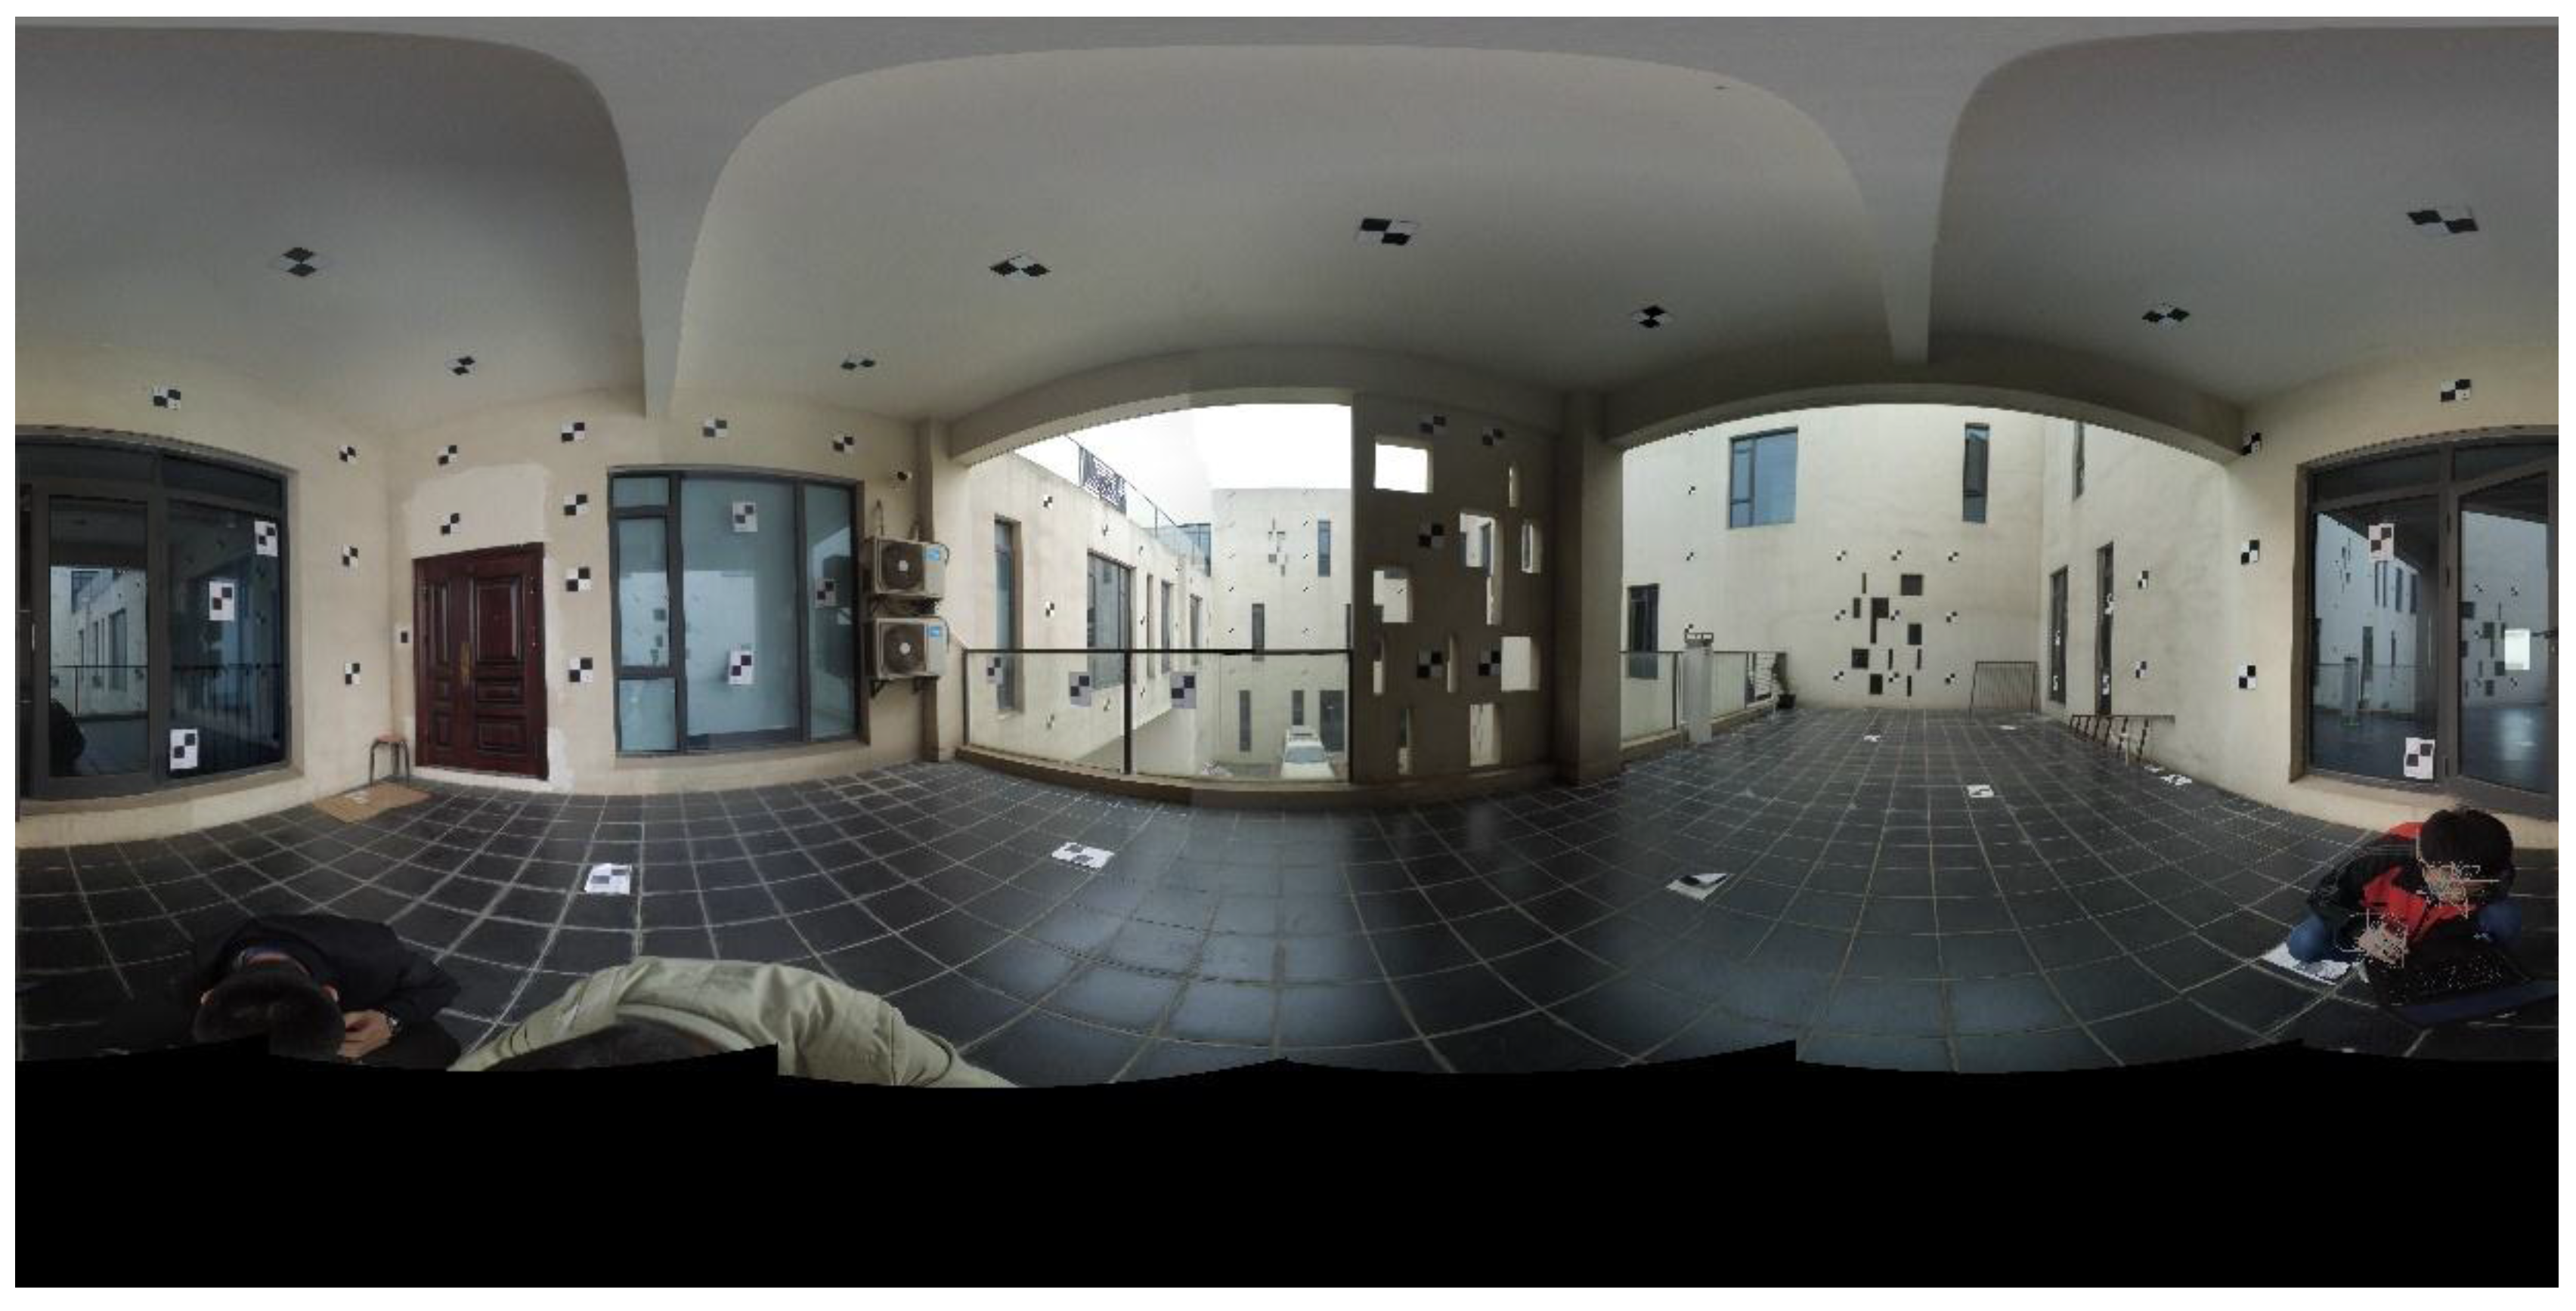
The panoramic images are produced by a panoramic stitching software, and Figure 8 shows the book lending room on the left of the second floor with 204 panoramic images of 4096 × 2048 pixels in size. Such dense panoramic images can fully meet the needs of coloring the model, and to a certain extent, the 3D structure can be recovered only from panoramic images. The vast majority of panoramic images are clear with no significant stitching, and only a few panoramic images have visible motion blur and dislocation stitching according to the statistical observation.
All in all, for the reconstructive point clouds and panoramic images, although the accuracy of the data can be further improved, the density and accuracy of the acquired data are fully responsive to the needs of structured indoor modeling at the present stage.
4. Discussion
The technical framework of this paper is reconstruction of the 3D real scene by the optimized equipment trajectory obtained by 2D SLAM technology. However, there is obvious information scarcity from a 2D trajectory with three degrees of freedom to a 3D trajectory with six degrees of freedom. Although there is no offset in the vertical direction, no pitching angle, and no roll angle when the equipment moves on a plane of absolute level, there are some subtle differences due to non-horizontal ground and jitter. Using the values acquired by MEMS-IMU to make up for this lack of information is a feasible method. However, through the experiment, a small error increase was found from the 2D map to the 3D map. Perhaps a better method is to use 3D SLAM technology to track the device’s trajectory because the six degrees of freedom of the trajectory are optimized simultaneously.
The panoramic images and point clouds are not the final product that describes 3D scenes. Future work will aim for a simple and effective method to turn the point clouds into a model, map the panoramic images on the model, and attach the semantic information to each object. Scene understanding is vital to the creation of a model that conforms to human cognition. Simple plane fitting is not qualified for high quality modeling; semantic extraction and learning intelligence need to be introduced into the disposal of a bunch of scattered point clouds such as the methods proposed in [42,43]. An intelligent generation method of a watertight mesh based on semantic information may be a research direction in modeling, and a distinctive mesh based on the semantic information of the object may be generated.
5. Conclusions
In this paper, an efficient solution for indoor mapping is proposed. Equipment with hardware and software for indoor mapping and modeling is designed. Point clouds and panoramic images for the description of 3D space are reconstructed based on optimized device trajectories obtained by the 2D SLAM technology. First, the integrated equipment with a panoramic camera and three laser scanners is designed and calibrated. Then, the 2D SLAM framework with tracking, local optimization, and global optimization is achieved. Finally, the algorithms for reconstruction of point clouds and generation of panoramic images are implemented.
A library building is mapped precisely as an experimental case. The small-time consumption of the experiment verifies the efficiency of the proposed workflow. The experimental results show that the accuracy of the indoor 3D point cloud can reach 5 cm, and the textures are abundant using the proposed prototype system. It demonstrates that the produced point clouds and panoramic images are fully utilizable for modeling and further work for the large-scale indoor scene. In summary, the proposed system is an efficient and accurate solution for indoor 3D mapping.
Author Contributions
Conceptualization, Q.H., S.W., and Q.M.; Data curation, P.Z. and M.A.; Formal analysis, P.Z. and M.A.; Funding acquisition, Q.H.; Investigation, P.Z.; Methodology, P.Z., Q.H., and M.A.; Project administration, Q.H.; Resources, S.W. and Q.M.; Software, P.Z.; Supervision, Q.H. and M.A.; Validation, P.Z., Q.H., S.W., M.A., and Q.M.; Visualization, P.Z.; Writing—original draft, P.Z.; Writing—review & editing, P.Z. and Q.H.
Funding
This research was funded by the Science and Technology Planning Project of Guangdong Province grant number 2017B020218001, the Fundamental Research Funds for the Central Universities grant number 2042017KF0235 and the National Key Research Program grant number 2016YFF0103502.
Conflicts of Interest
The authors declare no conflict of interest.
References
- 1. Gunduz; M; Isikdag; U; Basaraner; M. A review of recent research in indoor modelling & mapping. Int. Arch. Photogramm. Remote Sens. Spatial Inf. Sci. 2016, XLI-B4, 289–294. [CrossRef]
- Tang, P.B.; Huber, D.; Akinci, B.; Lipman, R.; Lytle, A. Automatic reconstruction of as-built building information models from laser-scanned point clouds: A review of related techniques. Autom. Constr. 2010, 19, 829–843. [Google Scholar] [CrossRef]
- Turner, E.; Cheng, P.; Zakhor, A. Fast, automated, scalable generation of textured 3D models of indoor environments. IEEE J. Sel. Top. Signal Process. 2015, 9, 409–421. [Google Scholar] [CrossRef]
- Xiao, J.; Furukawa, Y. Reconstructing the world's museums. Int. J. Comp. Vis. 2014, 110, 668–681. [Google Scholar] [CrossRef]
- Kim, M.K.; Li, B.; Park, J.S.; Lee, S.J.; Sohn, H.G. Optimal locations of terrestrial laser scanner for indoor mapping using genetic algorithm. In Proceedings of the 2014 International Conference on Control, Automation and Information Sciences (ICCAIS 2014), Gwangju, South Korea, 2–5 December 2014; pp. 140–143. [Google Scholar] [CrossRef]
- Bernat, M.; Janowski, A.; Rzepa, S.; Sobieraj, A.; Szulwic, J. Studies on the use of terrestrial laser scanning in the maintenance of buildings belonging to the cultural heritage. Int. J. Child. Rights 2014, 1, 155–164. [Google Scholar]
- Jamali, A.; Anton, F.; Mioc, D. A novel method of combined interval analysis and homotopy continuation in indoor building reconstruction. Eng. Optim. 2018, 1–7. [Google Scholar] [CrossRef]
- Jamali, A.; Anton, F.; Rahman, A.A.; Mioc, D. 3D indoor building environment reconstruction using least square adjustment, polynomial kernel, interval analysis and homotopy continuation. Int. Arch. Photogramm. Remote Sens. Spatial Inf. Sci. 2016, XLII-2/W1, 103–113. [Google Scholar] [CrossRef]
- Puente, I.; González-Jorge, H.; Martínez-Sánchez, J.; Arias, P. Review of mobile mapping and surveying technologies. Meas. J. Int. Meas. Confed. 2013, 46, 2127–2145. [Google Scholar] [CrossRef]
- Blaser, S.; Nebiker, S.; Cavegn, S. On a novel 360° panoramic stereo mobile mapping system. Photogramm. Eng. Remote Sens. 2018, 84, 347–356. [Google Scholar] [CrossRef]
- Hu, Q.; Mao, Q.; Chen, X.; Wen, G. An Integrated Mobile 3D Measuring Device. China Patent No. CN203148438U, 2013. [Google Scholar]
- Li, D. Mobile mapping technology and its applications. Geospat. Inf. 2006, 4, 1–5. [Google Scholar]
- Engel, J.; Schops, T.; Cremers, D. LSD-SLAM: Large-Scale Direct Monocular SLAM. In Proceedings of the European Conference on Computer Vision (ECCV), Zurich, Switzerland, 6–12 September 2014; Part II. Volume 8690, pp. 834–849. [Google Scholar] [CrossRef]
- Forster, C.; Pizzoli, M.; Scaramuzza, D. SVO: Fast semi-direct monocular visual odometry. In Proceedings of the IEEE International Conference on Robotics and Automation (ICRA), Hong Kong, China, 31 May–7 June 2014; pp. 15–22. [Google Scholar] [CrossRef]
- Mur-Artal, R.; Tardos, J.D. ORB-SLAM2: An open-source SLAM system for monocular, stereo, and RGB-D cameras. IEEE Trans. Robot. 2017, 33, 1255–1262. [Google Scholar] [CrossRef]
- Choi, S.; Zhou, Q.Y.; Koltun, V. Robust reconstruction of indoor scenes. In Proceedings of the IEEE Conference on Computer Vision and Pattern Recognition, Boston, MA, USA, 7–12 June 2015. [Google Scholar] [CrossRef]
- Endres, F.; Hess, J.; Engelhard, N.; Sturm, J.; Cremers, D.; Burgard, W. An evaluation of the RGB-D SLAM system. In Proceedings of the 2012 IEEE International Conference on Robotics and Automation (ICRA), Saint Paul, MN, USA, 14–18 May 2012; pp. 1691–1696. [Google Scholar] [CrossRef]
- Grisetti, G.; Stachniss, C.; Burgard, W. Improved techniques for grid mapping with Rao-Blackwellized particle filters. IEEE Trans. Robot. 2007, 23, 34–46. [Google Scholar] [CrossRef]
- Konolige, K.; Grisetti, G.; Kummerle, R.; Limketkai, B.; Vincent, R. Efficient sparse pose adjustment for 2D mapping. In Proceedings of the IEEE/RSJ International Conference on Intelligent Robots and Systems (IROS), Taipei, Taiwan, 18–22 October 2010. [Google Scholar] [CrossRef]
- Kohlbrecher, S.; Stryk, O.V.; Meyer, J.; Klingauf, U. A flexible and scalable SLAM system with full 3D motion estimation. In Proceedings of the 2011 IEEE International Symposium on the Safety, Security, and Rescue Robotics (SSRR), Kyoto, Japan, 1–5 November 2011. [Google Scholar] [CrossRef]
- Hess, W.; Kohler, D.; Rapp, H.; Andor, D. Real-time loop closure in 2D LIDAR SLAM. In Proceedings of the 2016 IEEE International Conference on Robotics and Automation (ICRA), Stockholm, Sweden, 16–21 May 2016; pp. 1271–1278. [Google Scholar] [CrossRef]
- Ikehata, S.; Yang, H.; Furukawa, Y. Structured indoor modeling. In Proceedings of the IEEE International Conference on Computer Vision, Santiago, Chile, 7–13 December 2015. [Google Scholar] [CrossRef]
- Sanchez, V.; Zakhor, A. Planar 3D modeling of building interiors from point cloud data. In Proceedings of the 2012 19th IEEE International Conference on the Image Processing (ICIP), Orlando, FL, USA, 30 September–3 October 2013. [Google Scholar] [CrossRef]
- Sui, W.; Wang, L.; Fan, B.; Xiao, H.; Wu, H.; Pan, C. Layer-wise floorplan extraction for automatic urban building reconstruction. IEEE Trans. Vis. Comp. Gr. 2016, 22, 1261–1277. [Google Scholar] [CrossRef] [PubMed]
- Zhou, Q.Y.; Koltun, V. Color map optimization for 3D reconstruction with consumer depth cameras. ACM Trans. Gr. 2014, 33. [Google Scholar] [CrossRef]
- Hedau, V.; Hoiem, D.; Forsyth, D. Recovering the spatial layout of cluttered rooms. In Proceedings of the 2009 IEEE 12th International Conference on the Computer Vision, Kyoto, Japan, 29 September–2 October 2009. [Google Scholar] [CrossRef]
- Pintore, G.; Ganovelli, F.; Gobbetti, E.; Scopigno, R. Mobile mapping and visualization of indoor structures to simplify scene understanding and location awareness. In Proceedings of the European Conference on Computer Vision, Amsterdam, The Netherlands, 8–16 October 2016. [Google Scholar] [CrossRef]
- Nakagawa, M. Point cloud clustering for 3D modeling assistance using a panoramic layered range image. J. Remote Sens. Technol. 2013, 1, 52. [Google Scholar] [CrossRef]
- Vosselman, G. Design of an indoor mapping system using three 2D laser scanners and 6 DOF SLAM. ISPRS Ann. Photogramm. Remote Sens. Spatial Inf. Sci. 2014, II-3, 173–179. [Google Scholar] [CrossRef]
- Thomson, C.; Apostolopoulos, G.; Backes, D.; Boehm, J. Mobile laser scanning for indoor modelling. ISPRS Ann. Photogramm. Remote Sens. Spatial Inf. Sci. 2013, II-5/W2, 289–293. [Google Scholar] [CrossRef]
- Zhang, Q.; Pless, R. Extrinsic calibration of a camera and laser range finder (improves camera calibration). In Proceedings of the 2004 IEEE/RSJ International Conference on the Intelligent Robots and Systems (IROS), Sendai, Japan, 28 September–2 October 2004. [Google Scholar] [CrossRef]
- Underwood, J.P.; Hill, A.; Peynot, T.; Scheding, S.J. Error modeling and calibration of exteroceptive sensors for accurate mapping applications. J. Field Robot. 2010, 27, 2–20. [Google Scholar] [CrossRef]
- Li, Q.C.; Muller, F.; Rauschenbach, T. Simulation-based comparison of 2D scan matching algorithms for different rangefinders. In Proceedings of the 2016 21st International Conference on Methods and Models in Automation and Robotics (MMAR), Miedzyzdroje, Poland, 29 August–1 September 2016; pp. 924–929. [Google Scholar] [CrossRef]
- Li, J.; Zhong, R.; Hu, Q.; Ai, M. Feature-based laser scan matching and its application for indoor mapping. Sensors 2016, 16, 1265. [Google Scholar] [CrossRef] [PubMed]
- Mohamed, H.A.; Moussa, A.M.; Elhabiby, M.M.; El-Sheimy, N.; Sesay, A.B. Improved real-time scan matching using corner features. Int. Arch. Photogramm. Remote Sens. Spatial Inf. Sci. 2016, XLI-B5, 533–539. [Google Scholar] [CrossRef]
- Mallick, M.; Morelande, M.; Mihaylova, L. Continuous-discrete filtering using EKF, UKF, and PF. In Proceedings of the 15th International Conference on Information Fusion, Singapore, 9–12 July 2012; pp. 1087–1094. [Google Scholar]
- Barfoot, T.D. State Estimation for Robotics; Cambridge University Press: Cambridge, UK, 2017; p. 388. [Google Scholar]
- Galvez-López, D.; Tardos, J.D. Bags of binary words for fast place recognition in image sequences. IEEE Trans. Robot. 2012, 28, 1188–1197. [Google Scholar] [CrossRef]
- Dubé, R.; Dugas, D.; Stumm, E.; Nieto, J.; Siegwart, R.; Cadena, C. SegMatch: Segment based loop-closure for 3D point clouds. arXiv, 2016; arXiv:1609.07720. [Google Scholar]
- Sameer, A.; Keir, M. Ceres Solver. 2017. Available online: http://ceres-solver.org (accessed on 23 October 2017).
- Zhang, F. Quaternions and matrices of quaternions. Linear Algebra Its Appl. 1997, 251, 21–57. [Google Scholar] [CrossRef]
- Xiao, J.; James, H.; Russell, B.C.; Genevieve, P.; Ehinger, K.A.; Antonio, T.; Aude, O. Basic level scene understanding: Categories, attributes and structures. Front. Psychol. 2013, 4, 506. [Google Scholar] [CrossRef] [PubMed]
- Qi, C.R.; Su, H.; Mo, K.; Guibas, L.J. PointNet: Deep learning on point sets for 3D classification and segmentation. arXiv, 2016; arXiv:1612.00593. [Google Scholar]
Figure 1.
Study workflow chart.

Figure 2.
Device array (left) and schematic diagram of the scanning mode (right).

Figure 3.
Calibration field for camera and laser calibration.

Figure 4.
Framework of trajectory evaluation.

Figure 5.
Snapshot of acquisition process.

Figure 6.
(a–f) Trajectories and 2D maps.


Figure 7.
(a–h) Reconstructive 3D point clouds.


Figure 8.
Panoramic images with position and attitude.


Table 1.
Residuals before and after calibration of relative pose between three laser scanners.
| Laser Scanner | Status | Orientation Error | Position Error |
|---|---|---|---|
| Tilted 1 to horizontal | initial | 0.58° | 0.3 cm |
| final | 0.091° | 0.1 cm | |
| Tilted 2 to horizontal | initial | 0.64° | 0.3 cm |
| final | 0.044° | 0.1 cm | |
| Tilted 2 to tilted 1 | initial | 0.62° | 0.5 cm |
| final | 0.058° | 0.2 cm |
Table 2.
Different accuracy indexes in trajectory evaluation
| Scene | Map Error | Track Error | Real Error |
|---|---|---|---|
| garage | 3 cm | 3° | 0.05° |
| first floor | 3 cm | 5° | 0.2° |
| second floor | 5 cm | 12° | 0.3° |
| third floor | 5 cm | 27° | 0.2° |
| fourth floor | 6 cm | 11° | 0.4° |
| fifth floor | 4 cm | 5° | 1.1° |
© 2018 by the authors. Licensee MDPI, Basel, Switzerland. This article is an open access article distributed under the terms and conditions of the Creative Commons Attribution (CC BY) license (http://creativecommons.org/licenses/by/4.0/).
Share and Cite
MDPI and ACS Style
Zhao, P.; Hu, Q.; Wang, S.; Ai, M.; Mao, Q. Panoramic Image and Three-Axis Laser Scanner Integrated Approach for Indoor 3D Mapping. Remote Sens. 2018, 10, 1269. https://0-doi-org.brum.beds.ac.uk/10.3390/rs10081269
AMA Style
Zhao P, Hu Q, Wang S, Ai M, Mao Q. Panoramic Image and Three-Axis Laser Scanner Integrated Approach for Indoor 3D Mapping. Remote Sensing. 2018; 10(8):1269. https://0-doi-org.brum.beds.ac.uk/10.3390/rs10081269
Chicago/Turabian StyleZhao, Pengcheng, Qingwu Hu, Shaohua Wang, Mingyao Ai, and Qingzhou Mao. 2018. "Panoramic Image and Three-Axis Laser Scanner Integrated Approach for Indoor 3D Mapping" Remote Sensing 10, no. 8: 1269. https://0-doi-org.brum.beds.ac.uk/10.3390/rs10081269
Note that from the first issue of 2016, this journal uses article numbers instead of page numbers. See further details here.