Article

SnowCloudHydro—A New Framework for Forecasting Streamflow in Snowy, Data-Scarce Regions

1
College of Earth, Ocean, and Atmospheric Sciences, Oregon State University, Corvallis, OR 97331, USA
2
Department of Earth Sciences, Montana State University, Bozeman, MT 59717, USA
3
Water Resources Science, Oregon State University, Corvallis, OR 77331, USA
4
Department of Geography, University of Nevada, Reno, NV 97331, USA
5
Pyrenean Institute of Ecology, CSIC, 50059 Zaragoza, Spain
*
Author to whom correspondence should be addressed.
Submission received: 19 June 2018 / Revised: 23 July 2018 / Accepted: 1 August 2018 / Published: 13 August 2018
(This article belongs to the Collection Google Earth Engine Applications)

Abstract

:
We tested the efficacy and skill of SnowCloud, a prototype web-based, cloud-computing framework for snow mapping and hydrologic modeling. SnowCloud is the overarching framework that functions within the Google Earth Engine cloud-computing environment. SnowCloudMetrics is a sub-component of SnowCloud that provides users with spatially and temporally composited snow cover information in an easy-to-use format. SnowCloudHydro is a simple spreadsheet-based model that uses Snow Cover Frequency (SCF) output from SnowCloudMetrics as a key model input. In this application, SnowCloudMetrics rapidly converts NASA’s Moderate Resolution Imaging Spectroradiometer (MODIS) daily snow cover product (MOD10A1) into a monthly snow cover frequency for a user-specified watershed area. SnowCloudHydro uses SCF and prior monthly streamflow to forecast streamflow for the subsequent month. We tested the skill of SnowCloudHydro in three snow-dominated headwaters that represent a range of precipitation/snowmelt runoff categories: the Río Elqui in Northern Chile; the John Day River, in the Northwestern United States; and the Río Aragón in Northern Spain. The skill of the SnowCloudHydro model directly corresponded to snowpack contributions to streamflow. Watersheds with proportionately more snowmelt than rain provided better results (R2 values: 0.88, 0.52, and 0.22, respectively). To test the user experience of SnowCloud, we provided the tools and tutorials in English and Spanish to water resource managers in Chile, Spain, and the United States. Participants assessed their user experience, which was generally very positive. While these initial results focus on SnowCloud, they outline methods for developing cloud-based tools that can function effectively across cultures and languages. Our approach also addresses the primary challenges of science-based computing; human resource limitations, infrastructure costs, and expensive proprietary software. These challenges are particularly problematic in countries where scientific and computational resources are underdeveloped.

Graphical Abstract

1. Introduction

Mountain snowpack collects, stores, and releases water that fills streams and recharges aquifers, functioning as an essential water resource for people, economies, and ecosystems. This annual cycle of accumulation and melt represents one of the most profound seasonal changes on the surface of the Earth [1] (Figure 1). Globally, however, warmer conditions have limited the accumulation of mountain snowpack and hastened its melt, leading to earlier spring snowmelt runoff [2,3,4,5,6,7,8]. These same shifts are expected to negatively affect groundwater recharge in mountainous regions [9], and in turn groundwater levels. Currently over one billion people rely on glaciers and seasonal snowpack as their water supply [10], and the global demand for water is projected to increase with growing populations and changing global economies [11]. These shifts in demand are coupled with supply becoming increasingly uncertain in the face of current climate trends [10,12].
Despite its importance, measurements of mountain snowpacks are sparse, and even when available they rely on monitoring networks that are commonly not representative of general topographic conditions (i.e., they are situated on flat ground in mountainous landscapes and in areas where the forest is has been cleared) [1,13]. Additionally, these are point-based measurements at stationary locations—functioning in a non-stationary climate. Since the availability and scarcity of water vary in time and space [14], the ability to better understand and quantify the accumulation and melt of mountain snowpack would advance science and improve the capacity for better-informed water resource management.
Remotely-sensed data capture the variability of snow across rugged mountain topography and bridge sparse monitoring networks [1,15]. For example, NASA’s Moderate Resolution Imaging Spectroradiometer (MODIS) provides daily snowcover data (MOD10A1) with global coverage. MODIS and other remotely-sensed snow (RSS) products provide daily global-to-local scale coverage of changing mountain snowcover [15,16]. Since RSS measurements provide near-real time data, global coverage, and a consistent historical data record [17], they are pivotal to better understanding snow hydrology, climate change, and related socio-environmental systems [18]. With broad spatial and temporal coverage, RSS products support new snow metrics and novel insights into the spatial and temporal connections between mountain snowpack and downstream water resources that support both basic and applied scientific insights [19]. Additionally, RSS products provide key input data for streamflow prediction models, and are especially valuable in data sparse watersheds [20,21,22].
While geographically versatile, RSS data do not readily transfer across institutions and user groups. Logistical and computational challenges abound in transitioning RSS data to actionable water resources information [23]. Traditionally, working with these massive datasets would require high bandwidth Internet, large digital storage capacity, and expensive hardware and software to download, process, and analyze. Such processing also typically requires a high level of technical expertise. These computational and human resource burdens limit these types of data from being readily implemented by managers and researchers [24].
These challenges limit the use of RSS data in both developed and developing countries, even though there is a critical global need for accessible snowcover information by resource managers and decision-makers. This demand and underutilization of RSS echoes similar concerns voiced by Peter H. Raven regarding the successful dissemination of scientific information. In his presidential address to the American Association for the Advancement of Science in 2002, Raven stated that disseminating scientific information will be fulfilled by approaches that combine advances in understanding, social capacity, and technology [25]. While progress has been made in these efforts, resource managers remain underserved in access to actionable scientific information needed to form decisions for complex, long-term challenges [26].
Cloud computing provides valuable opportunities to address issues of data access, human resource capacity, and computational intensity associated with geospatial information [27,28]. The web-based access and efficiency of cloud computing relieves the computational, budgetary, and logistical challenges of RSS products, provides a low barrier to users implementing this technology, and allows stakeholders and scientists to collaborate on timely and informed decisions in addition to basic and applied scientific discovery [27,28,29]. These advances speak to the long-term relevance of cloud computing to provide a reliable framework for RSS products and to the democratization of data [30,31]. However, simply developing cloud-based tools will not disseminate scientific information. The success of this new cloud-based paradigm will require advances in technological and social capacity that connect data providers to scientists and resource managers to create an end-to-end information system.
We present SnowCloud, an end-to-end cloud-computing framework comprised of (i) SnowCloudMetrics, cloud-based tools that transition RSS products into actionable snow metrics [19]; and (ii) SnowCloudHydro, a simple hydrologic model for snow dominated watersheds that relies solely on monthly Snow Cover Frequency (SCF) and previous streamflow to forecast monthly streamflow with a one-month lead-time. We also present the insights of water resource professionals collected from an anonymous survey that reflect their perspectives on the value of SnowCloud and cloud-based computing for improving water resource management. The intent of this paper is to demonstrate the prototype SnowCloud framework, showing snow mapping and hydrologic forecasting results from three case study watersheds. We also present ideas and methods on how to better integrate and manage large datasets for hydrological forecasts using an interactive, cloud-based approach.

2. Materials and Methods

The SnowCloud framework was tested in three snow-dominated watersheds: La Laguna (the headwaters of the Río Elqui in semi-arid, Northern Central Chile), the John Day River (a semi-arid watershed in Eastern Oregon, Northwestern USA), and the Río Aragón (in the Spanish Pyrenees) (Table 1). These watersheds were chosen to test the model framework where snowmelt is a major water resource, but in distinctly different climates. The watersheds were delineated from each respective stream gage, and streamflow data were provided by the respective managing agency [32,33,34]. Table 1 provides brief descriptions of each watershed’s topography, climate, mean annual SCF (2002–2016), and the runoff ratio (long-term average streamflow, Q, to long-term average precipitation, P) [35].
Figure 2 provides a conceptual overview of the SnowCloud framework for the reader, which is explained in greater detail in the Methods section.
Here we used SnowCloudMetrics to compute the monthly SCF from the daily MOD10A1 [36] snow cover product at 500-m resolution. For each MODIS pixel, SCF represents the ratio of the number of days in a month that the pixel is snow covered:
SCF monthly = #   of   snow   observations   #   of   valid   observations
Since cloud cover commonly obscures satellite observations of snow, a per-pixel cloud correction was implemented based upon the following rules:
(i)
If consecutive cloudy days occur between two snow-covered days, then the cloudy days are interpreted as snow-covered;
(ii)
If consecutive cloudy days occur between two non-snow-covered days, then the cloudy days are interpreted as non-snow-covered;
(iii)
If consecutive cloudy days occur between an antecedent snow-covered day and a subsequent non-snow-covered day, then the cloudy days are interpreted as non-snow-covered; and
(iv)
If consecutive cloudy days occur between an antecedent non-snow-covered day and a subsequent snow-covered day, then the cloudy days are interpreted as snow-covered.
The two corollaries to the four conditions listed above are (i) if cloudy days are succeeded by a snow day, then the cloudy days are considered as snow days; and (ii) if cloudy days are succeeded by a non-snow-covered day, then the cloudy days are considered non-snow-covered.
If the end of the analysis period has consecutive cloudy days, an additional test is performed. For this special case, the underlying snow condition for cloud pixels is estimated by including an additional 30 days at the end of the analysis period, then stepping backwards, applying the two corollaries to identify the snow or no-snow land condition for each pixel. When analysis of that 30-day period is complete, the snow/no-snow condition is accordingly assigned to any cloudy pixels at the end of the analysis period.
After the monthly calculations have been completed for each pixel, they are averaged over the watershed to provide a spatially aggregated fraction of days in a month with snow cover.
SCF values are computed in the Google Earth Engine (GEE) Code Editor, an integrated platform that provides planetary-scale geospatial analysis in a cloud computing environment [24]. Google Earth Engine allows users to access and analyze data from a multi-petabyte data catalog (including MODIS). Developers can create fast computing tools using code written in either JavaScript or Python in the Code Editor. The code runs on the GEE cloud and results are displayed as map-based visualizations [24]. The results of the SCF calculations are then exported to a comma-separated value file that can be readily input to any spreadsheet application.
These SCF calculations were used as input for SnowCloudHydro, a runoff model developed to forecast streamflow for snow-dominated watersheds in data-scarce northern Chile [21]. The structure of the model requires only monthly SCF and previous monthly streamflows to forecast monthly streamflow ( Q m ) with one-month lead time based upon the following algorithm:
Q m = a S C F ¯ m 1 b + c Q ¯ m 1 * + d Q ¯ m 1
where S C F ¯ m 1 represents the six-month running average of snow cover frequency, encapsulating annual accumulation and melt cycles. This approach also allows winters with more extensive and prolonged snowpack to provide greater melt contributions later into the spring and early summer. Q ¯ m 1   * is the two-month moving average of streamflow that represents seasonal changes and conditions, and whether streamflows are increasing or decreasing. Q ¯ m 1 is the twelve-month moving average of streamflow that represents annual base flow contributions [21]. The parameters a, b, c, and d are scaling coefficients.
The initial model was calibrated using data from 36 of 144 months. The calibration implemented code that executed the GLUE methodology [37] to find solutions for the scaling parameters (a, b, c, and d) that optimize the model. GLUE incorporates a series of dotty plots comprised of 5000 Monte Carlo simulations per iteration. In the optimization process, each scaling parameter was individually optimized through visual inspection using dotty plots (which show objective function values as a function of model parameters) and computational metrics (Nash-Sutcliffe Efficiency (NSE) [38,39] and R2). The model was then validated using the remaining 108 months of data. This rigorous calibration and validation helped ensure that the model was getting the right answers for the right reasons [40]. The original SCF-Runoff model displayed a high level of skill in predicting streamflow with NSE and R2 values of 0.83. For a more detailed description of the model, its uncertainties, and its results please refer to Sproles, et al. [21].
One of the primary goals of the SnowCloudHydro framework is to alleviate the computational and software demands required when using a robust methodology like the GLUE method. GLUE requires coding expertise and access to advanced computing resources. The same SnowCloudHydro model was tested in a cloud-based spreadsheet application (Google Sheets) by implementing the Solver extension and the non-linear least squares method to solve for the a, b, c, and d parameters.
Spreadsheets for each of the three watersheds were developed that included SCF calculations and monthly streamflow data. Optimized solutions for the a, b, c, and d parameters were solved in the spreadsheets for each watershed using only a calibration process. To test the efficacy of the optimized non-linear least squares solutions in Solver, the GLUE methodology was also completed for each watershed using a calibration and validation process within MATLAB® scientific computing software [41].
Since the intent of SnowCloud is provide end users with actionable scientific information, we introduced water resource managers to the cloud-based decision support tools through a series of web-based tutorials in English and Spanish. To assess the efficacy of SnowCloudHydro and the user’s experiences, a dual-language survey was developed and sent to water resource managers in the three participating countries (Appendix A). The survey provided anonymity for participants, and the only distinguishing component was whether or not it was conducted in English or Spanish. The distribution of the web-based tutorials and surveys were sent by email to participants using an address list curated by the authors. Additionally, the same introductory email and request for participation was emailed through listservs.
This qualitative component of the project was designed and implemented in accordance and compliance with the Human Research Protection Program and the Internal Review Board at Oregon State University (Study ID 8161).

3. Results

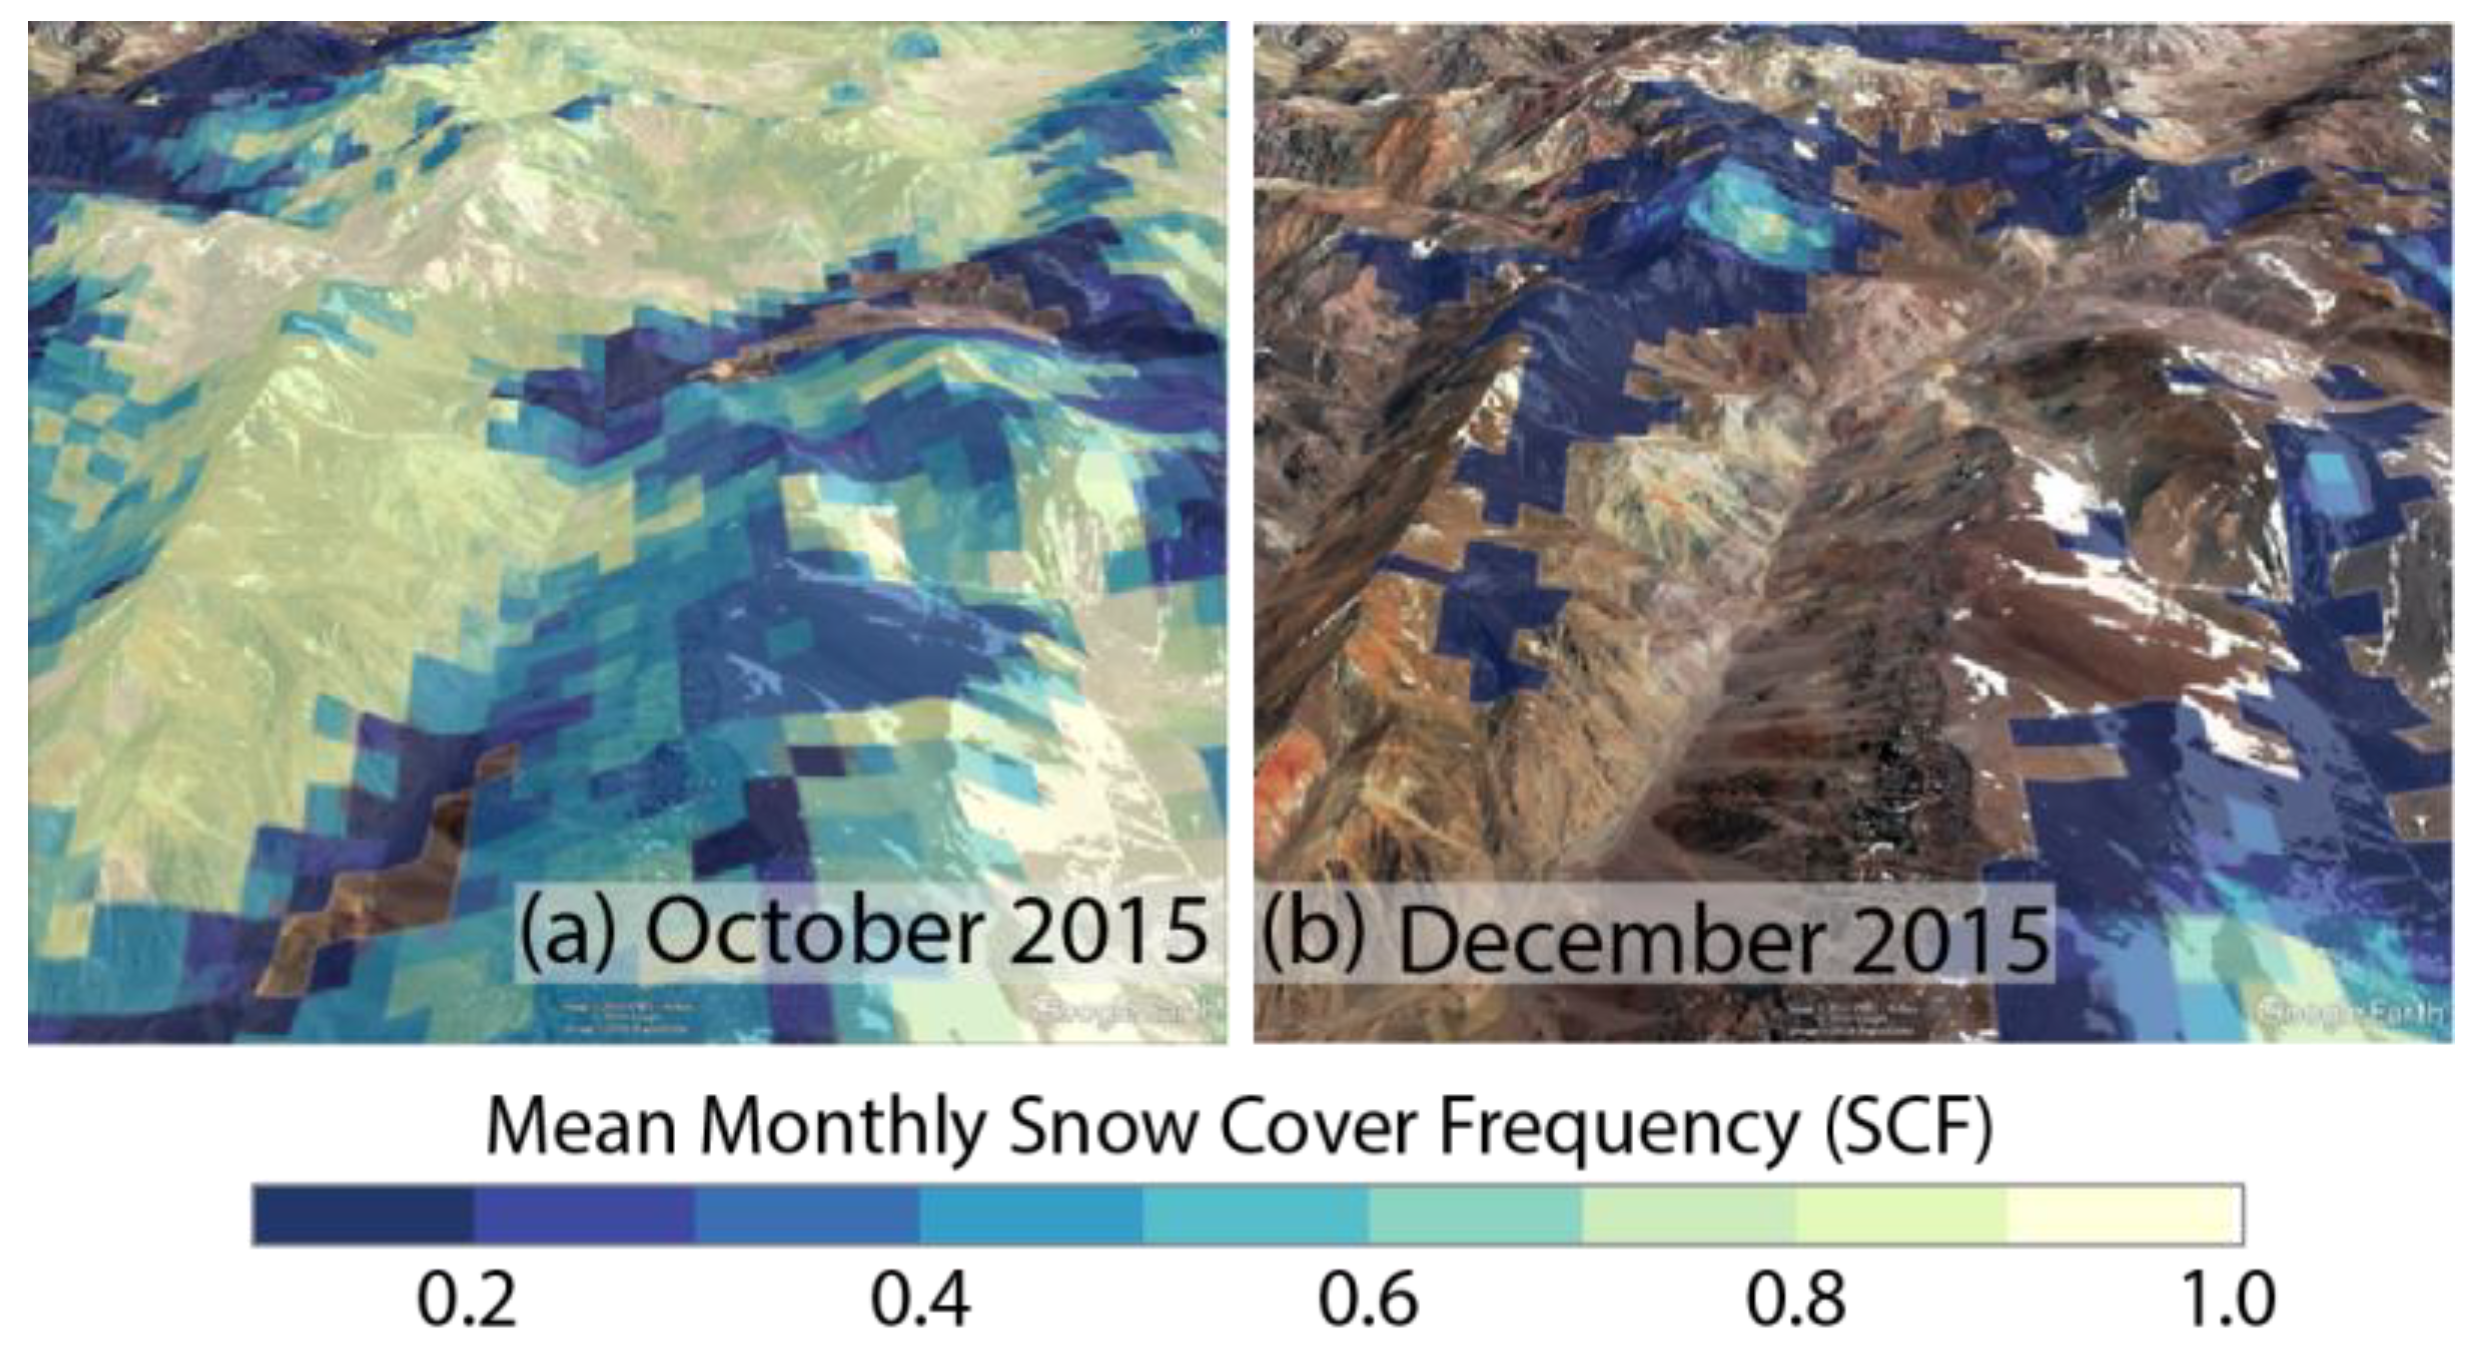
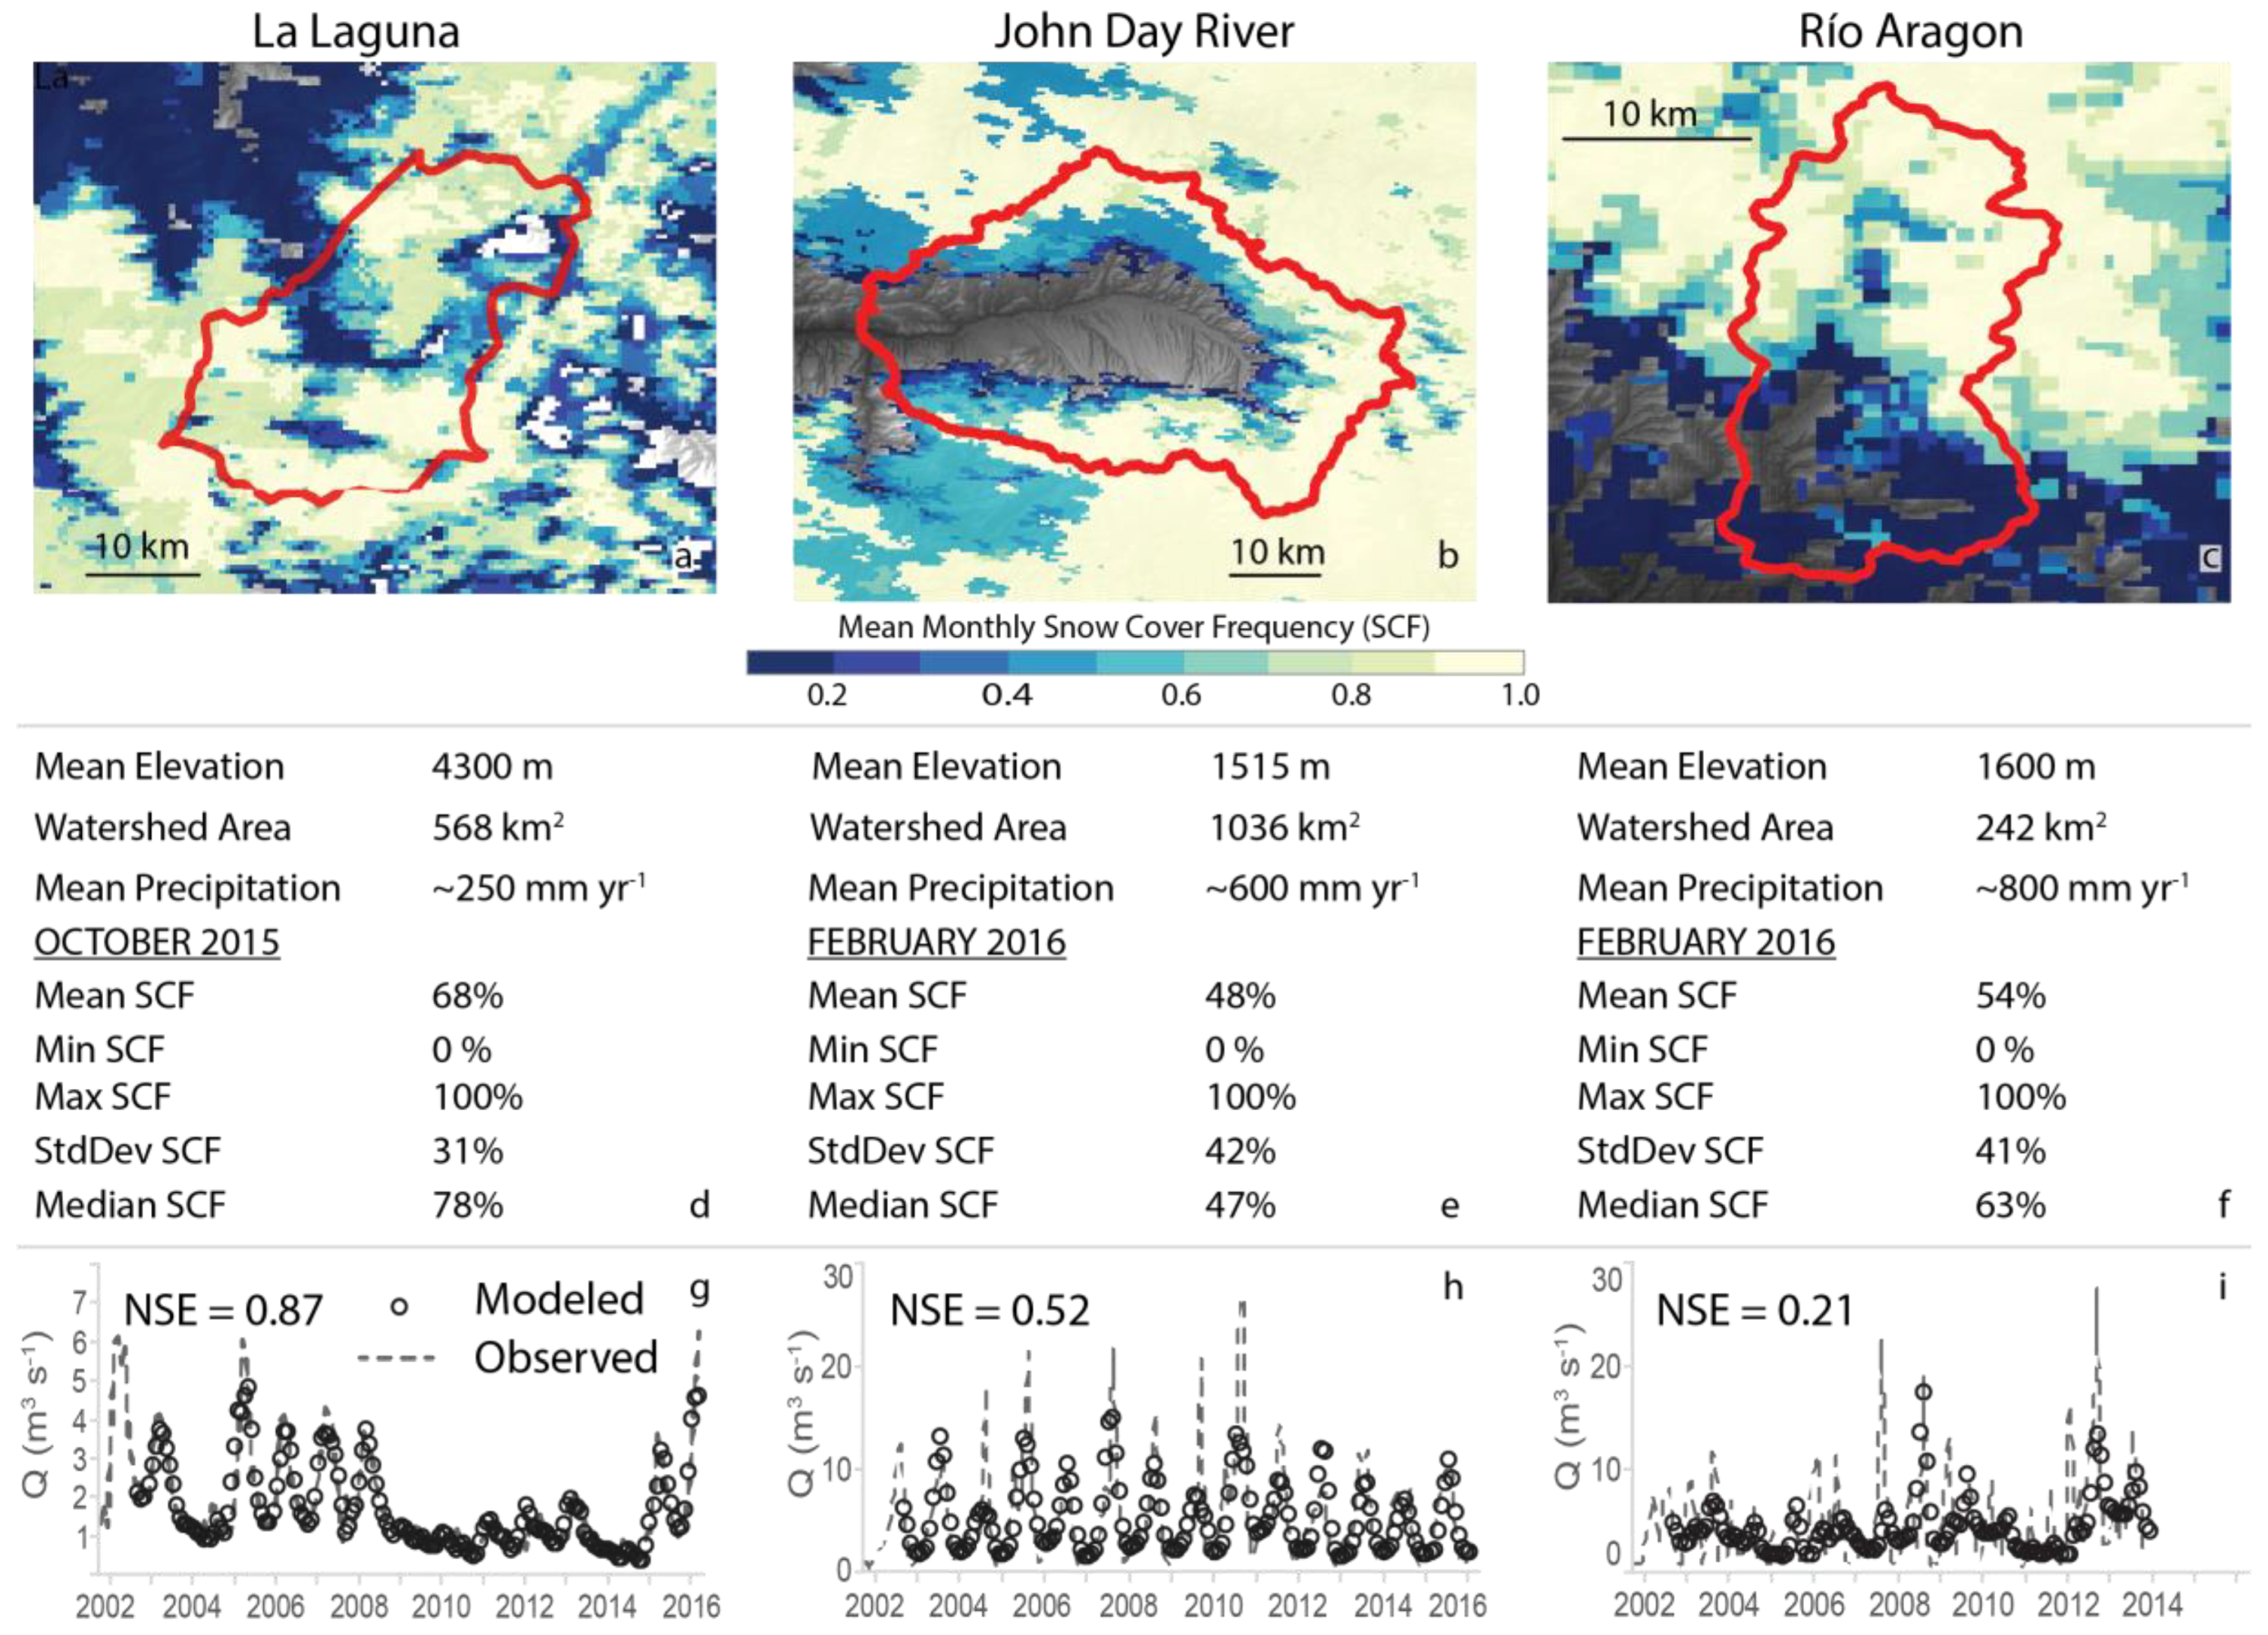
3.1. Snow Cover Frequency Calculations Using SnowCloudMetrics
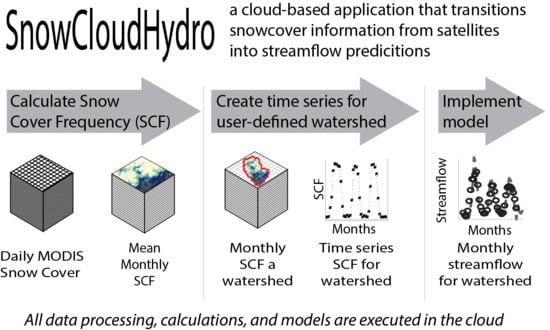
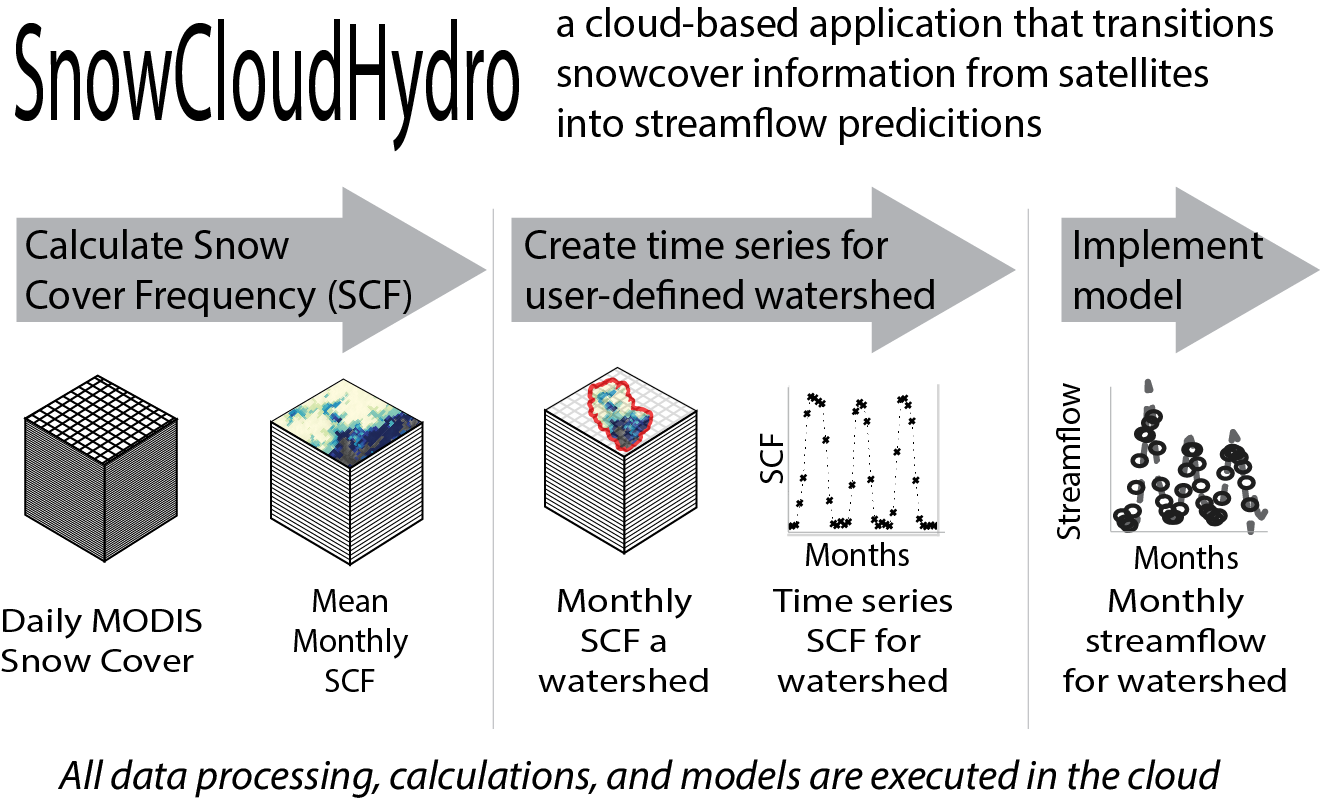
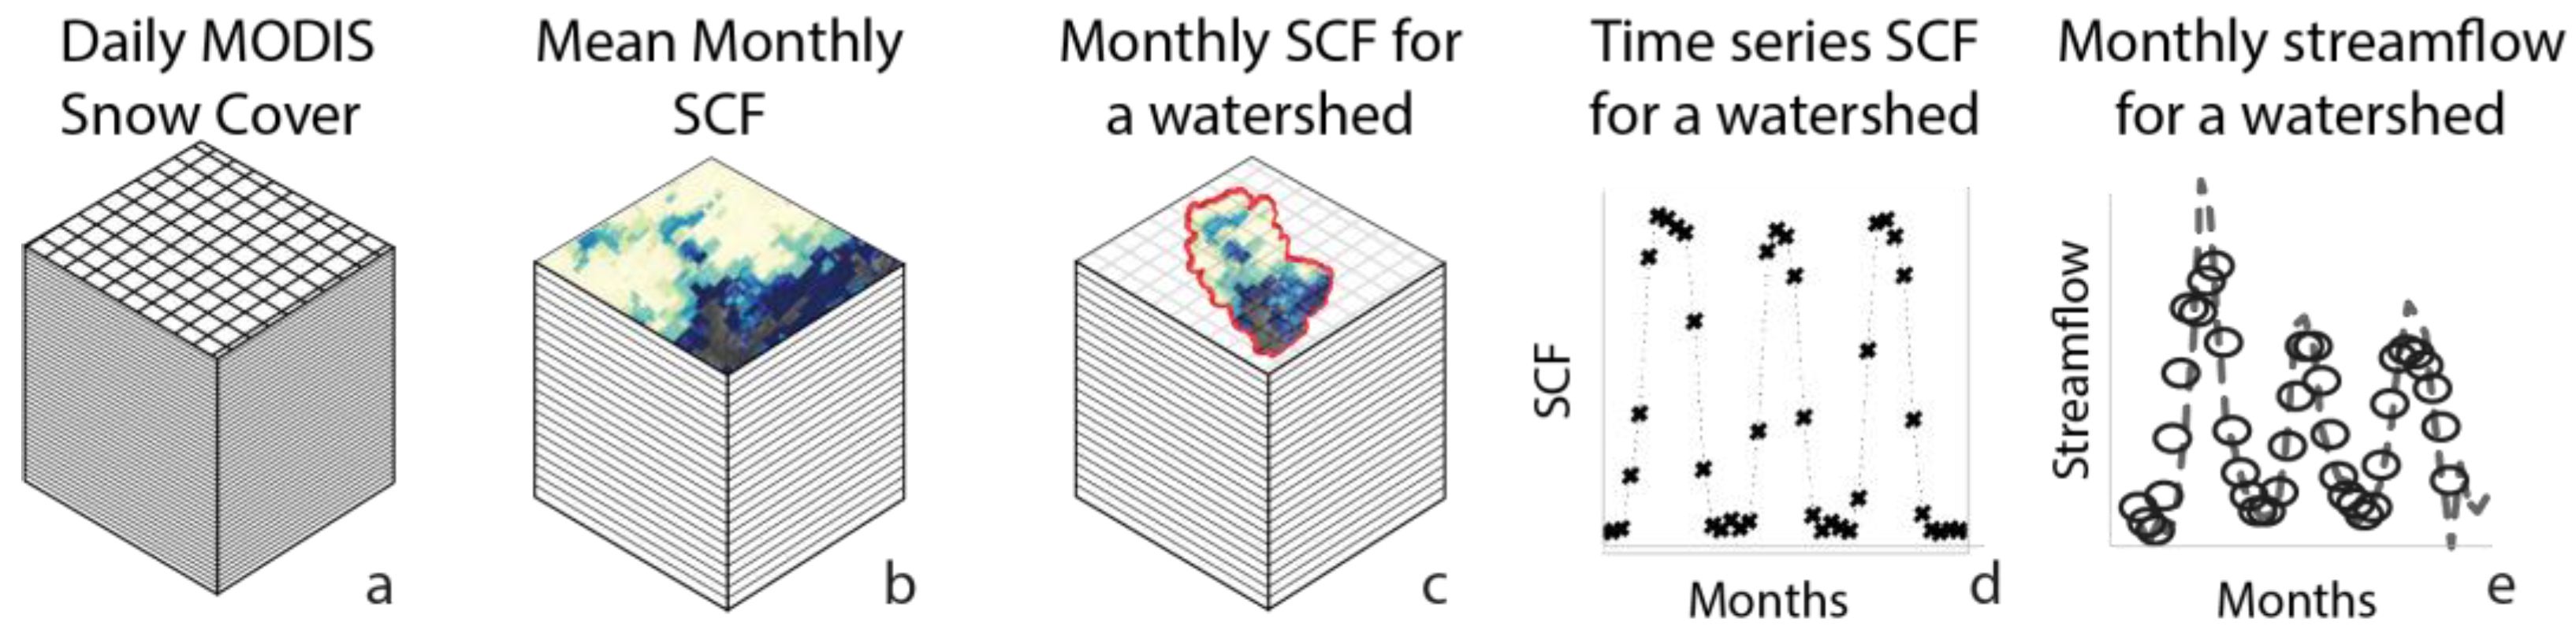
For each of the three case study watersheds, we computed SCF within SnowCloudMetrics. This was done for the period 24 February 2000 to 31 December 2016 (6156 days). The global pre-processing (Figure 2a; creating the data arrays and tiling the daily MODIS datasets) for SnowCloudMetrics required 3.75 min to compile a global MOD10A1 array. Calculations of the mean SCF for an individual month required between 5–10 s for each watershed (Figure 2b,c and Figure 3a–f). The calculations of mean monthly SCF for February 2000–December 2016 required between 4–5 min on average (Figure 2d). The calculations in the cloud also avoided downloading and organizing the requisite MODIS data, which, in total, would have been around 30–40 GB per watershed.

3.2. SnowCloudHydro

The model’s skill in predicting streamflow one month in advance varied across watersheds. In the higher elevation La Laguna watershed (mean elev. 4300 m) the simulations provided a high-degree of skill in forecasting streamflow (NSE = 0.87, Figure 3g). In the lower elevation John Day River (mean elev. 1514 m) and Río Aragón (mean elev. 1600 m) watersheds, model skill was lower (R2 = 0.52 and R2 = 0.21, Figure 3h,i, respectively). The streamflow simulations for the John Day River do not capture peak streamflow events during the winter, presumably because of rain contributions during these events. Similarly, in the Río Aragón watershed the model does not capture numerous peaks in streamflow, occurring primarily from late spring to mid fall, mainly associated with rain events. These results indicate a need for more detailed analysis of the model’s seasonal indicators, however this analysis lies outside the scope of this paper.
The optimized parameters for the GLUE and the non-linear least squares calibration were similar except for the a parameter in the Río Aragón, which was much higher in the non-linear least squares version (Table 2). In all three watersheds the non-linear least squares approach performed slightly better than the more robust GLUE and dotty plot method (Table 2).

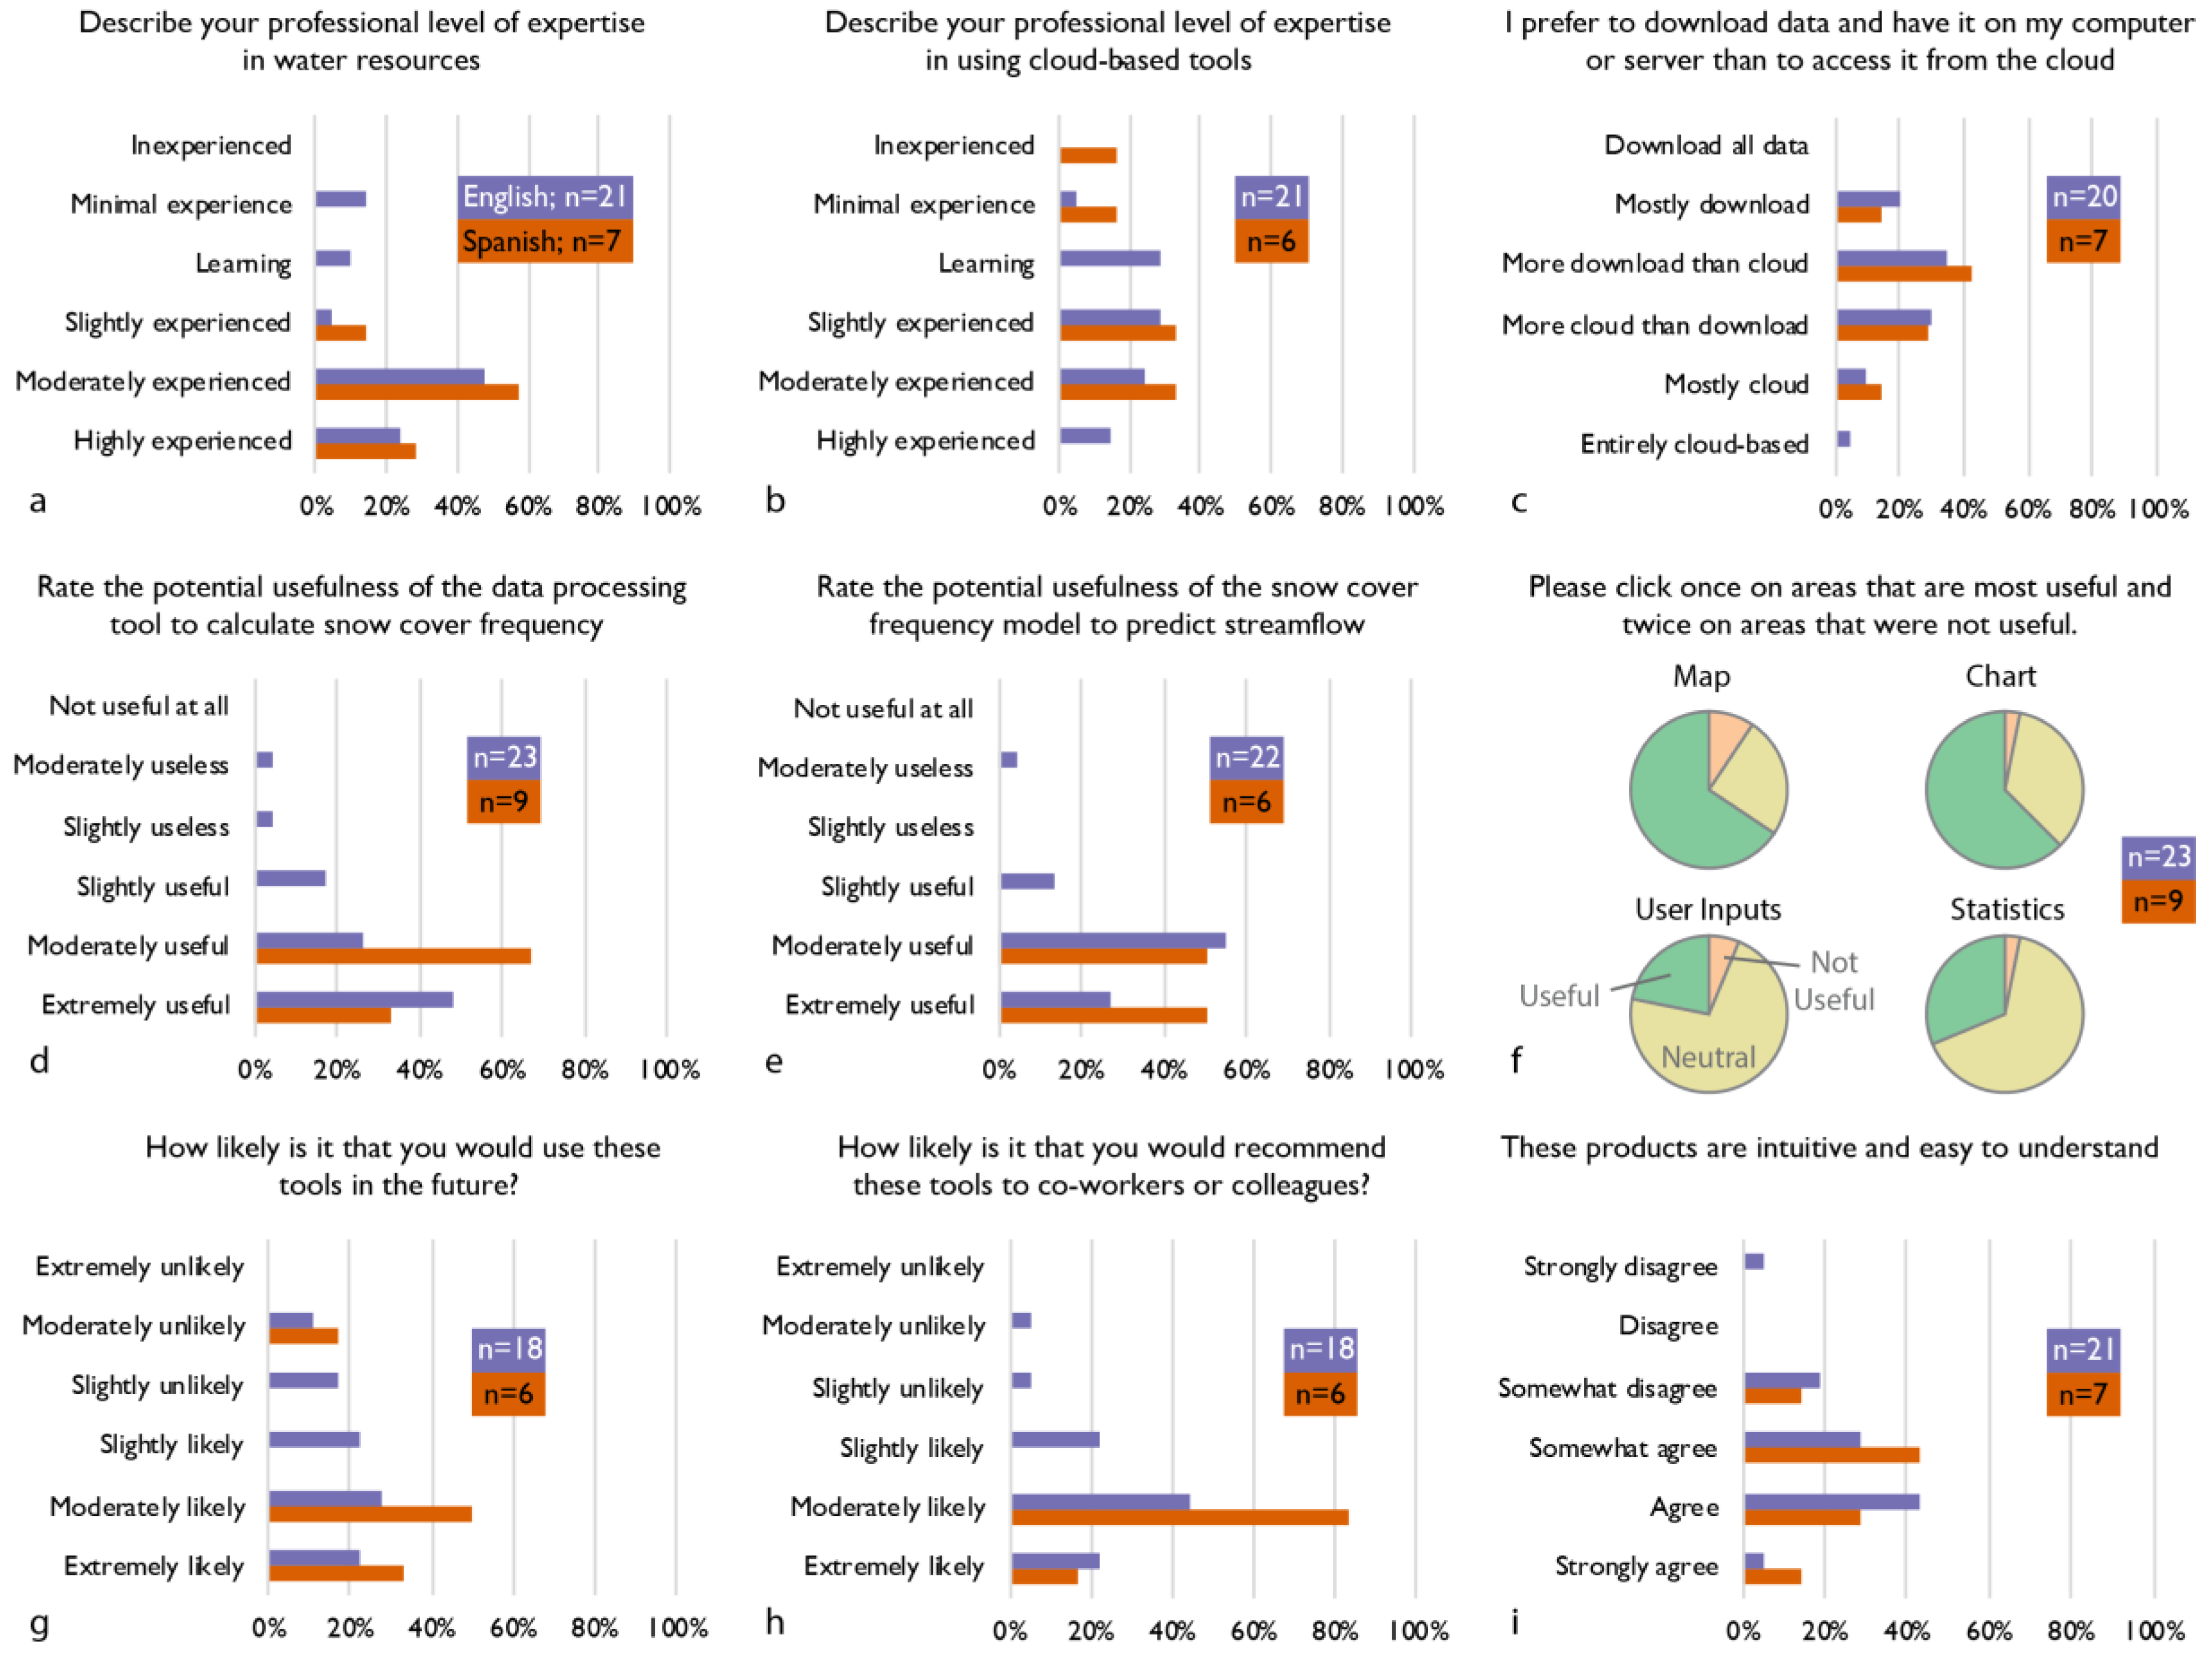
3.3. Users’ Assessment of SnowCloud

The participants’ responses from the qualitative survey provided an overall positive assessment of the SnowCloud framework (SnowCloudMetrics and SnowCloudHydro) (Figure 4a–j). The professional background of the users was comprised of more experienced water resource professionals (Figure 4a; 9.5 years for English speakers, and 12.6 years for Spanish speakers). The participants’ background in cloud computing was varied, ranging from beginners to experienced users (Figure 4b). Following this same trend, the participants used both downloaded and cloud-based data (Figure 4c).
Participants generally perceived the SnowCloud framework and its tools as moderately or extremely useful in calculating SCF and streamflow (Figure 4d,e), and only one English speaker found these tools moderately useless. To better understand which components of the web-interface were most useful, participants were provided an image of the Code Editor web-interface and were asked to identify which components were useful or not useful (Figure 4f and Appendix A). If the area was not selected it was considered neutral. The Map and the Chart that display the results in SnowCloudMetrics were considered the most useful by participants (66% and 63%, respectively). The Statistics (outputs similar to those in Figure 3d–f) and the ability to change User Inputs (select different watersheds) were also evaluated as useful, but to a lesser degree. While each of the components of the web-interface were classified as not useful by at least one participant, no one single component stood out as having less utility than the other components (all were below 10% of respondents).
Participants also indicated that they were moderately-to-extremely likely to use these tools in the future or would recommend them to a co-worker (Figure 4g,h). Despite these positive perceptions regarding the overarching SnowCloud framework, there was only modest agreement that these tools were intuitive to users (Figure 4i). This highlights the need to have clear directions and guidelines for the use of these tools.
The goal of this survey was to obtain user feedback on the prototype version of SnowCloud developed in the GEE Code Editor. The number of responses for each question is noted in each of the sub-figures. As such these results should be interpreted as indicative of user impressions, but do not reflect the opinions of the full water resources professional community.

4. Discussion

The case studies presented in this paper tested the ability of cloud computing frameworks to transition RSS data into actionable water resources information, a new paradigm for information delivery for snow hydrology and natural resource management. The initial inspiration for this project was based in the authors’ frustrations regarding the amount of computational and human resources required for monthly updates to the original SCF-runoff model in Chile [21]. Prior to SnowCloud, monthly streamflow forecasts of the La Laguna watershed required 2–3 days to complete. That earlier process required a technician to download MODIS snow cover data (with variable broadband rates), process and re-project the spatial data, compute SCF for the watershed, and finally to compute the streamflow. Requiring only a Google account and a web browser, SnowCloud performs these same spatial calculations in less than 10 min, and with a similar level of forecast skill. Through GEE, the SnowCloud model framework provides access to the data, processing, models, and visualizations that complete the detailed analyses of watersheds in snowy regions.
These case studies also identified the deficiencies of the snow-only framework of the SCF-Runoff model. Model skill directly corresponded to the snowpack contribution to streamflow, decreasing as the ratio of rain/snow increases at the basin scale. In the high-elevation La Laguna watershed, winter conditions consistently remain below 0 °C and almost all precipitation occurs during the winter months, arriving almost entirely as snow and covering the entire watershed (Figure 3a). Here the SnowCloudHydro model works with a high level of forecast skill (NSE = 0.87). By comparison in the lower elevation and warmer John Day River and Río Aragón watersheds (Table 1), the model skill drops considerably (NSE = 0.52 and NSE = 0.21, respectively). Average winter temperatures in the John Day River and Río Aragón watersheds are at, or slightly above, 0 °C in the middle and lower elevations of the watersheds. This 0 °C isotherm infers a higher likelihood that winter precipitation events will have both rain and snow during the course of the winter. As a result, the mid- to lower-elevation portions of these watersheds are only partially snow covered (Figure 3b,c). Further impacting model skill is summer precipitation in the John Day and Río Aragón watersheds, as 40% of annual precipitation occurs during May-September when precipitation falls as rain. These events are not captured in the current SnowCloudHydro model structure. The relative lower skill of the Río Aragón can be attributed to a watershed that is more responsive to rain events and/or has more intense summer precipitation events as evidenced in the peaks of measured streamflow during the summer (Figure 3j) [34].
While the model does work well in high altitude, snow-dominated regions like the headwaters of the La Laguna sub-basin, in regions where there is a higher contribution to streamflow from rain (like the John Day River and Río Aragón), the model underperforms. The authors recognize that improvements to this prototype model structure should enhance forecast skill in regions where rain has a pronounced role in streamflow generation. The current limitations will be addressed into subsequent versions of the SnowCloud model framework. We anticipate integrating precipitation data from NASA’s Global Precipitation Measurement (GPM) that are readily available in the GEE data library. Successful implementation of these precipitation forcings would greatly enhance the model structure, and potentially alleviate a priori streamflow input requirements. This enhanced model would thus allow cloud-based streamflow forecasts in ungauged basins that are influenced by both snow and rain. Increasing the temporal frequency of model predictions (monthly to weekly or biweekly) would require approximately four times as many calculations (ca. four weeks in a month), but would be able to provide more frequent insights into the water resources within a basin.
Temporally, the coarse resolution of monthly forecasts also provides a means to improve the current model structure. While informative, the monthly forecasts provide a general overview of future streamflow. Transitioning the model to weekly streamflow forecasts would provide managers with more timely information and the opportunity for more proactive resource management.
Another potential means to improve SnowCloudHydro would be to validate the SCF maps using high-resolution remote sensing imagery or in situ observations. This component was not included in this study because (1) the goal was to present the prototype framework, and (2) SnowCloudHydro is designed specifically for data scarce regions, which would limit these types of data.
Comparison of the optimized parameter solutions and model results for the two modeling approaches (GLUE and non-linear least squares) presents several questions regarding hydrologic models that are more broad in scope. The more rigorous GLUE methodology incorporates a calibration and validation period using Monte Carlo simulations. This calibration and validation approach is more common in research-based applications and generally requires more sophisticated software and programming and is not embedded in SnowCloudHydro, however, we do provide the source code for replicability [42]. Despite its complexity, the GLUE-based model performed with slightly less skill than the more simplistic non-linear least squares approach. These results suggest that model complexity does not always ensure better model results especially in data scarce regions, and that with straightforward models (like SnowCloudHydro) simplistic approaches can function well. Since the non-linear least squares approach was successfully implemented using a cloud-based spreadsheet, this technique provides a lower barrier to hydrological forecasting as compared to research-based computing and software associated with the GLUE methodology. This question of model complexity is relevant for researchers as they begin the initial stages of a research project, when they begin to conceptualize and develop analysis tools. During these initial stages it is important to have the end user in mind, identify the goals of the project, and understand the computational and human resources that are available for potential users.
The computation times for GEE will vary depending on the complexity of the processing task and the amount of computational resources available on the GEE servers. The times provided in the results are intended to be relative (minutes, hours, or days), and not exact (minutes: seconds). The important message is that these cloud-based calculations collapse the amount of time needed to perform complex processing and data generation from days to minutes. This represents a new paradigm for information creation and delivery.
To better connect these and subsequent efforts to the end user, our qualitative survey provides initial insights into the needs, interests, and expertise of end users across broad geographies. A majority of participants (water resource managers) classified SnowCloudMetrics and SnowCloudHydro as potentially useful, even though there was a wide-range of user experience with regards to cloud computing. Participants indicated that these types of tools would be used or recommended in the future. Regardless of their level of expertise with cloud computing, end users imply a willingness willing to use an end-to end, decision support framework. The perception that the framework is only moderately intuitive encourages us (and subsequent developers) to develop better guidelines for our product, facilitating its use for a wide user base. These survey results will help guide the conversion of the current SnowCloudMetrics and more robust versions of SnowCloudHydro into a freely accessible application (SnowCloud.app). Facilitating the use of SnowCloud is important as participants had a positive perspective of the SnowCloud framework that persisted across languages and continents, suggesting that similar multi-lingual platforms could also be well-received in other cultures and languages. This leads to a potentially overlooked benefit of cloud computing—its ability for data providers to expand their user base globally.
While the SnowCloud framework was developed using only MODIS data, it could readily be adapted to incorporate other types of spatial data. For example, other space-borne images with higher spatial resolution could be implemented as combined reanalysis products (temperature and precipitation) in areas where observational data is extremely sparse topographically complex. In these regions the 500 m resolution of MODIS may not effectively capture the complexity of the local mountain hydro-climatology.

5. Conclusions

SnowCloud, represents a prototype end-to-end framework comprised of cloud computing tools specifically designed to calculate monthly snow cover frequency and predict streamflow one month in advance. SnowCloud and the qualitative research that accompanies this paper are not intended as an end product, but rather as initial insights into this new paradigm that provides opportunities for snow scientists and hydrologists to accelerate basic and applied research in data sparse, snowy watersheds. These advances align well with the goals of applied science to support the implementation of Earth observations into better informed management of water resources [43].
Whether using GEE or other platforms, cloud-based computing lowers the computational, budgetary, and logistical barriers to implement RSS data that previously existed when working with large RSS datasets. Avoiding the requirement of downloading and pre-processing data in itself alleviates considerable technical and human capacity barriers that have existed previously. The geographic and cultural breadth of the participants and their overall positive assessment of SnowCloud speak to the potential opportunities that cloud computing can provide natural resource managers regardless of their location or level of expertise. This democratization of science and data [30,31] offers exciting new possibilities for basic and applied science beyond water resources by reducing the complexity around data management and processing. These efficiencies allow the research manager to focus time and resources on basic and applied scientific discovery, and away from computational barriers. The evolution of cloud computing and the accompanying science support the Raven’s [25] perspective that disseminating scientific information will be fulfilled by approaches that combine advances in understanding, social capacity, and technology. The resource management and research communities now have access to computational power that was previously limited to supercomputers. It is now up to these same communities to make use of it.

Author Contributions

Conceptualization: E.S., R.C., and A.N.; methodology: E.S., R.C., A.N., and E.M.; software: E.S., R.C., and E.M.; validation: E.S., R.C., and E.M.; formal analysis: E.S., R.C., A.N., and I.M.; investigation: E.S., R.C., A.N., and I.M.; resources: E.S., R.C., A.N., and I.M.; data curation: E.S. and I.M.; writing—original draft preparation: E.S.; writing—review and editing: E.S., R.C., A.N., E.M., and I.M.; visualization: E.S. and E.M.; supervision: E.S., and A.N.; project administration: E.S., and A.N.; funding acquisition: E.S., and A.N.

Funding

This research was funded by an incubator grant from the Earth Science Information Partners (ESIP) and by NASA grant No. NNX16AG35G.

Acknowledgments

The authors would like to thank the water resource professionals that participated in this project and provided anonymous assessments of SnowCloud. E.S. would also like to thank the Department of Geography at the University of Oregon for providing office space to facilitate the completion of this manuscript. Additionally, the authors would like to thank the four anonymous reviewers for their expertise and perspectives that helped improve the quality of the final manuscript.

Conflicts of Interest

The authors declare no conflict of interest. Any brand name or companies in the paper are not endorsements. The founding sponsors had no role in the design of the study; in the collection, analyses, or interpretation of data; in the writing of the manuscript, and in the decision to publish the results.

Appendix A

Questions provided in the online assessment (English version)
Read through the first page on the website, and then follow the instructions at the bottom of each page. There are four short pages in total.
Clicking on the “Agree” button indicates that:
  • You have read the above information
  • You voluntarily agree to participate
  • You understand that participation is voluntary, and you can stop at any time
  • You understand there is no monetary compensation for your participation
Thanks! Team SnowCloud
Agree (1)
(1) Rate the potential usefulness of the data processing tool to calculate snow cover frequency.
  • Extremely useful (1)
  • Moderately useful (2)
  • Slightly useful (3)
  • Slightly useless (4)
  • Moderately useless (5)
  • Not useful at all (6)
(2) Rate the potential usefulness of the snow cover frequency model to predict streamflow.
  • Extremely useful (1)
  • Moderately useful (2)
  • Slightly useful (3)
  • Slightly useless (4)
  • Moderately useless (5)
  • Not useful at all (6)
(3) Please click once on areas that are most useful (green) and twice on areas that were not useful (red). Remotesensing 10 01276 i001
(4) Describe your professional level of expertise in using cloud-based tools.
  • Highly experienced (1)
  • Moderately experienced (2)
  • Slightly experienced (3)
  • Learning (4)
  • Minimal experience (5)
  • Inexperienced (6)
(5) Describe your professional level of expertise in water resources.
  • Highly experienced (1)
  • Moderately experienced (2)
  • Slightly experienced (3)
  • Learning (4)
  • Minimal experience (5)
  • Inexperienced (6)
(6) I prefer to download data and have it on my computer or server than to access it from the cloud.
  • Entirely cloud-based (1)
  • Mostly cloud (2)
  • More cloud than download (3)
  • More download than cloud (4)
  • Mostly download (5)
  • Download all data (6)
(7) These products are intuitive and easy to understand.
  • Strongly agree (1)
  • Agree (2)
  • Somewhat agree (3)
  • Somewhat disagree (4)
  • Disagree (5)
  • Strongly disagree (6)
(8) How likely is it that you would use these tools in the future?
  • Extremely likely (1)
  • Moderately likely (2)
  • Slightly likely (3)
  • Slightly unlikely (4)
  • Moderately unlikely (5)
  • Extremely unlikely (6)
(9) How likely is it that you would recommend these tools to co-workers or colleagues?
  • Extremely likely (1)
  • Moderately likely (2)
  • Slightly likely (3)
  • Slightly unlikely (4)
  • Moderately unlikely (5
  • Extremely unlikely (6)
(10) Please provide the number of years that you have worked in your current professional capacity.

References

  1. Dozier, J. Mountain hydrology, snow color, and the fourth paradigm. Eos Trans. Am. Geophys. Union 2011, 92, 373. [Google Scholar] [CrossRef]
  2. Fritze, H.; Stewart, I.T.; Pebesma, E. Shifts in Western North American Snowmelt Runoff Regimes for the Recent Warm Decades. J. Hydrometeorol. 2011, 12, 989–1006. [Google Scholar] [CrossRef]
  3. Yucel, I.; Güventürk, A.; Sen, O.L. Climate change impacts on snowmelt runoff for mountainous transboundary basins in eastern Turkey. Int. J. Climatol. 2014. [Google Scholar] [CrossRef]
  4. Nogués-Bravo, D.; Araújo, M.B.; Errea, M.P.; Martínez-Rica, J.P. Exposure of global mountain systems to climate warming during the 21st Century. Glob. Environ. Chang. 2007, 17, 420–428. [Google Scholar] [CrossRef]
  5. Stewart, I.T. Changes in snowpack and snowmelt runoff for key mountain regions. Hydrol. Process. 2009, 23, 78–94. [Google Scholar] [CrossRef]
  6. Stewart, I.T.; Cayan, D.R.; Dettinger, M.D. Changes toward earlier streamflow timing across western North America. J. Clim. 2005, 18, 1136–1155. [Google Scholar] [CrossRef]
  7. Smerdon, B.D.; Allen, D.M.; Grasby, S.E.; Berg, M.A. An approach for predicting groundwater recharge in mountainous watersheds. J. Hydrol. 2009, 365, 156–172. [Google Scholar] [CrossRef]
  8. Berghuijs, W.R.; Woods, R.A.; Hrachowitz, M. A precipitation shift from snow towards rain leads to a decrease in streamflow. Nat. Clim. Chang. 2014, 4, 583–586. [Google Scholar] [CrossRef] [Green Version]
  9. Meixner, T.; Manning, A.H.; Stonestrom, D.A.; Allen, D.M.; Ajami, H.; Blasch, K.W.; Brookfield, A.E.; Castro, C.L.; Clark, J.F.; Gochis, D.J.; et al. Implications of projected climate change for groundwater recharge in the western United States. J. Hydrol. 2016, 534, 124–138. [Google Scholar] [CrossRef] [Green Version]
  10. Barnett, T.P.; Adam, J.C.; Lettenmaier, D.P. Potential impacts of a warming climate on water availability in snow-dominated regions. Nature 2005, 438, 303–309. [Google Scholar] [CrossRef] [PubMed]
  11. Wada, Y.; Bierkens, M.F.P. Sustainability of global water use: Past reconstruction and future projections. Environ. Res. Lett. 2014, 9, 104003. [Google Scholar] [CrossRef]
  12. Gosling, S.N.; Arnell, N.W. A global assessment of the impact of climate change on water scarcity. Clim. Chang. 2016, 134, 371–385. [Google Scholar] [CrossRef]
  13. Nolin, A.W. Perspectives on Climate Change, Mountain Hydrology, and Water Resources in the Oregon Cascades, USA. Mt. Res. Dev. 2012, 32, S35–S46. [Google Scholar] [CrossRef]
  14. Jaeger, W.K.; Plantinga, A.J.; Chang, H.; Dello, K.; Grant, G.; Hulse, D.; McDonnell, J.J.; Lancaster, S.; Moradkhani, H.; Morzillo, A.T.; et al. Toward a formal definition of water scarcity in natural-human systems. Water Resour. Res. 2013, 49, 4506–4517. [Google Scholar] [CrossRef] [Green Version]
  15. Bales, R.C.; Molotch, N.P.; Painter, T.H.; Dettinger, M.D.; Rice, R.; Dozier, J. Mountain hydrology of the western United States. Water Resour. Res. 2006, 42, W08432. [Google Scholar] [CrossRef]
  16. Yu, J.; Zhang, G.; Yao, T.; Xie, H.; Zhang, H.; Ke, C.; Yao, R. Developing daily cloud-free snow composite products from MODIS Terra–Aqua and IMS for the Tibetan plateau. IEEE Trans. Geosci. Remote Sens. 2016, 54, 2171–2180. [Google Scholar] [CrossRef]
  17. AghaKouchak, A.; Farahmand, A.; Melton, F.S.; Teixeira, J.; Anderson, M.C.; Wardlow, B.D.; Hain, C.R. Remote sensing of drought: Progress, challenges and opportunities. Rev. Geophys. 2015, 53, 452–480. [Google Scholar] [CrossRef] [Green Version]
  18. Wang, J.; Li, H.; Hao, X.; Huang, X.; Hou, J.; Che, T.; Dai, L.; Liang, T.; Huang, C.; Li, H. Remote sensing for snow hydrology in China: challenges and perspectives. J. Appl. Remote Sens. 2014, 8, 84687. [Google Scholar] [CrossRef] [Green Version]
  19. Nolin, A.W.; Sproles, E.A.; Crumley, R.L.; Wilson, A.; Mar, E.; van de Kerk, M.; Prugh, L. Cloud-based computing and applications of new snow metrics for societal benefit. In Proceedings of the American Geophysical Fall Meeting; American Geophysical Union: New Orleans, LA, USA, 2017. [Google Scholar]
  20. Xu, X.; Li, J.; Tolson, B.A. Progress in integrating remote sensing data and hydrologic modeling. Prog. Phys. Geogr. 2014, 38, 464–498. [Google Scholar] [CrossRef]
  21. Sproles, E.A.; Kerr, T.; Nelson, C.O.; Aspe, D.L. Developing a Snowmelt Forecast Model in the Absence of Field Data. Water Resour. Manag. 2016, 30. [Google Scholar] [CrossRef]
  22. Huang, X.; Deng, J.; Wang, W.; Feng, Q.; Liang, T. Impact of climate and elevation on snow cover using integrated remote sensing snow products in Tibetan Plateau. Remote Sens. Environ. 2017, 190, 274–288. [Google Scholar] [CrossRef]
  23. Ma, Y.; Wu, H.; Wang, L.; Huang, B.; Ranjan, R.; Zomaya, A.; Jie, W. Remote sensing big data computing: Challenges and opportunities. Futur. Gener. Comput. Syst. 2015, 51, 47–60. [Google Scholar] [CrossRef] [Green Version]
  24. Gorelick, N.; Hancher, M.; Dixon, M.; Ilyushchenko, S.; Thau, D.; Moore, R. Google Earth Engine: Planetary-scale geospatial analysis for everyone. Remote Sens. Environ. 2017, 202, 18–27. [Google Scholar] [CrossRef]
  25. Raven, P.H. Science, Sustainability, and the Human Prospect. Science 2002, 297, 954–958. [Google Scholar] [CrossRef] [PubMed]
  26. Beier, P.; Hansen, L.J.; Helbrecht, L.; Behar, D. A How-to Guide for Coproduction of Actionable Science. Conserv. Lett. 2016. [Google Scholar] [CrossRef]
  27. Yang, C.; Goodchild, M.; Huang, Q.; Nebert, D.; Raskin, R.; Xu, Y.; Bambacus, M.; Fay, D. Spatial cloud computing: How can the geospatial sciences use and help shape cloud computing? Int. J. Digit. Earth 2011, 4, 305–329. [Google Scholar] [CrossRef]
  28. Granell, C.; Havlik, D.; Schade, S.; Sabeur, Z.; Delaney, C.; Pielorz, J.; Usländer, T.; Mazzetti, P.; Schleidt, K.; Kobernus, M. Future Internet technologies for environmental applications. Environ. Model. Softw. 2016, 78, 1–15. [Google Scholar] [CrossRef] [Green Version]
  29. Nativi, S.; Mazzetti, P.; Santoro, M.; Papeschi, F.; Craglia, M.; Ochiai, O. Big Data challenges in building the Global Earth Observation System of Systems. Environ. Model. Softw. 2015, 68, 1–26. [Google Scholar] [CrossRef]
  30. Foster, I. Globus Online: Accelerating and democratizing science through cloud-based services. IEEE Internet Comput. 2011, 15, 70–73. [Google Scholar] [CrossRef]
  31. Sultan, N. Cloud computing: A democratizing force? Int. J. Inf. Manag. 2013, 33, 810–815. [Google Scholar] [CrossRef]
  32. Junta de Vigilancia del Rio Elqui y sus Afluentes. Estimated Inflows in La Laguna Reservoir; Junta de Vigilancia del Rio Elqui y sus Afluentes: La Serena, Chile, 2016. [Google Scholar]
  33. United States Geological Survey US Geological Survey National Water Information System. Available online: http://waterdata.usgs.gov/nwis/ (accessed on 10 January 2017).
  34. Sanmiguel-Vallelado, A.; Morán-Tejeda, E.; Alonso-González, E.; López-Moreno, J.I. Effect of snow on mountain river regimes: an example from the Pyrenees. Front. Earth Sci. 2017, 11, 515–530. [Google Scholar] [CrossRef] [Green Version]
  35. Sawicz, K.; Wagener, T.; Sivapalan, M.; Troch, P.A.; Carrillo, G. Catchment classification: empirical analysis of hydrologic similarity based on catchment function in the eastern USA. Hydrol. Earth Syst. Sci. 2011, 15, 2895–2911. [Google Scholar] [CrossRef] [Green Version]
  36. Hall, D.K.; Riggs, G.A. MODIS/Terra Snow Cover Daily L3 Global 500m Grid, Version 6; NASA National Snow and Ice Data Center Distributed Archive Center: Boulder, CO, USA, 2016; Available online: https://nsidc.org/data/mod10a1 (accessed on 22 May 2018). [CrossRef]
  37. Beven, K.; Binley, A. The Future of Distributed Models: Model Calibration and Uncertainty Prediction. Hydrol. Process. 1992, 6, 279–298. [Google Scholar] [CrossRef]
  38. Nash, J.E.; Sutcliffe, J.V. River flow forecasting through conceptual models part I: a discussion of principles. J. Hydrol. 1970, 10, 282–290. [Google Scholar] [CrossRef]
  39. Dingman, S.L. Physical Hydrology; Prentice Hall: Upper Saddle River, NJ, USA, 2002; ISBN 0130996955 9780130996954. [Google Scholar]
  40. Kirchner, J.W. Getting the right answers for the right reasons: Linking measurements, analyses, and models to advance the science of hydrology. Water Resour. Res. 2006, 42. [Google Scholar] [CrossRef] [Green Version]
  41. MathWorks. The MathWorks MATLAB and Statistics Toolbox Release 2013a; MathWorks: Natick, MA, USA, 2013. [Google Scholar]
  42. Sproles, E. SnowCloudHydro; Github Repository: Corvallis, OR, USA, 2017. Available online: https://github.com/MountainHydroClimate/SnowCloudHydro (accessed on 22 May 2018). [CrossRef]
  43. NASA—Applied Sciences Program Water Resources Program|Applied Sciences Website. Available online: https://appliedsciences.nasa.gov/programs/water-resources-program (accessed on 22 May 2018).
Figure 1. Maps of monthly snow cover frequency in the Chilean Andes (30° S, ranging in elevation from 3135 to 6200 m) for October ((a); spring) and December ((b); early summer) showing the extreme changes in seasonal snow.
Remotesensing 10 01276 g001
Figure 2. A conceptual flowchart of the SnowCloud framework. (ac) SnowCloudMetrics calculating Snow Cover Frequency (SCF) for a watershed using Moderate Resolution Imaging Spectroradiometer (MODIS) satellite data and is (d,e) transitioned into a streamflow forecast using SnowCloudHydro. (a) Data arrays and tiling of satellite images are used to (b) calculate SCF for each month. (c) These monthly data are then spatially subset and averaged by study watershed, and (d) converted into a time series for the MODIS record (three years of data shown in this figure). (e) The SCF data are then implemented into a streamflow forecast model for the watershed with a one-month lead-time.
Remotesensing 10 01276 g002
Figure 3. (ac) Maps of monthly SCF calculated in SnowCloudMetrics for the three watersheds. (df) Topographic, climatic, and SCF metrics for the three watersheds. (gi) The SnowCloudHydro results for the three watersheds. NSE refers to the Nash-Sutcliffe Efficiency coefficient, a standard metric applied to assess the predictive skill of hydrologic models [38,39].
Remotesensing 10 01276 g003
Figure 4. The questions and responses (aj) from the qualitative assessments completed by participants. Each question provided to the participants is above its respective sub-figure. In all sub-figures the number of responses (n) are represented in purple for English-speaking participants and orange for Spanish-speaking participants.
Remotesensing 10 01276 g004
Table 1. The topographic and climatic characteristics of the three study watersheds. Mean temperature (T) and Snow Cover Frequency (SCF) corresponds to the four primary winter months (May–September in the southern hemisphere, and November–March in the northern hemisphere).
La LagunaJohn DayAragón
Latitude30°S44°N42°N
Mean T (°C)−4.9−1.39.5
Min Elevation (m)3135933794
Max Elevation (m)620027332858
Average Precipitation (mm year−1)250600800
Mean SCF0.330.270.27
Runoff Ratio (mm/mm)0.410.260.77
Area (km2)5681036242
Table 2. Values for the different model parameters (a–d) from the GLUE and non-linear least squares methods from the three study watersheds. The R2 values associated with method are also provided.
WatershedParameterGLUENon-Linear Least Squares
La Lagunaa5.464.21
b3.982.96
c0.750.74
d0.090.05
NSE0.830.87
R20.830.88
John Day Rivera21.9422.18
b1.741.99
c0.130.11
d0.250.40
NSE0.500.52
R20.500.52
Río Aragóna38.42111.26
b3.645.45
c0.120.13
d0.590.61
NSE0.180.21
R20.190.22

