Article

Zero Deforestation Agreement Assessment at Farm Level in Colombia Using ALOS PALSAR

1
Biology Program, Faculty of Natural Sciences and Mathematics, Universidad del Rosario, Carrera 26 # 63B-48, Bogotá 111221, Colombia
2
The Nature Conservancy, Northern Andes and Central Southern America Program, Calle 67 # 7-94, Bogotá 110231, Colombia
3
Instituto de Hidrología, Meteorología, y Estudios Ambientales-IDEAM, Sistema de Monitoreo de Bosques y Carbono, Calle 25 D No. 96 B-70, Bogotá 110911, Colombia
*
Author to whom correspondence should be addressed.
Submission received: 28 July 2018 / Revised: 4 September 2018 / Accepted: 11 September 2018 / Published: 13 September 2018

Abstract

:
Due to the fast deforestation rates in the tropics, multiple international efforts have been launched to reduce deforestation and develop consistent methodologies to assess forest extension and change. Since 2010 Colombia implemented the Mainstream Sustainable Cattle Ranching project with the participation of small farmers in a payment for environmental services (PES) scheme where zero deforestation agreements are signed. To assess the fulfillment of such agreements at farm level, ALOS-1 and ALOS-2 PALSAR fine beam dual imagery for years 2010 and 2016 was processed with ad-hoc routines to estimate stable forest, deforestation, and stable nonforest extension for 2615 participant farms in five heterogeneous regions of Colombia. Landsat VNIR imagery was integrated in the processing chain to reduce classification uncertainties due to radar limitations. Farms associated with Meta Foothills regions showed zero deforestation during the period analyzed (2010–2016), while other regions showed low deforestation rates with the exception of the Cesar River Valley (75 ha). Results, suggests that topography and dry weather conditions have an effect on radar-based mapping accuracy, i.e., deforestation and forest classes showed lower user accuracy values on mountainous and dry regions revealing overestimations in these environments. Nevertheless, overall ALOS Phased Array L-band SAR (PALSAR) data provided overall accurate, relevant, and consistent information for forest change analysis for local zero deforestation agreements assessment. Improvements to preprocessing routines and integration of high dense radar time series should be further investigated to reduce classification errors from complex topography conditions.

Graphical Abstract

1. Introduction

About 44% of global forests are concentrated in the tropics (1,770,156 thousand ha in 2015 [1]), and is also where the vast majority of forest loss occurs, with reported rates of loss of 6.4 M ha year−1 between 2010 and 2015 [1]. In Colombia, approximately one third of forest cover has been cleared since the year 1700, as a result of multiple, heterogeneous historical processes [2]. At the beginning of the 20th century the agricultural footprint rapidly increased due to population growth; cattle ranching played an especially important role in landscape change dynamics within the country [2]. Currently, ranching represents one of the key economic subsectors in Colombia, contributing to approximately 3.5% of the overall Gross Domestic Product (GDP) and 27% of the agricultural and livestock GDP [3]. Cattle ranching exploited more than 38 million hectares over the last 50 years, holding approximately 23.5 million heads, supporting 7% and 28% of national and rural employment, respectively.
Information related to forest trends are critical to different actors involved in the decision-making of policies and investments promoting the conservation of forests and their ecosystem services. Globally, several efforts have been put in place to develop consistent and robust methodologies to assess forest extension and change [4,5,6,7,8,9,10]. As a response to the rapid advance of global forest loss and degradation, the UN Framework Convention on Climate Change (UNFCCC) launched the Reducing Emissions from Deforestation and Forest Degradation program (REDD+). The general aim of REDD+ is to contribute to the mitigation of climate change by reducing greenhouse gas (GHG) emissions by decreasing and reversing forest loss and degradation, and by increasing the removal of GHGs through conservation and the expansion of forests [11]. In 2008, the national government of Colombia in collaboration with UN launched the UN-REDD program in Colombia; since then, multiple collaboration initiatives, promoted especially by NGOs and multilateral organizations, implemented environmental programs based on the REDD+ approach that presented the Readiness Preparation Proposal for Colombia in 2013.
Dominating the forestry-based climate mitigation programs in Latin America and the Caribbean [12], REDD+ programs face multiple challenges for their operational implementation and the achievement of multiple goals involving climate change, biodiversity conservation, and sustainable development [13]. For effective implementation and assessment of such programs it is often necessary to obtain systematic Earth Observation-based forest data, together with specific methods and protocols integrating ground truth, geospatial information, and capacity building to ensure the project’s monitoring, reporting, and verification (MRV) [14,15]. Consequently, several international partnerships, like the Global Forest Information Initiative (GFOI), have been established to provide national forest monitoring systems with guidelines to exploit Earth observation data for REDD+, in order to foster robust, reliable, and achievable forest monitoring and assessment [16].
The Kyoto & Carbon (K&C) initiative, an international collaborative project led by the JAXA Earth Observation Research Center (EORC), was designed to contribute data and information to the UNFCCC Kyoto Protocol and international actors for the development of a Terrestrial Carbon Observing system, together with giving continuation to the previous initiatives, such as the Global Rain Forest Mapping (GRFM) and the Global Boreal Observing Satellite (GBFM) [17,18]. The K&C research is based on the Advanced Land Observing Satellites (ALOS). ALOS carries on board the active sensor Phased Array L-band SAR (PALSAR). ALOS PALSAR is considered a pathfinder global monitoring mission due the improvement of sensor performance and its systematic data-observation strategy, providing reliable wall-to-wall observations at fine resolution with consistency in spatial and temporal resolutions [18,19]. This ensures land observation acquisition through multiple missions, i.e., ALOS-1 (2006–2011) and ALOS-2 (2014–present). ALOS PALSAR information has been extensively used in forest applications, such as forest mapping [9], deforestation monitoring [20,21], aboveground biomass estimation [22], and mangrove monitoring [23]. In addition to the advantage of cloud-free imagery provided by the SAR sensors, ALOS L-band provides key information related to forest canopy and surface features [24]. With the ability to penetrate vegetation canopy, ALOS PALSAR L-band sensors, compared to other SAR instruments (e.g., C-band based), are more sensitive to trees’ aboveground structural characteristics, providing very suitable Earth Observations data for forest monitoring [4] with a systematic acquisition strategy.
Recent small-scale deforestation patterns found in Amazonian countries [25] have been found to be increasingly related to land cover conversion from small landowners, e.g., Brasil [26]. Current methodological and technical advances in remote sensing [19,20,21] allow the inclusion of robust small-scale deforestation detection in the assessment phase of deforestation monitoring programs. Previous projects exploit ALOS PALSAR data to quantify deforestation patterns at small-scale farm level to detect deforestation events below the hectare [27], or use Landsat data to estimate deforestation with a minimum area detection of 6.25 ha [28] to assess farmers’ ‘no deforestation’ compliance agreements.
In this work we exploit ALOS PALSAR data to assess zero deforestation agreements of the Colombian Mainstream Sustainable Cattle Ranching project (MSCR) in five different regions of Colombia. The MSCR aims are to improve the ecosystem functioning of degraded pastures lands through the implementation of sustainable silvopastoral practices, contributing to national goals to reduce the total cattle ranching land, contribute to climate change mitigation, as well as to generate socioeconomic benefits. The MSCR project integrates small holder cattle ranching farmers in a payment for the environmental services scheme (PES), where farmers have compromised through the signing of a contract to a zero-deforestation agreement inside the farms during the project’s life. Farmers receive materials, technical assistance, and PES associated with the establishment of silvopastoral systems and the restoration/conservation of areas that include forest. During the technical assistance phase project’s staff monitored the fulfillment of the zero-deforestation agreements by field inspection of the farm’s forest areas. The integration of a further assessment based on remote sensing imagery provides the required independent key performance indicator of estimation of deforestation extent at the project level, complementing field deforestation monitoring at the individual farm level. The MSCR project is supported by several international institutions including the Global Environment Facility (GEF), the UK’s Department of Energy and Climate Change (DECC), the World Bank (financial support and supervision), national Colombian agencies like the Center for Research in Sustainable Systems of Agricultural Production (CIPAV), the National Federation of Cattle Ranching, (FEDEGAN), the Action Fund for Environment and Children, and The Nature Conservancy.
Specific research objectives of this work are:
  • To develop an ALOS PALSAR processing workflow to classify forest and generate forest change products at local scales.
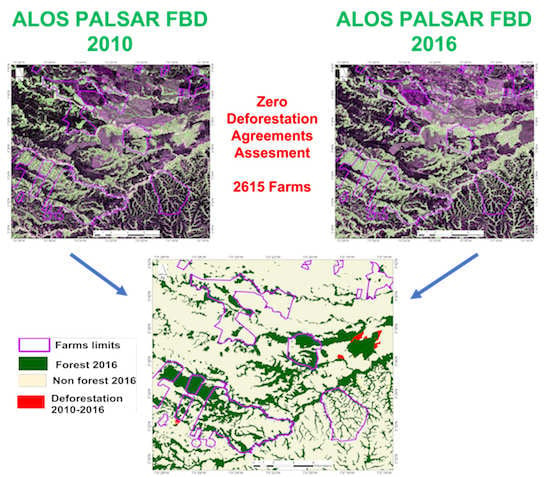
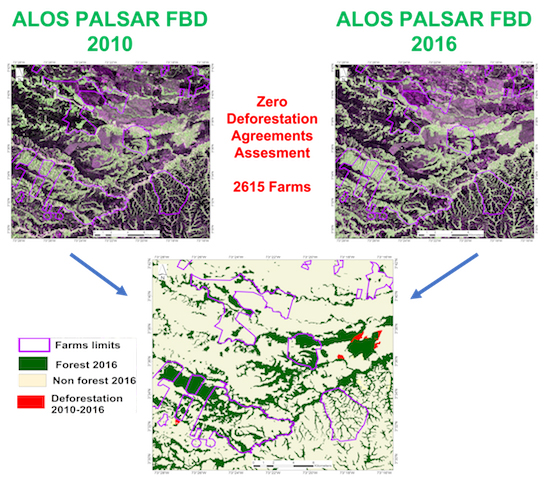
  • To assess zero deforestation agreements implementation in 2615 farms participating to the Colombian Mainstream Sustainable Cattle Ranching project by exploiting ALOS PALSAR forest-change products.

2. Materials and Methods
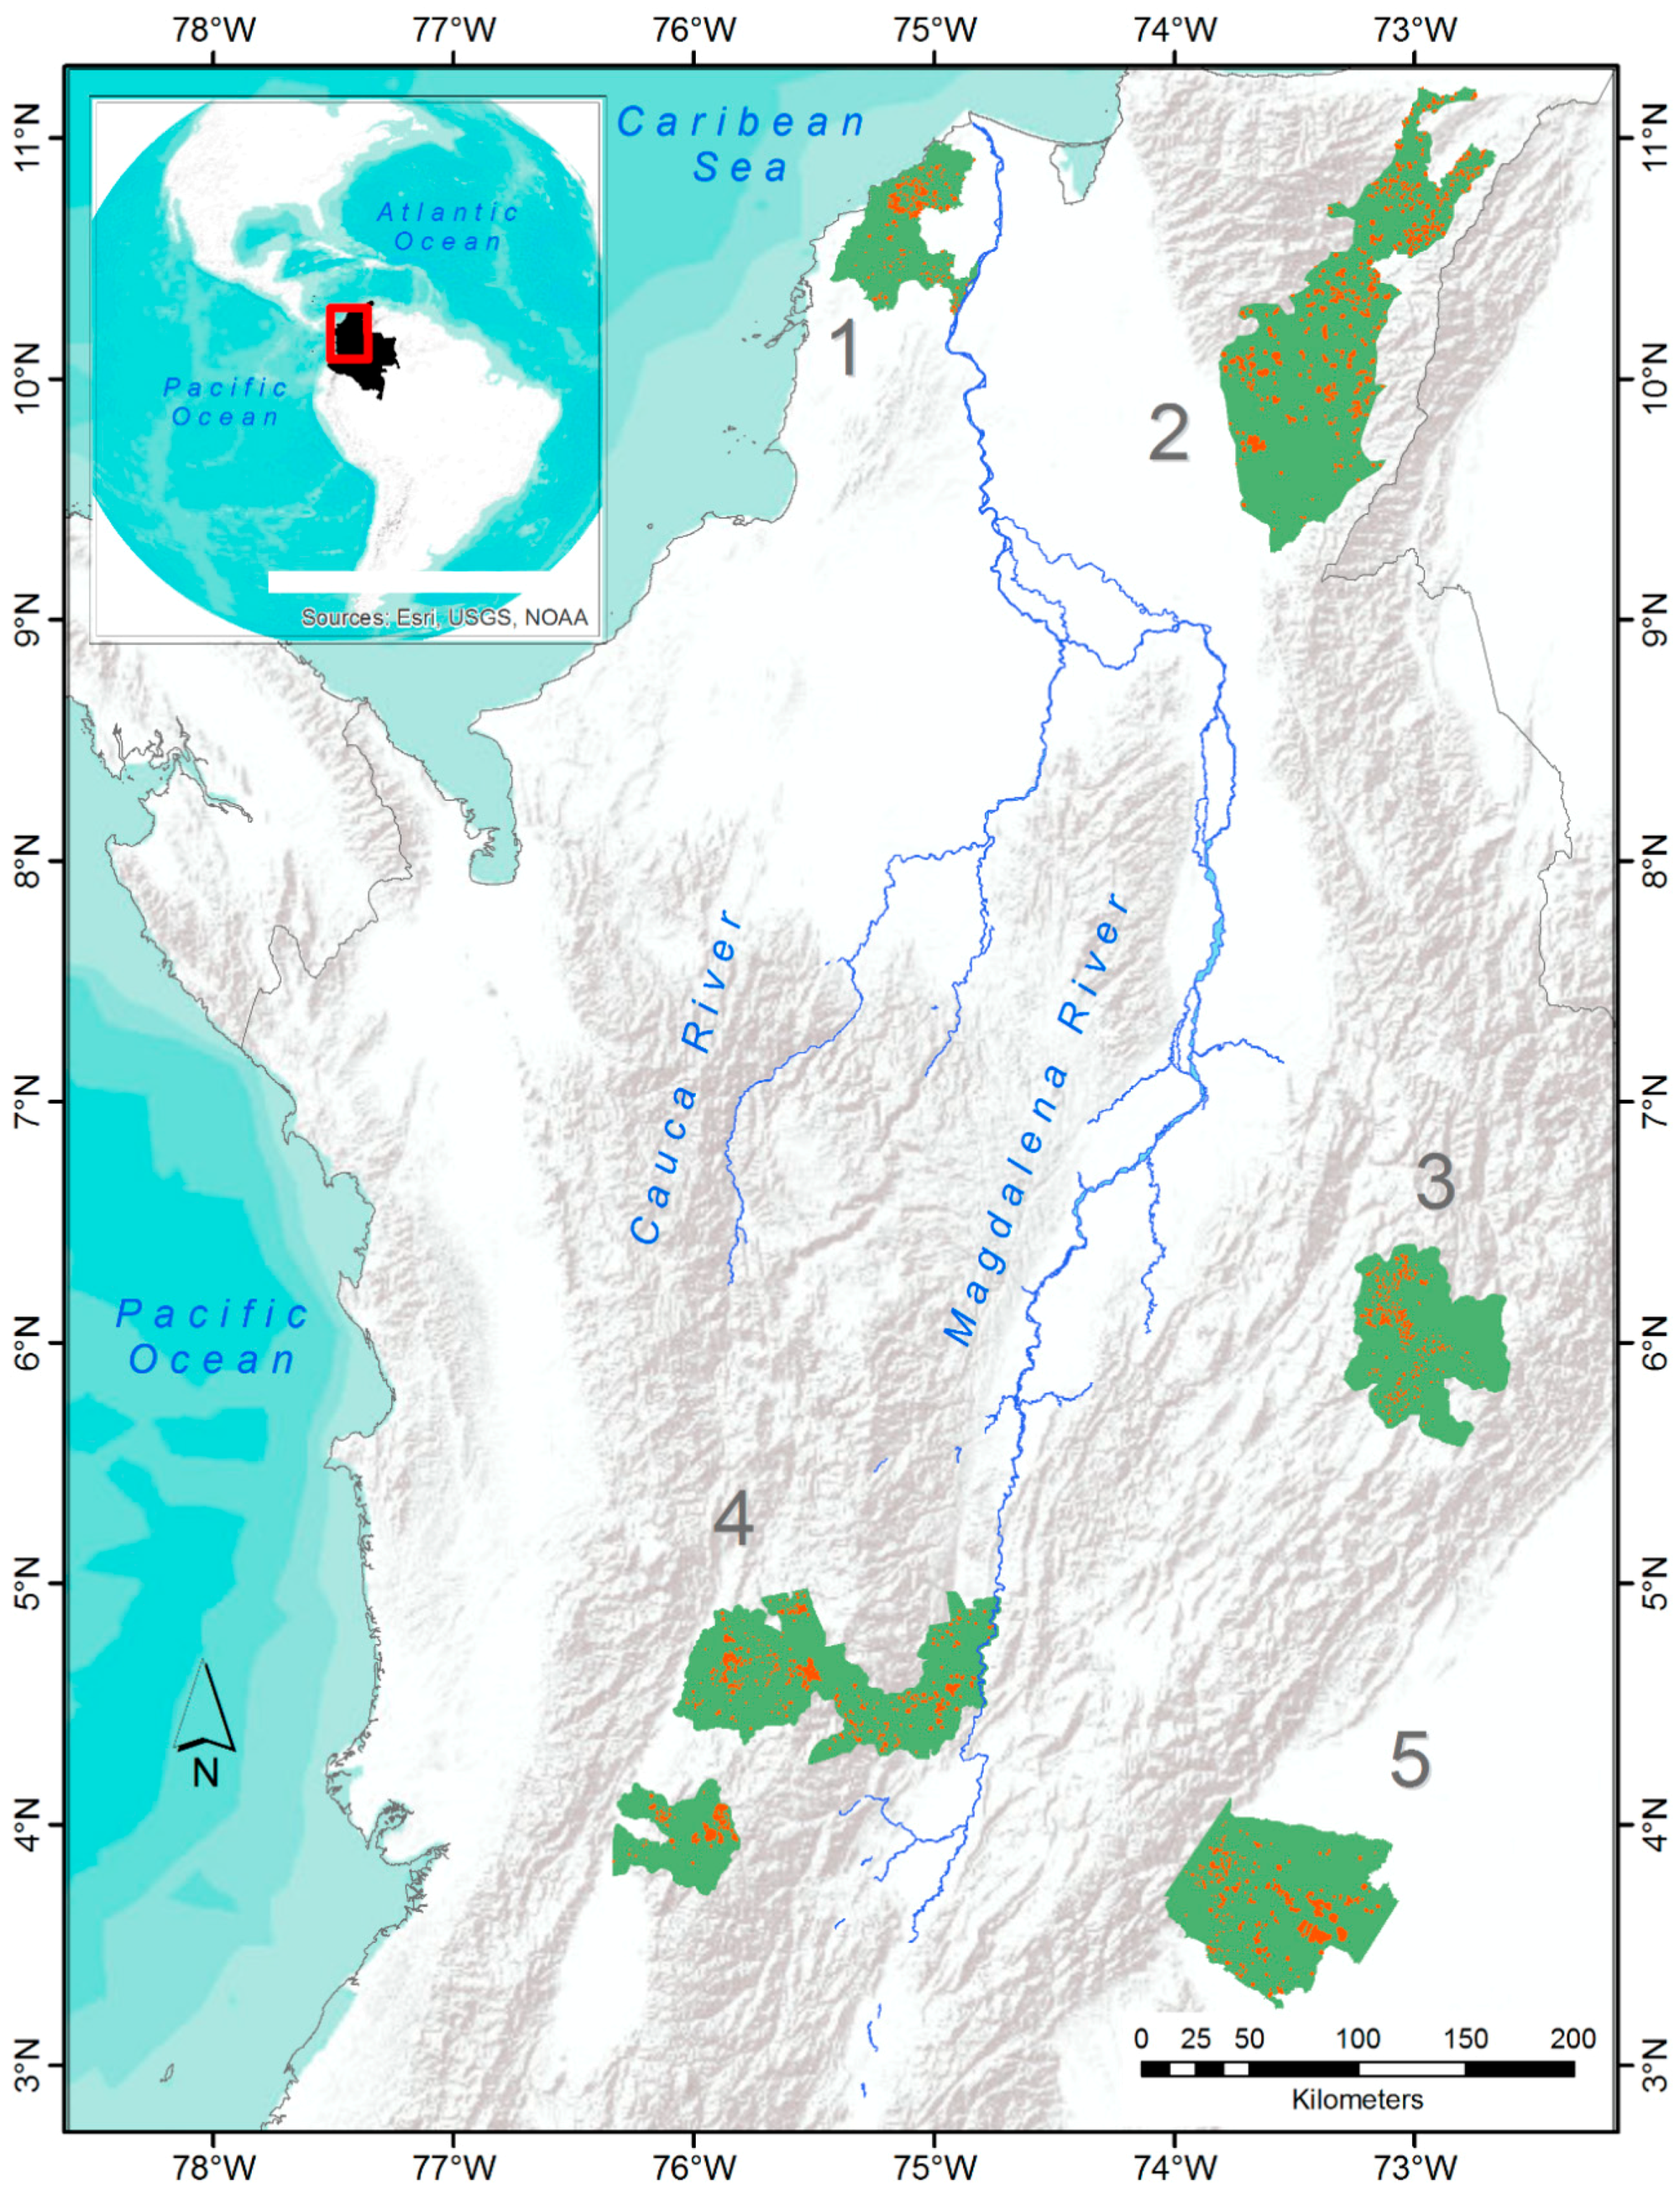
2.1. Study Area

Colombia is located in the northwest of the South American continent, with an area of 1.1 million km2 (the fourth largest country in South America), with coast on both the Caribbean Sea and the Pacific Ocean. Due to its heterogeneous geographic and topographic characteristics the country holds seven different biogeographic regions. With variations in mean annual precipitation (300–10,000 mm) and altitude (0–5765 m) this environmental heterogeneity is expressed in a large variety of ecosystems [29]. The study area includes five different regions that cover 83 municipalities (Figure 1), which were selected for their high levels of biodiversity and their proximity to strategic ecosystems and protected areas. The Cesar River Valley and the Magdalena River regions contain the last remaining fragments of dry tropical forest, considered one of the most endangered Neotropical ecosystems, currently 8% of its original extent remains in Colombia [30]. Other strategic ecosystems are mountain forests, where oak-dominated forests are characterized by a high level of degradation, the threat of habitat loss, and under-representation in protected areas [31] and wetland systems associated with the Magdalena River. The river system concentrates approximately 80% of the population of Colombia and represents a key contribution to the country’s fisheries [32].

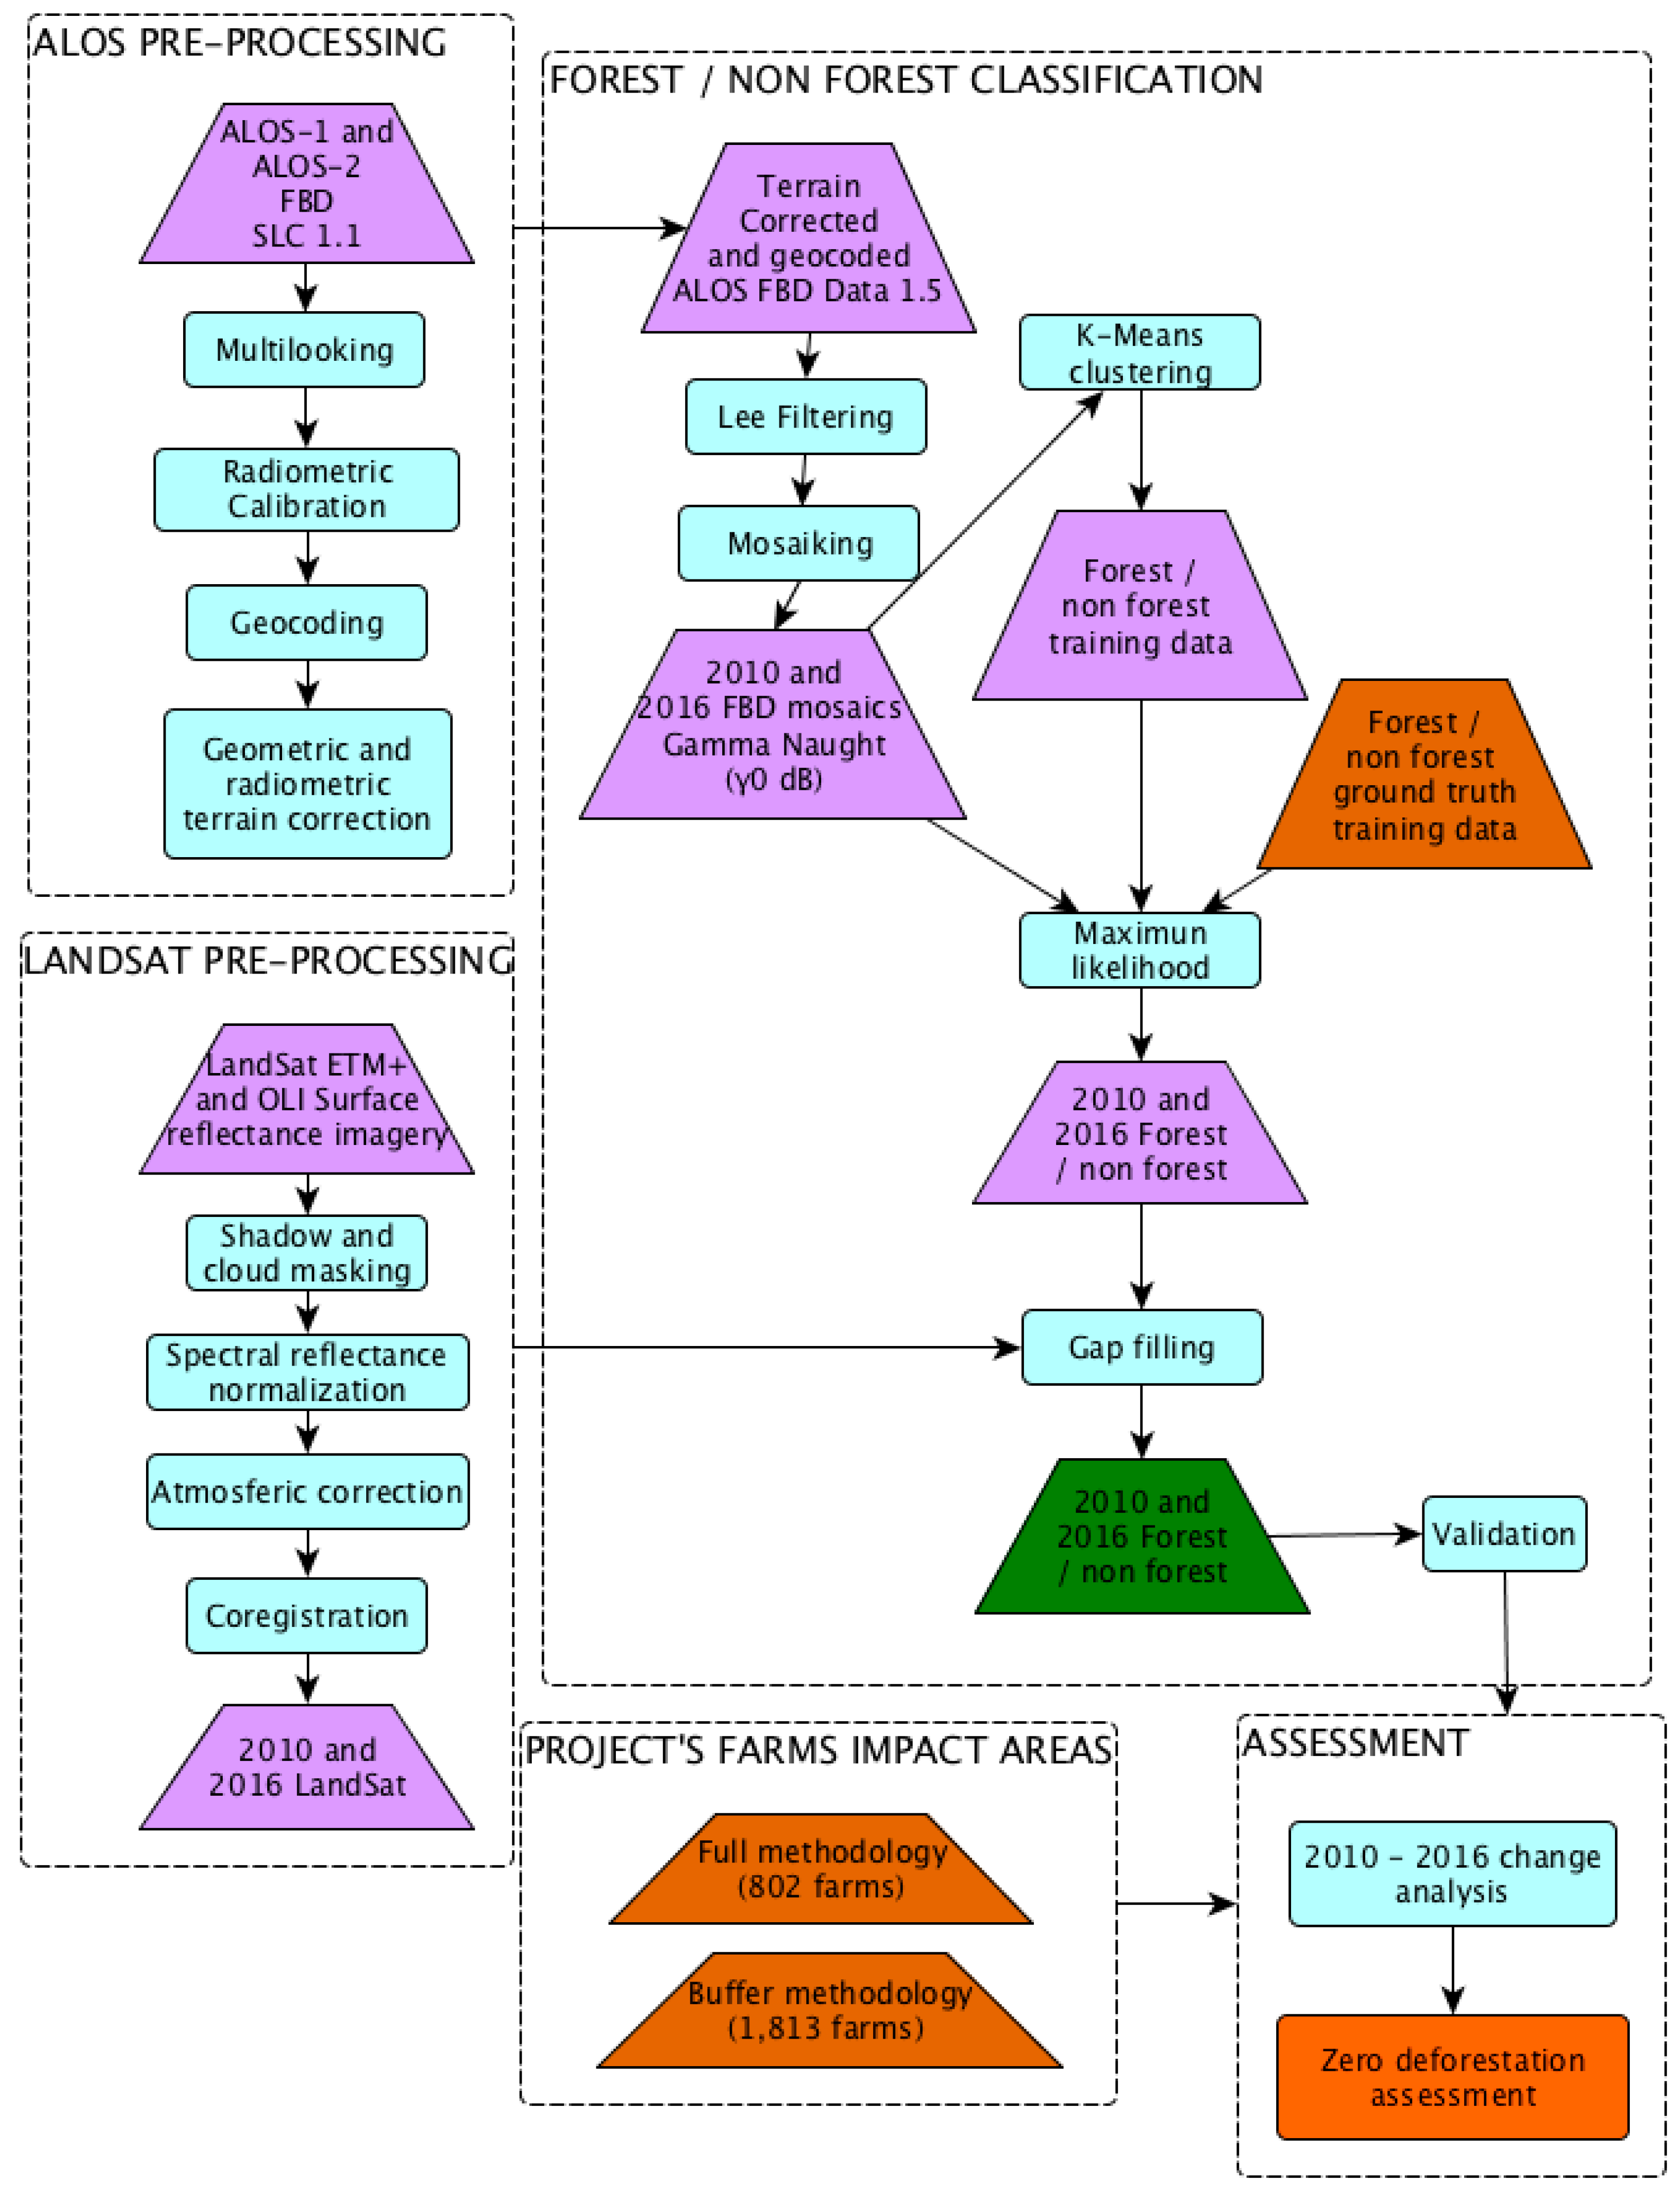
2.2. Data Processing

2.2.1. Project Impact Areas: Farms Delineation

Project impact areas where the zero deforestation agreements were implemented between land owners and the MSCR project (year 2010), correspond to 2615 small and medium-sized farms (Table 1). To determine the farm area to assess agreements in the absence of precise property boundaries, two different protocols for boundaries delimitation were implemented. For 802 farms an accurate boundary delimitation was carried out in situ using GPS technology; boundaries where generated through walks along the farms perimeter and the farm total extent was corroborated with legal documentation and owner feedback. For the remaining 1813 farms, approximate circular boundaries were generated based on a circle center determined using GPS, and on a radius estimated from the farm area reported by legal cadastral documents. Figure 2 shows an example of property boundary generation based on both protocols. Table 1 provides a description of the 2615 farms adhering to the MSCR project for the five regions under study.

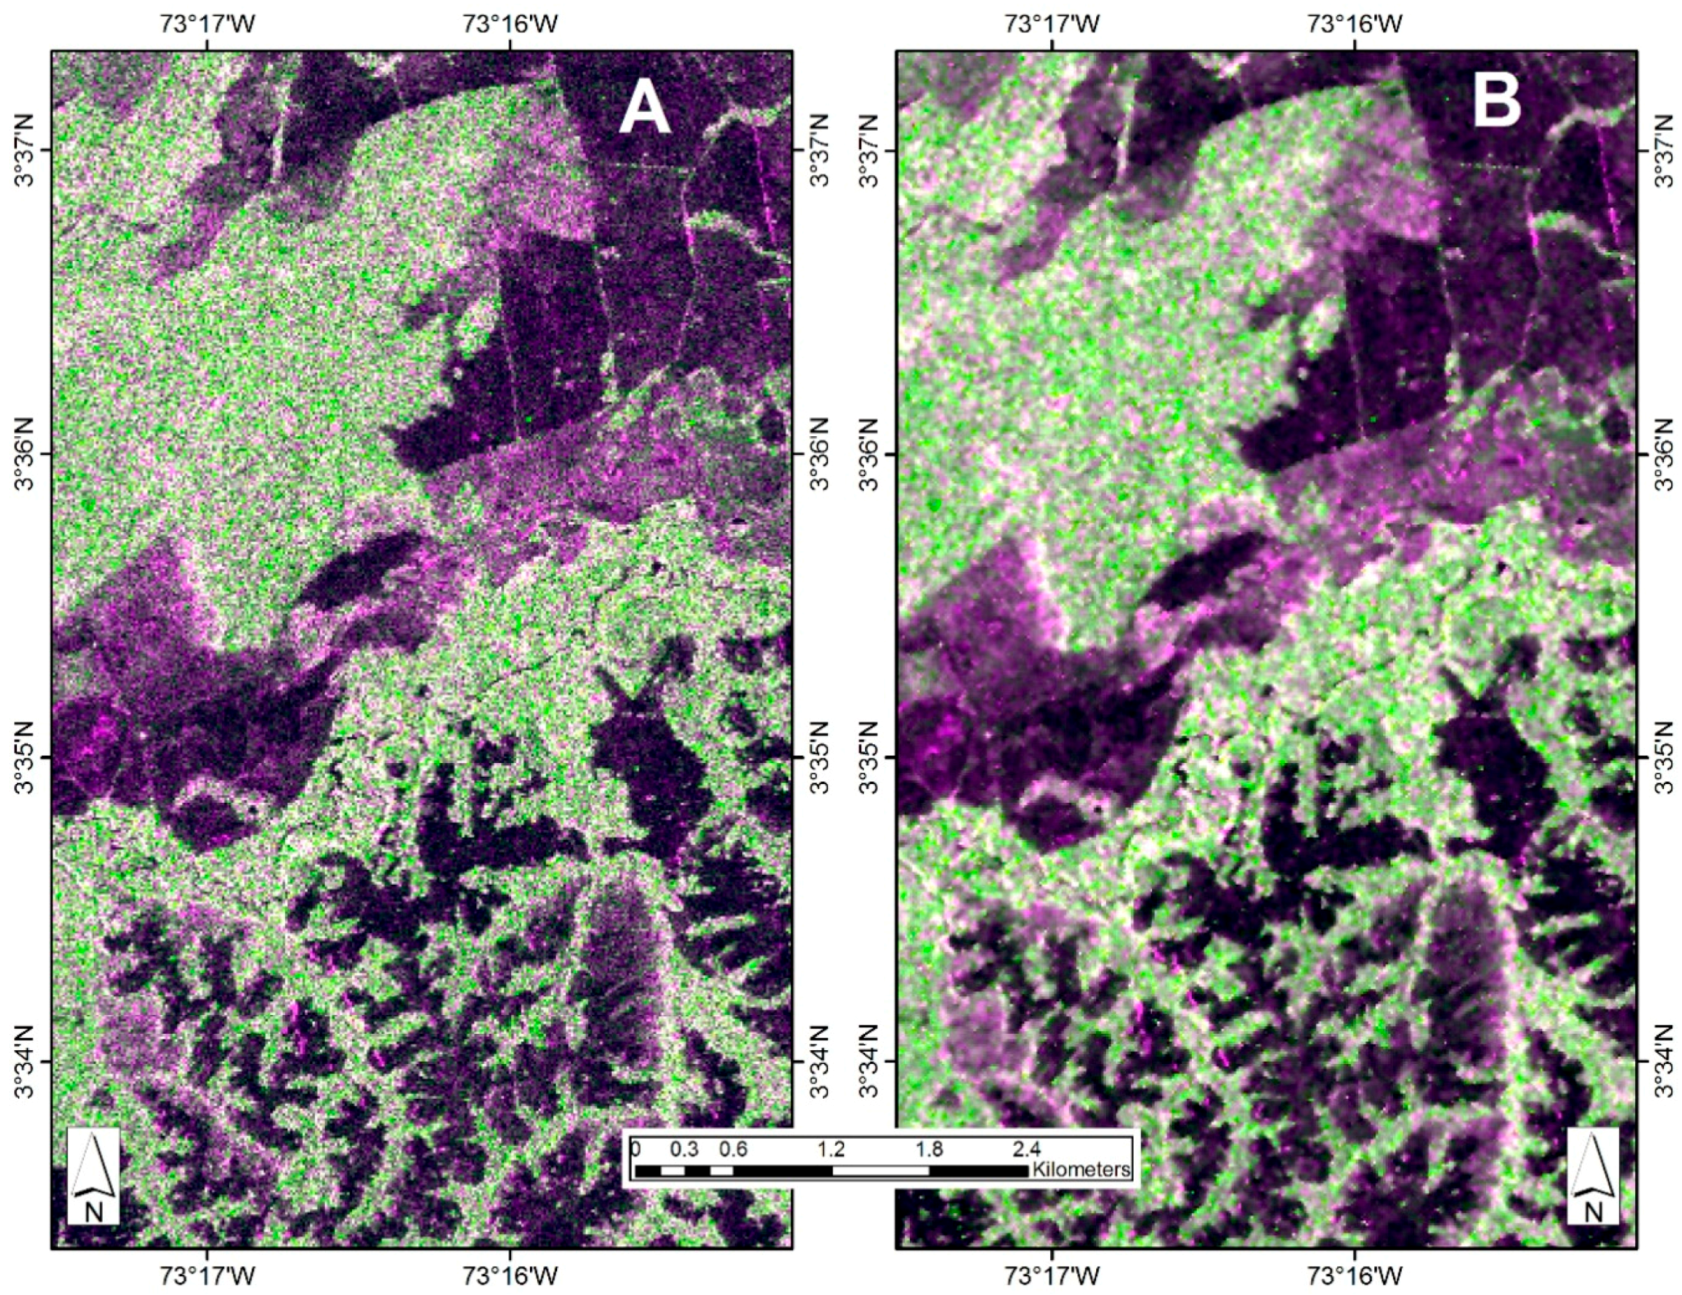
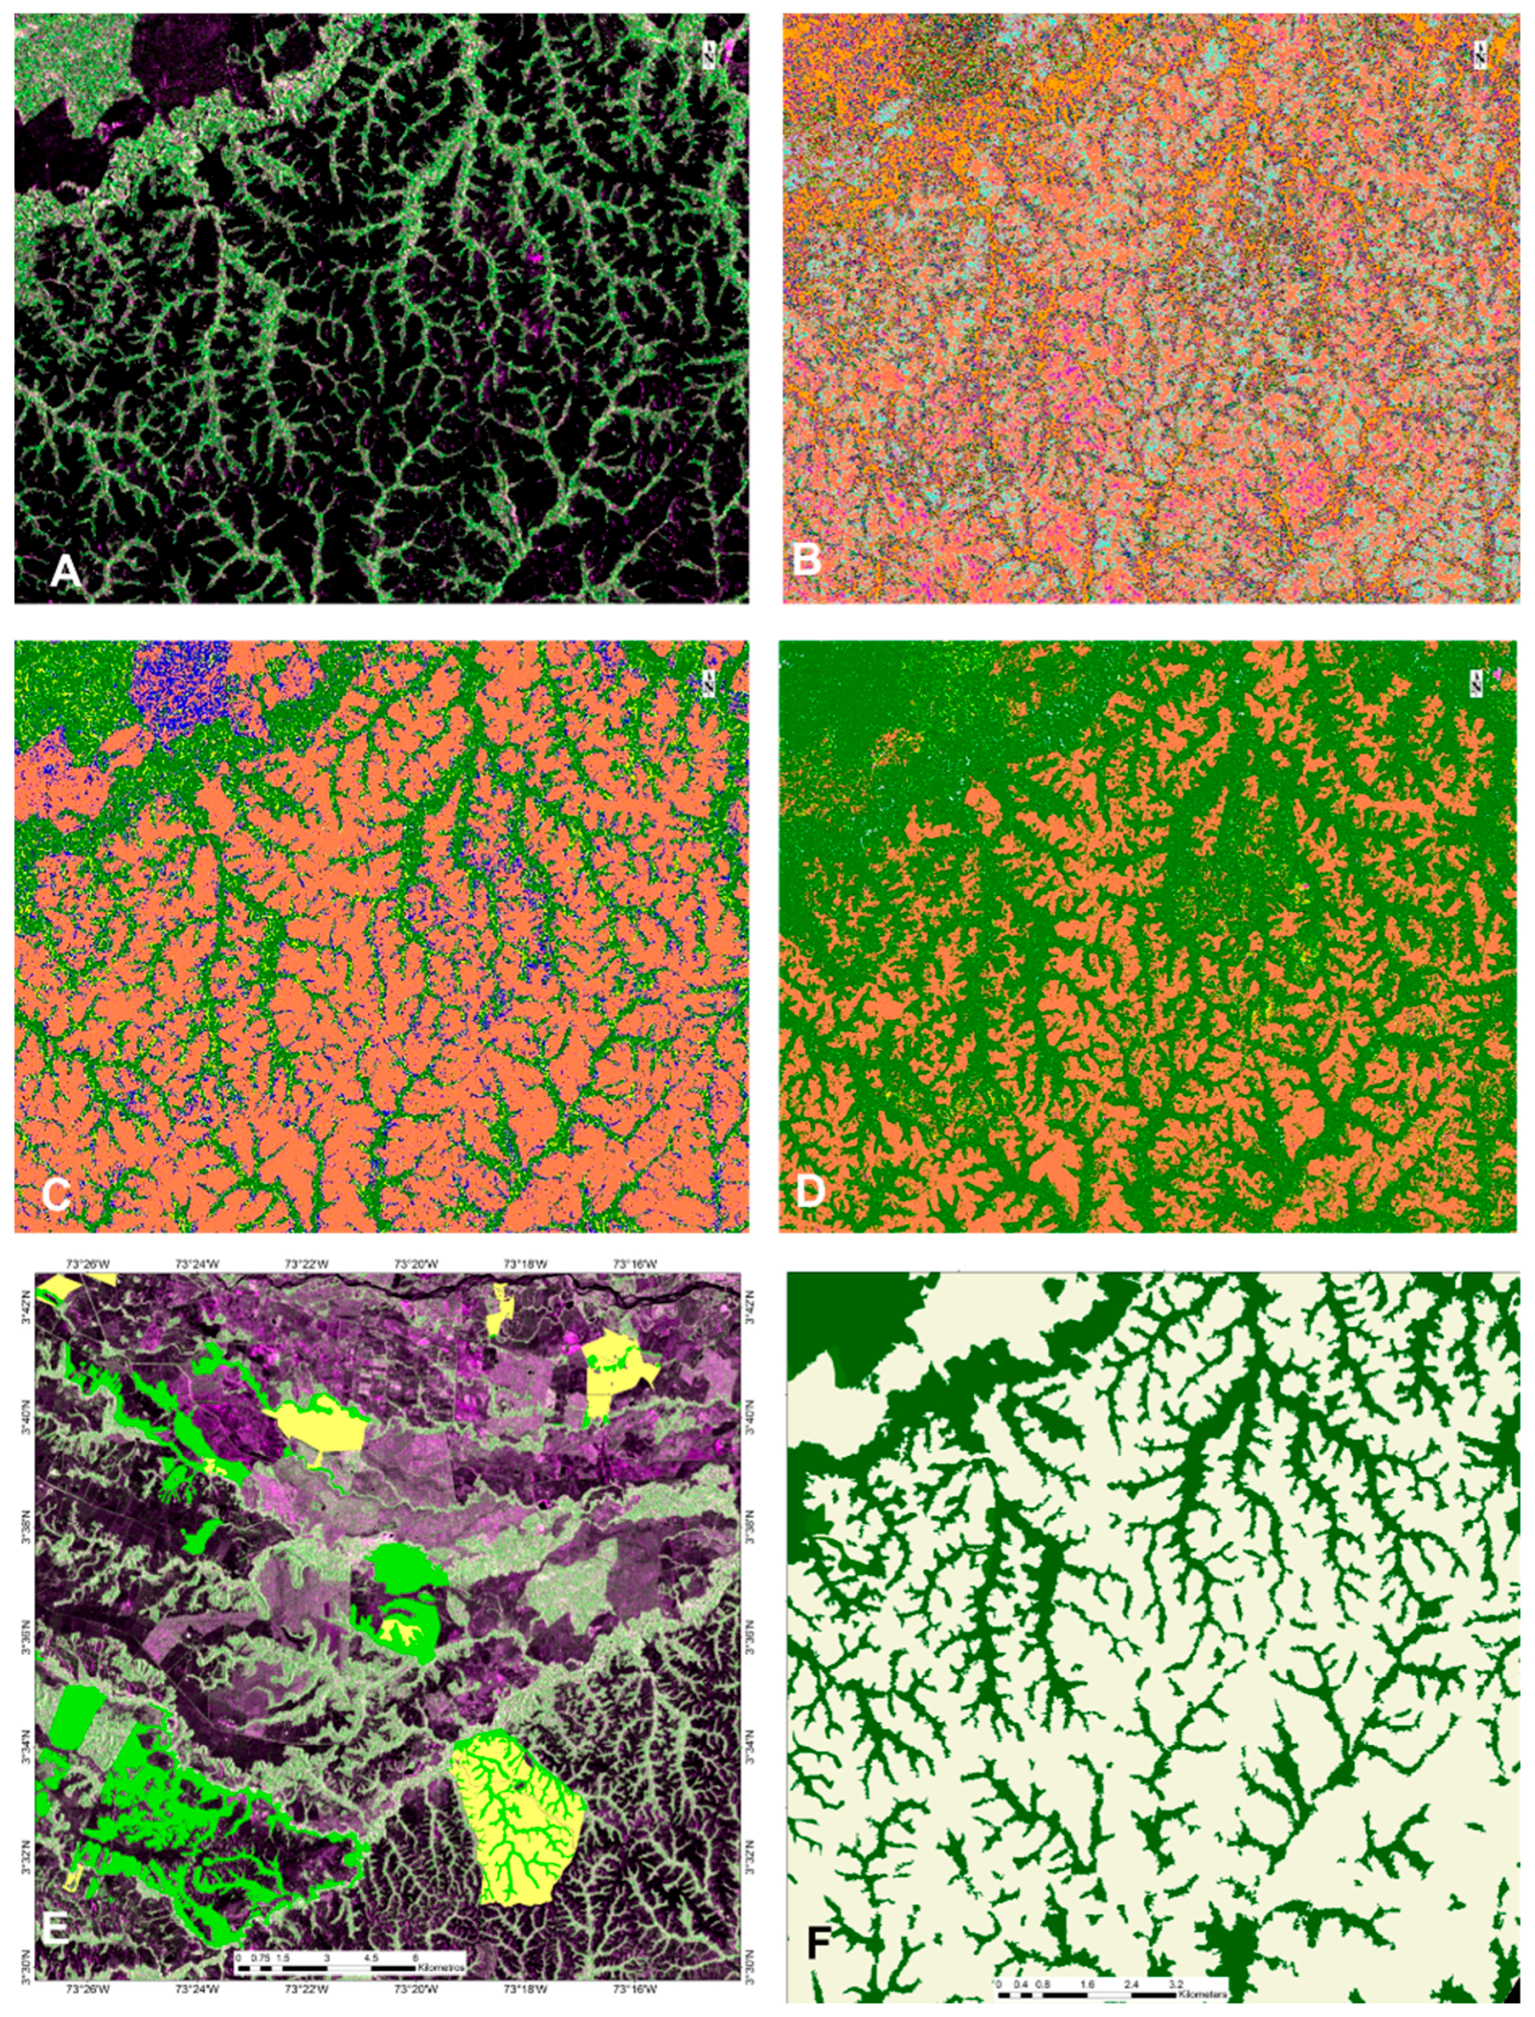
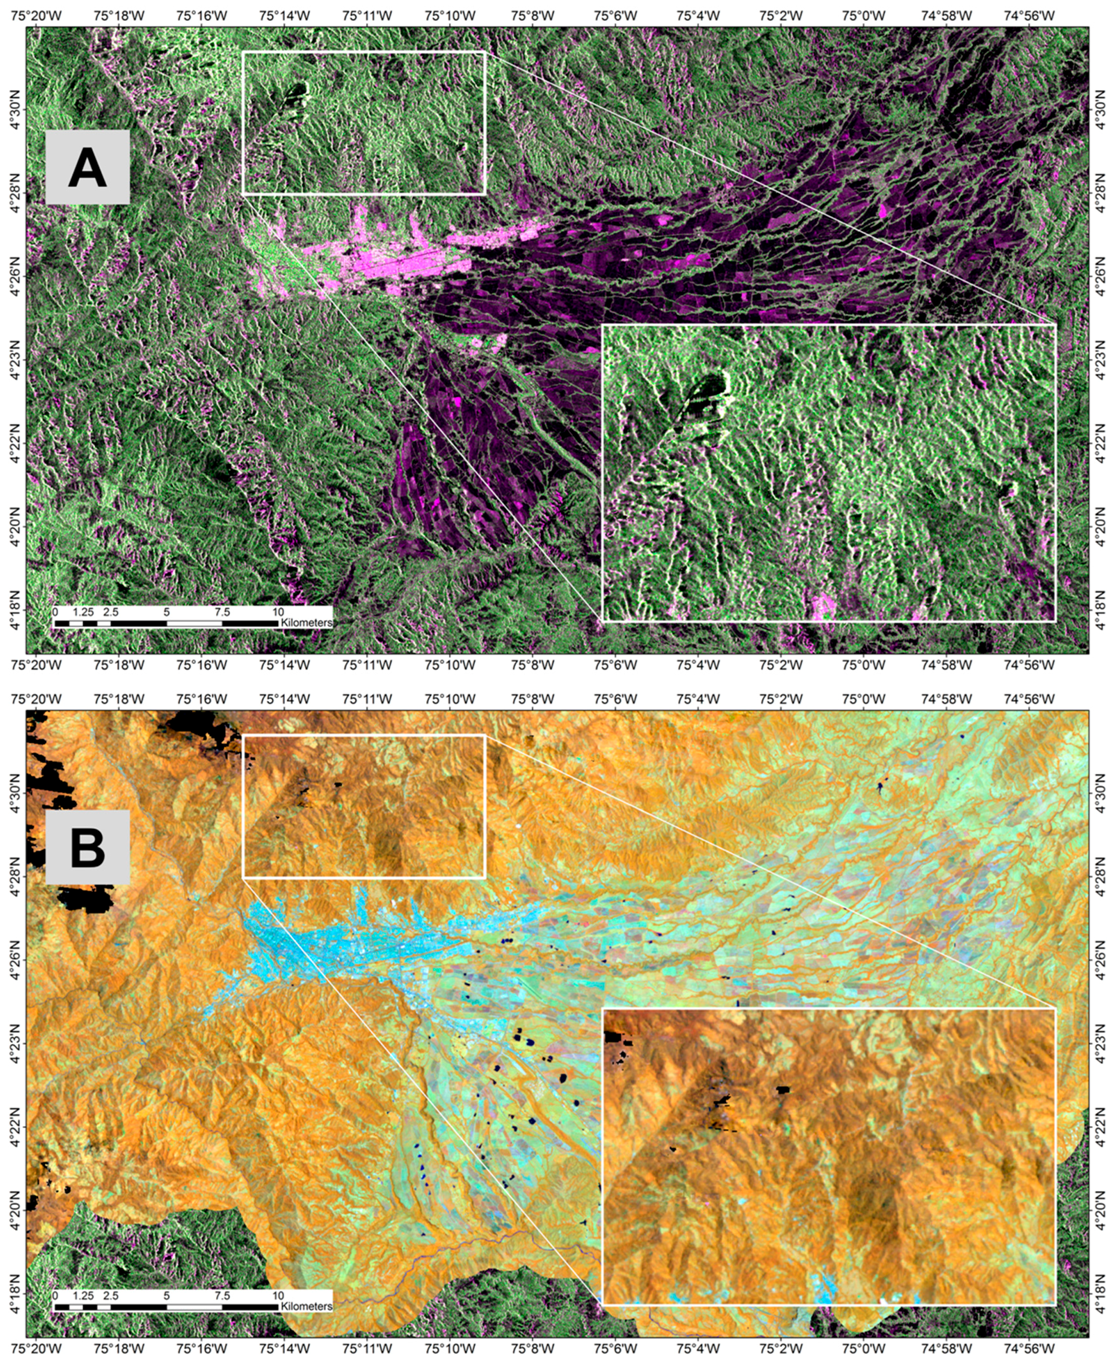
2.2.2. Fine Beam Dual ALOS PALSAR Imagery Preprocessing

Zero deforestation agreement assessments require a change analysis to estimate forest extent at the time of the MSCR agreement (2010) with respect to the target year of assessment (2016). ALOS PALSAR imagery was used to classify forest and nonforest cover, and to estimate deforestation extent at farm level for the five regions under analysis. ALOSPALSAR Fine Beam Dual (FBD) imagery was obtained through the Kyoto & Carbon Initiative as part of the collaborative research between The Nature Conservancy and the Japanese Aerospace Exploration Agency (JAXA). Data was accessed through the ALOS User Interface Gateway. A total of 125 SLC (Level 1.1) ALOS-1 and ALOS-2 FBD images were used, covering years 2010 (ALOS-1) and 2016 (ALOS-2) (Supplementary Materials, Table S1).
Multiple routines were implemented to convert single look complex (SLC) images into geocoded gamma naught (γ0) backscatter intensity images through: multilooking, radiometric, geocoding, and geometric/radiometric correction procedures (Figure 3). Multilooking was performed to SLC imagery complex data to produce multilook intensity imagery, using four range and one azimuth looks as parameters. Radiometric calibration of multilook imagery was applied using different calibration factor for ALOS-1 (−115 dB) and ALOS-2 (−83 dB) [33] for the normalization reference area correction to multilooking gamma naught imagery at a 15 m pixel resolution. Shuttle Radar Topography Terrain Mission (SRTM) 30 m digital elevation model was used for terrain correction and geocoding; additionally, a fine registration is implemented where SAR image is simulated based on the digital elevation model and used to determine the fine registration using a cross correlation analysis. Geocoded, radiometric, and geometric corrected products for ALOS PALSAR imagery products were obtained after preprocessing procedures performed using Gamma software® [34], which provides Synthetic Aperture Radar (SAR) preprocessing routines. Functions and parameters implemented through the software are detailed in Supplementary Materials Figure S1.
All imagery was projected to UTM 18N WGS84. An enhanced lee speckle filter was applied to HH and HV polarizations to reduce speckle (Figure 4). The filter was applied by means of least squares of the signal intensity in a kernel area of 3*3 pixels [35]. Mosaicking was finally performed to generate HH and HV polarization mosaics for both years 2010 and 2016. A detailed description of the preprocessing workflow is provided in Supplementary Materials Figure S1.

2.2.3. Forest Mapping

To estimate the extent of stable forest, stable nonforest, and deforestation (2010–2016) for the five MSCR regions, supervised classification procedures were applied to the FBD ALOS-1 PALSAR-1 (2010) and ALOS-2 PALSAR-2 (2016) geocoded, radiometric, and geometric corrected images. To generate training datasets for the maximum likelihood classifier [36], we followed two different strategies: (i) forest/nonforest GPS-based ground truth data were obtained during the technical assistance field visits of 802 farms, obtaining 1076 forest and 144 nonforest polygons (Figure 5E). (ii) Forest/nonforest regions were derived by a k-means unsupervised classification [37] of gamma naught (γ0) dB backscatter intensity values from HH and HV polarizations of FBD imagery (2010 and 2016). Forty classes were initially considered which were then visually merged to derive forest and nonforest regions (Figure 5B–D). Sample regions from the unsupervised classification were selected randomly and homogeneously distributed with respect of the ground truth data training samples previously acquired. Only forest/nonforest regions with no significant temporal variation based on visual assessment of ALOS PALSAR and Landsat images, and Google Earth® (2010–2016) was selected as training data. Ground truth and unsupervised data were merged to train the maximum likelihood classifier [36], in order to produce forest/nonforest maps for years 2010 and 2016.
Landsat VNIR imagery was integrated in the workflow to reduce misclassifications of classified forest/nonforest areas based on ALOS PALSAR imagery. Landsat scenes were provided by the Colombian National Forest and Carbon Monitoring System. Shadow/cloud masking spectral reflectance normalization, atmospheric correction, and surface reflectance conversion standard procedures [37,38,39,40,41,42] were implemented to generate mosaic products (Figure 3). Integration was implemented in mountain areas where the geometric correction of ALOS imagery was not effective due the presence of steep topography (Figure 6). ALOS-1 PALSAR-1 (2010) and ALOS-2 PALSAR-2 (2016) forest classifications products were explored visually, and misclassified forest/nonforest classes of steep slopes were reclassified to the correct class. This procedure was performed mainly in Boyacá-Santander, in the Coffee ecoregion, and partially in Meta foothills and Cesar river valley. Four Landsat VNIR spectral bands were used, avoiding bands in the visible blue and green intervals due to their sensitivity to atmospheric effects, especially in mountainous areas [43]. Forest change products (2010–2016) were then derived using the consolidated products, and zero deforestation assessment carried out at farm level.
The use of difference techniques using polarization values (especially HV) between image pairs can also lead to robust and cost-effective change detection results [28,44,45,46]. This research, however, needed thematic forest/nonforest extent products to estimate the carbon balance of the project (tons of equivalent CO2 at the baseline versus the assessment year). Additionally, the thematic maps were also necessary for forest management interventions in the project, e.g., defining conservation areas using fence isolation to avoid cattle access to forest.
A quantitative accuracy assessment of stable forest, stable nonforest and forest change thematic products were carried out based on Olofsson et al. validation approach [47,48], to derive accuracy indices at each of the five regions. The application of the validation at farm level was discarded due to (i) the impossibility to reach the minimum validation sample size per farm (n = 50 [47]), and (ii) the presence of highly concentrated points within small farms, thus not ensuring the sample independence [47]. The approach produced thematic accuracy indices and adjusted area estimations for each thematic class reported, with estimates of lower and upper limits (confidence intervals) at regional scale. The mapped areas were adjusted to take into account bias attributable to omission and commission classification errors [47]. The total validation sample size (n) per region was determined setting the expected standard error Si = 0.01 and validation accuracy Ui = 0.9 for each class, as suggested in this approach. In the case of a region rare class stratum, the minimum sample size was set at n = 50 following the reported validation approach [47]. The validation points were spatially randomly distributed within each region. The validation process was independent from the classification process: three project researchers visually interpreted the class of each validation point using ALOS PALSAR, Landsat, and Google Earth® imagery available for 2010 and 2016, and had no information on the previously classified maps. When at least two researchers coincided on the class assigned to the point, that point was taken as the validation reference, while when there was no agreement on the class assigned the three researchers defined the class by discussion and consensus. Results derived from the classification and validation phases were integrated to produce a confusion matrix and to derive the accuracy indices.

3. Results

3.1. Forest Extents and Change

Based on the adjusted areas estimations, Bajo Magdalena stable forest (2010–2016) represents 1.21% of the total area of the region with 3086 ha, deforestation 0.15% (373 ha), and nonforest 98.64% (251,032 ha) (Table 2). For the Cesar River Valley region stable forest represent 15.17% of the total area of the region (144,737 ha), deforestation 0.41% (3899 ha), and nonforest 84.42% (805,342 ha). In Boyacá-Santander the estimations showed that forest represent 20.78% of the total extension of the region with 94,499 ha, deforestation 0.13% with 592 ha, and nonforest 79.09% with 359,594 ha. Regarding to Coffee Ecoregion, stable forests represent 25.93% of the total area of the region with 224,534 ha, deforestation 0.02% with 210 ha, and nonforest 7440% with 641,093 ha. For the Meta region Foothills stable forest represent 16.13% of the total extension of the region with 99,275 ha, deforestation 0.06% with 377 ha, and nonforest 83.81% with 515,879 ha (Table 2).
Considering the total MSCR farms area (2615 farms), we estimated 17,162.1 ha of forest extent for year 2010 and 17,066.6 ha for 2016 (Table 3). The Meta foothills is the region had the largest forest cover of all farms with 6057.6 ha (2016), followed by the Coffee ecoregion with a total forest cover of 4931.8 ha and the Cesar river valley 4430.8 ha. The total forest area of these three regions represents 90% of the total forest cover associated with the farms of the MSCR project. Forest cover was estimated at 80.6 ha for Bajo Magdalena and 1565.8 ha for Boyacá-Santander. Bajo Magdalena has less than one percent of the total forest cover. Forest cover proportion inside the MSCR farms are low for all the regions: Bajo Magdalena and Cesar Valley river showed the lowest proportions with 1.1% and 9.5%, respectively, followed by the Coffee ecoregion (16.7%), Boyacá-Santander (23.7%), and Meta foothills (25.5%).
Forest change analysis indicated that the overall estimate of 2010–2016 deforestation, considering all MSCR farms, is approximately 95 ha, 0.5% percent of the total forest cover within farms (Table 3). Meta foothills farms showed zero deforestation hectares during the period of the assessment, followed by Bajo Magdalena (1.6 ha), Boyacá-Santander (3.7 ha), and Coffee ecoregion (15.2 ha). Cesar river valley showed the largest estimated deforestation extent (75 ha).

3.2. Forest Mapping Accuracy

Accuracy assessment was performed for the 2010–2016 forest change map. Thematic overall accuracy estimated for each study region varied from 92% to 99%, with a 90% confidence level. Cesar river valley (93%) and Coffee ecoregion (92%) presented the lowest overall thematic accuracy, followed by Meta foothills (95%), Boyacá-Santander (97%), and Bajo Magdalena (95%) (Table 4). User accuracy (UA) and producer accuracy (PA) values related to the stable forest, stable nonforest, and deforestation classes varied significantly among regions, i.e., between 62% and 100% (UA), and between 68% and 1% (PA) (Table 4).
The lowest UA values associated with forest class were associated to the Bajo Magdalena, Cesar River Valley, and Coffee Ecoregions, with 68%, 78%, and 80%, respectively; higher values were calculated for Boyacá-Santander and Meta foothills (93%). Stable forest PA showed generally high values (≥82%), with the exception of Cesar River Valley (77%). Stable nonforest classes showed high values for UA and PA consistently for all five regions (≥93%). Related to the deforestation class, Cesar River Valley showed the lowest UA and PA values with 32% and 68%, respectively. The Meta Foothills region consistently showed the highest values for both UA and PA (100%). Other regions showed intermediate user and producer accuracy values (Table 4).

4. Discussion

Forest and forest change products generated using ALOS PALSAR showed satisfactory overall accuracy (OA) values for all the regions analyzed (Table 4), presenting no significant differences among regions. High overall accuracy can be partially explained by the high accuracies obtained in the nonforest class, which is the class with largest area proportion (82%) compared to the forest and deforestation classes. This is a well-known limitation of this accuracy parameter.
Regions with highly complex topography (Boyacá-Santander and partially Cesar River Valley) presented lower accuracy levels for the forest and deforestation classes, respectively. Our results suggest that local slope orientation present in mountains with respect to the incidence angle of SAR sensors had a relevant effect on image distortion [49] or hampered the surface visibility by the sensor [50,51]. Here the integration with optical sensor information was necessary to reduce the misclassified areas. Higher accuracy performance was obtained in the Meta foothills region, which is characterized mostly by flat areas compared with mountain regions (i.e., Boyacá-Santander and Coffee Ecoregion). The Cesar river Valley region showed lower classification accuracy values, especially user’s accuracy, indicating an overestimation in the deforestation extension.
Deforestation products were characterized by misclassification errors especially within regions with dry conditions (Cesar River Valley and Bajo Magdalena), compared to the humid regions (Coffee ecoregion, Boyacá-Santander, and Meta foothills). During forest classification, detection of dry forests was more challenging, due to both (i) the high variation in vegetation structure observed in the ALOS PALSAR Fine Beam Dual imagery, and (ii) the seasonal deciduous behavior (phenology), well-observed using Landsat optical imagery. Our results suggest that dry forests mapping could need comprehensive ground truth data surveys to integrate the remote sensing-based mapping workflow. This is especially necessary for Colombia, where limited detailed and spatially explicit information is available for this forest type [30].
The low proportion of forests in the project’s farms reflects historical processes of deforestation, prior to the implementation of the MSCR project. The study regions characterized by greater proportion of forest cover within farms are located in mountainous or partially mountainous areas, possibly due to the limited accessibility [52], while those with less forest cover proportion are associated with dry regions which are historically characterized by high agricultural pressure [30].
In the Meta foothills region, zero hectares of deforestation detected between 2010 and 2016 (Table 3) advocates the fulfillment of zero deforestation. For the flat Bajo Magdalena region, deforestation estimate is 1.6 ha and with low variation due to uncertainties (Table 2), while in the mountain region of Boyacá-Santander, the deforestation estimated area (3.7 ha) is overestimated based on relatively low UA accuracy results. This was somehow expected due to the presence of steep slopes characteristic of the region, coupled with the lower efficiency of radar sensing in these topographic conditions [52].
In the case of the Cesar River Valley region, where major deforestation areas were detected and the lowest UA calculated, a postvalidation visual assessment was performed, revealing that the largest deforested area corresponds to a single event of approximately 33 ha; for this single event the area of the corresponding farm was estimated using the circular buffer method, so the direct attribution of noncompliance had an additional uncertainty due to the simplified geometric protocol used.
Nevertheless, other multi-temporal postclassification studies reported change classes as showing generally higher commission errors compared to errors associated to stable classes (forest/nonforest) [48,53,54,55,56]. Multiple research has discussed general minimum accuracy standards for remote sensing-based thematic mapping [57], although there is no global consensus for thematic accuracy of deforestation products. We stress that projects associated with zero deforestation agreements monitoring and assessment should always report omission and commission accuracy indices of each thematic class coupled with error-adjusted areas and their confidence intervals. Minimum accuracies should be included in the project specific requirements, together with additional procedures to corroborate agreements compliance/noncompliance, e.g., field corroboration of change detection procedures based on remote sensing analysis.
The application of ALOS PALSAR FBD imagery was found to provide significant and consistent information for the detection of forest and nonforest cover; the results were especially relevant for highly clouded tropical conditions [4]. Nonetheless, we found that its application in mountainous areas presents some limitations, since the signal of ALOS PALSAR resulted rather affected by the topography characteristics of some regions. The integration of highly detailed digital elevation models, dense temporal image series and improved preprocessing routines should be used to generate more accurate products for forest, nonforest, and deforestation detection and quantification in these specific conditions. The integration of optical sensors information improved the detection of forests and deforestation in topographic areas characterized by steep slopes, however, at the cost of the time of processing. Operational integration of Synthetic Aperture Radar imagery with optical imagery can significantly improve the consistency and robustness of forest monitoring in the tropics [58], to achieve efficient forest monitoring procedures for interoperability and classifications needs.

5. Conclusions

The Kyoto and Carbon Initiative has contributed significantly to the development and application of methodologies for forest monitoring in Colombia based on ALOS PALSAR products, allowing us to investigate their application for forest monitoring and deforestation at the local scale; complementing national efforts to quantify forest extent and forest change.
The present work highlighted some of the operational issues to be considered in the implementation and replicate of SAR-based systems for forest monitoring. These include the influence of topography features in SAR backscatters and the effect of structural and phenological characteristics of tropical dry forests. Our findings suggest that additional research should focus on more efficient geometric correction procedures to reduce errors associated with topography features. Future improvements to the current approach can include the use of radar dense time series to improve detection change analysis, together with ground truth data for dry forests to calibrate ALOS PALSAR sensors and reduce classification uncertainties. Large scale and medium resolution advances have been implemented on the generation of ALOS PALSAR products, i.e., JAXAS’s worldwide PALSAR mosaics [59] for forest monitoring, however additional research needs to be done on how to generate robust, consistent, and high accuracy forest products at local scales. ALOS PALSAR and SAR sensors provide multiple operation modes and processing approaches that need to be further explored to understand their real potential contribution to local scale forest monitoring.

Supplementary Materials

The following are available online at https://0-www-mdpi-com.brum.beds.ac.uk/2072-4292/10/9/1464/s1, Table S1: ALOS-1 and ALOS-2 Fine Beam Dual imagery used for forest change mapping; Figure S1: ALOS-1 and ALOS-2 Fine Beam Dual imagery preprocessing workflow implemented in Gamma® software.

Author Contributions

C.P., N.C., C.F. and G.G. conceived and designed the experiments; C.P. and C.F. performed the experiments; C.P. and C.F. analyzed the data; A.M. contributed with ground truth data; C.P., N.C., A.M., D.N., D.L., A.F.Z., J.D., C.F. and G.G wrote the paper.

Acknowledgments

The World Bank provided the funding for this study. The Global Environmental Facility (GEF) and the United Kingdom Government funded the Mainstream Sustainable Cattle Ranching Project, the Foundation Center for Research in Sustainable Systems of Agricultural Production (CIPAV), the Colombian Cattle Ranching Federation (FEDEGAN), The Nature Conservancy NASCA program, the Environmental action Fund (Fondo para la Acción Ambiental), and the World Bank are the institutions part of the Sustainable Cattle Ranching Project partnership. ALOS PALSAR data was provided by JAXA through the Fourth phase of the Kyoto and Carbon Initiative SIPM. No. 0216001. We acknowledge Julian Gonzalo Jimenez, Stavros Papageorgiou, and Luz Berania Díaz for their comments and recommendations on the methods applied in this research. Claudia Huertas and Ecometrica staff: Richard Tipper, Ryan Elfman, Jil Bournazel, and Véronique Morel are acknowledged for their helpful technical advice. Thanks are also given to all the field team members and researchers from this project’s partner institutions that provided the ground truth data.

Conflicts of Interest

The authors declare no conflicts of interest. The founding sponsors had no role in the design of the study; in the collection, analyses, or interpretation of data; in the writing of the manuscript, and in the decision to publish the results.

References

  1. Keenan, R.J.; Reams, G.A.; Achard, F.; de Freitas, J.V.; Grainger, A.; Lindquist, E. Dynamics of global forest area: Results from the FAO Global Forest Resources Assessment 2015. For. Ecol. Manag. 2015, 352, 9–20. [Google Scholar] [CrossRef]
  2. Etter, A.; McAlpine, C.; Possingham, H. Historical Patterns and Drivers of Landscape Change in Colombia Since 1500: A Regionalized Spatial Approach. Ann. Assoc. Am. Geogr. 2008, 98, 2–23. [Google Scholar] [CrossRef]
  3. Ministerio de Ambiente y Desarrollo Sostenible. Quinto Informe Nacional de Biodiversidad de Colombia ante el Convenio de Diversidad Biológica; Ministerio de Ambiente y Desarrollo Sostenible: Bogotá, Colombia, 2014; pp. 1–101.
  4. Rosenqvist, A.; Shimada, M.; Chapman, B.; Freeman, A.; De Grandi, G.; Saatchi, S.; Rauste, Y. The Global Rain Forest Mapping project—A review. Int. J. Remote Sens. 2000, 21, 1375–1387. [Google Scholar] [CrossRef]
  5. Achard, F.; Eva, H.D.; Stibig, H.-J.; Mayaux, P.; Gallego, J.; Richards, T.; Malingreau, J.-P. Determination of Deforestation Rates of the World’s Humid Tropical Forests. Science 2002, 297, 999–1002. [Google Scholar] [CrossRef] [PubMed]
  6. Hansen, M.C.; Stehman, S.V.; Potapov, P.V. Quantification of global gross forest cover loss. Proc. Natl. Acad. Sci. USA 2010, 107, 8650–8655. [Google Scholar] [CrossRef] [PubMed] [Green Version]
  7. Gong, P.; Wang, J.; Yu, L.; Zhao, Y.; Zhao, Y.; Liang, L.; Niu, Z.; Huang, X.; Fu, H.; Liu, S.; et al. Finer resolution observation and monitoring of global land cover: First mapping results with Landsat TM and ETM+ data. Int. J. Remote Sens. 2013, 34, 2607–2654. [Google Scholar] [CrossRef]
  8. Hansen, M.C.; Potapov, P.V.; Moore, R.; Hancher, M.; Turubanova, S.A.; Tyukavina, A.; Thau, D.; Stehman, S.V.; Goetz, S.J.; Loveland, T.R.; et al. High-Resolution Global Maps of 21st-Century Forest Cover Change. Science 2013, 342, 850–853. [Google Scholar] [CrossRef] [PubMed]
  9. Shimada, M.; Itoh, T.; Motooka, T.; Watanabe, M.; Shiraishi, T.; Thapa, R.; Lucas, R. New global forest/non-forest maps from ALOS PALSAR data (2007–2010). Remote Sens. Environ. 2014, 155, 13–31. [Google Scholar] [CrossRef]
  10. Kim, D.-H.; Sexton, J.O.; Townshend, J.R. Accelerated deforestation in the humid tropics from the 1990s to the 2000s. Geophys. Res. Lett. 2015, 42, 3495–3501. [Google Scholar] [CrossRef] [PubMed] [Green Version]
  11. Corbera, E.; Schroeder, H. Governing and implementing REDD+. Environ. Sci. Policy 2011, 14, 89–99. [Google Scholar] [CrossRef]
  12. Edenhoffer, O.; Pichs-Madruga, R.; Sokona, Y.; Minx, J.C.; Farahani, E.; Kadner, S.; Seyboth, K.; Adler, A.; Baum, I.; Brunner, S.; et al. Climate Change 2014 Mitigation of Climate Change; Cambridge University Press: Cambridge, UK, 2014; pp. 1–1454. [Google Scholar]
  13. Visseren-Hamakers, I.J.; McDermott, C.; Vijge, M.J.; Cashore, B. Trade-offs, co-benefits and safeguards: Current debates on the breadth of REDD. Curr. Opin. Environ. Sustain. 2012, 4, 646–653. [Google Scholar] [CrossRef]
  14. UNFCCC Report. In Proceedings of the Conference of the Parties on Its Nineteenth Session, Warsaw, Poland, 11–23 November 2013.
  15. Ochieng, R.M.; Visseren-Hamakers, I.J.; Arts, B.; Brockhaus, M.; Herold, M. Institutional effectiveness of REDD+ MRV: Countries progress in implementing technical guidelines and good governance requirements. Environ. Sci. Policy 2016, 61, 42–52. [Google Scholar] [CrossRef]
  16. Rosenqvist, A. Earth Observation Support to the UN Framework Convention on Climate Change: The Example of REDD. In Satellite Earth Observations and Their Impact on Society and Policy; Onoda, M., Young, O.R., Eds.; Springer: Singapore, 2017; Volume 352, pp. 143–153. [Google Scholar]
  17. Rosenqvist, A.; Shimada, M.; Chapman, B.; McDonald, K.; De Grandi, G.; Jonsson, H.; Williams, C.; Rauste, Y.; Nilsson, M.; Sango, D.; et al. An Overview of the JERS-1 SAR Global Boreal Forest Mapping (GBFM) Project. In Proceedings of the 2004 IEEE International Geoscience and Remote Sensing Symposium, Anchorage, AK, USA, 20–24 September 2004; Volume 2, pp. 1033–1036. [Google Scholar]
  18. Rosenqvist, A.; Shimada, M.; Ito, N.; Watanabe, M. ALOS PALSAR: A Pathfinder Mission for Global-Scale Monitoring of the Environment. IEEE Trans. Geosci. Remote Sens. 2007, 45, 3307–3316. [Google Scholar] [CrossRef]
  19. Reiche, J.; Lucas, R.; Mitchell, A.L.; Verbesselt, J.; Hoekman, D.H.; Haarpaintner, J.; Kellndorfer, J.M.; Rosenqvist, A.; Lehmann, E.A.; Woodcock, C.E.; et al. Combining satellite data for better tropical forest monitoring. Nat. Clim. Chang. 2016, 6, 120–122. [Google Scholar] [CrossRef]
  20. Ryan, C.M.; Hill, T.; Woollen, E.; Ghee, C.; Mitchard, E.; Cassells, G.; Grace, J.; Woodhouse, I.H.; Williams, M. Quantifying small-scale deforestation and forest degradation in African woodlands using radar imagery. Glob. Chang. Biol. 2011, 18, 243–257. [Google Scholar] [CrossRef]
  21. Reiche, J.; Hamunyela, E.; Verbesselt, J.; Hoekman, D.; Herold, M. Improving near-real time deforestation monitoring in tropical dry forests by combining dense Sentinel-1 time series with Landsat and ALOS-2 PALSAR-2. Remote Sens. Environ. 2018, 204, 147–161. [Google Scholar] [CrossRef]
  22. Cartus, O.; Santoro, M.; Kellndorfer, J. Mapping forest aboveground biomass in the Northeastern United States with ALOS PALSAR dual-polarization L-band. Remote Sens. Environ. 2010, 124, 1–13. [Google Scholar] [CrossRef]
  23. Lucas, R.; Rebelo, L.-M.; Fatoyinbo, L.; Rosenqvist, A.; Itoh, T.; Shimada, M.; Simard, M.; Souza-Filho, P.W.; Thomas, N.; Trettin, C.; et al. Contribution of L-band SAR to systematic global mangrove monitoring. Mar. Freshw. Res. 2014, 65, 589–616. [Google Scholar] [CrossRef]
  24. Shimada, M.; Isoguchi, O. JERS-1 SAR mosaics of Southeast Asia using calibrated path images. Int. J. Remote Sens. 2002, 23, 1507–1526. [Google Scholar] [CrossRef]
  25. Kalamandeen, M.; Gloor, E.; Mitchard, E.; Quincey, D.; Ziv, G.; Spracklen, D.; Spracklen, B.; Adami, M.; Aragão, L.E.; Galbraith, D. Pervasive Rise of Small-scale Deforestation in Amazonia. Sci. Rep. 2018, 8, 1600. [Google Scholar] [CrossRef] [PubMed]
  26. Godar, J.; Gardner, T.A.; Tizado, E.J.; Pacheco, P. Actor-specific contributions to the deforestation slowdown in the Brazilian Amazon. Proc. Natl. Acad. Sci. USA 2014, 111, 15591–15596. [Google Scholar] [CrossRef] [PubMed] [Green Version]
  27. Gibbs, H.K.; Munger, J.; L’Roe, J.; Barreto, P.; Pereira, R.; Christie, M.; Amaral, T.; Walker, N.F. Did Ranchers and Slaughterhouses Respond to Zero-Deforestation Agreements in the Brazilian Amazon? Conserv. Lett. 2015, 9, 32–42. [Google Scholar] [CrossRef] [Green Version]
  28. Almeida-Filho, R.; Shimabukuro, Y.E.; Rosenqvist, A.; Sanchez, G.A. Using dual-polarized ALOS PALSAR data for detecting new fronts of deforestation in the Brazilian Amazonia. Int. J. Remote Sens. 2009, 30, 3735–3743. [Google Scholar] [CrossRef]
  29. Etter, A.; Mcalpine, C.; Wilson, K.; Phinn, S.; Possingham, H. Regional patterns of agricultural land use and deforestation in Colombia. Agric. Ecosyst. Environ. 2006, 114, 369–386. [Google Scholar] [CrossRef]
  30. Pizano, C.; García, H. El Bosque seco Tropical en Colombia; UBC Press: Vancouver, BC, Canada, 2014. [Google Scholar]
  31. Armenteras, D.; Gast, F.; Villareal, H. Andean forest fragmentation and the representativeness of protected natural areas in the eastern Andes, Colombia. Biol. Conserv. 2003, 113, 245–256. [Google Scholar] [CrossRef]
  32. Galvis, G.; Iván Mojica, J. The Magdalena River fresh water fishes and fisheries. Aquat. Ecosyst. Health Manag. 2007, 10, 127–139. [Google Scholar] [CrossRef]
  33. JAXA Calibration Result of ALOS-2/PALSAR-2 JAXA Standard Products. Available online: http://www.eorc.jaxa.jp/ALOS-2/en/calval/calval_index.htm (accessed on 15 June 2018).
  34. Werner, C.; Wegmller, U.; Strozzi, T.; Wiesmann, A. Gamma SAR and interferometric processing software. In Proceedings of the ERS-ENVISAT Symposium, Gothenburg, Sweden, 16–20 October 2000. [Google Scholar]
  35. Lopes, A.; Touzi, R.; Nezry, E. Adaptive speckle filters and scene heterogeneity. IEEE Trans. Geosci. Remote Sens. 1990, 28, 992–1000. [Google Scholar] [CrossRef]
  36. Tou, J.T.; Gonzalez, R.C. Pattern Recognition Principles; Addison-Wesley: Reading, MA, USA, 1974. [Google Scholar]
  37. Richards, J.A. Remote Sensing Digital Image Analysis; Springer: Berlin/Heidelberg, Germany, 1999. [Google Scholar]
  38. Zhu, Z.; Woodcock, C.E. Object-based cloud and cloud shadow detection in Landsat imagery. Remote Sens. Environ. 2012, 118, 83–94. [Google Scholar] [CrossRef]
  39. Vermote, E.F.; El Saleous, N.; Justice, C.O.; Kaufman, Y.J.; Privette, J.L.; Remer, L.; Roger, J.C.; Tanre, D. Atmospheric correction of visible to middle-infrared EOS-MODIS data over land surfaces: Background, operational algorithm and validation. J. Geophys. Res. Atmos. 1997, 102, 17131–17141. [Google Scholar] [CrossRef] [Green Version]
  40. Schmidt, G.; Jenkerson, C.; Masek, J.G. Landsat Ecosystem Disturbance Adaptive Processing System (LEDAPS) Algorithm Description; U.S. Geological Survey: Reston, VA, USA, 2013.
  41. Masek, J.G.; Vermote, E.F.; Saleous, N.; Wolfe, R.; Hall, F.G.; Huemmrich, K.F.; Gao, F.; Kutler, J.; Lim, T.K. LEDAPS Calibration, Reflectance, Atmospheric Correction Preprocessing Code, Version 2; ORNL DAAC: Oak Ridge, TN, USA, 2013. [Google Scholar]
  42. Zhu, Z.; Woodcock, C.E. Automated cloud, cloud shadow, and snow detection in multitemporal Landsat data: An algorithm designed specifically for monitoring land cover change. Remote Sens. Environ. 2014, 152, 217–234. [Google Scholar] [CrossRef]
  43. Ouaidrari, H.; Vermote, E.F. Operational Atmospheric Correction of Landsat TM Data. Remote Sens. Environ. 1999, 70, 4–15. [Google Scholar] [CrossRef]
  44. Motohka, T.; Shimada, M.; Uryu, Y.; Setiabudi, B. Using time series PALSAR gamma nought mosaics for automatic detection of tropical deforestation: A test study in Riau, Indonesia. Remote Sens. Environ. 2014, 155, 79–88. [Google Scholar] [CrossRef]
  45. Reiche, J.; Verbesselt, J.; Hoekman, D.; Herold, M. Fusing Landsat and SAR time series to detect deforestation in the tropics. Remote Sens. Environ. 2015, 156, 276–293. [Google Scholar] [CrossRef]
  46. Whittle, M.; Quegan, S.; Uryu, Y.; Stüewe, M.; Yulianto, K. Detection of tropical deforestation using ALOS-PALSAR: A Sumatran case study. Remote Sens. Environ. 2012, 124, 83–98. [Google Scholar] [CrossRef]
  47. Olofsson, P.; Foody, G.M.; Stehman, S.V.; Woodcock, C.E. Making better use of accuracy data in land change studies: Estimating accuracy and area and quantifying uncertainty using stratified estimation. Remote Sens. Environ. 2013, 129, 122–131. [Google Scholar] [CrossRef]
  48. Olofsson, P.; Foody, G.M.; Herold, M.; Stehman, S.V.; Woodcock, C.E.; Wulder, M.A. Good practices for estimating area and assessing accuracy of land change. Remote Sens. Environ. 2014, 148, 42–57. [Google Scholar] [CrossRef] [Green Version]
  49. Gelautz, M.; Frick, H.; Raggam, J.; Burgstaller, J.; Leberl, F. SAR image simulation and analysis of alpine terrain. ISPRS J. Photogramm. Remote Sens. 1998, 53, 17–38. [Google Scholar] [CrossRef]
  50. Herrera, G.; Gutiérrez, F.; García-Davalillo, J.C.; Guerrero, J.; Notti, D.; Galve, J.P.; Fernández-Merodo, J.A.; Cooksley, G. Multi-sensor advanced DInSAR monitoring of very slow landslides: The Tena Valley case study (Central Spanish Pyrenees). Remote Sens. Environ. 2013, 128, 31–43. [Google Scholar] [CrossRef]
  51. Cigna, F.; Bateson, L.B.; Jordan, C.J.; Dashwood, C. Simulating SAR geometric distortions and predicting Persistent Scatterer densities for ERS-1/2 and ENVISAT C-band SAR and InSAR applications: Nationwide feasibility assessment to monitor the landmass of Great Britain with SAR imagery. Remote Sens. Environ. 2014, 152, 441–466. [Google Scholar] [CrossRef]
  52. Rubiano, K.; Clerici, N.; Norden, N.; Etter, A. Secondary Forest and Shrubland Dynamics in a Highly Transformed Landscape in the Northern Andes of Colombia (1985–2015). Forests 2017, 8, 216. [Google Scholar] [CrossRef]
  53. Jeon, S.B.; Olofsson, P.; Woodcock, C.E. Land use change in New England: A reversal of the forest transition. J. Land Use Sci. 2012, 9, 105–130. [Google Scholar] [CrossRef]
  54. Olofsson, P.; Torchinava, P.; Woodcock, C.E.; Baccini, A.; Houghton, R.A.; Ozdogan, M.; Zhao, F.; Yang, X. Implications of land use change on the national terrestrial carbon budget of Georgia. Carbon Balance Manag. 2010, 5, 4. [Google Scholar] [CrossRef] [PubMed]
  55. Olofsson, P.; Kuemmerle, T.; Griffiths, P.; Knorn, J.; Baccini, A.; Gancz, V.; Blujdea, V.; Houghton, R.A.; Abrudan, I.V.; Woodcock, C.E. Carbon implications of forest restitution in post-socialist Romania. Environ. Res. Lett. 2011, 6, 045202. [Google Scholar] [CrossRef] [Green Version]
  56. Seto, K.C.; Woodcock, C.E.; Song, C.; Huang, X.; Lu, J.; Kaufmann, R.K. Monitoring land-use change in the Pearl River Delta using Landsat TM. Int. J. Remote Sens. 2002, 23, 1985–2004. [Google Scholar] [CrossRef] [Green Version]
  57. Foody, G.M. Status of land cover classification accuracy assessment. Remote Sens. Environ. 2002, 80, 185–201. [Google Scholar] [CrossRef]
  58. Lehmann, E.A.; Caccetta, P.; Lowell, K.; Mitchell, A.; Zhou, Z.-S.; Held, A.; Milne, T.; Tapley, I. SAR and optical remote sensing: Assessment of complementarity and interoperability in the context of a large-scale operational forest monitoring system. Remote Sens. Environ. 2015, 156, 335–348. [Google Scholar] [CrossRef]
  59. Shimada, M.; Ohtaki, T. Generating Large-Scale High-Quality SAR Mosaic Datasets: Application to PALSAR Data for Global Monitoring. IEEE J. Sel. Top. Appl. Earth Obs. Remote Sens. 2010, 3, 637–656. [Google Scholar] [CrossRef]
Figure 1. Location of the five regions studied in Colombia (green areas): 1: Bajo Magdalena; 2: Cesar River Valley; 3: Boyacá-Santander; 4: Coffee Ecoregion; and 5: Meta Foothills. Orange dots represent the 2615 farms participating to the Mainstream Sustainable Cattle Ranching project. Geographical Coordinate System WGS 84.
Remotesensing 10 01464 g001
Figure 2. Examples of property delimitation of farms (yellow polylines) in the Meta foothills regions. Polylines were produced using GPS-based precise boundary delineation (802 farms) or by a circle buffer generated using a center GPS location and farm area reported by legal documentation (1813 farms). Background image: ALOS-2 Fine Beam (FCC: Red: HH, Green: HV, and Blue: |HH-HV| polarizations), March 2016. Geographical Coordinate System WGS 84.
Remotesensing 10 01464 g002
Figure 3. Zero deforestation agreements assessment data processing workflow for the MSCR project, including: ALOS Phased Array L-band SAR (PALSAR) Fine Beam Dual (FBD) preprocessing, Landsat preprocessing, thematic classification, and accuracy assessment.
Remotesensing 10 01464 g003
Figure 4. (A) ALOS-2 Fine Beam image (FCC: Red: HH, Green: HV and Blue: |HH-HV| polarizations); (B) the same image with Lee filter speckle reduction.
Remotesensing 10 01464 g004
Figure 5. Forest classification Meta foothills example: (A) FBD ALOS-2 PALSAR-2 2016 (FCC: Red: HH, Green: HV and Blue: |HH-HV| polarizations); (BD) training data of forest (green) and nonforest based on unsupervised k-means classification; (E) ground truth data of forest (green) and nonforest (yellow) obtained during field trip. Training data and ALOS PALSAR imagery were integrated to generate forest nonforest products (F) based on a maximum likelihood supervised classification.
Remotesensing 10 01464 g005
Figure 6. 2010 imagery (A) ALOS-1 fine beam imagery (FCC: Red: HH, Green: HV, and Blue: |HH-HV| polarizations). Steep slopes affect ALOS backscatter, where signal is intensified by terrain aspect (brighter pixel on mountain areas) or is lost by terrain aspect (black areas in mountain areas) in reference of the beam angle; (B) Landsat 8 OLI (FCC: Red: NIR, Green: SWIR, and Blue: red). Geographical Coordinate System WGS 84.
Remotesensing 10 01464 g006
Table 1. Descriptive statistics of the 2615 farms associated with the Mainstream Sustainable Cattle Ranching Project.
Region NameFarms Total Size (ha) 1Farms (n)Farms Mean Size (ha)Farms Min Size (ha)Farms Max Size (ha)Administrative DepartmentsForest Type
Bajo Magdalena (1)735442117.52217Atlántico, BolívarDry forest
Cesar River Valley (2)46,58769267.13.72582Cesar, La GuajiraDry forest
Boyacá-Santander (3)659346214.32250Boyacá, SantanderMountain forest
Coffee Ecoregion (4)29,52166744.221055Quindío, Caldas, Risaralda, Tolima, Valle del CesarMountain forest
Meta foothills (5)23,74737364.83.91581MetaFoothill forest
1 Farms size were estimated based on GPS farm boundaries delimitation (802 farms), and by legal documentation (1813 farms).
Table 2. Stable forest, stable nonforest, and deforestation area estimations for Bajo Magdalena, Cesar River Valley, Boyacá-Santander, Coffee Ecoregion, and Meta Foothills regions.
ClassMapped Area (ha)Adjusted Area (ha)Margin of Error (ha; 95% Confidence Interval)
Bajo MagdalenaF45283086302
DF33637392
NF249,627251,032297
Cesar River ValleyF143,618144,73712,433
DF199938992663
NF808,361805,34212,266
Boyacá-SantanderF94,46994,4994074
DF80059250
NF359,417359,5944075
Coffee EcoregionF231,785224,53413,761
DF25021013
NF633,802641,09313,761
Meta FoothillsF113,40499,2756605
DF48437729
NF501,645515,8796605
Table 3. Forest, nonforest and deforestation area estimations at farm level for 2615 farms associated to the MSCR project (2010–2016).
RegionStable Forest (ha)Deforestation (ha)Stable No Forest (ha)
Bajo Magdalena80.61.65727
Cesar river Valley4430.87534,118.6
Boyacá-Santander1565.83.73655.8
Coffee ecoregion4931.815.221,834
Meta foothills6057.6017,677.9
Table 4. Thematic accuracy indices and number of validation points per region assigned to stable forest (F), deforestation (DF) and stable nonforest (NF) classes. Accuracy measures are calculated with 90% confidence interval, following the method of a previous paper [47].
RegionClassFDFNFTotalWiUser AccuracyProducer AccuracyOverall Accuracy
Bajo MagdalenaF34115500.01780.6810.99
DF1427500.00130.840.76
NF002962960.980910.99
Total 3543318396
Boyacá-SantanderF6705720.2080.930.930.97
DF23711500.0020.741
NF502692740.790.980.98
Total 7437285396
Meta foothillsF52012640.1840.930.930.95
DF2399500.00111
NF402782820.8150.960.96
Total 5839299396
Coffee ecoregionF74019930.2680.80.820.92
DF4424500.0000.841
NF1602372530.7320.940.93
Total 9442260396
Cesar river valleyF42111540.1510.780.770.93
DF13118500.0020.320.68
NF1202822940.8470.960.96
Total 5532311398

