Letter

In-Flight Calibration and Performance of the OSIRIS-REx Visible and IR Spectrometer (OVIRS)

1
NASA Goddard Space Flight Center, Greenbelt, MD 20771, USA
2
Physics Department, Catholic University of America, Washington, DC 20064, USA
3
NASA Postdoctoral Fellow, Greenbelt, MD 20771, USA
4
Science Systems and Applications, Inc., Greenbelt, MD 20771, USA
5
Lunar and Planetary Lab, University of Arizona, Tucson, AZ 85721, USA
*
Author to whom correspondence should be addressed.
Submission received: 1 August 2018 / Revised: 6 September 2018 / Accepted: 16 September 2018 / Published: 18 September 2018

Abstract

:
Performance of the Origins, Spectral Interpretation, Resource Identification, Security–Regolith Explorer (OSIRIS-REx) Visible and InfraRed Spectrometer (OVIRS) instrument was validated, showing that it met all science requirements during extensive thermal vacuum ground testing. Preliminary instrument radiometric calibration coefficients and wavelength mapping were also determined before instrument delivery and launch using NIST-traceable sources. One year after launch, Earth flyby data were used to refine the wavelength map by comparing OVIRS spectra with atmospheric models. Near-simultaneous data from other Earth-orbiting satellites were used to cross-calibrate the OVIRS absolute radiometric response, particularly at visible wavelengths. Trending data from internal calibration sources and the Sun show that instrument radiometric performance has been stable to better than 1% in the 18 months since launch.

Graphical Abstract

1. Introduction

The Origins, Spectral Interpretation, Resource Identification, Security–Regolith Explorer (OSIRIS-REx) Visible and InfraRed Spectrometer (OVIRS) is a point spectrometer with a circular 4-mrad field of view, as shown in Figure 1. OVIRS is designed to obtain spectra of OSIRIS-REx mission target asteroid (101955) Bennu from 0.4 to 4.3 microns to quantify space weathering, constrain surface mineralogy, and measure contributions to the Yarkovsky effect [1]. To achieve these science objectives, OVIRS has a required in-flight radiometric stability of <2.5% from 0.4 to 2.0 μm with a signal-to-noise ratio (SNR) of >50 from 0.4 to 4 μm for a 3% solar reflectance target. As the expected Bennu spectral features are broad, the required spectral resolution is 3 to 5 nm at visible wavelengths and 7 to 20 nm at IR wavelengths. OVIRS spectra are acquired using Linear Variable Filters (LVFs) over a Teledyne Hawaii-1RG (H1RG) detector [2,3]. The wavelength span is split into five separate LVF segments with variable spectral resolution. For each filter, 512 columns are read out over 32-row pre-defined regions of interest. Individual frames may be read out in full-frame mode or in ‘superpixel’ (SP) summing mode. A full frame is 512 × 180 pixels, which includes 20 rows of dark pixels. There are ~64 pixels within a spectral resolution element (two columns) to improve the SNR, and data may be summed onboard, after known bad pixels are removed, to reduce data volume. The standard science mode sums all data in 8-pixel averages in each column to reduce the frame to 512 × 23 pixels; it is possible to apply less onboard summing. In that case, data are subsequently summed during ground processing, after outliers are rejected to improve the signal to noise.
OVIRS employs two internal sources and a solar calibration port to monitor radiometric performance in flight [3]. Cruise calibration and trending activities occur about every six months, as well as during the Earth Gravity Assist (EGA) one year after launch. Here, we describe ground calibration using NIST-traceable sources, as well as the first in-flight calibration activities and instrument performance.

2. Materials and Methods

The initial OVIRS performance was predicted using component-level testing, including detector response, filter transmissivity, and mirror reflectivity. Because OVIRS operates in the near-IR, its detector must be cooled to reduce background signal, and it includes radiators for passive cooling. The instrument was tested in a LN2-cooled thermal vacuum chamber (TVAC) to assess system-level performance. During TVAC testing, a helium cryo-refrigerator with a cold finger to the second stage radiator provided additional cooling for the detector to test performance over the full expected operating temperature range (90–105 K), with limited additional data acquired at higher temperatures. The instrument has no thermal stability requirements, but at temperatures above ≈135 K, the detector saturates with hot pixels.
Instrument performance on the ground was measured with an in-chamber system designed for radiometric and geometric testing [4]. This system includes a NIST-traceable infrared blackbody flood source with 0.992 emissivity from 180 K to 360 K over a uniform field. A separate visible integrating sphere provides calibrated output over the 0.5-to-1.6-μm wavelength range. An additional IR blackbody source (up to 500 K) provides a collimated beam for angular testing with a variety of beam sizes. Finally, line sources (laser, monochromator, and arc lamps) are available using an external chamber feed coupled to the collimated light path for wavelength calibration, spectral resolution, and line width evaluation.
In flight, detailed instrument performance is monitored with internal source exposures throughout a science sequence and with solar exposures every 6 months. In September 2017, data for the Earth and Moon were acquired at set intervals after closest approach, covering multiple ranges and phase angles (Table 1) and included spacecraft scans in both instrument axes, as well as distant point-and-stare mosaics. As outlined below, the Earth flyby data were used to check the wavelength and radiometric calibration, as well as to confirm the boresight pointing direction.

3. Results

3.1. Wavelength Calibration

Initial wavelength calibration was based on vendor (JDS Uniphase, now Viavi Solutions)–supplied measurements of the filter transmission, resolving power, and wavelengths (Table 2). A quadratic fit of the measurements in each filter segment was used to assign initial wavelengths. At the instrument level, measurements were acquired using external (to the chamber) sources to provide distinct line sources. First, a monochromator was used with an uncalibrated IR source to provide multiple orders of light over the full spectral region. The monochromator was also stepped in small wavelength increments (8 to 12 nm) to determine line width, using Gaussian line fits. The monochromator data were supplemented with Hg and Kr/Ar arc lamps and visible lasers at several wavelengths for quick checks of wavelength vs. detector pixel location. Short wavelength measurements were challenging due to blockage by the chamber window and reflectance losses in the coupling system optics, several of which are gold-coated. Thus, wavelengths below 0.5 μm could not be fully characterized.
Flight data from the Earth flyby provided an absolute check on wavelengths below ~2.3 μm, where sufficient signal and spectral features could be identified. Atmospheric lines in these spectra were compared with their known wavelengths using a model atmosphere from MODTRAN [5]. Fits to identified lines were used to adjust the spectral coverage on a filter-by-filter basis. The measured short wavelength adjustments were then bootstrapped to calibrate the TVAC monochromator data and adjust the longer wavelength values. Final wavelength values for each LVF segment are shown in Table 2. The filters have a very slight temperature dependence, 5 ppm/K for LVFs 1a, 1b, 3, and 4 and 50 ppm for LVF2, resulting in a negligible shift over the OVIRS operating temperatures (~0.5 nm, much smaller than the required spectral resolution of 7 to 12 nm in this filter).

3.2. Radiometric Calibration

Detector noise response is linear with temperature, providing an overall background level [3]. Above ~135 K, no signals can be detected due to detector saturation (~60,000 counts). In addition to the background level, some pixels are permanently inoperable or saturated, while others have poor response at higher temperatures, resulting in a temperature-dependent bad-pixel map (BPM). In flight, an onboard BPM is used to exclude these pixels before SP summing. Ideally, different BPMs should be used for the expected detector operating temperature; a cold BPM excludes fewer pixels and could corrupt SP sums if the detector is warm, whereas a warm BPM can exclude good pixels if the detector is cold. In flight, the detector temperatures have consistently been near 105 K, with heating during expected events (such as Earth in the field of view of the passive thermal radiator) up to 115 K and higher. The most conservative 115 K BPM was chosen for use during EGA and beyond, retaining the option to do less onboard summing. Local deep space observations obtained in conjunction with each science observation provide the background level for later removal.
During ground testing, several of the NIST sources were used to calibrate instrument response to an absolute radiance. First, the IR flood source was used to produce blackbody curves at temperatures of 320 K, 340 K, and 360 K; data at 360 K were saturated at long wavelengths. After background frame subtraction, the calculated Planck blackbody radiance curves at these temperatures were used to provide a radiance conversion from measured counts/s to W/cm2/sr/μm for wavelengths greater than 2.5 μm. Similarly, for wavelengths from 0.4 to 1.6 μm, the visible integrating sphere included a Labsphere-provided absolutely calibrated response curve, though with coarse spectral sampling. Many integration times and power settings were used to provide adequate dynamic range at most wavelengths, though the signal was low below 0.5 μm and above 1.5 μm due to optical fiber absorption. Additionally, the optical fibers had OH absorption features and suffered from an epoxy failure that blackened the fibers that potentially affected the source signal. Thus, ground calibration below 1.5 μm was suspect and required flight data for validation. The calibrated chamber sources did not allow for proper validation of the calibration between 1.5 and 2.5 μm, and the predicted instrument response (built up from component-level tests) was used at these wavelengths for the final ground characterization.
In addition to the radiometric coefficients, the IR flood source was used to characterize observed out-of-band leakage at short wavelengths. After background subtraction and radiance calibration, the 320 K, 340 K and 360 K blackbody curves were converted into photon radiance units. To estimate the out-of-band signal, we integrated under the photon radiance curve in LVF4 (2.85 to 4.28 μm) at each temperature using the trapezoidal rule. Blackbody radiances were substituted for the saturated portion of the 360 K curve (above 3.8 μm). A linear fit was then performed to correlate each short wavelength pixel’s out-of-band response with the integrated long-wavelength photon radiance. This value was then subtracted to correct the calibrated radiance spectrum. Although it would be more precise to perform a fit to each filter segment after measuring a variety of known spectral shapes and powers, this was not possible with the available chamber sources. However, the out-of-band effect is small (<0.8%) and is expected only for the hottest asteroid surfaces; these should be most similar to the blackbody curves at 360 K. Thus, the final calibration provides a pixel-by-pixel conversion for all wavelengths from counts/s to W/cm2/sr/μm:
Ii,j = Ri,j * (DNi,jBi,j)/tS * OBi,j * Ei,j
where I is corrected radiance, DN is the measured counts, B is the background signal, t is exposure time, R is the radiometric coefficient, S is the integrated long-wavelength photon radiance, OB is the out-of-band coefficient, and E is the wavelength-dependent photon energy for each pixel (i,j). Only wavelengths < 2.2 μm have an OB correction (the value is set to zero otherwise).
During the EGA, thousands of Earth spectra were obtained, as presented in Table 1, primarily over the ocean, but also over western North America and East Asia, with varying cloud cover. Near-simultaneous data from several Earth-viewing (EV) imagers—Earth Observing System Aqua/Moderate Resolution Imaging Spectroradiometer (MODIS), Suomi-NPP/Visible Infrared Imaging Radiometer Suite (VIIRS), and DSCOVR/Earth Polychromatic Imaging Camera (EPIC)—allowed for a cross-platform radiometry check over multiple overlapping wavelength bands [6,7,8]. These EV imagers are narrowband instruments; therefore, each measurement corresponds to a spectral channel which is a near-box filter over a certain wavelength range. The channels are calibrated using either radiance (IR) or reflectance (VIS, SWIR) space as appropriate, with typical uncertainties of 2% or better [6,7,8]. For each of the EV imager channels, we reported a mean reflectance (or radiance), standard deviation, measurement count, and measurement histogram on a 0.1° resolution lat-lon grid. The histograms were included in order to provide an estimate of scene homogeneity that is more accurate than a standard deviation. As there are many OVIRS spectral elements within a single EV imager bandpass, OVIRS data had to be converted into an effective EV instrument measurement by applying the EV channel spectral response function to the OVIRS spectrum. The resultant effective radiance was then converted to radiance (Reff) or reflectance (dividing I by solar flux) for the particular EV channel by integrating over the bandpass:
R e f f = λ 1 λ 2 I ( λ ) S R F E V ( λ ) d λ λ 1 λ 2 S R F E V ( λ ) d λ
where SRFEV is the spectral response function for the EV channel. To correct the OVIRS data, EV data were selected to be close in zenith angle and time, and the OVIRS effective radiance was ratioed to that of the corresponding EV channel. As the OVIRS data were not simultaneous with every EV platform, and there could be residual pointing uncertainties, we focused on clear regions over the ocean to avoid variable cloud cover. We then fit a curve to all the data from the satellites within each of the LVFs (except LVF4 where there are no bands with sufficient signal) and applied that fit as a correction to our radiometric coefficients. It was necessary to fix the values at the ends of each filter segment to ensure the radiances matched.
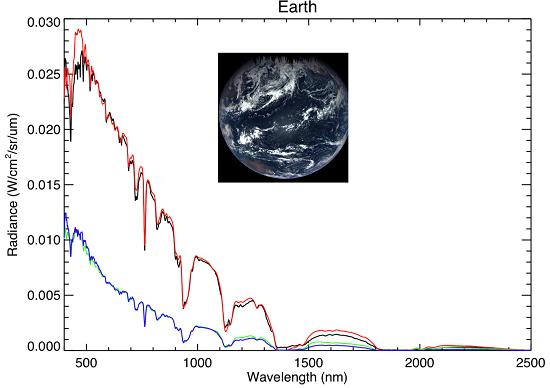
Cross-calibrated Earth spectra are shown in Figure 2 against MODTRAN models [5]. The low-reflectance spectrum (blue line) is a reasonable match to a MODTRAN model with no clouds and 11% surface reflectance (green line). The addition of 40% cumulus cloud cover to the MODTRAN model (red line) approximately matches a brighter OVIRS spectrum (black line). The mismatch at the shortest wavelengths results from the fact that the EV imagers have discrete broad passbands relative to the higher spectral resolution of OVIRS, and there were no EV satellite data below ~400 nm. Even a second- or third-order polynomial fit cannot perfectly correct the OVIRS data, as the EV data set did not adequately sample the full wavelength-dependent structure in each OVIRS LVF; we used 11 bands in LVF1a, ten in LVF1b, five in LVF2, and two in LVF3. Further examination of other EV and OVIRS flight data, including solar data, will be used to improve the few remaining mismatches in the future.

3.3. Radiometric Stability and Instrument Performance

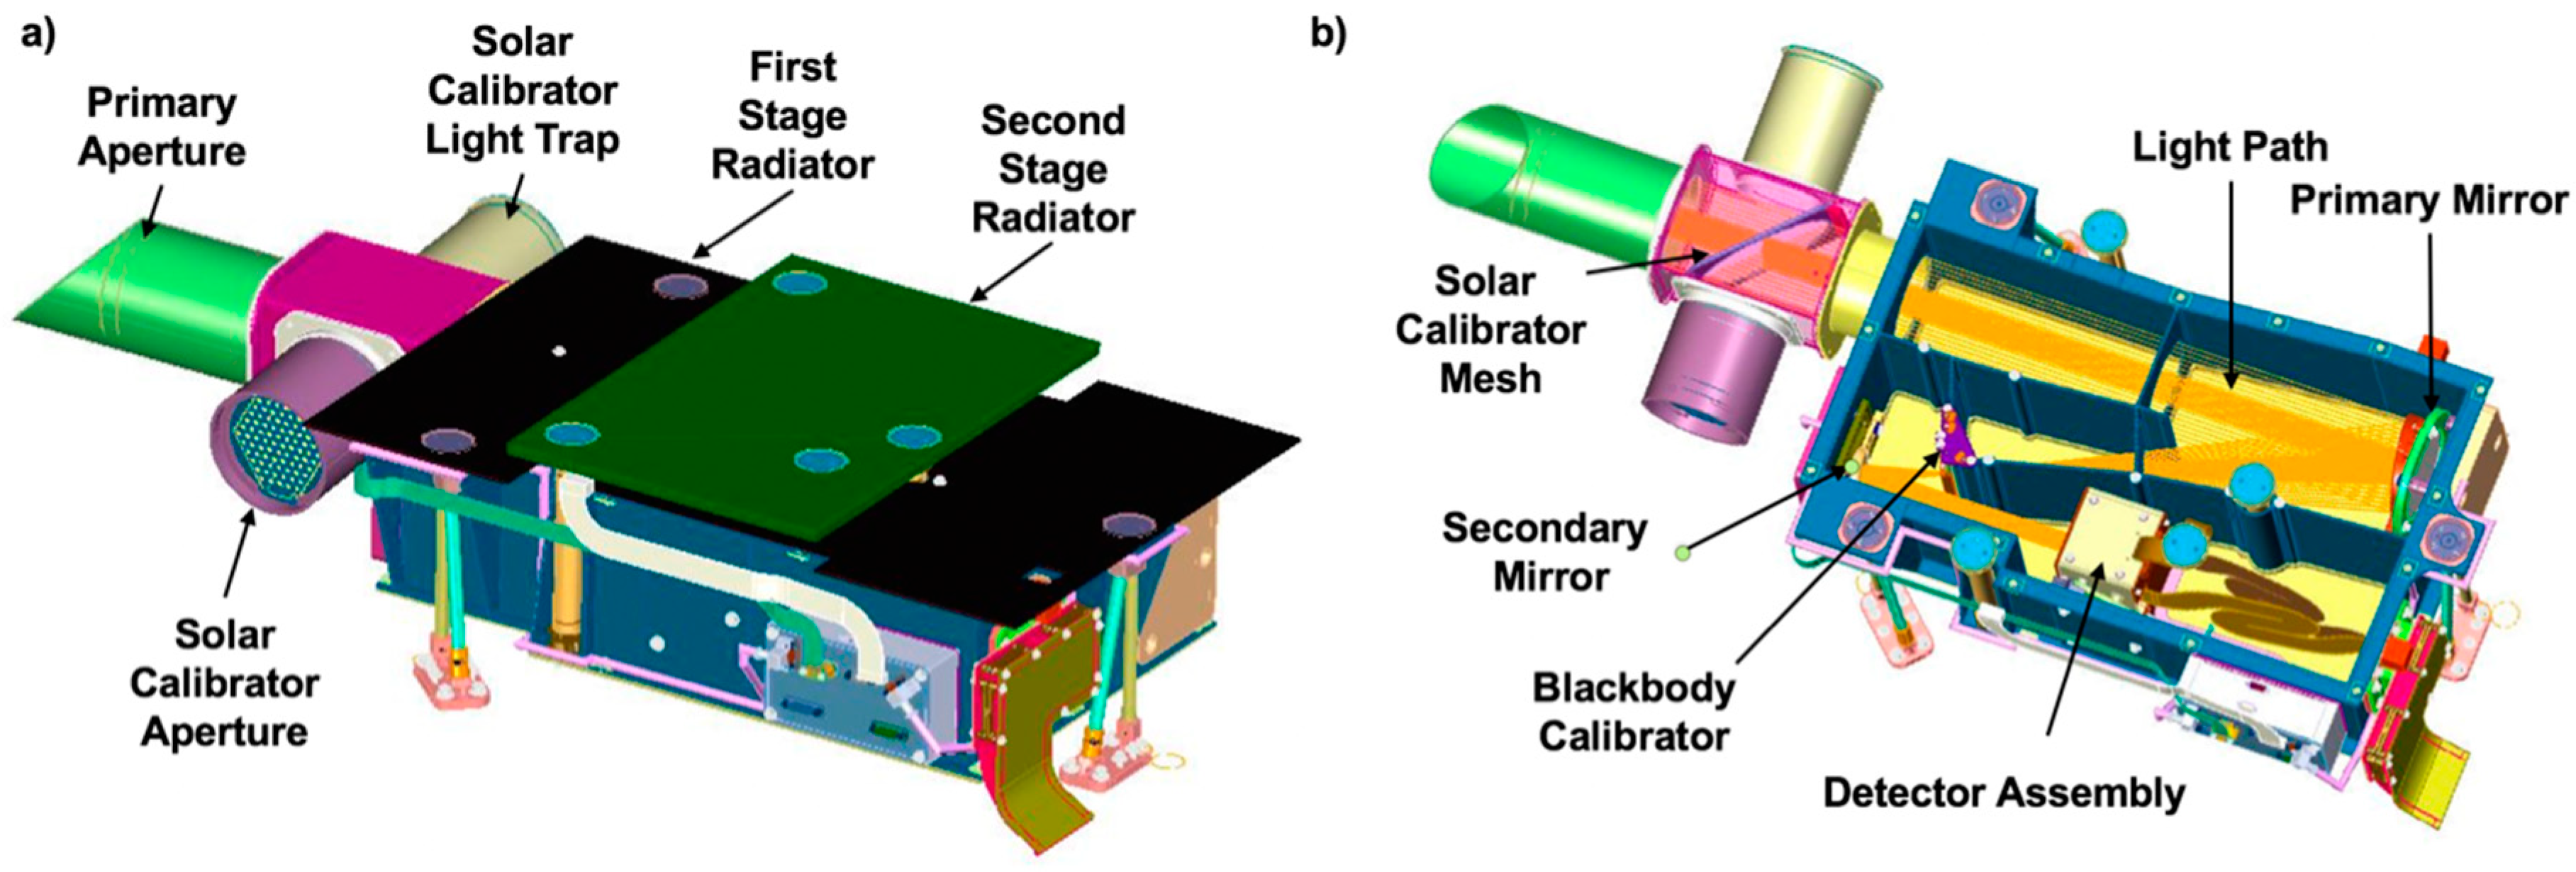
A full set of calibrations are performed about every six months in cruise, as well as around critical activities, to monitor instrument performance in flight. OVIRS uses three in-flight calibration sources: internal blackbodies, internal tungsten lamps, and a solar calibration port. The solar calibration port is designed to approximate the signal level from the asteroid surface, scattering <3% of the solar light into the main optical path. Illuminating the solar calibration port requires slewing the spacecraft, so it is used less frequently to check absolute radiometric performance. The design of the solar calibrator, and separate light path, forms a non-uniform pattern at the detector, and thus it cannot be directly compared to a solar spectrum; this transfer function may be analyzed in the future.
The two internal sources allow for checks of relative performance changes throughout a science observation, as well as long-term trending. Each source is located at a different position along the optical path and has a different spectral response. This distribution allows some diagnostic capability for determining where a potential change may be occurring in the instrument, including the sources themselves. The internal lamps and blackbody sources are activated frequently throughout an observation sequence, when relative radiometric monitoring is needed.
Data acquired after launch were compared with ground data to assess post-launch performance. The only sources useful for trending from TVAC are the internal lamps, as the blackbodies require burn-in after launch and the Sun was not observed before launch. To date, filament performance is identical to ground data, indicating no changes post-launch. After launch, the blackbody burn-in was completed, as well as a check of the solar port pointing direction. Data acquired from these sources are now also monitored for stability and show no radiometric changes over time.
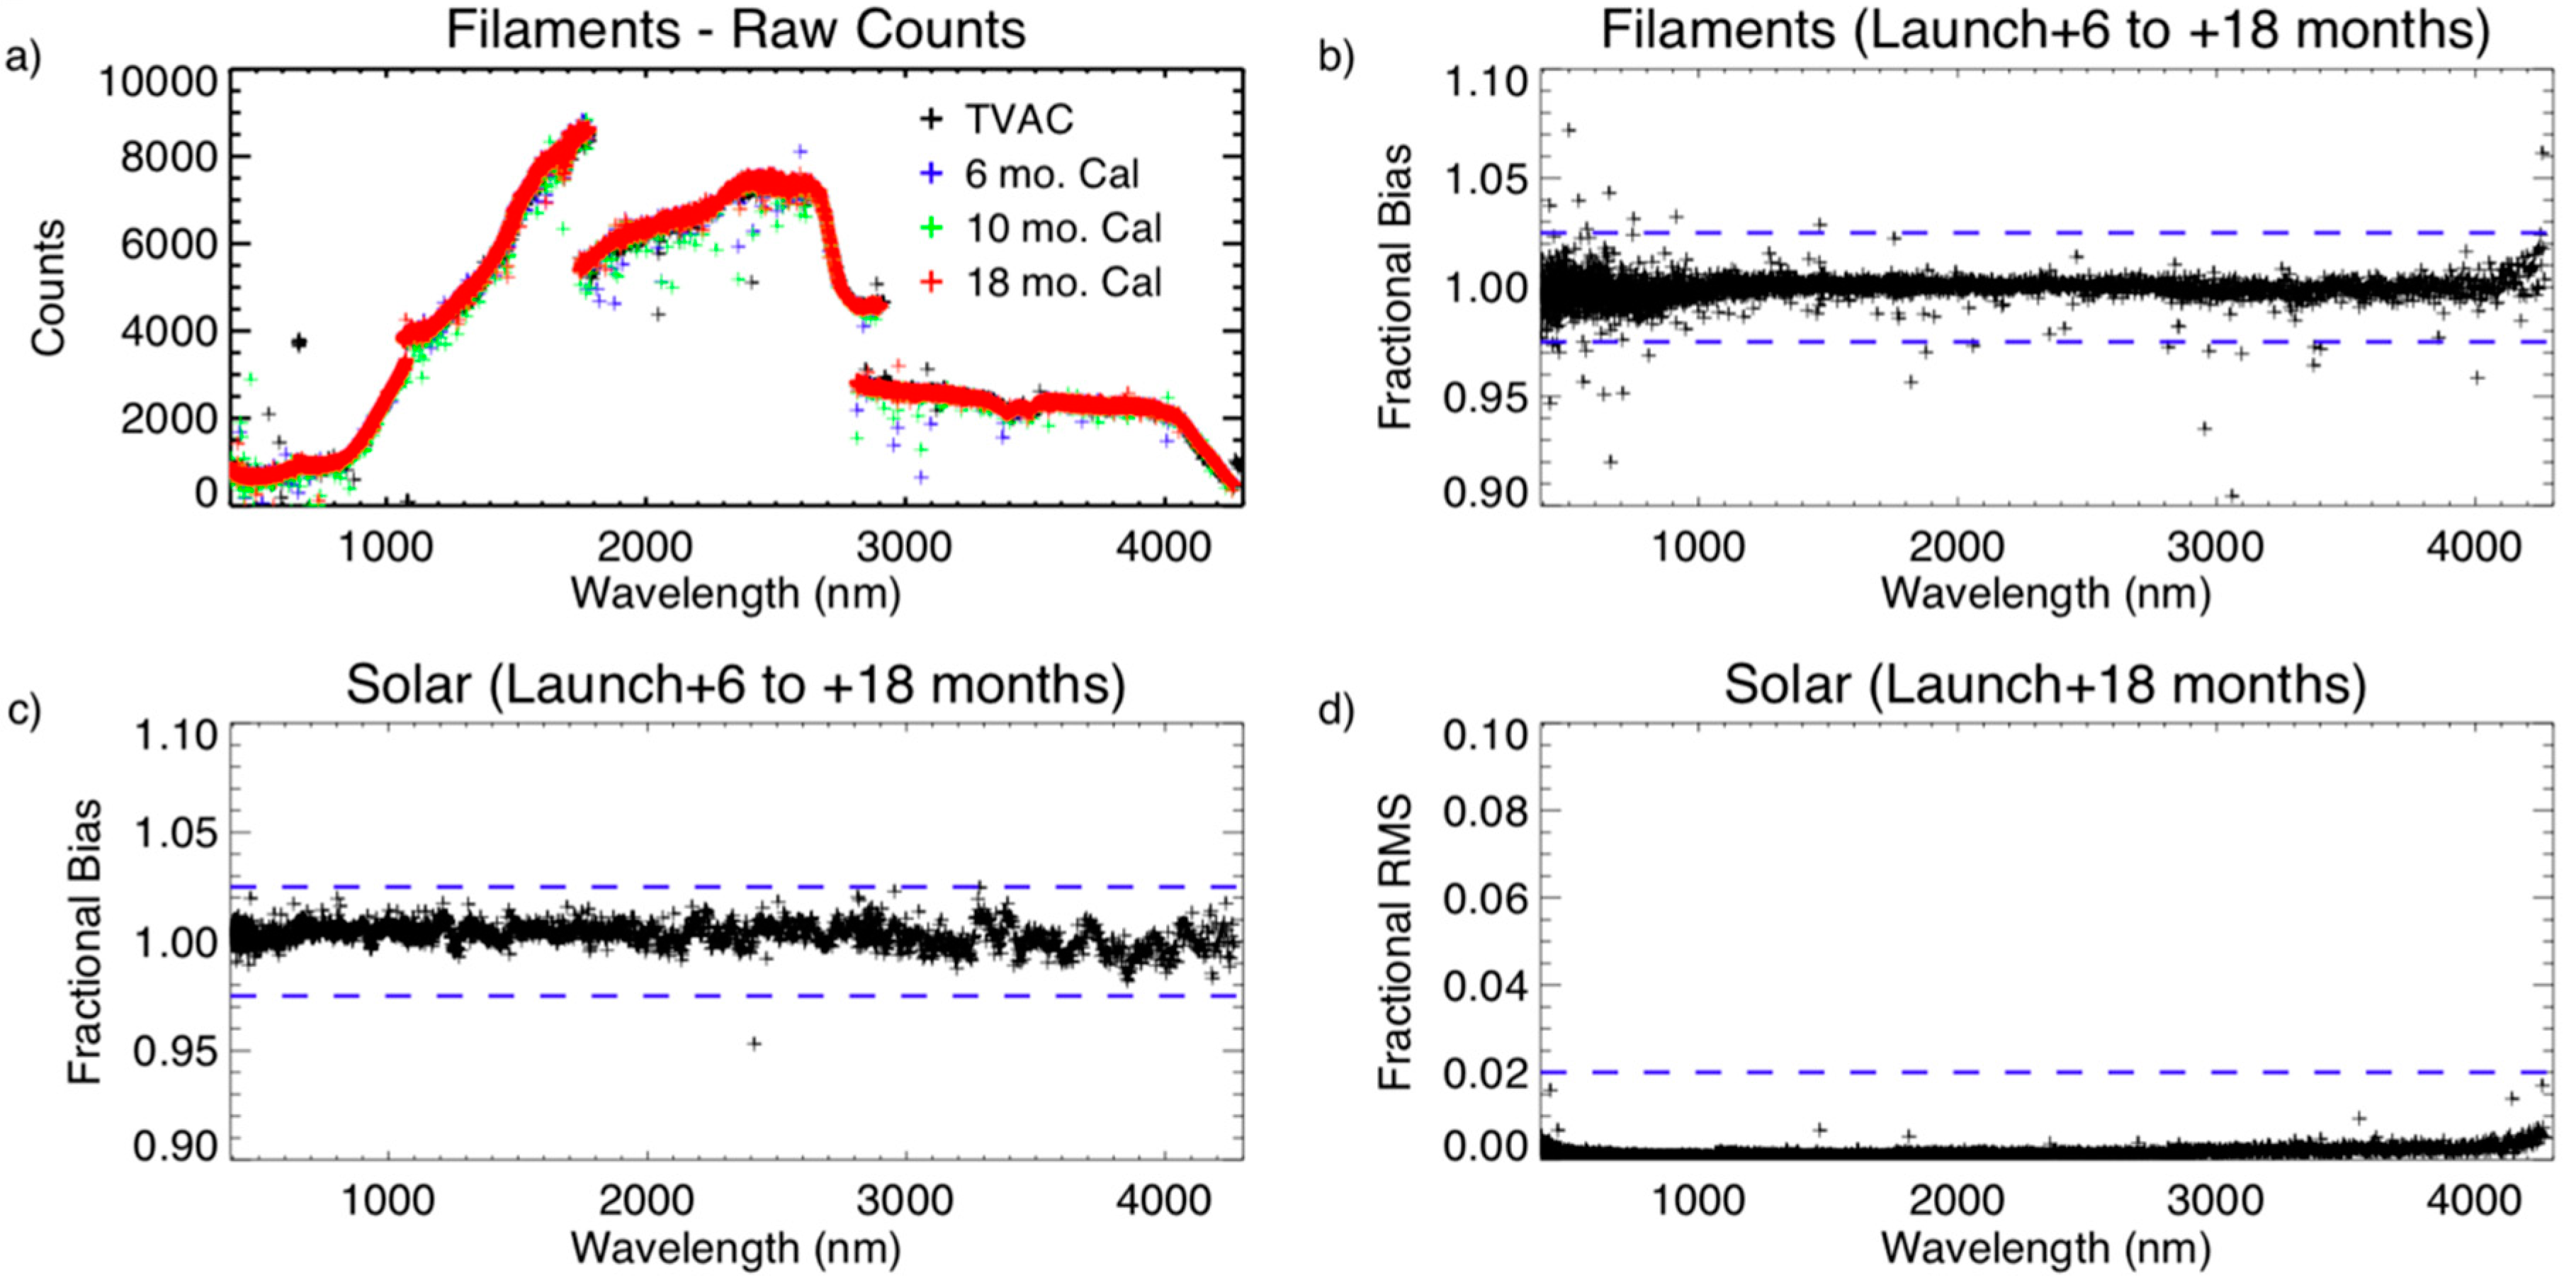
As mentioned above, OVIRS has a requirement for radiometric stability (±2.5%) and SNR performance (>50). Instrument radiometric stability has been stable to better than ±1% from TVAC through EGA, based on filament measurements, as can be seen in Figure 3. Figure 3 also shows an example of the measured flight radiometric stability from solar calibrations. As the solar spectra approximate the Bennu signal, the measured SNR of >100 also exceeds the requirement at all wavelengths.

4. Conclusions

OVIRS radiometric calibration coefficients and wavelength maps were determined before instrument delivery and launch. Internal filament sources have shown no changes post-launch and radiometric stability is ±1% in the 18 months since launch, exceeding the ±2.5% requirement. Solar data show that the SNR response also exceeds the requirement by a factor of two. Flight spectra obtained during the September 2017 Earth flyby were used to refine the wavelength map, and data acquired by other Earth-orbiting satellites were used to cross-calibrate the OVIRS absolute radiometric response, particularly below 2 μm. Further investigation of flight data will improve the calibration coefficients in the future.

Author Contributions

Conceptualization, D.C.R., A.A.S., D.S.L., and A.L.; investigation, D.C.R., D.S.L., A.A.S.; methodology, A.A.S., G.W.; software, A.L. and A.A.S.; validation, A.A.S., N.G., R.G.C., G.W.; writing and original draft preparation, A.A.S.; writing, review and editing, D.C.R., D.S.L., N.G., R.G.C., A.L.; project administration, D.S.L.; funding acquisition, D.S.L.; data curation, A.L., A.A.S., D.S.L.

Funding

This research was funded by the NASA OSIRIS-REx Project. R.C.G. was supported by an appointment to the NASA Postdoctoral Program at the NASA Goddard Space Flight Center, administered by the Universities Space Research Association under contract with NASA.

Conflicts of Interest

The authors declare no conflicts of interest.

References

  1. Lauretta, D.S.; Bartels, A.E.; Barucci, M.A.; Bierhaus, E.B.; Binzel, R.P.; Bottke, W.F.; Campins, H.; Chesley, S.R.; Clark, B.C.; Clark, B.E.; et al. The osiris-rex target asteroid (101955) bennu: Constraints on its physical, geological, and dynamical nature from astronomical observations. Meteorit. Planet. Sci. 2014, 50, 834–849. [Google Scholar] [CrossRef]
  2. Beletic, J.W.; Blank, R.; Gulbransen, D.; Lee, D.; Loose, M.; Piquette, E.C.; Sprafke, T.; Tennant, W.E.; Zandian, M.; Zino, J. Teledyne Imaging Sensors: Infrared imaging technologies for Astronomy & Civil Space. In Proceedings of the SPIE: High Energy, Optical, and Infrared Detectors for Astronomy III, Bellingham, WA, USA, 22 July 2008; Volume 70210H. [Google Scholar] [CrossRef]
  3. Reuter, D.C.; Simon, A.A.; Hair, J.; Lunsford, A.; Manthripragada, S.; Bly, V.; Bos, B.; Brambora, C.; Caldwell, E.; Casto, G.; et al. The OSIRIS-REx Visible and InfraRed Spectrometer (OVIRS): Spectral Maps of the Asteroid Bennu. Space Sci. Rev. 2018, 214, 54. [Google Scholar] [CrossRef] [Green Version]
  4. Montenaro, M.; Lunsford, A.; Tesfaye, Z.; Wenny, B.; Reuter, D. Radiometric Calibration Methodology of the Landsat 8 Thermal Infrared Sensor. Remote Sens. 2014, 6, 8803–8821. [Google Scholar] [CrossRef] [Green Version]
  5. Berk, A.; Conforti, P.; Kennett, R.; Perkins, T.; Hawes, F.; van den Bosch, J. MODTRAN6: A major upgrade of the MODTRAN radiative transfer code. In Proceedings of the SPIE 9088: Algorithms and Technologies for Multispectral, Hyperspectral, and Ultraspectral Imagery XX, Bellingham, WA, USA, 13 June 2014; Volume 90880H. [Google Scholar] [CrossRef]
  6. Xiong, X.; Barnes, W. An overview of MODIS radiometric calibration and characterization. Adv. Atmos. Sci. 2006, 23, 69–79. [Google Scholar] [CrossRef]
  7. Chen, L.; Zheng, P.; Lv, J.; Xu, N.; Hu, X. Radiometric calibration evaluation for RSBs of Suomi-NPP/VIIRS and Aqua/MODIS based on the 2015 Dunhuang Chinese Radiometric Calibration Site in situ measurements. Int. J. Remote Sens. 2017, 38, 5640–5656. [Google Scholar] [CrossRef]
  8. Geogdzhayev, I.V.; Marshak, A. Calibration of the DSCOVR EPIC visible and NIR channels using MODIS Terra and Aqua data and EPIC lunar observations. Atmos. Meas. Tech. 2018, 11, 359–368. [Google Scholar] [CrossRef] [Green Version]
Figure 1. (a) Mechanical drawing of the Origins, Spectral Interpretation, Resource Identification, Security–Regolith Explorer (OSIRIS-REx) Visible and Infrared Spectrometer (OVIRS) instrument with external features labeled. (b) Internal optical elements and light path (orange) (both reproduced from Reuter et al. (2018)). Light enters either the primary aperture (green) or the solar calibrator aperture (purple), which scatters multiple light beams off a nickel mesh and into the main light path. Not visible are the internal filament sources, which are adjacent to the secondary mirror.
Remotesensing 10 01486 g001
Figure 2. Calibrated OVIRS Earth spectra acquired near the OSIRIS-REx closest approach. The blue line represents a cloud-free view over the ocean, and the black line is a nearby footprint that contained cloud cover. Model atmospheres from MODTRAN (green and red lines) are shown for comparison.
Remotesensing 10 01486 g002
Figure 3. OVIRS radiometric stability and signal-to-noise ratio (SNR) performance from thermal vacuum (TVAC) and flight data. (a) Filament spectra from TVAC are identical to flight spectra (colored points), and improvements have been made in bad pixel identification. The fractional bias for the (b) filaments and (c) solar spectra from observations taken at launch + 6 and + 18 months show stability to within ±1% (dashed lines show the ±2.5% requirement). (d) The fractional root mean square (RMS) within the L + 18-month solar spectra indicate that the signal to noise ratio is ~100, better than the required SNR = 50 (dashed line).
Remotesensing 10 01486 g003
Table 1. Earth Gravity Assist (EGA) data.
Sequence (Target)Min. Range to Target (106 km)Phase Angle (°)Apparent Diameter (mrad)Data Acquired
22 September (Earth)0.1520-2484.9N-S, E-W scans,
8-mrad step between scans
25 September (Earth)1.37329.3N-S, E-W scans,
8-mrad step between scans
25 September (Moon)1.17423.0N-S, E-W scans,
2-mrad step between scans
29 September (Earth)2.90334.4N-S, E-W scans,
4-mrad step between scans
2 October (Earth)5.09352.54 × 4 mosaic,
1.8-mrad step between positions
Table 2. Wavelengths in each filter segment.
FilterRows (CDS Array)JDSU SuppliedIn Flight MeasurementResolving Power *
(λ/Δλ)
Start λ (μm)
Column 1
End λ (μm)
Column 512
Start λ (μm)
Column 1
End λ (μm)
Column 512
RequiredJDSU
Dark1 to 20----
1b21 to 521.0860.6541.0900.652>125136–156
453 to 844.3042.8784.2842.850>350
>200
360–385
330–360
385 to 1162.9981.0822.9361.764>200240–264
2117 to 1481.7921.0761.8011.075>150177–195
1a149 to 1800.6580.3970.6700.392>125139–176
* For LVF4, Rp > 350 is required from 2.9 to 3.6 μm, and > 200 from 3.6 to 4.3 μm.

