Detecting Building Edges from High Spatial Resolution Remote Sensing Imagery Using Richer Convolution Features Network


Abstract
:
1. Introduction
- The dataset used in network training is natural image rather than remote sensing imagery. Remote sensing imagery has some features that natural images do not possess such as resolution information [15] and spatial autocorrelation.
- The remote sensing imagery has other superfluous objects in addition to the building. The network trained by the natural image cannot identify the edges of a certain object, so it is difficult to obtain the building edges directly through the pre-trained deep learning network.
2. Related Work
- Edge-driven methods. This category usually extracts line segments by low-level edge detection algorithm first, then, groups the building edges from the line segments based on various rules [16,17,18,19,20,21,22,23,24,25,26]. Those rules, for example, can be perceptual grouping [16,17,18,19], Graph structure theory [20,21], Markov random field models [22], geometry theory [23], circle detection [24], heuristic approach [25], and dense matching [26]. Additionally, a series of models [27,28,29,30] have been set up to directly detect the building edges. This kind of method, in comparison to the classical methods, can detect building edges more accurately, and avoid the boundaries of features in the building neighborhood such as streets and trees. Snake model [31], also called active contour model, was widely applied in fields of building edges detection [27,28,29]. The research in Garcin et al. [30] built a shape-model using Markov Object processes and a MCMC Algorithm, and this model used perspective of the whole building to detect the building.
- Region-driven methods. The building region feature and the edge feature are the important elements of the building description. Under certain circumstances, building edges can be converted from building region. Various classification strategies were utilized to extract building region, here are only a few classification strategies for HSRRS imagery:
- ⧫
- Object-based image analysis (OBIA) extraction method has gradually been accepted as an efficient method for extracting detailed information from HSRRS imagery [7,32,33,34,35,36,37,38,39]. For example, references [7,32,33,34,35,36,37] comprehensively used object-based image segmentation and various features of objects such as spectrum, texture, shape, and spatial relation to detect buildings. Due to the scale parameter has an important influence on OBIA, Guo et al. [38] proposed a parameter mining approach to mine parameter information for building extraction. In addition, Liu et al. [39] adopted the probabilistic Hough transform to delineate building region which extract by multi-scale object oriented classification, and result showed that with the boundary constraint, most rectangular building roofs can be correctly detected, extracted, and reconfigured.
- ⧫
- Extraction method based on deep learning is a long-standing problem in recent years [40,41,42,43,44,45,46,47,48]. References [40,41,42,43,44,45] designed an image segmentation using convolutional neural network, full convolutional network or other network, to effectively extract building region from imagery. The above research is still pixel-level-based, references [46,47,48] proposed superpixel-based convolution neural network (SML-CNN) model in hyperspectral image classification in which superpixels are taken as the basic analysis unit instead of pixels. Compared to other deep-learning-based methods, superpixel-based method gain promising classification results. Gao et al. [49] combined counter map with fully convolutional neural networks to offer a higher level of detection capabilities on image, which provided a new idea for building detection. In addition, constantly proposed theories, such as transfer hashing [50] and structured autoencoders [51] can also be introduced into this application field to solve problems, such as data sparsity and data mining.
- ⧫
- Auxiliary-information-based methods. Due to the complexity of the structure and surrounding environment of the building, many scholars have proposed the method of extracting the building by the shadow, stereoscopic aerial image or digital elevation model (DEM) data to assist the building extraction. Liow et al. [59] pioneering proposed a new idea of using shadow to extract buildings. Later, research in [59,60,61,62] proposed to identify and extract buildings based on the shadow features and graph based segmentation in high-resolution remote sensing imagery. In addition, local contrast in the image where shadow and building interdepend will be increase. Based on this principle, references [63,64] proposed PanTex method with gray level co-occurrence matrix contrast features, which is practically used to identify buildings and build-up areas. Hu et al. [65] used the shadow, shape, color features, similarity of angle between shade lines and so on multiple cues to extract buildings. In addition, stereo information can provide great convenience for the extraction of buildings information [5,66,67,68,69,70,71,72,73,74,75,76,77,78].
3. Methodology
3.1. Dataset Construction
- (1)
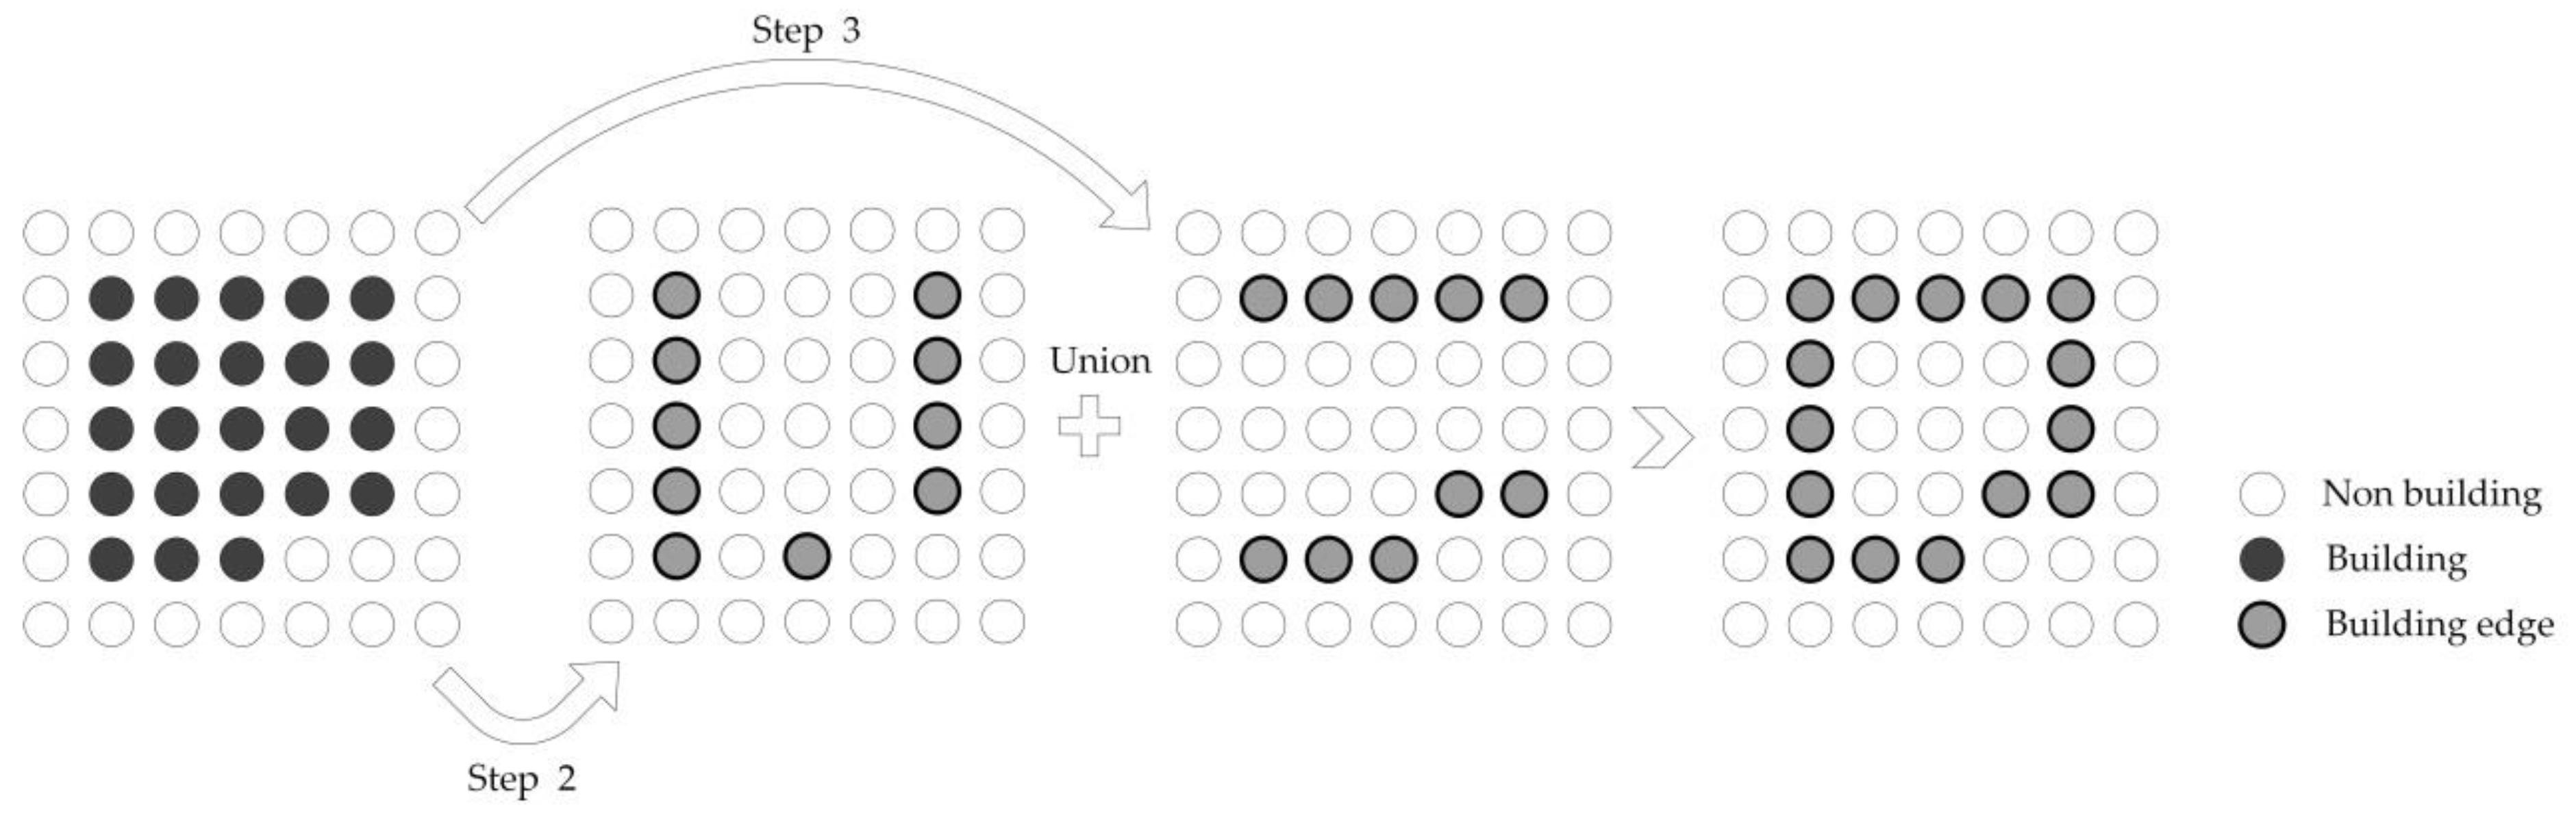
- Binarization of the building region map. Supposing the building pixel value is 1, and the non-building pixel is 0;
- (2)
- Generating an image with the same size as the original image, and all the pixel values are 0. Scanning the building region map row by row to find all pixels (marked as Pr) satisfying two conditions: the pixel value is 1, and the pixel value shifts from 1 to 0 or from 0 to 1. In the newly generated image, setting the pixel values at the same locations with Pr as 1. Thus, building edge pixels on each row are detected;
- (3)
- Generating an image with the same size as the original image, and all the pixel values are 0. Repeating step 2 to detect all building edge pixels on each column;
- (4)
- All building edge pixels on each row and each column are combined. Thus, the building edge is finally detected.
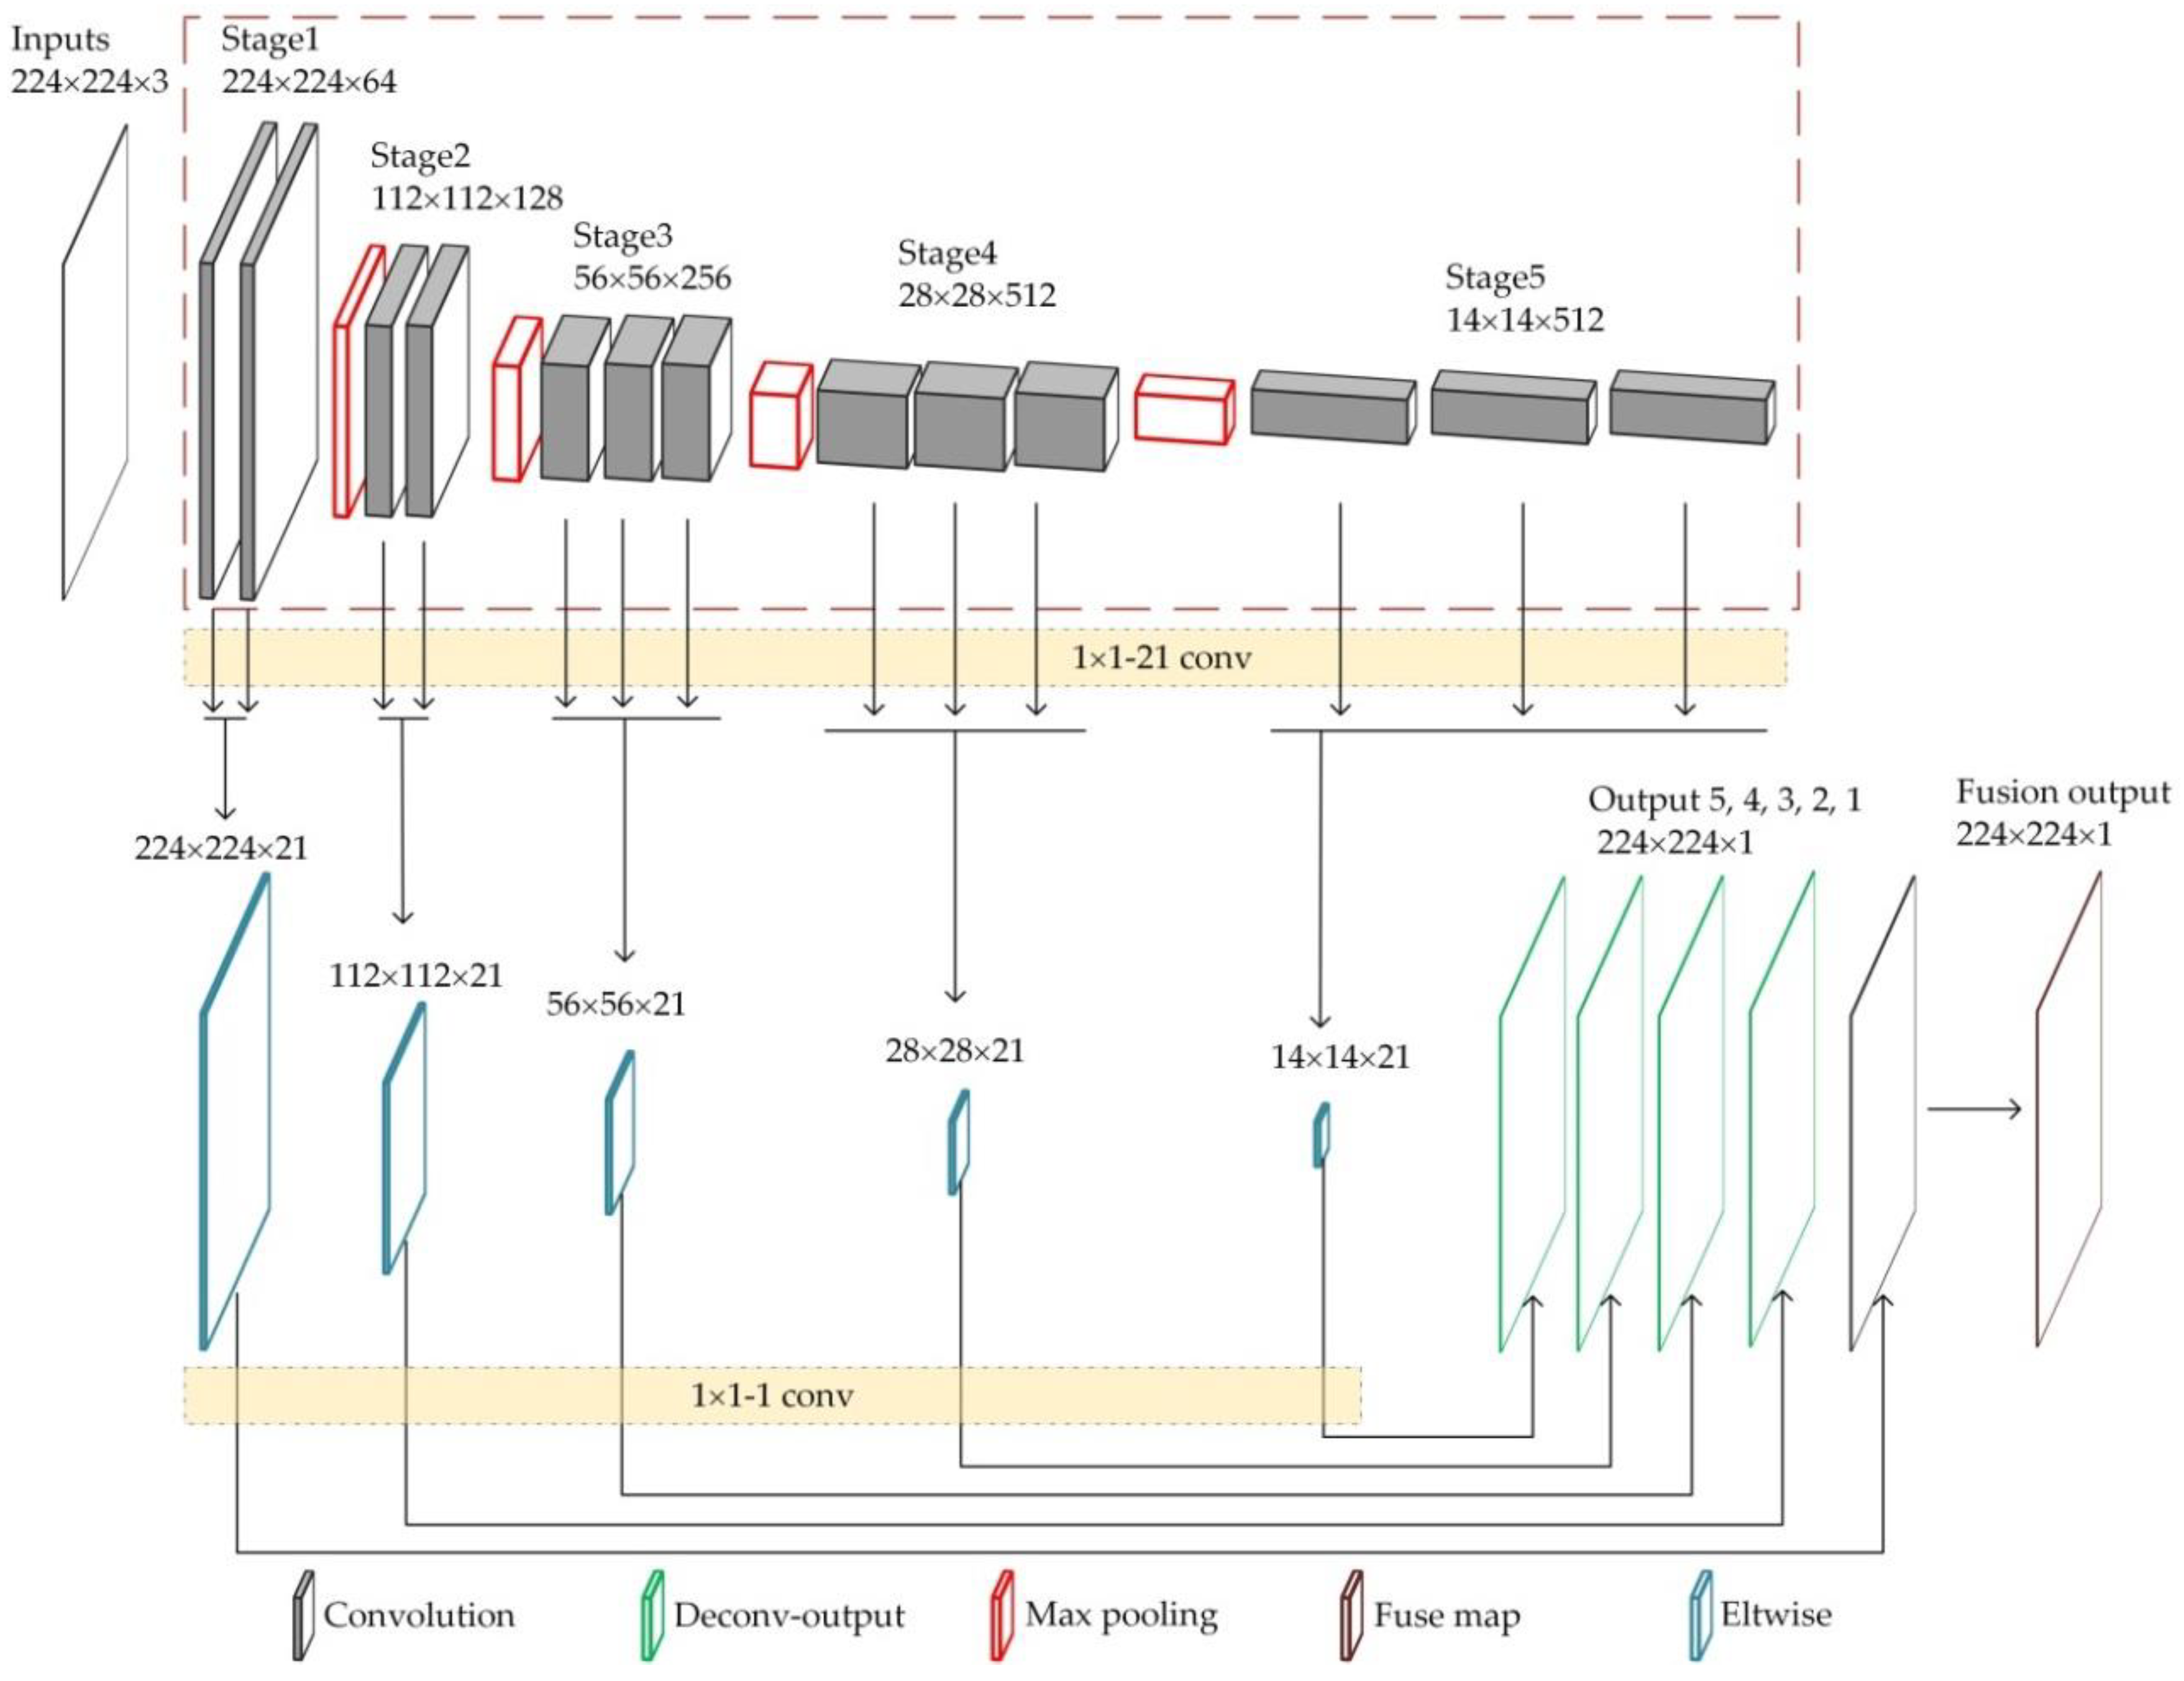
3.2. RCF Network
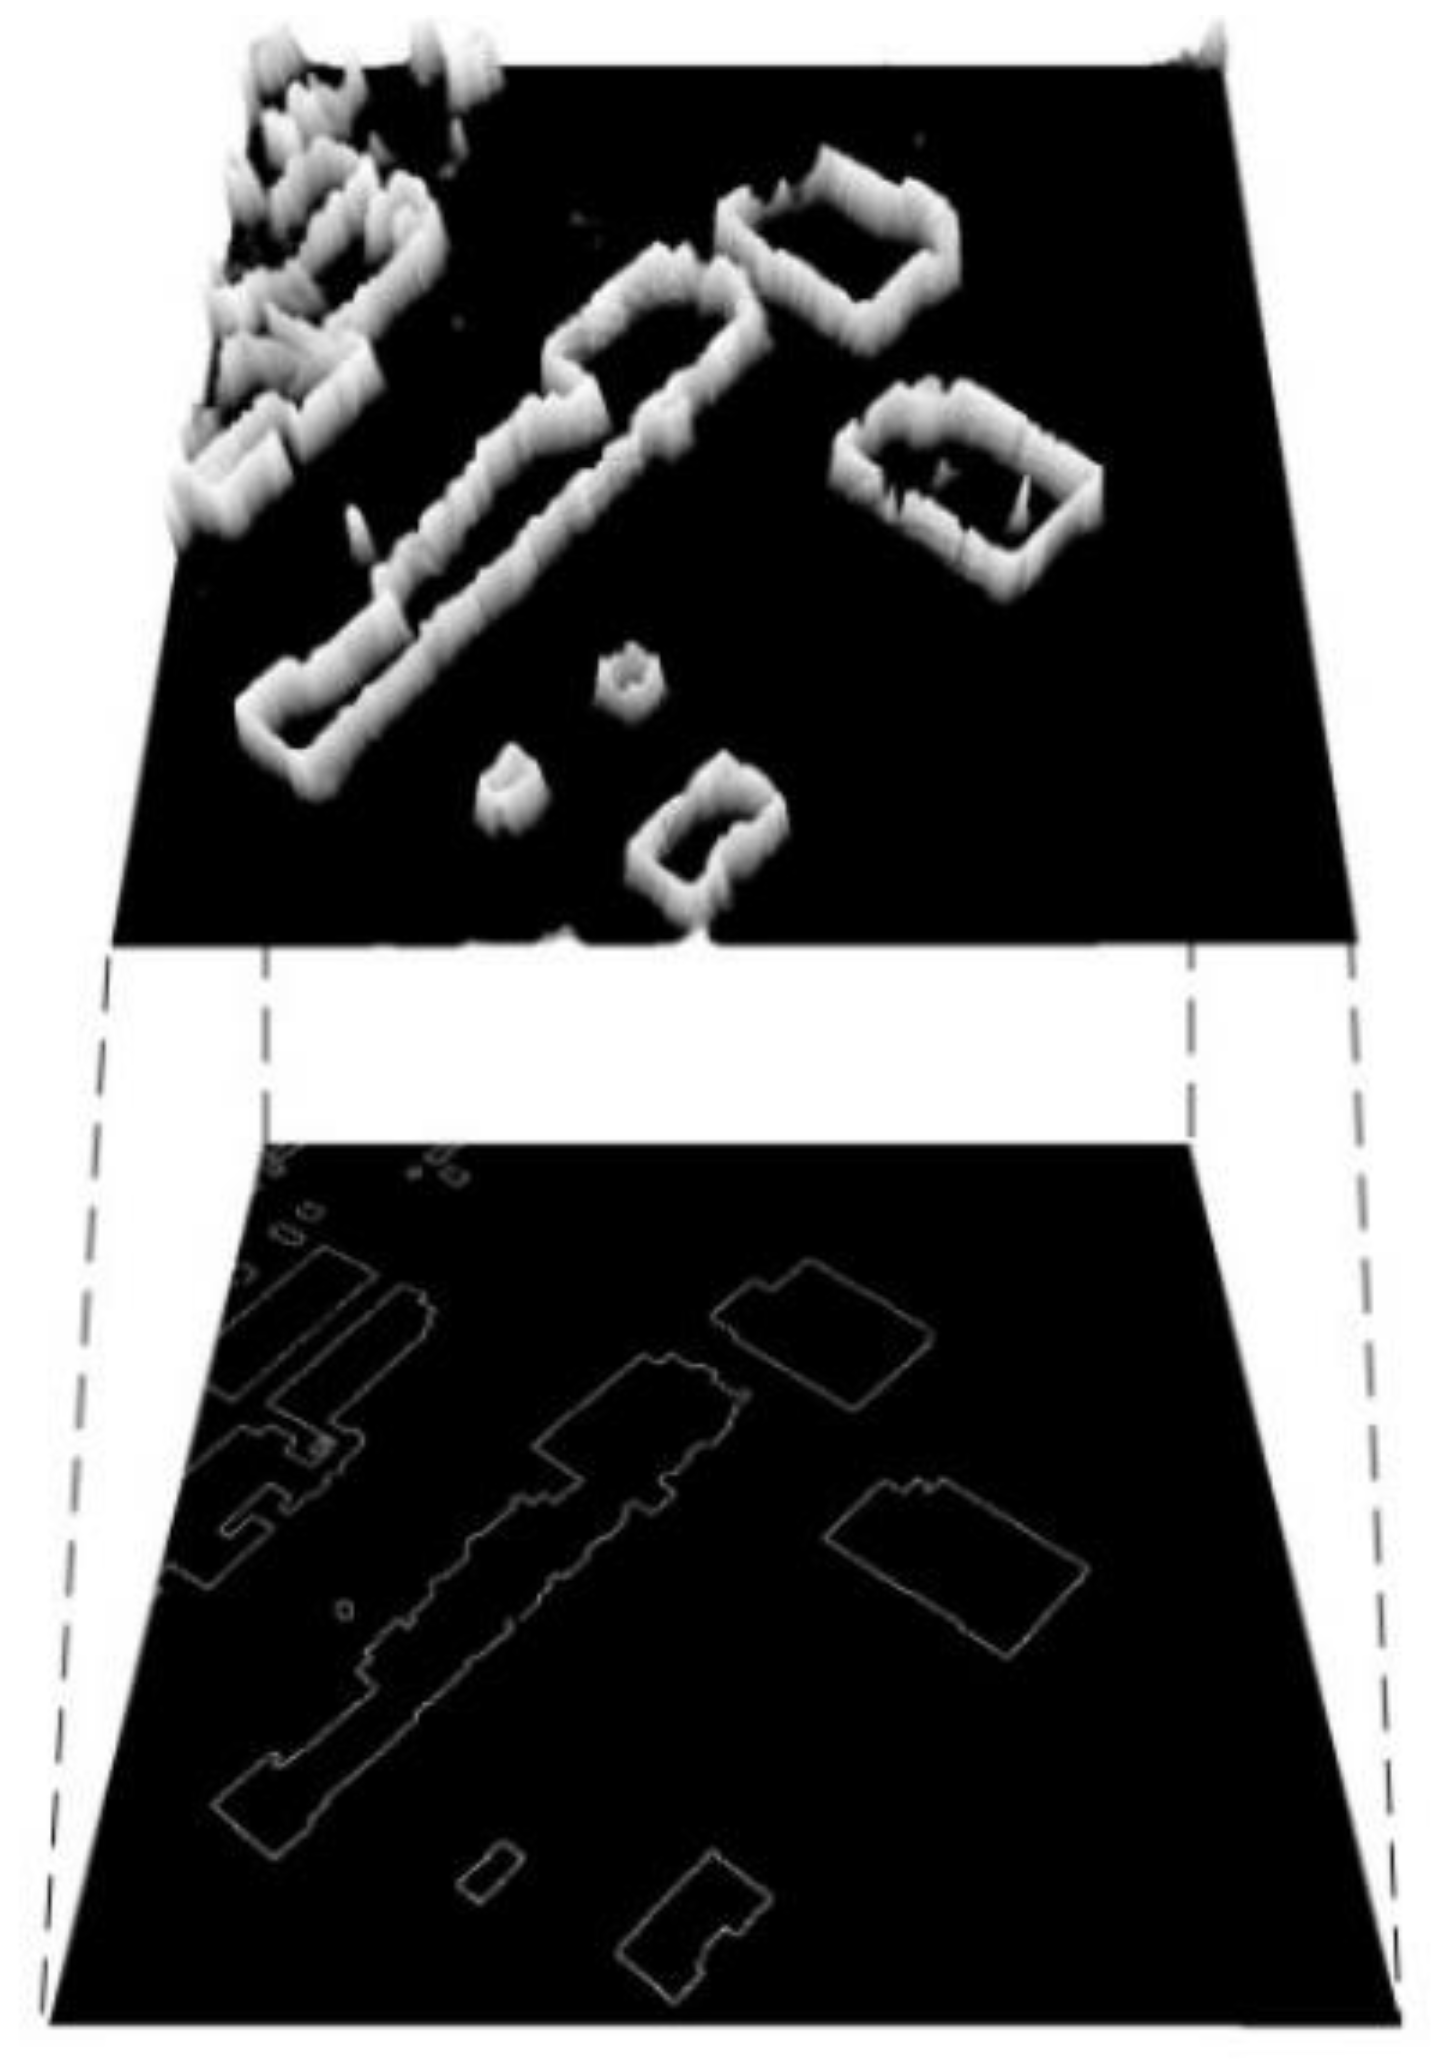
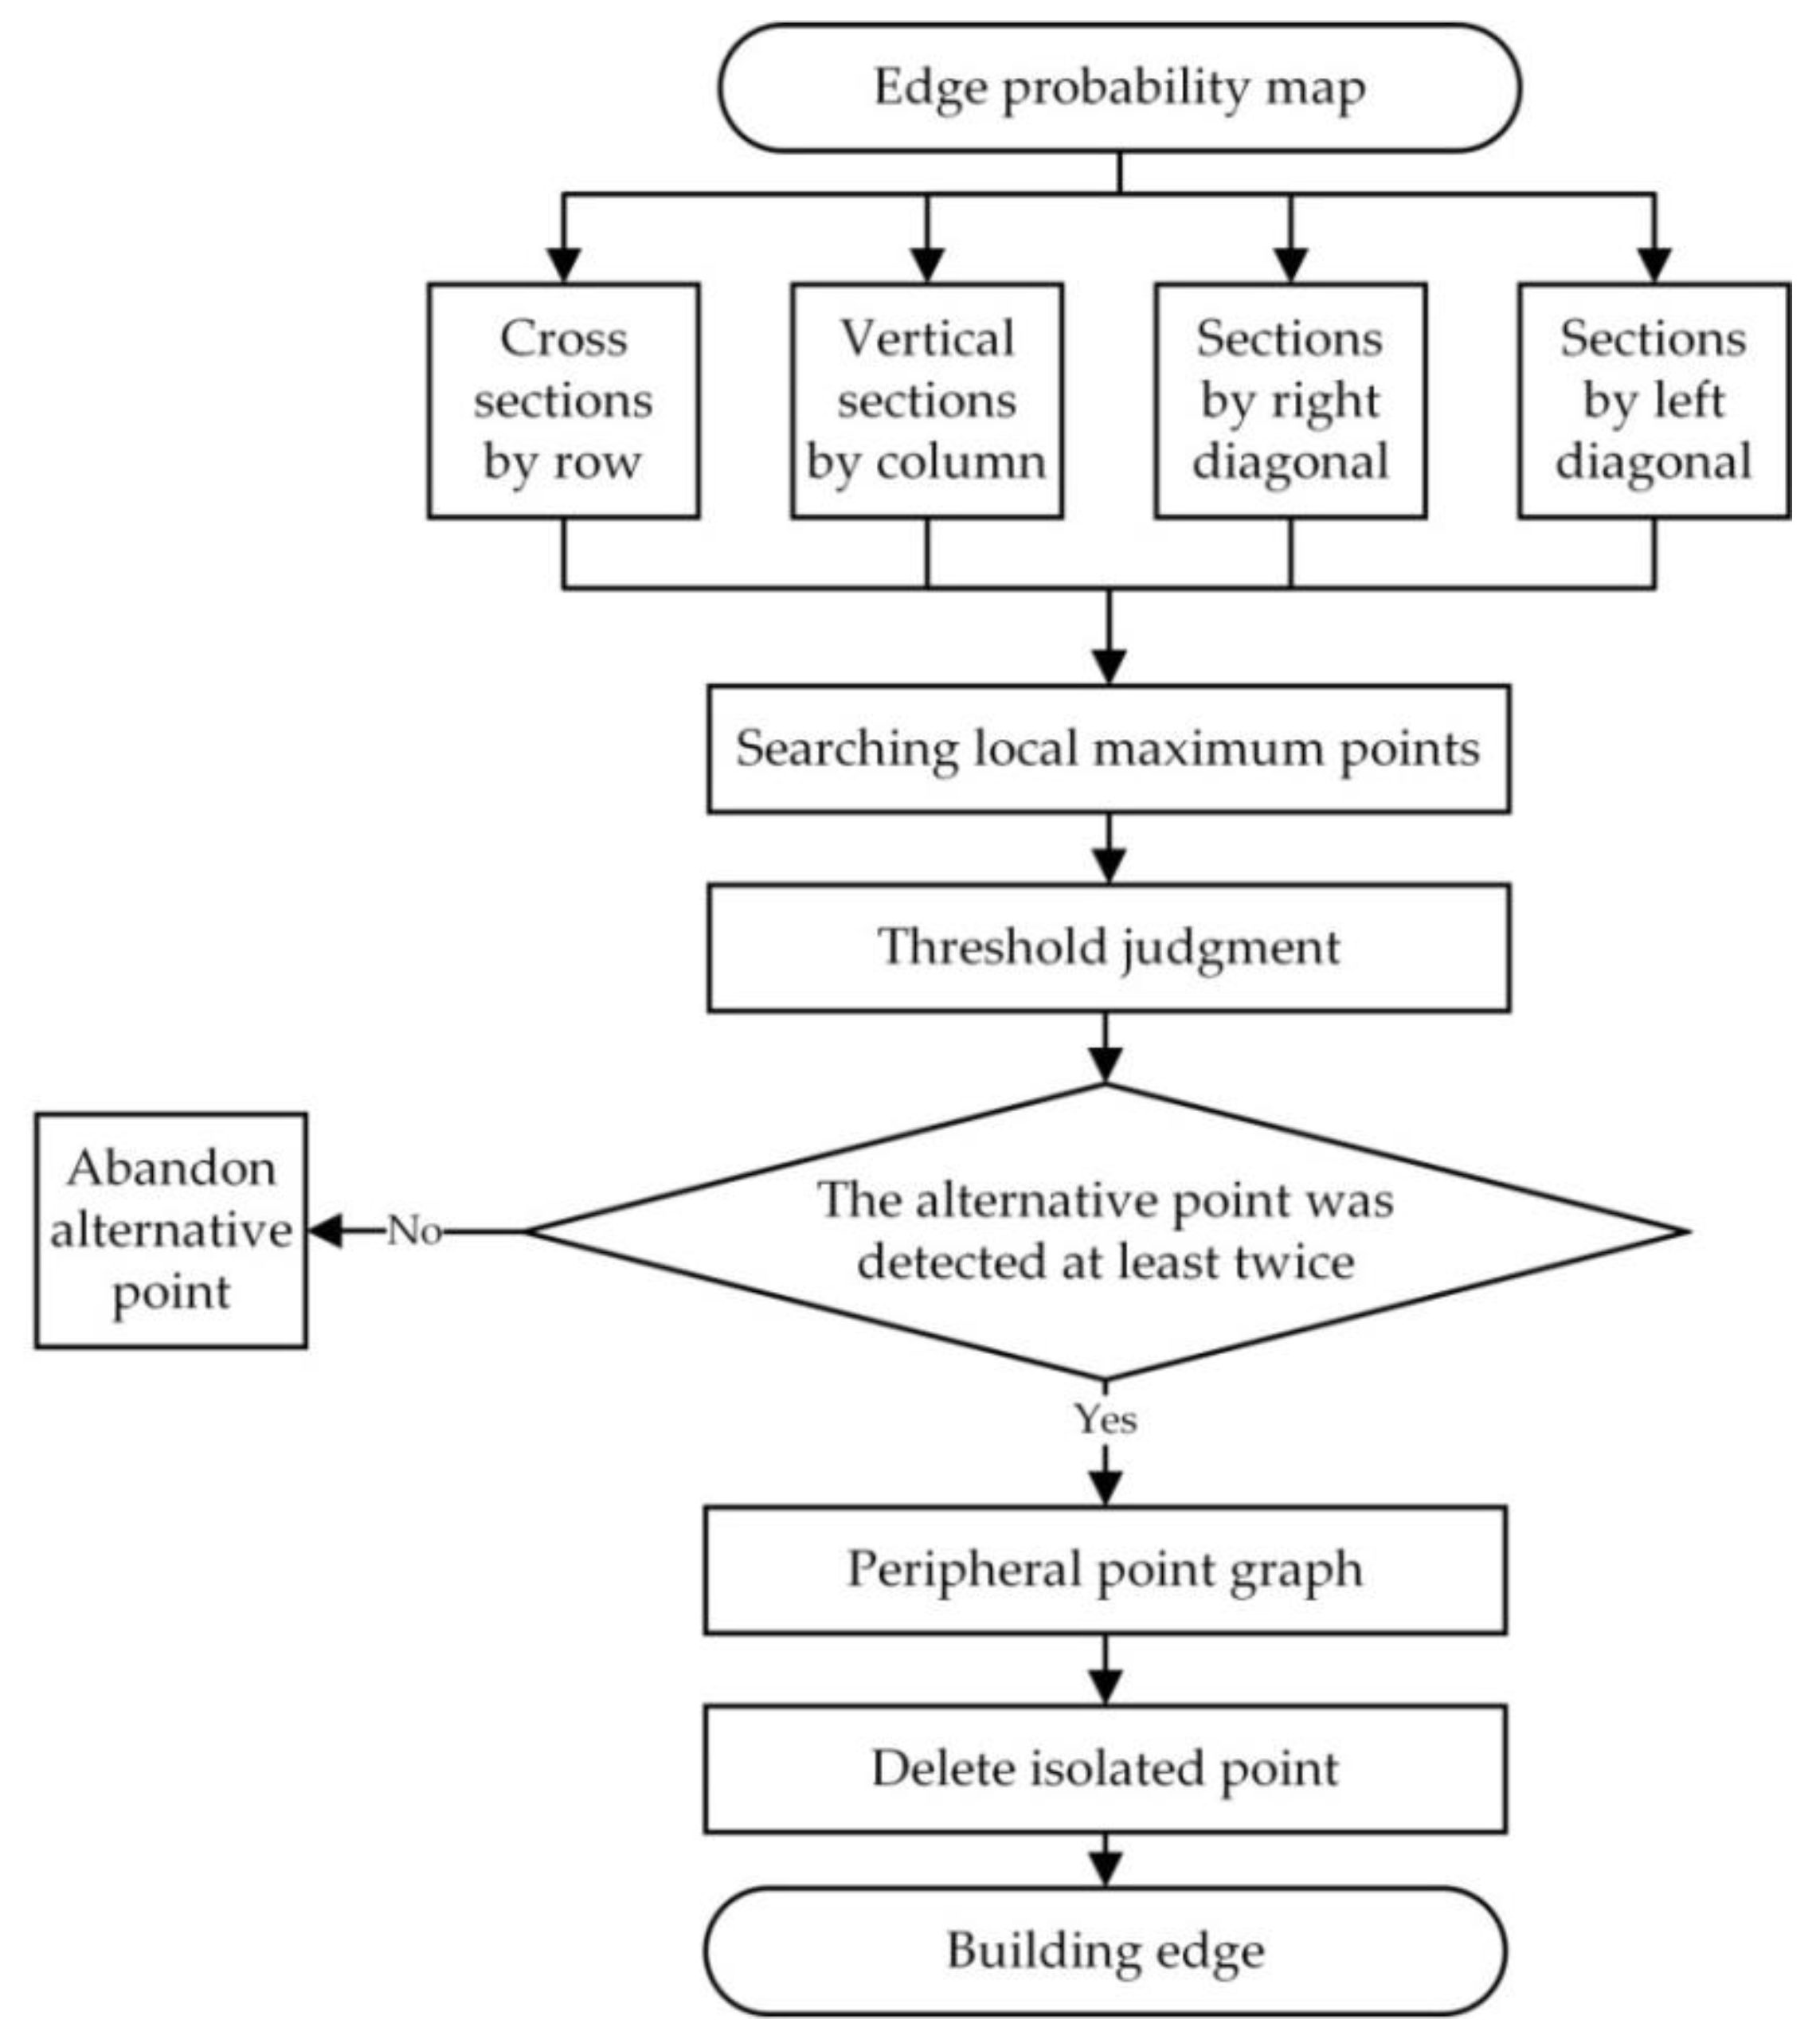
3.3. Refinement of Edge Probability Map
- (1)
- Scanning from four directions (vertical, horizontal, left diagonal, and right diagonal) to find the local maxima points as candidate points;
- (2)
- Setting a threshold to discard the candidate points whose probability is less than 0.5 (After many experiments, the highest accuracy is obtained under this threshold. For gray image, the threshold value is 120.);
- (3)
- Calculating the times that each candidate point is detected out. When a candidate point is detected at least twice, it is classified as an edge point;
- (4)
- Checking the edge points got by step (3) one by one. When there is no other edge point in an eight neighborhood, this point is determined as an isolated point and deleted;
- (5)
- Generating edge mask map based on the edge point map got by step (4) to refine the edge probability map and obtain the final edge refinement map.
4. Experiments and Analysis
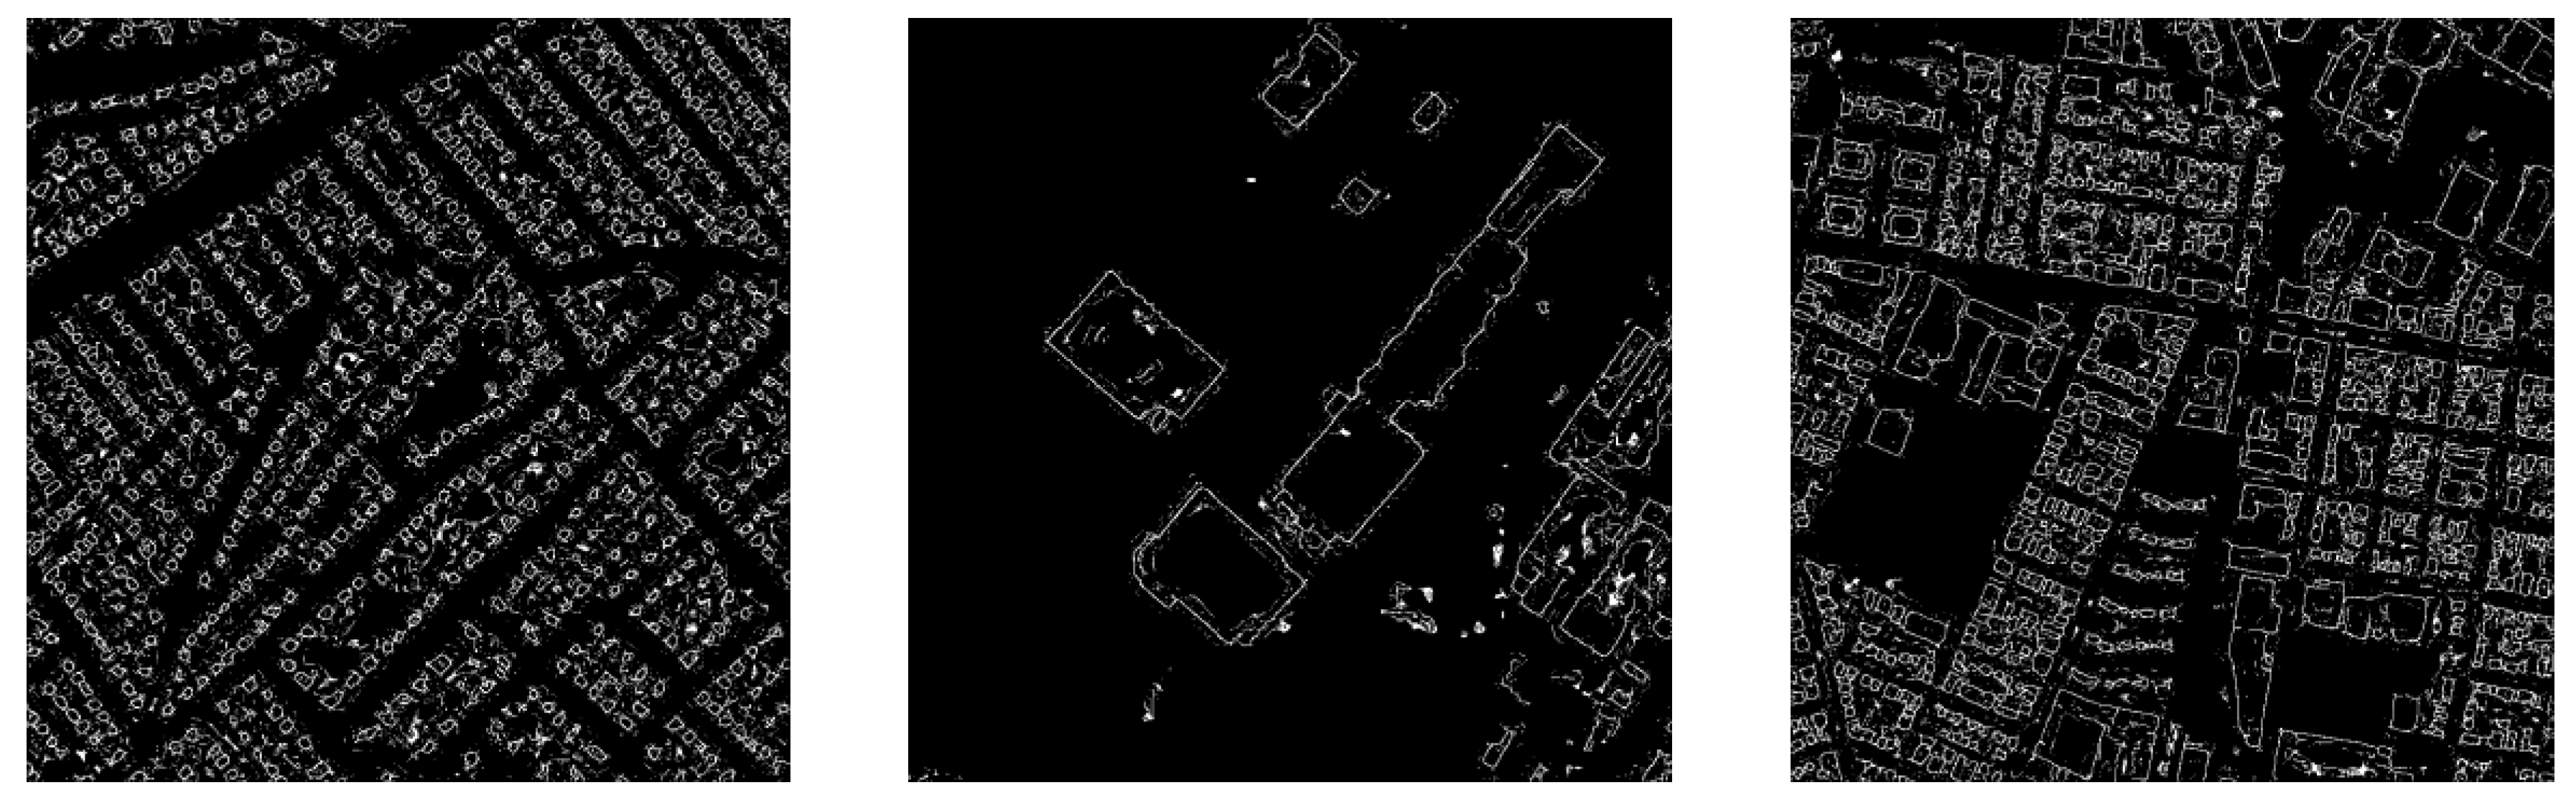
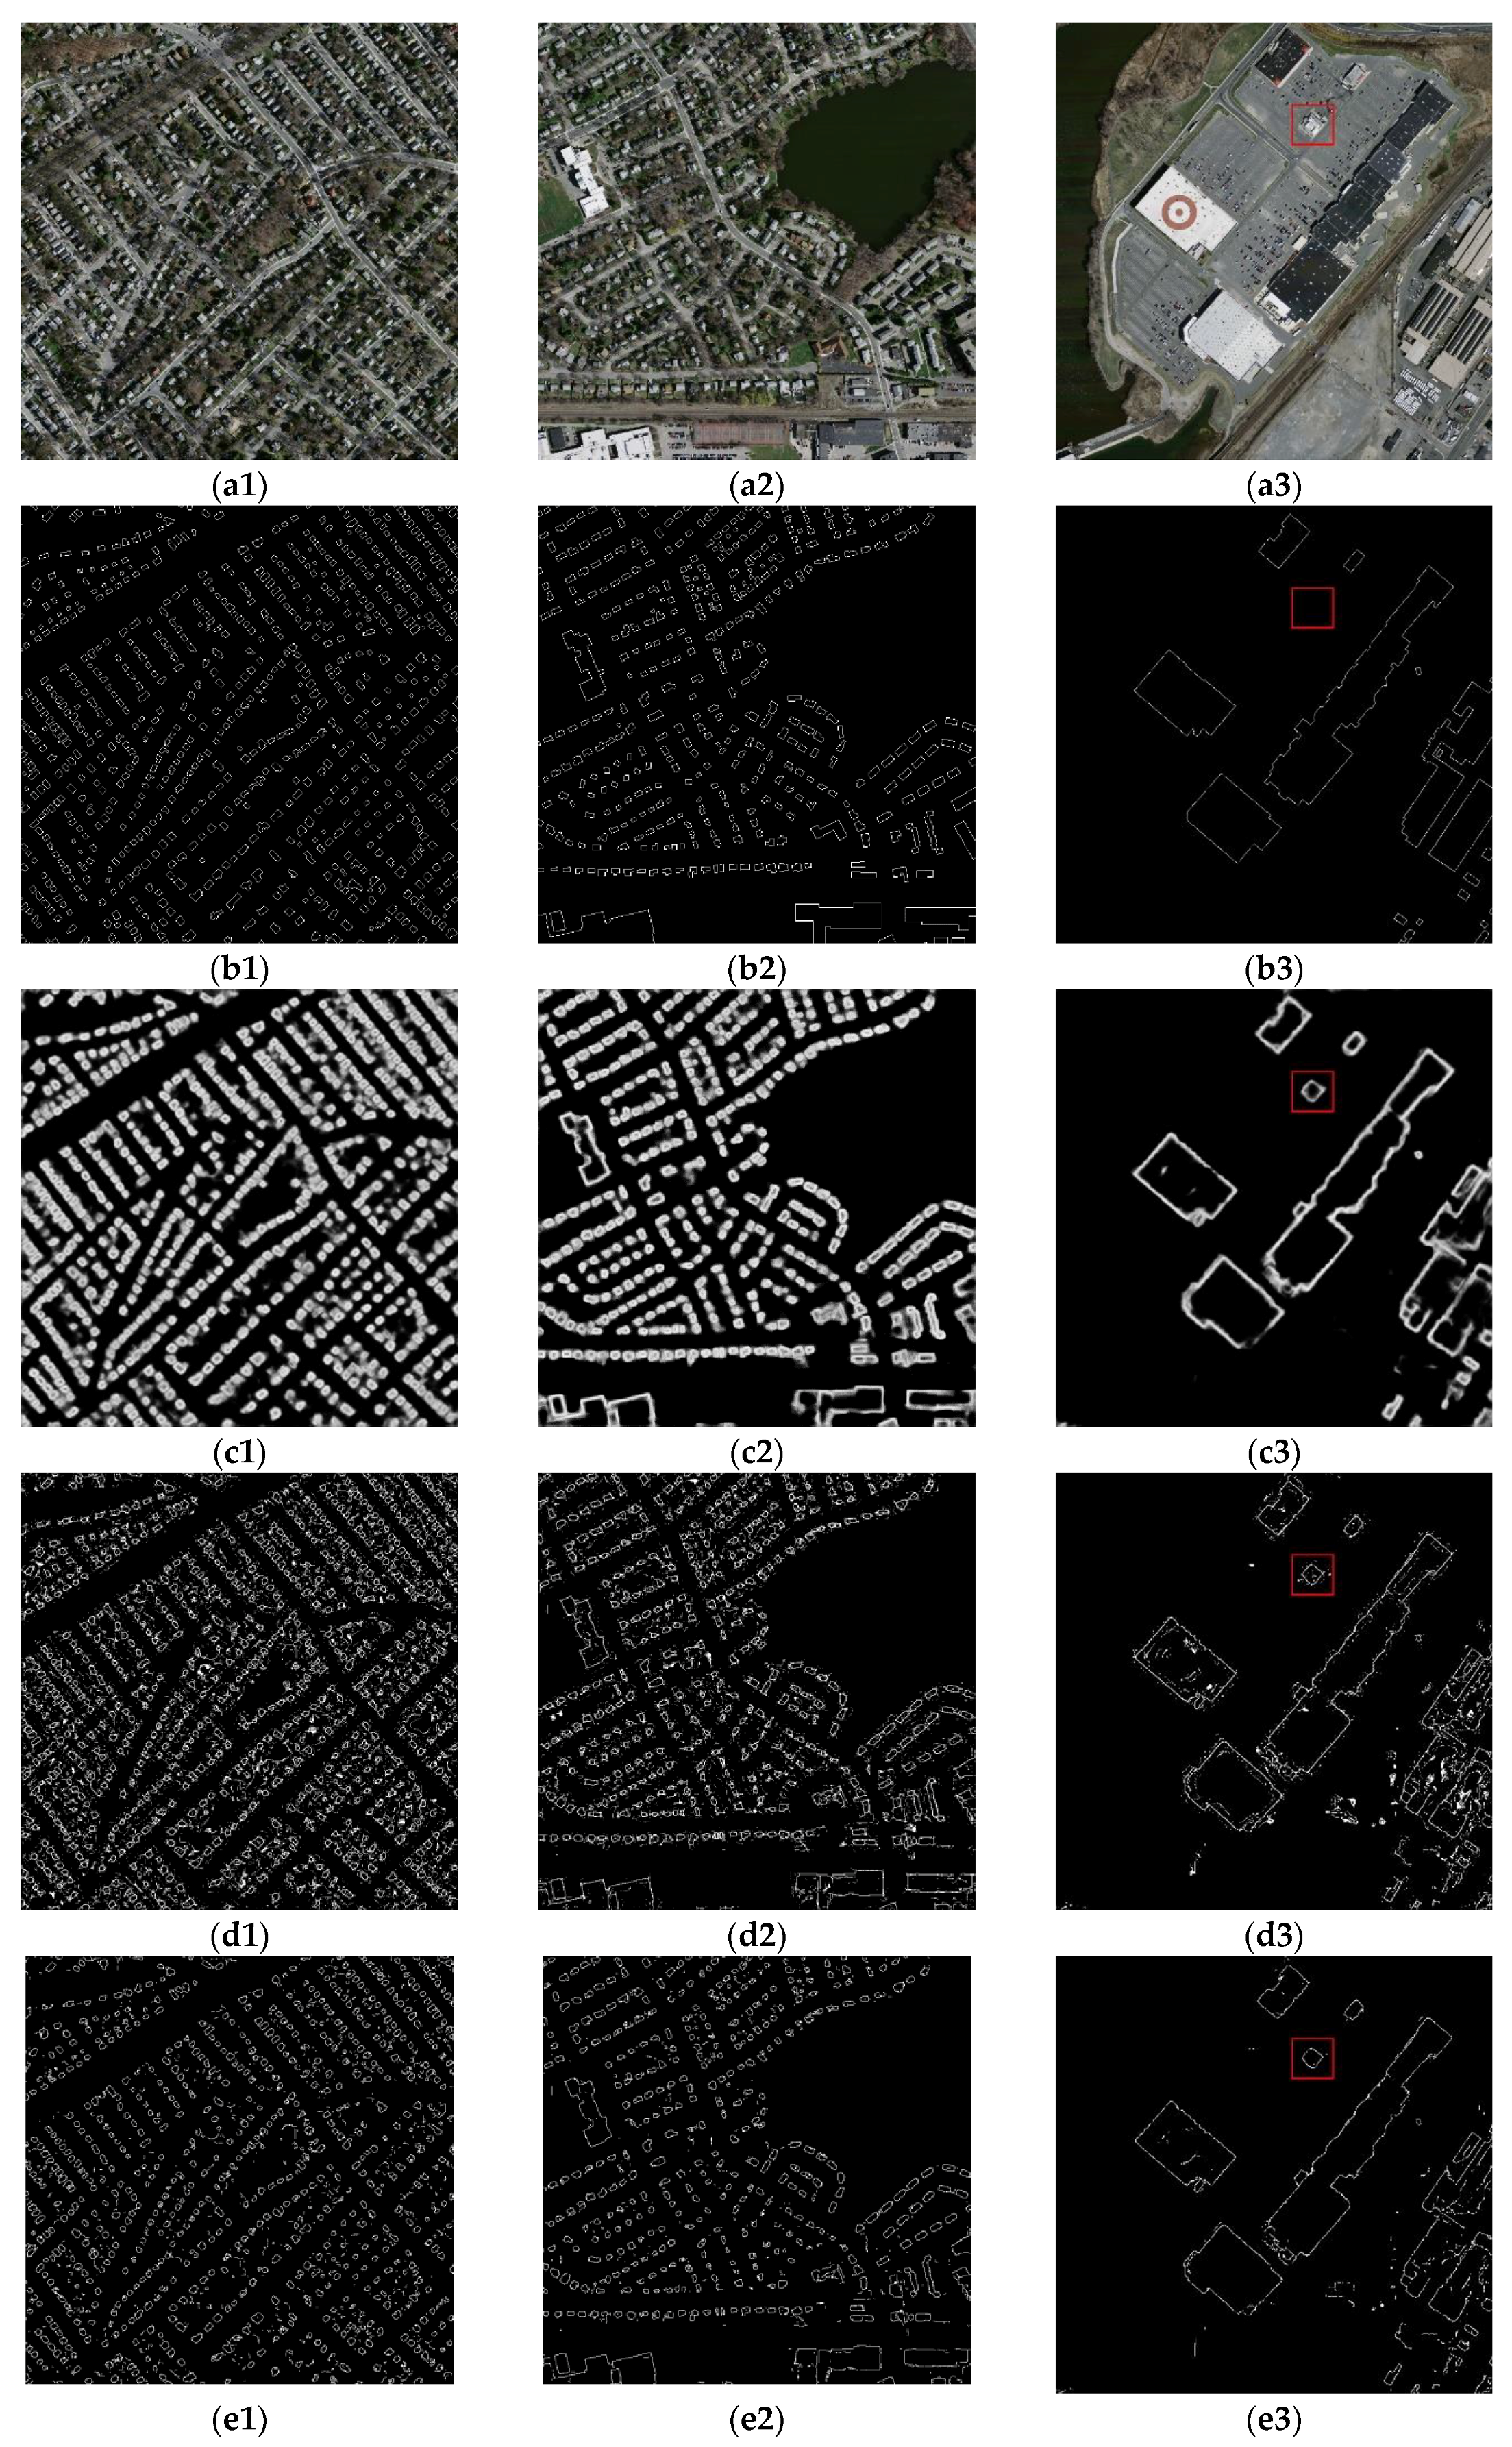
4.1. Experimental Results
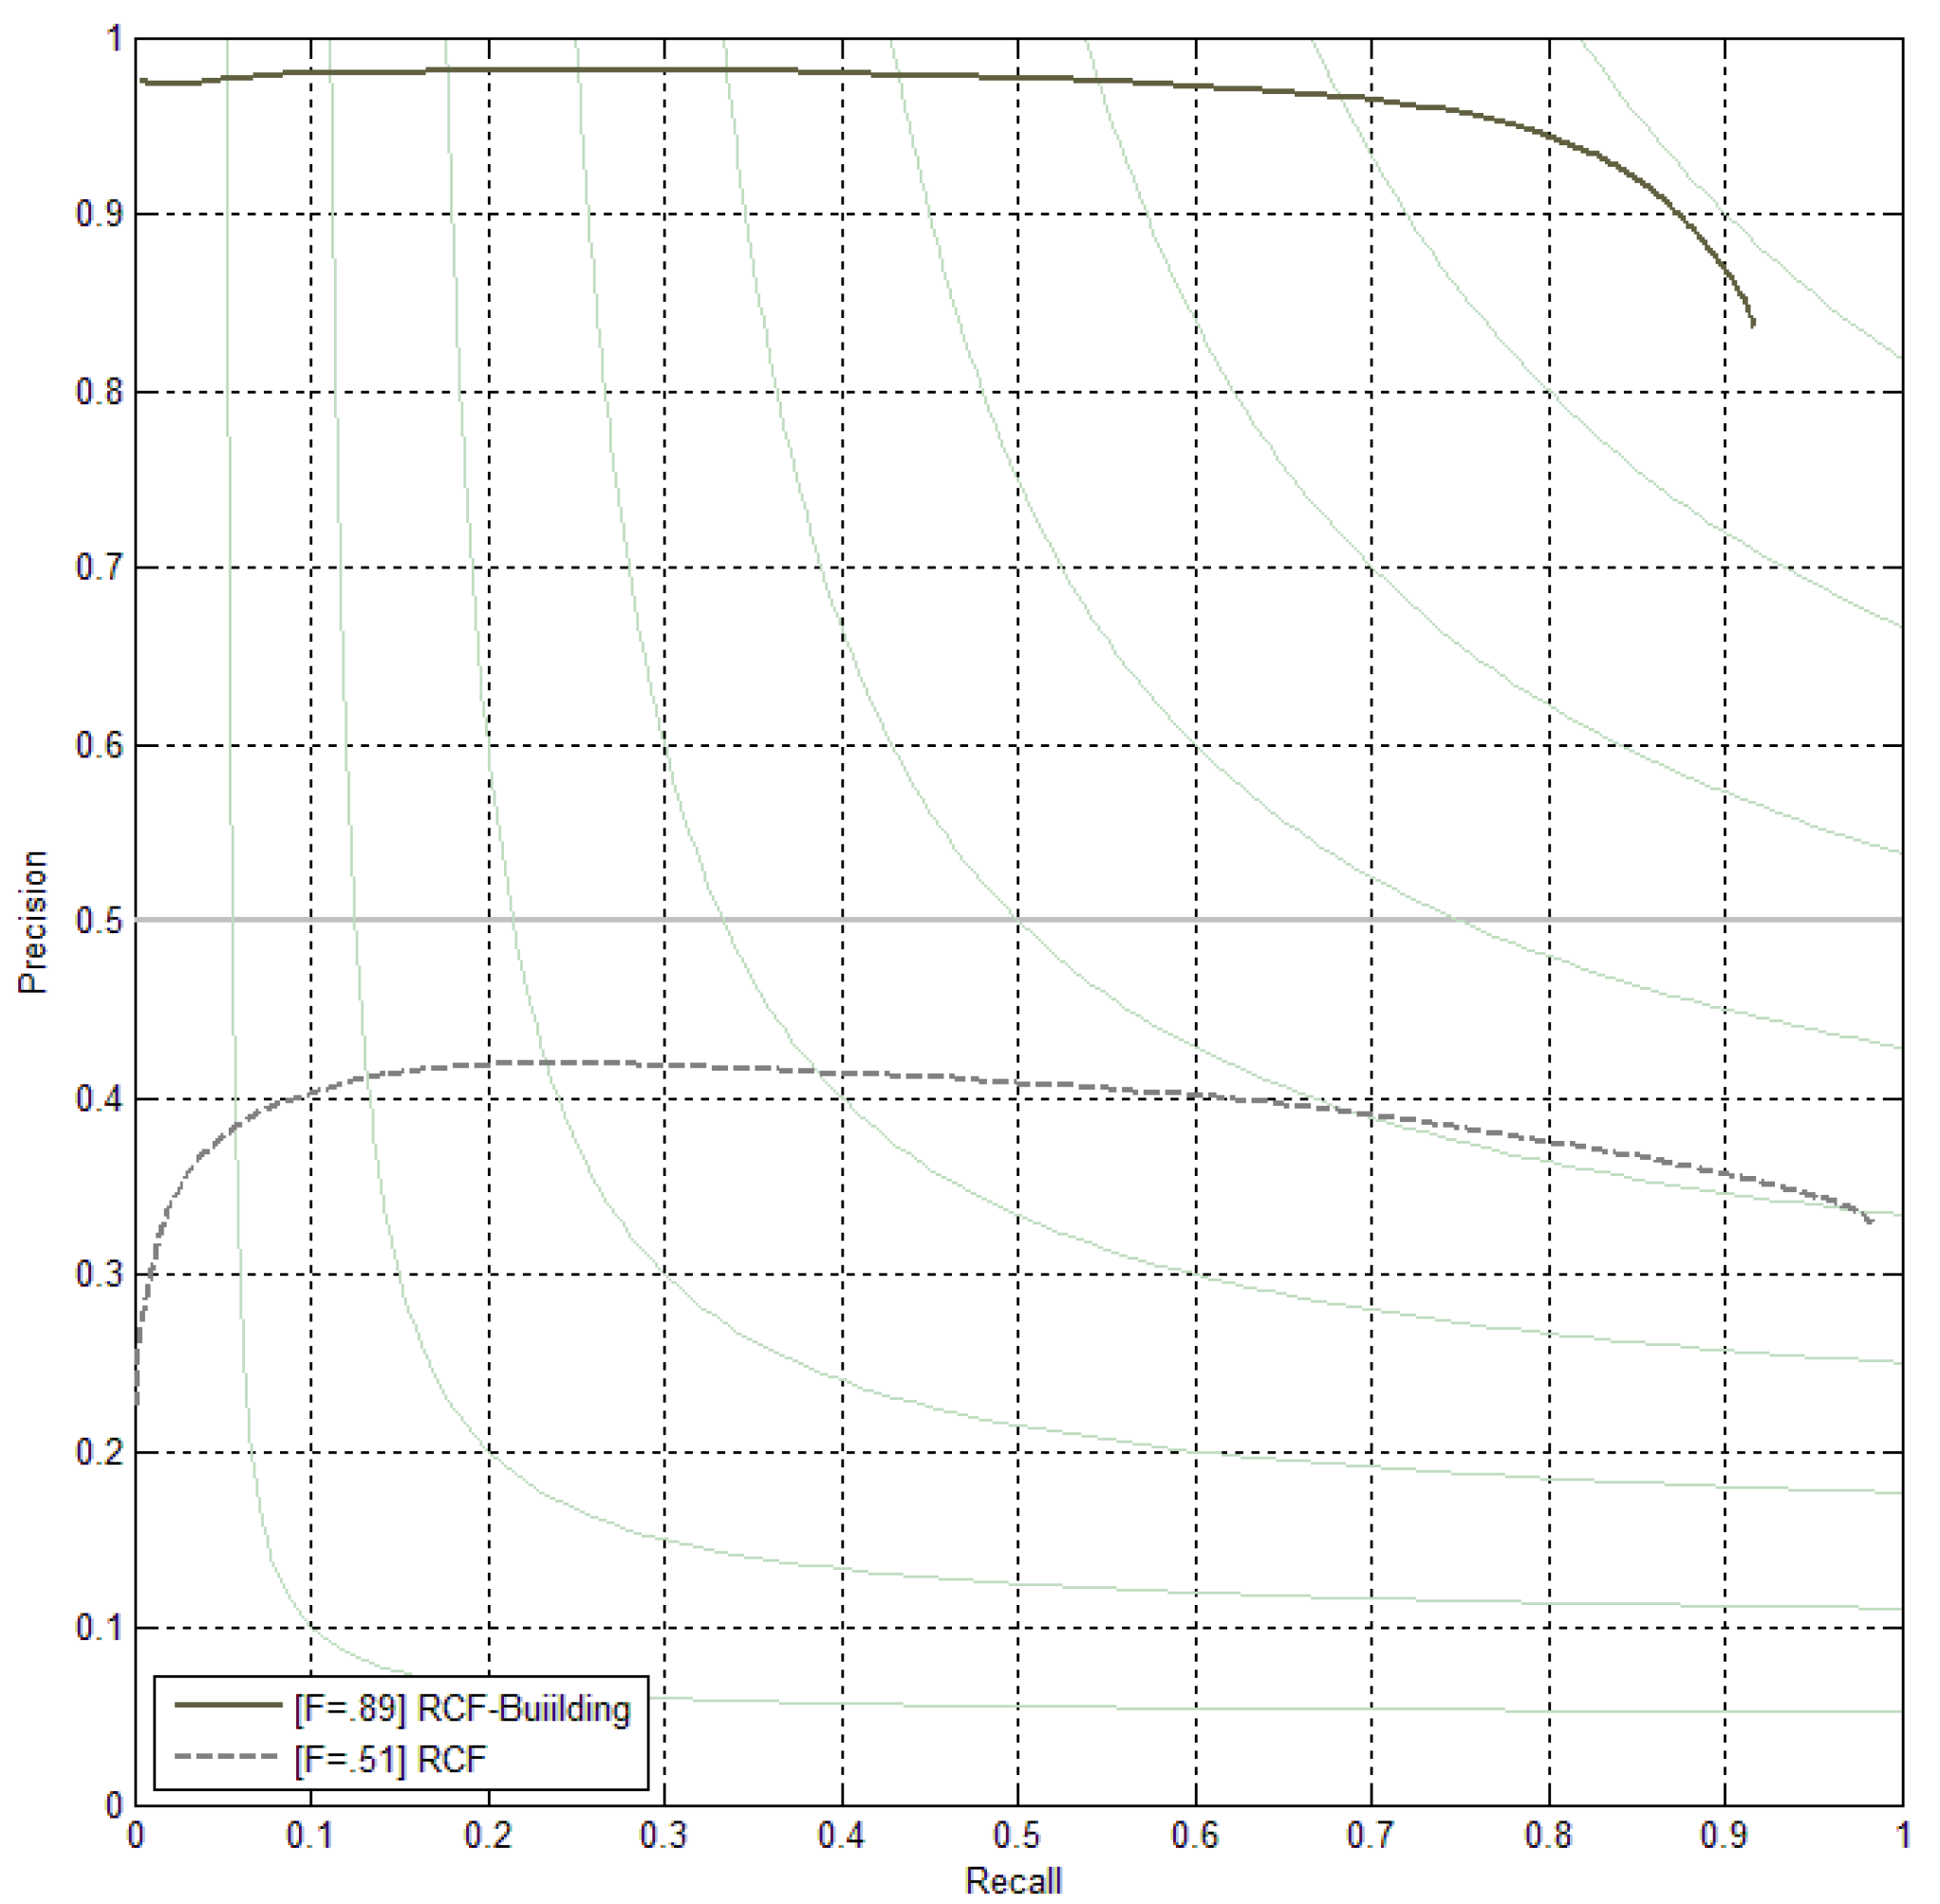
4.2. Precision and Recall Evaluation
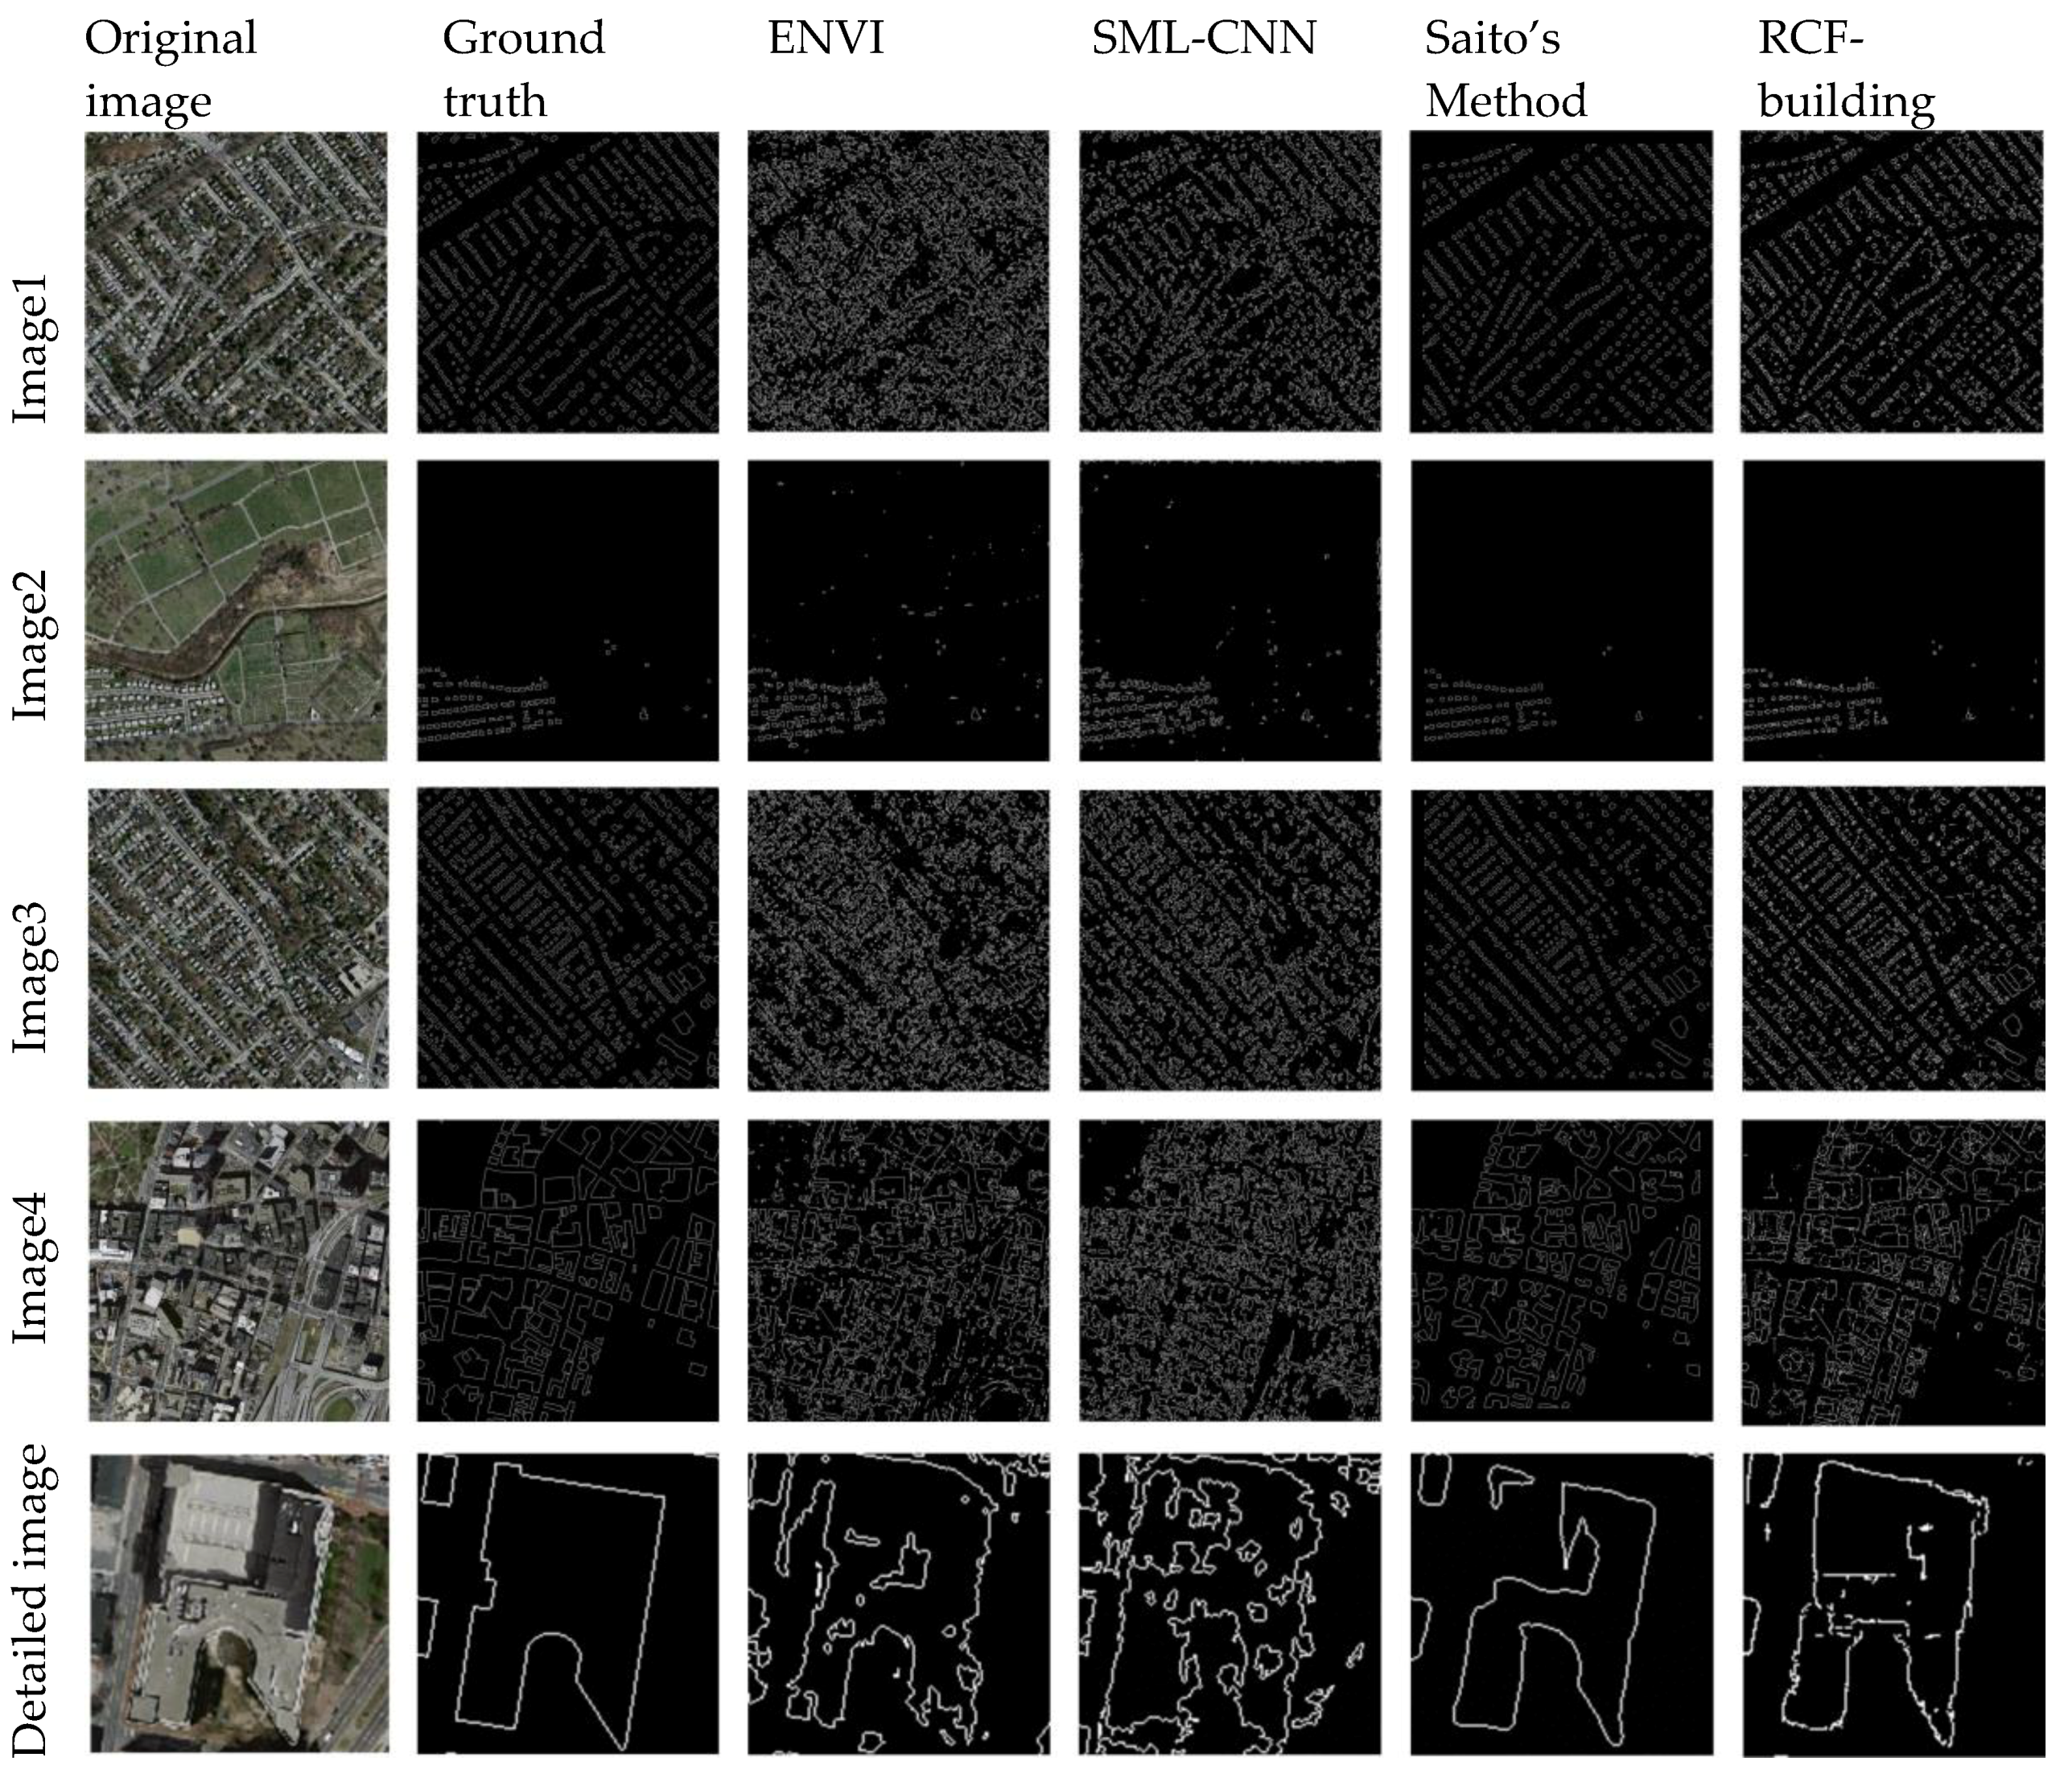
4.3. Comparison with Other Building Extraction Methods
5. Discussion
5.1. Ablation Experiment
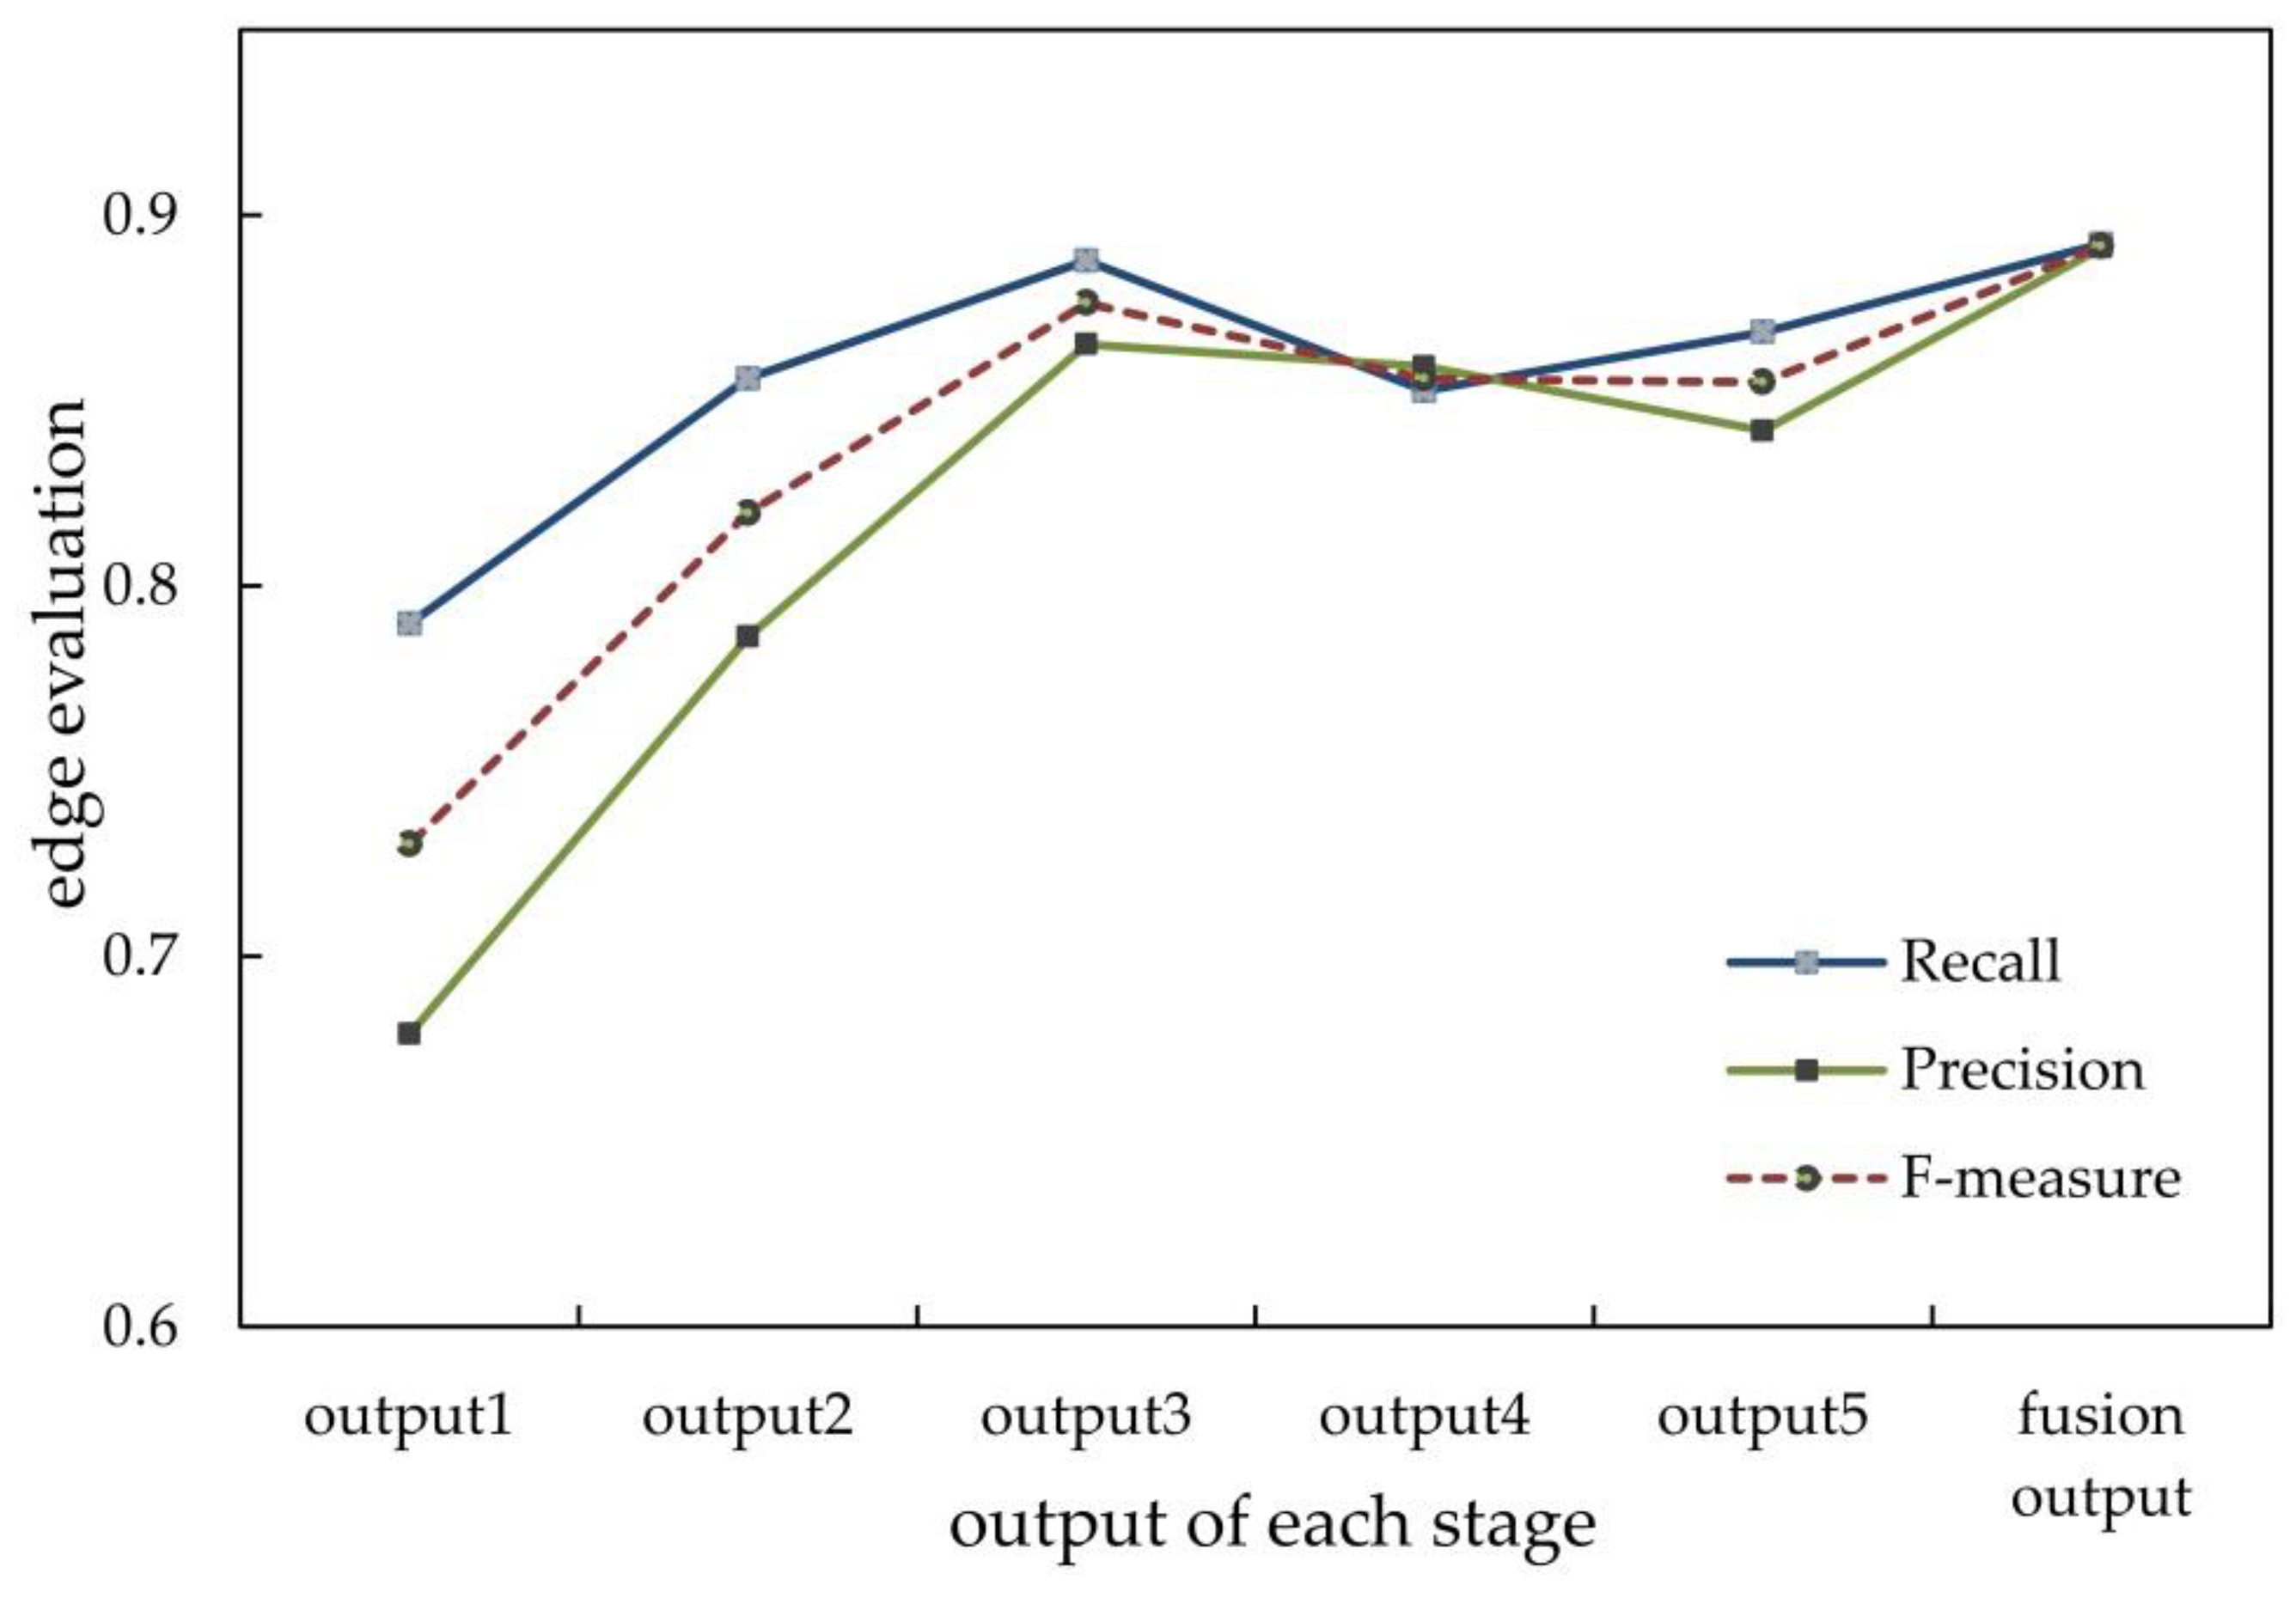
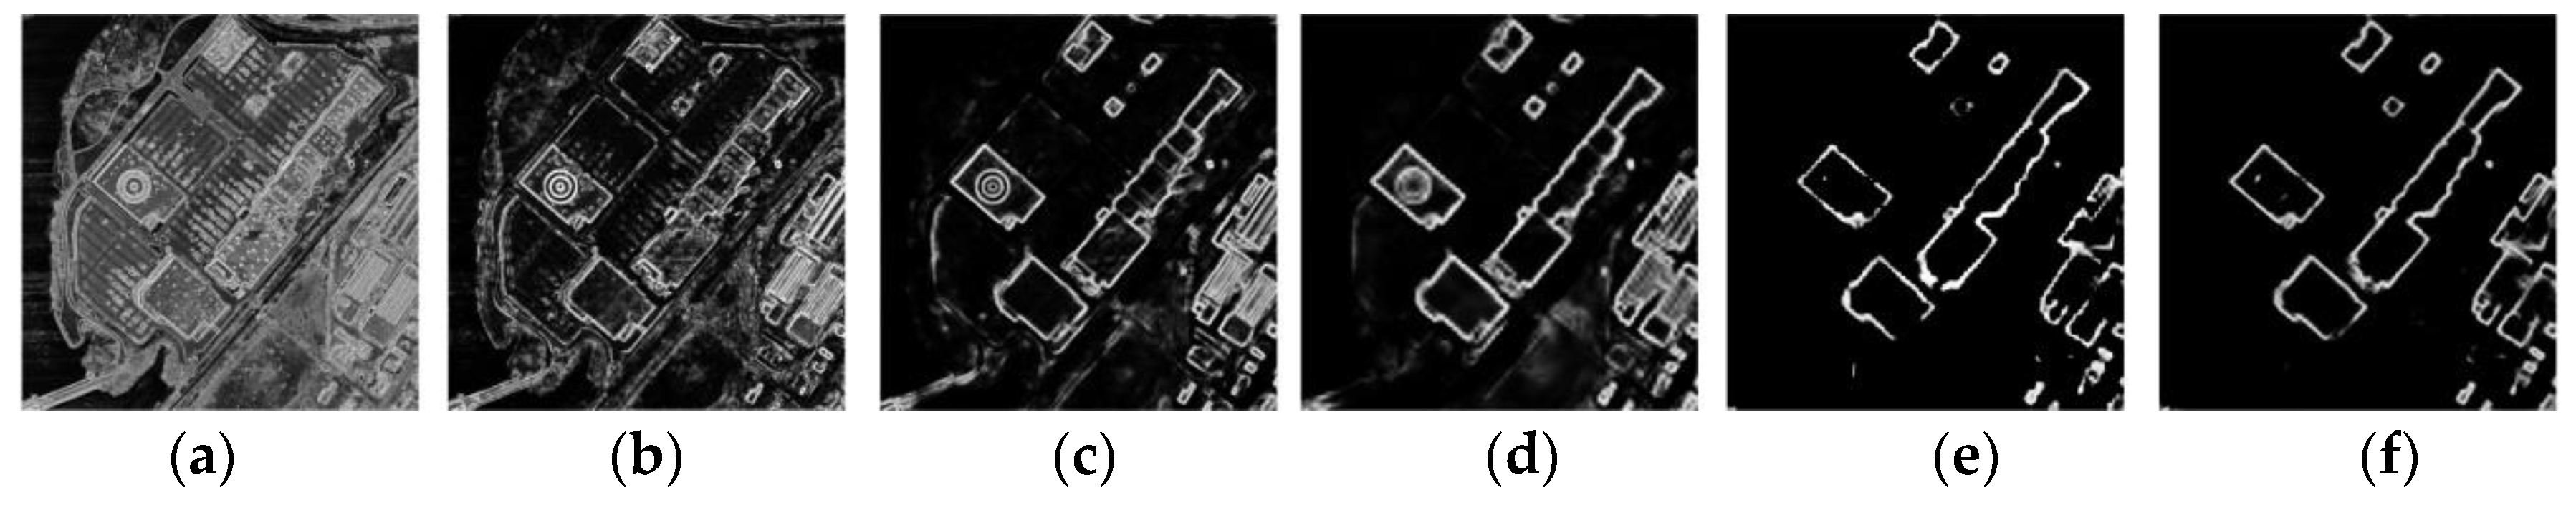
5.2. Influence of the RCF Fusion Output
6. Conclusions
- The RCF network is firstly combined with HSRRS imagery to detect building edges and then an RCF-building model that can accurately and comprehensively detect the building edges is built. Compared to the traditional building edge extraction method, the method used in this paper can make use of high-level semantic information and can get a higher accuracy evaluation value and better visual effects. Compared to deep-learning-based building extraction methods, RCF-building could better retain the corner part building edges. In addition, this paper also analyzes the influence of the RCF fusion output architecture on the building edges detection accuracy, and the precision and recall lines affirm that this unique architecture of RCF can perfectly inherit the advantages of each stage and has a strong applicability to the detection of building edges.
- In the preprocessing stage, on the basis of Massachusetts Building dataset, we proposed the most peripheral constraint edge conversion algorithm and created the Massachusetts Building-edge dataset specifically for deep-learning-based building edges detection. The comparison result shows that the dataset produced by the most peripheral constraint algorithm can effectively improve the performance of RCF-building model, and affirms the positive impact of accurately labeled data on network training. This Massachusetts Building-edge dataset makes the foundation for future research on deep-learning-based building edges detection.
- In the post-processing stage, this paper involves a geomorphological concept to refine edge probability map according to geometric morphological analysis of topographic surface. Compared to the NMS algorithm, the involved refinement algorithm could balance the precision and recall value, and get a higher F-measure. It can preserve the integrity of the building edges to the greatest extent and reduce noise points. However, there are still some broken lines, as well as some discontinuities in the detected building edges results after the post-processing.
Author Contributions
Funding
Acknowledgments
Conflicts of Interest
References
- Du, S.; Luo, L.; Cao, K.; Shu, M. Extracting building patterns with multilevel graph partition and building grouping. ISPRS J. Photogramm. Remote Sens. 2016, 122, 81–96. [Google Scholar] [CrossRef]
- Li, Y.; Wu, H. Adaptive building edge detection by combining lidar data and aerial images. Int. Arch. Photogramm. Remote Sens. Spat. Inf. Sci. 2008, 37, 197–202. [Google Scholar]
- Hu, X.; Shen, J.; Shan, J.; Pan, L. Local edge distributions for detection of salient structure textures and objects. IEEE Geosci. Remote Sens. Lett. 2013, 10, 4664–4670. [Google Scholar] [CrossRef]
- Yang, H.-C.; Deng, K.-Z.; Zhang, S. Semi-automated extraction from aerial image using improved hough transformation. Sci. Surv. Mapp. 2006, 6, 32. [Google Scholar]
- Siddiqui, F.U.; Teng, S.W.; Awrangjeb, M.; Lu, G. A robust gradient based method for building extraction from lidar and photogrammetric imagery. Sensors 2016, 16, 1110. [Google Scholar] [CrossRef] [PubMed]
- Wu, G.; Guo, Z.; Shi, X.; Chen, Q.; Xu, Y.; Shibasaki, R.; Shao, X. A boundary regulated network for accurate roof segmentation and outline extraction. Remote Sens. 2018, 10, 1195. [Google Scholar] [CrossRef]
- Ming, D.-P.; Luo, J.-C.; Shen, Z.-F.; Wang, M.; Sheng, H. Research on information extraction and target recognition from high resolution remote sensing image. Sci. Surv. Mapp. 2005, 30, 18–20. [Google Scholar]
- Ganin, Y.; Lempitsky, V. N 4-fields: Neural network nearest neighbor fields for image transforms. In Proceedings of the Asian Conference on Computer Vision, Singapore, 1–5 November 2014; Springer: Berlin, Germany, 2014; pp. 536–551. [Google Scholar]
- Shen, W.; Wang, X.; Wang, Y.; Bai, X.; Zhang, Z. Deepcontour: A deep convolutional feature learned by positive-sharing loss for contour detection. In Proceedings of the IEEE Conference on Computer Vision and Pattern Recognition, Boston, MA, USA, 7–12 June 2015; pp. 3982–3991. [Google Scholar]
- Bertasius, G.; Shi, J.; Torresani, L. Deepedge: A multi-scale bifurcated deep network for top-down contour detection. In Proceedings of the 2015 IEEE Conference on Computer Vision and Pattern Recognition (CVPR), Boston, MA, USA, 7–12 June 2015; pp. 4380–4389. [Google Scholar]
- Bertasius, G.; Shi, J.; Torresani, L. High-for-low and low-for-high: Efficient boundary detection from deep object features and its applications to high-level vision. In Proceedings of the IEEE International Conference on Computer Vision, Santiago, Chile, 7–13 December 2015; pp. 504–512. [Google Scholar]
- Xie, S.; Tu, Z. Holistically-nested edge detection. In Proceedings of the IEEE International Conference on Computer Vision, Santiago, Chile, 7–13 December 2015; pp. 1395–1403. [Google Scholar]
- Liu, Y.; Cheng, M.-M.; Hu, X.; Wang, K.; Bai, X. Richer convolutional features for edge detection. In Proceedings of the 2017 IEEE Conference on Computer Vision and Pattern Recognition (CVPR), Honolulu, HI, USA, 21–26 July 2017; pp. 5872–5881. [Google Scholar]
- Martin, D.R.; Fowlkes, C.C.; Malik, J. Learning to detect natural image boundaries using brightness and texture. Advances in Neural Information Processing Systems, Vancouver, BC, Canada, 8–13 December 2003; pp. 1279–1286. [Google Scholar]
- Chen, Z.; Zhang, T.; Ouyang, C. End-to-end airplane detection using transfer learning in remote sensing images. Remote Sens. 2018, 10, 139. [Google Scholar] [CrossRef]
- Lin; Huertas; Nevatia. Detection of buildings using perceptual grouping and shadows. In Proceedings of the IEEE Computer Vision & Pattern Recognition, Seattle, WA, USA, 21–23 June 1994. [Google Scholar]
- Jaynes, C.O.; Stolle, F.; Collins, R.T. Task driven perceptual organization for extraction of rooftop polygons. In Proceedings of the Second IEEE Workshop on Applications of Computer Vision, Sarasota, FL, USA, 5–7 December 1994; pp. 152–159. [Google Scholar]
- Mohan, R.; Nevatia, R. Using perceptual organization to extract 3d structures. IEEE Trans. Pattern Anal. Mach. Intell. 1989, 11, 1121–1139. [Google Scholar] [CrossRef]
- Turker, M.; Koc-San, D. Building extraction from high-resolution optical spaceborne images using the integration of support vector machine (SVM) classification, hough transformation and perceptual grouping. Int. J. Appl. Earth Obs. Geoinf. 2015, 34, 586–589. [Google Scholar] [CrossRef]
- Kim, T.; Muller, J.P. Development of a graph-based approach for building detection. Image Vis. Comput. 1999, 17, 31–34. [Google Scholar] [CrossRef]
- Tao, W.B.; Tian, J.W.; Liu, J. A new approach to extract rectangle building from aerial urban images. In Proceedings of the 2002 6th International Conference on Signal Processing, Beijing, China, 26–30 August 2002; Volume 141, pp. 143–146. [Google Scholar]
- Krishnamachari, S.; Chellappa, R. Delineating buildings by grouping lines with mrfs. IEEE Trans. Image Process. 2002, 5, 1641–1668. [Google Scholar] [CrossRef] [PubMed]
- Croitoru, A.; Doytsher, Y. Right-angle rooftop polygon extraction in regularised urban areas: Cutting the corners. Photogramm. Rec. 2010, 19, 3113–3141. [Google Scholar] [CrossRef]
- Cui, S.; Yan, Q.; Reinartz, P. Complex building description and extraction based on hough transformation and cycle detection. Remote Sens. Lett. 2012, 3, 1511–1559. [Google Scholar] [CrossRef]
- Partovi, T.; Bahmanyar, R.; Krauß, T.; Reinartz, P. Building outline extraction using a heuristic approach based on generalization of line segments. IEEE J. Sel. Top. Appl. Earth Obs. Remote Sens. 2017, 10, 9339–9347. [Google Scholar] [CrossRef]
- Su, N.; Yan, Y.; Qiu, M.; Zhao, C.; Wang, L. Object-based dense matching method for maintaining structure characteristics of linear buildings. Sensors 2018, 18, 1035. [Google Scholar] [CrossRef] [PubMed]
- Rüther, H.; Martine, H.M.; Mtalo, E.G. Application of snakes and dynamic programming optimisation technique in modeling of buildings in informal settlement areas. ISPRS J. Photogramm. Remote Sens. 2002, 56, 269–282. [Google Scholar] [CrossRef]
- Peng, J.; Zhang, D.; Liu, Y. An improved snake model for building detection from urban aerial images. Pattern Recognit. Lett. 2005, 26, 5875–5895. [Google Scholar] [CrossRef]
- Ahmadi, S.; Zoej, M.J.V.; Ebadi, H.; Moghaddam, H.A.; Mohammadzadeh, A. Automatic urban building boundary extraction from high resolution aerial images using an innovative model of active contours. Int. J. Appl. Earth Obs. Geoinf. 2010, 12, 1501–1557. [Google Scholar] [CrossRef]
- Garcin, L.; Descombes, X.; Men, H.L.; Zerubia, J. Building detection by markov object processes. In Proceedings of the International Conference on Image Processing, Thessaloniki, Greece, 7–10 October 2001; Volume 562, pp. 565–568. [Google Scholar]
- Kass, A. Snake: Active contour models. Int. J. Comput. Vis. 1988, 1, 321–331. [Google Scholar] [CrossRef]
- Zhou, J.Q. Spatial relation-aided method for object-oriented extraction of buildings from high resolution image. J. Appl. Sci. 2012, 30, 511–516. [Google Scholar]
- Tan, Q. Urban building extraction from vhr multi-spectral images using object-based classification. Acta Geod. Cartogr. Sin. 2010, 39, 618–623. [Google Scholar]
- Wu, H.; Cheng, Z.; Shi, W.; Miao, Z.; Xu, C. An object-based image analysis for building seismic vulnerability assessment using high-resolution remote sensing imagery. Nat. Hazards 2014, 71, 151–174. [Google Scholar] [CrossRef]
- Benarchid, O.; Raissouni, N.; Adib, S.E.; Abbous, A.; Azyat, A.; Achhab, N.B.; Lahraoua, M.; Chahboun, A. Building extraction using object-based classification and shadow information in very high resolution multispectral images, a case study: Tetuan, Morocco. Can. J. Image Process. Comput. Vis. 2013, 4, 1–8. [Google Scholar]
- Mariana, B.; Lucian, D. Comparing supervised and unsupervised multiresolution segmentation approaches for extracting buildings from very high resolution imagery. ISPRS J. Photogramm. Remote Sens. 2014, 96, 67–75. [Google Scholar]
- Tao, C.; Tan, Y.; Cai, H.; Du, B.; Tian, J. Object-oriented method of hierarchical urban building extraction from high-resolution remote-sensing imagery. Acta Geod. Cartogr. Sin. 2010, 39, 394–395. [Google Scholar]
- Guo, Z.; Du, S. Mining parameter information for building extraction and change detection with very high-resolution imagery and gis data. Mapp. Sci. Remote Sens. 2017, 54, 38–63. [Google Scholar] [CrossRef]
- Liu, Z.J.; Wang, J.; Liu, W.P. Building extraction from high resolution imagery based on multi-scale object oriented classification and probabilistic hough transform. In Proceedings of the 2005 IEEE International Geoscience and Remote Sensing Symposium (IGARSS’05), Seoul, Korea, 25–29 July 2005; pp. 250–253. [Google Scholar]
- Krizhevsky, A.; Sutskever, I.; Hinton, G.E. Imagenet classification with deep convolutional neural networks. In Proceedings of the International Conference on Neural Information Processing Systems, Lake Tahoe, NV, USA, 3–6 December 2012; pp. 1097–1105. [Google Scholar]
- Badrinarayanan, V.; Kendall, A.; Cipolla, R. Segnet: A deep convolutional encoder-decoder architecture for scene segmentation. IEEE Trans. Pattern Anal. Mach. Intell. 2015, 39, 2481–2495. [Google Scholar] [CrossRef] [PubMed]
- Huang, Z.; Cheng, G.; Wang, H.; Li, H.; Shi, L.; Pan, C. Building extraction from multi-source remote sensing images via deep deconvolution neural networks. In Proceedings of the Geoscience and Remote Sensing Symposium, Beijing, China, 10–15 July 2016; pp. 1835–1838. [Google Scholar]
- Saito, S.; Yamashita, T.; Aoki, Y. Multiple object extraction from aerial imagery with convolutional neural networks. Electron. Imaging 2016, 2016, 1–9. [Google Scholar]
- Zhong, Z.; Li, J.; Cui, W.; Jiang, H. Fully convolutional networks for building and road extraction: Preliminary results. In Proceedings of the Geoscience and Remote Sensing Symposium, Beijing, China, 10–15 July 2016; pp. 1591–1594. [Google Scholar]
- Xu, Y.; Wu, L.; Xie, Z.; Chen, Z. Building extraction in very high resolution remote sensing imagery using deep learning and guided filters. Remote Sens. 2018, 10, 144. [Google Scholar] [CrossRef]
- Cao, J.; Chen, Z.; Wang, B. Deep convolutional networks with superpixel segmentation for hyperspectral image classification. In Proceedings of the Geoscience and Remote Sensing Symposium, Beijing, China, 10–15 July 2016; pp. 3310–3313. [Google Scholar]
- Zhao, W.; Jiao, L.; Ma, W.; Zhao, J.; Zhao, J.; Liu, H.; Cao, X.; Yang, S. Superpixel-based multiple local cnn for panchromatic and multispectral image classification. IEEE Trans. Geosci. Remote Sens. 2017, 55, 4141–4156. [Google Scholar] [CrossRef]
- Liu, Y.; Cao, G.; Sun, Q.; Siegel, M. Hyperspectral classification via deep networks and superpixel segmentation. Int. J. Remote Sens. 2015, 36, 3459–3482. [Google Scholar] [CrossRef]
- Gao, J.; Wang, Q.; Yuan, Y. Embedding structured contour and location prior in siamesed fully convolutional networks for road detection. In Proceedings of the IEEE International Conference on Robotics and Automation, Singapore, 29 May–3 June 2017; pp. 219–224. [Google Scholar]
- Zhou, J.T.; Zhao, H.; Peng, X.; Fang, M.; Qin, Z.; Goh, R.S.M. Transfer hashing: From shallow to deep. IEEE Trans. Neural Netw. Learn. Syst. 2018, PP, 1–11. [Google Scholar] [CrossRef] [PubMed]
- Peng, X.; Feng, J.; Xiao, S.; Yau, W.Y.; Zhou, J.T.; Yang, S. Structured autoencoders for subspace clustering. IEEE Trans. Image Process. 2018, 27, 5076–5086. [Google Scholar] [CrossRef] [PubMed]
- Huang, X.; Zhang, L. Morphological building/shadow index for building extraction from high-resolution imagery over urban areas. IEEE J. Sel. Top. Appl. Earth Obs. Remote Sens. 2012, 5, 1611–1672. [Google Scholar] [CrossRef]
- Rongming, H.U.; Huang, X.; Huang, Y. An enhanced morphological building index for building extraction from high-resolution images. Acta Geod. Cartogr. Sin. 2014, 43, 514–520. [Google Scholar]
- Huang, X.; Yuan, W.; Li, J.; Zhang, L. A new building extraction postprocessing framework for high-spatial-resolution remote-sensing imagery. IEEE J. Sel. Top. Appl. Earth Obs. Remote Sens. 2017, 10, 654–668. [Google Scholar] [CrossRef]
- Lin, X.; Zhang, J. Object-based morphological building index for building extraction from high resolution remote sensing imagery. Acta Geod. Cartogr. Sin. 2017, 46, 724–733. [Google Scholar]
- Jiménez, L.I.; Plaza, J.; Plaza, A. Efficient implementation of morphological index for building/shadow extraction from remotely sensed images. J. Supercomput. 2017, 73, 482–489. [Google Scholar] [CrossRef]
- Ghandour, A.; Jezzini, A. Autonomous building detection using edge properties and image color invariants. Buildings 2018, 8, 65. [Google Scholar] [CrossRef]
- Cardona, E.U.; Mering, C. Extraction of buildings in very high spatial resolution’s geoeye images, an approach through the mathematical morphology. In Proceedings of the Information Systems and Technologies, Nashville, TN, USA, 12–13 November 2016; pp. 1–6. [Google Scholar]
- Liow, Y.T.; Pavilidis, T. Use of shadows for extracting buildings in aerial images. Comput. Vis. Graph. Image Process. 1989, 49, 242–277. [Google Scholar] [CrossRef]
- Shi, W.Z.; Mao, Z.Y. Building extraction from high resolution remotely sensed imagery based on shadows and graph-cut segmentation. Acta Electron. Sin. 2016, 69, 11–13. [Google Scholar]
- Wang, L. Development of a multi-scale object-based shadow detection method for high spatial resolution image. Remote Sens. Lett. 2015, 6, 596–598. [Google Scholar]
- Raju, P.L.N.; Chaudhary, H.; Jha, A.K. Shadow analysis technique for extraction of building height using high resolution satellite single image and accuracy assessment. ISPRS Int. Arch. Photogramm. Remote Sens. Spat. Inf. Sci. 2014, XL-8, 1185–1192. [Google Scholar] [CrossRef]
- Pesaresi, M.; Gerhardinger, A.; Kayitakire, F. A robust built-up area presence index by anisotropic rotation-invariant textural measure. IEEE J. Sel. Top. Appl. Earth Obs. Remote Sens. 2009, 1, 180–192. [Google Scholar] [CrossRef]
- Pesaresi, M.; Gerhardinger, A. Improved textural built-up presence index for automatic recognition of human settlements in arid regions with scattered vegetation. IEEE J. Sel. Top. Appl. Earth Obs. Remote Sens. 2011, 4, 162–166. [Google Scholar] [CrossRef]
- Hu, L.; Zheng, J.; Gao, F. A building extraction method using shadow in high resolution multispectral images. In Proceedings of the Geoscience and Remote Sensing Symposium, Vancouver, BC, Canada, 24–29 July 2011; pp. 1862–1865. [Google Scholar]
- Fraser, C. 3D Building Reconstruction from High-Resolution Ikonos Stereo-Imagery; Automatic Extraction Of Man-Made Objects From Aerial And Space Images (iii); Balkema: London, UK, 2001. [Google Scholar]
- Gilani, S.; Awrangjeb, M.; Lu, G. An automatic building extraction and regularisation technique using lidar point cloud data and orthoimage. Remote Sens. 2016, 8, 27. [Google Scholar] [CrossRef]
- Uzar, M.; Yastikli, N. Automatic building extraction using lidar and aerial photographs. Boletim De Ciências Geodésicas 2013, 19, 153–171. [Google Scholar] [CrossRef]
- Awrangjeb, M.; Fraser, C. Automatic segmentation of raw lidar data for extraction of building roofs. Remote Sens. 2014, 6, 3716–3751. [Google Scholar] [CrossRef]
- Shaker, I.F.; Abdelrahman, A.; Abdelgawad, A.K.; Sherief, M.A. Building extraction from high resolution space images in high density residential areas in the great cairo region. Remote Sens. 2011, 3, 781–791. [Google Scholar] [CrossRef]
- Sportouche, H.; Tupin, F.; Denise, L. Extraction and three-dimensional reconstruction of isolated buildings in urban scenes from high-resolution optical and sar spaceborne images. IEEE Trans. Geosci. Remote Sens. 2011, 49, 3932–3946. [Google Scholar] [CrossRef]
- Grigillo, D.; Fras, M.K.; Petrovič, D. Automated Building Extraction from Ikonos Images in Suburban Areas; Taylor & Francis, Inc.: London, UK, 2012; pp. 5149–5170. [Google Scholar]
- Hu, X.; Ye, L.; Pang, S.; Shan, J. Semi-global filtering of airborne lidar data for fast extraction of digital terrain models. Remote Sens. 2015, 7, 10996–11015. [Google Scholar] [CrossRef]
- Pang, S.; Hu, X.; Wang, Z.; Lu, Y. Object-based analysis of airborne lidar data for building change detection. Remote Sens. 2014, 6, 10733–10749. [Google Scholar] [CrossRef]
- Siddiqui, F.U.; Awrangjeb, M. A novel building change detection method using 3d building models. In Proceedings of the International Conference on Digital Image Computing: Techniques and Applications, Sydney, Australia, 29 November–1 December 2017; pp. 1–8. [Google Scholar]
- Yang, B.; Huang, R.; Li, J.; Tian, M.; Dai, W.; Zhong, R. Automated reconstruction of building lods from airborne lidar point clouds using an improved morphological scale space. Remote Sens. 2016, 9, 14. [Google Scholar] [CrossRef]
- Tian, J.; Cui, S.; Reinartz, P. Building change detection based on satellite stereo imagery and digital surface models. IEEE Trans. Geosc. Remote Sens. 2013, 52, 406–417. [Google Scholar] [CrossRef] [Green Version]
- Siddiqui, F.U.; Awrangjeb, M.; Teng, S.W.; Lu, G. A new building mask using the gradient of heights for automatic building extraction. In Proceedings of the International Conference on Digital Image Computing: Techniques and Applications, Gold Coast, Australia, 30 November–2 December 2016; pp. 1–7. [Google Scholar]
- Mnih, V. Machine Learning for Aerial Image Labeling; University of Toronto: Toronto, ON, Canada, 2013. [Google Scholar]
- Simonyan, K.; Zisserman, A. Very deep convolutional networks for large-scale image recognition. arXiv, 2014; arXiv:1409.1556. [Google Scholar]
- Jia, Y.; Shelhamer, E.; Donahue, J.; Karayev, S.; Long, J.; Girshick, R.; Guadarrama, S.; Darrell, T. Caffe: Convolutional architecture for fast feature embedding. In Proceedings of the 22nd ACM international conference on Multimedia, Orlando, FL, USA, 3–7 November 2014; pp. 675–678. [Google Scholar]
- Hermosilla, T.; Ruiz, L.A.; Recio, J.A.; Estornell, J. Evaluation of automatic building detection approaches combining high resolution images and lidar data. Remote Sens. 2011, 3, 1188–1210. [Google Scholar] [CrossRef]
- Zhang, Z.; Zhang, X.; Xin, Q.; Yang, X. Combining the pixel-based and object-based methods for building change detection using high-resolution remote sensing images. Acta Geod. Cartogr. Sin. 2018, 47, 102–112. [Google Scholar]
- Lin, X.; Zhang, J. Extraction of human settlements from high resolution remote sensing imagery by fusing features of right angle corners and right angel sides. Acta Geod. Cartogr. Sin. 2017, 46, 838–839. [Google Scholar]
- Buckland, M.; Gey, F. The relationship between recall and precision. J. Am. Soc. Inf. Sci. 1994, 45, 12–19. [Google Scholar] [CrossRef]
- Zhou, Z. Machine Learning; Tsinghua University Press: Beijing, China, 2016. [Google Scholar]
- Envi Feature Extraction Module User’s Guide. Available online: http://www.harrisgeospatial.com/portals/0/pdfs/envi/Feature_Extracyion_Module.pdf (accessed on 1 December 2008).
- Deng, S.B.; Chen, Q.J.; Du, H.J. Envi Remote Sensing Image Processing Method; Higher Education Press: Beijing, China, 2014. [Google Scholar]
- Canny, J. A computational approach to edge detection. In Readings in Computer Vision; Elsevier: New York, NY, USA, 1987; pp. 184–203. [Google Scholar]
- Zhang, Z.; Schwing, A.G.; Fidler, S.; Urtasun, R. Monocular object instance segmentation and depth ordering with cnns. In Proceedings of the The IEEE International Conference on Computer Vision (ICCV), Santiago, Chile, 13–16 December 2015; pp. 2614–2622. [Google Scholar]


| Sample Category | Image1 | Image2 | Image3 | Image4 |
|---|---|---|---|---|
| Building | 1200 | 194 | 1200 | 1954 |
| Non building | 2088 | 1298 | 2088 | 1774 |
| Approach | Index | Image1 | Image2 | Image3 | Image4 | Mean |
|---|---|---|---|---|---|---|
| ENVI Feature Extraction | Precision | 0.35 | 0.71 | 0.44 | 0.45 | 0.49 |
| Recall | 0.97 | 0.90 | 0.96 | 0.87 | 0.93 | |
| F-measure | 0.52 | 0.80 | 0.61 | 0.60 | 0.63 | |
| SLIC-CNN | Precision | 0.51 | 0.54 | 0.57 | 0.35 | 0.49 |
| Recall | 0.99 | 0.97 | 0.97 | 0.96 | 0.97 | |
| F-measure | 0.68 | 0.70 | 0.72 | 0.52 | 0.65 | |
| Saito’s Method | Precision | 0.99 | 1.00 | 0.99 | 0.78 | 0.94 |
| Recall | 0.55 | 0.72 | 0.50 | 0.75 | 0.63 | |
| F-measure | 0.70 | 0.84 | 0.67 | 0.77 | 0.74 | |
| RCF-building | Precision | 0.85 | 0.96 | 0.88 | 0.74 | 0.86 |
| Recall | 0.94 | 0.82 | 0.93 | 0.94 | 0.91 | |
| F-measure | 0.89 | 0.89 | 0.91 | 0.82 | 0.88 |
| Conversion Algorithm | Refinement Algorithm | Precision | Recall | F-Measure |
|---|---|---|---|---|
| Canny algorithm | NMS | 0.46 | 0.99 | 0.63 |
| Canny algorithm | Our refinement algorithm | 0.70 | 0.94 | 0.80 |
| Our conversion algorithm | NMS | 0.60 | 0.98 | 0.75 |
| Our conversion algorithm | Our refinement algorithm | 0.85 | 0.89 | 0.87 |
© 2018 by the authors. Licensee MDPI, Basel, Switzerland. This article is an open access article distributed under the terms and conditions of the Creative Commons Attribution (CC BY) license (http://creativecommons.org/licenses/by/4.0/).
Share and Cite
Lu, T.; Ming, D.; Lin, X.; Hong, Z.; Bai, X.; Fang, J. Detecting Building Edges from High Spatial Resolution Remote Sensing Imagery Using Richer Convolution Features Network. Remote Sens. 2018, 10, 1496. https://0-doi-org.brum.beds.ac.uk/10.3390/rs10091496
Lu T, Ming D, Lin X, Hong Z, Bai X, Fang J. Detecting Building Edges from High Spatial Resolution Remote Sensing Imagery Using Richer Convolution Features Network. Remote Sensing. 2018; 10(9):1496. https://0-doi-org.brum.beds.ac.uk/10.3390/rs10091496
Chicago/Turabian StyleLu, Tingting, Dongping Ming, Xiangguo Lin, Zhaoli Hong, Xueding Bai, and Ju Fang. 2018. "Detecting Building Edges from High Spatial Resolution Remote Sensing Imagery Using Richer Convolution Features Network" Remote Sensing 10, no. 9: 1496. https://0-doi-org.brum.beds.ac.uk/10.3390/rs10091496