Enhanced Warming and Intensification of the Kuroshio Extension, 1999–2013


Department of Earth Sciences, National Taiwan Normal University, Taipei 116, Taiwan
*
Author to whom correspondence should be addressed.
Remote Sens. 2019, 11(1), 101; https://0-doi-org.brum.beds.ac.uk/10.3390/rs11010101
Submission received: 12 November 2018
/
Revised: 23 December 2018
/
Accepted: 1 January 2019
/
Published: 8 January 2019
(This article belongs to the Section Ocean Remote Sensing)
Abstract
:The Pacific climate regime has anomalous warm and cool periods every decade associated with atmospheric circulation changes, which are known to have modulated the tropical and subtropical Pacific during the recent Pacific hiatus regime (1999–2013). However, the influence of the hiatus regime on the Kuroshio Extension (KE) remains unclear. Here, we show that the KE jet underwent enhanced warming (increased 1–1.5 °C), intensification (8–19%) and northward migration (0.5–1°). The KE jet became more perturbed in the upstream region (increased by 70%, west of 146°E) but became stable downstream (perturbation decreased 5–11%, east of 146°E). A poleward shift of the mid-latitude jet stream and weakened Aleutian Low (AL) contributed to the northward migration and intensification of the KE jet, respectively. The weakened AL was associated with negative wind stress curl (WSC) in the eastern Pacific, and this WSC generated an underlying positive sea surface height anomaly that propagated westward, intensifying the KE jet when it reached the KE region. Since the recent Pacific hiatus regime ended after 2013, these changes of the KE jet may reverse during the ongoing warming regime.
1. Introduction
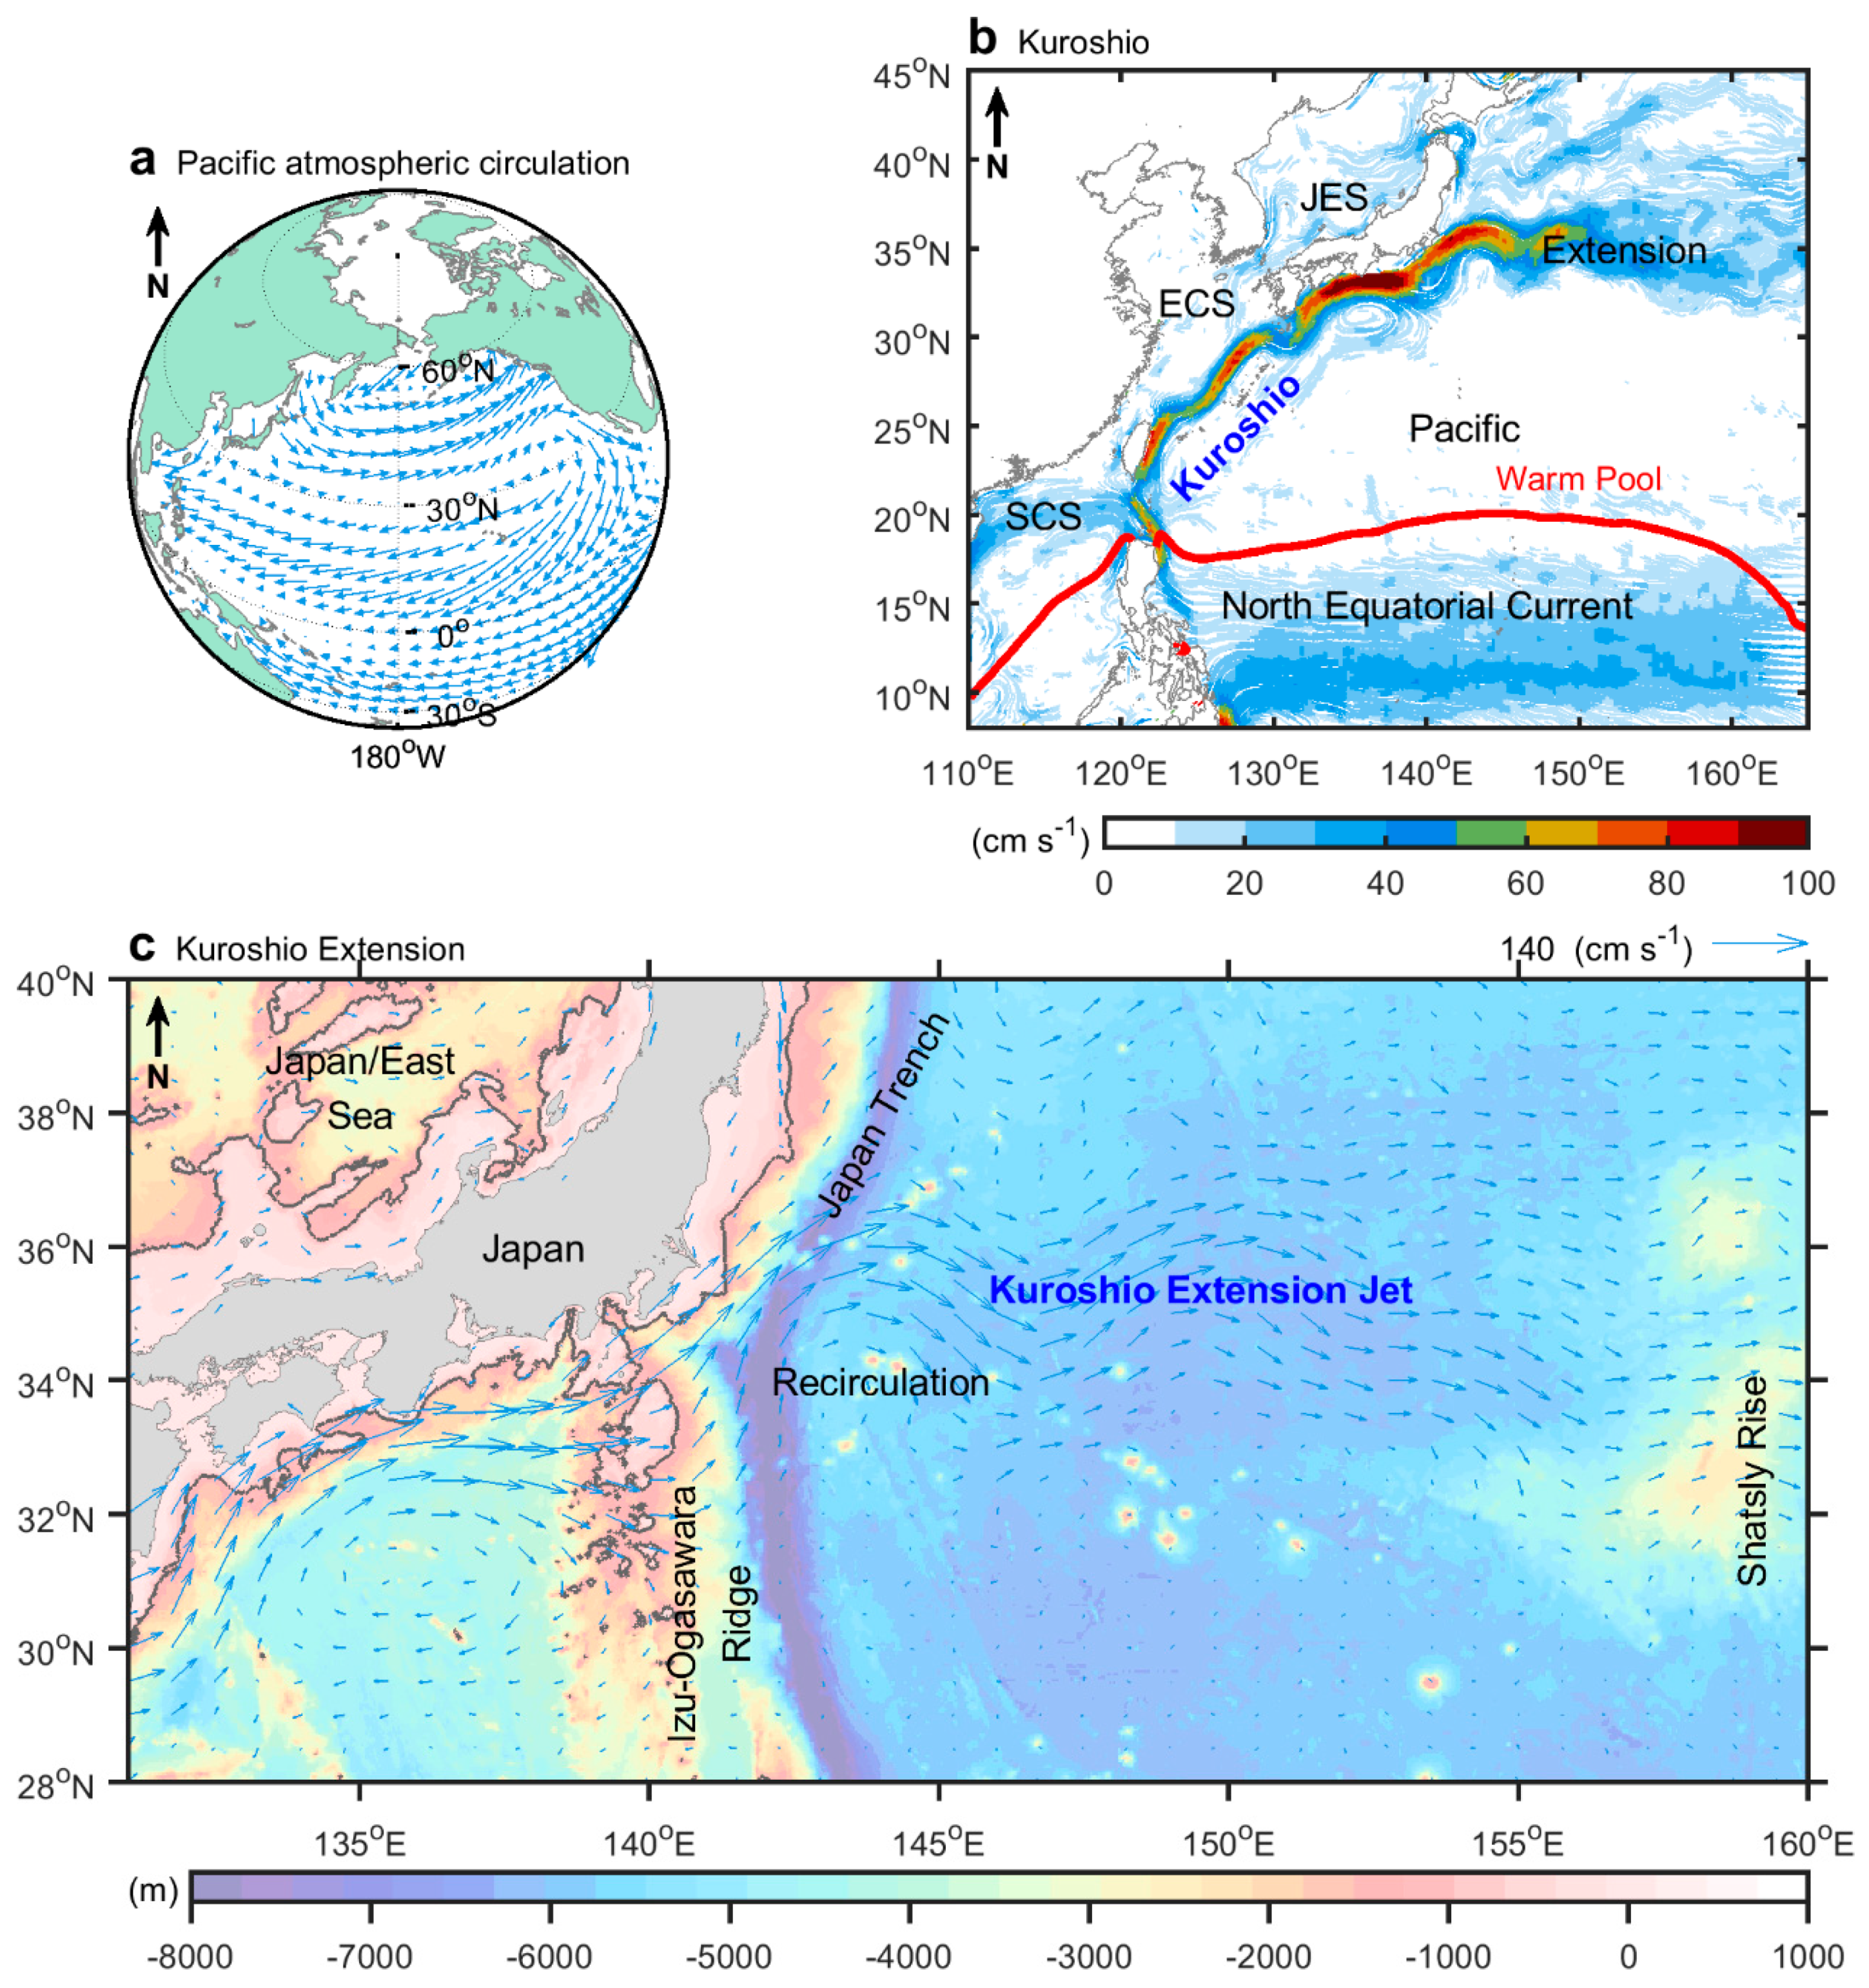
As ocean circulation is mainly driven by surface winds, the Pacific trade winds and westerlies are vitally important to modulating the North Pacific subtropical gyre (Figure 1a). Negative wind stress curl (WSC) between the two wind belts produces southward transport in the interior of the ocean, causing basin-scale southward transport that is compensated by the Kuroshio Current (Figure 1b) [1,2,3,4]. The Kuroshio originates from the north branch of the North Equatorial Current (NEC) as it encounters the Philippine coast [5,6,7], and entrains warm water from the Pacific Warm Pool (Figure 1b). After this, the Kuroshio flows poleward and balances the transfer of energy and mass between the tropical and extratropical regions [1], and between the Pacific and the East Asian Marginal Seas including the South China Sea (SCS) [8,9,10], East China Sea (ECS) [8,9,11,12], and Japan/East Sea (JES) [13,14,15] (Figure 1b).
The Kuroshio flows eastward as the Kuroshio Extension (KE) off Japan into the mid-latitudes of the Pacific, and releases large amounts of heat and moisture into the atmosphere (Figure 1b) [16,17,18,19]. These strong ocean-to-atmosphere fluxes modulate the mean atmospheric state, feed storms, and anchor storm tracks [17,20,21,22,23]. During the winter monsoon season, the transfer of energy becomes dominant due to wind enhancing the mixed layer depth, which allows more heat from the ocean to be released into the atmosphere [24]. Oceanic heat in the KE region is influenced by this process, as evidenced by the slow westward propagation of oceanic mesoscale eddies and variability of the KE jet [25,26,27].
Variability of the KE jet is associated with the intensity of the recirculation gyre south of it and the collision between the Kuroshio and the Izu–Ogasawara Ridge (138.2–141°E) (Figure 1c): As the Kuroshio migrates northward (southward), it passes through a deep channel (shallow segment) in the northern (southern) portion of the Izu–Ogasawara Ridge, which reduces (increases) the instability of the KE jet path based on the conservation of potential vorticity [28,29]. When the recirculation gyre south of the KE jet strengthens (weakens), the KE jet tends to intensify (weaken) [28,29]. The KE jet swings between stable and unstable states at an interannual to decadal timescale. For instance, during the stable periods from 1992 to 1995 and from 2002 to 2004, transport by the KE jet has intensified during northward migration [28]. The variability in the recirculation gyre and the KE jet can be attributed to sea surface height anomalies (SSHAs) generated by anomalous atmospheric circulation over the eastern Pacific [25,28,30].
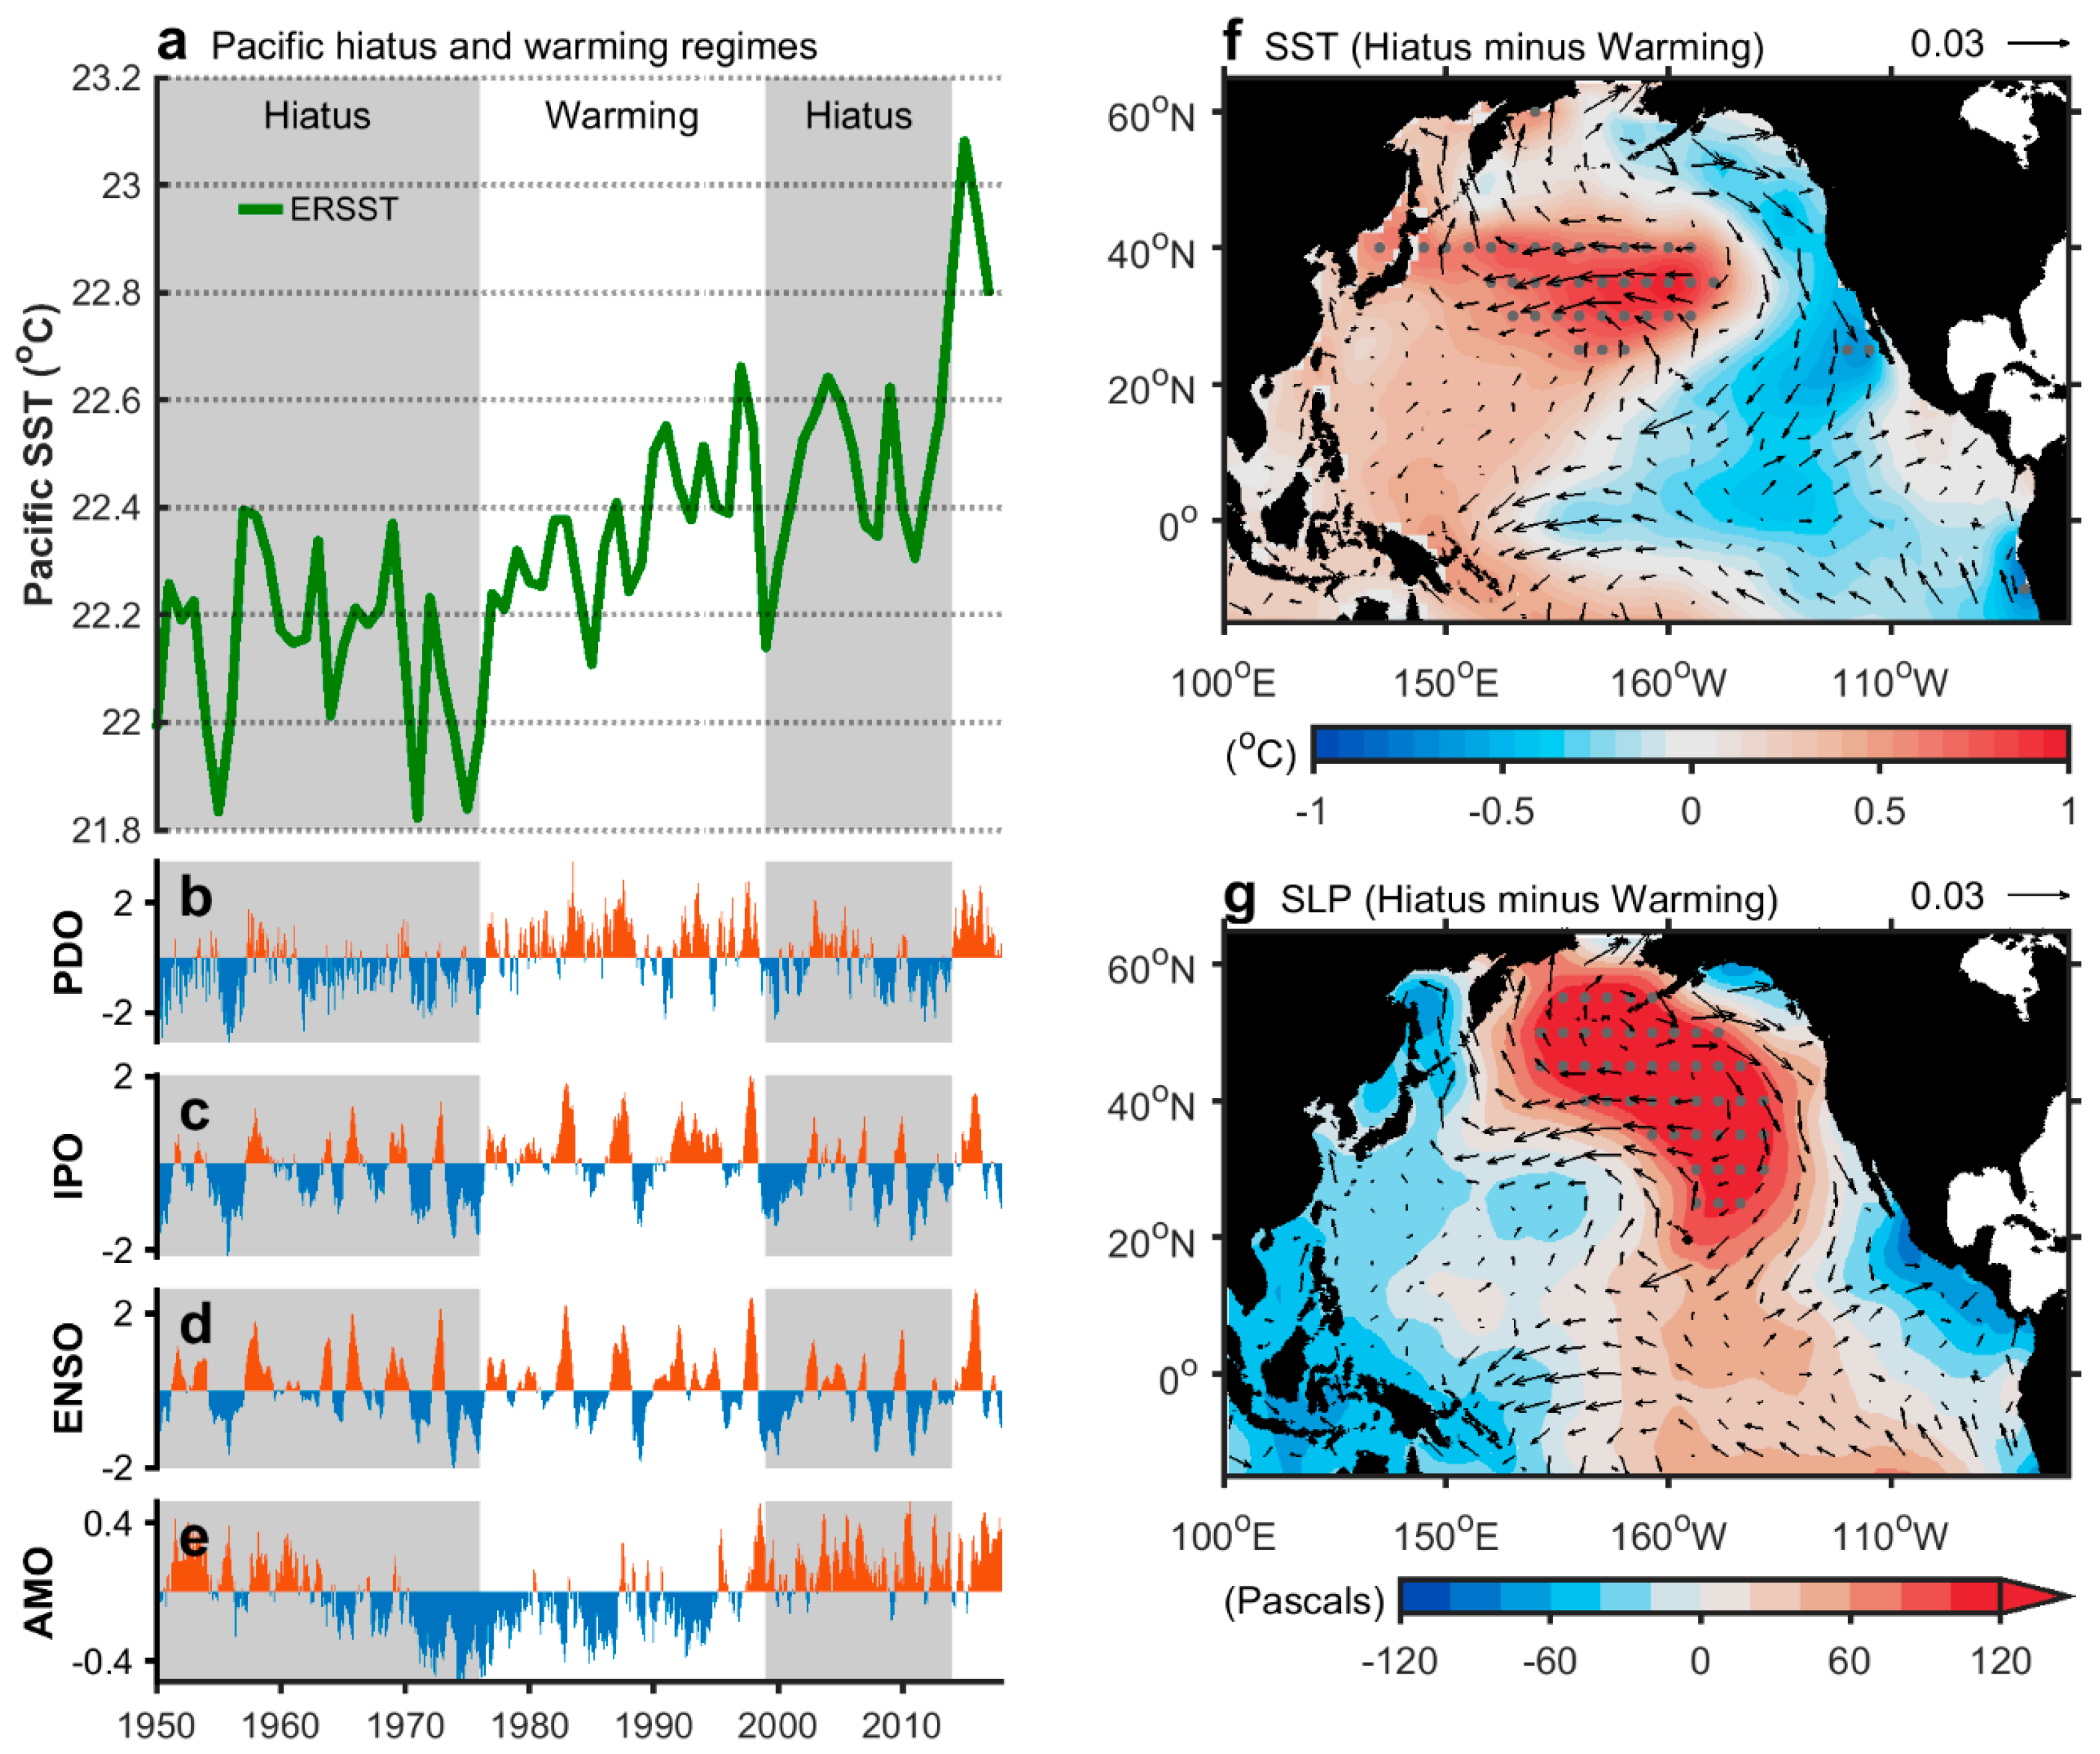
In the last century, global warming has been associated with anomalous atmospheric circulation anchoring the KE jet to a northerly path, which has accelerated warming over the KE region [27]. Despite increased artificial greenhouse gases and global temperature, the Pacific experiences hiatus every decade (Figure 2a) [31]. This oscillation of Pacific Ocean temperatures shares many traits with well-known natural variabilities, such as the Pacific Decadal Oscillation (PDO) [32,33], Interdecadal Pacific Oscillation (IPO) [34,35], El Niño–Southern Oscillation (ENSO) [36], and Atlantic Multidecadal Oscillation (AMO) [37] (Figure 2b–e). The PDO, IPO, and ENSO are defined based on their specific spatial patterns in the Pacific, and their timing is in phase with the oscillation of Pacific Ocean temperatures (Figure 2a–d). Additionally, interbasin effects, such as those from the Atlantic, may also contribute to decadal and multidecadal modulation of the Pacific (Figure 2a,e) [38,39].
During the recent Pacific hiatus regime (1999–2013, gray shading in Figure 2a), cooling signals were primarily recorded in the tropical Pacific, near the west coast of North America and in the Peruvian upwelling zone, in contrast to the 1977–1998 Pacific warming regime (Figure 2f). These features are similar to the so-called “global warming hiatus” [40], where the Pacific, and especially its tropical region, was the major source of cooling signals during the hiatus [41,42]. Periods in which the Pacific experienced regime shifts, such as around 1977, 1998, and 2013, are documented in previous studies [43,44,45,46,47,48]. During the recent Pacific hiatus regime, equatorward wind anomalies off the west coast of North America induced coastal upwelling and transported cold water from the extratropical to the tropical region of the Pacific (Figure 2f). The intensified trade wind enhances equatorial and Peruvian upwelling (Figure 2f) [49]. Similar findings of coastal cooling during 1999–2013 were confirmed in a recent study [50]. The anomalous atmospheric circulation during the cold regime was tied to increased pressure over the Aleutian Low (AL) [49] and decreased pressure over the western Pacific warm pool (Figure 2f,g). The weakened AL was associated with weakened westerlies over the KE region (vector in Figure 2f,g) [51] and intensified equatorial wind off the west coast of North America (vector in Figure 2f,g).
Although recent studies have demonstrated that intensification of the Kuroshio in the tropics is linked to intensified trade winds [49,52,53], while weakening of the Kuroshio in the subtropics was associated with weakened westerlies and basin WSC during the recent Pacific hiatus regime [52,54], it remains unclear how the KE jet responds to this hiatus regime. Here, we show that enhanced warming in the KE region is tied to northward migration and intensification of the KE jet during the recent Pacific hiatus regime. The KE jet also becomes more perturbed in the upstream region west of 146°E, which favors greater heat transfer from the KE jet poleward and into the local atmosphere. We discuss these changes in detail in the following sections.
2. Materials and Methods
In Figure 1, 6-hourly oceanic surface current measured at ~15 m depth from the SVP (Surface Velocity Program) drifter since 1979 was provided by the Global Drifter Program [55] (GDP; http://www.aoml.noaa.gov/phod/dac/index.php)/NOAA (National Oceanic and Atmospheric Administration)). Daily sea surface height anomalies with 0.25° resolution since 1993 were provided by the AVISO (Archiving, Validation and Interpretation of Satellite Oceanographic Data; https://www.aviso.altimetry.fr/en/home.html) in a version of MSLA-DT (Map of Sea Level Anomalies) two-sat. The sea surface height and geostrophic velocity were also obtained from the AVISO in a version of MADT-DT (Map of Absolute Dynamic Topography) two-sat used in Figure 3. The SVP drifter data were gridded on 0.5° meshes after being downloaded. The monthly mean was derived first for all data before analysis.
Three sea surface temperature datasets were used, including the Extended Reconstructed Sea Surface Temperature (ERSST; https://www.ncdc.noaa.gov/data-access/marineocean-data/extended-reconstructed-sea-surface-temperature-ersst-v5) [56], and the OISST (Optimum Interpolation Sea Surface Temperature; https://www.ncdc.noaa.gov/oisst) [57]. The monthly ERSST with 2° resolution since 1854 was used in version of 5. The daily OISST with 0.25° resolution was used in version of high-resolution V2. Comparing to the OISST (Figure 3a), the ERSST did not adequately resolve the warming pattern of the KE jet in Figure 2f which was tied to its low-resolution of 2°.
Monthly wind stress, zonal wind velocity, and sea level pressure with 1.875°, 2.5°, and 2.5° resolution, respectively, since 1948, were adopted from the NCEPr1 (National Centers for Environmental Information/National Center for Atmospheric Research reanalysis 1; https://www.esrl.noaa.gov/psd/data/gridded/data.ncep.reanalysis.html) [58]. The climate indices of the PDO (Pacific Decadal Oscillation, http://research.jisao.washington.edu/pdo/) [32,33], IPO (Interdecadal Pacific Oscillation; https://www.esrl.noaa.gov/psd/data/timeseries/IPOTPI/) [34,35] ONI (Ocean Niño index, a proxy of the El Niño–Southern Oscillation, http://origin.cpc.ncep.noaa.gov/products/analysis_monitoring/ensostuff/ONI_v5.php), and AMO (Atlantic Multidecadal Oscillation, https://www.esrl.noaa.gov/psd/data/timeseries/AMO/) [37] were used in Figure 2b–e.
The path of the KE jet could be detected using particular sea surface height (SSH) values [29]. In Figure 3c, the monthly path of the KE jet was obtained using 90-cm SSH contours according to the estimation provided in Figure S1. A 90-cm interval of SSH could capture the maximum KE jet speed better than the other contour values; these contours represented the axial path of the KE jet (Figure S1). Since SSH data from the AVISO were available after October 1992, we discussed those changes in two eras, the 1993–1998 warming regime and the 1999–2013 hiatus regime, in the following sections.
3. Results
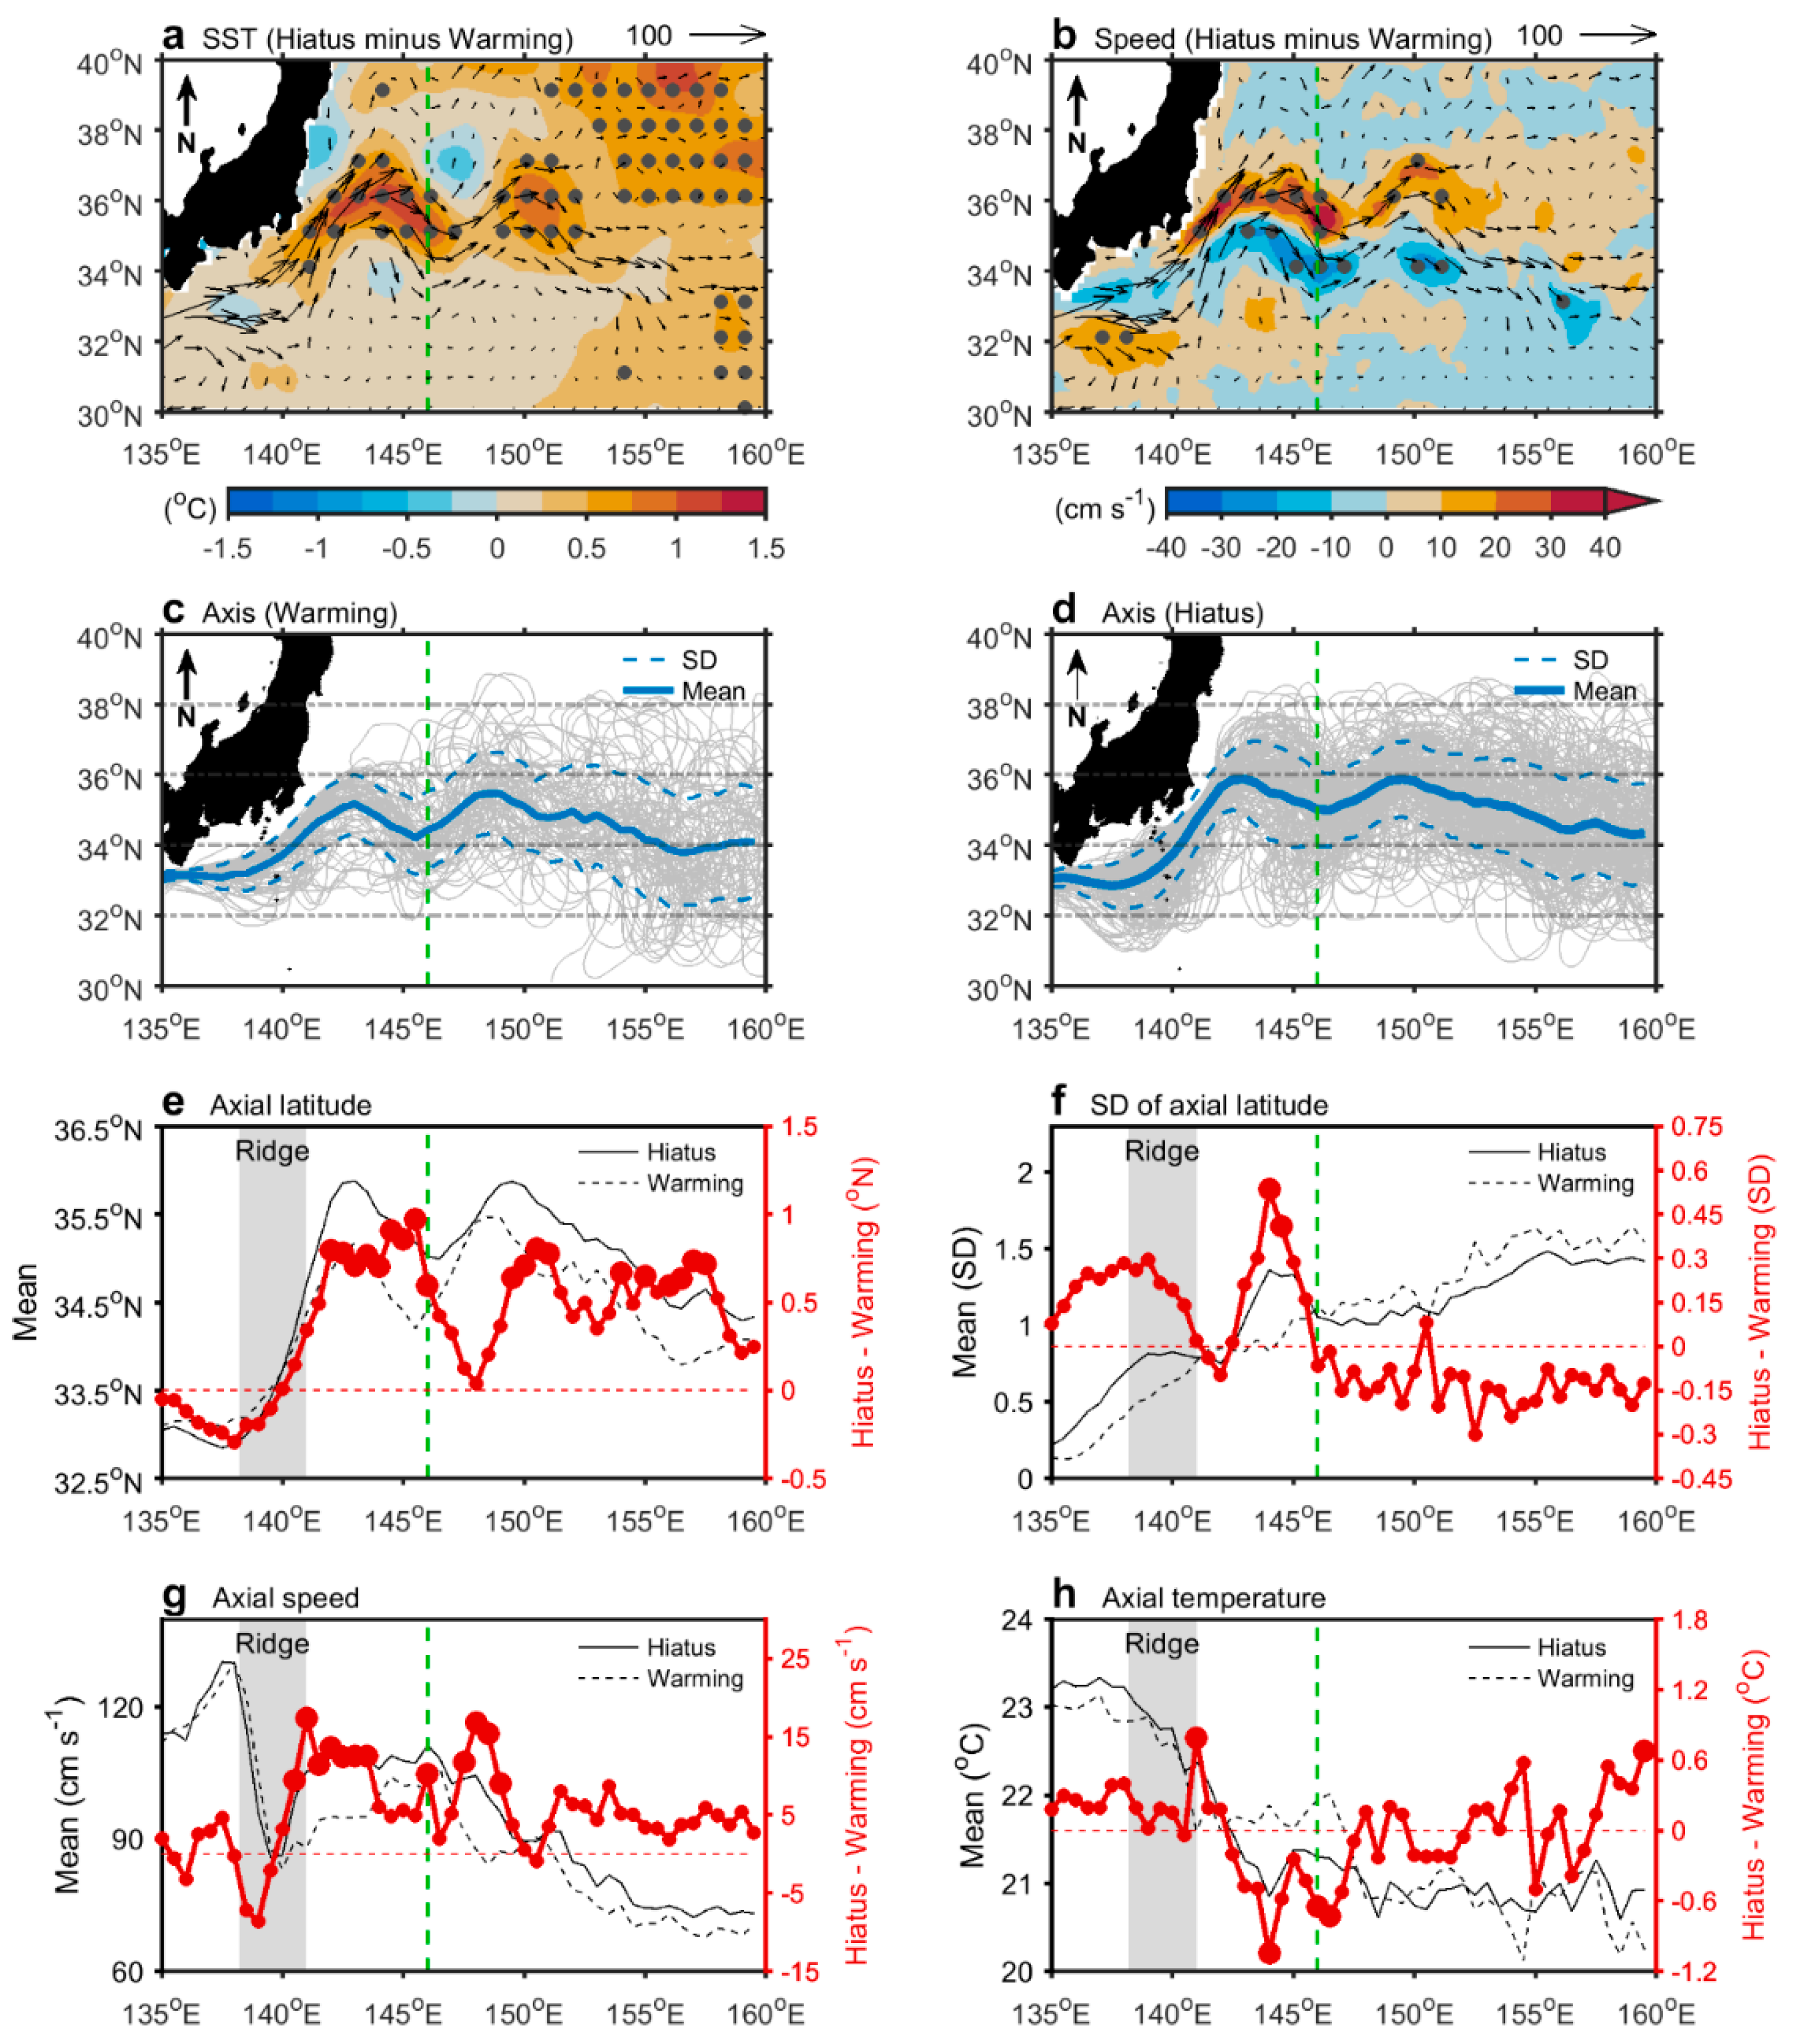
The SST warmed by 1 °C over the north flank of the KE jet during the recent Pacific cold regime (Figure 3a), while the KE jet’s first quasi-stationary meanders (141°E–146°E) [59] simultaneously intensified, reaching 10–40 cm s−1 in its north flank (Figure 3b), which decreased to 10–30 cm s−1 in the south flank. The amplitude of the intensified north flank is greater than that of the south flank, indicating an intensified KE jet, and the meridional variation in speed may be due to northward migration of the KE jet. Although the warming pattern over the KE region appears to be easily explained by the northward migration and intensification of the KE jet, the variability of the KE jet path should also play a role in the enhancement of warming, assuming its path becomes more perturbed. Comparing to the stable KE jet, the perturbed KE jet more often reaches areas at higher latitudes, warming over the region. Furthermore, upstream warming of the Kuroshio may provide more heat to the KE region [27,54]. We quantified changes in the migration, perturbation, speed, and temperature of the KE jet, as detailed in Figure 3c–h.
During the warming regime, the mean path of the KE jet’s first quasi-stationary meander (141°E–146°E) is located at a latitude of 34–35°N (blue curve in Figure 3c). During the hiatus regime, the mean path migrates northward to 35–36°N (blue curve in Figure 3d). The KE jet generally migrated northward by about 1° during the hiatus regime in 1999–2013 relative to the 1993–1998 warming regime. The second quasi-stationary meander (146–152°E) and the downstream KE jet (east 152°E) show similar results, but with less pronounced northward migration. In Figure 3c,d, the degree of perturbation of the KE jet is indicated as an interval of 1 standard deviation (SD) around the latitude of the monthly path (gray curves) during the overall period (blue dashed curve). We found that the KE jet became more perturbed (large SD) in the south of Japan and the first quasi-stationary meander during the hiatus regime compared to the warming regime (cf. Figure 3c,d).
Furthermore, the reason why the KE jet became more perturbed during the hiatus regime was due to the upstream Kuroshio south of Japan migrating southward and colliding with the Izu–Ogasawara Ridge, increasing the instability of the KE jet path in the Pacific. The southward migration of the Kuroshio could be further attributed to the intensified recirculation south of Japan (comparing between Figure S2a,b). The intensified recirculation induced the southward migration of the Kuroshio path, favoring interacting with the Izu–Ogasawara Ridge, resulting in more perturbation in the KE jet. The velocity difference (1999–2013 minus 1993–1998) in Figure S2c illustrated the intensified recirculation to the south of Japan that provided the southeastward velocity anomaly which caused the Kuroshio to shift southward.
We quantified the latitude of the KE jet path and its longitudinal perturbation during the two Pacific regimes in Figure 3e,f. The KE jet migrated southward by 0.3° (Figure 3e; red curve) before passing through the Izu–Ogasawara Ridge (gray shading) and its perturbation increased by 50–60% (Figure 3f; red curve, increased by 0.3 SD, mean during the warming regime near 0.5 SD). After passing through the ridge, the KE jet migrated northward by 0.75–1° (red curve in Figure 3e) and its perturbation increased, reaching 70% (red curve in Figure 3f; a maximum increase of 0.55 SD, mean during the warming regime of 0.8 SD) in the first quasi-stationary meander. The greater perturbation that accompanies the southward migration of the KE jet south of Japan results in it frequently encountering shallow seamounts over the southern part of the Izu–Ogasawara Ridge (138.2–141°E, south 33°N), which cause instability in the path of the first quasi-stationary meander due to the conservation of vorticity. This current–topography interaction has been demonstrated in previous studies [28,29], and was enhanced during the recent Pacific hiatus regime.
The KE jet’s second quasi-stationary meander (146–152°E) also migrated northward as well as eastward. The location of the crest of the second quasi-stationary meander was near 149°E and 35.47°N during the 1993–1998 warming regime (dashed line) and migrated northeastward to 149.5°E and 35.88°N during the recent hiatus regime (solid black line). The northeastward migration of the second meander explained why the KE jet exhibited no migration around 147–148°E in Figure 3e (red curve). The perturbation of the KE jet’s second quasi-stationary meander decreased by 11.5–12.5% (Figure 3f; SD decreased by 0.15, the mean during the warming regime is 1.2–1.3). Similar northward migration and stabilization also occurred in the downstream KE jet (east 152°E) (Figure 3e,f), which migrated northward 0.25–0.75° and stabilized (SD decreased 5%, the mean during the warming regime is 1.5) during the hiatus regime.
In Figure 3g, the difference in axial speed during the hiatus regime compared to the warming regime is small (<5 cm s−1; red curve) before the Kuroshio passes through the Izu–Ogasawara Ridge (west of 138.2°E). After passing through the ridge (east of 141°E), the overall KE jet intensified by 7.8% at 141–160°E (+6.6 cm s−1, with a mean of 84.53 cm s−1), with two peaks located at the two quasi-stationary meanders (intensified by up to 19%; increased by 16–17 cm s−1, the mean during the warming regime is 88 cm s−1). The enhanced warming over the first quasi-stationary meander is attributable to the northward migration, perturbation, and intensification of the first meander of the KE jet.
In Figure 3h, the SST difference along the KE jet axis increased by 0.27 °C (red curve) before passing through the ridge, which provided additional heat to the KE region during the recent hiatus regime. We observed that the SST along the KE jet increased by 0.8 °C at 141°E, but abruptly decreased by 1 °C at 144°E (red curve). The SST decreased by about 1.8 °C from 141°E to 144°E (red curve in Figure 3h), indicating that the heat carried by the KE jet was released dramatically at the first quasi-stationary meander during the hiatus regime. We noted no obvious change in the SST during the warming regime from 141°E to 144°E (dashed curve in Figure 3h), which suggests that the rapid release of heat at the first quasi-meander during the hiatus regime is an unusual feature. Besides, the region of the KE jet with the greatest SST decrease (a proxy for heat release) during the warming regime is located at the second quasi-meander (146–152°E) (dashed curve in Figure 3h). The shift in major heat-releasing regions along the KE jet from the second quasi-stationary meander to the first quasi-stationary meander was caused by changes in the KE jet path. During the recent hiatus regime, the southward-migrated Kuroshio off south Japan obtained more heat from lower-latitude regions, and released the heat after northward migration and perturbation at the first quasi-stationary meander (Figure 3c–e).
We suggest that the unusual enhanced warming over the KE region during the recent Pacific hiatus regime was due to the northward migration and intensification of the KE jet, which has a more perturbed path in the first meander. The cause of this perturbation is attributed to enhanced current-topography interactions, as the Kuroshio more frequently encounters shallow seamounts south of the Izu–Ogasawara Ridge, causing greater perturbation downstream during the hiatus regime. The causes of the northward migration and intensification of the KE jet during the hiatus regime are discussed in the next section. Although the timescales differ, we noted that the changes of the northward migration and intensification of the KE jet during the 1999–2013 hiatus regime were similar to the responses of the KE jet to long-term global warming [27].
4. Discussion
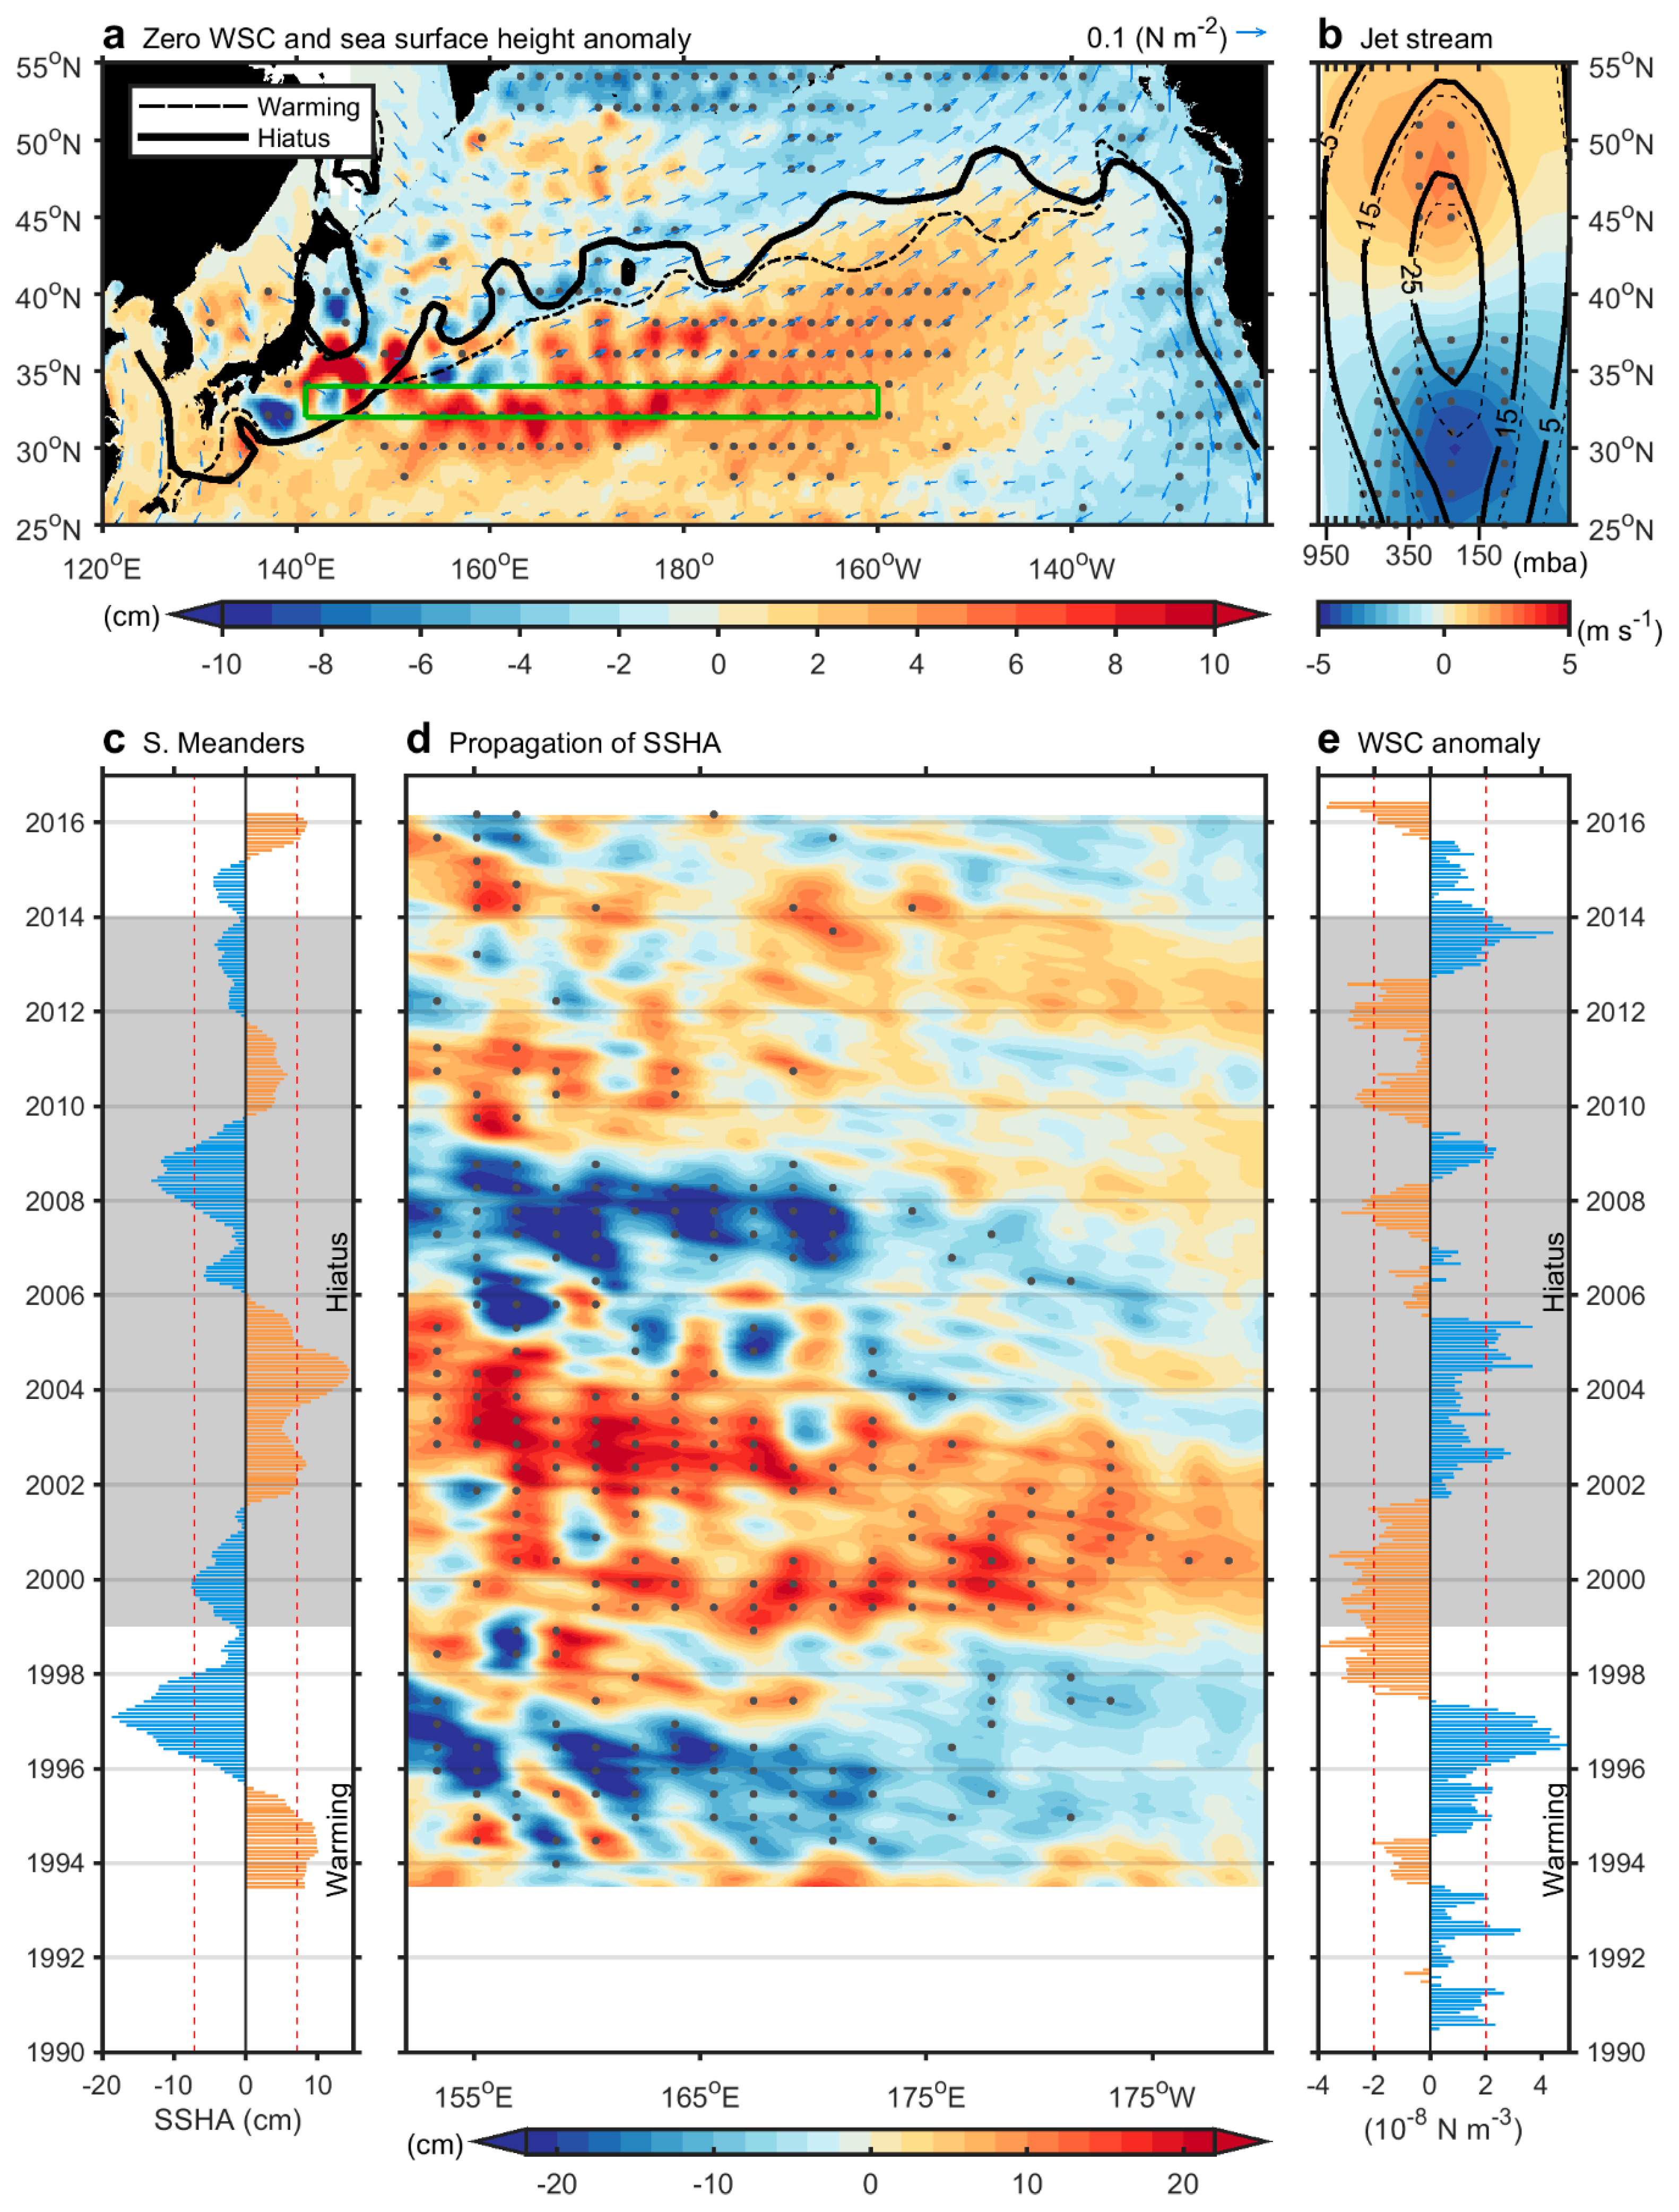
In this study, the poleward-migrated, intensified and perturbed KE jet during the Pacific hiatus regime has been confirmed. These changes contribute to the enhanced warming in the Kuroshio Extension. The meridional variability of the KE jet is fundamentally related to the location of zero WSC (a proxy for the surface westerlies) in the open ocean; zero WSC is the dynamic boundary between the subtropical gyre and the subpolar gyre [1,3]. In Figure 4, the positions of zero WSC during the warming regime and the hiatus regime are indicated as dashed and solid curves, respectively. The position of zero WSC is steady on the western and eastern sides of the North Pacific basin, such as off Japan and North America, during the two regimes (cf. the dashed and solid curves). We noticed that the latitude of zero WSC migrated northward by 1–5° during the hiatus regime compared with during the warming regime (dashed and solid curves in Figure 4a, respectively), which contributed to the northward migration of the KE jet.
As the zero WSC location in the open ocean is a proxy for the mid-latitude westerlies (cf. the dashed and solid curves with the vector in Figure 4a) [3], the migration of zero WSC should be linked to large-scale changes of the atmospheric structure. In Figure 4b, the mean vertical structure of the average zonal wind (160°E–140°W) during the recent hiatus regime (solid curve) and the warming regime (dashed curve) are shown, along with the northward migration of the jet stream in the westerlies (cf. the solid and dashed curves). In Figure 4b, the southern part of the jet stream core (indicated by the 25 m s−1 contour) has migrated northward by 3.6°, from 30.6°N to 34.2°N (cf. the dashed and solid 25 m s−1 contours), while the northern part of the jet stream core has shown less extensive migration (northward shift 2°, from 45.9°N to 47.9°N), reflecting reduction of the meridional size of the jet stream during the recent hiatus regime. Both the northward migration and the reduction in size of the jet stream contribute to the enhanced weakening of its southern portion and intensification of its northern portion (shading in Figure 4b). Furthermore, the northward migration of the jet stream has continued from its core to the atmospheric boundary layer, suggesting that the northward migration of zero WSC shown in Figure 4a is a result of the poleward migration of the jet stream during the recent hiatus regime.
Wind in the basin not only affects the migration of the KE jet, but also produces an eddy-related sea surface height anomaly (SSHA). SSHA signals are mainly generated in the eastern Pacific (160–170°W) and propagate westward into the KE jet, travelling for a few years as a Rossby wave, and are known to contribute to variability in the intensity and perturbation of the KE jet [25,28]. In Figure 3g, the intensification of the KE over the quasi-stationary meanders (142–152°E) is related to a higher SSHA at the south parts of the two meanders (shading in Figure 4a, western side of the green box), as previous studies have demonstrated that variability of the KE jet intensity is associated with SSHAs in the area [29]. During the Pacific hiatus regime, the SSHA increases over the central and eastern Pacific (Figure 4a), which appears to favor intensified geostrophic velocities through the two meanders, assuming that the SSHA spreads westward to arrive at the south parts of the two meanders from the eastern Pacific (shading in Figure 4a along the green box).
We designated a latitudinal section along the south front of the two meanders (32–34°N, based on the mean location of the meanders in Figure 1c; the green box in Figure 4a) to estimate the propagation of the SSHA. Figure 4c shows that the regionally averaged SSHA signal at the south parts of the two meanders (141–152°E, 32–34°N) is positive during 1993-1994 2000–2005 and (defined as a value > 1 SD). Furthermore, the SSHA is negative during 1995–1999, and 2008–2009 (<1 SD; Figure 4c), while other periods show smaller changes (within 1 SD) (Figure 4c). Overall, the results shown in Figure 4c suggest that variability of the SSHA to the south of the two quasi-stationary meanders changes over a decadal timescale, and the properties of this decadal variability have been supported by previous research [28,60].
During the warming regime (before 1998), the SSHA in the two quasi-stationary meanders was in a negative state (−6.03 cm; bar in Figure 4c) in contrast to the recent Pacific hiatus regime (1999–2013), when it increased to 2.5 cm, supporting intensification of the KE jet during the hiatus regime. Previous studies have suggested that SSHA variability to the south of the two meanders is due to westward-propagating mesoscale eddies, which are generated in the eastern Pacific basin [25,28]. In Figure 4d, most SSHA signals to the south of the two meanders can be tracked back to the eastern Pacific, east of 170°W. For instance, the positive SSHA at 152°E in 2003 propagated from 170°W in 2000. Taking 3 years to cross a distance of ~3500 km reflects a propagation speed of about 3.7 cm s−1, which agrees with the propagation speed of mesoscale eddies [61]. Similar estimations have been presented in previous studies [25,28]. The results shown in Figure 4c,d confirm that the SSHA-associated intensification of the KE jet’s two meanders during the Pacific hiatus regime is due to the westward propagation of the SSHA from the eastern Pacific.
As positive (negative) WSC in the eastern Pacific favors the generation of negative (positive) SSHAs in the underlying water [62], changes in SSHAs during the two regimes should reflect the changes in WSC. In Figure 4e, the calculated temporal variability of WSC over the eastern Pacific (170–150°W, 30°–40°N; eastern side of the green box in Figure 4a) is presented. Two generally positive SSHA signals were generated in the eastern Pacific during 1998–2001 and 2007–2012 (shading east 175°W in Figure 4d), which are comparable with the negative WSC patterns occurring during the same periods (Figure 4e). On the other hand, a negative SSHA was generated synchronously with positive WSC during 1993–1996 and 2002–2005. The two WSC-related positive SSHAs generated in 1998–2001 and 2007–2012 contributed to the intensified KE jet during the 1999–2013 hiatus regime. Overall, basin-scale WSC over the eastern Pacific during the warming regime is positive (before 1998; Figure 4e), in contrast to negative values during the hiatus regime (1999–2013; Figure 4e). This negative basin-scale WSC anomaly was caused by the weakened AL, as shown in Figure 2g. The southern part of the weakened AL (red shading in Figure 2g) was located at the latitude of the KE jet (~35°N) and generated negative WSC anomalies during the recent hiatus regime.
Wang and Wu [52] demonstrated that the Kuroshio to the east of Taiwan has weakened during the 1999–2013 hiatus regime. On the other hand, the present study pointed out enhancement of the KE jet during the same period. One curious question is: how was the Kuroshio water budget conserved in the subtropical gyre during the period? To a certain extent, the intensified KE jet during the 1999–2013 hiatus regime was largely due to the intensified recirculation gyre south of the KE jet (indicated by ‘R1’ in Figure S3). The existence of the recirculation gyre has been observed to increase the eastward transport of the KE from the local Sverdrup transport value of ~50 to ~130 Sv (1 Sv = 106 m3s−1) [63].
The enhanced warming over the KE region was attributed to not only the oceanic changes (the KE jet variability in this study) but also the atmospheric changes. Seager et al. [51] pointed out that when the westerlies weakened (intensified), it decreased (increased) the equatorward Ekman drift of the underlying ocean, and favored warming (cooling) conditions over the Pacific mid-latitudes. While the westerlies over the region weakened during the 1999–2013 hiatus [54], the atmospheric variability would also result in warming in the KE region.
In summary, three changed characteristics of the KE jet have been presented. (1) The northward migrated KE jet, which associated with the poleward-shifted basin wind system, including the zero WSC and the mid-latitude jet stream. (2) The intensified KE jet, which related to the oceanic mesoscale eddy variability. (3) The perturbed KE jet, which attributed to the upstream Kuroshio to the south of Japan interacting with the topography. These changed characteristics of the KE jet contributed to the enhanced warming and heat release over the Kuroshio extension during the Pacific hiatus regime.
5. Conclusions
We found that during the recent Pacific hiatus regime (1999–2013), the AL was weakened and the mid-latitude jet stream migrated poleward. During the hiatus regime, the KE enhanced warming, which led to northward migration, intensification, and more perturbation of the KE jet. The increased sea surface temperatures over the upstream region (Kuroshio south of Japan) reinforced the enhanced warming. The northward migration of the KE jet during the hiatus regime was caused by poleward migration of the jet stream. The intensified KE jet attributed to the weakened AL caused negative WSC in the eastern Pacific, which generated positive SSHAs that propagated westward into the KE region, creating an intensified KE jet. The more perturbed KE jet was associated with the location of the Kuroshio in the south of Japan. South of the Izu–Ogasawara Ridge, the Kuroshio frequently encounters shallow seamounts, leading to perturbation of the KE jet. This study indicated that changes to the atmospheric circulation during the recent hiatus regime were not only able to influence the Kuroshio system from the tropics to the subtropics, but also impacted the KE region. Finally, we emphasize that understanding the impacts of the recent Pacific hiatus regime on the climate system, as well as its physical mechanism, is important for improving the predictions in climate models. Following the recent hiatus regime that ended in 2013, these patterns may disappear or reverse due to ongoing warming, and may then return during future hiatus regimes.
Supplementary Materials
The following are available online at https://0-www-mdpi-com.brum.beds.ac.uk/2072-4292/11/1/101/s1, Figure S1: Estimation for the path of the Kuroshio extension jet, Figure S2: Mean SSH and velocity together with their difference, Figure S3: Spatial pattern of SSH and velocity differences.
Author Contributions
Y.-L.W. and C.-R.W. conceived and designed the study. Y.-L.W. led the writing and plotting. C.-R.W. contributed to the writing and data interpretation.
Funding
This research received no external funding.
Acknowledgments
The authors appreciate those who provided the data used in this study. Detailed information for accessing data was presented in the Methods. This research was supported by the Ministry of Science and Technology, ROC, under Grants MOST 107-2611-M-003-003-MY3. This article was subsidized by the National Taiwan Normal University.
Conflicts of Interest
The authors declare no conflict of interest.
References
- Hu, D.; Wu, L.; Cai, W.; Gupta, A.S.; Ganachaud, A.; Qiu, B.; Gordon, A.L.; Lin, X.; Chen, Z.; Hu, S.; et al. Pacific western boundary currents and their roles in climate. Nature 2015, 522, 299–308. [Google Scholar] [CrossRef] [PubMed]
- Nitani, H. Beginning of the Kuroshio. In Kuroshio, Its Physical Aspects; University of Tokyo Press: Tokyo, Japan, 1972; pp. 129–163. [Google Scholar]
- Munk, W.H. On the wind-driven ocean circulation. J. Meteorol. 1950, 7, 80–93. [Google Scholar] [CrossRef]
- Sverdrup, H.U. Wind-driven currents in a baroclinic ocean; with application to the equatorial currents of the eastern Pacific. Proc. Natl. Acad. Sci. USA 1947, 33, 318–326. [Google Scholar] [CrossRef] [PubMed]
- Qu, T.; Lukas, R. The bifurcation of the North Equatorial Current in the Pacific. J. Phys. Oceanogr. 2003, 33, 5–18. [Google Scholar] [CrossRef]
- Qiu, B.; Lukas, R. Seasonal and interannual variability of the North Equatorial Current, the Mindanao Current, and the Kuroshio along the Pacific western boundary. J. Geophys. Res. 1996, 101, 12315–12330. [Google Scholar] [CrossRef]
- Toole, J.M.; Millard, R.C.; Wang, Z.; Pu, S. Observations of the Pacific North Equatorial Current bifurcation at the Philippine coast. J. Phys. Oceanogr. 1990, 20, 307–318. [Google Scholar] [CrossRef]
- Wu, C.-R.; Wang, Y.-L.; Lin, Y.-F.; Chao, S.-Y. Intrusion of the Kuroshio into the South and East China Seas. Sci. Rep. 2017, 7, 7895. [Google Scholar] [CrossRef]
- Hsin, Y.-C. Multidecadal variations of the surface Kuroshio between 1950s and 2000s and its impacts on surrounding waters. J. Geophys. Res. Oceans 2015, 120, 1792–1808. [Google Scholar] [CrossRef] [Green Version]
- Qu, T.; Mitsudera, H.; Yamagata, T. Intrusion of the North Pacific waters into the South China Sea. J. Geophys. Res. Oceans 2000, 105, 6415–6424. [Google Scholar] [CrossRef] [Green Version]
- Isobe, A. Recent advances in ocean-circulation research on the Yellow Sea and East China Sea shelves. J. Oceanogr. 2008, 64, 569–584. [Google Scholar] [CrossRef]
- Guo, X.; Miyazawa, Y.; Yamagata, T. The Kuroshio Onshore Intrusion along the Shelf Break of the East China Sea: The Origin of the Tsushima Warm Current. J. Phys. Oceanogr. 2006, 36, 2205–2231. [Google Scholar] [CrossRef]
- Chang, K.-I.; Teague, W.; Lyu, S.; Perkins, H.; Lee, D.-K.; Watts, D.; Kim, Y.-B.; Mitchell, D.; Lee, C.; Kim, K. Circulation and currents in the southwestern East/Japan Sea: Overview and review. Prog. Oceanogr. 2004, 61, 105–156. [Google Scholar] [CrossRef]
- Kawabe, M. Branching of the Tsushima current in the Japan Sea. J. Oceanogr. Soc. Jpn. 1982, 38, 95–107. [Google Scholar] [CrossRef]
- Huh, O.K. Spring season flow of the Tsushima Current and its separation from the Kuroshio: Satellite evidence. J. Geophys. Res. Oceans 1982, 87, 9687–9693. [Google Scholar] [CrossRef]
- Tozuka, T.; Cronin, M.F.; Tomita, H. Surface frontogenesis by surface heat fluxes in the upstream Kuroshio Extension region. Sci. Rep. 2017, 7, 10258. [Google Scholar] [CrossRef] [PubMed]
- Kida, S.; Mitsudera, H.; Aoki, S.; Guo, X.; Ito, S.-I.; Kobashi, F.; Komori, N.; Kubokawa, A.; Miyama, T.; Morie, R.; et al. Oceanic fronts and jets around Japan: A review. J. Oceanogr. 2015, 71, 469–497. [Google Scholar] [CrossRef]
- Kwon, Y.-O.; Alexander, M.A.; Bond, N.A.; Frankignoul, C.; Nakamura, H.; Qiu, B.; Thompson, L.A. Role of the Gulf Stream and Kuroshio–Oyashio Systems in Large-Scale Atmosphere–Ocean Interaction: A Review. J. Clim. 2010, 23, 3249–3281. [Google Scholar] [CrossRef] [Green Version]
- Yasuda, I. Hydrographic structure and variability in the Kuroshio-Oyashio transition area. J. Oceanogr. 2003, 59, 389–402. [Google Scholar] [CrossRef]
- Wada, A. Unusually rapid intensification of Typhoon Man-yi in 2013 under preexisting warm-water conditions near the Kuroshio front south of Japan. In “Hot Spots” in the Climate System; Springer: Berlin, Germany, 2016; pp. 131–156. [Google Scholar]
- O’Reilly, C.H.; Czaja, A. The response of the Pacific storm track and atmospheric circulation to Kuroshio Extension variability. Q. J. R. Meteor. Soc. 2015, 141, 52–66. [Google Scholar] [CrossRef]
- Nakamura, H.; Sampe, T.; Tanimoto, Y.; Shimpo, A. Observed associations among storm tracks, jet streams and midlatitude oceanic fronts. Earth’s Clim. 2004, 329–345. [Google Scholar] [CrossRef]
- Nonaka, M.; Xie, S.-P. Covariations of sea surface temperature and wind over the Kuroshio and its extension: Evidence for ocean-to-atmosphere feedback. J. Clim. 2003, 16, 1404–1413. [Google Scholar] [CrossRef]
- Xie, S.-P.; Kunitani, T.; Kubokawa, A.; Nonaka, M.; Hosoda, S. Interdecadal thermocline variability in the North Pacific for 1958–97: A GCM simulation. J. Phys. Oceanogr. 2000, 30, 2798–2813. [Google Scholar] [CrossRef]
- Qiu, B.; Chen, S.; Schneider, N. Dynamical links between the decadal variability of the Oyashio and Kuroshio extensions. J. Clim. 2017, 30, 9591–9605. [Google Scholar] [CrossRef]
- Sugimoto, S.; Kako, S.I. Decadal variation in winter mixed layer depth south of the Kuroshio Extension and its influence on winter mixed layer temperature. J. Clim. 2016, 29, 1237–1252. [Google Scholar] [CrossRef]
- Wu, L.; Cai, W.; Zhang, L.; Nakamura, H.; Timmermann, A.; Joyce, T.; McPhaden, M.J.; Alexander, M.; Qiu, B.; Visbeck, M.; et al. Enhanced warming over the global subtropical western boundary currents. Nat. Clim. Chang. 2012, 2, 161–166. [Google Scholar] [CrossRef] [Green Version]
- Qiu, B.; Chen, S. Eddy-mean flow interaction in the decadally modulating Kuroshio Extension system. Deep Sea Res. Part II 2010, 57, 1098–1110. [Google Scholar] [CrossRef]
- Qiu, B.; Chen, S. Variability of the Kuroshio Extension jet, recirculation gyre, and mesoscale eddies on decadal time scales. J. Phys. Oceanogr. 2005, 35, 2090–2103. [Google Scholar] [CrossRef]
- Taguchi, B.; Xie, S.-P.; Schneider, N.; Nonaka, M.; Sasaki, H.; Sasai, Y. Decadal Variability of the Kuroshio Extension: Observations and an Eddy-Resolving Model Hindcast*. J. Clim. 2007, 20, 2357–2377. [Google Scholar] [CrossRef] [Green Version]
- Trenberth, K.E.; Hurrell, J.W. Decadal atmosphere-ocean variations in the Pacific. Clim. Dyn. 1994, 9, 303–319. [Google Scholar] [CrossRef]
- Newman, M.; Alexander, M.A.; Ault, T.R.; Cobb, K.M.; Deser, C.; Di Lorenzo, E.; Mantua, N.J.; Miller, A.J.; Minobe, S.; Nakamura, H. The Pacific decadal oscillation, revisited. J. Clim. 2016, 29, 4399–4427. [Google Scholar] [CrossRef]
- Mantua, N.J.; Hare, S.R.; Zhang, Y.; Wallace, J.M.; Francis, R.C. A Pacific interdecadal climate oscillation with impacts on salmon production. Bull. Am. Meteor. Soc. 1997, 78, 1069–1079. [Google Scholar] [CrossRef]
- Henley, B.J.; Gergis, J.; Karoly, D.J.; Power, S.; Kennedy, J.; Folland, C.K. A tripole index for the interdecadal Pacific oscillation. Clim. Dyn. 2015, 45, 3077–3090. [Google Scholar] [CrossRef]
- Power, S.; Casey, T.; Folland, C.; Colman, A.; Mehta, V. Inter-decadal modulation of the impact of ENSO on Australia. Clim. Dyn. 1999, 15, 319–324. [Google Scholar] [CrossRef]
- Wang, C.; Deser, C.; Yu, J.-Y.; DiNezio, P.; Clement, A. El Niño-Southern Oscillation (ENSO): A review. In Coral Reefs of the Eastern Pacific; Springer: Dordrecht, The Netherlands, 2012; pp. 3–19. [Google Scholar]
- Enfield, D.B.; Mestas-Nuñez, A.M.; Trimble, P.J. The Atlantic multidecadal oscillation and its relation to rainfall and river flows in the continental US. Geophys. Res. Lett. 2001, 28, 2077–2080. [Google Scholar] [CrossRef]
- Kucharski, F.; Ikram, F.; Molteni, F.; Farneti, R.; Kang, I.-S.; No, H.-H.; King, M.P.; Giuliani, G.; Mogensen, K. Atlantic forcing of Pacific decadal variability. Clim. Dyn. 2016, 46, 2337–2351. [Google Scholar] [CrossRef]
- Zhang, R.; Delworth, T.L. Impact of the Atlantic multidecadal oscillation on North Pacific climate variability. Geophys. Res. Lett. 2007, 34. [Google Scholar] [CrossRef]
- Easterling, D.R.; Wehner, M.F. Is the climate warming or cooling? Geophys. Res. Lett. 2009, 36. [Google Scholar] [CrossRef] [Green Version]
- Kosaka, Y.; Xie, S.-P. The tropical Pacific as a key pacemaker of the variable rates of global warming. Nat. Geosci. 2016, 9, 669–673. [Google Scholar] [CrossRef]
- Kosaka, Y.; Xie, S.P. Recent global-warming hiatus tied to equatorial Pacific surface cooling. Nature 2013, 501, 403–407. [Google Scholar] [CrossRef] [PubMed] [Green Version]
- Medhaug, I.; Stolpe, M.B.; Fischer, E.M.; Knutti, R. Reconciling controversies about the ‘global warming hiatus’. Nature 2017, 545, 41–47. [Google Scholar] [CrossRef]
- Hu, S.; Fedorov, A.V. The extreme El Niño of 2015–2016 and the end of global warming hiatus. Geophys. Res. Lett. 2017, 44, 3816–3824. [Google Scholar] [CrossRef]
- Hong, C.-C.; Wu, Y.-K.; Li, T.; Chang, C.-C. The climate regime shift over the Pacific during 1996/1997. Clim. Dyn. 2014, 43, 435–446. [Google Scholar] [CrossRef]
- Bond, N.A.; Overland, J.E.; Spillane, M.; Stabeno, P. Recent shifts in the state of the North Pacific. Geophys. Res. Lett. 2003, 30. [Google Scholar] [CrossRef] [Green Version]
- Mantua, N.J.; Hare, S.R. The Pacific Decadal Oscillation. J. Oceanogr. 2002, 58, 35–44. [Google Scholar] [CrossRef]
- Miller, A.J.; Cayan, D.R.; Barnett, T.P.; Graham, N.E.; Oberhuber, J.M. The 1976-77 climate shift of the Pacific Ocean. Oceanography 1994, 7, 21–26. [Google Scholar] [CrossRef]
- England, M.H.; McGregor, S.; Spence, P.; Meehl, G.A.; Timmermann, A.; Cai, W.; Gupta, A.S.; McPhaden, M.J.; Purich, A.; Santoso, A. Recent intensification of wind-driven circulation in the Pacific and the ongoing warming hiatus. Nat. Clim. Chang. 2014, 4, 222–227. [Google Scholar] [CrossRef] [Green Version]
- Liao, E.; Lu, W.; Yan, X.-H.; Jiang, Y.; Kidwell, A. The coastal ocean response to the global warming acceleration and hiatus. Sci. Rep. 2015, 5, 16630. [Google Scholar] [CrossRef] [PubMed] [Green Version]
- Seager, R.; Kushnir, Y.; Naik, N.H.; Cane, M.A.; Miller, J. Wind-Driven Shifts in the Latitude of the Kuroshio–Oyashio Extension and Generation of SST Anomalies on Decadal Timescales. J. Clim. 2001, 14, 4249–4265. [Google Scholar] [CrossRef]
- Wang, Y.-L.; Wu, C.-R. Discordant multi-decadal trend in the intensity of the Kuroshio along its path during 1993–2013. Sci. Rep. 2018, 8, 14633. [Google Scholar] [CrossRef] [PubMed]
- Wu, C.R.; Wang, Y.L.; Lin, Y.F.; Chiang, T.L.; Wu, C.C. Weakening of the Kuroshio intrusion into the South China Sea under the global warming hiatus. IEEE J. Sel. Top. Appl. Earth Obs. Remote Sens. 2016, 9, 5064–5070. [Google Scholar] [CrossRef]
- Wang, Y.-L.; Wu, C.-R.; Chao, S.-Y. Warming and weakening trends of the Kuroshio during 1993–2013. Geophys. Res. Lett. 2016, 43, 9200–9207. [Google Scholar] [CrossRef]
- Lumpkin, R.; Pazos, M. Measuring surface currents with Surface Velocity Program drifters: The instrument, its data, and some recent results. In Lagrangian Analysis and Prediction of Coastal and Ocean Dynamics; Cambridge University Press: Cambridge, UK, 2007; pp. 39–67. [Google Scholar]
- Huang, B.; Thorne, P.W.; Banzon, V.F.; Boyer, T.; Chepurin, G.; Lawrimore, J.H.; Menne, M.J.; Smith, T.M.; Vose, R.S.; Zhang, H.-M. Extended reconstructed sea surface temperature, version 5 (ERSSTv5): Upgrades, validations, and intercomparisons. J. Clim. 2017, 30, 8179–8205. [Google Scholar] [CrossRef]
- Reynolds, R.W.; Smith, T.M.; Liu, C.; Chelton, D.B.; Casey, K.S.; Schlax, M.G. Daily High-Resolution-Blended Analyses for Sea Surface Temperature. J. Clim. 2007, 20, 5473–5496. [Google Scholar] [CrossRef]
- Kalnay, E.; Kanamitsu, M.; Kistler, R.; Collins, W.; Deaven, D.; Gandin, L.; Iredell, M.; Saha, S.; White, G.; Woollen, J.; et al. The NCEP/NCAR 40-Year Reanalysis Project. Bull. Amer. Meteor. Soc. 1996, 77, 437–471. [Google Scholar] [CrossRef] [Green Version]
- Mizuno, K.; White, W.B. Annual and interannual variability in the Kuroshio current system. J. Phys. Oceanogr. 1983, 13, 1847–1867. [Google Scholar] [CrossRef]
- Taguchi, B.; Qiu, B.; Nonaka, M.; Sasaki, H.; Xie, S.-P.; Schneider, N. Decadal variability of the Kuroshio Extension: Mesoscale eddies and recirculations. Ocean Dyn. 2010, 60, 673–691. [Google Scholar] [CrossRef]
- Chelton, D.B.; Schlax, M.G.; Samelson, R.M.; de Szoeke, R.A. Global observations of large oceanic eddies. Geophys. Res. Lett. 2007, 34. [Google Scholar] [CrossRef] [Green Version]
- Qiu, B.; Chen, S.; Wu, L.; Kida, S. Wind- versus Eddy-Forced Regional Sea Level Trends and Variability in the North Pacific Ocean. J. Clim. 2015, 28, 1561–1577. [Google Scholar] [CrossRef]
- Wijffels, S.E.; Hall, M.M.; Joyce, T.; Torres, D.J.; Hacker, P.; Firing, E. Multiple deep gyres of the western North Pacific: A WOCE section along 149°E. J. Geophys. Res. Oceans 1998, 103, 12985–13009. [Google Scholar] [CrossRef] [Green Version]
Figure 1.
The Kuroshio Extension. (a) Climatology of the Pacific surface atmospheric circulation. The vector indicates the mean wind stress from the National Centers for Environmental Information/National Center for Atmospheric Research reanalysis 1 (NCEPr1); (b) The mean state of the Kuroshio Current system. The thick red contour indicates the boundary of the Pacific warm pool (28 °C, from the Optimum Interpolation Sea Surface Temperature (OISST)). The color of the streamlines indicates the climatological 15 m velocity of the Surface Velocity Program (SVP) drifter. The locations of the Japan/East Sea (JES), East China Sea (ECS), and South China Sea (SCS) are indicated; (c) The Kuroshio Extension. The climatological 15 m velocity (vector), topography (shading), and 1000 m isobaths (contours) are shown.

Figure 2.
The Pacific hiatus and warming regimes. (a) The Pacific hiatus and warming regimes. Time series of the sea surface temperature (SST) over the Pacific (100°E–70°W, 20°S–65°N, domain in Figure 2f) from the Extended Reconstructed Sea Surface Temperature (ERSST) are shown. The periods of 1st and 2nd gray shadings are before 1976 and during 1999–2013, respectively; (b–e) Time series of the Pacific Decadal Oscillation (PDO), Inter-decadal Pacific Oscillation (IPO), El Niño-Southern Oscillation (ENSO), and Atlantic Multi-decadal Oscillation (AMO) are shown; (f) The differences in the SST (shading) and wind stress (vector) are shown, obtained by variables during the 1999–2013 hiatus period minus those during the 1976–1998 warming period; (g) Same as (f), but the shading is sea level pressure (SLP) difference; (f,g) Data are from ERSST and NCEPr1. Gray dots indicate statistical significance above the 90% confidence level. The units of vector in (f,g) are N m−2.

Figure 3.
Intensifying and warming Kuroshio under the recent Pacific hiatus regime. (a) The SST difference (shading; the 1999–2013 hiatus regime minus the 1993–1998 warming regime) and mean velocity (1993–2013; vector, in units of cm s−1) are shown (from OISST); (b) Same as (a), but the shading is the difference of speed (from Archiving, Validation and Interpretation of Satellite Oceanographic Data (AVISO)); (a,b) The gray dots indicate statistical significance above the 90% confidence level; (c) The monthly axis of the Kuroshio Extension (KE) jet during the warming regime (gray curves). The mean path (blue curve) and one standard deviation (SD) of the mean path (blue dashed curves) during the warming regime are shown. The path is defined as the 90-cm contour of the sea surface height according to Figure S1; (d) Same as (c), but for the hiatus regime; (e) The mean axial latitude during the warming regime (black dashed curve) and during the hiatus regime (black solid curve), and the difference of axial latitude (red curve; the hiatus regime minus the warming regime) are shown. The gray shading indicates the location of the Izu–Ogasawara Ridge; (f–h) Same as (e), but for the SD of the axial latitude, the axial speed, and the axial temperature of the KE jet, respectively; (a–h) The green dashed lines indicate the boundary between the two quasi-stationary meanders. Data are based on the AVISO and the OISST; (e–h) The large (small) red dots indicate statistical significance above (below) the 90% confidence level.

Figure 4.
Response of the Kuroshio Extension jet to basin-scale wind change. (a) The position of zero wind stress curl during the Pacific warming regime (1993–1998) (black dashed curve) and during the recent hiatus regime (1999–2013) (black solid curve), the mean wind stress (vector), the difference in sea surface height anomaly (SSHA; from AVISO MSLA-DT) (the hiatus regime minus the warming regime), and the domain along the south part of the two quasi-stationary meanders (green box; 141°E–60°W, 32°N–34°N) are shown; (b) The zonal average (160°E–140°W) of the vertical zonal wind velocities during the hiatus regime (solid contours) and the warming regime (dashed contours) are shown. The shading indicates the difference in zonal wind velocity (the hiatus regime minus the warming regime); (c) The SSHA in the south part of the two quasi-stationary meanders (141–152°E, 32–34°N). The dashed lines indicate one standard deviation interval; (d) The SSHA along the latitude of the south part of the two meanders (152°E–170°W, 32°N–34°N); (e) The wind stress curl anomaly over the eastern Pacific (170°W–150°W, 30°N–40°N; eastern side of the green box in Figure 4a); (c–e) The 13-monthly running average has been applied; (a–e) The annual cycle has been removed via the monthly value minus the monthly climatology; (c,e) The white and gray shadings indicate the periods of the warming regime before 1998 and the hiatus regime during 1999–2013, respectively; (a,b,d) The gray dots indicate statistical significance above the 99% confidence level.

© 2019 by the authors. Licensee MDPI, Basel, Switzerland. This article is an open access article distributed under the terms and conditions of the Creative Commons Attribution (CC BY) license (http://creativecommons.org/licenses/by/4.0/).
Share and Cite
MDPI and ACS Style
Wang, Y.-L.; Wu, C.-R. Enhanced Warming and Intensification of the Kuroshio Extension, 1999–2013. Remote Sens. 2019, 11, 101. https://0-doi-org.brum.beds.ac.uk/10.3390/rs11010101
AMA Style
Wang Y-L, Wu C-R. Enhanced Warming and Intensification of the Kuroshio Extension, 1999–2013. Remote Sensing. 2019; 11(1):101. https://0-doi-org.brum.beds.ac.uk/10.3390/rs11010101
Chicago/Turabian StyleWang, You-Lin, and Chau-Ron Wu. 2019. "Enhanced Warming and Intensification of the Kuroshio Extension, 1999–2013" Remote Sensing 11, no. 1: 101. https://0-doi-org.brum.beds.ac.uk/10.3390/rs11010101
Note that from the first issue of 2016, this journal uses article numbers instead of page numbers. See further details here.