Article

Extended Dependence of the Hydrological Regime on the Land Cover Change in the Three-North Region of China: An Evaluation under Future Climate Conditions

1
State Key Laboratory of Remote Sensing Science, Jointly Sponsored by Beijing Normal University and Institute of Remote Sensing and Digital Earth of Chinese Academy of Sciences, Beijing 100875, China
2
Beijing Engineering Research Center for Global Land Remote Sensing Products, Institute of Remote Sensing Science and Engineering, Faculty of Geographical Science, Beijing Normal University, Beijing 100875, China
*
Author to whom correspondence should be addressed.
Submission received: 27 November 2018 / Revised: 23 December 2018 / Accepted: 28 December 2018 / Published: 4 January 2019
(This article belongs to the Special Issue Remote Sensing of the Terrestrial Hydrologic Cycle)

Abstract

:
The hydrological regime in arid and semi-arid regions is quite sensitive to climate and land cover changes (LCC). The Three-North region (TNR) in China experiences diverse climate conditions, from arid to humid zones. In this region, substantial LCC has occurred over the past decades due to ecological restoration programs and urban expansion. At a regional scale, the hydrological effects of LCC have been demonstrated to be less observable than the effects of climate change, but it is unclear whether or not the effects of LCC may be intensified by future climate conditions. In this study, we employed remote sensing datasets and a macro-scale hydrological modeling to identify the dependence of the future hydrological regime of the TNR on past LCC. The hydrological effects over the period from 2020–2099 were evaluated based on a Representative Concentration Pathway climate scenario. The results indicated that the forest area increased in the northwest (11,691 km2) and the north (69 km2) of China but declined in the northeast (30,042 km2) over the past three decades. Moreover, the urban area has expanded by 1.3% in the TNR. Under the future climate condition, the hydrological regime will be influenced significantly by LCC. Those changes from 1986 to 2015 may alter the future hydrological cycle mainly by promoting runoff (3.24 mm/year) and decreasing evapotranspiration (3.23 mm/year) over the whole region. The spatial distribution of the effects may be extremely uneven: the effects in humid areas would be stronger than those in other areas. Besides, with rising temperatures and precipitation from 2020 to 2099, the LCC may heighten the risk of dryland expansion and flooding more than climate change alone. Despite uncertainties in the datasets and methods, the regional-scale hydrological model provides new insights into the extended impacts of ecological restoration and urbanization on the hydrological regime of the TNR.

1. Introduction

Global climate has changed dramatically over the past few decades as demonstrated by many studies [1,2,3]. Mainly due to human activities, land cover also has experienced various and rapid changes, especially in recent decades [4,5,6,7]. Both changes in climate and land cover could greatly affect the hydrological cycle [8,9,10,11,12] regarding water balance and energy balance processes at various scales [13]. These changes are more likely to result in serious consequences, such as droughts and floods, in arid and semi-arid regions, where the environment is much more vulnerable than in humid areas [14].
The Three-North region (TNR), which is composed of Northwestern, Northern, and Northeastern China, covers arid, semi-arid, and humid areas. The TNR is also an ecologically fragile area, where land degradation has been very serious due to both human activities and changes in natural conditions since the last century, especially in the Northwestern region [15]. In order to solve this problem, the Chinese government has launched a series of ecological restoration programs, beginning in 1978, including the Three-North Forest Shelterbelt (TNFS) program and the restoration of farmland to forest area [15,16]. Meanwhile, other land cover changes (LCC), such as urban expansion and industrialization, have been accelerating since the population has increased sharply [17]. As a result, land cover in the TNR has radically changed over the past 40 years.
There have been many studies in which hydrological responses to climate change and LCCs have been detected through observation or simulation. Based on observation data, the potential evaporation and actual evaporation in most basins of the TNR, and the resulting annual streamflow, had been decreasing from the 1960s until the start of this century [18]. From the 1960s to the 2010s, the observed streamflow showed a negative trend in the Songhua Basin [19], but a positive one in the Tarim River Basin [20].
Some researchers employed hydrological models, such as the Variable Infiltration Capacity (VIC) model, to simulate the hydrological cycle over this region. Hydrological models have their advantages in considering forces from climate, land cover, soil and topography conditions. In the Yellow River Basin which is in TNR, simulation results of VIC model have indicated that the effects of climate change were stronger than those of LCC [21,22]. Some studies have also focused on future changes in the hydrological cycle and applied the VIC model to detect the hydrological response to future climate change under a Representative Concentration Pathway (RCP8.5) scenario and found that, in Northern China, the evaporation and runoff will increase, while soil moisture will decline [23].
Since ecological restoration programs first began, a few studies have been performed to determine whether or not they have had a positive impact. Results show that from 1970s, with the growing afforestation, windy days and dust storms have declined sharply over a wide range of area. In Northwest, North and Northeast China, the number of windy days had decreased by nearly 50%, and so did the number of dust storms. However, a few studies also show that the effectiveness of these programs may have been overestimated [15]. Although they have had some beneficial impacts on controlling dust storms in arid and semi-arid areas in China, the ecological improvements have been very limited. The desertification rates (fractions of total area that has undergone desertification) did not decline after the construction of the afforestation programs, and even rose in some zones. For example, in northeast China, the rate was more than 40% in early 2000s, which is over four times that in mid-1970s [15]. Furthermore, some simulation results have suggested changes in the hydrological conditions of the TNR are mainly due to climate change, especially the redistribution of precipitation, while the contribution of LCC may be very minimal. From 1989 to 2009, climate change contributed to a loss of over 25 mm in ET and over 14 mm in R, while LCC only resulted in small changes no more than 2 mm in these two elements [24].
The majority of studies on the effects of LCC have focused on historical periods, using different methods, such as observation or stimulation based on historical data. However, in future, the climate may be different, since there has been a warmer trend globally, and the effects of LCC may be also influenced by climate change. So, the question remains: will the effects of past LCC on hydrological cycle be changed under future climate scenario within the TNR? Additionally, the exploration can be seen as an evaluation of ecological programs, since the LCC over TNR were affected significantly by those programs, especially in semi-arid and arid areas. The programs have been in place for over 40 years, yet their influence may not be well-recognized due to the short time series.
In this study, the dependence of the future hydrological regime (2020–2099) on past LCC (from 1986 to 2015) in the TNR was evaluated. A macro-scale hydrological model (i.e., the variable infiltration capacity (VIC) model [25,26]) was employed to simulate the hydrological processes over the entire region. Model simulations were performed based on different vegetation parameters generated by datasets from historical land cover information, and the simulations were forced with climate data sets from global climate models (GCMs) from the Inter-Sectoral Impact Model Inter-comparison Project (ISI-MIP) [27]. As this study was aimed at understanding the implications of past LCC on the future hydrological regime, model simulations were performed using historical land cover data rather than the projected future land cover information. The work can be seen as an evaluation for the effects of the ecological restoration programs constructed in past decades, since these programs played a significant role in altering land cover condition, so it may provide some guidance for the following construction of the programs.

2. Data and Methods

2.1. Study Area

The TNR located in the north of China, covers more than 50% of the land area in China, nearly 5.3 million km2 (Figure 1). More than 551 counties across 13 provinces are contained in this region, including Beijing-Tianjin-Hebei, Harbin-Changchun, and other metropolitan areas, where the population has risen sharply. The population in TNR has increased from 344.10 million in 2000 to 384.06 million in 2016 (these data are available at the website of National Bureau of Statistics of China: http://www.stats.gov.cn/). As a result, the urban areas in TNR have been expanding rapidly. There are five large river basins in this region: The Inland River Basin (IRB), Yellow River Basin (YRB), Hai River Basin (HRB), Liao River Basin (LRB), and Songhua River Basin (SRB), from west to east. In fact, the study area is slightly larger than the area of the TNFS because we assess hydrological responses at close to the basin level.
The eastern part of this region is mainly influenced by the East Asian Monsoon, and the western part exhibits a typical continental climate [28]. According to the historical datasets from 1959–2009, the climate across the TNR shows great spatial heterogeneity (Figure 2). The annual precipitation reaches more than 1000 mm/year in the southeast, and gradually declines to less than 50 mm/year in the northwest, with an obvious gradient between these endpoints. Mean annual temperature also presents a wide range of spatial variation, from above 12 °C in the south of the HRB and YRB to under 0 °C in the north of the IRB, but without any apparent gradient over the area as a whole.
According to the land cover map for the year 2015 (Figure 1), the land cover over this region also exhibits distinct spatial variability [29]. In the SRB, forestlands account for nearly 50% of the land cover, and in the YRB, grasslands cover nearly half of the area. In the SRB and LRB, which are densely populated, the dominant land cover type is cropland, while in the IRB, over 60% of the area is unutilized. Additionally, the proportion of urban lands is minute in all basins. In the entire region, over 35% of the area is unutilized, including bare lands and bodies of water, and the most abundant vegetative land cover type is grassland, at nearly 30%, with forestland and cropland coverage being approximately equal at 15%, and the least abundant land cover type is the urban area, at no more than 2%.

2.2. Hydrological Model

The VIC model is a semi-distributed physically-based hydrological model. It can simulate water and energy balance. In the model, a study area is divided into grids according to latitudes and longitudes, and all the calculations are done in each grid separately. In each grid, all elements are computed based on different land cover types, before being averaged according to their correspondent fractions [25,26]. Since the model has been proved to perform well over a range of scales [30,31], we employed it in our study. Here, the spatial resolution of modeling is at 0.5° × 0.5° to ensure consistency with the climate forcing data.

2.3. Data Availability

2.3.1. Vegetation and Soil Parameters

To produce the vegetation parameters for VIC, land use maps and the average leaf area index (LAI) over 12 months are necessary. The two land use maps obtained were created by merging Landsat Thematic Mapper (TM) images for the periods ranging from 1983–1986 and 2010–2015. In these studies, land cover conditions were divided into 12 types as in Figure 1. A human–computer interactive interpretation method of remotely sensed land use cover information was used to interpret these maps, and the accuracy was over 90% [29,32]. The LAI datasets were available from the Global Land Surface Satellite (GLASS) products (http://www.bnu-datacenter.com/) that were retrieved from the Moderate Resolution Imaging Spectroradiometer reflectance data (MOD-09A1) using a general regression neural network algorithm [33]. The resulting combinations of land use and LAI datasets for the two collection periods (1983–1986 and 2010–2015) were referred to as “LC1986” and “LC2015,” respectively. The other parameters, except for the LAI, in the VIC vegetation library data were set as in the study of a previous study [24]. We assumed that the differences between the two combination datasets could accurately represent the progress accomplished by the ecological programs and other factors from 1986 to 2015. The soil parameters were set according to those of a previous study [24], in which the parameters were derived based on the Food and Agriculture Organization of the United Nations (FAO) digital soil map of the world, and they were previously evaluated at a global scale [34,35].

2.3.2. Bias-Corrected Climate Datasets

The climate data sets used in this study are from the Inter-Sectoral Impact Model Inter-comparison Project (ISI-MIP), and are available at: https://esg.pik-potsdam.de/. This project provides a framework to compare climate impact projections in different sectors and at different scales, which enable quantitative synthesis of climate change impacts at different level of global warming [27]. A new bias-correction method was developed within the first stage of this project, which can reduce the bias between daily or monthly simulated and observed climate data, while maintaining the absolute or relevant long-term trend much better than previous methods [36]. In this study, bias-corrected climate data from five GCMs (HadGEM2-ES, GFDL-ESM2M, IPSL-CM5A-LR, MIROC-ESM-CHEM, and NorESM1-M) with a daily time step were selected in order to lessen the uncertainty of a single model. Considering that the RCP8.5 scenario, in which the anthropogenic radiative forcing will approach 8.5W m−2 by 2100 and the concentration of CO2 will be 3–4 times the present value, estimates extremely severe circumstances in future, evaluation of this scenario was assumed to be more important than for others scenarios [37]. Five meteorological datasets were provided under this scenario: precipitation, maximum temperature, minimum temperature, mean wind speed, and downward shortwave radiation at a 0.5° × 0.5° spatial resolution, daily time steps from 2006 to 2099 were collected to generate the climate forcing data. These data are accessible at https://www.isimip.org/outputdata/caveats-fast-track/. Among these data, precipitation, temperature, and wind speed are necessary to force the VIC model, and the downward shortwave radiation plays an important role in detecting the effects of land cover on the hydrological cycle, as it will be redistributed differently according to the various vegetation types.

2.4. Experimental Design

In this study, the VIC model was run based on climate forcing datasets from the five GCMs, as described in Section 2.3.2, and the simulation results were averaged to reduce the uncertainties from the forcing data. Moreover, the model parameters described in Section 2.3 have been extensively validated by a previous study [24], with 15 stations of streamflow data and 10 stations of evapotranspiration (ET) data. The model has shown a favorable performance, with an average Nash–Sutcliffe efficiency for streamflow of 0.55 and a Pearson correlation coefficient for the ET of greater than 0.5 [24]. Therefore, we did not further validate the model parameters.
To identify the impact of historical LCC on the future hydrological regime in the TNR, the present land cover state (corresponding to the LC2015 data) was assumed to remain constant throughout the study period. Thus, two simulation experiments were conducted with different land cover and vegetation input data. The first experiment involved running the model with the LC2015 data to explore changes in the hydrological cycle under the influence of climate change alone. We paid the most attention to the ET, runoff (R), and soil moisture (SM), as these three hydrologic features play important roles in the water cycle, and their values can reflect the ecological conditions of the area to some degree. The time series of the climatic (i.e., precipitation and temperature) and the three hydrological variables were divided into four periods: 2020–2039, 2040–2059, 2060–2079, and 2080–2099 to lessen the uncertainties of a single year in the analysis. The spatial distribution for the four periods, as well as the annual mean values over the entire region, were analyzed to determine the hydrological response to climate change across the TNR.
The second simulation experiment ran the model with the LC1986 data for the same period as in the first simulation. Therefore, the two experiments differ only with respect to their land cover and vegetation data, respectively regarded as the land cover conditions after afforestation (LC2015) and before afforestation (LC1986). Comparison of the two experiments can be used to identify the effects of past LCC on the future hydrological regime under RCP8.5 scenario. The comparative analyses between the two experiments were conducted over different basins and periods. The annual differences and the spatial distribution of the annual mean differences between the two experiments were evaluated to measure the effects of afforestation on the hydrology across the TNR. We also analyzed the differences in four seasons, so as to explore the different effects of LCC in different seasons.

3. Results

3.1. Past Changes in Land Cover

We first identified past LCC. According to the data from Liu et al. (2014), we focused on four primary land cover types: forests, grasslands, croplands, and urban areas. As shown in Table 1, urban expansion played an important role over the last 30 years in the TNR, leading to a substantial decrease in the cropland and grassland areas of most basins. In the HRB, the urban area expanded from 2.5% to 9%, resulting in a decrease in cropland areas, and in the LRB, the urban area doubled, which caused a decline in the other land cover types. In the western three basins, the IRB, YRB, and HRB, due to afforestation projects, the forest area has slightly increased. The YRB is the basin where the forestland increased the most, from 12% to 13%, and the increases in the other two basins were under 0.4%. Meanwhile, in the other two basins, the SRB and LRB, the forest area decreased, especially in the SRB, where the reduction was greater than 3%. The reason for the reduction in forestlands in these two basins may be the expansion of croplands and urban areas. For the entire region overall, the proportion of forestlands, grasslands, croplands, and others land cover types all decreased because of the expansion of urban areas.
Due to afforestation programs and favorable climate conditions, the vegetation in the TNR has grown substantially. We calculated the vegetation index (i.e., the mean LAI from January to December) across the TNR, and the results are shown in Figure 3. Because of the growth of vegetation, the LAI peaked from July to August, and exhibited the lowest values from December to February. The average values between 1983–1986 and 2011–2015 were compared, and the results show that there has been a great improvement in the LAI over the entire region, especially in July and August when it increased by over 0.5.

3.2. Future Climate Change

To determine the temperature changes projected for the future under the RCP8.5 scenario, we averaged the datasets of five models, and averaged the maximum and minimum temperatures as the mean temperature. In order to correspond to the hydrological changes analyzed, we also selected the period from 2020–2099 as the experimental interval. The mean annual temperatures (MATs) across two different periods, 2020–2039 and 2080–2099, are shown in Figure 4. We found that the spatial pattern across the TNR may not change in future. The HRB will remain the hottest basin, while the SRB will remain the coldest, and the differences between the two periods were very similar in each area. The northeast of the SRB and the north and southwest of the IRB are the areas where temperatures will increase the most, by more than 3.6 °C, and in the south of the YRB, the change will be slightly less at ~3 °C. The MAT of the entire region will rise steadily from nearly 5.5 °C to over 10 °C (Figure 5).
The spatial pattern of precipitation also may not exhibit obvious changes obviously; there will remain an obvious declining gradient from the southeast to northeast. As shown in Figure 3, the south of the LRB will remain the wettest area, where the annual precipitation will be over 1400 mm from 2080–2099, and the west of the IRB will be the driest, remaining under 50 mm. Additionally, except in some small zones in the west and north of the IRB, the precipitation will increase from 2020–2039 to 2080–2099 over the entire TNR. The spatial distribution of difference is consistent with that of the precipitation, with the southwest experiencing the most change (more than 180 mm), and the northeast experiencing the least, less than 10 mm or even less than 0 mm. The mean annual precipitation (MAP) of the entire region is shown in Figure 5. There will be a positive, linear trend overall, but the variability will also rise, which means that the discrepancy between the years will also increase. As for wind speed and downward shortwave radiation, no remarkable changes were found (the results were not shown.).

3.3. Hydrological Responses to Future Climate Change

We examined the changes in three hydrological variables, ET, R, and SM, from the VIC model, based on the input of the LC2015 data. As with the analysis of climate change, all values were averaged by the five simulations that were driven by data from the five GCMs, as described in Section 2.3.1. Additionally, we focused on the period from 2020–2099, since the period from 2006–2019 was set as the warm-up period for the VIC model.
The annual mean ET, R, and SM in two corresponding periods (i.e., 2020–2039 and 2080–2099) are shown in Figure 6. The distributions of ET and R are similar to that of precipitation. In the period from 2080–2099, ET decreased from over 1000 mm in the southeast to under 50 mm in the northwest, and R from more than 400 mm to less than 10 mm. Due to the complex spatial variabilities in climate and land surface conditions, the distribution of SM differed from those of ET and R. Across the three eastern basins (i.e., the SR, LR, and HRB), the SM in most areas will be greater than 700 mm, while over the majority of the other two basins, the SM will remain under 400 mm, and even under 200 mm in some areas. In each basin, it was obvious that the SM may rise in those areas where the soil was wetter, but decline in the drier areas.
The three hydrological variables exhibited significant temporal changes. Comparing the results from the two periods (2020–2039 and 2080–2099), we found that ET will increase over the vast majority of the TNR because of the increases in precipitation and temperature. This increase may approach over 150 mm in the southeast, especially in those areas with forest cover. As for SM, the changes appeared closely related to the land cover type. In the entire region, rising temperatures will aggravate the water loss by ET, especially in the areas with forest cover in the SRB, LRB, and HRB, as well as in the areas with grassland cover in the IRB and YRB, leading to a decrease in SM, although precipitation will also greatly increase SM. In other areas, the increase in precipitation will be able to compensate for the loss by ET, so the SM will increase. The center of the SRB and northwest of the IRB are the areas where SM will increase the most; in the southwest of the YRB and as the south of the SRB, the SM will decrease the most, by over 20 mm. The changes in R will be directly influenced by the changes in precipitation, ET, and SM. In most areas, the R will increase, while decrease only in some small zones.
The annual mean ET, R, and SM for the entire TNR are shown in Figure 7. As with the changes in precipitation, the ET and R will both experience a positive and fluctuating trend. Because of rising temperatures, the trend of ET is more pronounced than that of R, and the fluctuations in R are greater than those of ET. The SM will increase in the first 20 years and then remain relatively stable at 510 mm from 2030 onward.

3.4. Hydrological Effects of Past Land Cover Changes (LCC)

Based on the two simulation experiments performed in this study, we can quantify the contribution of past LCC on the future hydrological regime. The differences in ET, R, and SM between the two experiments for the period from 2080–2099 are shown in Figure 8. It is obvious that across nearly all the TNR, LCC will result in a reduction of ET, as the areas with vegetation cover decreased, as illustrated in Section 3.1, though the LAI increased to some degree. In particular, the center and the southeast of the HRB is the area where the ET decreased most distinctly, by over 40 mm. Only in a few grids, such as in the center and the east of the SRB and the center of the YRB, where the ET increase within a range of 40–60 mm. As for the changes in R, the distribution is somewhat complex. Contrary to that of ET, in a majority of the eastern part of the TNR, R will increase, which is mainly because of the reduction of ET. The center and southeast of the HRB will be the place where the difference is the greatest, by over 40 mm. Some grids in the east of the SRB are the areas where R will decrease the most, by more than 60 mm in 2080–2099. As for the west part of TNR, R will increase in nearly half of the grids and decrease in the others grids, while the range may not be greater than 20 mm. As SM is very sensitive to the ET process, its distribution is similar to that of R across the majority of TNR, but the maximum increase will be in the center and southeast of the HRB, where urban expansion is the most intense, and will reach over 80 mm. SM will decrease in some areas in the SRB by over 80 mm. In contrast, in some areas across the northeast of the IRB, SM will decrease by more than 120 mm. Overall, the effects of LCC on R and SM may be positive in the SRB, LRB, HRB, and YRB, but negative in the IRB.
The annual mean changes in ET, R, and SM are shown in Figure 9. Obviously, the changes in land cover will cause a decrease in ET, as well as increases in R and SM. Similar to the change in annual precipitation, there is a positive trend in these effects over time, which means that under the RCP8.5 scenario, LCC will more strongly influence the hydrological cycle in the future than at present.
The shifts in the hydrological regime due to past LCC also exhibit obvious seasonal variability; Figure 10 shows the shifts in ET among the four seasons across every basin. Across most of the basins, the effects in spring, summer, and autumn will be negative, while they will be positive during winter. For example, across the YRB from 2080–2099, the shift will be nearly 0.1 mm in winter, and −1.9 mm, −3.1 mm, and −0.4 mm in spring, summer, and autumn, respectively. Moreover, the HRB will be the most strongly affected, with a change of over 10 mm in the summer; the magnitude of change observed in the HRB is followed by that for the LRB (~9 mm in the summer), and in the IRB, where effects are the weakest, there will be a change of no more than 0.5 mm. The effects of LCC on R and SM across the TNR are shown in Figure 11. In every season, the shifts in R and SM due to LCC will be positive, and stronger from 2080–2099 than in other periods. Especially in the summer, R and SM may significantly by ~2 mm. A similar positive pattern will likely appear in each of the five basins despite different amounts of change.

4. Discussion

4.1. Extended Effects on Hydrological Regimes of Climate Change and LCC

In this study, we detected the future hydrological regime based on current land cover condition (LC2015) at first. In previous studies about the predicted hydrological regime in TNR, especially under the most extreme scenario, some similar results were obtained. Over the entire region, annual ET may increase steadily under RCP8.5 scenario, possibly due to the increasing temperature and precipitation [23]. Other researchers found that annual R would increase in most areas of TNR, especially in eastern basins [38], which is consistent with our study. Additionally, other study also found the interannual changes in ET and R may be expanded under RCP8.5 scenario, which means they may be more fluctuating in future [23], resulting from the fluctuating P. Those studies all predicted an uneven distribution in changes of R. In those humid areas, the increase in R may be much more than that in arid and semi-arid areas, and in some arid areas over Northwest China, the R may even experience a decrease [23,38]. The reason may be that in humid areas, the increase in P could compensate for the water loss caused by ET, while in those arid or semi-arid areas it could not. Many studies based on various scales and time series have summoned a similar result: “Wet get wetter, dry get drier” [39,40,41]. In our study, the SM in those areas densely covered by vegetation may experience a decrease in future, while in other areas the SM would rise in contrary. It can be attributed to the effects in promoting ET by vegetations, especially driven by increasing temperature. In other study, researchers predicted that over each basin in TNR, the SM would decline in future [23], which is inconsistent with our study, and those differences may be caused by the choose in soil depth.
Then we explored the dependence of the future hydrological regime on past LCC. With the progress of ecological restoration from 1986 to 2015, including afforestation, the forest area increased in North China (i.e., in the HRB) and in Northwest China (i.e., in the IRB), but decreased in Northeast China (i.e., in the HRB and LRB). The TNR also showed a significant increase in urban area of ~1.3% (52,701 km2) due to rapid urbanization. Results show that compared to the effects of climate change, those of LCC would be far less observable. Based on past climate condition, other study has found the similar conclusion that the LCC did not obviously alter the hydrological regime at a regional scale [24]. There was also study that found the afforestation did not help solve, and even aggravate the desertification in arid and semi-arid areas [15]. However, although the effects may be less observable than those of climate change, our study found that under the projected climate scenario they may also be intensified, and could be able to alter the hydrological regime in some areas. Growing temperature and precipitation may be responsible for the amplification in those effects. We also explored the effects in different seasons. Most improved R and SM may occur in summer, because P in this season may be much more than in other seasons and the abundance of water resources could intensify the effects of LCC.

4.2. Implications

Our results predicted the future hydrological regime under RCP8.5 scenario, and it may bring some consequences. The increasing ET will likely lead to drier conditions in the TNR, especially in those arid regions (i.e., the IRB), where the SM may decrease. This finding imply that climate change may cause dryland expansion and exacerbate the risk of land degradation and desertification. Moreover, R would also rise in future, particularly in areas with dense population (i.e., the HRB), which may enhance the risk of flooding. Besides, the fluctuation in R may lead to the amplification of the inter-annual gap in water resources, so more solutions may need to be done to balance the temporal distribution.
Land cover change due to urbanization may slowly inhibit the increase of ET to some degree, but accelerate R in most areas. These effects are much stronger in the eastern basins than in the western ones. The majority of arid and semi-arid areas are located in the IRB, where effects are limited, while in the humid areas, such as the SRB, LRB, and HRB, increasing R caused by LCC may increase the risk of floods in the summer, especially in those places where the cities are densely structured. Considering that climate change may also have the similar effects, floods in these areas would be severe problems. Additionally, in arid and semi-arid regions, such as IRB, the ecological restoration programs have expanded the areas of forest or grass, and such change may increase the ET and decrease the R and SM, which can further intensify desertification and other forms of environmental degradation, since the rising temperature may have exacerbated these risks.
Overall, the progress of ecological programs may be unable to help balance neither spatial nor temporal distribution. In humid areas, the risk of floods may be heightened, especially in summer, while in arid and semi-arid areas, the desertification and drought could not be solved. Such results could aggravate the results “dry get drier, wet get wetter”, which are caused by climate change [39,40,41].

4.3. Potential Limitations

Potential limitations still exist in this study with respect to the data, the methods, and modeling. First, there are biases within the projected climate datasets. Our study was focused on detecting the regularity of hydrological changes in the future, so such biases could be neglected to some degree. Second, the RCP8.5 scenario that was considered in this study is much more extreme than others scenarios, and we only explored the hydrological response under this scenario. However, when only one scenario is considered, it may result in uncertainties, so additional scenarios should also be considered in future studies. Third, differences in the spatial resolution between the model and land cover data may induce uncertainties in the simulations. The spatial resolution in this study was 0.5° × 0.5°, which was limited by the projected climate forcing datasets. Although the vegetation parameters were generated with 1 km × 1 km land cover maps and LAI datasets, there were also changes in smaller zones, especially some extreme events that could not be captured. Perhaps downscaling the forcing data to a finer resolution can be used to ease this problem to some degree. Finally, in this study we considered climate change and LCC as two independent factors. However, a great number of studies have suggested that there are links between them [42,43]. We kept the land cover condition unchanged when simulating, but the climate would change dramatically in future under RCP8.5 scenario, and the growth of vegetation in some areas may be threatened by the slightly increasing temperature. In our study, we intend to evaluate the hydrological effects of past LCC (or the progress that has been achieved by series of ecological restoration programs), rather than predicting how the hydrological regime would change in future, so this could be acceptable. If we want to do a more accurate projection in future researches, an improved VIC model which can couple dynamic vegetation parameters, reliable predicted land cover condition and LAI should be necessary.

5. Conclusions

This study employed remote sensing data and macro-scale hydrological modeling, and determined the role of past LCC in reshaping the future hydrological regime across the TNR of China. Land cover change may have imposed minor impacts on the hydrological regime over the past three decades. In contrast, it was found in this study that LCC may play a more significant role in altering ET and R in the future. The conclusions are as follows:
(1)
There has been a significant change in land cover in the TNR over the past three decades, primarily due to ecological restoration projects, urban expansion, and industrialization. In most basins across the TNR, urban areas expanded, leading to the reduction of other land cover types, and the replaced land cover types vary among basins. Forest areas increased in the south and the west of the TNR (i.e., in the HRB, YRB, and IRB), but decreased in Northeast China (i.e., in the HRB and LRB). With afforestation and favorable climate conditions, LAI exhibited a positive change in all basins, and the most significant changes occurred between July and August.
(2)
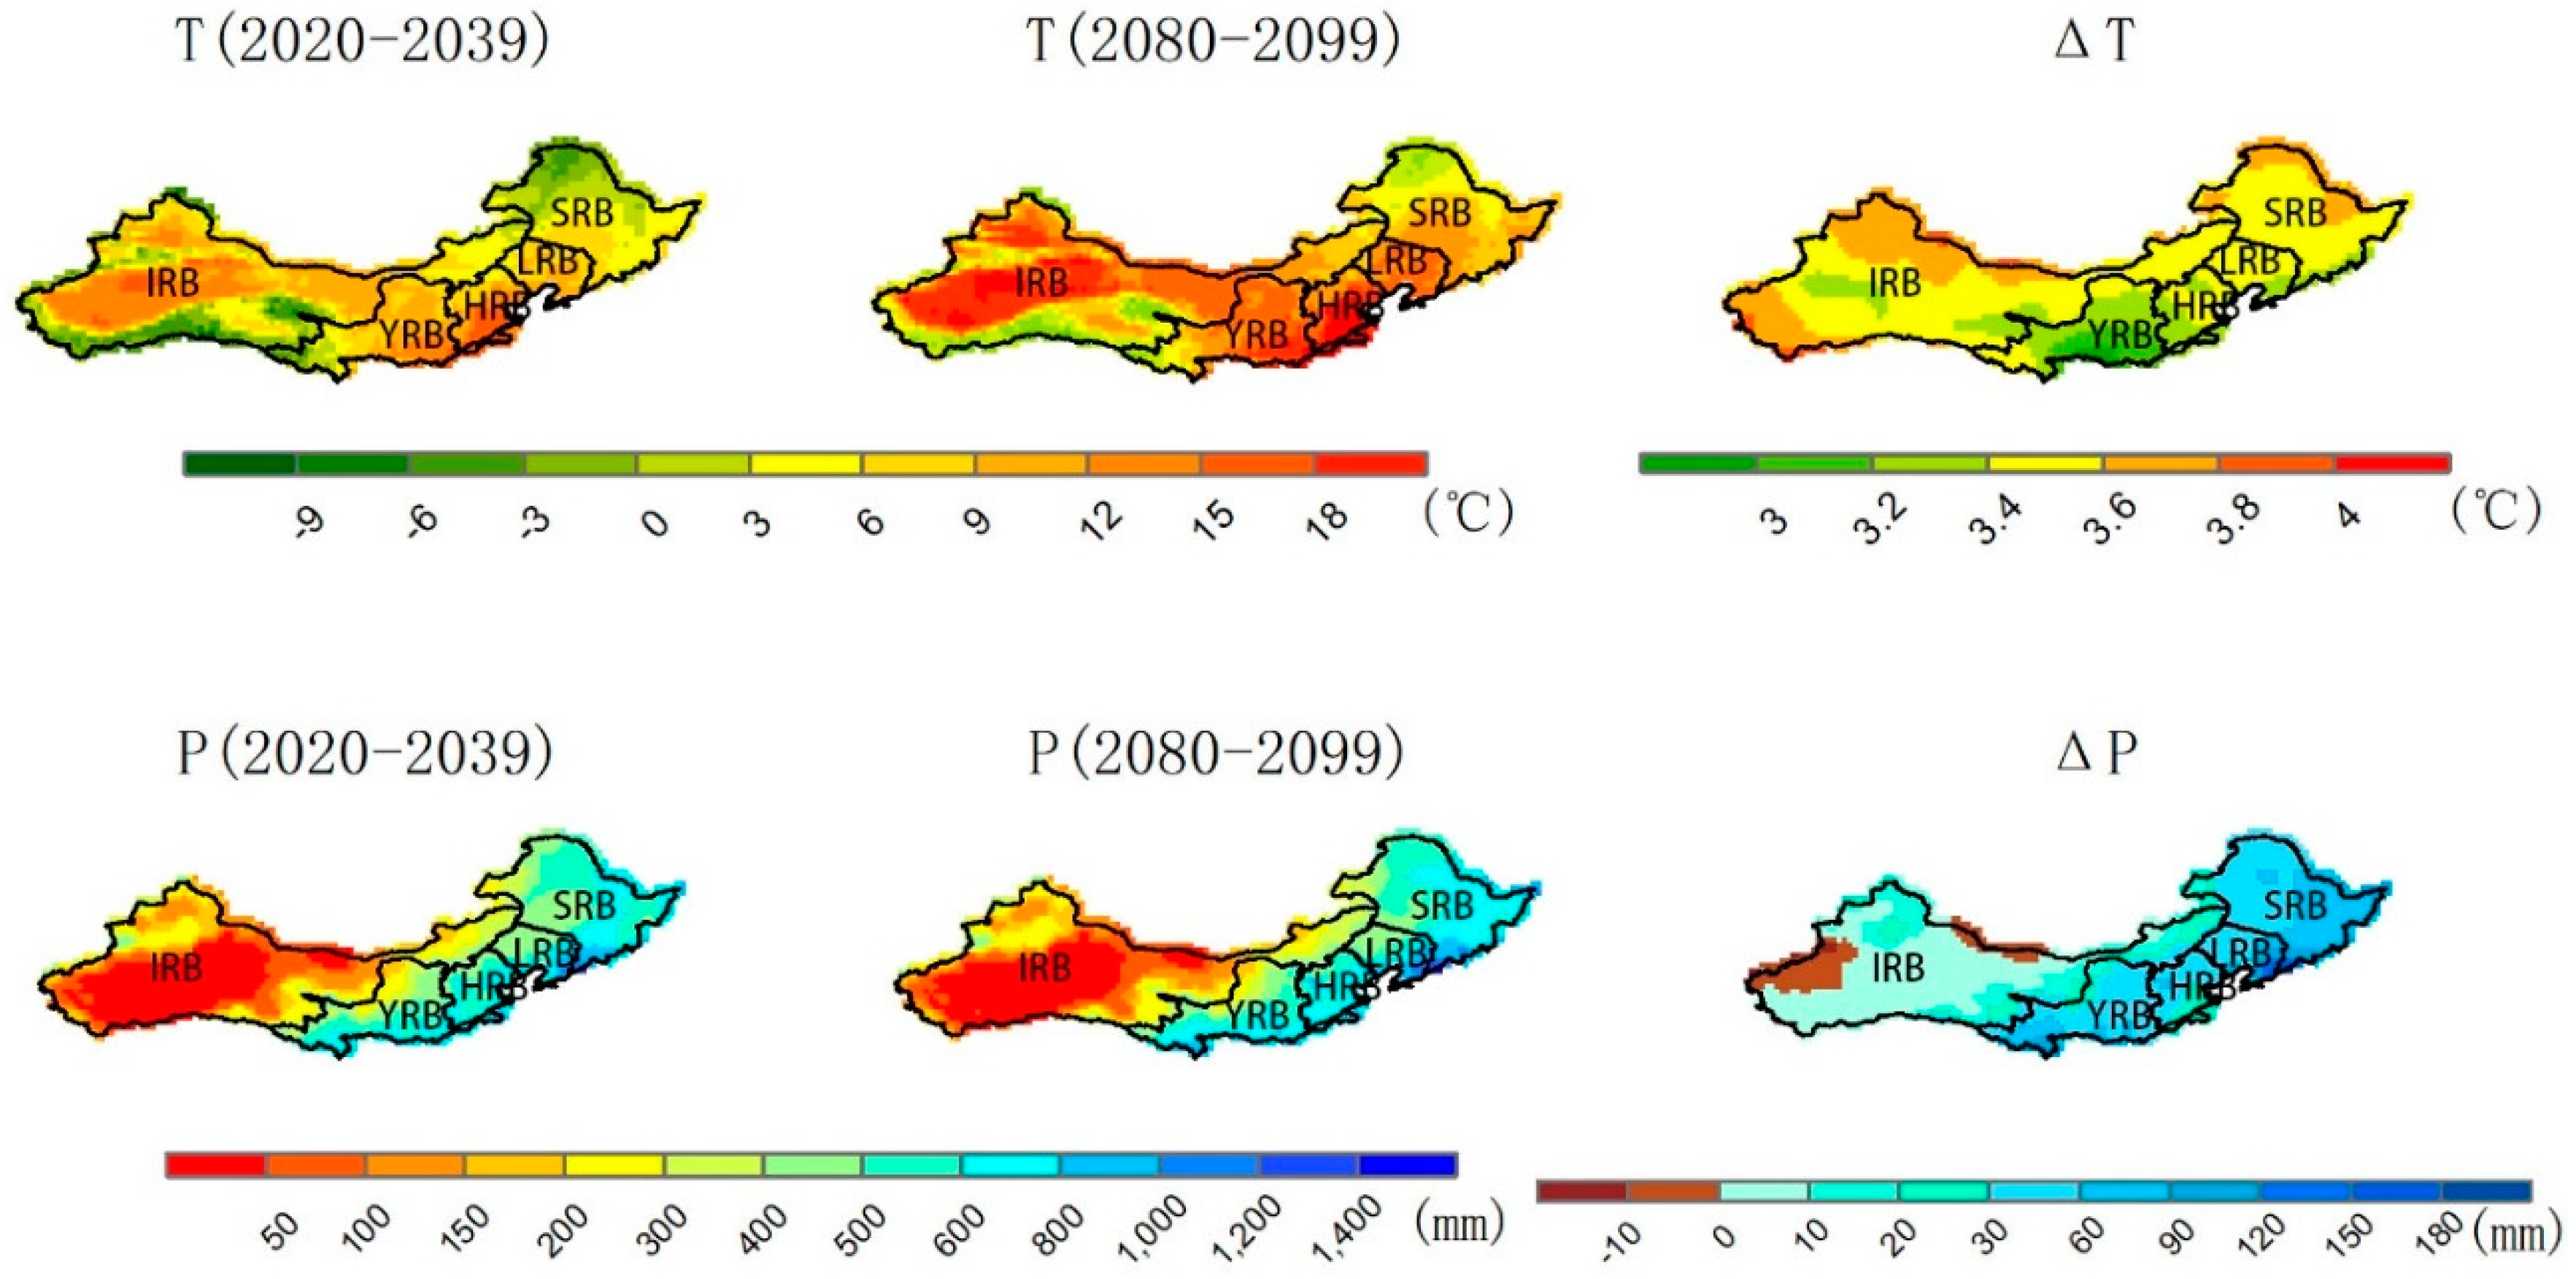
Climate will experience obvious changes in the TNR under the RCP8.5 scenario. Temperatures will steadily rise in all basins at the rate of ~0.57° per decade from 2020–2099. The spatial pattern of precipitation will remain unchanged, but the mean annual value will increase, except for in some small zones in the IRB. The area where the precipitation will increase the most (by over 120 mm) will be the southeast.
(3)
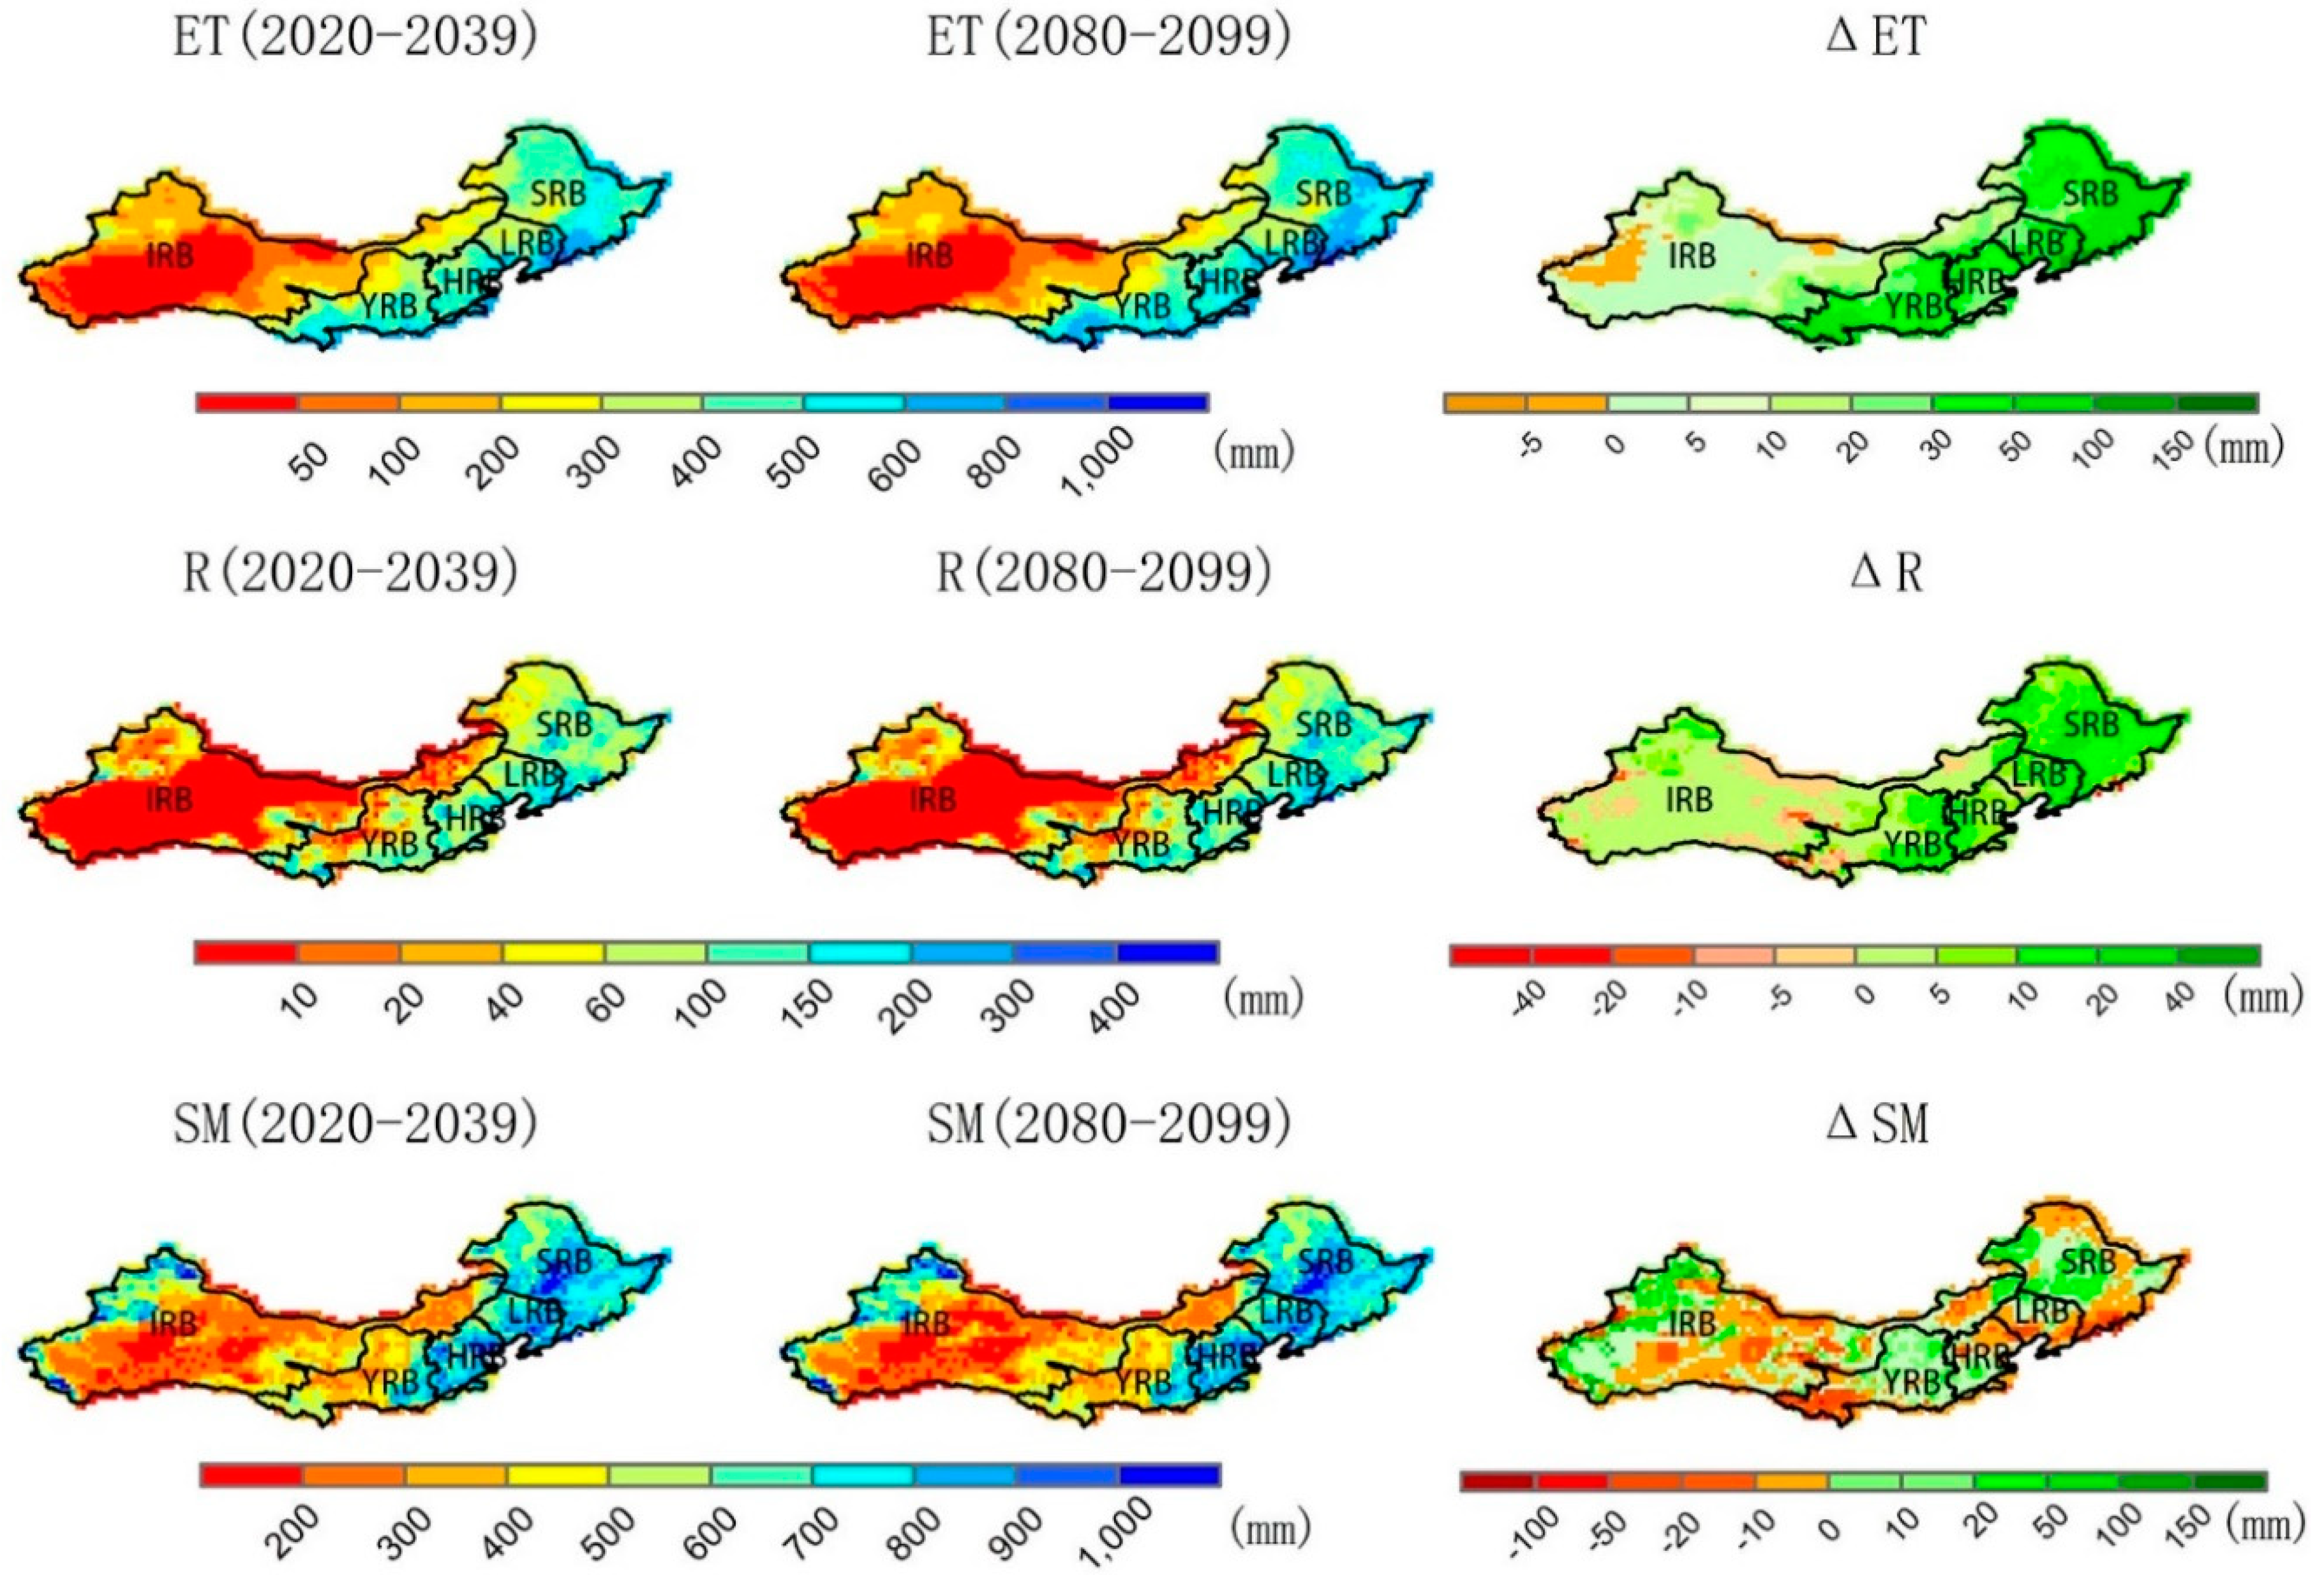
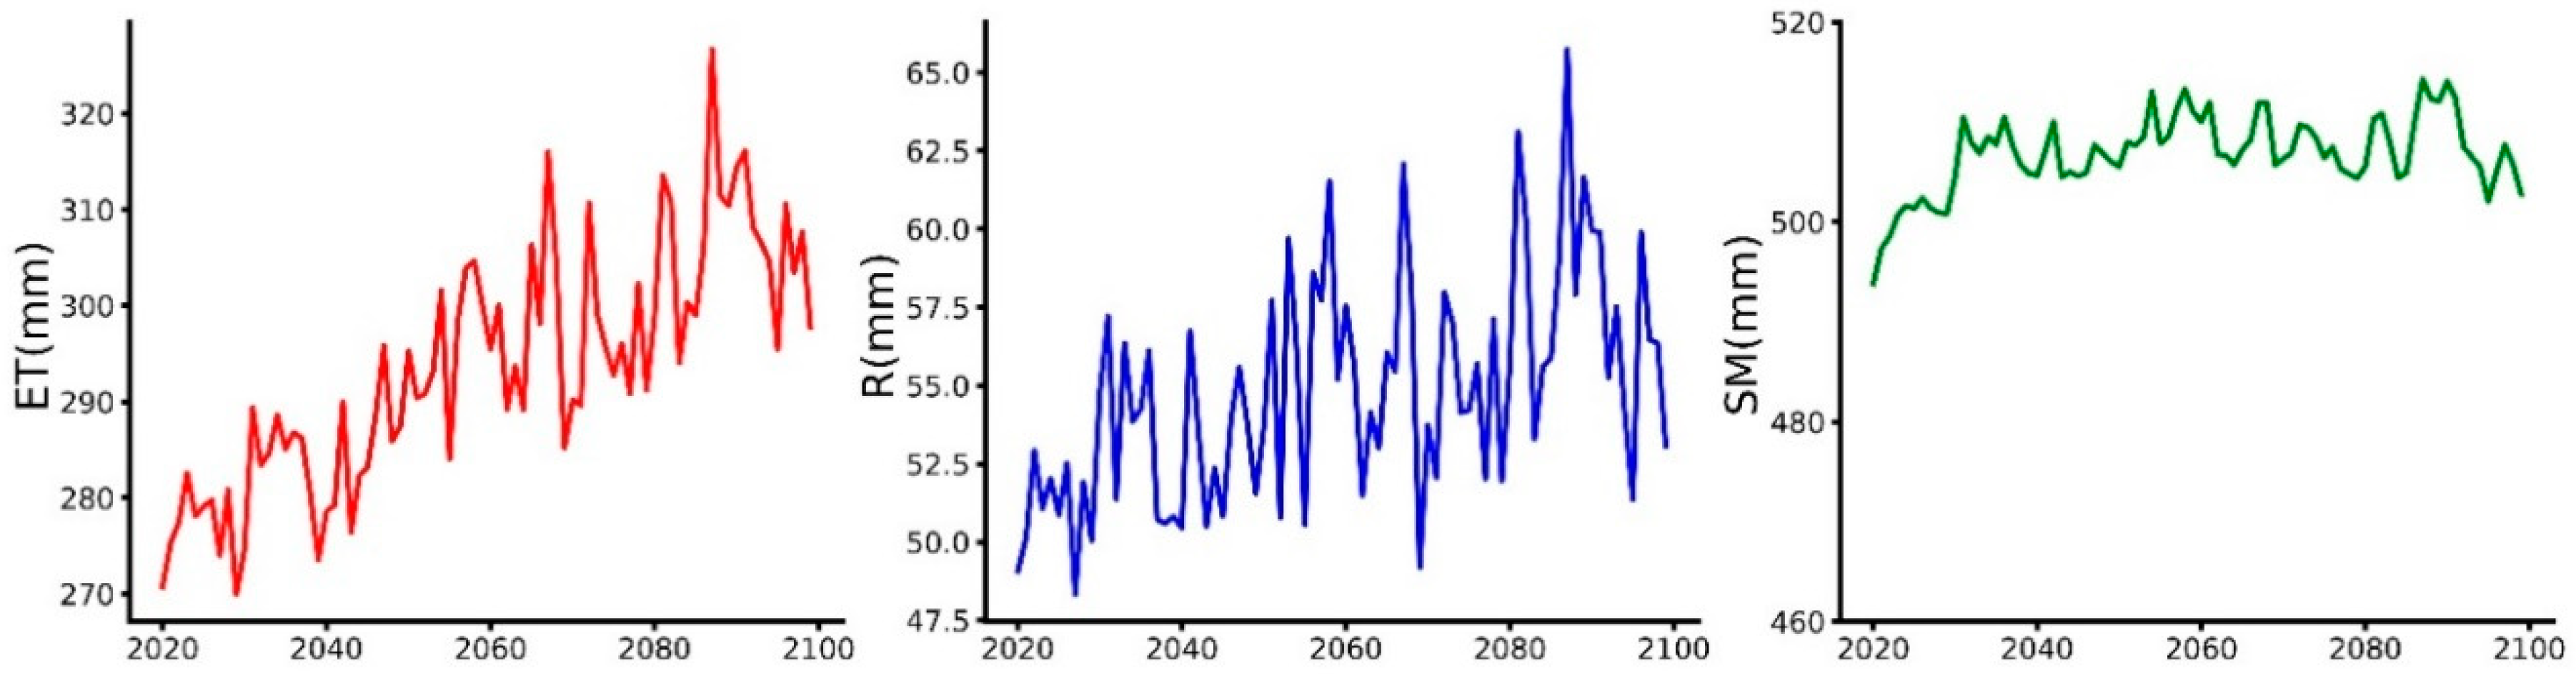
Forced by future climate conditions, the hydrological regime will experience various changes. Similar to precipitation, the ET and R will increase over most of the TNR. However, the changes in SM will vary. Specifically, over those areas with forest cover in the SRB, LRB, and HRB, and areas with grassland cover in the IRB and YRB, the SM will decrease due to the excessive increase in ET. However, over the areas with other land cover types, the SM may increase, mainly due to increased precipitation. Additionally, in all basins, the SM may increase where the soil is wetter, while decreasing in drier areas.
(4)
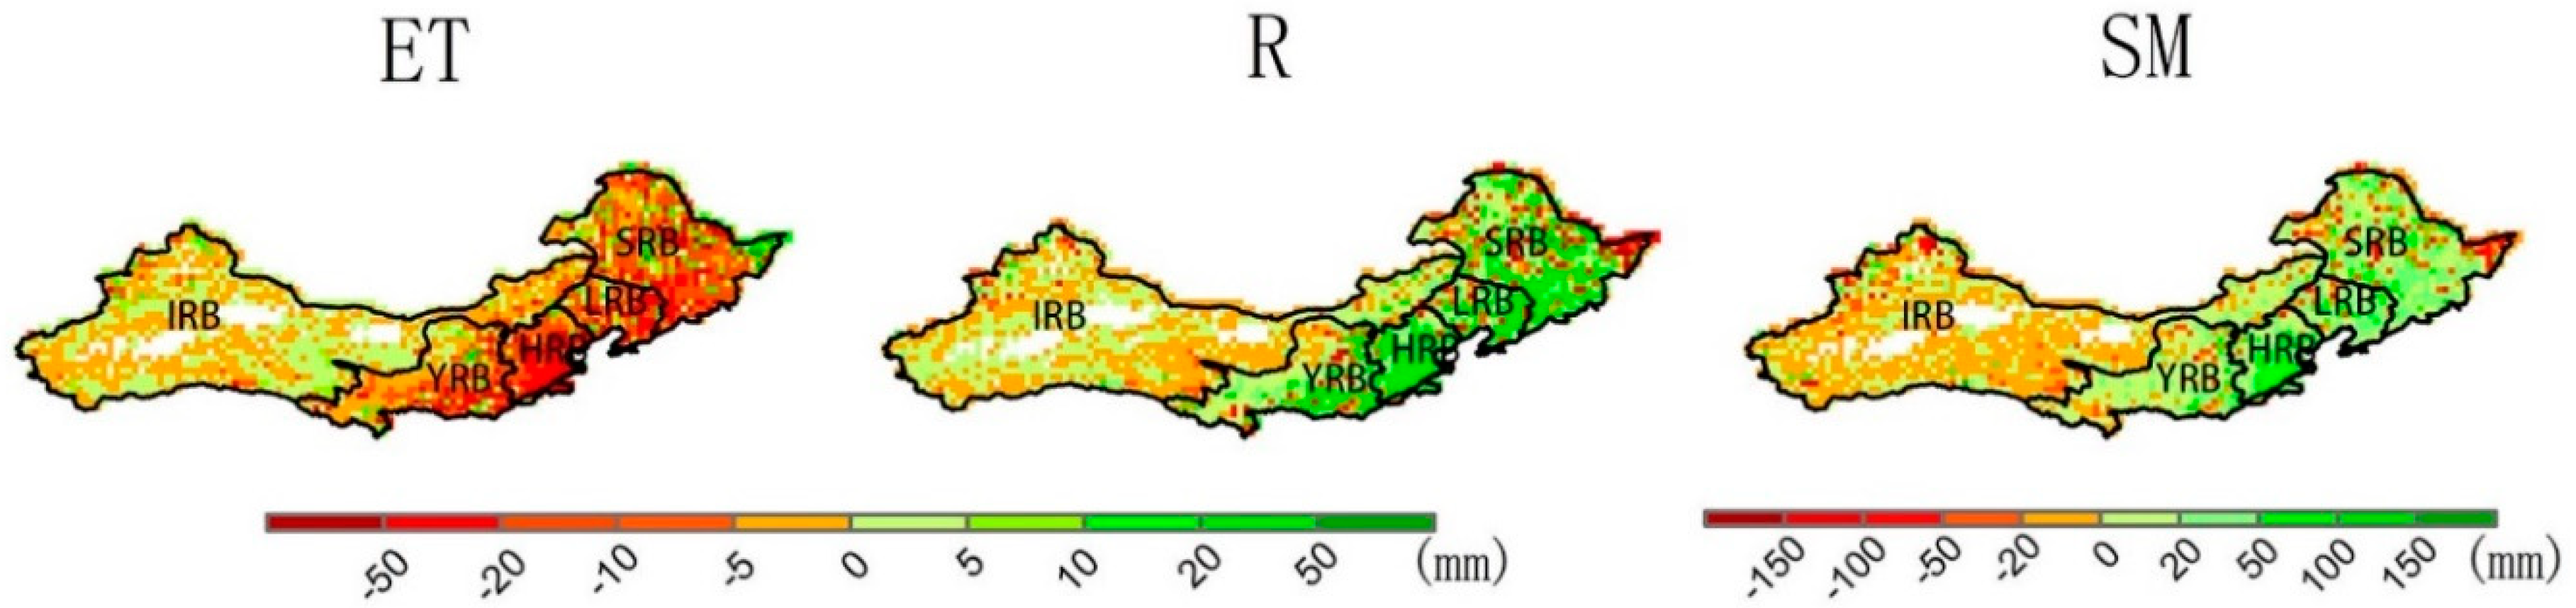
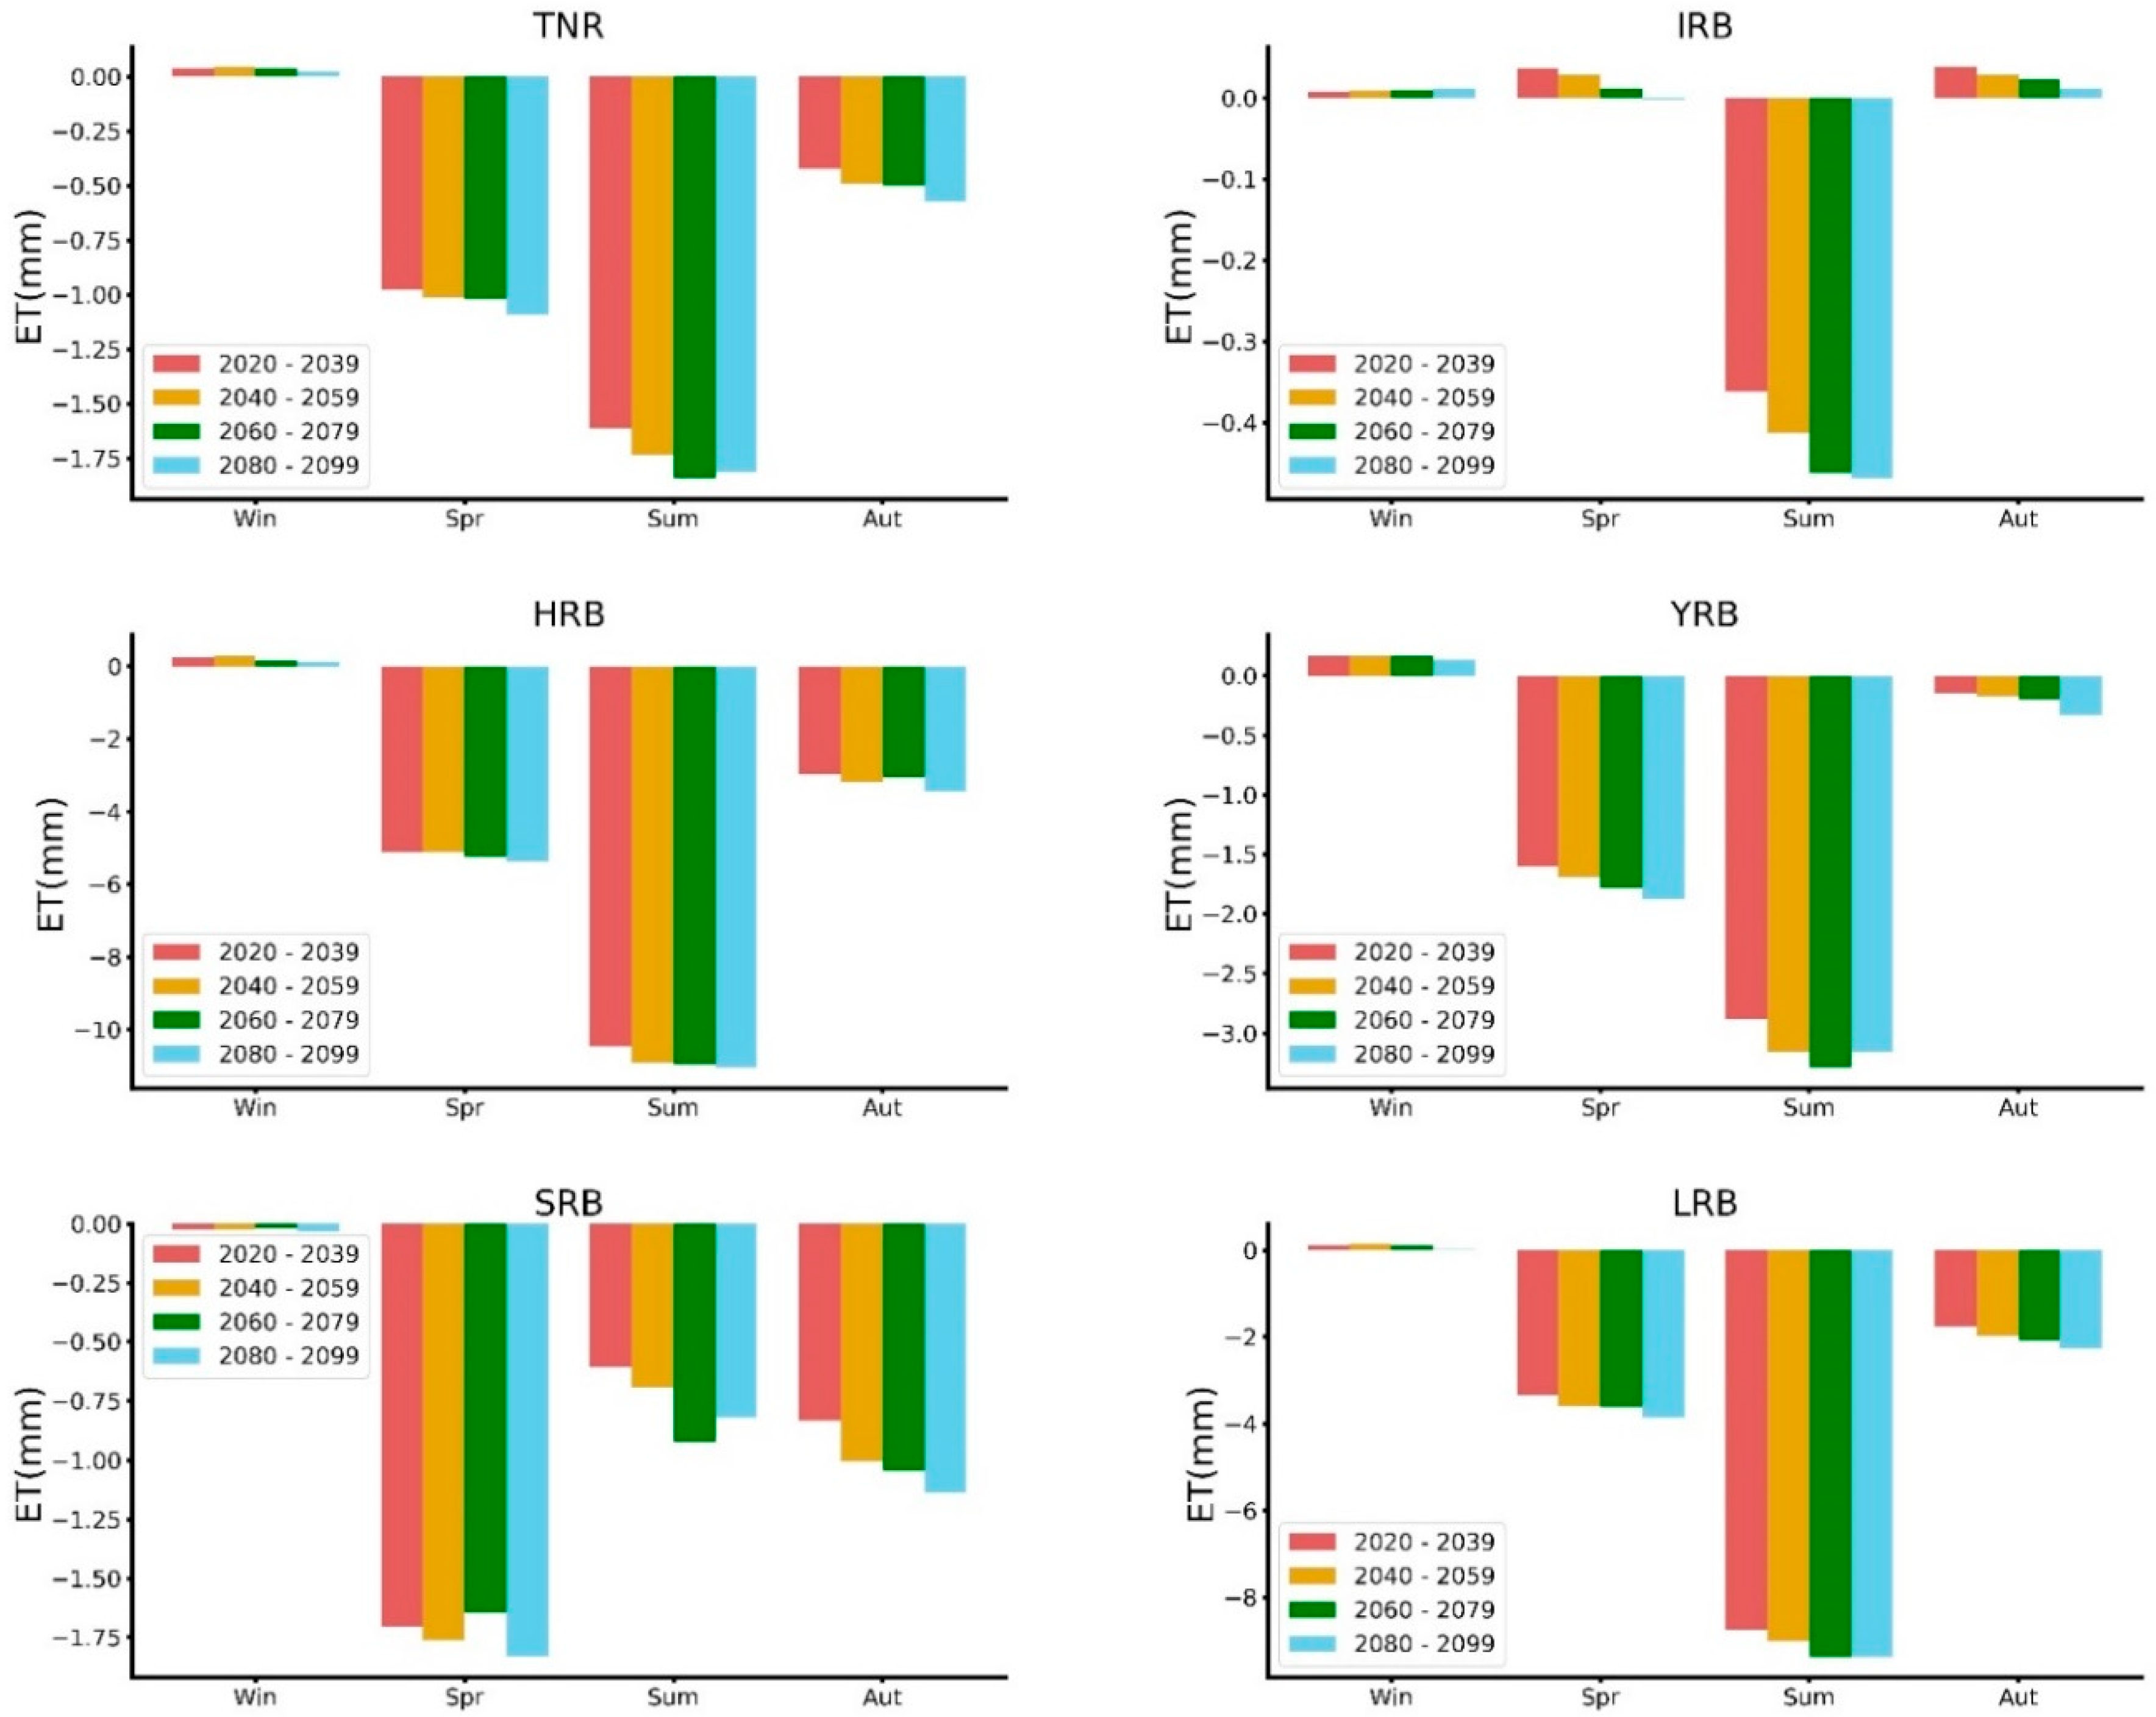
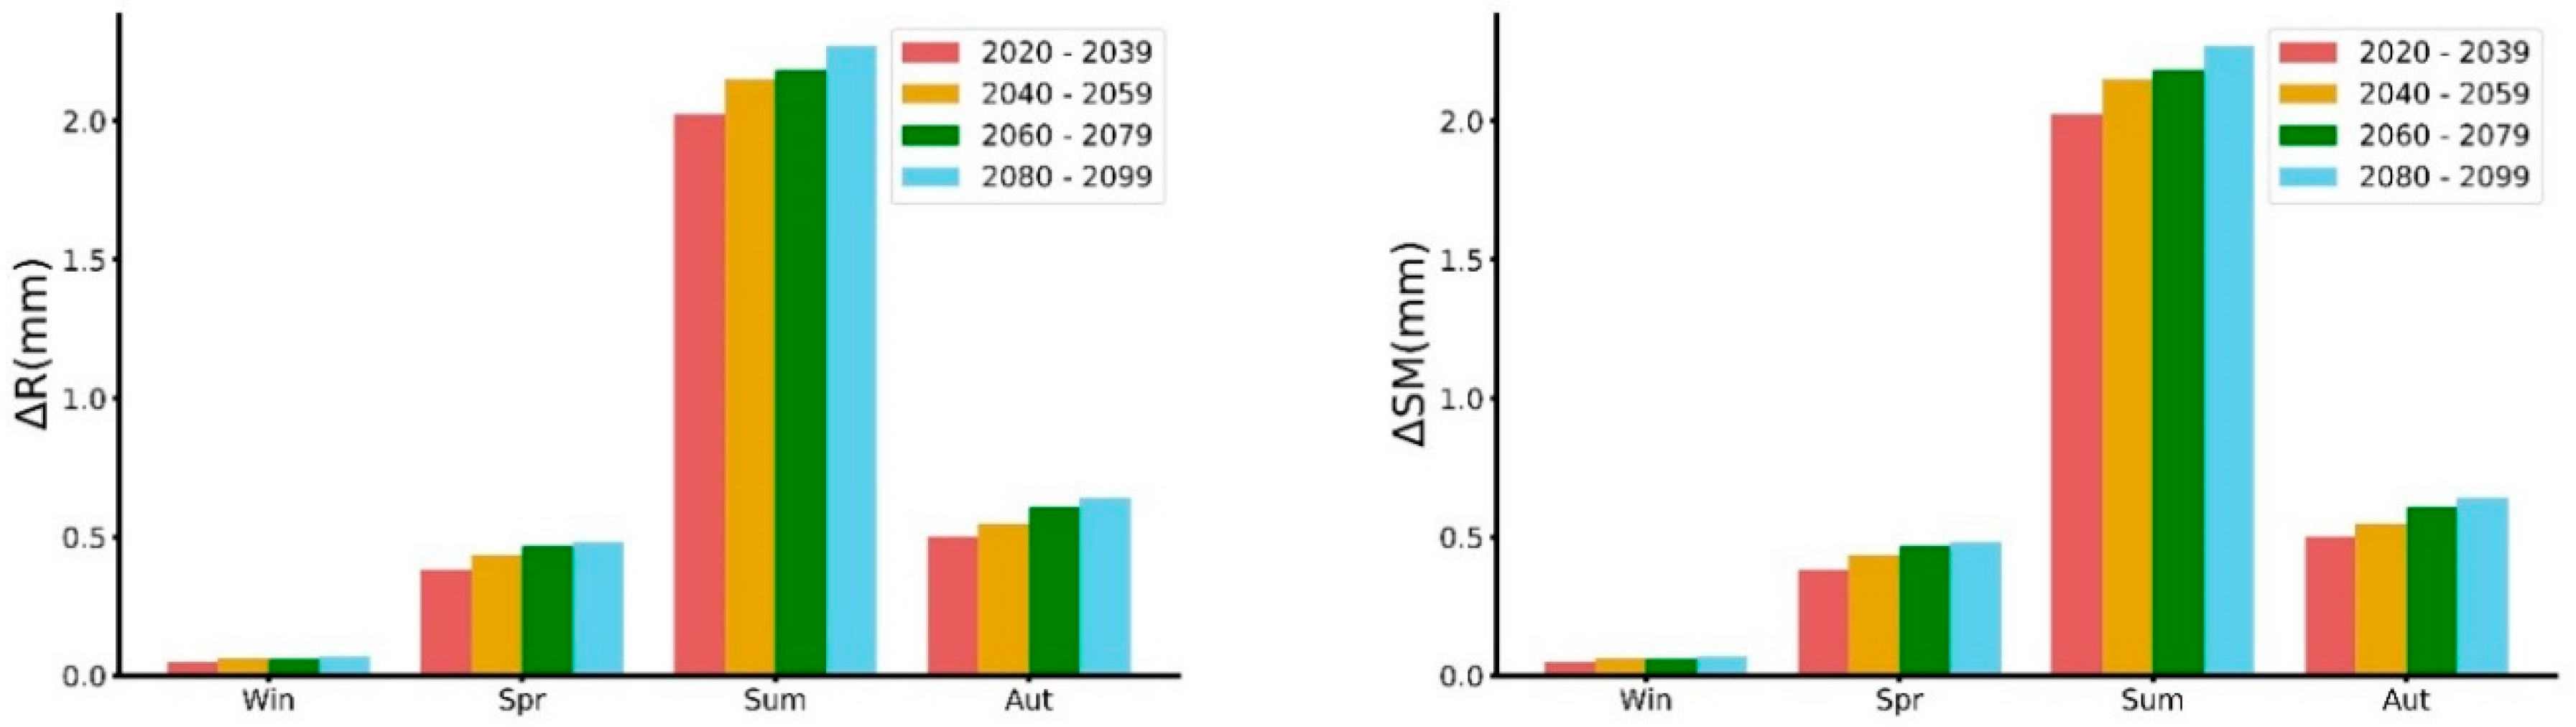
Land cover changes in the TNR will play different roles in influencing ET and R. Specifically, LCC will likely slow the rate of increasing ET, while promoting increases in R, although the strength of these effects will vary across different basins. In the SRB, LRB, and HRB, the effects are much stronger than in other basins, and in the eastern four basins, R and SM will increase due to LCC, while decrease in the IRB. Additionally, the effects of LCC on ET, R, and SM will all increase over time, which means that the effects of LCC will increasingly strengthen in the future.
Compared to the hydrological effects over the past decades, the strengthening role of LCC on the future hydrological regime can be attributed to its long-term, cumulative effects and strengthening climate change (i.e., the rising temperature and increasing precipitation). However, the future hydrological regime in the TNR will be primarily driven by climate change. Based on the SM, the arid region (i.e., the IRB) may become drier and the humid regions (i.e., the east of the YRB and the south of the HRB) may become wetter, and these effects are consistent with the standard catchphrase, “dry gets drier, wet gets wetter” [39,40,41]. LCC may likely intensify these effects, implying dryland expansion in arid and semi-arid areas and a potentially increased flood risk in humid areas, although it may diminish ET so as to preserve water resources. Uncertainties may exist in our study, including the interactions among climate, water, and vegetation. Coupling land use and vegetation dynamics in the hydrological modeling can improve future hydrological projections.

Author Contributions

Conceptualization, Y.Y. and X.X.; methodology, Y.Y.; validation, X.X.; formal analysis, Y.Y.; investigation, Y.Y.; resources, Y.Y.; data curation, Y.Y., X.X., S.M., B.Z., K.Z. and Y.W.; writing—original draft preparation, Y.Y.; writing—review and editing, X.X.; visualization, Y.Y.; supervision, X.X.; project administration, X.X.; funding acquisition, X.X.

Funding

This research was funded by the National Natural Science Foundation of China (No. 41471019, 61661136006) and the National Key Research and Development Program of China (No. 2016YFC0401404). And The APC was funded by the National Natural Science Foundation of China (No. 41471019).

Acknowledgments

We would like to thank the three anonymous reviewers for their constructive comments and language editing.

Conflicts of Interest

The authors declare no conflict of interest.

References

  1. Qin, D.; Stocker, T. Highlights of the IPCC Working Group I Fifth Assessment Report. Progressus Inquisitiones de Mutatione Climatis 2014, 10, 1–6. [Google Scholar] [CrossRef]
  2. Webster, M.A.; Rigor, I.G.; Nghiem, S.V.; Kurtz, N.T.; Farrell, S.L.; Perovich, D.K.; Sturm, M. Interdecadal changes in snow depth on Arctic sea ice. J. Geophys. Res. Oceans 2014, 119, 5395–5406. [Google Scholar] [CrossRef] [Green Version]
  3. Notz, D.; Stroeve, J. Observed Arctic sea-ice loss directly follows anthropogenic CO2 emission. Science 2016, 354, 747–750. [Google Scholar] [CrossRef]
  4. Lambin, E.F.; Geist, H.J.; Lepers, E. Dynamics Ofland-Use Andland-Coverchange Intropicalregions. Annu. Rev. Environ. Resour. 2003, 28, 205–241. [Google Scholar] [CrossRef]
  5. Liu, M.; Tian, H. China’s land cover and land use change from 1700 to 2005: Estimations from high-resolution satellite data and historical archives. Glob. Biogeochem. Cycles 2010, 24. [Google Scholar] [CrossRef]
  6. Jepsen, M.R.; Kuemmerle, T.; Müller, D.; Erb, K.; Verburg, P.H.; Haberl, H.; Vesterager, J.P.; Andrič, M.; Antrop, M.; Austrheim, G.; et al. Transitions in European land-management regimes between 1800 and 2010. Land Use Policy 2015, 49, 53–64. [Google Scholar] [CrossRef] [Green Version]
  7. Olofsson, P.; Holden, C.E.; Bullock, E.L.; Woodcock, C.E. Time series analysis of satellite data reveals continuous deforestation of New England since the 1980s. Environ. Res. Lett. 2016, 11. [Google Scholar] [CrossRef]
  8. Scanlon, B.R.; Reedy, R.C.; Stonestrom, D.A.; Prudic, D.E.; Dennehy, K.F. Impact of land use and land cover change on groundwater recharge and quality in the southwestern US. Glob. Chang. Biol. 2005, 11, 1577–1593. [Google Scholar] [CrossRef]
  9. Oki, T.; Kanae, S. Global Hydrological Cycles and World Water Resources. Science 2006, 313, 1068–1072. [Google Scholar] [CrossRef]
  10. Schilling, K.E.; Jha, M.K.; Zhang, Y.-K.; Gassman, P.W.; Wolter, C.F. Impact of land use and land cover change on the water balance of a large agricultural watershed: Historical effects and future directions. Water Resour. Res. 2008, 44. [Google Scholar] [CrossRef] [Green Version]
  11. Fu, S.S.Q. A drier future. Science 2014, 343, 737–739. [Google Scholar] [CrossRef]
  12. Haddeland, I.; Heinke, J.; Biemans, H.; Eisner, S.; Florke, M.; Hanasaki, N.; Konzmann, M.; Ludwig, F.; Masaki, Y.; Schewe, J.; et al. Global water resources affected by human interventions and climate change. Proc. Natl. Acad. Sci. USA 2014, 111, 3251–3256. [Google Scholar] [CrossRef] [PubMed]
  13. Frans, C.; Istanbulluoglu, E.; Mishra, V.; Munoz-Arriola, F.; Lettenmaier, D.P. Are climatic or land cover changes the dominant cause of runoff trends in the Upper Mississippi River Basin? Geophys. Res. Lett. 2013, 40, 1104–1110. [Google Scholar] [CrossRef] [Green Version]
  14. Molnar, P. Climate change, flooding in arid environments, and erosion rates. Geology 2001, 29, 1071–1074. [Google Scholar] [CrossRef]
  15. Wang, X.M.; Zhang, C.X.; Hasi, E.; Dong, Z.B. Has the Three Norths Forest Shelterbelt Program solved the desertification and dust storm problems in arid and semiarid China? J. Arid. Environ. 2010, 74, 13–22. [Google Scholar] [CrossRef]
  16. Li, W. Degradation and restoration of forest ecosystems in China. For. Ecol. Manag. 2004, 201, 33–41. [Google Scholar] [CrossRef]
  17. Li, Z.; Zheng, F.-L.; Liu, W.-Z. Spatiotemporal characteristics of reference evapotranspiration during 1961–2009 and its projected changes during 2011–2099 on the Loess Plateau of China. Agric. For. Meteorol. 2012, 154–155, 147–155. [Google Scholar] [CrossRef]
  18. Zha, Y.; Gao, J. Characteristics of desertification and its rehabilitation in China. J. Arid Environ. 1997, 37, 419–432. [Google Scholar] [CrossRef]
  19. Li, F.; Zhang, G.; Xu, Y.J. Spatiotemporal variability of climate and streamflow in the Songhua River Basin, northeast China. J. Hydrol. 2014, 514, 53–64. [Google Scholar] [CrossRef]
  20. Tao, H.; Gemmer, M.; Bai, Y.; Su, B.; Mao, W. Trends of streamflow in the Tarim River Basin during the past 50 years: Human impact or climate change? J. Hydrol. 2011, 400, 1–9. [Google Scholar] [CrossRef]
  21. Cuo, L.; Zhang, Y.; Gao, Y.; Hao, Z.; Cairang, L. The impacts of climate change and land cover/use transition on the hydrology in the upper Yellow River Basin, China. J. Hydrol. 2013, 502, 37–52. [Google Scholar] [CrossRef]
  22. Wang, J.; Hong, Y.; Gourley, J.; Adhikari, P.; Li, L.; Su, F. Quantitative assessment of climate change and human impacts on long-term hydrologic response: A case study in a sub-basin of the Yellow River, China. Int. J. Clim. 2010, 30, 2130–2137. [Google Scholar] [CrossRef]
  23. Leng, G.; Tang, Q.; Huang, M.; Hong, Y.; Ruby, L.L. Projected changes in mean and interannual variability of surface water over continental China. Sci. China Earth Sci. 2014, 58, 739–754. [Google Scholar] [CrossRef] [Green Version]
  24. Xie, X.; Liang, S.; Yao, Y.; Jia, K.; Meng, S.; Li, J. Detection and attribution of changes in hydrological cycle over the Three-North region of China: Climate change versus afforestation effect. Agric. For. Meteorol. 2015, 203, 74–87. [Google Scholar] [CrossRef]
  25. Liang, X.; Lettenmaie, D.P.; Wood, E.F.; Burges, S.J. A simple hydrologically based model of land surface water and energy fluxes for general circulation models. J. Geogr. Res. 1994, 99, 14415–14428. [Google Scholar] [CrossRef]
  26. Liang, X.; Wood, E.F.; Lettenmaier, D.P. Surface soil moisture parameterization of the VIC-2L model: Evaluation and modification. Glob. Planet. Chang. 1996, 13, 195–206. [Google Scholar] [CrossRef]
  27. Warszawski, L.; Frieler, K.; Huber, V.; Piontek, F.; Serdeczny, O.; Schewe, J. The Inter-Sectoral Impact Model Intercomparison Project (ISI-MIP): Project framework. Proc. Natl. Acad. Sci. USA 2014, 111, 3228–3232. [Google Scholar] [CrossRef] [PubMed]
  28. Zheng, X.; Zhu, J. A new climatic classification of afforestation in Three-North regions of China with multi-source remote sensing data. Theor. Appl. Clim. 2015, 127, 465–480. [Google Scholar] [CrossRef]
  29. Liu, J.; Kuang, W.; Zhang, Z.; Xu, X.; Qin, Y.; Ning, J.; Zhou, W.; Zhang, S.; Li, R.; Yan, C.; et al. Spatiotemporal characteristics, patterns, and causes of land-use changes in China since the late 1980s. J. Geogr. Sci. 2014, 24, 195–210. [Google Scholar] [CrossRef]
  30. Chang, J.; Wang, Y.; Istanbulluoglu, E.; Bai, T.; Huang, Q.; Yang, D.; Huang, S. Impact of climate change and human activities on runoff in the Weihe River Basin, China. Quat. Int. 2015, 380–381, 169–179. [Google Scholar] [CrossRef]
  31. Treesa, A.; Das, J.; Umamahesh, N.V. Assessment of impact of climate change on streamflows using VIC model. Eur. Water 2017, 59, 61–68. [Google Scholar] [CrossRef]
  32. Ning, J.; Liu, J.; Kuang, W.; Xu, X.; Zhang, S.; Yan, C.; Li, R.; Wu, S.; Hu, Y.; Du, G.; et al. Spatiotemporal patterns and characteristics of land-use change in China during 2010–2015. J. Geogr. Sci. 2018, 28, 547–562. [Google Scholar] [CrossRef]
  33. Xiao, Z.; Liang, S.; Wang, J.; Xiang, Y.; Zhao, X.; Song, J. Long-Time-Series Global Land Surface Satellite Leaf Area Index Product Derived from MODIS and AVHRR Surface Reflectance. IEEE Trans. Geosci. Remote Sens. 2016, 54, 5301–5318. [Google Scholar] [CrossRef]
  34. Nijssen, B.; O’Donnell, G.M.; Lettenmair, D.P. Predicting the Discharge of Global Rivers. J. Clim. 2001, 14, 3307–3323. [Google Scholar] [CrossRef]
  35. Nijssen, B.; O’Donnell, G.M.; Hamlet, A.F.; Lettenmaier, D.P. Hydrologic Sensitivity of Global Rivers to Climate Change. Clim. Chang. 2001, 50, 143–175. [Google Scholar] [CrossRef]
  36. Hempel, S.; Frieler, K.; Warszawski, L.; Schewe, J.; Piontek, F. A trend-preserving bias correction-the ISI-MIP approach. Earth Syst. Dyn. 2013, 4, 219–236. [Google Scholar] [CrossRef]
  37. Canadell, J.G.; Quéré, C.L.; Raupacha, M.R.; Fielde, C.B.; Buitenhuisc, E.T.; Ciaisf, P.; Conwayg, T.J.; Gillettc, N.P.; Houghtonh, R.A.; Marlandi, G. Contributions to accelerating atmospheric CO2 growth from economic activity, carbon intensity, and efficiency of natural sinks. Proc. Natl. Acad. Sci. USA 2007, 104, 18866–18870. [Google Scholar] [CrossRef]
  38. Wang, G.Q.; Zhang, J.Y.; Jin, J.L.; Pagano, T.C.; Calow, R.; Bao, Z.X.; Liu, C.S.; Liu, Y.L.; Yan, X.L. Assessing water resources in China using PRECIS projections and a VIC model. Hydrol. Earth Syst. Sci. 2012, 16, 231–240. [Google Scholar] [CrossRef] [Green Version]
  39. Huang, J.; Yu, H.; Guan, X.; Wang, G.; Guo, R. Accelerated dryland expansion under climate change. Nat. Clim. Chang. 2015, 6, 166–171. [Google Scholar] [CrossRef]
  40. Huang, J.; Li, Y.; Fu, C.; Chen, F.; Fu, Q.; Dai, A.; Shinoda, M.; Ma, Z.; Guo, W.; Li, Z.; et al. Dryland climate change: Recent progress and challenges. Rev. Geophys. 2017, 55, 719–778. [Google Scholar] [CrossRef]
  41. Greve, P.; Orlowsky, B.; Mueller, B.; Sheffield, J.; Reichstein, M.; Seneviratne, S.I. Global assessment of trends in wetting and drying over land. Nat. Geosci. 2014, 7, 716–721. [Google Scholar] [CrossRef]
  42. Luyssaert, S.; Jammet, M.; Stoy, P.C.; Estel, S.; Pongratz, J.; Ceschia, E.; Churkina, G.; Don, A.; Erb, K.; Ferlicoq, M.; et al. Land management and land-cover change have impacts of similar magnitude on surface temperature. Nat. Clim. Chang. 2014, 4, 389–393. [Google Scholar] [CrossRef] [Green Version]
  43. Pielke, R.A. Land Use and Climate Change. Science 2005, 310, 1625–1626. [Google Scholar] [CrossRef] [PubMed]
Figure 1. Distribution of land cover types for the year of 2015 in the Three-North region (TNR), where five basins, i.e., the Inland River Basin (IRB), Yellow River Basin (YRB), Hai River Basin (HRB), Liao River Basin (LRB), and Songhua River Basin (SRB), distributed in this region.
Remotesensing 11 00081 g001
Figure 2. Annual mean temperature and annual precipitation from 1959 to 2009 in the TNR, IRB, YRB, HRB, LRB, and SRB of China.
Remotesensing 11 00081 g002
Figure 3. Mean monthly leaf area index (LAI) of the TNR in 1985 and 2015.
Remotesensing 11 00081 g003
Figure 4. Projected mean annual temperature (MAT) and mean annual precipitation (MAP) over two periods (2020–2039 and 2080–2099) and their differences (Δ).
Remotesensing 11 00081 g004
Figure 5. Projected MAT and MAP across the TNR.
Remotesensing 11 00081 g005
Figure 6. Mean annual evapotranspiration (ET), runoff (R), and soil moisture (SM) during two periods, 2020–2039 (left) and 2080–2099 (middle), and their differences (Δ).
Remotesensing 11 00081 g006
Figure 7. Projected mean annual ET, R, and SM across the TNR.
Remotesensing 11 00081 g007
Figure 8. Shifts in annual ET, R, and SM for 2080–2099 driven by past land cover changes (LCC).
Remotesensing 11 00081 g008
Figure 9. Projected average annual changes in ET (left), R (middle), and SM (right) between the two results, based on different land cover datasets across the TNR.
Remotesensing 11 00081 g009
Figure 10. Projected changes in ET between the two results (based on different land cover datasets) of each season and different periods, over the five basins in the TNR.
Remotesensing 11 00081 g010
Figure 11. Projected changes in R and SM between the two results, based on the different vegetation parameters of each season.
Remotesensing 11 00081 g011
Table 1. Fractions of primary land cover types of the TNR in 1985 and 2015.
BasinYearUrbanForestGrassCropOthers
TNR19850.5%15.3%30.5%15.9%37.8%
20151.8%14.9%30.0%15.9%37.4%
IRB19850.1%1.8%33.4%3.8%60.9%
20150.5%2.1%32.8%4.4%60.2%
HRB19852.5%19.2%19.8%56.0%2.5%
20159.0%19.4%19.6%48.7%3.3%
YRB19850.7%12.0%47.7%29.2%10.4%
20153.0%13.0%46.9%26.2%10.9%
SRB19850.5%48.8%17.5%24.8%8.4%
20151.8%45.6%17.5%27.0%8.1%
LRB19851.7%23.5%26.7%39.8%8.2%
20154.6%23.2%24.7%39.0%8.4%

