Article

The Continental Impact of European Forest Conservation Policy and Management on Productivity Stability

by
Adam Moreno
1,*,
Mathias Neumann
2,
Phillip M. Mohebalian
3,
Christopher Thurnher
2 and
Hubert Hasenauer
2
1
Universities Space Research Association, NASA Ames Research Center, Moffett Field, CA 94035, USA
2
Institute of Silviculture, University of Natural Resources and Life Sciences, Peter-Jordan-Straße 82, 1190 Vienna, Austria
3
Geographic Standards, Criteria and Quality Branch, Geography Division, U.S. Census Bureau, 4600 Silver Hill Road, Washington, DC 20233, USA
*
Author to whom correspondence should be addressed.
Submission received: 19 November 2018 / Revised: 26 December 2018 / Accepted: 1 January 2019 / Published: 6 January 2019
(This article belongs to the Section Forest Remote Sensing)

Abstract

:
The ecological impact of continental scale land-use policies that influence forest management is often difficult to quantify. European forest conservation began in 1909 with a marked increase in designated areas with the inception of Natura 2000 in the early 1990s. It has been shown that increases in European forest mortality may be linked to climate variability. Measuring productivity response to climate variability may be a valid proxy indicating a forest’s ability to bear this disturbance. Net Primary Production (NPP) response to climate variability has also been linked to functional diversity within forests. Using a European specific annual MODIS NPP estimates, we assess the NPP response to climate variability differences between actively managed forests, which experience human interventions and conserved, Protected Area (PA) forests with minimal to no human impact. We found, on the continental scale, little to no differences in NPP response between managed and conserved forests. However, on the regional scale, differences emerge that are driven by the historic forest management practices and the potential speciation of the area. Northern PA forests show the same NPP response to climate variability as their actively managed counter parts. PA forests tend to have less NPP response to climate variability in the South and in older conserved forests. As the time a forest has been designated, as a PA, extends past its typically actively managed rotation length, greater differences begin to emerge between the two management types.

Graphical Abstract

1. Introduction

Forest Protected Areas (PA) are a dominant policy instrument applied across Europe to prevent the loss of biodiversity and to ensure the supply of ecosystem services for human-wellbeing [1,2]. The European Union’s Habitat and Birds Directives comprise the cornerstone of European Environmental Law [3]. From these directives, the Natura 2000 mandate was established to ensure the provision of ecosystem services and to conserve habitats of various plant and animal species in areas of ecological importance by restricting human disturbances to enhance robustness and diversity [4,5,6]. Natura 2000 is the current driving EU policy instrument regarding PA in Europe. In part, as a result of this mandate, PA now covers around 17% of the land surface area across Europe, providing the region with the distinction of having the largest network of protected forests in the world [1]. Despite the implementation of PA, their effectiveness remains debated within economic, environmental, political, and social arenas [7,8,9]. Forest function monitoring techniques are a critical next-step in advancing conservation science and are instrumental in helping researchers shed light on the interactions between policy interventions and conservation outcomes [10]. Without accurate and timely monitoring of programmatic environmental policies, it is uncertain whether these policies are achieving their objectives.
While conservation and management effects on ecosystems are widely studied on a stand-level in Europe, little is known on the continental scale [11,12,13]. Continental level forest conservation policies, rather than having quantifiable impacts, remain an “issue for an abstract high-level policy debate”; needing large-scale, science-based policy impact assessments [11,14]. The first forests in Europe were set aside for conservation in 1909 and it is still unknown if this long history of conservation has led to forests with increased functional biodiversity that are more resilient and robust then forests that experience human interventions, i.e., their managed counterparts. Additionally, no spatially explicit ecological quantification on the continental scale has been performed to determine if the goals set forth by the International Union for Conservation of Nature within the Natura 2000 framework have been, or are becoming, fulfilled. Further, as climate variability such as drought and temperature stress are projected to increase, it is increasingly important to understand how conservation affects forest resilience and long-term ecological outcomes [15,16].
A forest’s robustness under a climate variability is one measure of a forest’s ability to ensure the provision of ecosystem services. Research has shown that increasing climate variability may lead to increased forest mortality [17]. To ensure the provision of ecosystem services and habitat, it is vital to know if conservation policy is leading to forests that can withstand increases in climate variability. The ecological benefits of PA, compared to managed forests, typically increase over time [18]. Actively managing a forest alters its tree species composition and structure [19,20]. Forests with little to no human intervention fill more ecological niches [21]. Forests with few ecological niches filled demonstrate different ecological responses to inter-annual climate variability than others [22]. Researchers have proposed Net Primary Productivity (NPP) anomalies as an indicator to measure such forest health aspects [17,23]. Applying these principles on a continental scale, we implemented a quasi-experimental design of using remotely sensed data to identify PA forests and actively managed forests that have similar site qualities. In this way, we can assess the two groups spatially and explicitly to test the impact forest PA has on NPP response to climate variability compared to actively managed forests [14,22].

2. Materials and Methods

If PAs were randomly distributed across Europe, our study would have the design of a controlled experiment and PA impact could be easily measured by comparing protected and non-protected forests. The randomness of our sample would ensure protected and managed forests were similar and the only remaining difference between groups was due to the impacts of PA designation. In reality, PA across Europe are more likely to be located in areas of lesser alternative economic land use value [24]. We use forest NPP responses to inter-annual climate variability as a proxy-indicator for forest functional biodiversity. Similar to forest PA designation, forest NPP is non-randomly distributed and are strongly influenced by site and climate characteristics [25]. This non-randomness of PA sites required us to select actively managed forests with similar site characteristics to isolate the climate’s influence on NPP.
Our framework outlines a quasi-experimental design to estimate PA impacts on NPP response to climate variability. We applied k-nearest neighbors to control socioeconomic and climate differences between groups, thus simulating a random sampling design with a control and experimental group. We matched cells one-to-one in our georeferenced dataset from PA and managed forest groups based on variables which otherwise confound our ability to detect PA impacts on functional biodiversity. After matching PA and managed forests, we then attribute the remaining difference between groups as resulting from PA designation (Table A1 and Table A2). PA forests that have little to no human intervention accumulate more deadwood and have higher biological and functional diversity with more filled ecological niches, which should then have quantifiable effects on NPP and its response to climate variability, as compared to their managed counterparts [22,26,27]. Through this mechanism, we were able to estimate the impact of PA has on forest NPP response to inter-annual climate variability.

2.1. Forest Protected Areas: Treatment Applied

We restricted PA forests in Europe to those that were placed into conservation in or before 1995, as specified by the International Union Common for Conservation of Nature (IUCN) Common Database on Designated Areas (CDDA) version 13. Only forests designated as CDDA categories Ia, Ib, and II were included, which are the strictest categories, not allowing for any extraction of timber [28]. To our knowledge, no spatially explicit data set of forest management exists from which we could extract areas that are confirmed to practice active forest management. Therefore, we assumed that every forest not conserved, and not within 5 km to a PA, has experienced some level of active forest management (Figure 1) [29]. Active forest management has been practiced in Europe for centuries, leading to almost every forest not explicitly conserved having some level of human disturbance or impact [29].

2.2. Land Characteristics: Independent Variables

We matched PA and managed forests based on environmental covariates to control for the bias that occurs when PAs are designated in areas of lower alternative land use value. These variables include: Bioregion within Europe [30], forest cover type [31], latitude, average temperature, annual precipitation, incoming shortwave radiation [32], and elevation [33]. For every 1 × 1 km cell in a PA designated forest we matched a managed forest at least 5 km away from a PA forest using our variables and a k-nearest neighbor algorithm. In this way, we create two groups, a PA and a managed group, with very similar site quality and land use value and the same sample size. We did not include socioeconomic variables, such as proximity to roads/cities, because models quantifying these impacts on forest ecophysiology are locally and nationally dependent and require separate socioeconomic modeling [34].

2.3. Average NPP Response to Climate Anomalies: Response Variable

We used NPP between 2000 and 2012 from a Europe focused NPP data set derived from the MODerate Resolution Imaging Spectroradiometer (MODIS) sensor [35] and climate data from a gridded European daily data set over the same period on 0.0083-degree (~1 km2 at the equator) resolution [32]. Evaluating this NPP dataset with National Forest Inventory data [35] and agricultural crop statistics [36] suggested that it is able to represent both absolute NPP values and inter-annual NPP variability. For every grid-cell, we calculated the mean NPP, minimum, and maximum temperatures and precipitation for the time-period 2000–2012 (the long-term means). We calculated the mean annual NPP anomaly relative to the 2000–2012 average for managed and conserved forest in Northern, central, and Southern Europe, as well as all of Europe. We defined anomalies as the difference of each year’s annual NPP or climate variable from the long-term mean. For every anomaly in temperature and precipitation, we averaged all the NPP anomalies for all the cells that ever experienced that climate anomaly. Temperature anomalies were analyzed using the absolute difference in degrees while precipitation is analyzed as percent relative to the long-term mean (Figure A1). We assessed the response on the continental scale and on the regional scale with Northern, Central and Southern European regions (Figure 1). We are studying ecosystem responses to inter-annual variation and not long-term climate change.
Forest management also affects the age of a forest, which in turn affects NPP. We assessed the age class cumulative distribution function in each of our three regions. The age data we used was derived from the largest plot level National Forest Inventory (NFI) data set in Europe, consisting of 261,465 plots extrapolated across Europe [35,37]. Using this NFI data age was spatially extrapolated using remote sensing data and k-means clustering and k-nearest neighbor algorithms. This data represents the same time period analyzed in this study.

3. Results

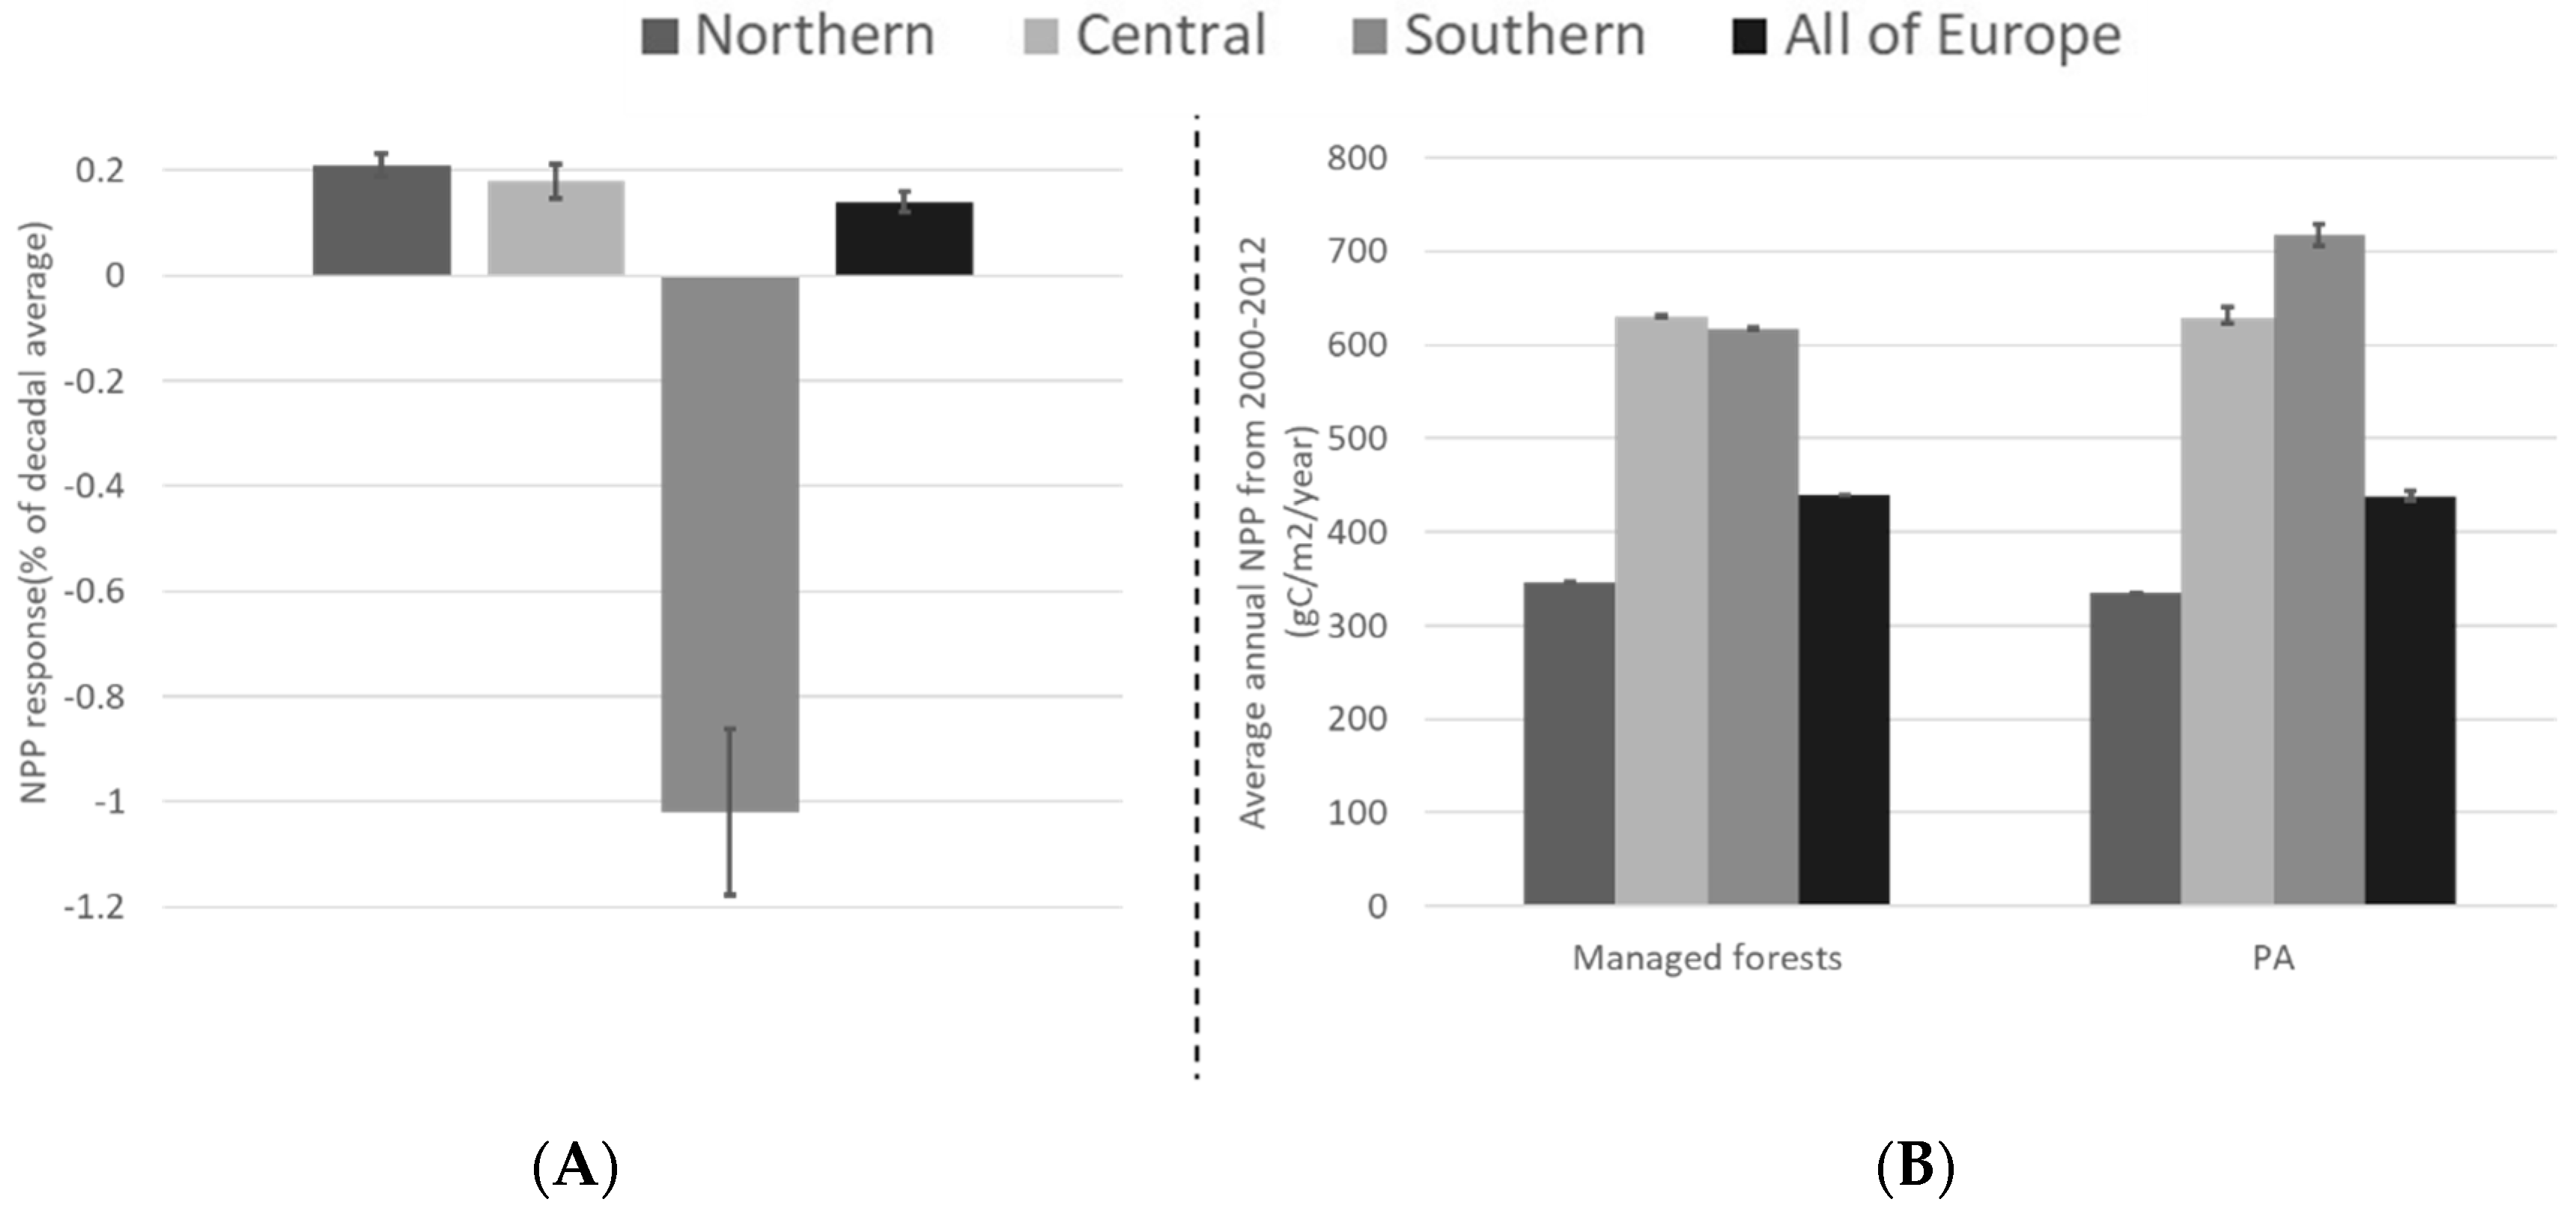
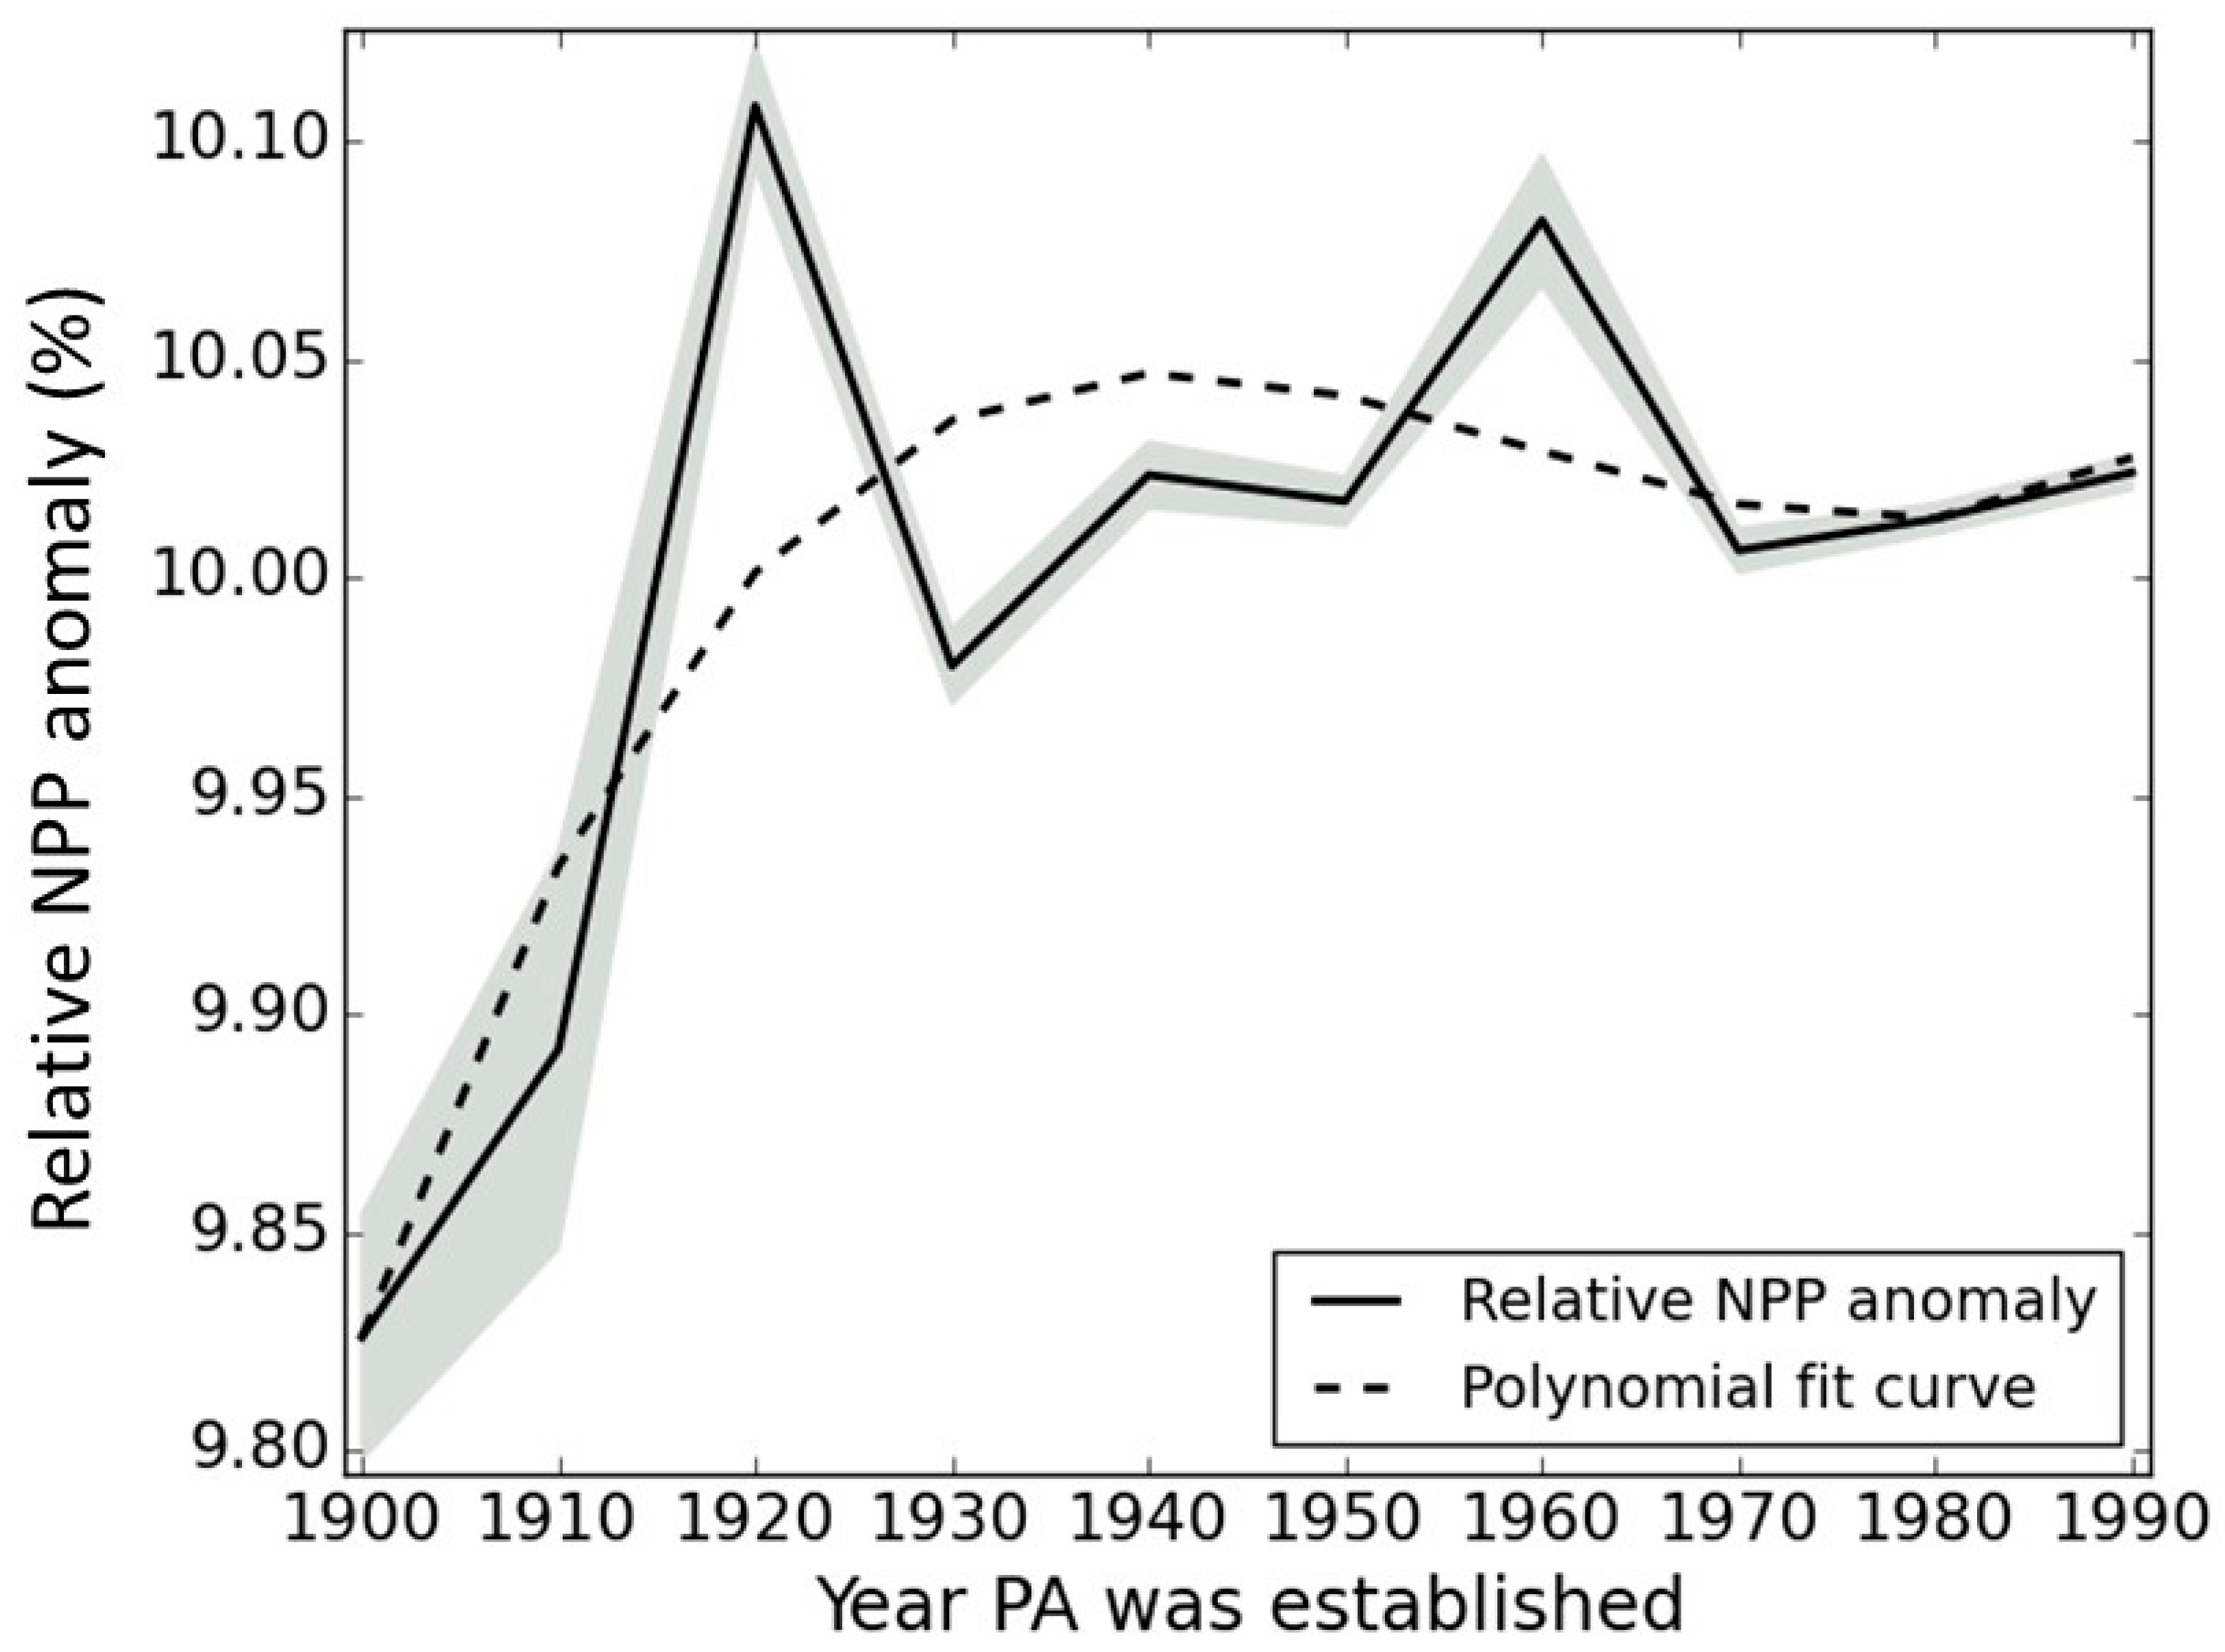
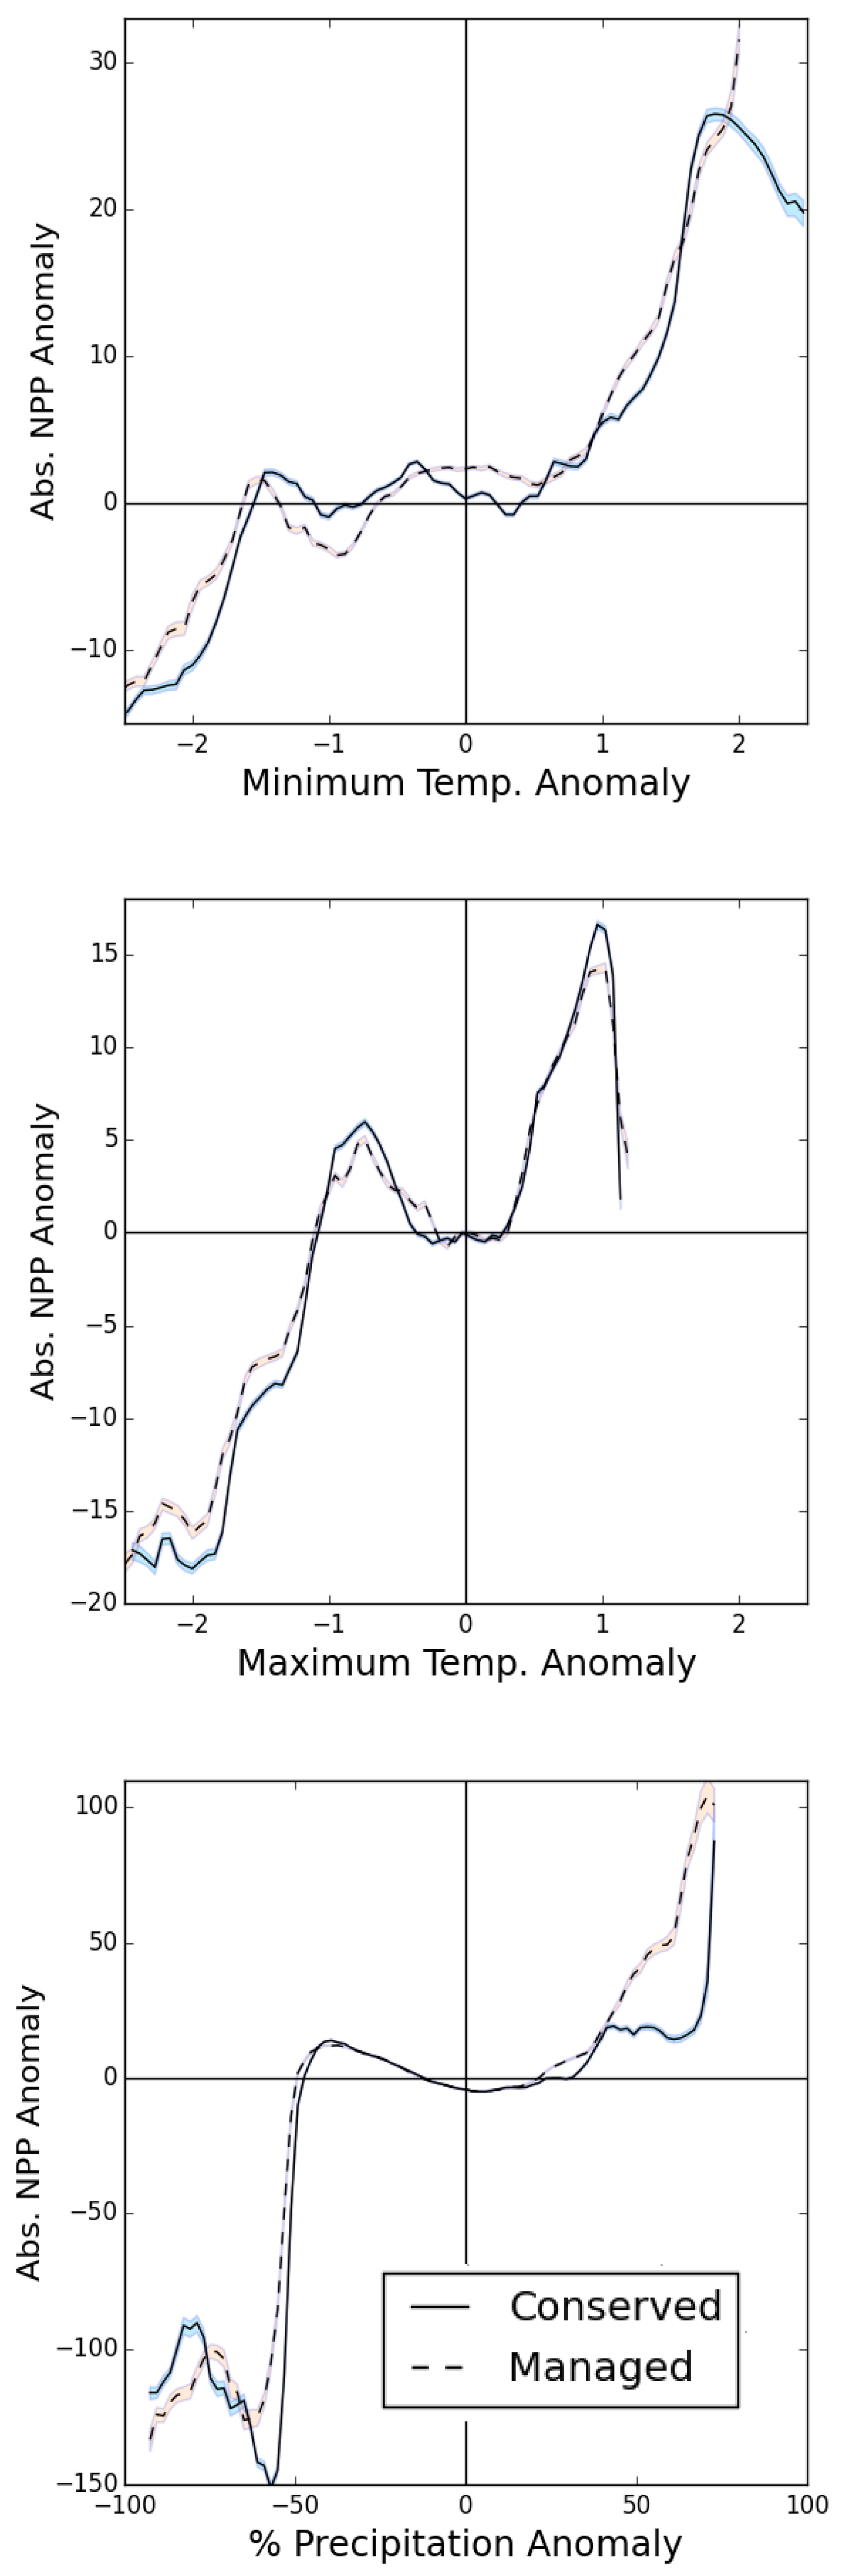
3.1. PA Impact across Europe

Throughout Europe, we compared NPP response to inter-annual climate variation between PA forests and matched managed forests. When we aggregated estimates across the continent, we found no differences in absolute NPP response to climate anomalies between PA and managed forests (Figure 2 and Figure 3). As the period of our data is about one decade and is on a 1 km2 resolution, it is not possible for us to ensure that conservation in PA forests is actually occurring, but because Natura 2000 has an explicit action item [38] to enforce regulations, we assumed that it is being done as outlined by the CDDA.
Different regions have varying portions of their forests designated as PA and experience different magnitudes of inter-annual climate anomalies. For this reason, we analyzed the relative productivity anomaly by region, which weighs highly and unproductive forests equally (Figure 3). This is because a forest’s relative NPP anomaly compared to its long-term mean allows small changes in unproductive sites to be counted equally to large changes in highly productive sites. In this study, less NPP response to climate variability means more robustness because it implies that climate variability has less impact on forest function. Across Europe, we found that PA designated forests do not exhibit sizable differences in NPP response from their actively managed counterparts (Figure 2). Comparing PA-forests to managed forests after applying a quasi-experimental matching (PSM) design, PA-forests were found to have a 0.14% greater absolute mean NPP response to climate anomalies compared to managed forests, indicating that PA designation has had little to no impact in improving forest robustness against climate variation (Figure 2 and Figure A1). However, this result is still highly influenced by Boreal forests, which comprise the majority of PA forests in Europe (Table A1).

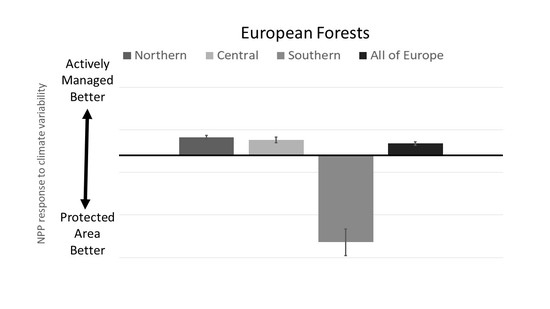
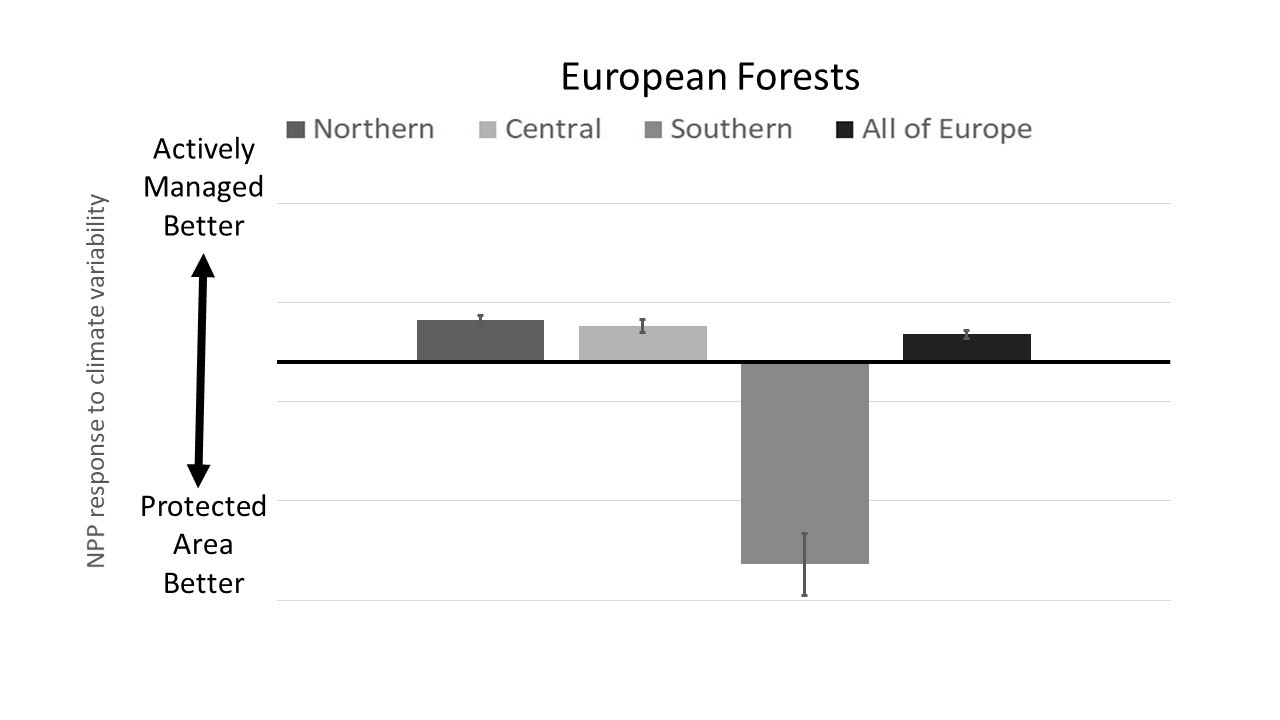
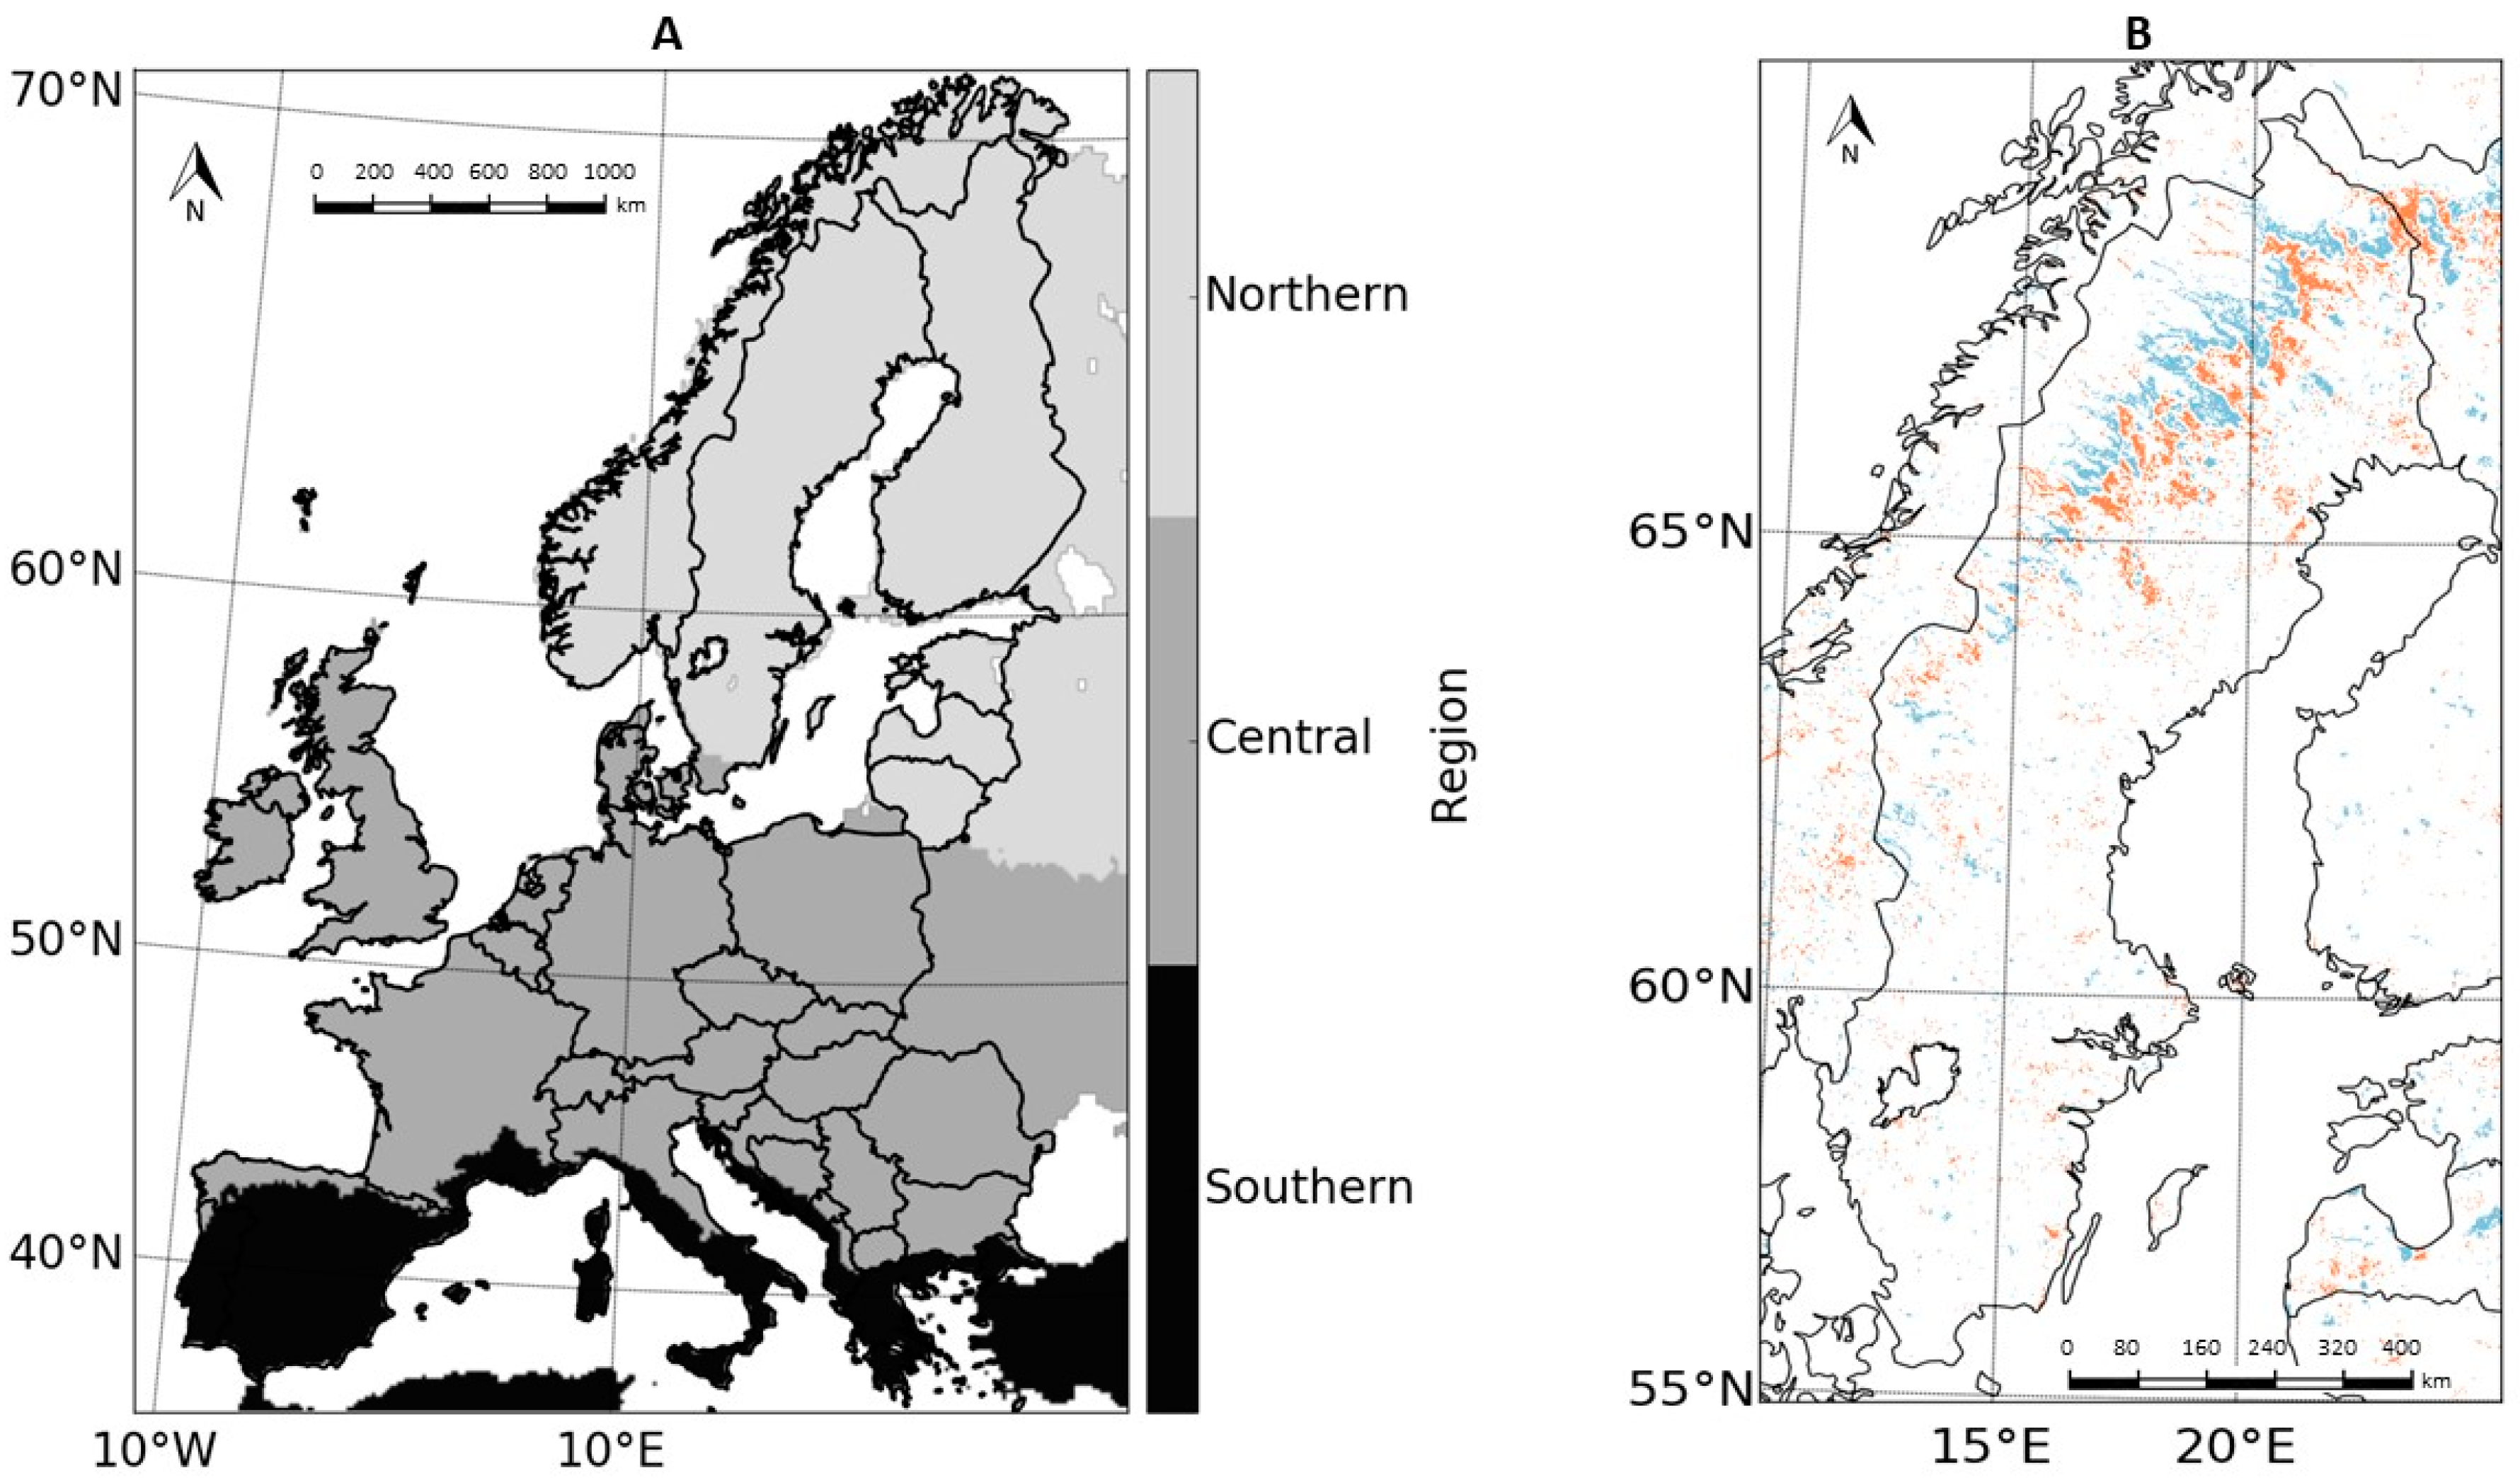
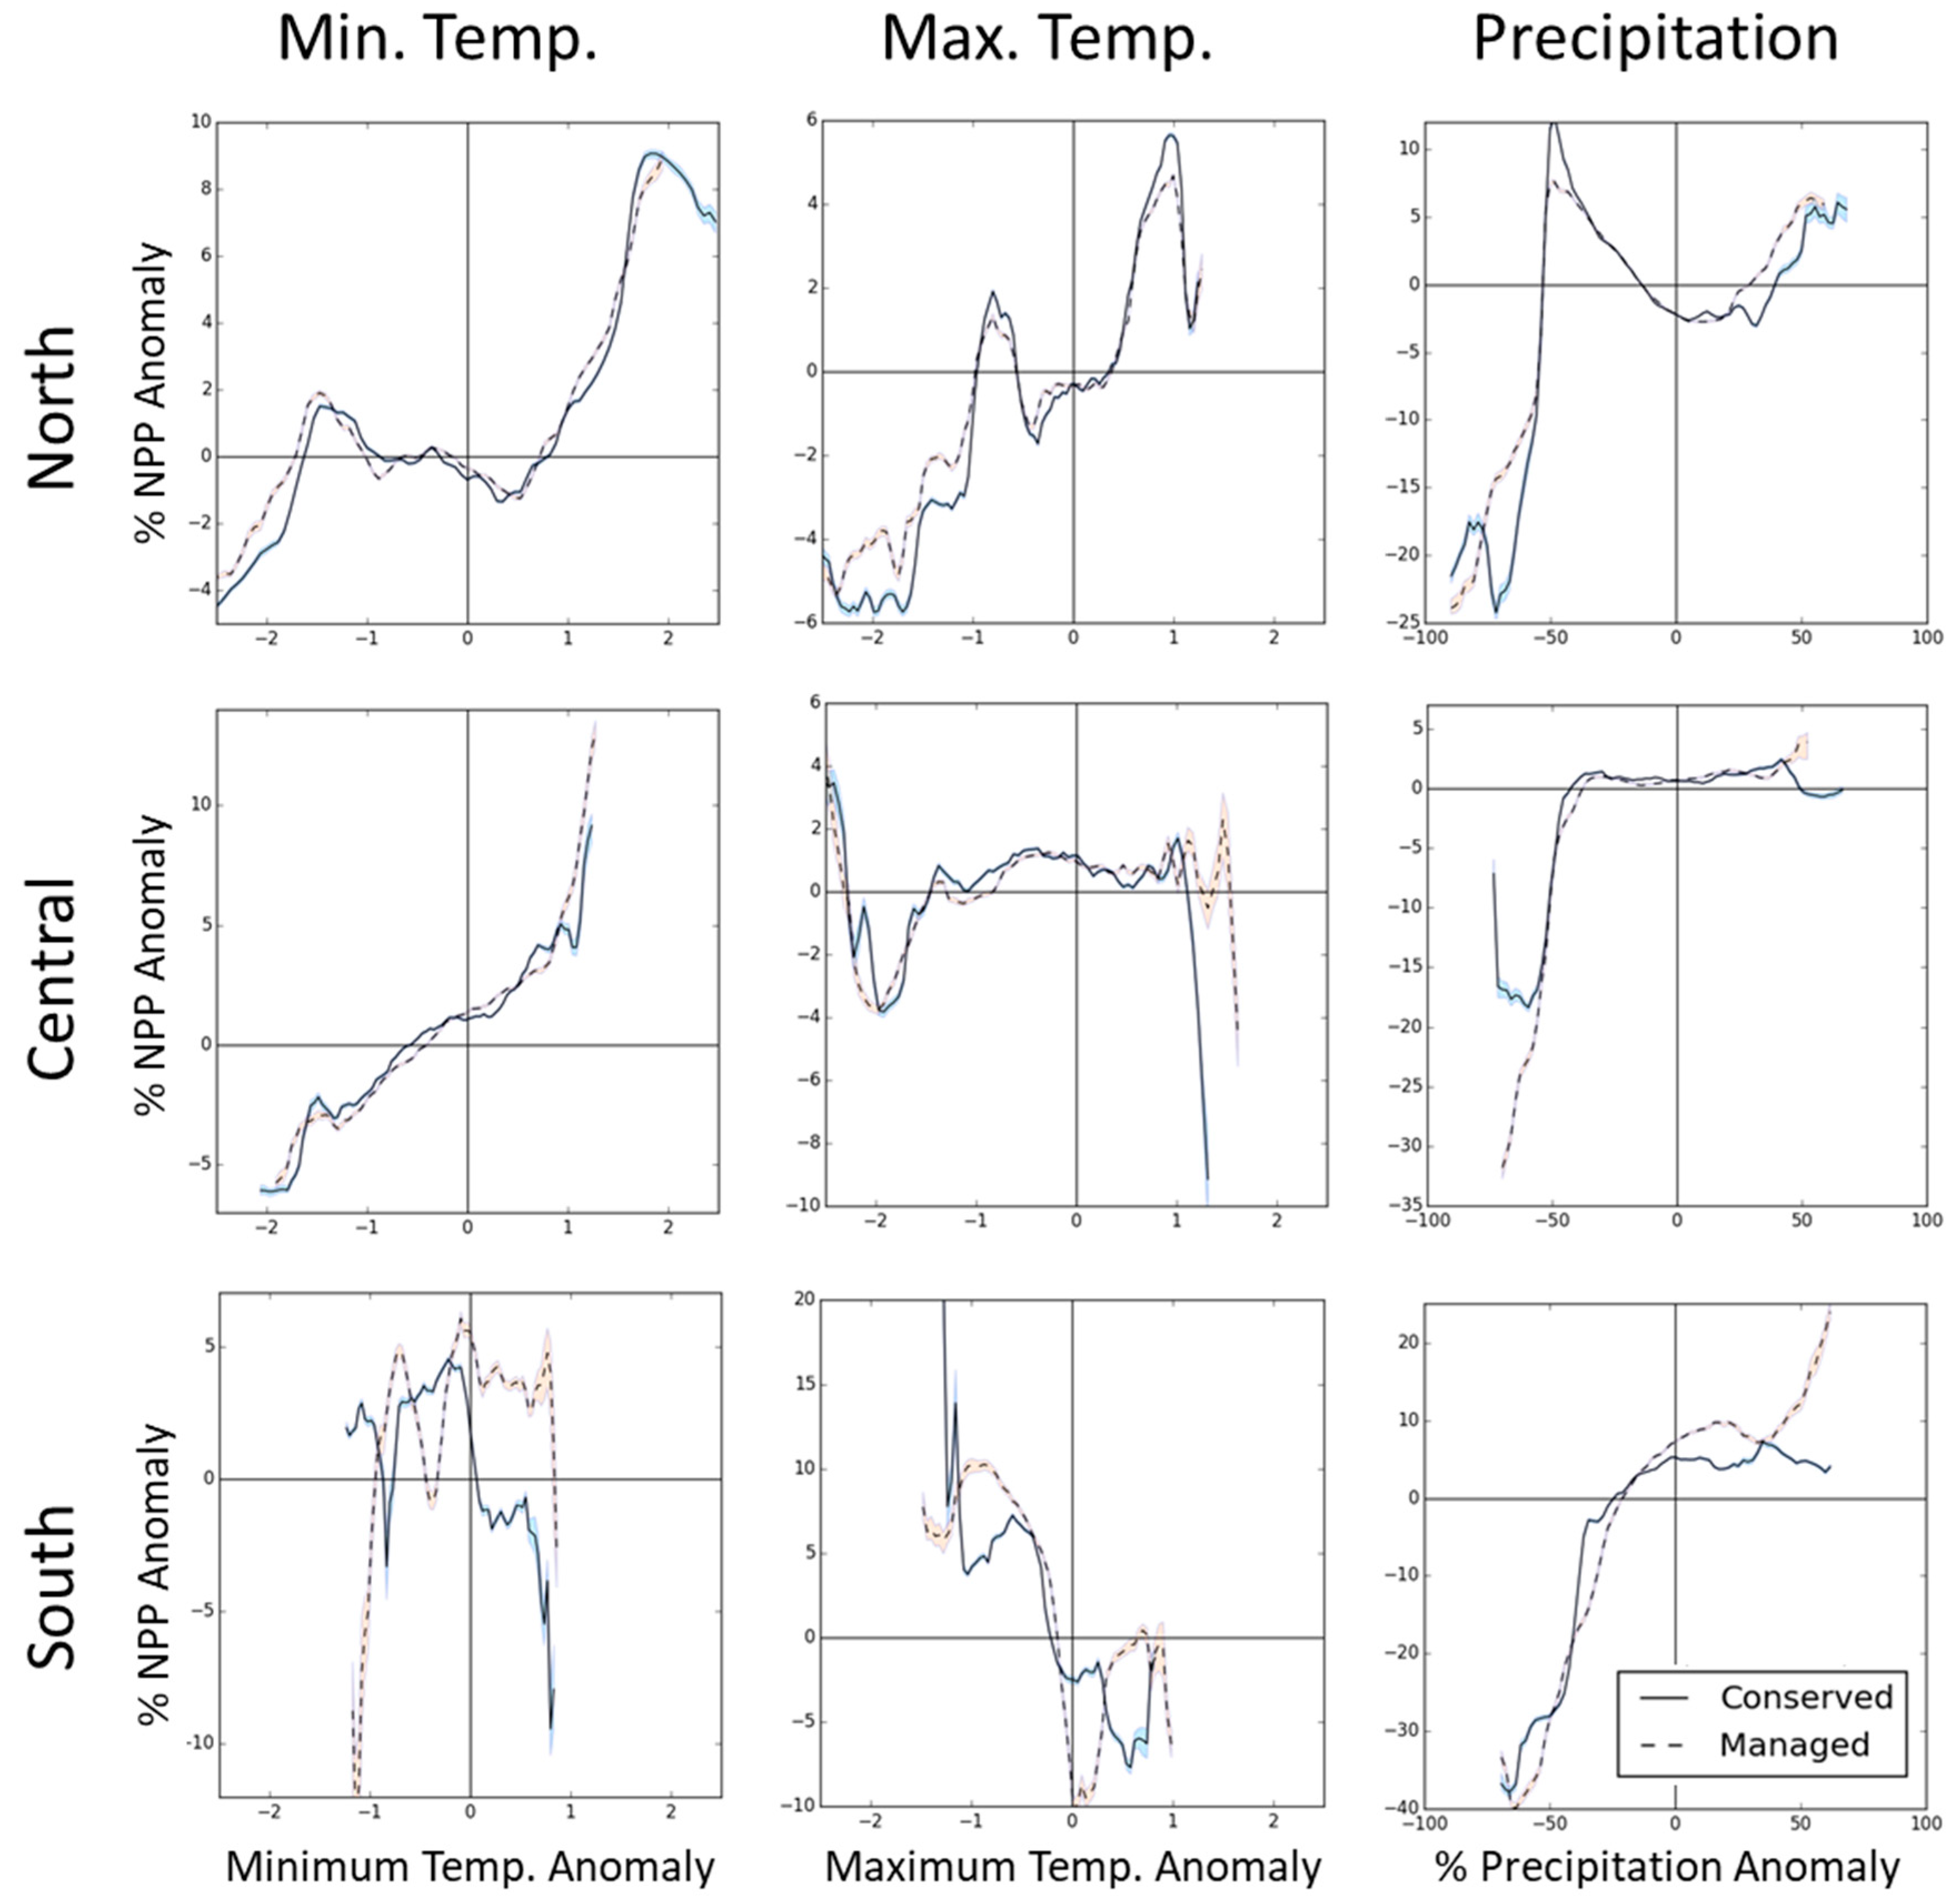
3.2. PA Regional Impacts

We detected significant variation in PA impact on NPP response to climate variation between regions across Europe. We found that, on average, PA forests experienced about a 3% larger responses relative to managed forests for all climate anomalies in the Northern and Central Regions. In these regions, this finding suggests greater or equal robustness to climate anomalies among managed forests as compared to PA forests. In contrast, Southern European PA forests, within the same climate anomaly interval, experienced about 6.5% less response than managed forests. Further, overall NPP was found to be the greatest in the Southern PA forest group out of all forests in this study (Figure 2 and Table A1). Additionally, climate variables impact each region in different ways (Figure 3). Increasing maximum temperature anomalies has a positive impact on NPP in the North, little impact in Central Europe, and a negative impact in the South. Precipitation, however, appears to have a similar impact across regions defined by a step response curve.
The age of a forest also affects forest NPP and robustness; reflecting the management history of a region. For this reason, we quantified the cumulative distribution function of forest age in our three regions (Figure 4) [37]. Forest age tends to increase from South to North. For example, the share of Southern European forests that are younger than 60 years old are 78%, while this share is only 48% in Central Europe and 31% in Northern Europe.
To test whether the length of time a forest has been conserved has an impact we assessed the mean NPP anomaly by year PA was conserved (Figure 5). The general trend indicates that the longer a forest is conserved, the less NPP anomalies are present. Further, on a continental scale this analysis indicates that the greatest impact of conservation begin to show after a forest has been conserved for 60 years or more. This is reflected by the relative flatness after the year 1930 of the NPP anomaly curve with respect to year PA was established. The sharp drop in average NPP anomalies for forests established before 1930 indicates that those forests are more robust to climate variability than the younger ones.

4. Discussion

4.1. Conservation Monitoring and Evaluation

Past evaluation of PA impacts across Europe [39,40] and globally [7,41] have been limited due to difficulties in establishing large-scale datasets on forest-specific biophysical characteristics–which is critical to accurately estimating conservation impacts [42]. The validity of studies that have included forest biophysical characteristics can result in diminished external validity due to the time and costs associated with collecting a statistically representative number of samples across landscapes [43]. Evaluating impacts of policies that influence forest management, traditionally require intensive field data collection [9,44]. The ability to some kind of policy impact via remote sensing methods could provide an inexpensive alternative with increased external validity of larger sample sizes for researchers. The use of remote sensing techniques to measure NPP response to climate variability provides conservation scientists, policy makers and foresters access to previously unavailable baseline data. These methods may have particular relevance to the monitoring of tropical forests where faster annual growth rates often result in a shorter optimum economic rotation period of managed forests when compared to the temperate forests included in this study [45].

4.2. Within the Context of European Conservation

The European Union’s Natura 2000 mandate, along with complimenting global conservation initiatives, such as the Convention on Biological Diversity [10], have been noted as having a clear need for evaluation methods and techniques that reveal the impact of conservation interventions [46,47,48]. This research plays an important role in complimenting the European Commission’s evaluation of conservation progress, currently conducted by their Regulatory Fitness and Performance Programme (REFIT), by providing a third-party analysis using novel methods. Early evaluation of the Natura 2000 has found evidence that many aspects of the program have been successful in meeting international commitments [3]. Our aggregated finding that PA shows little impact to forest NPP response to climate variability on the continental scale (Figure 2 and Table A1), do not contradict these findings, but instead elucidate the importance that time since PA establishment and biodiversity potential has on estimating PA impacts. Our findings show that large-scale remotely sensed quantifiable PA impacts on forest NPP response to climate variability are linked to the historic rotation lengths of the region, largely determined by growth rates, and the potential biodiversity that fill productivity niches and may be lost through forest management. The impact of PA across Europe, which have been established relatively recently, with respect to the age of forests, may not be fully understood until far into the future; especially in regions with slower rates of vegetative growth and relatively few flora species, such as in the boreal zone.

4.3. Regional Differences in PA Impacts

Varying response patterns emerge when relative NPP anomalies are analyzed at the regional level (Figure 2 and Figure 3). In each region, NPP increases with an increasing minimum temperature anomaly (Figure 3). Interestingly, Northern Europe is no more responsive to minimum temperature anomalies between ±1 °C than other climate variables, indicating that productivity in these forests are not primarily driven by growing season length. In fact, the minimum temperature anomalies must be relatively high before a benefit can be detected. In Central Europe, the minimum temperature response demonstrates that NPP is strongly limited by growing season length. Southern Europe is limited by both precipitation and maximum temperatures and experiences the most inter-annual variation in productivity response compared to the other regions (Table A1 and Table A2). Central and Southern Europe have negative responses to rising maximum temperatures, while Northern Europe has a positive response. This indicates that, during the growing season, Northern forests may be limited by low maximum temperatures, while other regions may respond negatively to factors driven by maximum temperatures such as vapor pressure deficit, respiration rates, or soil moisture. Central Europe has little response to precipitation until ±25%, indicating that Central European forests are relatively robust to drought. It is interesting to note that the regional curves of response to precipitation appear to be the same step response function with different overshoot values, indicating that all forests respond to precipitation in the same way, except for differences in some damping mechanisms in the system (Figure 3).
It is important to recognize the differences in patterns between regions to acknowledge that each will react differently to inter-annual climate variation, regardless of management type. For example, management in Central Europe will have little effect on response to drought because little overall response to precipitation exists. Where little response to variation is shown, little difference between management and PA exists.
We, however, found significant differences in the impacts of PA to NPP response to climate variability between Northern, Central, and Southern European Regions (Figure 2). These differences are a result of historic forest management practices and biodiversity potential of the region. The greatest difference in NPP response to climate variability between managed and PA forests is in the Southern Region, which has the shortest rotation lengths and greatest biodiversity potential in Europe [49,50]. Southern PA forests not only have the lowest NPP response to climate variation, but also have the highest NPP out of any other group in this study with 718 gC/m2/yr (Figure 2 and Figure 3, Table A1). This may indicate that traditional coppice forest management, prevalent in the South, underutilizes the potential productivity in their forests. Previous studies have shown that an increase in filled ecological niches may beneficially impact forest productivity [21,51].
Northern forests typically have rotation lengths of 65–110 years, while Southern forests contain a large portion of coppice forest, which can have rotation lengths as short as two years [52,53]. Rotation lengths dictate forest age and the average age of forests gets older from South to North [37] (Figure 4). Differences between managed and PA forests begin to emerge as the time that a forest is conserved surpasses the common rotation length of its region. Once a forest is older than the common rotation length of the region, PA forests will enter a successional stage that managed forests will not reach leading to different NPP dynamics. This fact, combined with the fact that rotation lengths grow longer from South to North, leads to a logical observation that impacts from PA on NPP response will be more quantifiable in the south as opposed to the north. It is for this reason that on the continental scale, which is primarily influenced by boreal forests because they have the most PA in Europe, the impact of PA is negligible for forests conserved less than 65 years (Figure 5). The average time a forest has been designated as PA in our study is 23 years, further supporting the observation that most impacts from PA policies in Europe are demonstrated in the South, even though no differences are detectible on the continental scale. Climate conditions from North to South also, generally, mean that a greater biodiversity and tree species richness is achievable in the South leading to a greater potential quantifiable magnitude of difference between managed and PA forests [49]. Taken to an extreme is, for example, if only one functional group could exist in a region then PA could not increase the biodiversity over a managed forest, thus not filling additional ecological niches, and so could not create a more stable system under a varying climate. We also found higher levels of NPP in PA forest established before 1950 with a mean NPP of 449 gC/m2/yr. Whereas, those conserved after 1950 have a mean NPP of 386 gC/m2/yr further leading to the conclusion that the more time a forest is in PA, the greater benefit will be quantifiable on large scales.

5. Conclusions

We conclude that not enough time has elapsed to quantify large-scale effects of conservation policy and forest management over all PA forests throughout Europe. In addition, until conserved forests are older than rotation lengths for their forest type, European forest management, especially in central and Northern Europe, maintains robustness levels that are potentially equal those of conserved forests. This does not imply that forest conservation does not have an effect on robustness because when forests are evenly weighted and split into regional groups, differences between managed and PA forests emerge. Indeed, forests with the highest productivity are southern PA forests (Figure 2, Table A1). This is not to say that these forests have the greatest productivity in all of Europe. Southern PA forests have the highest productivity of forests that have the same site quality as forests of equal alternative economic land use value to European PA forests. The differences between managed and PA increase from north to south, which follows historic forest management and the potential biodiversity of the region. Differences between managed and PA forests are beginning to appear in the South and older conserved forests indicating that with time differences may begin to emerge in all regions of Europe. Policies and management decisions could be made to hasten this progress. For example, restoration and planting efforts could more quickly increase tree species diversity, which can take decades to change if forests are surrounded by managed forests and not within diverse species’ parent tree seed dispersal distances.
Though uncertainty is low in the results, this is primarily driven by the large number of data points. MODIS NPP, climate data, and forest age information all have uncertainty and error associated with them. As an aggregate, the results of this study have relatively low uncertainty. However, on the local scale uncertainty increases. It is for this reason that we present our results on regional to continental scales.
The lack of large differences between managed and conserved forests is not only driven by ecophysiology and management but also by policy and regulation enforcement. One could speculate that the IUCN categories were not strictly followed or that our assumption that un-conserved forests are managed is imperfect. Both obscure conservation enforcement and abandoned management on productive forest may lead to little difference between managed and PA forests, yet verifying this is out of the scope of this study. Further large-scale research is needed to ensure regulation and management is being implemented as designed.
NPP response to climate variability could also be used as an indicator of functional biodiversity. As more functional groups establish within a forest more ecological niches are filled. As climate varies from year to year as one niche’s NPP diminishes another niche’s NPP may thrive, thereby keeping NPP at near steady state. In this way less NPP response to climate variability may indicate increased biodiversity. This indicates that, with further research, this method may be used as a proxy measure for functional biodiversity.
Concerted forest conservation policies throughout Europe are still in their infancy with respect to the age of forests. However, as these forests mature the differences in their response to climate anomalies between managed and PA forests, and thus in their functional diversity, will begin to widen. Continuous large scale monitoring, such as that shown here, could assist in assessing the efficacy of continental scale policy decisions.

Author Contributions

A.M. and M.N. conceptualized the study; A.M. and C.T. developed the methodology and software; A.M. wrote the manuscript; and H.H. supervised the work. All authors reviewed and edited the final manuscript.

Funding

This research was funded by the European Union Seventh Framework Programme under grant agreement n° 311,970 and the University Space Research Association’s NASA Post-Doctoral Program fellowship.

Acknowledgments

We thank Loretta Moreno for proof reading and revising the manuscript.

Conflicts of Interest

The authors declare no conflict of interest. The funders had no role in the design of the study; in the collection, analyses, or interpretation of data; in the writing of the manuscript, or in the decision to publish the results.

Appendix A

On the European scale, forests experienced few NPP anomalies up to ±1 °C and ±25% precipitation (Figure A1). Only 16%, 14%, and 14% of all climate anomalies are outside of these ranges for minimum and maximum temperatures and precipitation respectively. Annual NPP increases with higher anomalies in all climate factors. Less than 0.5% of the absolute mean NPP anomaly separates managed and conserved forest’s response to all climate anomalies (Table A1). Differences between managed and PA forests arise towards higher climate anomaly values with conserved forests experiencing less response than managed except regarding maximum temperatures. However, only 2%, 1%, and 2% of events are greater than ±2 °C in minimum and maximum temperatures and ±50% of precipitation respectively.
Figure A1. Absolute NPP anomalies versus minimum temperature, maximum temperature, and precipitation for conserved and managed forests in Europe. The blue and pink shading is the 95% confidence intervals for PA and managed forests respectively. Moving median of 10 climate anomalies.
Remotesensing 11 00087 g0a1
Table A1. NPP and NPP response to climate anomalies for Northern, Central, Southern and All of Europe. Both managed and conserved (PA) groups are considered. N is the number of samples, % Ann is the average relative response to climate anomalies as a percent of the long-term mean, STD is the standard deviation of the % Ann, NPP is the average annual NPP from 2000–2012.
ManagedConserved
N% Ann.STDNPP% Ann.STDNPP
Northern816,0237.4510.05346.007.6610.39334.51
Central326,2096.388.94630.656.459.55629.00
Southern80,65215.7221.67617.3514.7022.93716.72
All1,222,8977.6910.94439.947.8311.45438.27
Table A2. Sensitivity Analysis and quantification of confounding of matching procedure for several variables that influence economic value or site conditions of a forest site. N is the number of samples, mean is the mean of that variable, STD is the standard deviation, and Variance, Skewness and Kurtosis are the three moments of the distribution.
NMeanSTDVarianceSkewnessKurtosis
Solar Radiation (W/km2)
  All managed forests9,352,1922118.58662.78439,274.00−0.13−0.65
  PA-forests94,0691712.79684.97469,188.000.69−1.00
  Managed forests post-match94,0691741.14716.86513,893.000.75−0.90
Elevation (m)
  All managed forests9,352,192323.71366.23134,124.822.478.41
  PA-forests94,069578.61498.38248,383.101.532.30
  Managed forests post-match94,069562.25484.98235,207.741.542.24
Precipitation (cm/yr)
  All managed forests9,352,1921.980.8267.992.7110.80
  PA-forests94,0691.920.7963.002.628.39
  Managed forests post-match94,0691.910.7454.122.346.66
Minimum Temperature (°C)
  All managed forests9,352,1923.954.431959.66−0.34−0.43
  PA-forests94,069−0.484.652157.980.960.25
  Managed forests post-match94,069−0.484.311860.910.82−0.16
Maximum Temperature (°C)
  All managed forests9,352,19212.795.282785.68−0.01−0.46
  PA-forests94,0697.674.642154.801.000.28
  Managed forests post-match94,0697.984.752257.381.010.25
Vapor Pressure Deficit (Pa)
  All managed forests9,352,1925549.632309.875,335,510.000.69−0.17
  PA-forests94,0693923.851494.052,232,180.001.904.83
  Managed forests post-match94,0694113.031746.333,049,660.001.893.66

References

  1. European Commission Natura 2000 Newsletter. Available online: http://ec.europa.eu/environment/nature/info/pubs/natura2000nl_en.htm (accessed on 14 October 2018).
  2. Millennium Ecosystem Assessment. Ecosystems and Human Well-being: Synthesis; Island Press: Washington, DC, USA, 2005; ISBN 1597260401. [Google Scholar]
  3. Beresford, A.E.; Buchanan, G.M.; Sanderson, F.J.; Jefferson, R.; Donald, P.F. The Contributions of the EU Nature Directives to the CBD and Other Multilateral Environmental Agreements. Conserv. Lett. 2016, 9, 479–488. [Google Scholar] [CrossRef] [Green Version]
  4. Daily, G.C.; Alexander, S.; Ehrlich, P.R.; Goulder, L.; Lubchenco, J.; Matson, P.A.; Mooney, H.A.; Postel, S.; Schneider, S.H.; Tilman, D.; et al. Ecosystem Services: Benefits Supplied to Human Societies by Natural Ecosystems. Issues Ecol. 1997, 2, 1–18. [Google Scholar]
  5. Day, J.; Dudley, N.; Hockings, M.; Holmes, G.; Laffoley, D.; Stolton, S. Guidelines for Applying the IUCN Protected Area Management Categories to Marine Protected Areas; IUCN: Gland, Switzerland, 2012. [Google Scholar]
  6. European Commission Natura 2000 and Forests. Part I-II. Tech. Rep. Environ. 2015, 88, 114.
  7. Joppa, L.N.; Pfaff, A. Global protected area impacts. Proc. R. Soc. B Biol. Sci. 2011, 278, 1633–1638. [Google Scholar] [CrossRef] [PubMed]
  8. Geldmann, J.; Barnes, M.; Coad, L.; Craigie, I.D.; Hockings, M.; Burgess, N.D. Effectiveness of terrestrial protected areas in reducing habitat loss and population declines. Biol. Conserv. 2013, 161, 230–238. [Google Scholar] [CrossRef]
  9. Gray, C.L.; Hill, S.L.L.; Newbold, T.; Hudson, L.N.; Börger, L.; Contu, S.; Hoskins, A.J.; Ferrier, S.; Purvis, A.; Scharlemann, J.P.W. Local biodiversity is higher inside than outside terrestrial protected areas worldwide. Nat. Commun. 2016, 7, 12306. [Google Scholar] [CrossRef] [PubMed] [Green Version]
  10. Balmford, A.; Bennun, L.; Ten Brink, B.; Cooper, D.; Côté, I.M.; Crane, P.; Dobson, A.; Dudley, N.; Dutton, I.; Green, R.E.; et al. The Convention on Biological Diversity’s 2010 Target. Science 2005, 307, 212–213. [Google Scholar] [CrossRef]
  11. Trouwborst, A.; Chapron, G.; Fleurke, F.; Epstein, Y.; López-Bao, J.V. Europe’s biodiversity avoids fatal setback. Science 2017, 355, 140. [Google Scholar] [CrossRef]
  12. Orlikowska, E.H.; Roberge, J.-M.; Blicharska, M.; Mikusiński, G. Gaps in ecological research on the world’s largest internationally coordinated network of protected areas: A review of Natura 2000. Biol. Conserv. 2016, 200, 216–227. [Google Scholar] [CrossRef]
  13. PAILLET, Y.; BERGÈS, L.; HJÄLTÉN, J.; ÓDOR, P.; AVON, C.; BERNHARDT-RÖMERMANN, M.; BIJLSMA, R.-J.; DE BRUYN, L.; FUHR, M.; GRANDIN, U.; et al. Biodiversity Differences between Managed and Unmanaged Forests: Meta-Analysis of Species Richness in Europe. Conserv. Biol. 2010, 24, 101–112. [Google Scholar] [CrossRef] [Green Version]
  14. De Koning, J.; Winkel, G.; Sotirov, M.; Blondet, M.; Borras, L.; Ferranti, F.; Geitzenauer, M. Natura 2000 and climate change—Polarisation, uncertainty, and pragmatism in discourses on forest conservation and management in Europe. Environ. Sci. Policy 2014, 39, 129–138. [Google Scholar] [CrossRef]
  15. Salinger, M.J. Climate Variability and Change: Past, Present and Future—An Overview. Clim. Chang. 2005, 70, 9–29. [Google Scholar] [CrossRef]
  16. Anderegg, W.R.L.; Berry, J.A.; Smith, D.D.; Sperry, J.S.; Anderegg, L.D.L.; Field, C.B. The roles of hydraulic and carbon stress in a widespread climate-induced forest die-off. Proc. Natl. Acad. Sci. USA 2012, 109, 233–237. [Google Scholar] [CrossRef] [PubMed]
  17. Neumann, M.; Mues, V.; Moreno, A.; Hasenauer, H.; Seidl, R. Climate variability drives recent tree mortality in Europe. Glob. Chang. Biol. 2017, 23, 4788–4797. [Google Scholar] [CrossRef] [PubMed]
  18. Miteva, D.A.; Pattanayak, S.K.; Ferraro, P.J. Evaluation of biodiversity policy instruments: What works and what doesn’t? Oxf. Rev. Econ. Policy 2012, 28, 69–92. [Google Scholar] [CrossRef]
  19. Faith, D.P.; Walker, P.A.; Ive, J.R.; Belbin, L. Integrating conservation and forestry production: Exploring trade-offs between biodiversity and production in regional land-use assessment. For. Ecol. Manag. 1996, 85, 251–260. [Google Scholar] [CrossRef]
  20. Seidl, R.; Schelhaas, M.-J.; Rammer, W.; Verkerk, P.J. Increasing forest disturbances in Europe and their impact on carbon storage. Nat. Clim. Chang. 2014, 4, 806–810. [Google Scholar] [CrossRef] [PubMed] [Green Version]
  21. Tilman, D.; Reich, P.B.; Isbell, F. Biodiversity impacts ecosystem productivity as much as resources, disturbance, or herbivory. Proc. Natl. Acad. Sci. USA 2012, 109, 10394–10397. [Google Scholar] [CrossRef] [Green Version]
  22. Hooper, D.U.; Chapin, F.S., III; Ewel, J.J. Effects of biodiversity on ecosystem functioning: a consensus of current knowledge. Ecol. Monogr. 2005, 75, 3–35. [Google Scholar] [CrossRef]
  23. Robinson, N.P.; Allred, B.W.; Smith, W.K.; Jones, M.O.; Moreno, A.; Erickson, T.A.; Naugle, D.E.; Running, S.W. Terrestrial primary production for the conterminous United States derived from Landsat 30 m and MODIS 250 m. Remote Sens. Ecol. Conserv. 2018, 1–17. [Google Scholar] [CrossRef]
  24. Joppa, L.N.; Pfaff, A. High and Far: Biases in the Location of Protected Areas. PLoS ONE 2009, 4, e8273. [Google Scholar] [CrossRef] [PubMed]
  25. Cleveland, C.C.; Townsend, A.R.; Taylor, P.; Alvarez-Clare, S.; Bustamante, M.M.C.; Chuyong, G.; Dobrowski, S.Z.; Grierson, P.; Harms, K.E.; Houlton, B.Z.; et al. Relationships among net primary productivity, nutrients and climate in tropical rain forest: A pan-tropical analysis. Ecol. Lett. 2011, 14, 939–947. [Google Scholar] [CrossRef] [PubMed] [Green Version]
  26. Chapin, F.S., III; Zavaleta, E.S.; Eviner, V.T.; Naylor, R.L.; Vitousek, P.M.; Reynolds, H.L.; Hooper, D.U.; Lavorel, S.; Sala, O.E.; Hobbie, S.E.; et al. Consequences of changing biodiversity. Nature 2000, 405, 234–242. [Google Scholar] [CrossRef] [PubMed]
  27. Thuiller, W. Climate change and the ecologist. Nature 2007, 448, 550–552. [Google Scholar] [CrossRef] [PubMed] [Green Version]
  28. European Environment Agency Nationally Designated Areas (CDDA). Available online: https://www.eea.europa.eu (accessed on 14 October 2018).
  29. Forest Europe. State of Europe’s Forests 2015. In Proceedings of the Ministerial Conference on the Protection of Forests in Europe FOREST EUROPE Liaison Unit, Madrid, Spain, 20–21 October 2015. [Google Scholar]
  30. European Environment Agency European Biogeographical Regions. Available online: https://www.eea.europa.eu/data-and-maps/data/biogeographical-regions-europe-3 (accessed on 14 October 2018).
  31. Friedl, M.; McIver, D.K.; Hodges, J.C.F.; Zhang, X.; Muchoney, D.; Strahler, A.H.; Woodcock, C.E.; Gopal, S.; Schneider, A.; Cooper, A.; et al. Global land cover mapping from MODIS: algorithms and early results. Remote Sens. Environ. 2002, 83, 287–302. [Google Scholar] [CrossRef]
  32. Moreno, A.; Hasenauer, H. Spatial downscaling of European climate data. Int. J. Climatol. 2016, 36, 1444–1458. [Google Scholar] [CrossRef]
  33. USGS GTOPO30 Global 30 Arc-Second Elevation (GTOPO30). Available online: https://lta.cr.usgs.gov/GTOPO30 (accessed on 14 October 2018).
  34. Newbold, T.; Hudson, L.N.; Hill, S.L.; Contu, S.; Lysenko, I.; Senior, R.; Börger, L.; Bennett, D.; Choimes, A.; Collen, B.; et al. Global effects of land use on local terrestrial biodiversity. Nature 2015, 520, 45. [Google Scholar] [CrossRef]
  35. Neumann, M.; Moreno, A.; Thurnher, C.; Mues, V.; Härkönen, S.; Mura, M.; Bouriaud, O.; Lang, M.; Cardellini, G.; Thivolle-Cazat, A.; et al. Creating a Regional MODIS Satellite-Driven Net Primary Production Dataset for European Forests. Remote Sens. 2016, 8, 554. [Google Scholar] [CrossRef]
  36. Neumann, M.; Smith, P. Carbon uptake by European agricultural land is variable, and in many regions could be increased: Evidence from remote sensing, yield statistics and models of potential productivity. Sci. Total Environ. 2018, 643, 902–911. [Google Scholar] [CrossRef]
  37. Moreno, A.; Neumann, M.; Hasenauer, H. Forest structures across Europe. Geosci. Data J. 2017, 4, 17–28. [Google Scholar] [CrossRef] [Green Version]
  38. Biodiversity Information System for Europe. Available online: https://biodiversity.europa.eu/ (accessed on 14 October 2018).
  39. Kallimanis, A.S.; Touloumis, K.; Tzanopoulos, J.; Mazaris, A.D.; Apostolopoulou, E.; Stefanidou, S.; Scott, A.V.; Potts, S.G.; Pantis, J.D. Vegetation coverage change in the EU: patterns inside and outside Natura 2000 protected areas. Biodivers. Conserv. 2015, 24, 579–591. [Google Scholar] [CrossRef]
  40. Gerard, F.; Petit, S.; Smith, G.; Thomson, A.; Brown, N.; Manchester, S.; Wadsworth, R.; Bugar, G.; Halada, L.; Bezák, P.; et al. Land cover change in Europe between 1950 and 2000 determined employing aerial photography. Prog. Phys. Geogr. 2010, 34, 183–205. [Google Scholar] [CrossRef] [Green Version]
  41. Nagendra, H. Do Parks Work? Impact of Protected Areas on Land Cover Clearing. AMBIO J. Hum. Environ. 2008, 37, 330–337. [Google Scholar] [CrossRef]
  42. Vincent, J.R. Impact Evaluation of Forest Conservation Programs: Benefit-Cost Analysis, Without the Economics. Environ. Resour. Econ. 2016, 63, 395–408. [Google Scholar] [CrossRef]
  43. Ho, D.E.; Imai, K.; King, G.; Stuart, E.A. Matching as nonparametric preprocessing for reducing model dependence in parametric causal inference. Political Anal. 2007, 15, 199–236. [Google Scholar] [CrossRef]
  44. Mohebalian, P.M.; Aguilar, F.X. Beneath the Canopy: Tropical Forests Enrolled in Conservation Payments Reveal Evidence of Less Degradation. Ecol. Econ. 2018, 143, 64–73. [Google Scholar] [CrossRef]
  45. Pearse, P.H. The Optimum Forest Rotation. For. Chron. 1967, 43, 178–195. [Google Scholar] [CrossRef]
  46. Davis, M.; Naumann, S.; McFarland, K.; Graf, A.; Evans, D. Literature Review The ecological effectiveness of the Natura 2000 Network. Tech. Pap. Eur. Environ. Agency 2014, 5, 30. [Google Scholar]
  47. Tittensor, D.P.; Walpole, M.; Hill, S.L.L.; Boyce, D.G.; Britten, G.L.; Burgess, N.D.; Butchart, S.H.M.; Leadley, P.W.; Regan, E.C.; Alkemade, R.; et al. A mid-term analysis of progress toward international biodiversity targets. Science 2014, 346, 241–244. [Google Scholar] [CrossRef]
  48. Butchart, S.H.M.; Clarke, M.; Smith, R.J.; Sykes, R.E.; Scharlemann, J.P.W.; Harfoot, M.; Buchanan, G.M.; Angulo, A.; Balmford, A.; Bertzky, B.; et al. Shortfalls and Solutions for Meeting National and Global Conservation Area Targets. Conserv. Lett. 2015, 8, 329–337. [Google Scholar] [CrossRef] [Green Version]
  49. Fady-Welterlen, B. Is There Really More Biodiversity in Mediterranean Forest Ecosystems? Taxon 2005, 54, 905. [Google Scholar] [CrossRef]
  50. Mauri, A.; Strona, G.; San-Miguel-Ayanz, J. EU-Forest, a high-resolution tree occurrence dataset for Europe. Sci. Data 2017, 4, 160123. [Google Scholar] [CrossRef] [PubMed] [Green Version]
  51. Paquette, A.; Messier, C. The effect of biodiversity on tree productivity: from temperate to boreal forests. Glob. Ecol. Biogeogr. 2011, 20, 170–180. [Google Scholar] [CrossRef]
  52. Dallemand, E.J.F.; Petersen, J.E.; Karp, A. Short Rotation Forestry, Short Rotation Coppice and perennial grasses in the European Union: Agro-environmental aspects, present use and perspectives. JRC Sci. Tech. Rep. 2008, 166. Available online: https://iet.jrc.ec.europa.eu/remea/events/short-rotation-forestry-short-rotation-coppice-and-perennial-grasses-european-union-agro (accessed on 26 December 2018).
  53. Laughlin, J.; Messina, M. Swedisk Forestry and Forest Policy. J. For. 1988, 86, 17–22. [Google Scholar] [CrossRef]
Figure 1. Regions of Europe (A) and Swedish example (B) of Forest Protected Areas (blue) and managed forests (red).
Remotesensing 11 00087 g001
Figure 2. NPP response by region and for all of Europe combined (A) and mean annual NPP separated by managed forests and protected areas PA (B). Error bars indicate the standard error. Mean absolute NPP anomaly was measured relative to the decadal average for managed and conserved forest in Northern, Central, and Southern Europe as well as all of Europe. All findings were found to be statistically significant with a 95% confidence interval with P-value <0.001.
Remotesensing 11 00087 g002
Figure 3. Relative NPP anomalies to long-term NPP mean against minimum temperature, maximum temperature and precipitation anomalies for managed and conserved forests in three regions of Europe. The blue and pink shading is the 95% confidence intervals for conserved and managed forests respectively. Moving median of 10 climate anomalies.
Remotesensing 11 00087 g003
Figure 4. Cumulative distribution function of forest age classes in three European regions. Age classes: 1 = 0–20, 2 = 21–40, 3 = 41–60, 4 = 61–80, 5 = 81–100, 6 = 101–120, and 7 = 121–140, and 8 = >140.
Remotesensing 11 00087 g004
Figure 5. Average relative NPP response to climate variation as % to long-term mean by year forest was designate as protected. Shaded areas represent the 95% confidence interval.
Remotesensing 11 00087 g005

