Flood Hazard Mapping and Assessment on the Angkor World Heritage Site, Cambodia


1
Institute of Remote Sensing and Digital Earth, Chinese Academy of Sciences, No. 9 Dengzhuang South Road, Beijing 100094, China
2
University of Chinese Academy of Sciences, Beijing 100049, China
3
School of Architectural and Surveying Engineering, Jiangxi University of Science and Technology, No. 86 Hongqi Avenue, Zhanggong District, Ganzhou 341000, China
*
Author to whom correspondence should be addressed.
Remote Sens. 2019, 11(1), 98; https://0-doi-org.brum.beds.ac.uk/10.3390/rs11010098
Submission received: 1 December 2018
/
Revised: 25 December 2018
/
Accepted: 2 January 2019
/
Published: 8 January 2019
(This article belongs to the Special Issue Synthetic Aperture Radar (SAR) Technology Advance and for Cultural Heritage Applications)
Abstract
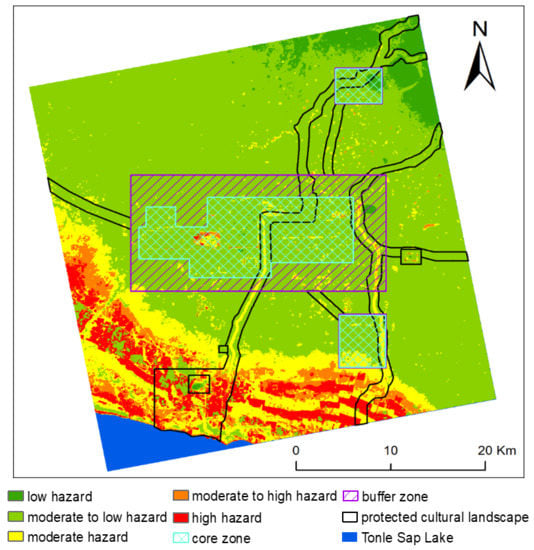
:World Heritage sites in general are exposed to the impacts of natural hazards, which threaten their integrity and may compromise their value. Floods are a severe threat to the Angkor World Heritage site. Studies of regional floods and flood hazard zoning have played an increasingly important role in ensuring sustainability of the Angkor site. This study developed a flood hazard index (FHI) model based on a geographic information system (GIS) and used synthetic aperture radar (SAR) data to extract historical floods at Angkor from 2007 to 2013. Four indices (flood affected frequency, absolute elevation, elevation standard deviation, drainage density) were used to identify flood-prone areas. The Analytic Hierarchy Process (AHP) and the Delphi method were employed to determine the weight of each index. The weighted indices were then used to develop a distribution map of flood hazards at Angkor. The results show that 9 monuments are at risk by potential floods among the 52 components of the Angkor monuments. The high hazard and moderate-to-high hazard areas in the core zone are mainly located surrounding the West Baray but will not bring direct risk impact on the monuments located in the core archaeological zone. The moderate hazard areas are located on both sides of the Siem Reap and Roluos rivers and in the flooded area of the Tonle Sap Lake in the core archaeological zone. These areas cover 19.4 km2, accounting for 9.13% of the total area of the core zone. This moderate hazard zone poses a greater flood threat to the core zone and must be given higher attention. The buffer zone is a small area with fewer sites. As such, flooding has a low impact on the buffer zone. The methods used in this study can be applied to flood hazard assessments of other heritage sites in Southeast Asia.
1. Introduction
The protection and conservation of the natural and cultural heritages are a significant contribution to sustainable development [1]. However, cultural heritage sites are threatened by various human factors or natural disasters [2]. Among these disasters, floods have an adverse impact on heritage sites. Flood-risk management is a serious challenge facing many heritage sites today [3,4,5]. This challenge will further expand with urbanization, climate change, population growth and economic growth [6]. Flood hazard assessment is the crucial first step towards effective flood-risk management and constitutes the basis for taking preventive conservation measures for risk mitigation, thus contributing to the sustainable development of World Heritage sites [7,8].
Angkor is one of the symbols of the Cambodian nation and Khmer culture. At this site, there are many amazing temples, ruins and stratified remains of cities and settlements from the 9th to the 15th centuries. In 1992, the United Nations Educational Scientific and Culture Organization (UNESCO) listed the Angkor monuments as a World Cultural Heritage site. For over more than a hundred years, experts and scholars from all over the world have invested extensive manpower and material resources in Angkor maintenance projects to protect this World Heritage site. In 1995, Jonathan Wager, the leader of the Zoning and Environmental Management Plan (ZEMP) project team, developed the sustainable development strategy for the Angkor region, pointing out that tourism is an important economic pillar of Angkor and the need to balance the relationship between tourism development and protection of Angkor monuments is an important guarantee for the sustainable development of the Angkor region. After discussions, the ZEMP project team formulated a zoning plan conducive to the sustainable development of natural and cultural resources in the Angkor region. The plan aimed to maintain the balance between tourism development and the protection of historical remains [9]. In the context of Angkor preservation goals, sustainable development requires integration of the conservation practices of these sites with the sustainable use and management of natural resources in the broader landscape surroundings of the World Heritage site. The APSARA National Authority, responsible for the protection and management of the Angkor region, has integrated site conservation into sustainable use of water, forests and so forth.
The water distribution network of Angkor, covering over 1000 km2, was made up of hundreds of excavated canals and embankments, temple moats, reservoirs, natural river channels and other features, which provided both irrigation and flood defense [10]. Flooding is a frequent recurring problem in Siem Reap River Basin which comprises the area of Pourk river, Siem Reap river and Rolous river network. In the year of 2009, 2010 and 2011, Angkor got affected with frequent flooding. In 2011, Angkor and Siem Reap experienced the worst flood in fifty years. Minimizing flood-threat is the primary concern of APSARA during the wet season. Now, the Angkorean hydraulics has been assigned a central role for the conservation of Angkor World Heritage site and the sustainable development of the Siem Reap province [10]. Regarding the Angkor’s hydraulic network, Kummu [11] studied natural and artificial water systems, analyzed the influence and role of these water systems and proposed the establishment of water management levels and water management areas, providing a theoretical basis for water management. Chen et al. [12] used Interferometric synthetic aperture radar (InSAR) to conduct research covering approximately 400 km2 on the Angkor site and to analyze the impacts of groundwater level and temperature changes on the stability of the site. The results showed that from 2011 to 2013 the extraction of groundwater by residents and tourism development did not threaten the stability of the site but that seasonal changes in groundwater level and the thermodynamics of stone materials may trigger or exacerbate the chemical weathering and biogenic alteration of temple materials. In addition, Chen et al. [13] used the SAR data collected from 2011 to 2013 to extract data related to past floods in the Angkor region. After analyzing the correlation between floods and precipitation, they found that the changes in flood water volume were not closely related to precipitation. Recently, Penny et al. [14] used a model to reveal unstable behavior in which extensive and cascading damage to infrastructure occurs in response to flooding within Angkor’s urban water management system. The results showed that due to large floods would have been channeled into just a few major pathways, the likelihood and extent of the cascading failure abruptly grow with the magnitude of flooding relative to normal flows in the system.
Many experts and scholars have made relevant studies on the protection and development of Angkor and some experts tried to explore the major factors, including drought and flooding, which might contribute to the demise of Angkor in the late 14th and early 15th Centuries. However, few studies have been conducted on the flood hazard mapping and assessment in the Angkor region. Therefore, strengthening flood management, especially flood hazard assessment, is of great significance for Angkor in terms of disaster prevention and mitigation and the protection of Angkor monuments. Cigna et al. [15] did offer us a new insight to analyze the susceptibility to groundwater flooding in heritage sites based on the geological survey dataset. In this study, we only focus on the hazard assessment of fluvial flooding in Angkor using SAR data. The impact of groundwater flooding in Angkor was not discussed in this research due to lack of hydrogeological properties and groundwater information. At present, there are two main methods for fluvial flood risk assessment, namely flood risk assessment based on a hydrodynamic model [16,17,18,19] and flood risk assessment based on the multi-criteria system [20,21,22,23]. The hydrodynamic model, which is based on hydrology and hydraulics, combines theory from related disciplines to carry out a physical simulation of all aspects of a flood disaster. This model facilitates simulation of the flood formation process and takes into account the role of an artificial flood control system in the flood risk assessment. These models also provide an important technical means for flood risk assessment and decision-making and command of flood control. However, hydrodynamic models have high data requirements and complicated calculations, limiting their use and application [24]. On the other hand, flood risk assessment based on a multi-criteria system uses the flood formation mechanism to select a series of indices that can reflect flood characteristics, natural environmental features and socio-economic attributes and constructs a model for regional flood risk assessment. The method is relatively comprehensive and simple. As such, it can be used for the comprehensive assessment of flood risk and to assess flood hazards and vulnerability separately. However, the multi-criteria method is subjective in terms of index selection and weight assignment. Therefore, the assessment results are difficult to verify. It is also difficult to take into account the impact of flood control projects on flood risk assessment using this method.
In this study, we use an evaluation method based on the multi-index system to assess flood hazards in the Angkor region. There are many relevant studies [23,25,26,27,28], that have utilized index selection method for evaluating flood hazards. In these studies, the indices selected for flood risk assessment include storm intensity, elevation, slope, land use, flood affected frequency, drainage density and the standard deviation of elevation. Kazakis [23] and Dou [25] only considered meteorological and geomorphological parameters in their flood risk assessment. However, these two parameters usually do not describe the characteristics of flood disasters directly. Islam and Sado [26,27] used Advanced Very High Resolution Radiometer (AVHRR) optical images to extract flood water bodies in Bangladesh in 1988 and assessed the flood risk for Bangladesh using meteorological and geomorphological parameters. However, Angkor, is located in Southeast Asia and generally has relatively thick cloud cover during flood seasons [29], rendering optical observation useless. Unlike optical instruments, observations of earth surface by SAR instruments are not hindered by cloud cover. This study, therefore, utilized several years of historical SAR data to extract records of historical floods in the Angkor region to calculate the flood affected frequency. The flood affected frequency is defined in this study as the number of times that a location is flooded from 2007 to 2013. Additionally, based on the existing literature and the characteristics of Angkor, the study selected absolute elevation, the standard deviation of the elevation and drainage density as indices to assess the flood hazard. Meteorological parameters were not selected as indices as Chen et al. [13] has already established a low correlation between rainfall and flooding in the Angkor region. The AHP [23,24,30,31] and the Delphi method [32,33] were applied to determine the weight of the four indices. Hadjimitsis et al. [31] used the AHP to compare the different factors and their relative importance in assessing natural and anthropogenic risk for culture heritage in Cyprus. Song et al. [33] used the AHP and Delphi method to set up the evaluation indicator system of conservation of modern architectural heritage and calculate the weight of evaluation indicators. We employ the above four indices to establish a flood hazard assessment model for the Angkor region based on the Flood Hazard Index (FHI) used by Kazakis et al. [23] and Dou et al. [25]. The FHI model is an effective method for obtaining overall assessment results for flooded areas [23]. The results of the model can provide more visual information for flood assessment and management [34].
The main purpose of this study is to identify the flood-prone areas of Angkor by using the multi-index evaluation system and the FHI model, so as to provide for disaster mitigation measures that can be taken in a timely way in case of danger.
2. Study Area
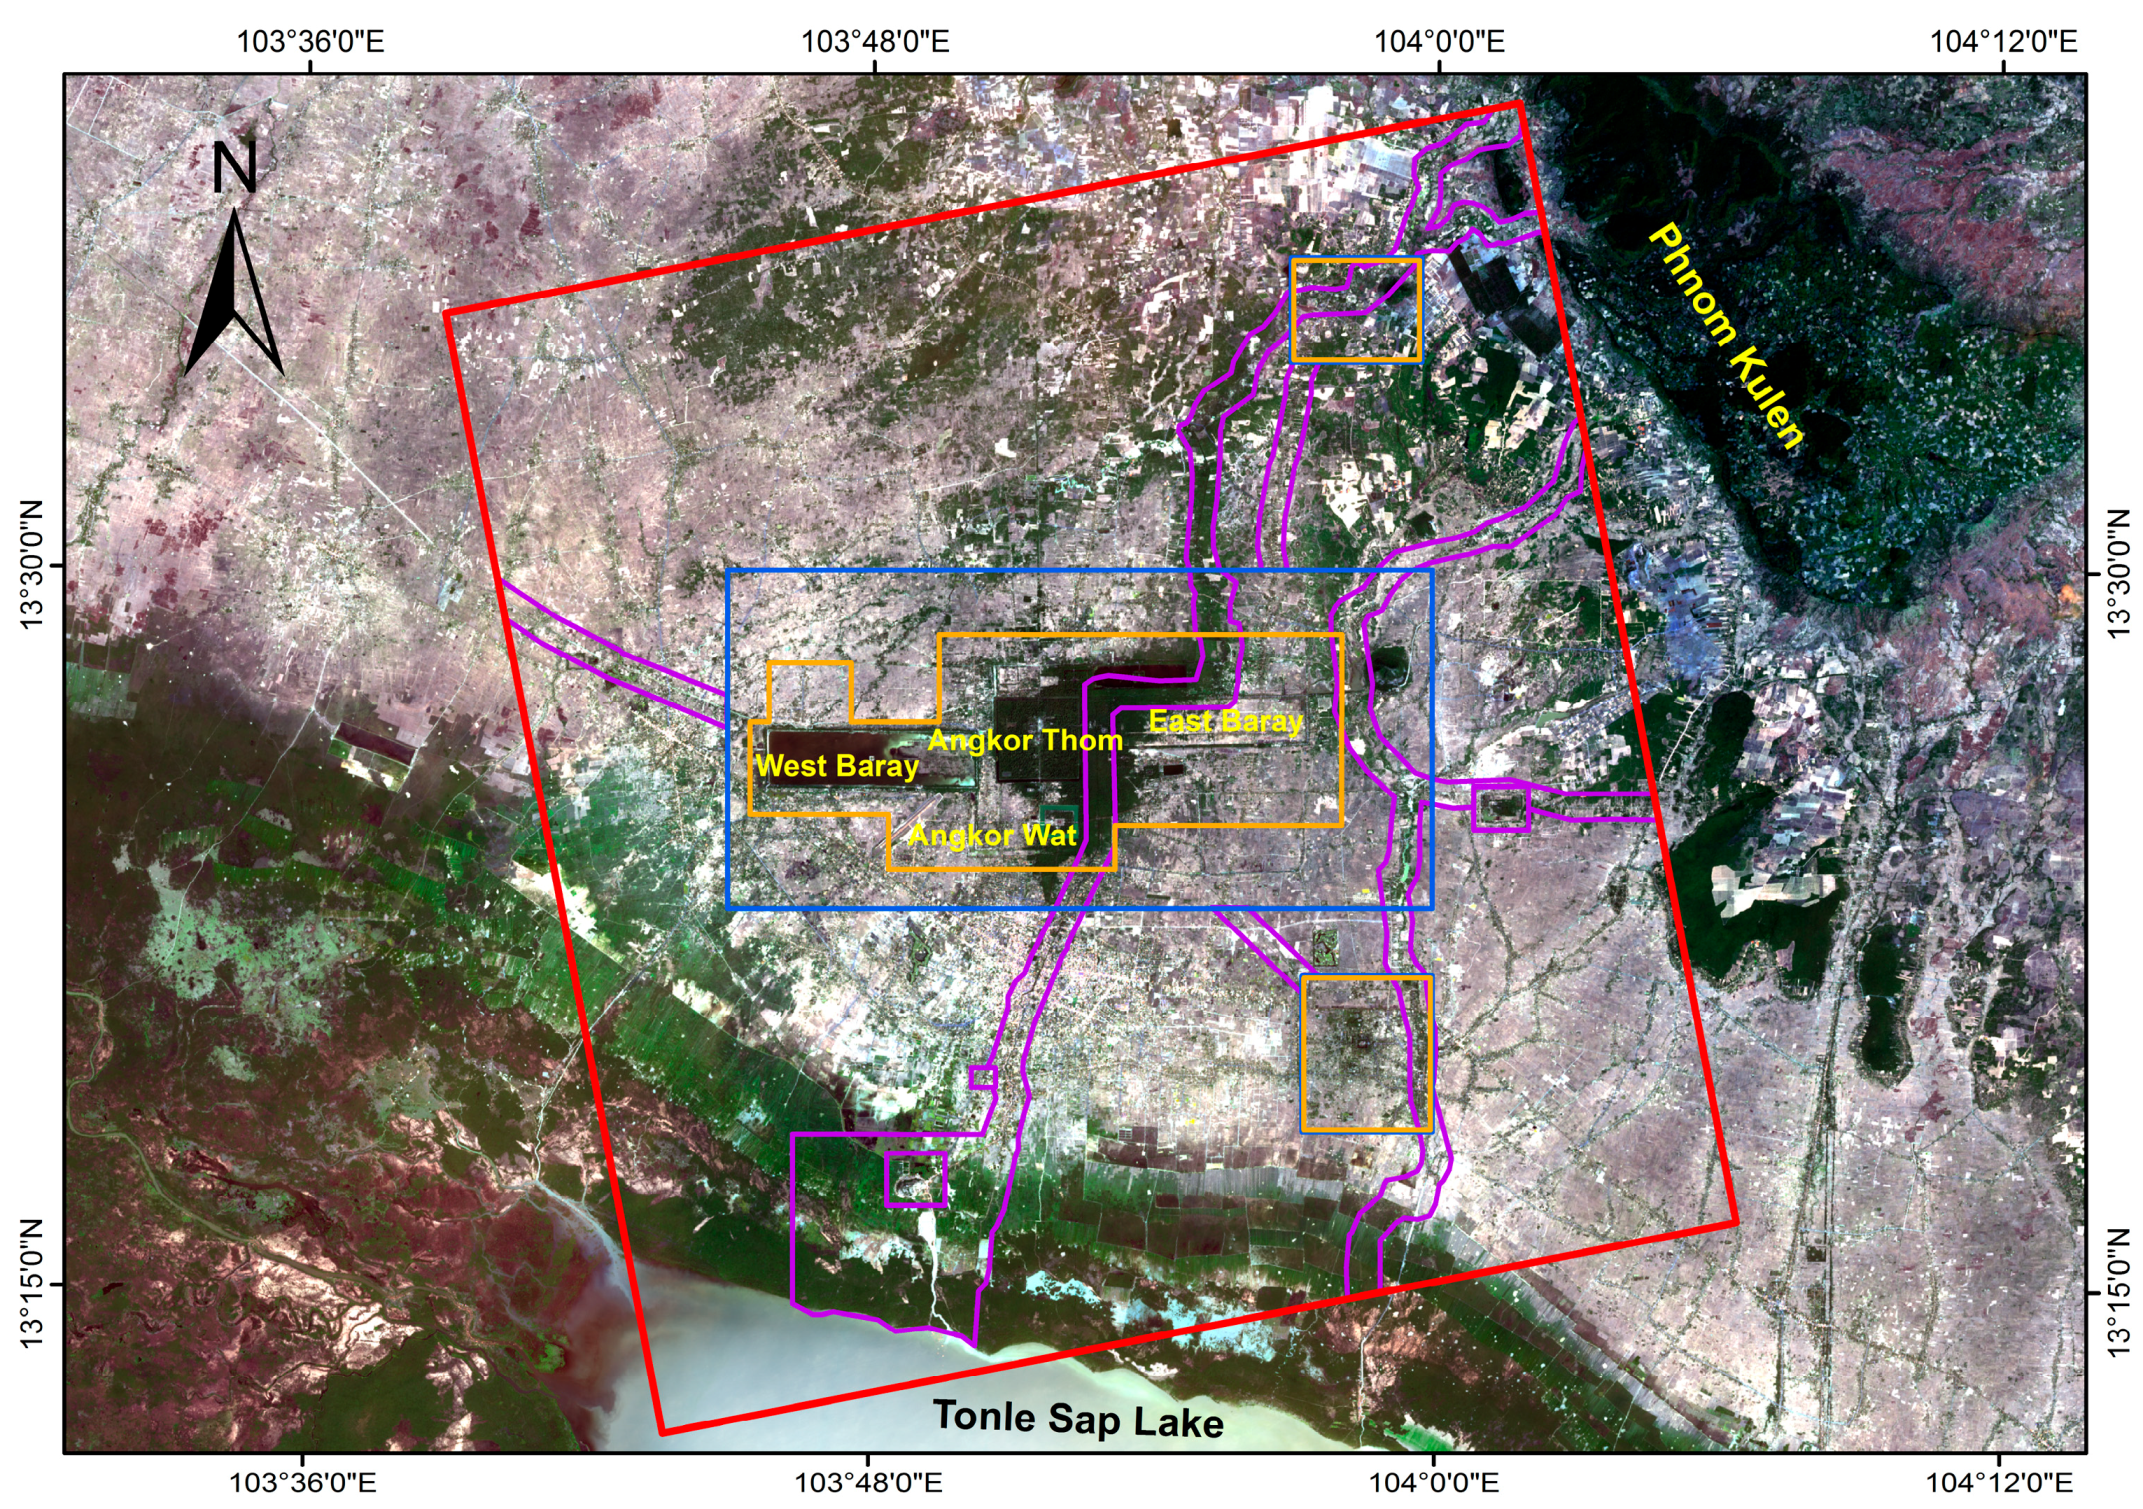
Angkor is located in Siem Reap city, Cambodia between the geographic coordinates, 103°22′E–104°15′E and 13°05′N–13°44′N. Figure 1 shows the geographic location of the study area, which covers areas of 1800 km2. Angkor has a typical tropical monsoon climate, with an annual average temperature ranging from 29 °C to 30 °C. Affected by the terrain and monsoon, there is a large variation in precipitation with time and with geographic location. Generally speaking, the rainy season at Angkor lasts from May to November while the dry season lasts from December to April [35]. The average annual rainfall is around 1320 mm, 88% of which is concentrated between May and October [36]. To the south of Angkor is the Tonle Sap Lake. Angkor is located on the plain between the Tonle Sap Lake and the Kulen Mountains. The area is relatively flat, with elevation ranging from 3 m to 60 m above the mean sea surface. The Kulen Mountains are located to the northeast of Angkor and have an altitude ranging from 300 m to 400 m [37]. The complicated water system at Angkor and the interlaced distribution of natural and artificial water systems have played an important role in Angkor’s ecological environment. The Tonle Sap Lake is the largest freshwater lake in Southeast Asia. During dry seasons, water flows from the Tonle Sap Lake into the Mekong River. The lake is about 150 km long and 30 km wide, with an area varying from 2700 km2 to 3000 km2 and an average water depth reaching 1 m. During rainy seasons, the rainfall and the backward flow from the Mekong River to the Tonle Sap Lake have resulted in the rapid expansion of the lake, with the lake reaching a maximum area of 10,000 km2 and an average water depth of about 12 m. The floodplain of the lake is composed of mangrove wetlands and paddy fields. The Tonle Sap Lake has important economic, ecological, social and cultural value [38]. There are three main rivers, namely the Pourk River, the Siem Reap River and the Roluos River. The sources of the Pourk River and the Roluos River are in the Kulen Mountains and they eventually flow into the Tonle Sap Lake. In order to store water and build a city moat, the people of Angkor built a large number of artificial channels diverting river water into the moat and four giant barays including the West Baray, the East Baray, the Indratataka and the Jayatataka. The construction of these artificial channels and barays has played a powerful role in the management and use of flood waters in the Angkor region. During rainy seasons, the flood waters are diverted and stored in these barays. During dry seasons, the stored water was used for agricultural irrigation and to maintain a continuous supply to the temple complex [39]. In order to protect and maintain the sustainable development of the Angkor monuments, the ZEMP project team held discussions with Cambodian and international experts with diverse expertise to formulate 10 principles for sustainable development in the Angkor region. According to these principles, the Angkor area is divided into multiple zones, including monumental sites (core zone), protected archaeological reserves (buffer zone) and protected cultural landscapes (along rivers). Among them, the core zone has an area of approximately 208 km2 covering most of the Angkor region’s monuments, attracting a large number of visitors every year. This is the most important area for protection and management of monuments in the Angkor region. The buffer zone has abundant archaeological resources, covering approximately 193 km2. It was designated in order to protect these resources from damage due to land use and the impacts of over-exploitation. As the buffer zone surrounds the core zone, protecting it ensures the protection of the core zone. The protected cultural landscape area was designated to protect the ecological integrity of the Angkor region. The area is built along major rivers and embankments [9]. This study is mainly concerned with the impact of floods on the Angkor monuments in the core and buffer zones.
3. Data and Methodology
3.1. Data Used
This study made use of the following data: five Phased Array type L-band Synthetic Aperture Radar (PALSAR) scenes from 2007 to 2010 provided by Japan Aerospace Exploration Agency (JAXA) and three Constellation of small Satellites for the Mediterranean basin Observation (COSMO-SkyMed) SAR images from 2011 to 2013 provided by e-GEOS. Out of the total eight scenes, seven scenes were acquired during the October/November flood peak period at Angkor. The remaining scene was PALSAR image of Angkor acquired on the February of 2008. This scene was used as a standard for water bodies in Angkor during the pre-disaster period. The PALSAR images were Level-1.1 L-band dual-polarized single-look-complex (SLC) images with a swath width ranging 40 km to 70 km and a resolution of about 20 m × 20 m, we selected HH polarization mode in this study. The three COSMO-SkyMed images consisted of Level-1A X-band SLC data with an observation swath of 40 km and a resolution of 3 m × 3 m. The polarization mode was HH. The SRTM digital elevation model (DEM) data had 30 m × 30 m-resolution and was downloaded from the US-based USGS website. The Angkor drainage network was manually digitized from the high-resolution images. The GIS layers of the Angkor monument sites and the core and buffer zones were provided by the APSARA National Authority.
3.2. Data Processing and Methodology
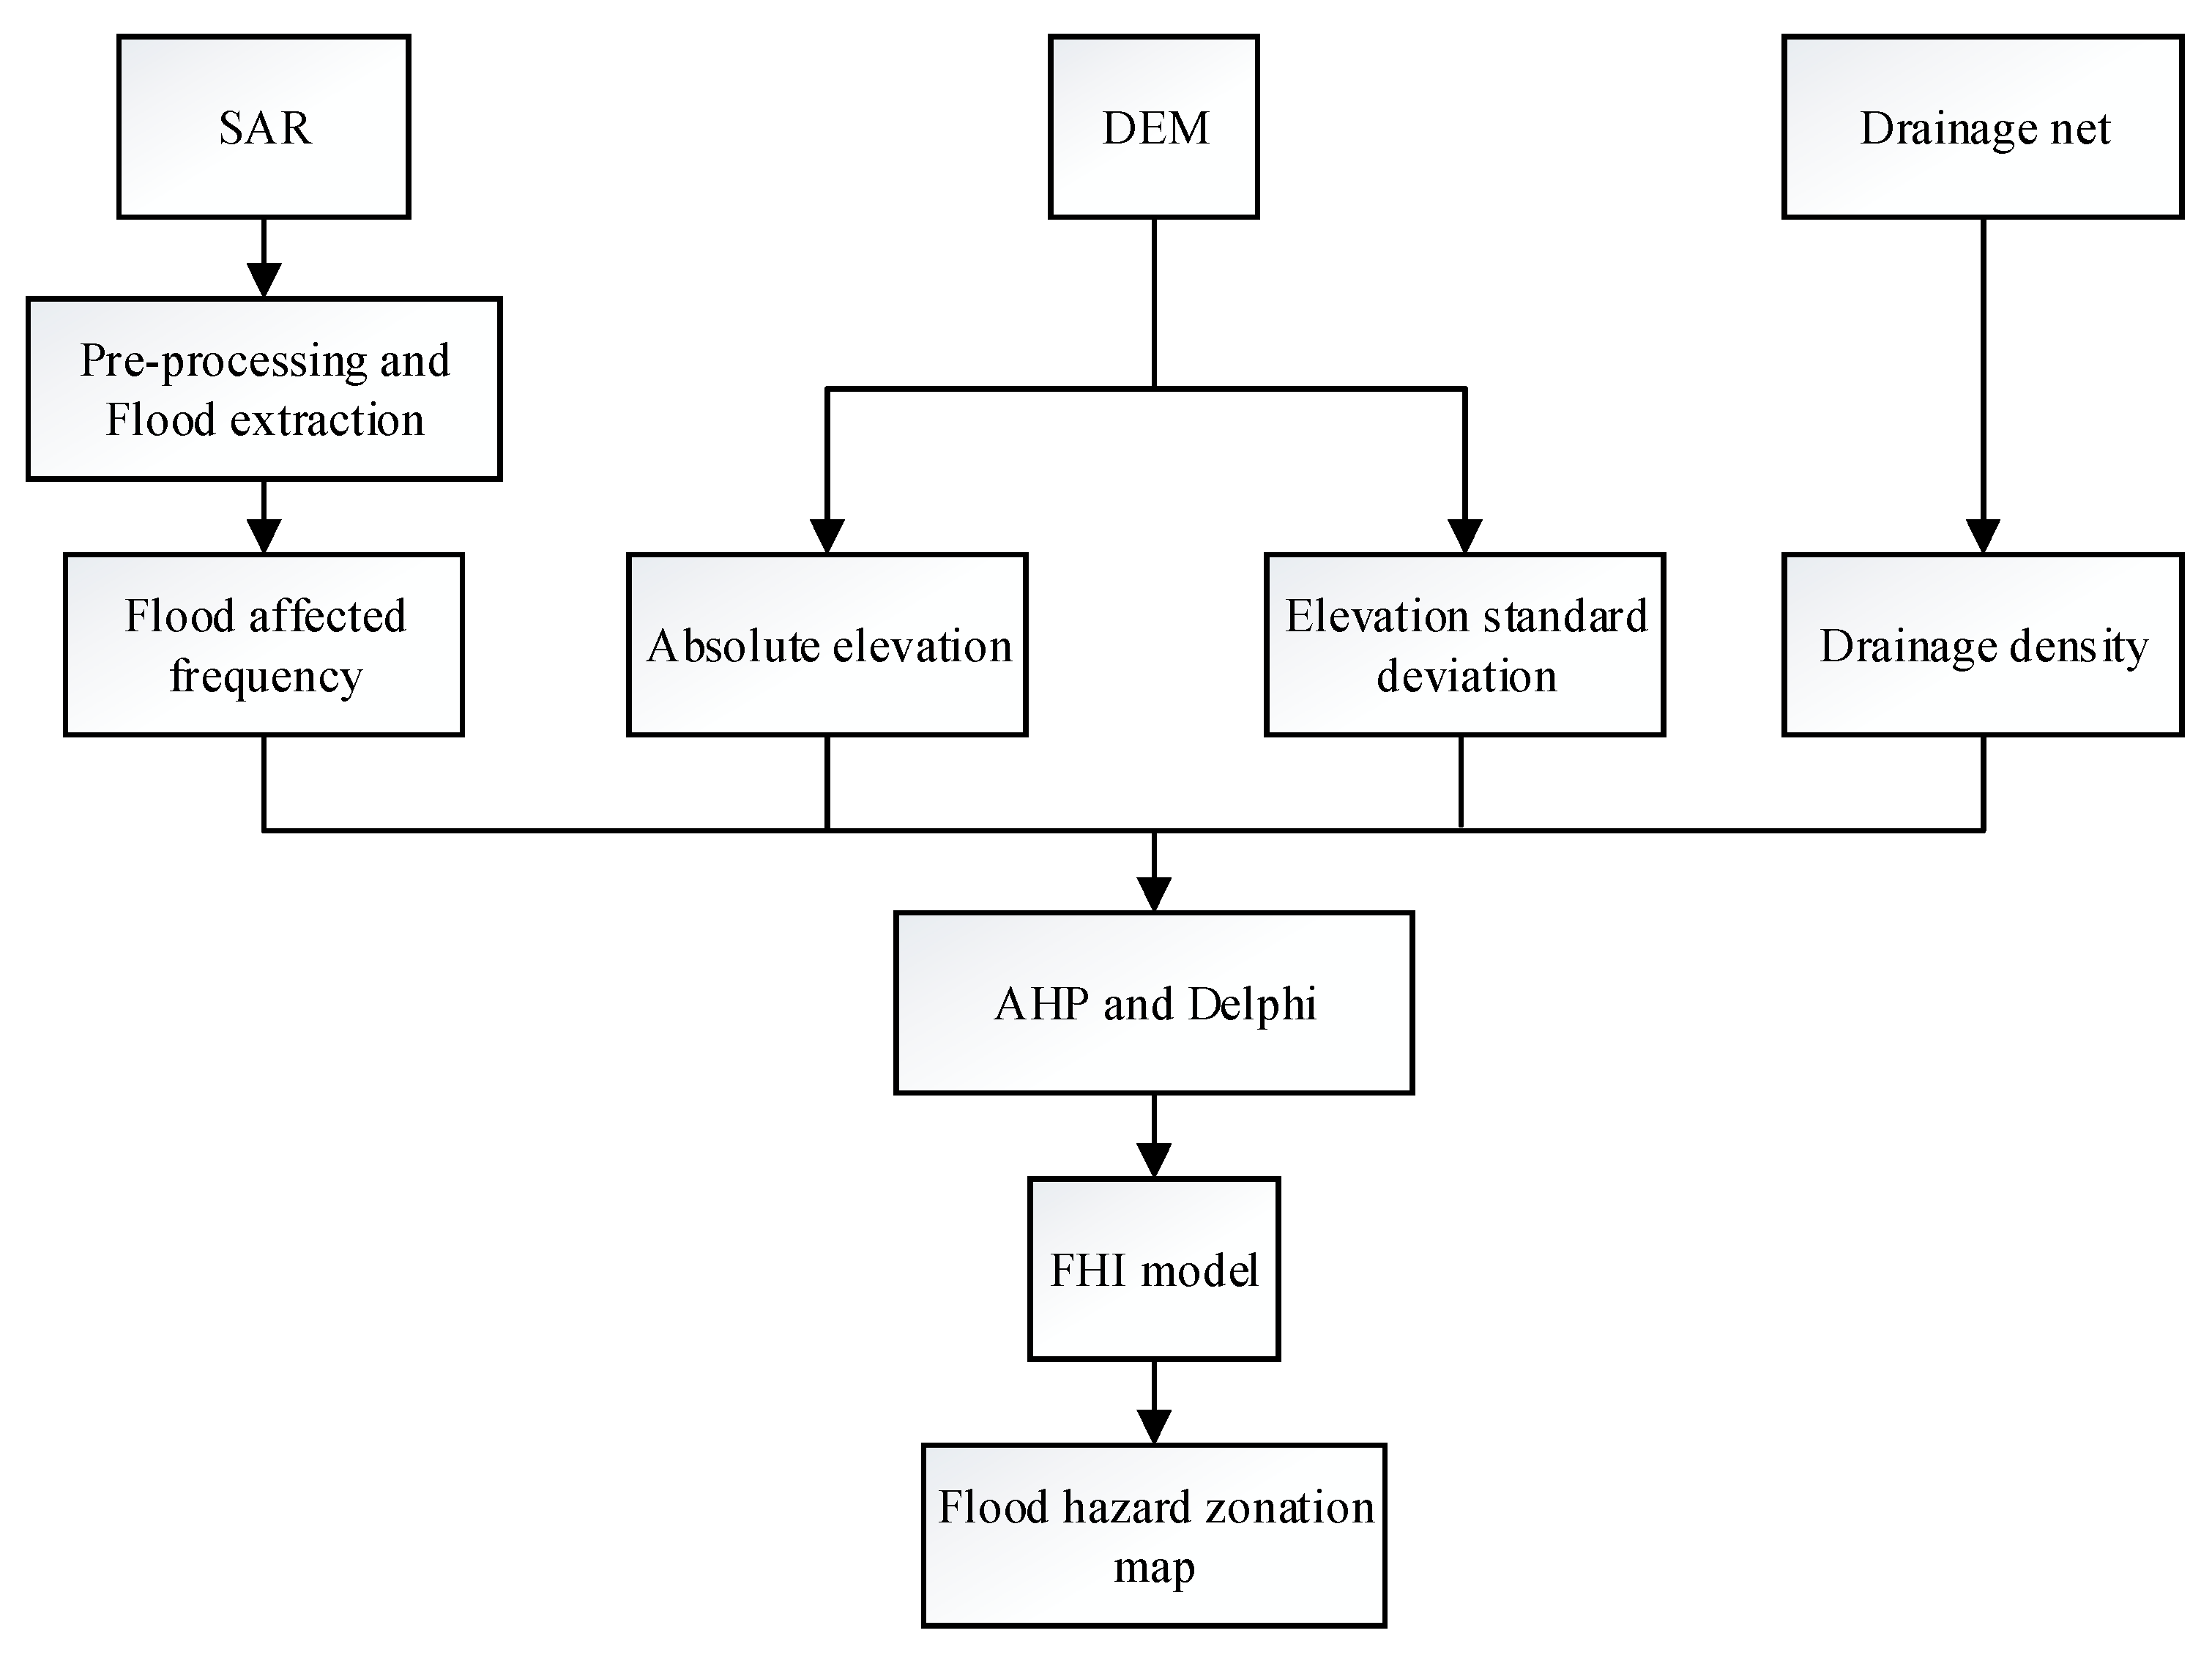
Data processing and methodology was broadly a three step process. Primarily the four indices namely; flood affected frequency, absolute elevation, standard deviation of elevation and drainage density were calculated using SAR, DEM and river network data. Following this, the AHP and the Delphi methods were used to determine the weights of the four indices. Finally, employing the spatial analysis tool set in ArcGIS, FHI model was constructed to develop a zonation map for flood hazard assessment of Angkor. Figure 2 shows a flowchart of the method used in this study.
3.2.1. Calculation of Indices
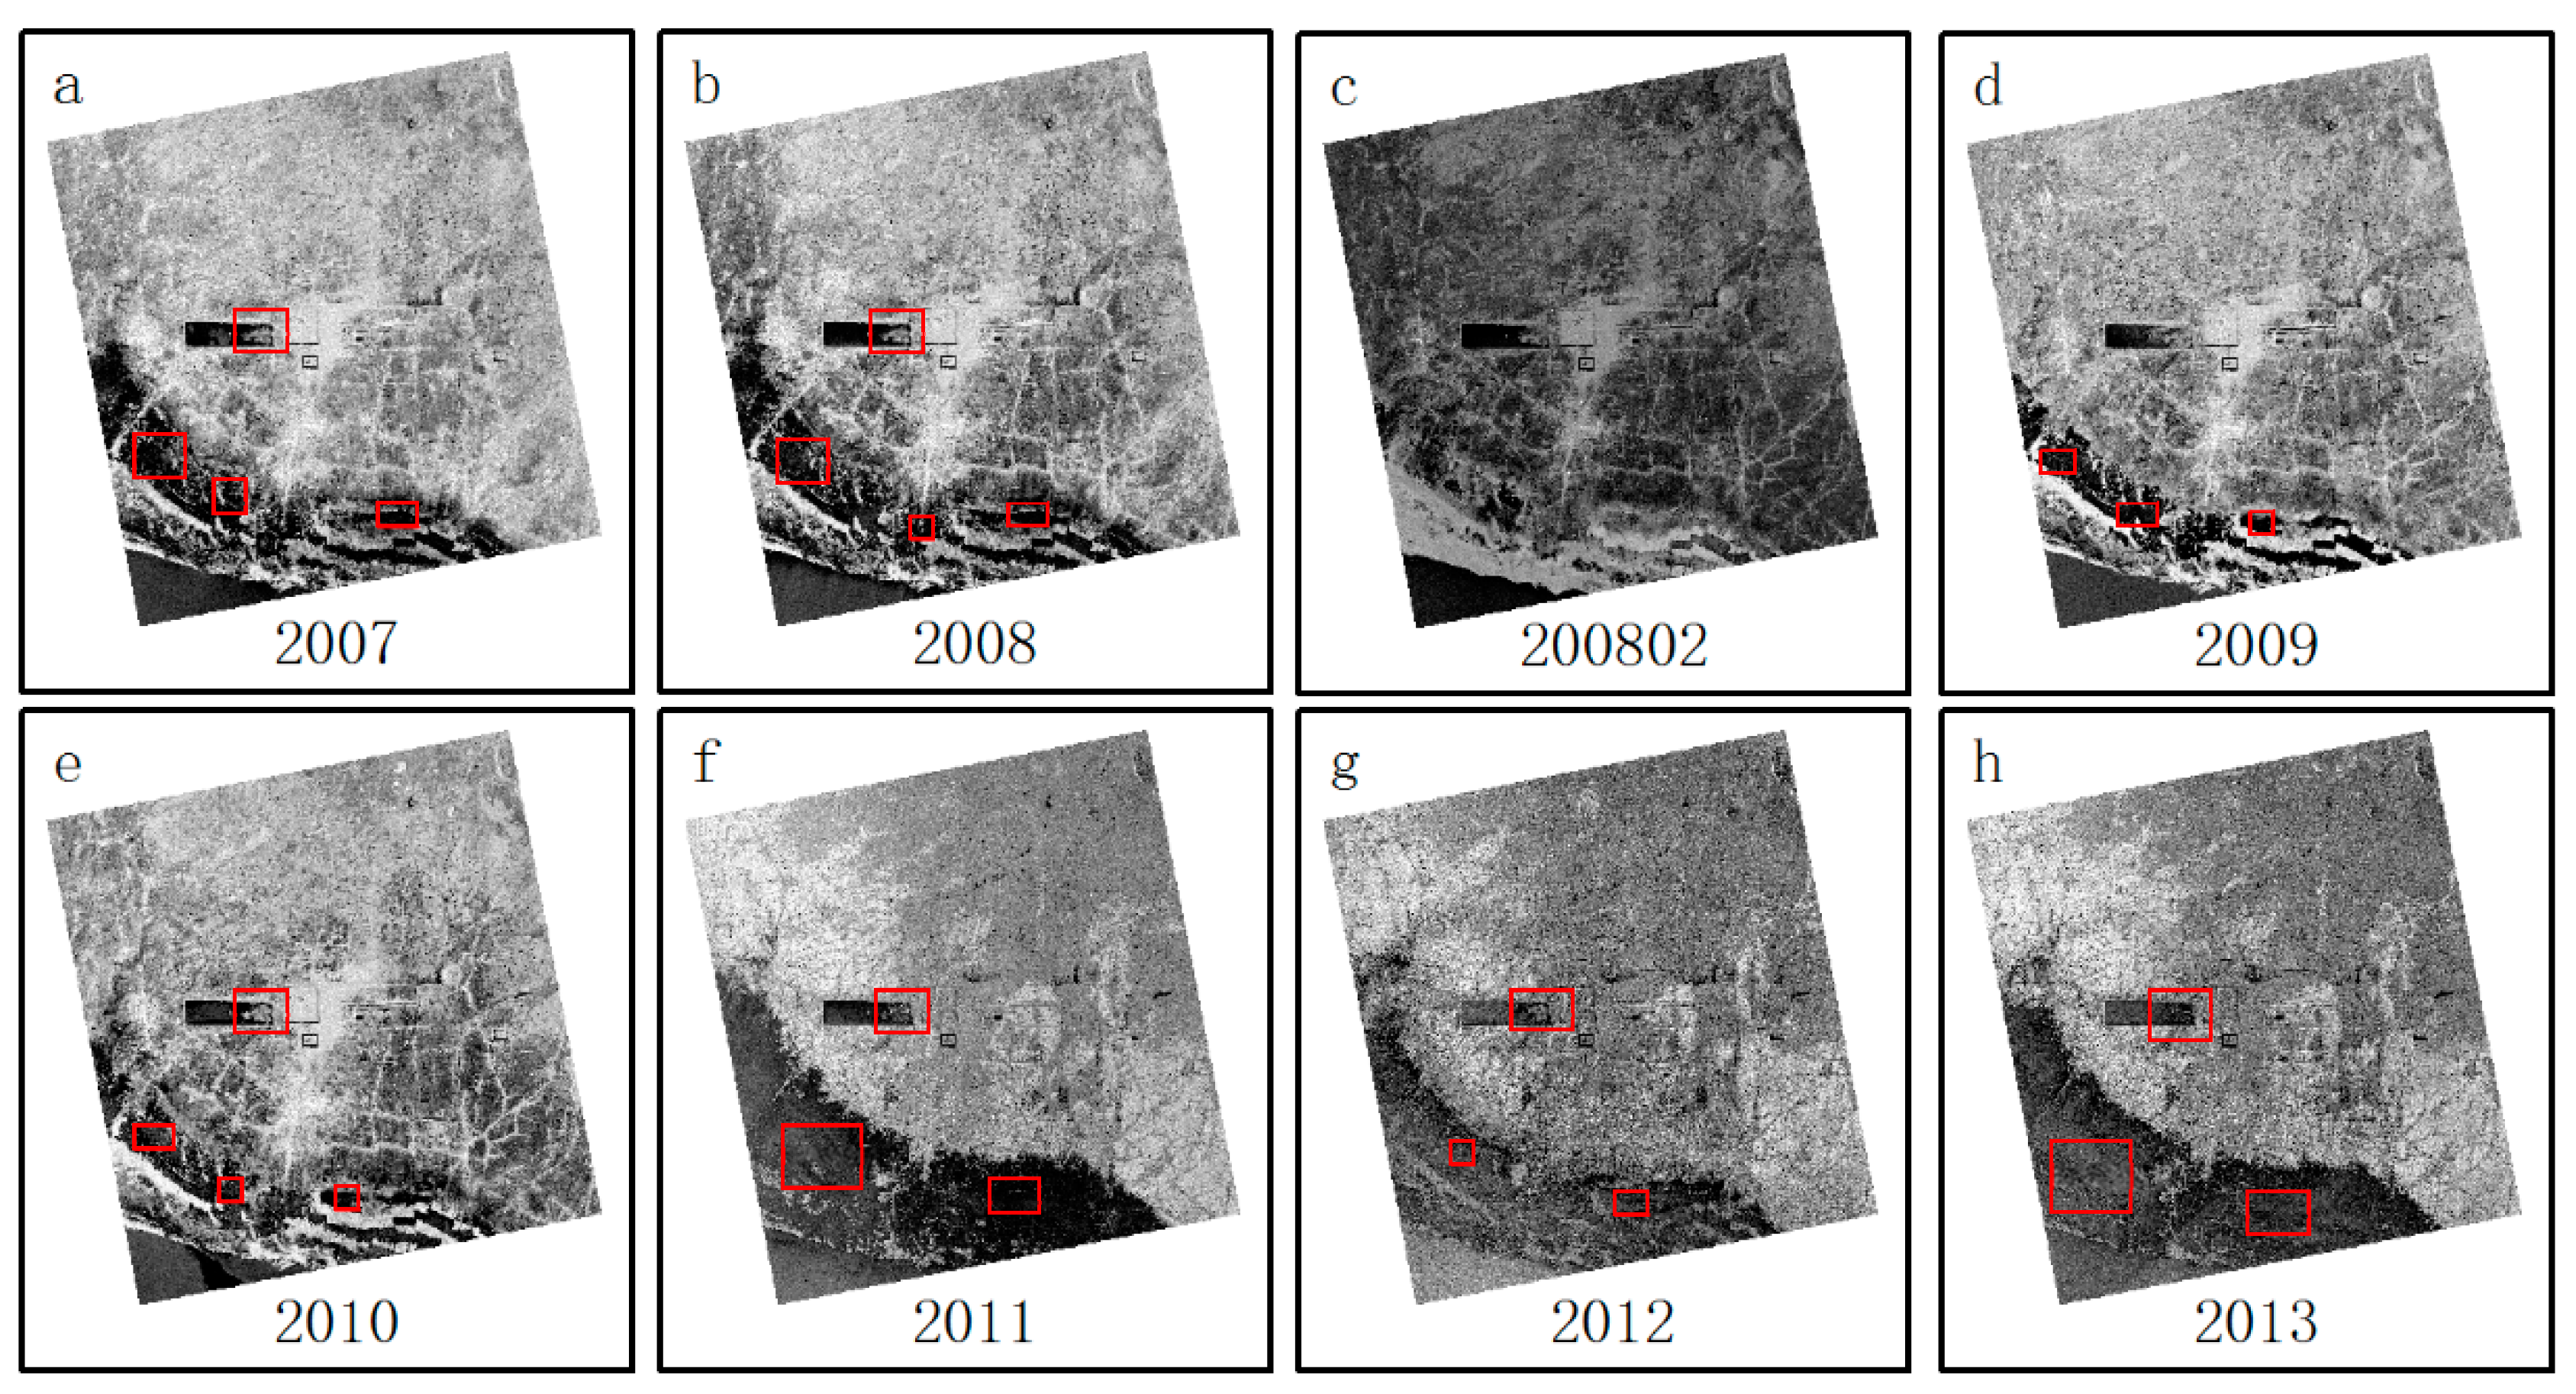
A flood disaster frequency chart is very useful to understand the historical distribution of flood disasters as high flood affected frequency suggests higher flood risks [26,27]. In order to obtain a historical flood affected frequency map for the Angkor region, it was necessary to identify the spatial coverage of water bodies of pre-disaster and flood seasons in Angkor over the years. Subtracting the two would provide the spatial coverage of the flood water. However, prior to extracting water bodies from SAR images, the images were pre-processed. SARscape software was used to pre-process the SAR images. The main pre-processing steps consisted of (1) multi-looking and registration (PALSAR and COSMO-SkyMed were separately registered), (2) filtering, (3) radiometric calibration and (4) geo-coding. The output pixel size of the SAR images was set to be 20 m × 20 m. Following the pre-processing step, there was an offset between the PALSAR and COSMO-SkyMed images. Therefore, we selected multiple pairs of tie points to register the PALSAR data using the COSMO-SkyMed image collected in 2011 as the reference image. Figure 3 shows the processed SAR images. The flood water area presents a single texture feature and a uniform dark area in the SAR images.
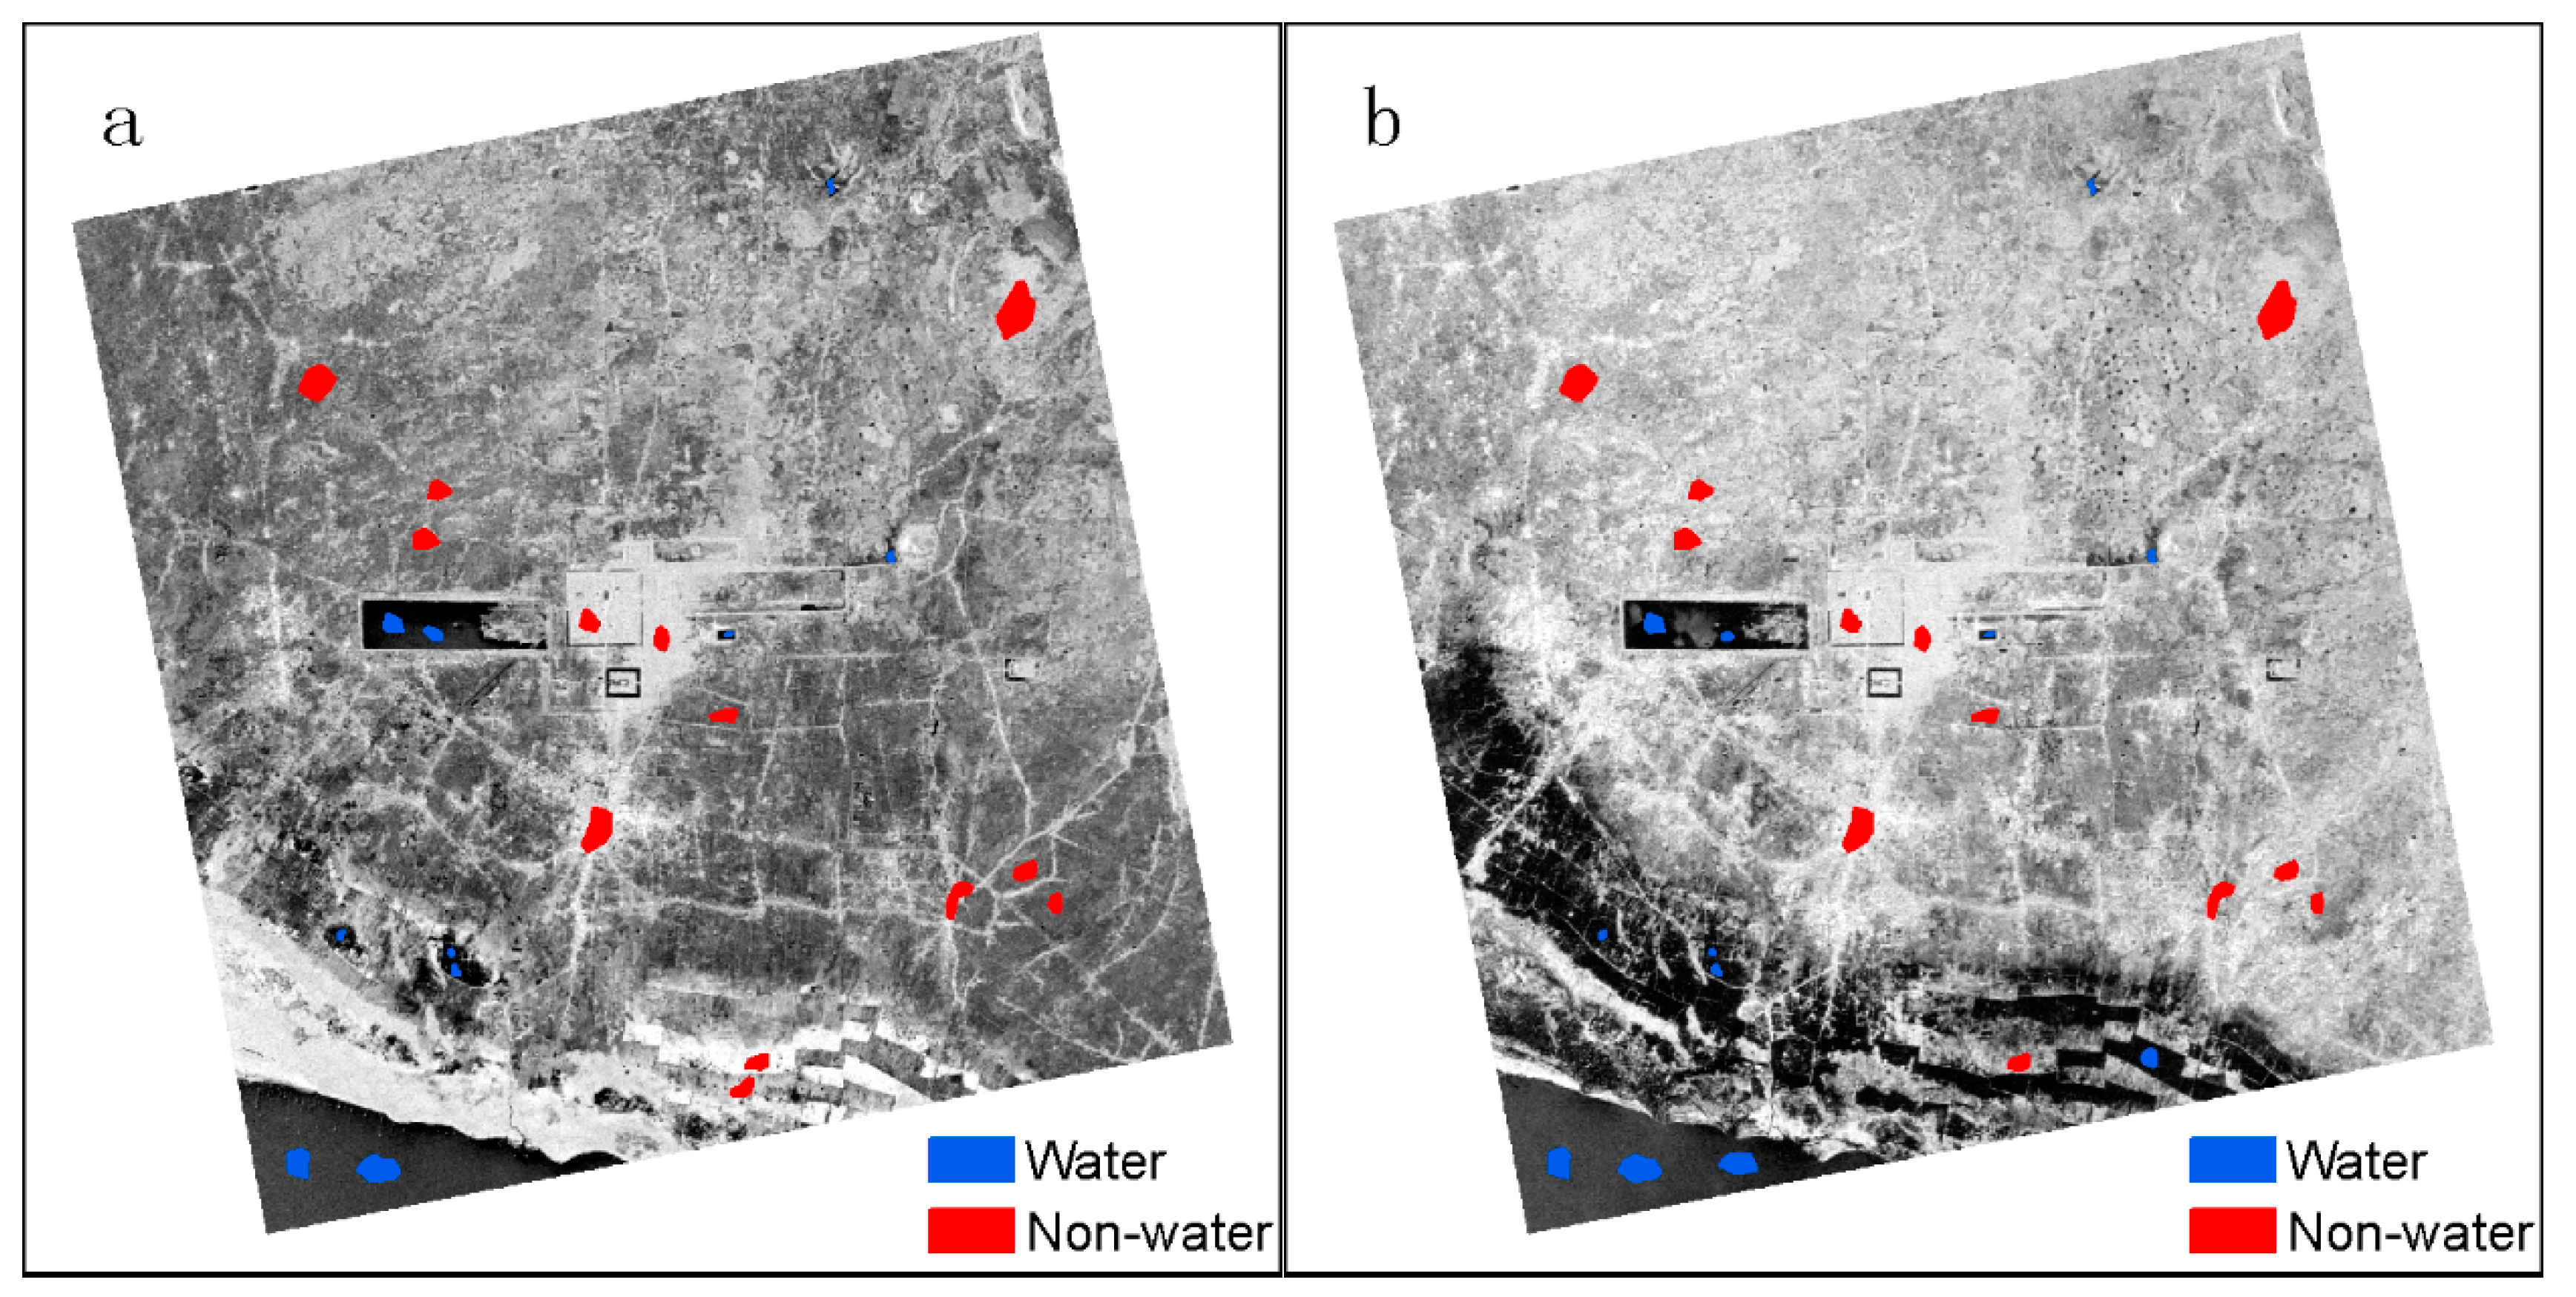
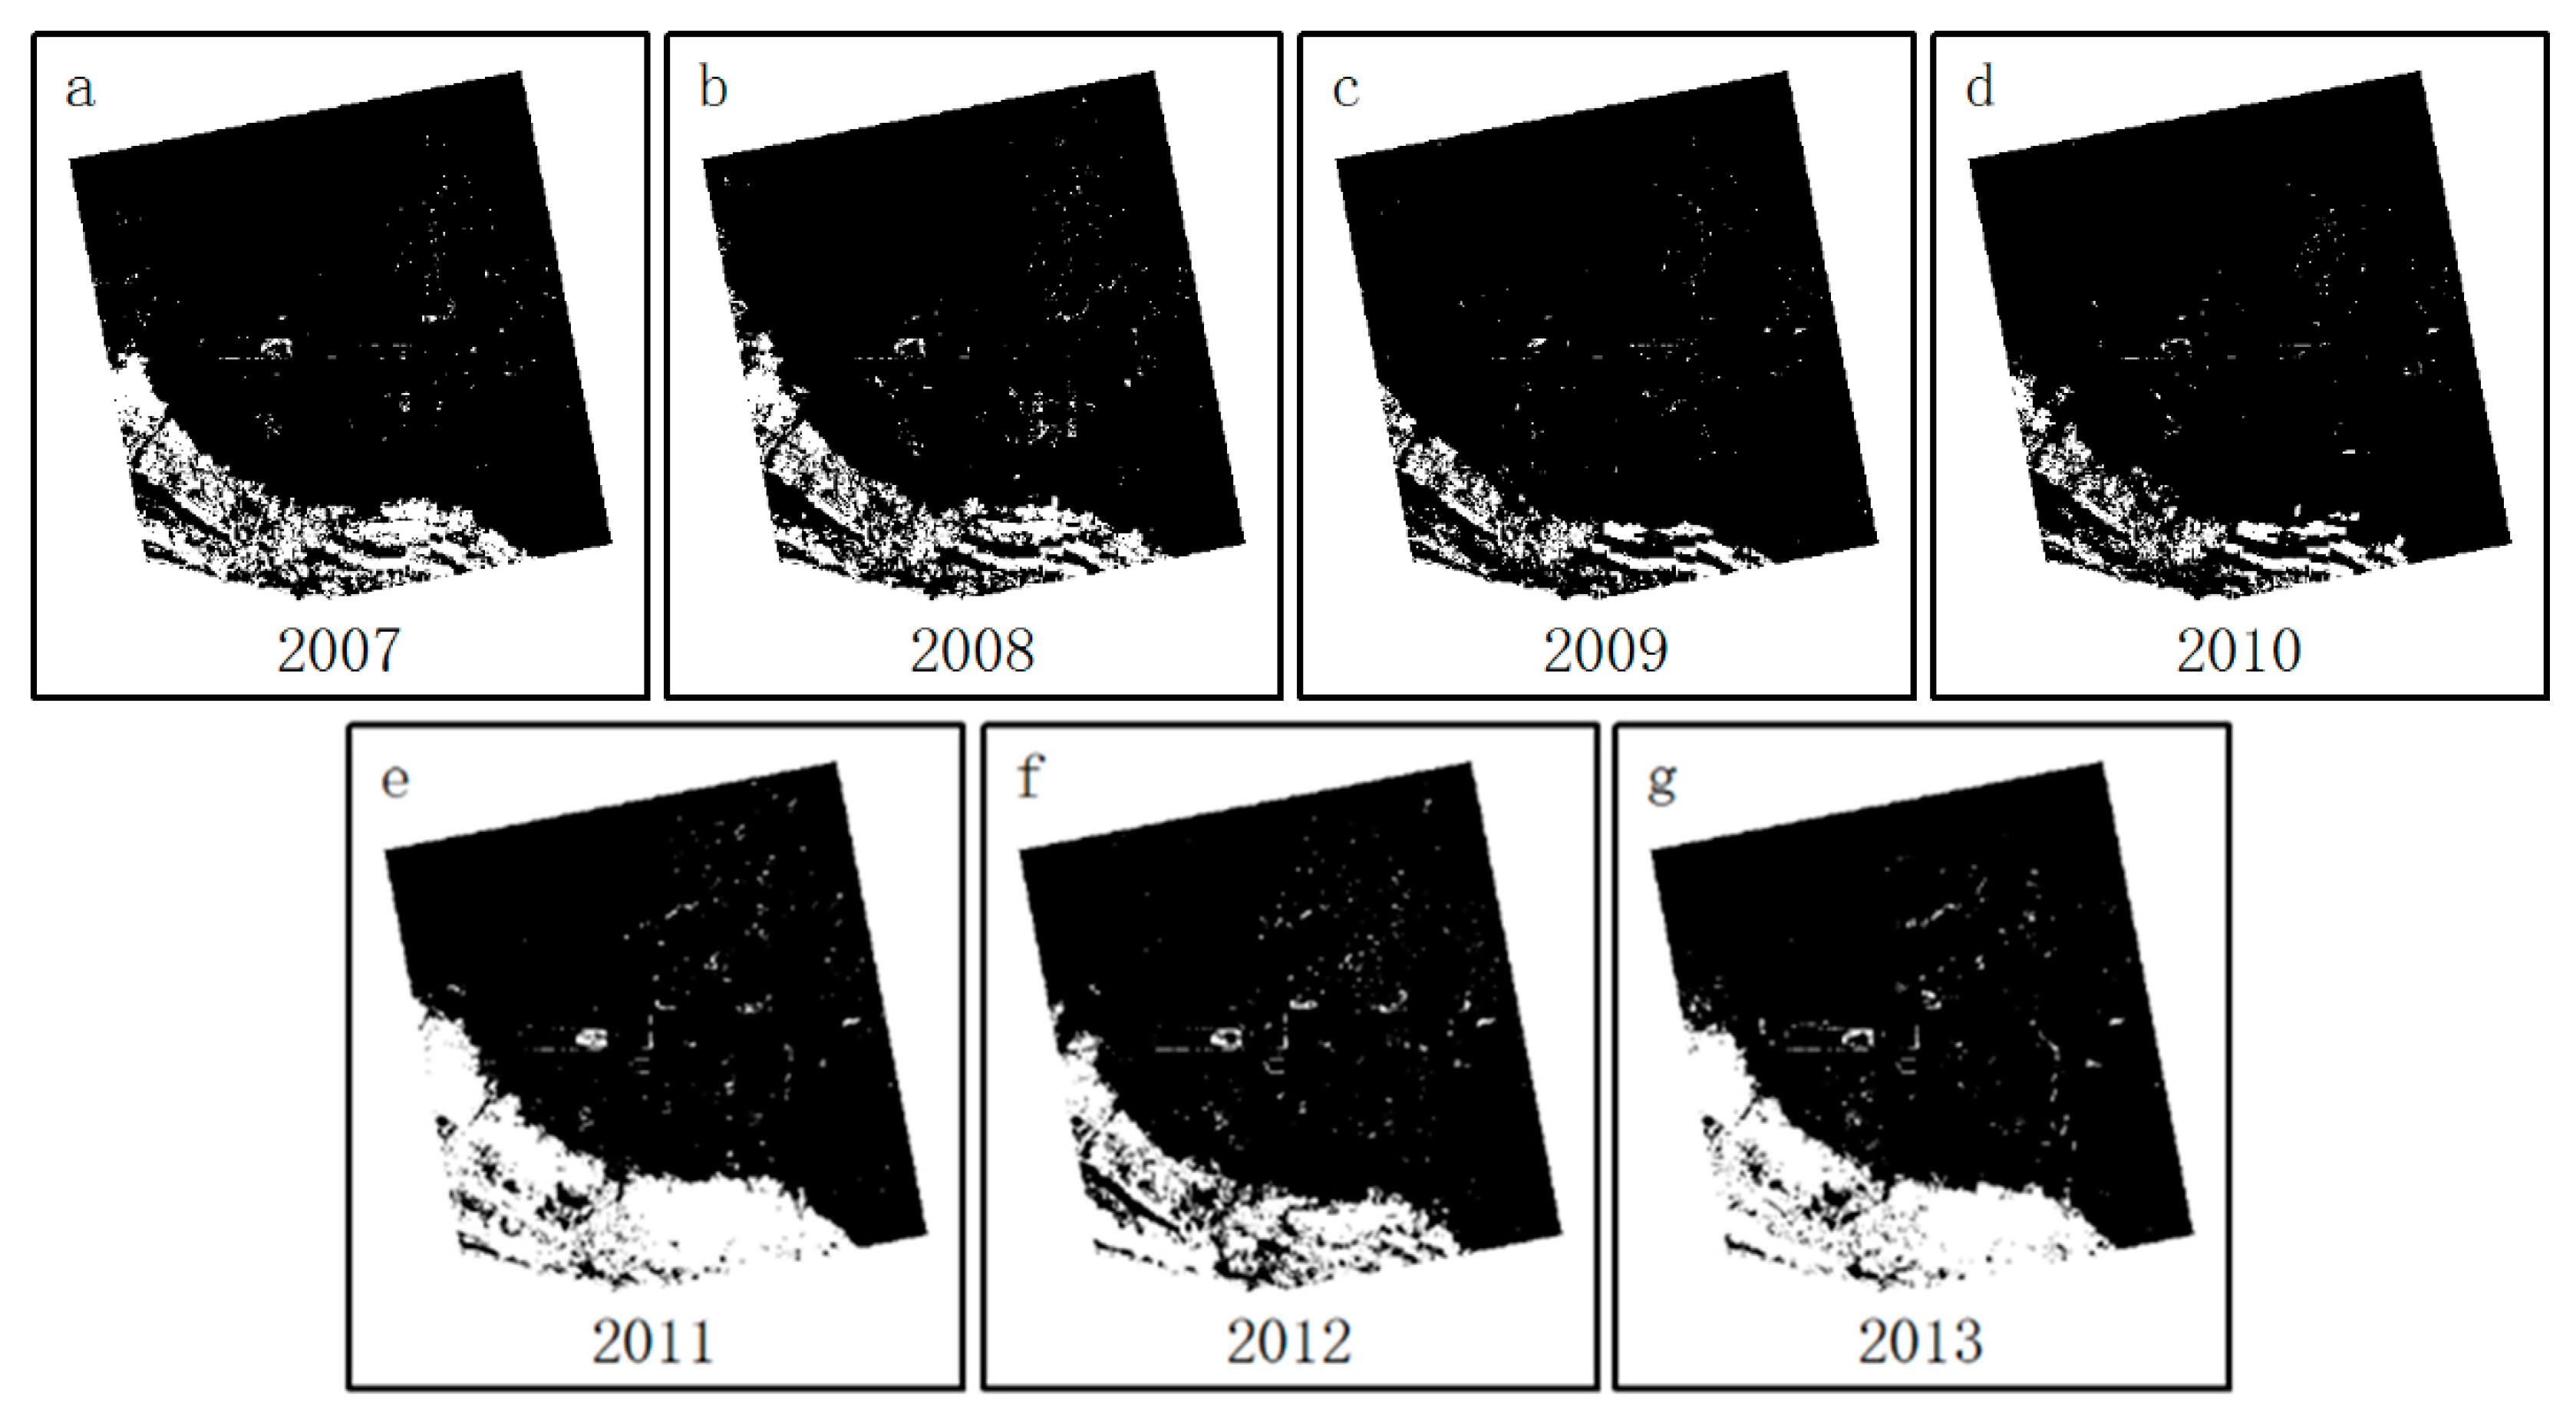
There are two main methods for water body extraction from single-band single-polarized SAR data, namely the threshold segmentation method [40,41] and texture analysis and supervision classification based on the gray level co-occurrence matrix [42,43]. Threshold segmentation divides an image into the target area and non-target area and finds an optimal threshold to distinguish the target area from the non-target area through multiple tests. The method is simple, but, due to the large change in the backscatter coefficient value of water bodies that occurs during floods, it is difficult to find an optimal threshold to extract water bodies. In this study, the texture analysis support vector machine (SVM) classification method based on the gray level co-occurrence matrix was used to extract water bodies [42]. First, we used the Environment for Visualizing Images (ENVI) to analyze the texture of eight pre-processed SAR images to obtain eight bands including the mean, variance, homogeneity, contrast, dissimilarity, entropy, second moment and correlation. After the second moment, mean and entropy were superimposed and training samples were selected to classify eight images using the SVM classifier. To ensure the validity of the classification results, two sets of training samples were selected. One contains water and non-water samples of pre-disaster images acquired in February 2008 and another contains water and non-water samples images during flood seasons. Both training samples of water and non-water are evenly distributed in the study area. The training samples of seven SAR images acquired during flood seasons from 2007 to 2013 were consistent and include training samples of SAR image acquired in February 2008. The selected training sample map is shown in Figure 4. These two sets of training samples were used to classify SAR images during pre-disaster and flood seasons, respectively. Then we got the spatial coverage of water bodies during pre-disaster and flood seasons and the spatial coverage of flood water were generated by subtracting these two. The annual flood water spatial coverage is shown in Figure 5.
Terrain is closely related to flood risk. The two aspects of terrain important for floods are terrain elevation and terrain changes. The lower the terrain elevation, the smaller the terrain change and the higher the probability of flooding. Descriptive terrain changes are usually represented by slopes. However, current GIS software considers the elevation variation of neighboring grids when calculating slopes. In fact, it is the terrain change within a certain range that affects the degree of flood risk, so it is not very reasonable to use the slope as an index of terrain change. ArcGIS can calculate the standard deviation of elevation in a certain neighborhood of a grid. The results of this calculation can better reflect the degree of terrain change [28]. By using ArcGIS to mosaic the DEM of the Angkor region, we were able to obtain an absolute elevation map of Angkor. The mosaicked DEM image was then processed using ArcGIS to obtain the map of the standard deviation of elevation.
The distribution of the drainage network to a certain extent determines the varied extent to which area under observation is vulnerable to floods: the greater the drainage density, the higher the risk. The drainage density is defined as the total length of rivers per unit area [44]. In this study, we used ArcGIS spatial analysis to generate a drainage density map. The influence varies depending on the river ‘level’: the higher the level, the greater the influence. The main water systems of the Angkor region include the Tonle Sap Lake, the Siem Reap River and the Roluos River. Using ArcGIS we gave these rivers a weight of 8 and assigned the other rivers weights of 6, 4 and 2 according to their respective levels and set the grid size to 200 m × 200 m to get the drainage density map of the Angkor region.
Since the Tonle Sap Lake within the study area did not require a flood hazard assessment, it needed to be excluded. The boundary of the Tonle Sap Lake within the study area was manually digitized from the standard SAR image acquired on the February of 2008 by using ArcGIS and a cropped vector file was generated. This was then used to trim the four index charts described above.
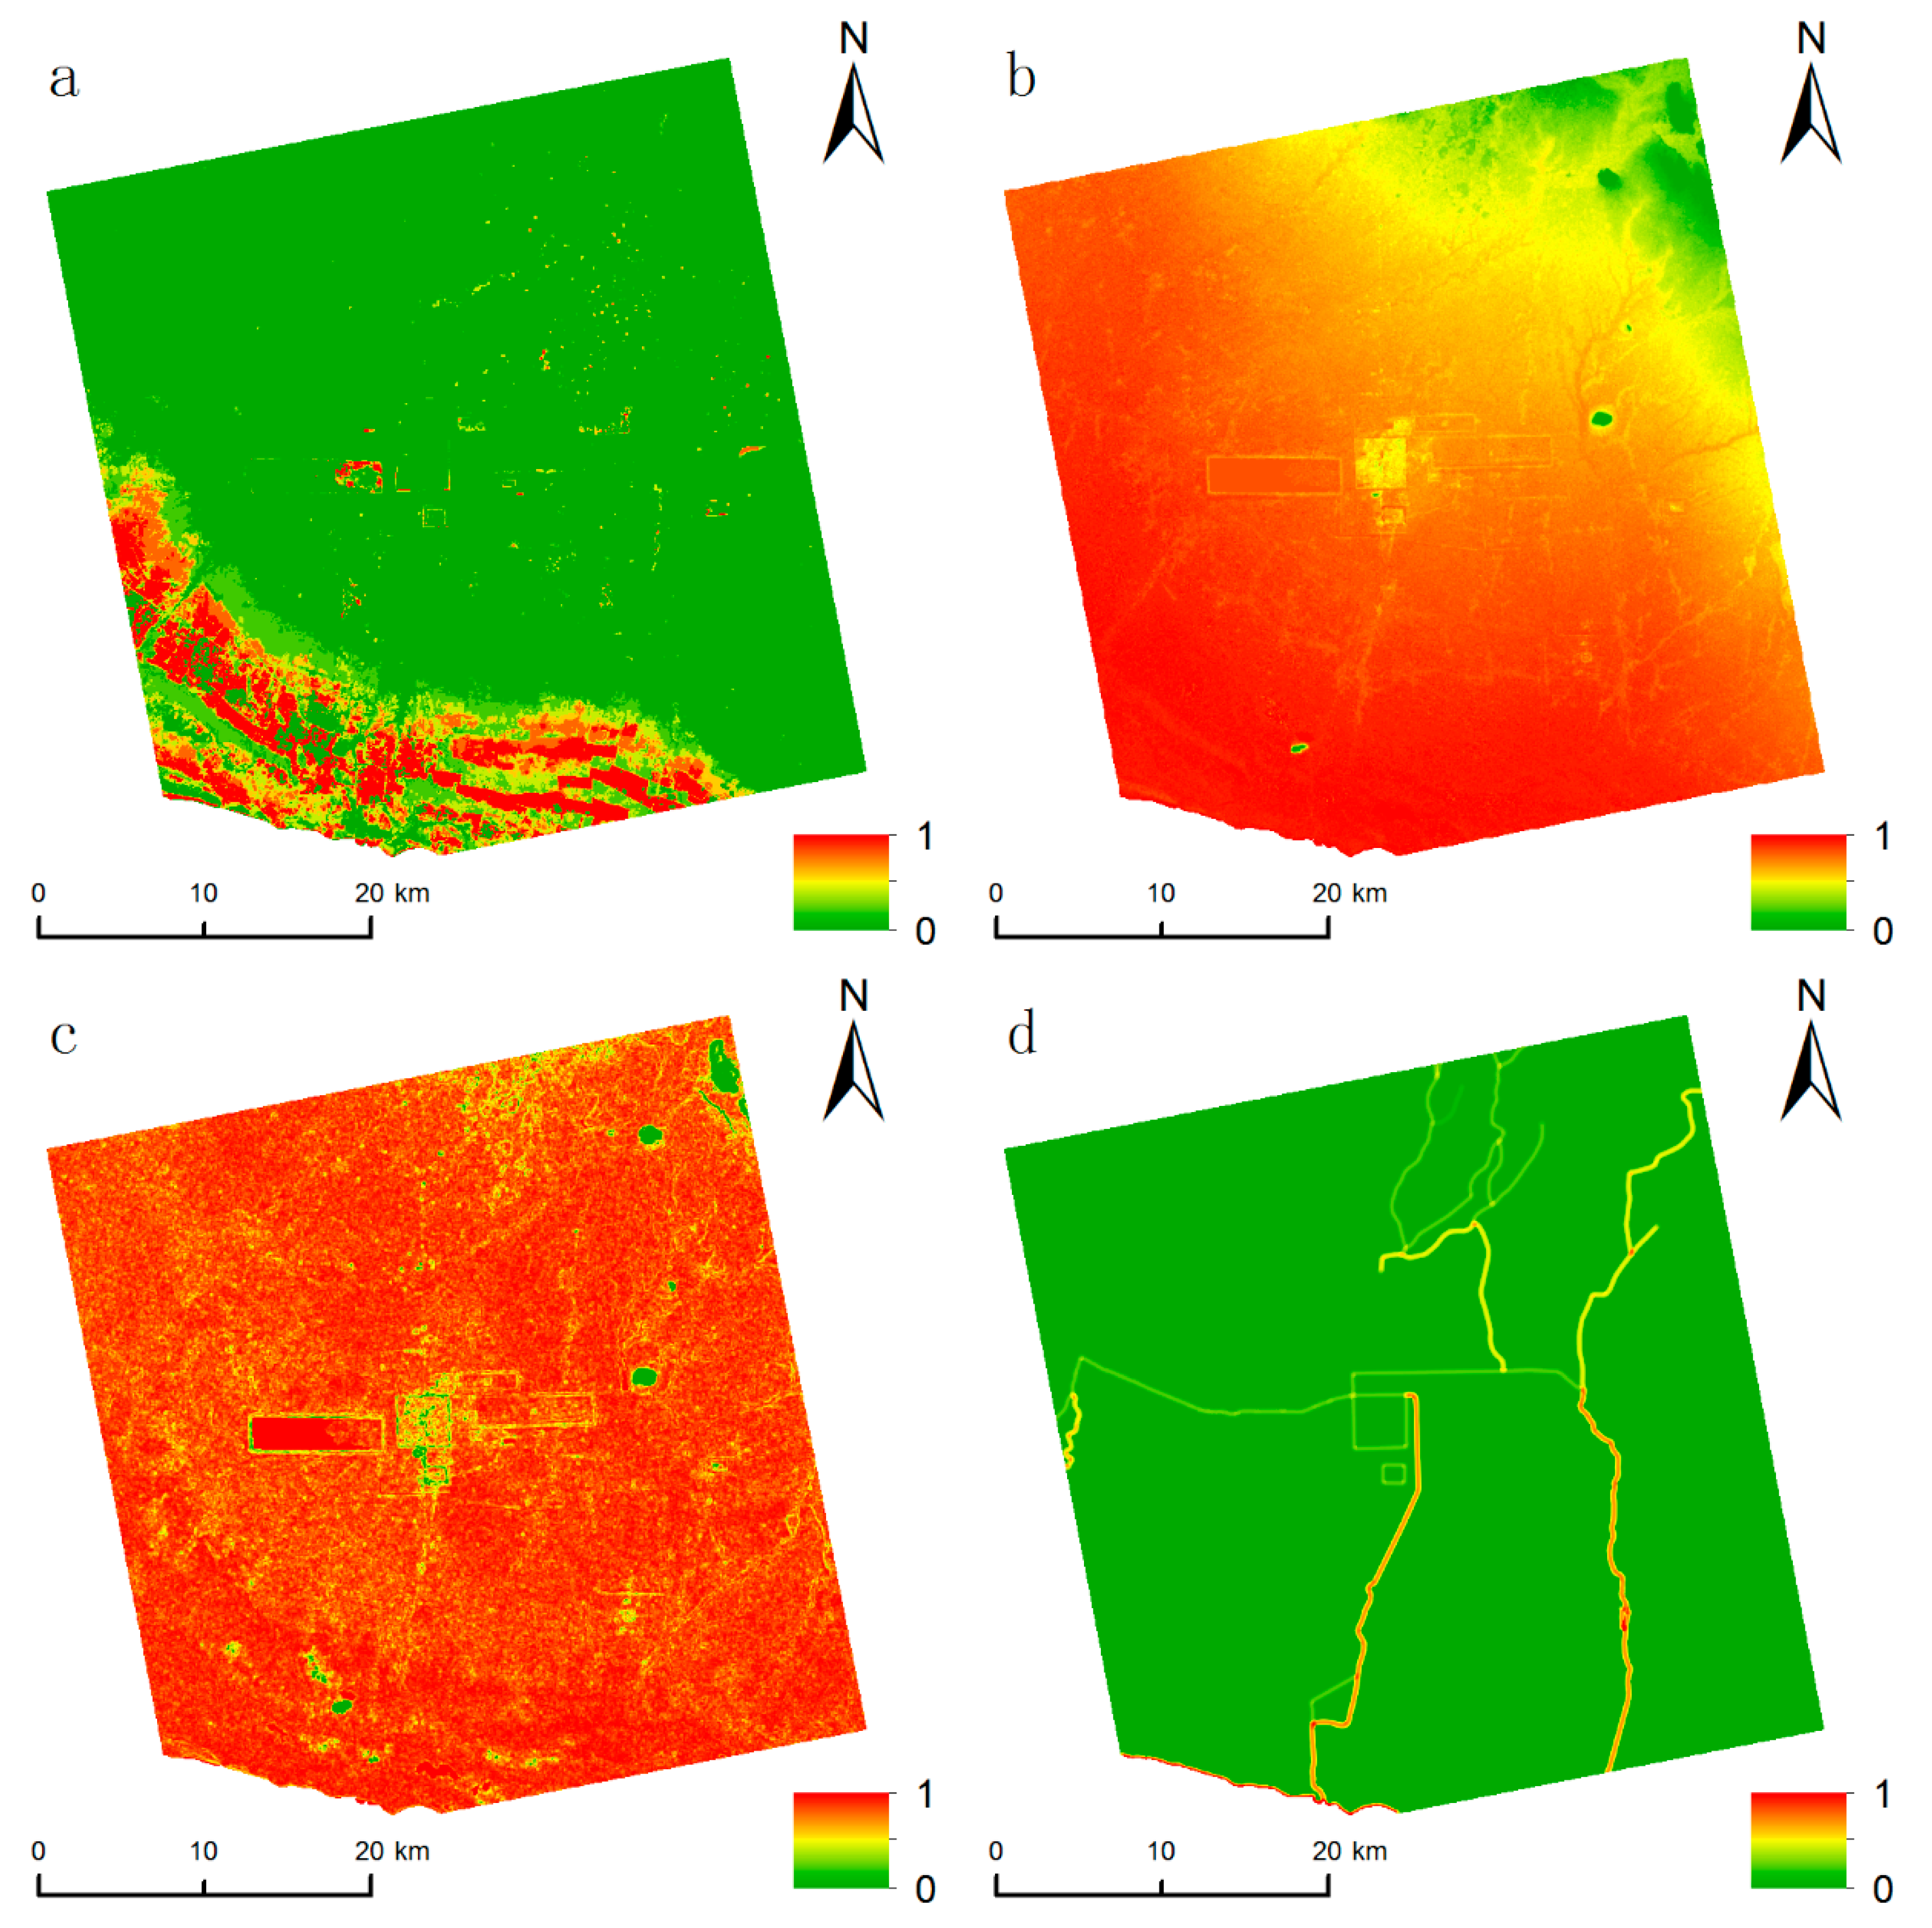
The indices calculated to this point were derived from different data sources and were different in terms of their units and their relationship with flood risk (directly or inversely proportional to flood risk). For example, a higher flood affected frequency and drainage density means a higher risk of floods in relevant areas making these two indices positively related to flood risk, conversely, the absolute elevation and elevation standard deviation are negatively related to flood risk. For these reasons the indices were normalized using the following normalization equations:
where, is the normalized value of the positive index, is the normalized value of the negative index, the original value of the index and and are the maximum and minimum values of the index respectively. The normalized index map is shown in Figure 6.
3.2.2. Determination of Index Weights
Different indices have different impacts on the flood hazard index, so it is necessary to determine the weight of each index. In this study, the AHP [23,24] and Delphi [32,33] methods were used to determine the index weights. The AHP method is a flexible, multi-criteria decision-making method that can quantify qualitative problems. The Delphi method is a comprehensive evaluation method that gradually makes expert opinions consistent through multiple rounds of information feedback and exchanges by using extensive consultation with experts. Conclusions obtained by this method are reliable. The implementation steps are listed as follows.
- (1)
- Determine the relative importance of each index. The importance of each index to the flood risk is different. In the AHP, nine scales are usually used to determine the relative importance of each index. The specific meanings of the scales ranges from 1 to 9 are shown in Table 1.
- (2)
- Building the judgment matrix. A pair wise comparison was used for each index according to the scale value of each index, yielding a n × n matrix where diagonal elements were equal to 1. The matrix is shown in Table 2:
Also, the judgment matrix must meet the condition = .
- (3)
- The maximum eigenvalue of the judgment matrix and its corresponding eigenvectors were calculated and a consistency check was performed. If the Consistency Ratio (CR) was less than 0.1, it meant that the test has been passed, otherwise, the judgment matrix was reconstructed. The consistency check equation is as follows:
In the equation, CR is the value of the consistency ratio, CI is value of the consistency index, is the maximum eigenvalue of the judgment matrix, n is the number of indices and RI is the average random consistency index. The RI values are shown in Table 3.
The Delphi method was used to determine the value of scale of each index, we produced an index score form and sent it to five experts. After multiple rounds of information feedback, we took the median of their scores as the final score for each index and based on the above indices and expert scores, constructed a judgment matrix, as shown in Table 4.
We used MATLAB to get the index weights of the judgment matrix = (0.413, 0.295, 0.1607, 0.1313). The consistency check ratio CR was 0.0076, that is, it was less than 0.1 and so the consistency check was passed.
3.2.3. Building the FHI Model
We built the FHI model to assess flood hazards at Angkor. The FHI model was established using a multi-parameter method and by combining GIS spatial analysis and decision making. Four basic indicators of the FHI model, namely flood affected frequency, absolute elevation, standard deviation of the elevation and drainage density were chosen to develop the FHI model by using the algebraic function of ArcGIS. The equation for the FHI model is
where FHI is the flood hazard index, is the hazard assessment index and is the weight of assessment index i.
4. Results and Discussion
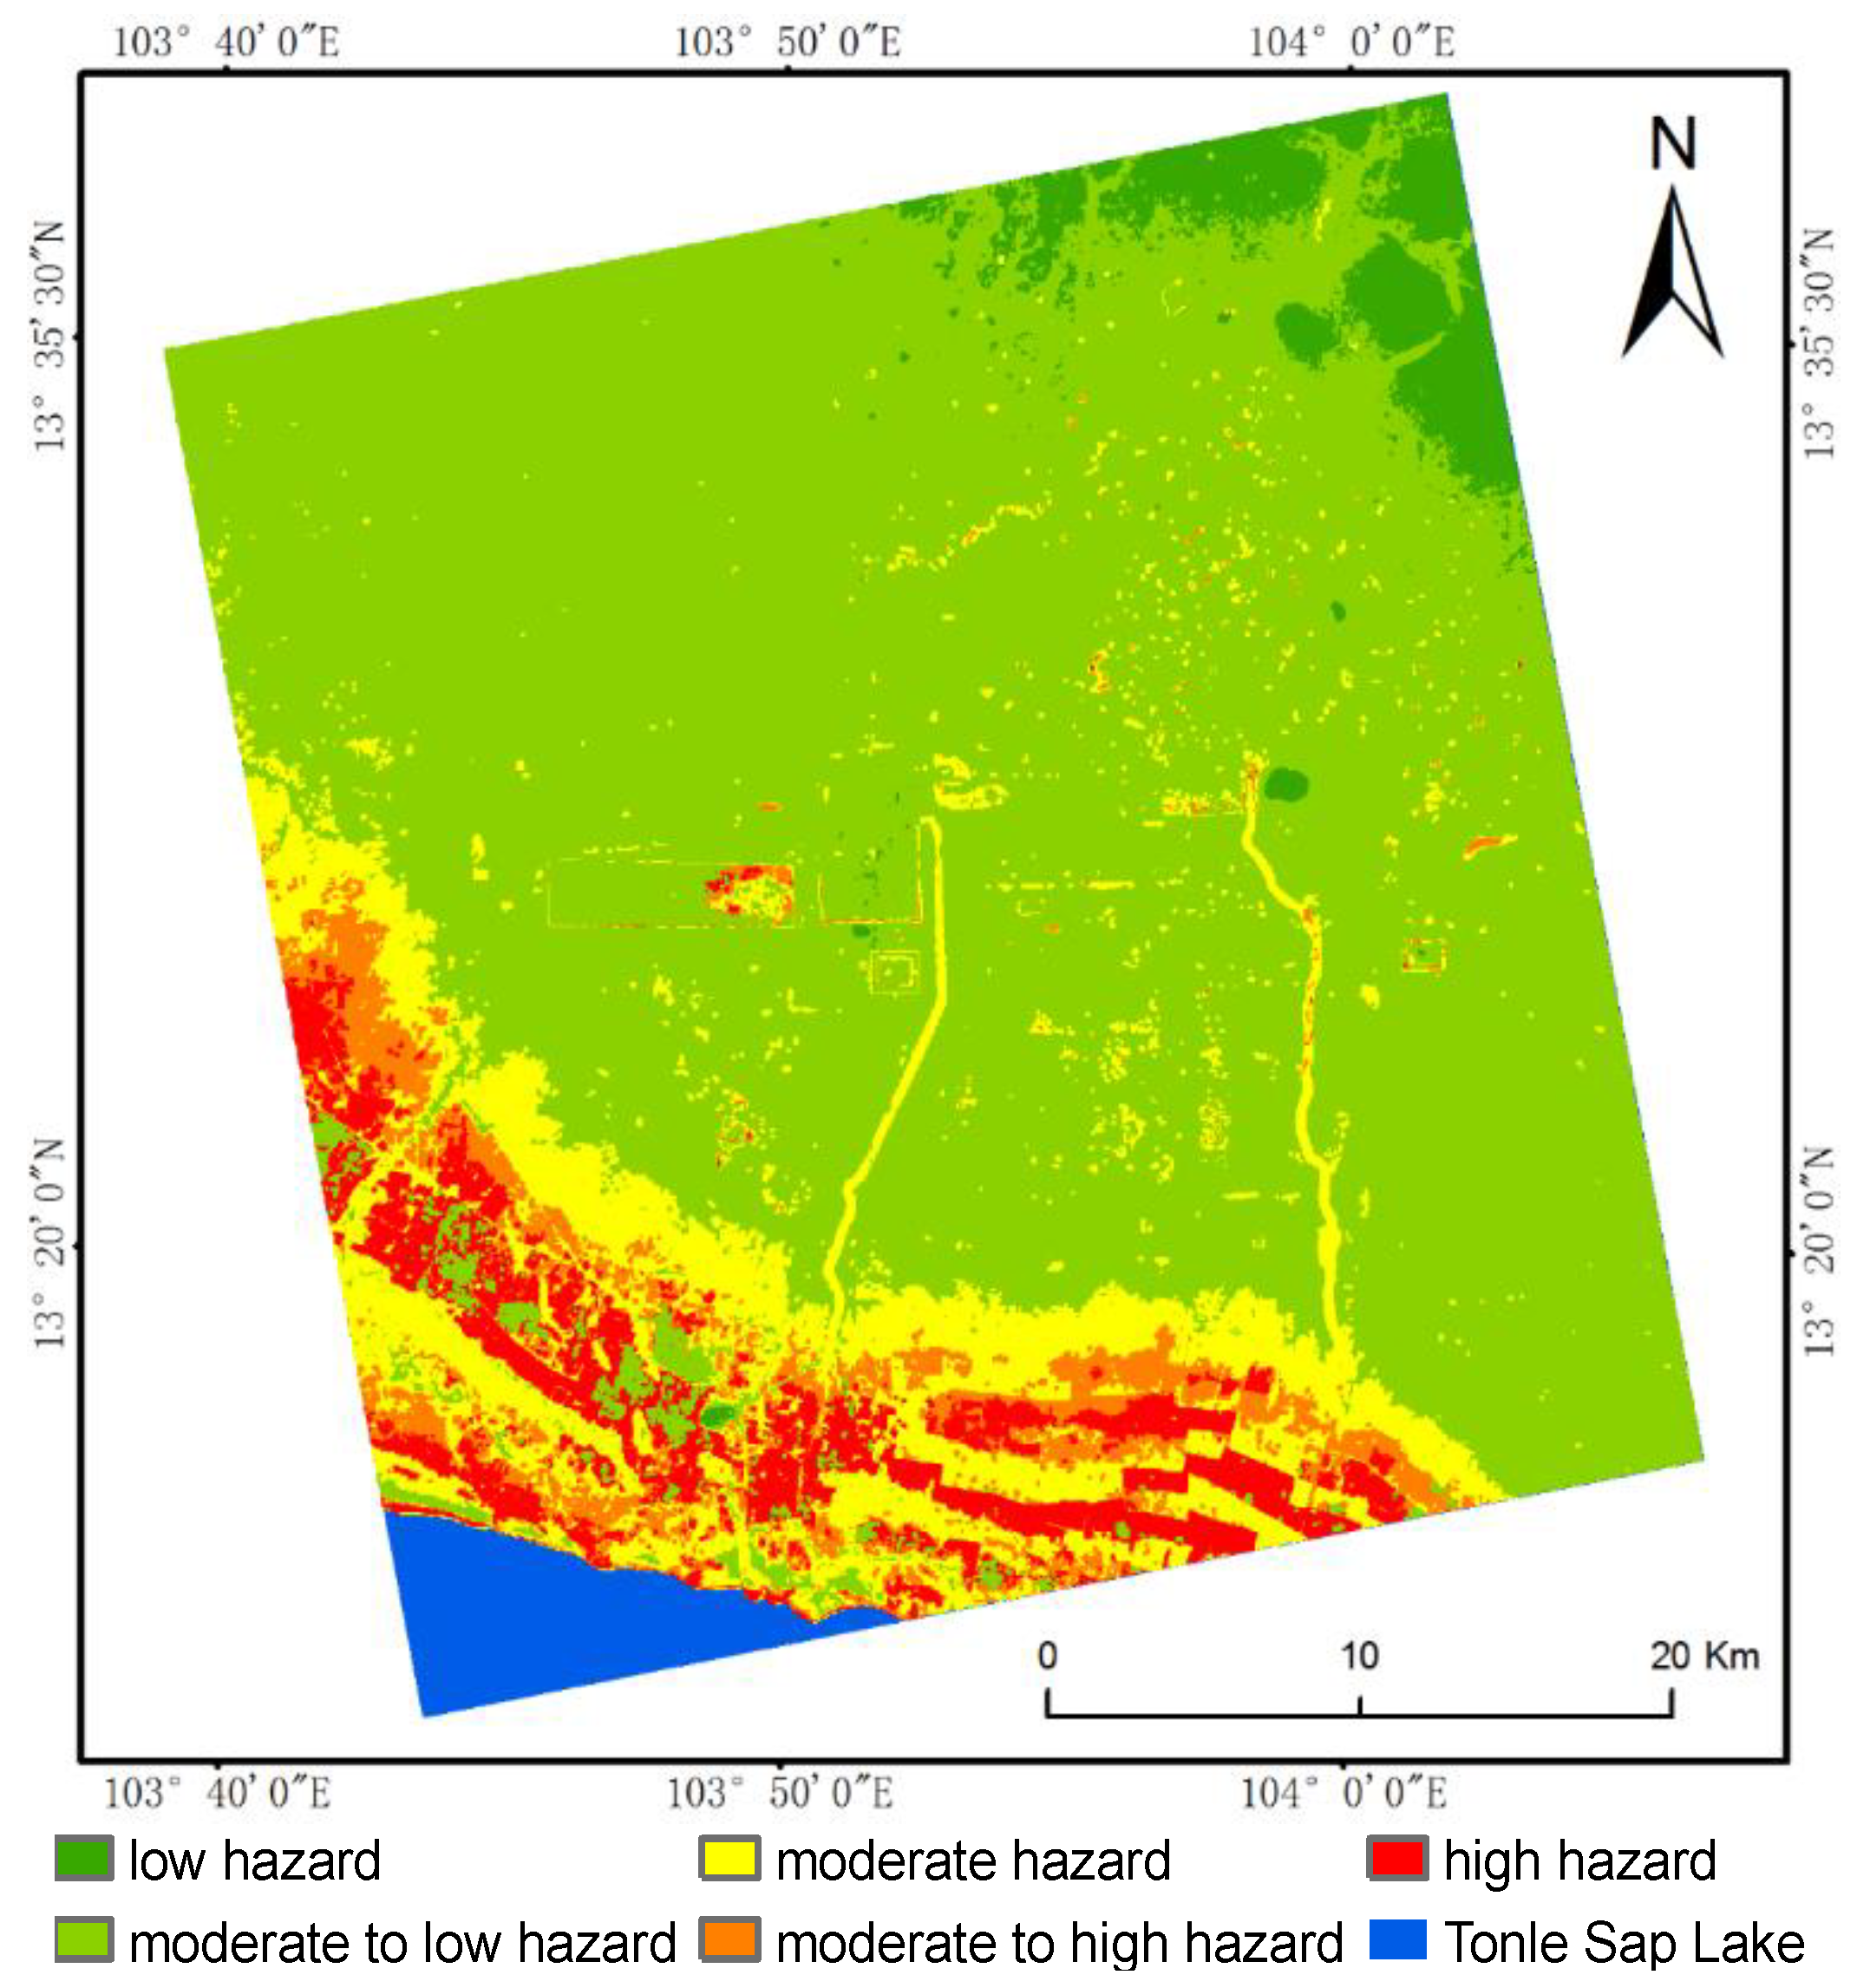
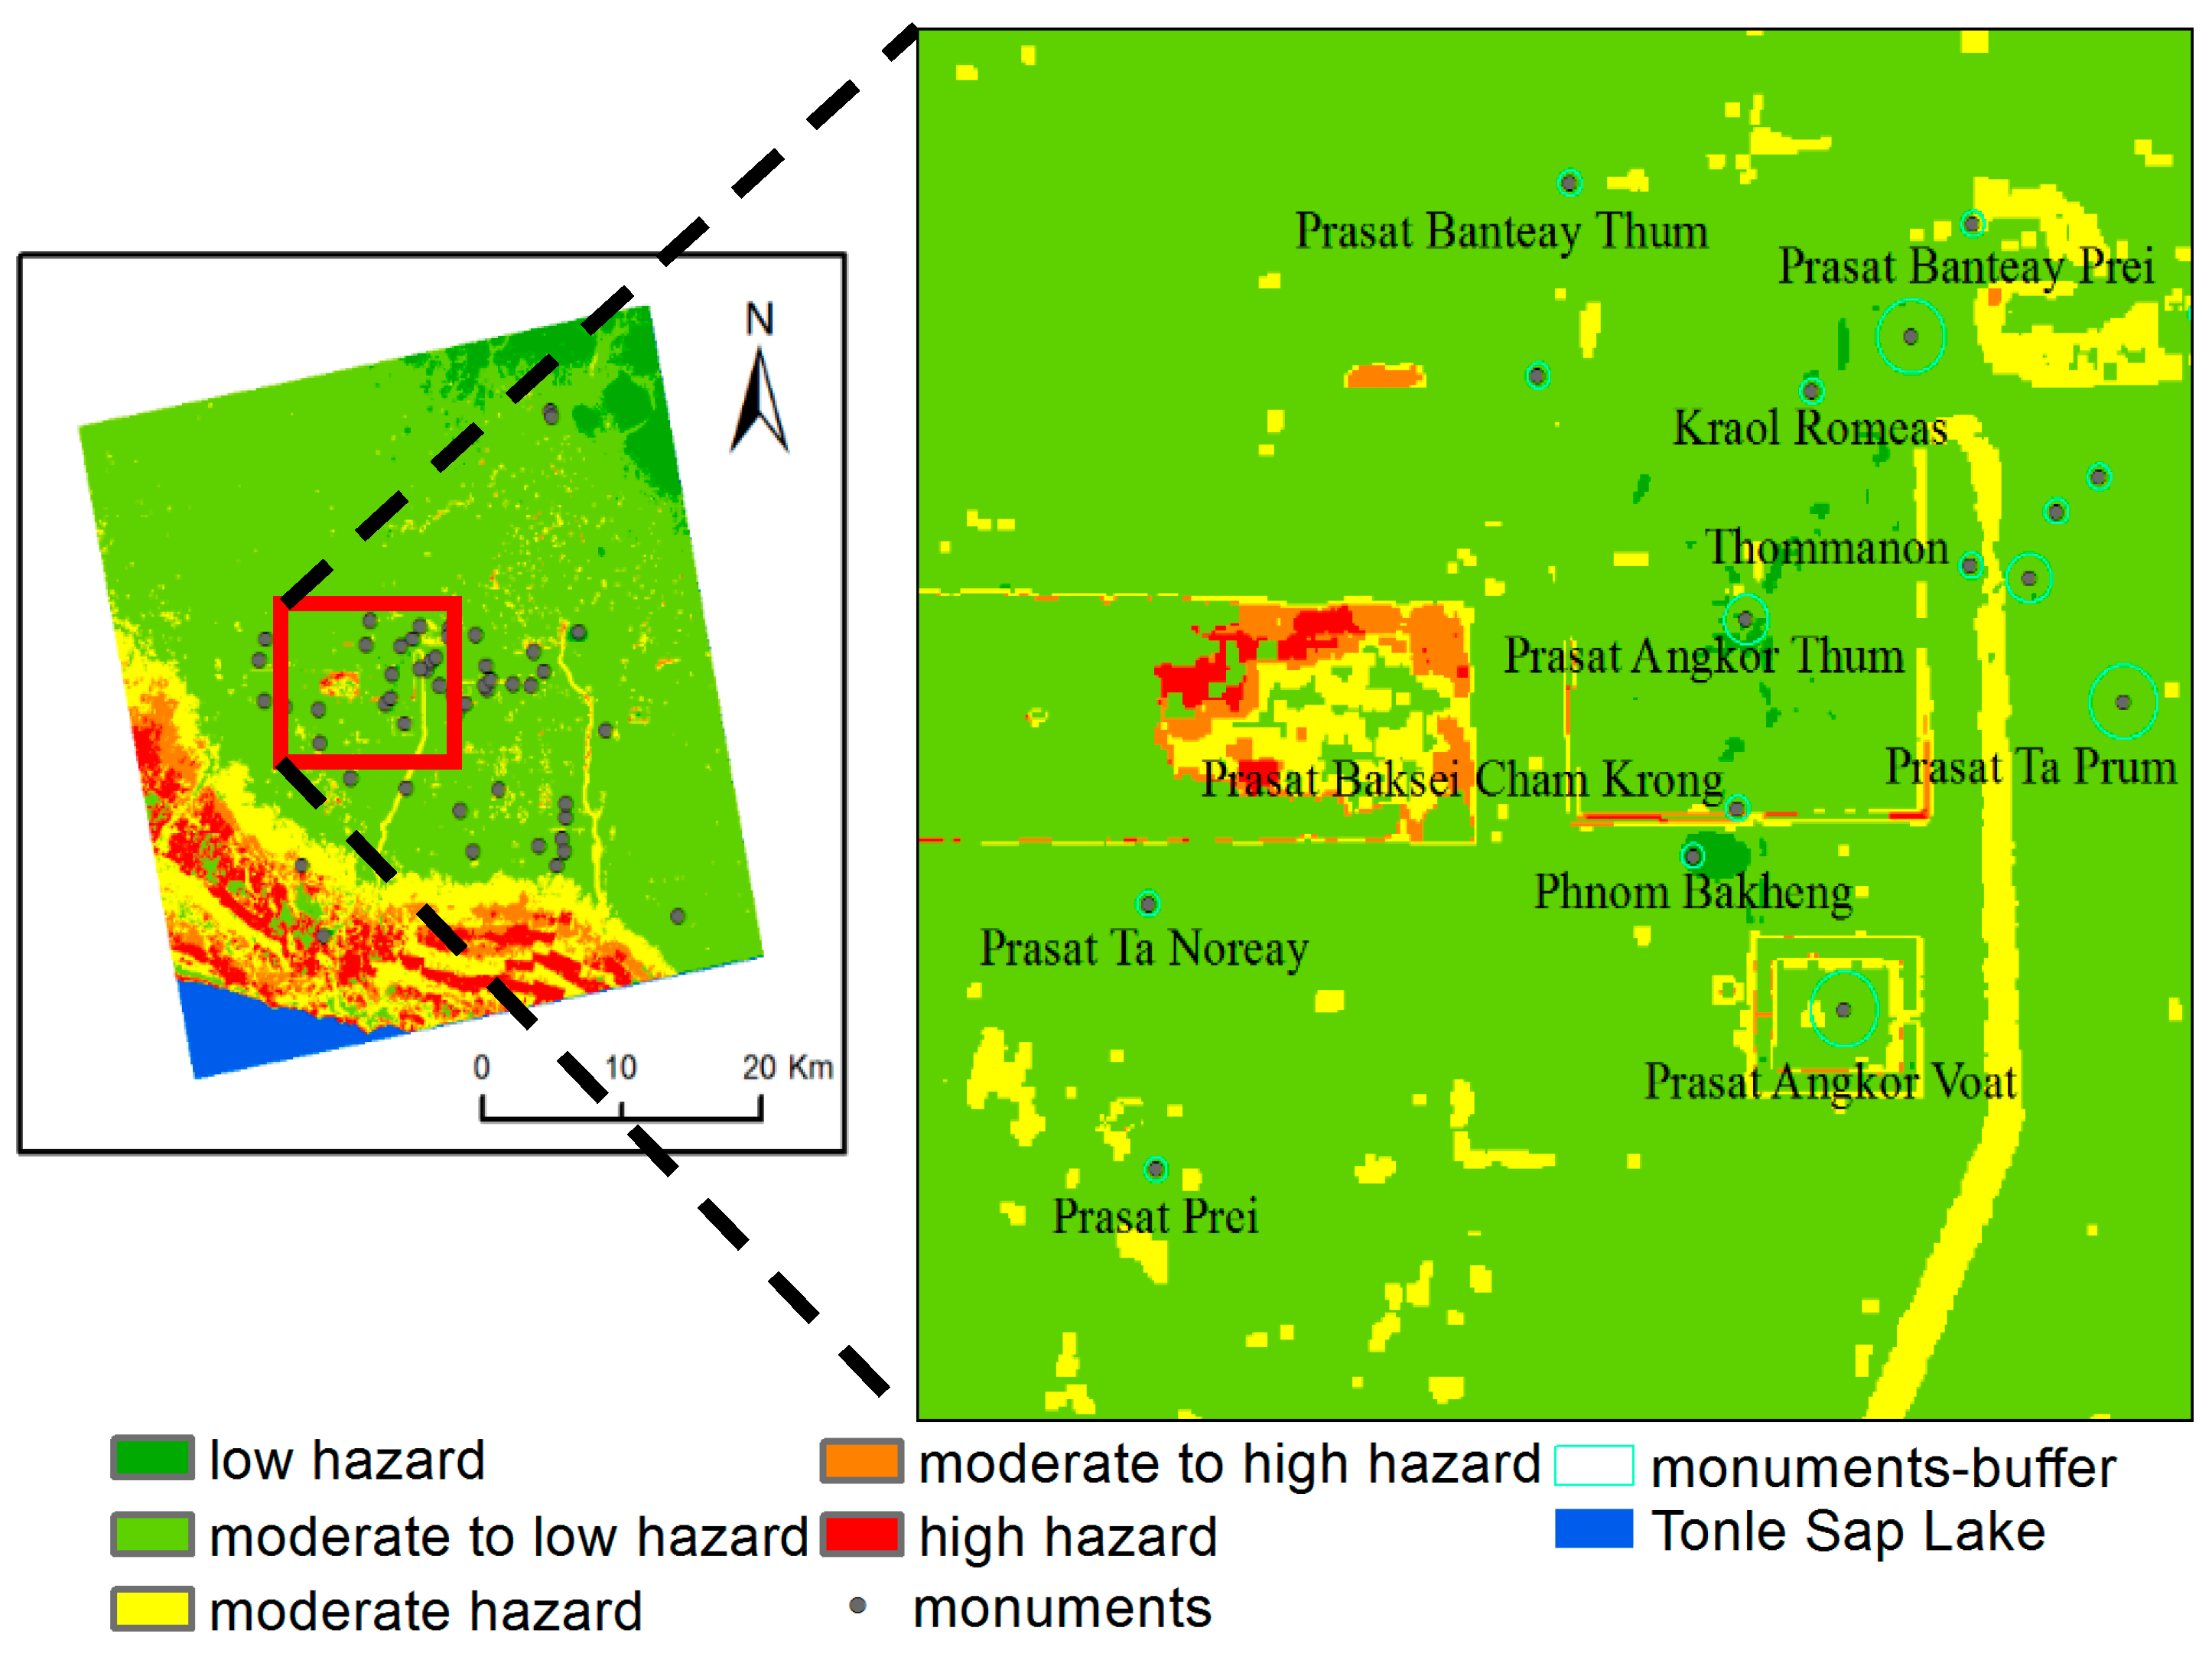
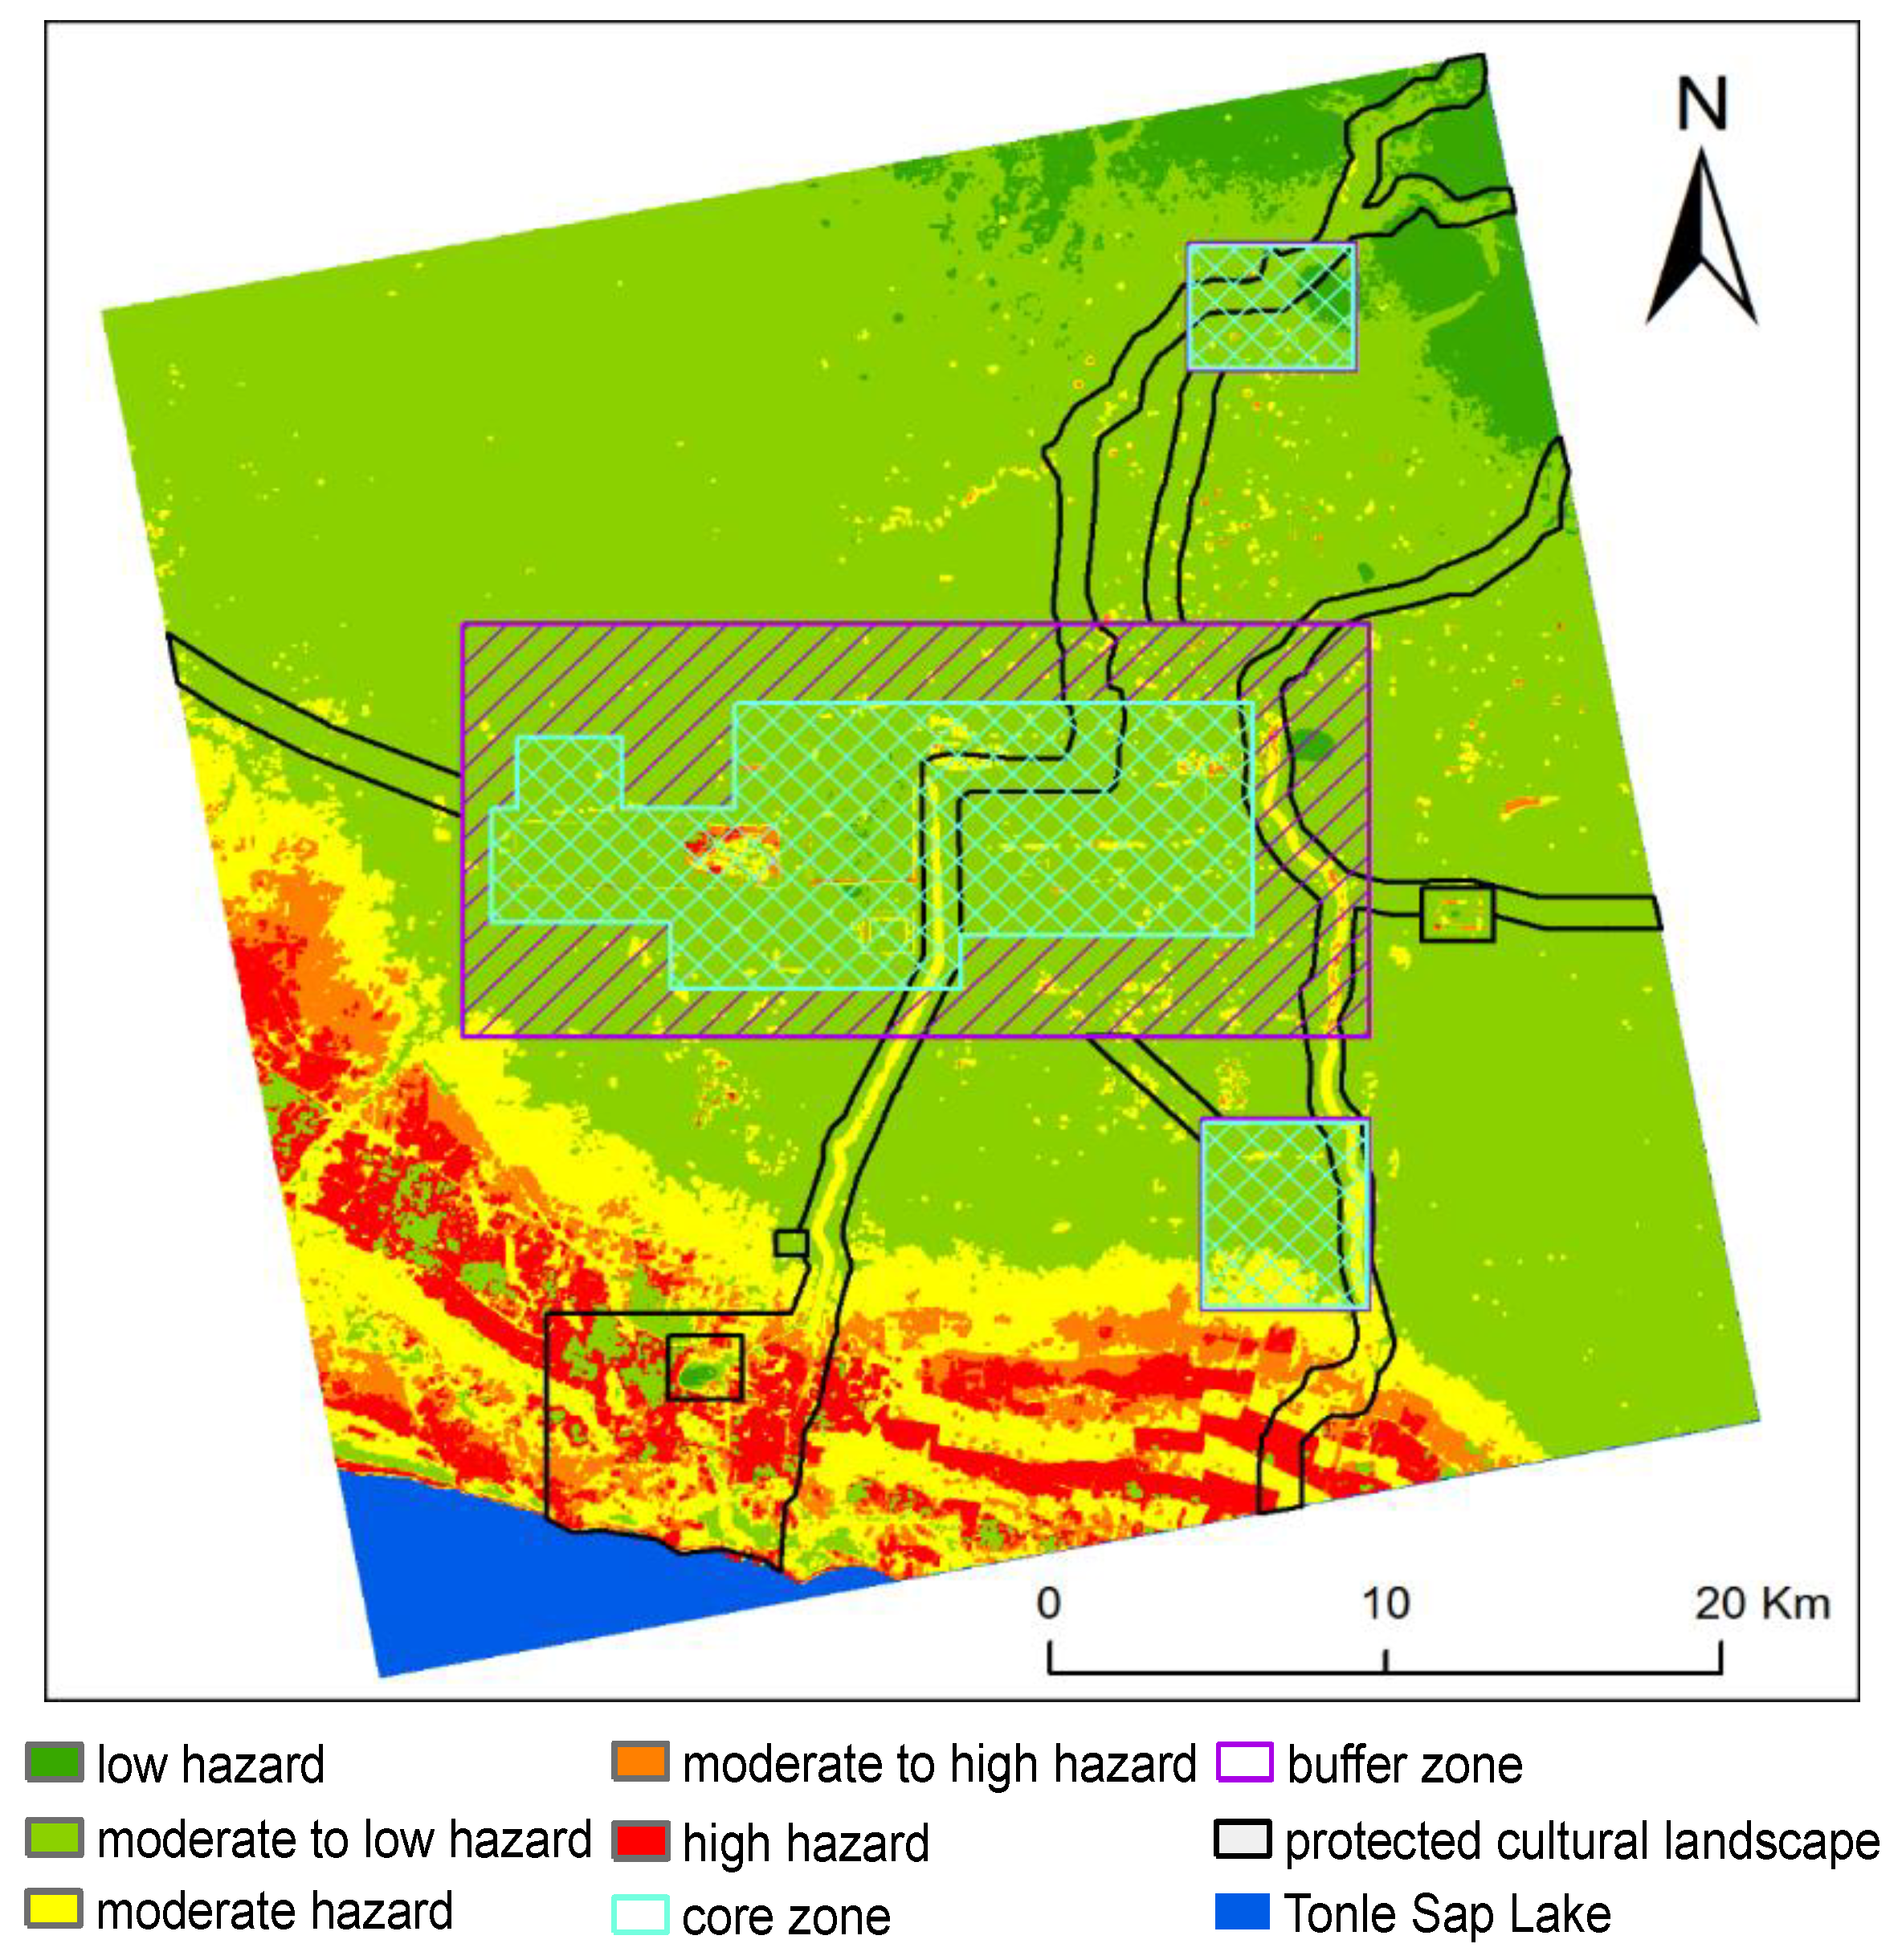
After adding the index data shown in Figure 6 and the corresponding index weights into the FHI model, we obtained a flood hazard assessment map of the Angkor region. Natural breaks classification method [45] was used to classify the hazards due to flooding into five levels, namely, low hazard, moderate-to-low hazard, moderate hazard, moderate-to-high hazard and high hazard, as shown in Figure 7. Natural breaks classification method is a data classification method designed to determine the best arrangement of values into different classes and a practical method for geographical classification [46]. In order to understand the flood hazard levels at various monuments, the monument layer provided by the APSARA was superimposed on the flood hazard assessment map. However, the risk level for a particular site cannot be judged only by the hazard level for its location: rather, it should be based on whether or not there are other flood risk levels within a certain range around the location. Therefore, after investigating the monuments using Google Earth and by making on-site surveys, it was found that most of the monuments are isolated Buddha statues, As such, a buffer zone was created for each monument by using ArcGIS. The radius of the buffer zones ranged from 100 m to 300 m for different monuments. The buffer zones of the monuments are shown in Figure 8. To assess the flood hazard in the core and buffer zones of Angkor, the layer of core and buffer zones provided by APSARA was superimposed on the hazard assessment map, as shown in Figure 9.
Figure 7 shows that the high hazard and moderate-to-high hazard areas in the study area are mainly located to the north of the Tonle Sap Lake and the east side of the West Baray, accounting for 10.50% of the total study area. High flood hazard in the north of the Tonle Sap Lake is a result of dramatic rise in the water level of Tonle Sap Lake during the rainy season—the spread of the lake forms an inundation area. Besides this, rainwater flowing down from the northern Kulen Mountains also accumulates here because of the low and flat terrain. The floodplain is about 10 km away from the edge of the Tonle Sap Lake. The West Baray high hazard area is a result of precipitation and the injection of river water, which leads to an increase in the water level and the formation of an inundation area. The moderate hazard areas are mainly distributed around high hazard areas and on both sides of the Siem Reap and Roluos rivers, accounting for 13.10% of the total study area. Due to the high topography, the low hazard and moderate-to-low hazard areas are mainly located in the north and southeast of Angkor, occupying 76.40% of the entire study area. Figure 8 shows the flood-risk levels for the monuments. There are 52 monuments in the study area. We used the ArcGIS analysis function to learn that there are 43 monuments and buffer zones that lie completely within areas with low and moderate-to-low hazard levels. The remaining 9 monuments lie within moderate-hazard areas; none are in high-hazard areas. Figure 9 shows the distribution of flood hazard levels in the core and buffer zones of Angkor. The high and moderate-to-high hazard areas in the core zone are mainly distributed on the east side of the West Baray and on the extension of the moat. The moderate hazard areas are located on both sides of the Siem Reap and Roluos rivers, which flow through the core zone and in the flooded area of the Tonle Sap Lake adjacent to the core zone. Low and moderate-to-low hazard areas occupy most of the core zone. The high and moderate-to-high hazard areas in the core zone cover 2.60 km2, accounting for approximately 1.15% of the entire core zone. The moderate hazard areas cover 19.04 km2, accounting for approximately 9.13% of the total study area. The low and moderate-to-low hazard areas have a total area of 186.86 km2, accounting for approximately 89.72% of the total. The high and moderate-to-high hazard areas in the buffer zone cover 0.78 km2, accounting for 0.4% of the total area of the buffer zone. The moderate hazard areas cover 11.51 km2 or 5.9% of the total and are mainly distributed on both sides of the Roluos River. The low and moderate-to-low hazard areas cover 180.42 km2, taking up 93.7% of the total.
This study has been mainly concerned with evaluating flood hazards in the Angkor region based on the multi-criteria evaluation system and the FHI model. During the past two decades, the monitoring of the World Heritage sites using Earth observation data offers definite benefits, namely the coverage of very large areas, the systematic investigation and the multi-scale accurate detection [47]. The characteristics of SAR data, which can be obtained in all-weather real-time and are not hindered by cloud cover, provide great convenience for flood monitoring in cloudy areas such as Southeast Asia. Traditionally, disaster risk assessment at heritage sites has produced a general risk level for the site location [1,2]. However, this often fails to truly reflect the risk level for a site. We find there are 9 monuments which are threatened by potential floods after we established a buffer zone for each monument, such as Prasat Angkor Voat, Prasat Baksei Cham Krong, Prasat Banteay Prei and Thmmanon (Figure 8). The high hazard and moderate-to-high hazard areas in the core zone are mainly located in the inundation area of the West Baray, which is created by the rising level of the lake water during the monsoon period. In fact, this helps to reduce the flood pressure on the site areas a whole. As such, the flood hazard in the West Baray has low impact on the rest of the site. The moderate hazard areas in the core zone are mainly located on both sides of the Siem Reap and Roluos rivers and near some flooded areas of the Tonle Sap Lake. This hazard is the result of a combination of multiple factors, including flood affected frequency, topography and the river network. The buffer zone mainly belongs to moderate-to-low hazard areas. Within this zone, the Roluos River has a major impact on floods. During rainy seasons, dynamic changes in the Siem Reap and Rolous rivers must be closely monitored. If there are abnormal water-level changes, timely decisions must be made to avoid threats to the many temples in the core zone.
Water played an important role in the development, the rise and fall of Angkor civilization. Angkor flourished for six centuries and, undoubtedly as a result of the water-harnessing ingenuity of the Khmer, became the largest pre-industrial city in the world. In the early 1950s, the French archaeologist Bernard-Philippe Groslier argued that the extent and breakdown of the hydraulic network was implicated in the demise of Angkor [48,49]. Evans et al. have drawn a hydraulic network map covering Angkor region about 1000 km2, the results of their study indicated that the surge in population and ecological deterioration increased the risk of floods and other natural disasters, which was one of the important factors that forced people to leave Angkor [50,51]. However, nowadays, water management in Angkor region is challenged by a growing population and tourists’ activity, along with deforestation practices and other watershed alteration. Additionally, the tourist facilities in Angkor and the Siem Reap city are concentrated in the drainage zone, making the region susceptible to flooding during annual rains from May and September. In 2011, there was a major flood in Cambodia and some of the Angkor sites were flooded. If Angkor had a 50 year flood recurrence period, then more sites would been submerged or even washed down. Therefore, effective water management is critical for long-term maintenance of Outstanding Universal Value (OUV) of the Angkor World Heritage site. The recognition of the importance of the hydraulic system of Angkor has broadened the scope of management from local site scale towards ecosystem scale.
The methodology used in this study has some limitations. This study used single-band HH polarization SAR data to extract water bodies, which is not effective in distinguishing the inundated jungle areas. A more accurate flood assessment map for Angkor Thom and Angkor Wat covered by jungle could be obtained if we could identify the flood in jungle areas. Also, the formation of regional floods results from many factors, for example, some scholars conducted research on the impact of groundwater flooding on World Heritage sites. Although this study has established a relatively complete assessment index system for the Angkor region, indices related to the flood process such as inundation duration, runoff and peak discharge were not taken into account. These will be considered in the future studies, in order to conduct a more in-depth analysis of the flood mechanism.
Result Validation
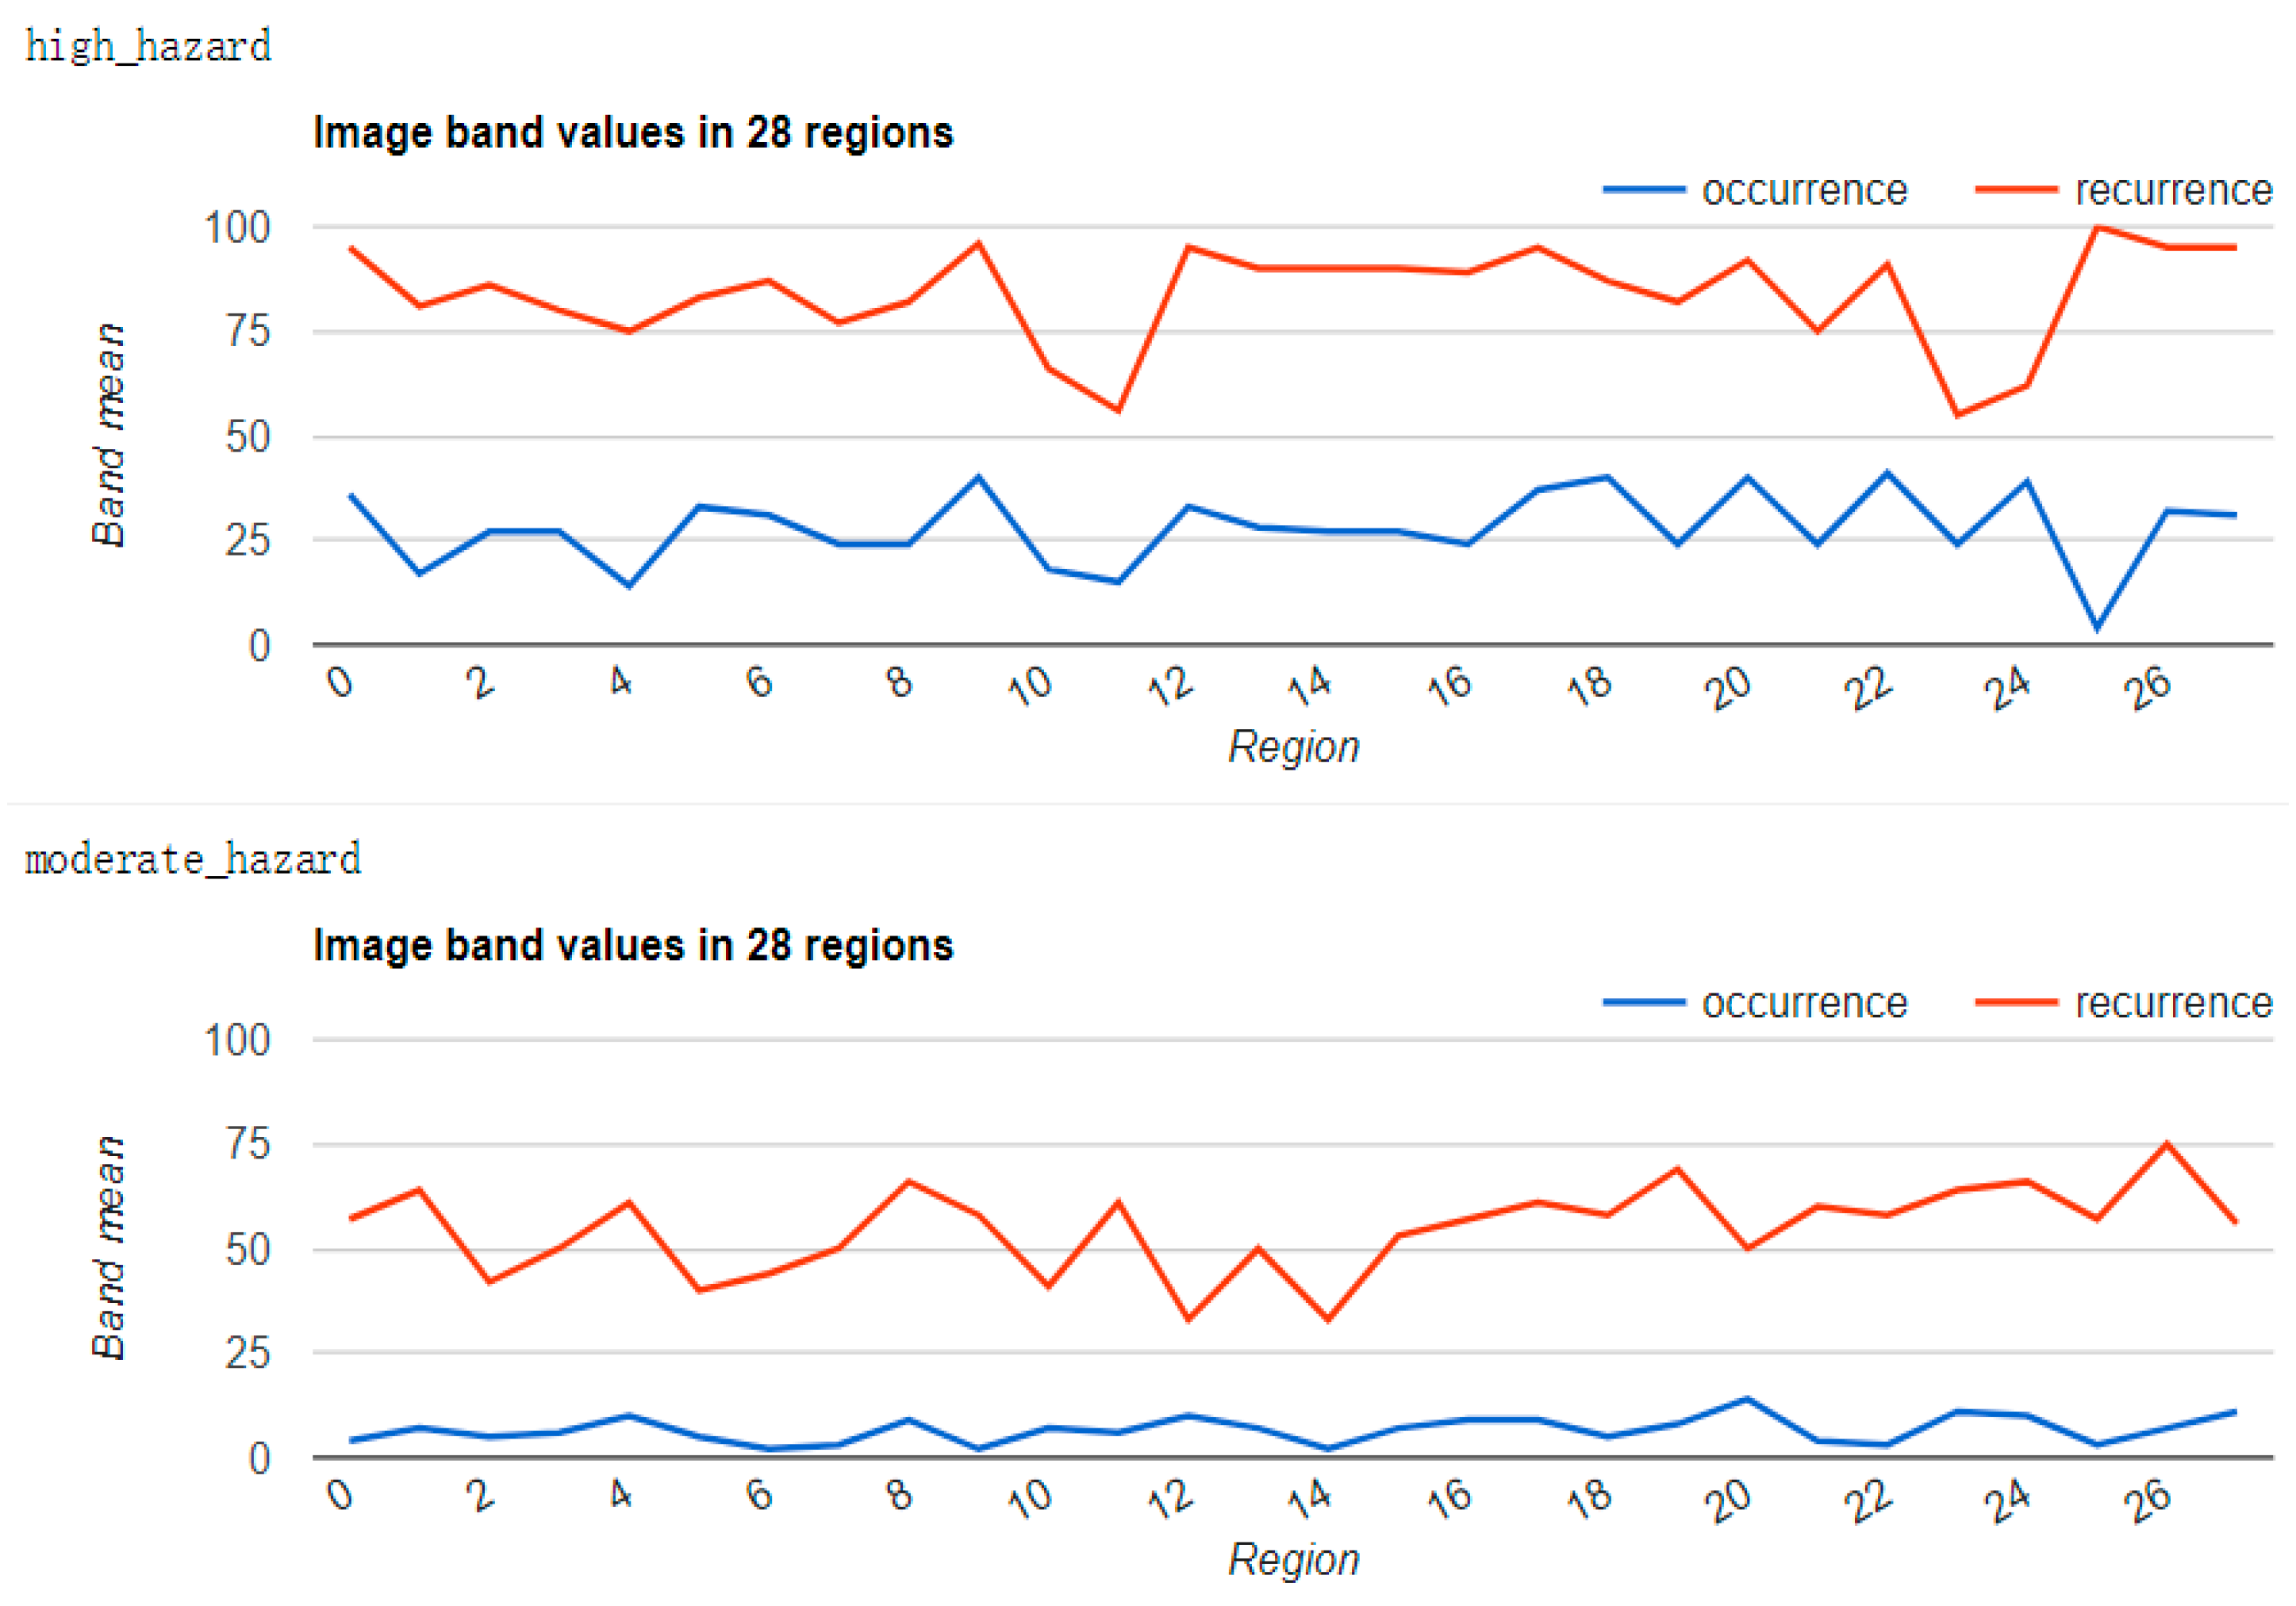
In 2016, Pekel et al. [52] released the 1984–2015 global 30 m × 30 m resolution surface water dataset, which maps global surface water bodies from 1984 to 2015 and provided statistics on the extent and variations of these water bodies. Table 5 lists the basic information of the seven bands of global surface water dataset. Occurrence and recurrence bands from this dataset were used to validate our results. For the validation process, we randomly select 28 points from high hazard, moderate hazard and low hazard zones and counted the occurrence and recurrence values at these points. Figure 10 shows the locations of the random points for each of the hazard intensities and Figure 11 shows the band values of the 28 random points in high hazard, moderate hazard and low hazard zones.
Comparing the values of occurrence and recurrence in high hazards zones (27.9% and 83.8% respectively) and moderate hazard zones (6.64% and 54.79% respectively), it can be concluded that high occurrence and recurrence values corroborate higher flood risk in the high hazard zones and lower occurrence and recurrence values corroborate moderate flood risks in moderate hazards zone. Additionally, the zero occurrence and recurrence values in low hazard zones are indicative of absence of water in the region and therefore indicative of extremely low possibility of flooding. These results validate the flood hazard assessment results, demonstrating the flood hazard assessment process to be reliable and useful for decision support process and flood disaster prevention.
5. Conclusions
The flood disaster not only directly harms the Angkor site but also brings sediment to the river channel, thereby destroying the continuity of the Angkor hydraulic network and affecting the sustainable development of Angkor [50]. The Siem Reap city and its environs where tourism facilities are concentrated are in the drainage zone and are susceptible to flooding during annual rains from May to September. This study aimed to identify flood-prone areas and monuments vulnerable to the threat of floods and to provide a theoretical basis and decision support for flood management and disaster prevention and mitigation in the Angkor region.
This study developed a FHI model for flood risk assessment based on the index system. Flood affected frequency, absolute elevation, standard deviation of elevation and drainage density were selected as indices for the flood hazard assessment. The AHP and Delphi methods were used to weight different indices to obtain a flood hazard map of the Angkor region. SAR data from different years were used to extract the flood spatial coverage in the Angkor region. According to the assessment results, the high hazard and moderate-to-high hazard areas due to floods in the study area are mainly located in the floodplain about 10 km north of the Tonle Sap Lake and in the east part of the West Baray. Although these areas have a high degree of risk, their impact on the heritage site is not significant. The moderate hazard areas are mainly located in parts of the flooded area around the Tonle Sap Lake and on both sides of the Siem Reap and Roluos rivers. The moderate hazard areas on both sides of the Siem Reap and Roluos rivers—in the core and buffer zones—and also the flooded area around the Tonle Sap Lake—covering parts of the core zone—have a greater impact on the heritage site. These areas pose a greater flood threat to the core zone and must be given greater attention. There are 52 components of the monument within the study area. Although most are located in low hazard or moderate-to-low hazard areas, nine with a higher flood risk are within the buffer zone. The possibility of these monuments being affected by floods is higher. During rainy seasons, the monitoring around these monuments must be strengthened. In the case of flood risk, flood control measures must be taken as soon as possible to protect the sites from being inundated.
In short, flood prevention and management is an important guarantee for the sustainable development of the Angkor site. The flood hazard map obtained in this study meets the needs of flood hazard assessment in the Angkor region. The application of SAR data and FHI model has clearly revealed the flood-prone hazard areas, which will support disaster preparedness and mitigation activities in Angkor region. In addition, the newly developed model used in this study takes the Angkor site as an example and can be modified and applied to other heritage sites in Southeast Asia.
Author Contributions
Conceptualization, J.L.; methodology, Z.X., F.C. (Fulong Chen); formal analysis, J.L., Z.X.; validation, L.Z.; writing—original draft preparation, J.L., Z.X.; writing—review and editing, F.C. (Fulong Chen), F.C. (Fang Chen); funding acquisition, F.C. (Fulong Chen).
Funding
This research was funded by the Strategic Priority Research Program of the Chinese Academy of Sciences (Grant No. XDA19030502).
Acknowledgments
We thank APSARA Authority for their support and sharing valuable data. We acknowledge Japan Aerospace Exploration Agency (JAXA) and e-GEOS to provide ALOS PALSAR-1 and COSMO-SkyMed data, respectively.
Conflicts of Interest
The authors declare no conflict of interest.
References
- Anderson, K.; Ryan, B.; Sonntag, W.; Kavvada, A.; Friedl, L. Earth observation in service of the 2030 Agenda for sustainable development. Geo-Spat. Inf. Sci. 2017, 20, 77–96. [Google Scholar] [CrossRef]
- Agapiou, A.; Lysandrou, V.; Alexakis, D.D.; Themistocleous, K.; Cuca, B.; Argyriou, A.; Sarris, A.; Hadjimitsis, D.G. Cultural heritage management and monitoring using remote sensing data and GIS: The case study of Paphos area, Cyprus. Comput. Environ. Urban Syst. 2015, 54, 230–239. [Google Scholar] [CrossRef]
- Lanza, S.G. Flood hazard threat on cultural heritage in the town of Genoa (Italy). J. Cult. Heritage 2003, 4, 159–167. [Google Scholar] [CrossRef]
- Vojinovic, Z.; Hammond, M.; Golub, D.; Sianee, H.; Weesakul, S.; Meesuk, V.; Media, N.; Sanchez, A.; Kummara, S.; Abbott, M. Holistic approach to flood risk assessment in areas with cultural heritage: A practical application in Ayutthaya, Thailand. Nat. Hazards 2016, 81, 589–616. [Google Scholar] [CrossRef]
- Hategekimana, Y.; Yu, L.; Nie, Y.; Zhu, J.F.; Liu, F.; Guo, F. Integration of multi-parametric fuzzy analytic hierarchy process and GIS along the UNESCO World Heritage: A flood hazard index, Mombasa County, Kenya. Nat. Hazards 2018, 92, 1137–1153. [Google Scholar] [CrossRef]
- Huong, H.T.L.; Pathirana, A. Urbanization and climate change impacts on future urban flooding in Can Tho city, Vietnam. Hydrol. Earth Syst. Sci. 2013, 17, 379–394. [Google Scholar] [CrossRef] [Green Version]
- Lee, H.; Kim, J.S.; Jung, S. Flood Risk Analysis of cultural heritage sites: Changgyeong Palace, Korea. Arab. J. Sci. Eng. 2014, 39, 3617–3631. [Google Scholar] [CrossRef]
- Li, H.B.; Zhang, J.W.; Sun, J.Z.; Wang, J.D. A visual analytics approach for flood risk analysis and decision-making in cultural heritage. J. Vis. Lang. Comput. 2017, 41, 89–99. [Google Scholar] [CrossRef]
- Wager, J. Developing a strategy for the Angkor World Heritage Site. Tour. Manag. 1995, 16, 515–523. [Google Scholar] [CrossRef]
- Hang, P.; Ishwaran, N.; Hong, T.H.; Delanghe, P. From conservation to sustainable development—A case study of Angkor World Heritage Site, Cambodia. J. Environ. Sci. Eng. A 2016, 5, 141–155. [Google Scholar] [CrossRef]
- Kummu, M. Water management in Angkor: Human impacts on hydrology and sediment transportation. J. Environ. Manag. 2009, 90, 1413–1421. [Google Scholar] [CrossRef] [PubMed]
- Chen, F.L.; Guo, H.D.; Ma, P.F.; Lin, H.; Wang, C.; Ishwaran, N.; Hang, P. Radar interferometry offers new insights into threats to the Angkor site. Sci. Adv. 2017, 3, 1–8. [Google Scholar] [CrossRef] [PubMed]
- Penny, D.; Zachreson, C.; Fletcher, R.; Lau, D.; Lizier, J.T.; Fischer, N.; Evans, D.; Pottier, C.; Prokopenko, M. The demise of Angkor: Systemic vulnerability of urban infrastructure to climatic variations. Sci. Adv. 2018, 4, 1–9. [Google Scholar] [CrossRef] [PubMed]
- Chen, F.L.; Jiang, A.H.; Ishwaran, N. Angkor site monitoring and evaluation by radar remote sensing. Proc. SPIE 2014, 1–9. [Google Scholar]
- Cigna, F.; Tapete, D.; Lee, K. Geological hazards in the UNESCO World Heritage sites of the UK: From the global to the local scale perspective. Earth-Sci. Rev. 2018, 176, 166–194. [Google Scholar] [CrossRef]
- Tingsanchali, T.; Mohammed, F.K. Flood hazard and risk analysis in the southwest region of Bangladesh. Hydrol. Process. 2005, 19, 2055–2069. [Google Scholar] [CrossRef]
- Awang Ali, A.N.; Ariffin, J. Model reliability assessment: A hydrodynamic modeling approach for flood simulation in Damansara Catchment using InfoWorks RS. Adv. Mater. Res. 2011, 250–253, 3769–3775. [Google Scholar] [CrossRef]
- Zhong, G.H.; Liu, S.G.; Han, C.; Huang, W.R. Urban flood mapping for Jiaxing City based on hydrodynamic modeling and GIS analysis. J. Coast. Res. 2014, 68, 168–175. [Google Scholar] [CrossRef]
- Yin, J.; Yu, D.P.; Yin, Z.N.; Liu, M.; He, Q. Evaluating the impact and risk of pluvial flash flood on intra-urban road network: A case study in the city center of Shanghai, China. J. Hydrol. 2016, 537, 138–145. [Google Scholar] [CrossRef] [Green Version]
- Kubal, C.; Haase, D.; Meyer, V.; Scheuer, S. Integrated urban flood risk assessment—Adapting a multi criteria approach to a city. Nat. Hazards Earth Syst. Sci. 2009, 9, 1881–1895. [Google Scholar] [CrossRef]
- Sanyal, J.; Lu, X.X. GIS-based flood hazard mapping at different administrative scales: A case study in Gangetic West Bengal, India. Singap. J. Trop. Geogr. 2010, 27, 207–220. [Google Scholar] [CrossRef]
- Elkhrachy, I. Flash flood hazard mapping using satellite images and GIS tools: A case study of Najran City, Kingdom of Saudi Arabia (KSA). Egypt. J. Remote Sens. Space Sci. 2015, 18, 261–278. [Google Scholar] [CrossRef]
- Kazakis, N.; Kougias, I.; Patsialis, T. Assessment of flood hazard areas at a regional scale using an index-based approach and analytical hierarchy process: Application in rhodope-evros region, Greece. Sci. Total Environ. 2015, 538, 555–563. [Google Scholar] [CrossRef] [PubMed]
- Stefanidis, S.; Stathis, D. Assessment of flood hazard based on natural and anthropogenic factors using analytic hierarchy process (AHP). Nat. Hazards 2013, 68, 569–585. [Google Scholar] [CrossRef]
- Dou, X.Y.; Song, J.X.; Wang, L.P.; Tang, B.; Xu, S.F.; Kong, F.H.; Jiang, X.H. Flood risk assessment and mapping based on a modified multi-parameter flood hazard index model in the Guanzhong Urban Area, China. Stoch. Environ. Res. Risk Assess. 2017, 32, 1131–1146. [Google Scholar] [CrossRef]
- Islam, M.M.; Sado, K. Flood hazard assessment in Bangladesh using NOAA AVHRR data with geographical information system. Hydrol. Process. 2000, 14, 605–620. [Google Scholar] [CrossRef]
- Islam, M.M.; Sado, K. Development of flood hazard maps of Bangladesh using NOAA-AVHRR images with GIS. Hydrol. Sci. J. 2000, 45, 337–355. [Google Scholar] [CrossRef] [Green Version]
- Ma, G.B.; Zhang, J.; Jiang, W.G.; Liu, J.F.; Ma, L.Y. GIS-based risk assessment model for flood disaster in China. In Proceedings of the 2010 18th International Conference on Geoinformatics, Beijing, China, 18–20 June 2010; pp. 1–5. [Google Scholar]
- Zhang, L.; Guo, H.D.; Li, X.W.; Wang, L.Y. Ecosystem assessment in the Tonle Sap Lake region of Cambodia using RADARSAT-2 Wide Fine-mode SAR data. Int. J. Remote Sens. 2014, 35, 2875–2892. [Google Scholar] [CrossRef]
- Saaty, T.L. The Analytic Hierarchy Process: Planning, Priority Setting, Resources Allocation; McGraw: New York, NY, USA, 1980; p. 281. [Google Scholar]
- Hadjimitsis, D.; Agapiou, A.; Alexakis, D.; Sarris, A. Exploring natural and anthropogenic risk for cultural heritage in Cyprus using remote sensing and GIS. Int. J. Digit. Earth 2013, 6, 115–142. [Google Scholar] [CrossRef]
- Okoli, C.; Pawlowski, S.D. The Delphi method as a research tool: An example, design considerations and applications. Inf. Manag. 2015, 42, 15–29. [Google Scholar] [CrossRef]
- Song, G.; Yang, C.M.; Hao, C.; Ran, Y.P. Weights of the value assessment indicators in integrated conservation of modern architectural heritage. J. Appl. Sci. 2014, 14, 580–585. [Google Scholar]
- Danumah, J.H. Assessing Urban Flood Risks under Changing Climate and Land Use in Abidjan District, South Cote d’Ivoire; Kwame Nkrumah University of Science & Technology: Kumasi, Ghana, 2016. [Google Scholar]
- JICA. The Study on Groundwater Development in Southern Cambodia; Draft Final Report (II); Ministry of Rural Development and Kokusai Kogyo Co., Ltd.: Phnom Penh, Cambodia, 1999.
- André, M.F.; Vautier, F.; Voldoire, O.; Roussel, E. Accelerated stone deterioration induced by forest clearance around the Angkor temples. Sci. Total Environ. 2014, 493, 98–108. [Google Scholar] [CrossRef] [PubMed]
- Kummu, M. The natural environment and historical water management of Angkor, Cambodia. In Proceedings of the Fifth World Archeological Congress, Washington, DC, USA, 21–26 June 2003. [Google Scholar]
- Penny, D. The Holocene history and development of the Tonle Sap, Cambodia. Quat. Sci. Rev. 2006, 25, 310–322. [Google Scholar] [CrossRef]
- Engelhardt, R.A. Two thousand years of engineering genius on the Angkor Plain. Exped. Mag. Univ. Pa. 1995, 37, 18–30. [Google Scholar]
- An, C.J.; Niu, Z.D.; Li, Z.J.; Chen, Z.P. Otsu threshold comparison and SAR water segmentation result. J. Electron. Inf. Technol. 2010, 32, 2215–2219. [Google Scholar] [CrossRef]
- Sui, H.G.; Xu, C. Automatic extraction of water in high-resolution SAR images based on multi-scale level set method and otsu algorithm. Prog. Electromagn. Res. 2012, 132, 233–254. [Google Scholar] [CrossRef]
- Hu, D.Y.; Li, J.; Chen, Y.H.; Jiang, W.G. Water and settlement area extraction from single-band, single-polarization SAR images based on SVM method. J. Image Graph. 2008, 13, 257–263. [Google Scholar]
- Lv, W.T.; Yu, Q.Z.; Yu, W.X. Water extraction in SAR images using GLCM and support vector machine. In Proceedings of the IEEE 10th International Conference on Signal Processing Proceedings, Beijing, China, 24–28 October 2010. [Google Scholar]
- Huang, S.F.; Xu, M.; Chen, D.Q. GIS-based extraction of drainage network density and its application to flood hazard analysis. J. Nat. Disasters 2001, 10, 129–132. [Google Scholar]
- Jenks, G.F. The data model concept in statistical mapping. Int. Yearb. Cartogr. 1967, 7, 186–190. [Google Scholar]
- Chen, J.; Yang, S.T.; Li, H.W.; Zhang, B.; Lv, J.R. Research on geographical environment unit division based on the method of natural breaks (Jenks). Remote Sens. Spat. Inf. Sci. 2013, 4, 47–50. [Google Scholar] [CrossRef]
- Negula, I.D.; Sofronie, R.; Virsta, A.; Badea, A. Earth observation for the world cultural and natural heritage. Agric. Agric. Sci. Procedia 2015, 6, 438–445. [Google Scholar] [CrossRef]
- Groslier, B.P. La cité hydraulique angkorienne: Exploitation ou surexploitation du sol? Bull. de l Ecole française d Extrême-Orient 1979, 66, 161–202. [Google Scholar] [CrossRef]
- Groslier, B.P.; Boxer, C.R. Angkor et le Cambodge au XVIe siècle; d’après les Sources Portugaises et Espagnoles; Presses Universitaires de France: Paris, France, 1958. [Google Scholar]
- Evans, D.; Pottier, C.; Fletcher, R.; Hensley, S.; Tapley, L.; Milne, A.; Barbetti, M. A comprehensive archaeological map of the world’s largest preindustrial settlement complex at Angkor, Cambodia. Proc. Natl. Acad. Sci. USA 2007, 104, 14277–14282. [Google Scholar] [CrossRef] [PubMed]
- Fletcher, R.; Pottier, C.; Evans, D.; Kummu, M. The development of the water management system of Angkor: A provisional model. Bull. Indo-Pac. Prehistory Assoc. 2008, 28, 57–66. [Google Scholar] [CrossRef]
- Pekel, J.F.; Cottam, A.; Gorelick, N.; Belward, A.S. High-resolution mapping of global surface water and its long-term changes. Nature 2016, 540, 418–422. [Google Scholar] [CrossRef] [PubMed]
Figure 1.
Location of Angkor (Landsat 8 data acquired on 12 February 2017) with the study area highlighted by the red rectangle. Core zone highlighted by orange layer, buffer zone highlighted by blue layer, protected cultural landscape area highlighted by purple layer.
Figure 1.
Location of Angkor (Landsat 8 data acquired on 12 February 2017) with the study area highlighted by the red rectangle. Core zone highlighted by orange layer, buffer zone highlighted by blue layer, protected cultural landscape area highlighted by purple layer.

Figure 2.
Flow chart of flood hazard assessment at Angkor.

Figure 3.
Pre-processed SAR images: (a–e) are PALSAR images; (f–h) are COSMO-SkyMed images. The portion of flood inundated areas are highlighted by red rectangle.
Figure 3.
Pre-processed SAR images: (a–e) are PALSAR images; (f–h) are COSMO-SkyMed images. The portion of flood inundated areas are highlighted by red rectangle.

Figure 4.
(a) Training samples for the SAR image acquired during dry season of February 2008; (b) Training samples for the SAR images acquired during flood seasons.
Figure 4.
(a) Training samples for the SAR image acquired during dry season of February 2008; (b) Training samples for the SAR images acquired during flood seasons.

Figure 5.
Flood water spatial coverage from 2007 to 2013 (a–g). The Tonle Sap Lake in the lower left corner of the images were removed.
Figure 5.
Flood water spatial coverage from 2007 to 2013 (a–g). The Tonle Sap Lake in the lower left corner of the images were removed.

Figure 6.
The normalized risk index map, (a) flood affected frequency, (b) absolute elevation, (c) elevation standard deviation, (d) drainage density. The greater the value, the higher the possibility of being inundated by a flood.
Figure 6.
The normalized risk index map, (a) flood affected frequency, (b) absolute elevation, (c) elevation standard deviation, (d) drainage density. The greater the value, the higher the possibility of being inundated by a flood.

Figure 7.
Flood hazard assessment map of Angkor.

Figure 8.
Maps showing overlap of the components of the site and those in the buffer zone.

Figure 9.
Map showing overlap of core and buffer zones.

Figure 10.
The locations of 28 points in high hazard zones (red), moderate hazard zones (blue), low hazard zones (yellow).
Figure 10.
The locations of 28 points in high hazard zones (red), moderate hazard zones (blue), low hazard zones (yellow).

Figure 11.
The band values of 28 points in high hazard, moderate hazard, low hazard zones, respectively.
Figure 11.
The band values of 28 points in high hazard, moderate hazard, low hazard zones, respectively.


Table 1.
Meanings of scales 1–9 in the AHP.
| Scale ai,j | Meaning |
|---|---|
| 1 | Index i is equally important as index j. |
| 3 | Index i is slightly more important than index j. |
| 5 | Index i is more important than index j. |
| 7 | Index i is strongly more important than index j. |
| 9 | Index i is absolutely more important than index j. |
| 2, 4, 6, 8 | The comparison of the importance of index i and index j lies between two levels. For example, the importance of the index with a value of 2 is between level 1 and level 3. |
| Reciprocal | The judgment value obtained by comparing index j with index i is the reciprocal of ai,j. |
Table 2.
Judgment matrix.
| Judgment Index | a1 | a2 | … | |
|---|---|---|---|---|
| a1 | 1 | … | ||
| a2 | 1 | … | ||
| … | … | … | 1 | … |
| … | 1 |
Table 3.
Average random consistency index.
| n | 1 | 2 | 3 | 4 | 5 | 6 | 7 |
|---|---|---|---|---|---|---|---|
| RI | 0 | 0 | 0.58 | 0.90 | 1.12 | 1.24 | 1.32 |
Table 4.
Judgment matrix.
| Judgment Index | Flood Affected Frequency (H1) | Absolute Elevation (H2) | Elevation Standard Deviation (H3) | Drainage Density (H4) |
|---|---|---|---|---|
| Flood affected frequency | 1 | 7/5 | 7/3 | 7/2 |
| Absolute elevation | 5/7 | 1 | 5/3 | 5/2 |
| Elevation standard deviation | 3/7 | 3/5 | 1 | 1 |
| Drainage density | 2/7 | 2/5 | 1 | 1 |
Table 5.
The basic information of seven bands of global surface water dataset.
| Name | Units | Min | Max | Description |
|---|---|---|---|---|
| occurrence | % | 0 | 100 | The frequency with which water was present. |
| change_abs | % | −100 | 100 | Absolute change in occurrence between two epochs: 1984–1999 vs. 2000–2015. |
| change_norm | % | −100 | 100 | Normalized change in occurrence.(epoch1 − epoch2)/(epoch1 + epoch2) × 100 |
| seasonality | % | 0 | 12 | Number of months water is present |
| recurrence | % | 0 | 100 | The frequency with which water from year to year. |
| transition | Categorical classification of change between first and last year. | |||
| max_extent | Binary image containing anywhere water has ever been detected. |
© 2019 by the authors. Licensee MDPI, Basel, Switzerland. This article is an open access article distributed under the terms and conditions of the Creative Commons Attribution (CC BY) license (http://creativecommons.org/licenses/by/4.0/).
Share and Cite
MDPI and ACS Style
Liu, J.; Xu, Z.; Chen, F.; Chen, F.; Zhang, L. Flood Hazard Mapping and Assessment on the Angkor World Heritage Site, Cambodia. Remote Sens. 2019, 11, 98. https://0-doi-org.brum.beds.ac.uk/10.3390/rs11010098
AMA Style
Liu J, Xu Z, Chen F, Chen F, Zhang L. Flood Hazard Mapping and Assessment on the Angkor World Heritage Site, Cambodia. Remote Sensing. 2019; 11(1):98. https://0-doi-org.brum.beds.ac.uk/10.3390/rs11010098
Chicago/Turabian StyleLiu, Jie, Zhiwei Xu, Fulong Chen, Fang Chen, and Lu Zhang. 2019. "Flood Hazard Mapping and Assessment on the Angkor World Heritage Site, Cambodia" Remote Sensing 11, no. 1: 98. https://0-doi-org.brum.beds.ac.uk/10.3390/rs11010098
Note that from the first issue of 2016, this journal uses article numbers instead of page numbers. See further details here.