Article

Spatial Evolution of Prosopis Invasion and its Effects on LULC and Livelihoods in Baringo, Kenya

1
Institute for Climate Change and Adaptation (ICCA), University of Nairobi, P.O. Box 30197, Nairobi, Kenya
2
Kenya Forestry Research Institute (KEFRI), P.O. Box 57-30403, Marigat, Kenya
3
Chuka University, P.O. Box 109-60400, Chuka, Kenya
4
Earth Observation Data Centre for Water Resources Monitoring GmbH (EODC), Franz-Grill-Straße 9, 1030 Vienna, Austria
5
Institute for Surveying, Remote Sensing and Land Information (IVFL), University of Natural Resources and Life Sciences Vienna (BOKU), 1180 Vienna, Austria
6
Centre for Agriculture and Biosciences International (CABI), 2800 Delémont, Switzerland
7
Centre for Development and Environment, University of Bern, 3012 Bern, Switzerland
*
Author to whom correspondence should be addressed.
Remote Sens. 2019, 11(10), 1217; https://0-doi-org.brum.beds.ac.uk/10.3390/rs11101217
Submission received: 24 February 2019 / Revised: 16 April 2019 / Accepted: 8 May 2019 / Published: 22 May 2019

Abstract

:
Woody alien plant species have been deliberately introduced globally in many arid and semi-arid regions, as they can provide services and goods to the rural poor. However, some of these alien trees and shrubs have become invasive over time, with important impacts on biodiversity, ecosystem services, and human well-being. Prosopis was introduced in Baringo County, Kenya, in the 1980s, but since then, it has spread rapidly from the original plantations to new areas. To assess land-use and land-cover (LULC) changes and dynamics in Baringo, we used a combination of dry and wet season Landsat satellite data acquired over a seven-year time interval between 1988–2016, and performed a supervised Random Forest classification. For each time interval, we calculated the extent of Prosopis invasion, rates of spread, gains and losses of specific LULC classes, and the relative importance of Prosopis invasion on LULC changes. The overall accuracy and kappa coefficients of the LULC classifications ranged between 98.1–98.5% and 0.93–0.96, respectively. We found that Prosopis coverage increased from 882 ha in 1988 to 18,792 ha in 2016. The highest negative changes in LULC classes were found for grasslands (−6252 ha; −86%), irrigated cropland (−849 ha; −57%), Vachellia tortilis-dominated vegetation (−3602 ha; −42%), and rainfed cropland (−1432 ha; −37%). Prosopis invasion alone directly accounted for over 30% of these negative changes, suggesting that Prosopis invasion is a key driver of the observed LULC changes in Baringo County. Although the management of Prosopis by utilization has been promoted in Baringo for 10–15 years, the spread of Prosopis has not stopped or slowed down. This suggests that Prosopis management in Baringo and other invaded areas in East Africa needs to be based on a more integrated approach.

Graphical Abstract

1. Introduction

Woody alien plant species have been deliberately introduced in many arid and semi-arid regions of the world, as they can provide services and goods to the rural poor. Many of these have become invasive and continue to invade new regions at an unprecedented rate, exerting strong impacts on ecosystems and human welfare [1,2]. These species are a major threat to the environment, because they can: (1) suppress or replace native biodiversity, (2) alter ecosystem functions and services, and (3) cause significant economic damage, costing economies millions of dollars [3].
African arid and semi-arid lands (ASALs) were severely degraded by the prolonged Sahelian drought of the 1970s [4,5,6], which prompted the prioritization of tree planting. In Kenya, species from the South and Central American genus Prosopis were selected for screening because they had shown potential in the rehabilitation of quarries [7,8]. Prosopis spp., also known as Mesquite and locally as ‘Mathenge’ or ‘Promi’, are perennial, multi-stemmed shrubby or single-canopy trees [9] which are nitrogen-fixing and tolerant to arid conditions [10]. In the 1980s, Prosopis juliflora (Sw.) DC., Prosopis pallida (Willd.), and Prosopis chilensis (Molina) Stuntz were planted in Baringo County [11]. The planted Prosopis trees were initially appreciated due to their ability to grow in degraded and barren landscapes where native vegetation could not grow, thus reducing soil erosion and dust storms, while providing shade and pods that served as fodder for livestock [12,13]. However, over time, trees of the evergreen Prosopis julifloraProsopis pallida complex [9] (hereafter called Prosopis) escaped cultivation and became unmanageable due to their fast proliferation and ability to survive cutting by coppicing [14].
Recently, the analysis of plant invasions at the landscape level has received considerable attention because the spatial and temporal invasion patterns can be correlated to proximate causes [15,16]. This has allowed the quantification of rates and patterns of spread and the assessment of efficiency of different management practices [17,18]. The early detection and mapping of invasive species are essential to formulating effective management strategies and preventing further spread into non-invaded lands [19]. As such, remote sensing (RS) offers cost-efficient means to assess the distribution of alien plant species and monitor their spread [20] while allowing monitoring areas that are inaccessible.
Very High Resolution (VHS) sensors, which collect data at metric or sub-metric resolution, can provide very high accuracy data for landscape change analysis and can distinguish Prosopis from native tree species, such as Vachellia tortilis [17,21,22,23]. However, these data can’t be used to study historical changes of Prosopis cover, as the data are tasked, and the archives do not date back to early introduction periods (e.g., to the 1980s). Therefore, we must rely on satellite data that have been captured over a long time and in a consistent manner, such as the Landsat or the moderate-resolution imaging spectroradiometer (MODIS) missions. Several studies have used such satellite data to capture spatiotemporal Prosopis distribution in various regions in Africa. Van den Berg et al. [24] assessed Prosopis invasion in South Africa by combining MODIS data with soil and terrain data. Shiferaw et al. [16] used Landsat 8 Surface Reflectance, Climate Data, topographic, and landscape structure data to assess Prosopis invasion over time in Afar, Ethiopia.
In Kenya, Kyuma [25] mapped the spatiotemporal changes in Prosopis distribution between 2000–2013 in the southern part of Kenya using MODIS NDVI and net primary productivity products at 250m spatial resolution. Other studies, although not spatiotemporal in nature, mapped P. juliflora using Landsat 8 imagery and ground information [26,27], and evaluated the effectiveness in Landsat 8 data to map Prosopis in Somaliland.
These examples show that the mapping and monitoring of Prosopis invasion has received increasing attention in the last years in Africa. However, a reliable estimate of the spatial evolution and dynamics of Prosopis invasion and its effects on the land-use/land-cover dynamics, and thus on rural livelihoods, is currently lacking for Kenya and other parts of the invaded range. A better understanding of the invasion process and the current distribution of Prosopis in Baringo would be particularly revealing, as it would also help evaluate what extent the ‘management by utilization’ approach, which has been promoted in this county for the last 10–15 years [28,29], has slowed down or even stopped Prosopis invasion.
Thus, in this study, we aim at enhancing the understanding of the spatial evolution and dynamics of Prosopis invasion in Marigat subregion, which is the most heavily invaded subregion in Baringo County, by assessing its distribution in regular time intervals, calculating rates of spread, and analyzing which LULC classes are the most affected. Our study builds on the work of [30], who assessed LULC changes in the same area. Besides assessing LULC changes, we investigated how an exotic woody plant invaded, and the role that it played in fueling further LULC changes in the area. In order to achieve these goals, we use a time-series of multispectral and bi-seasonal Landsat data in combination with other important auxiliary data, and apply a novel machine learning classifier. A rigorous validation procedure makes sure that the obtained classification results are of high accuracy and allow for an accurate multi-temporal change analysis.

2. Materials and Methods
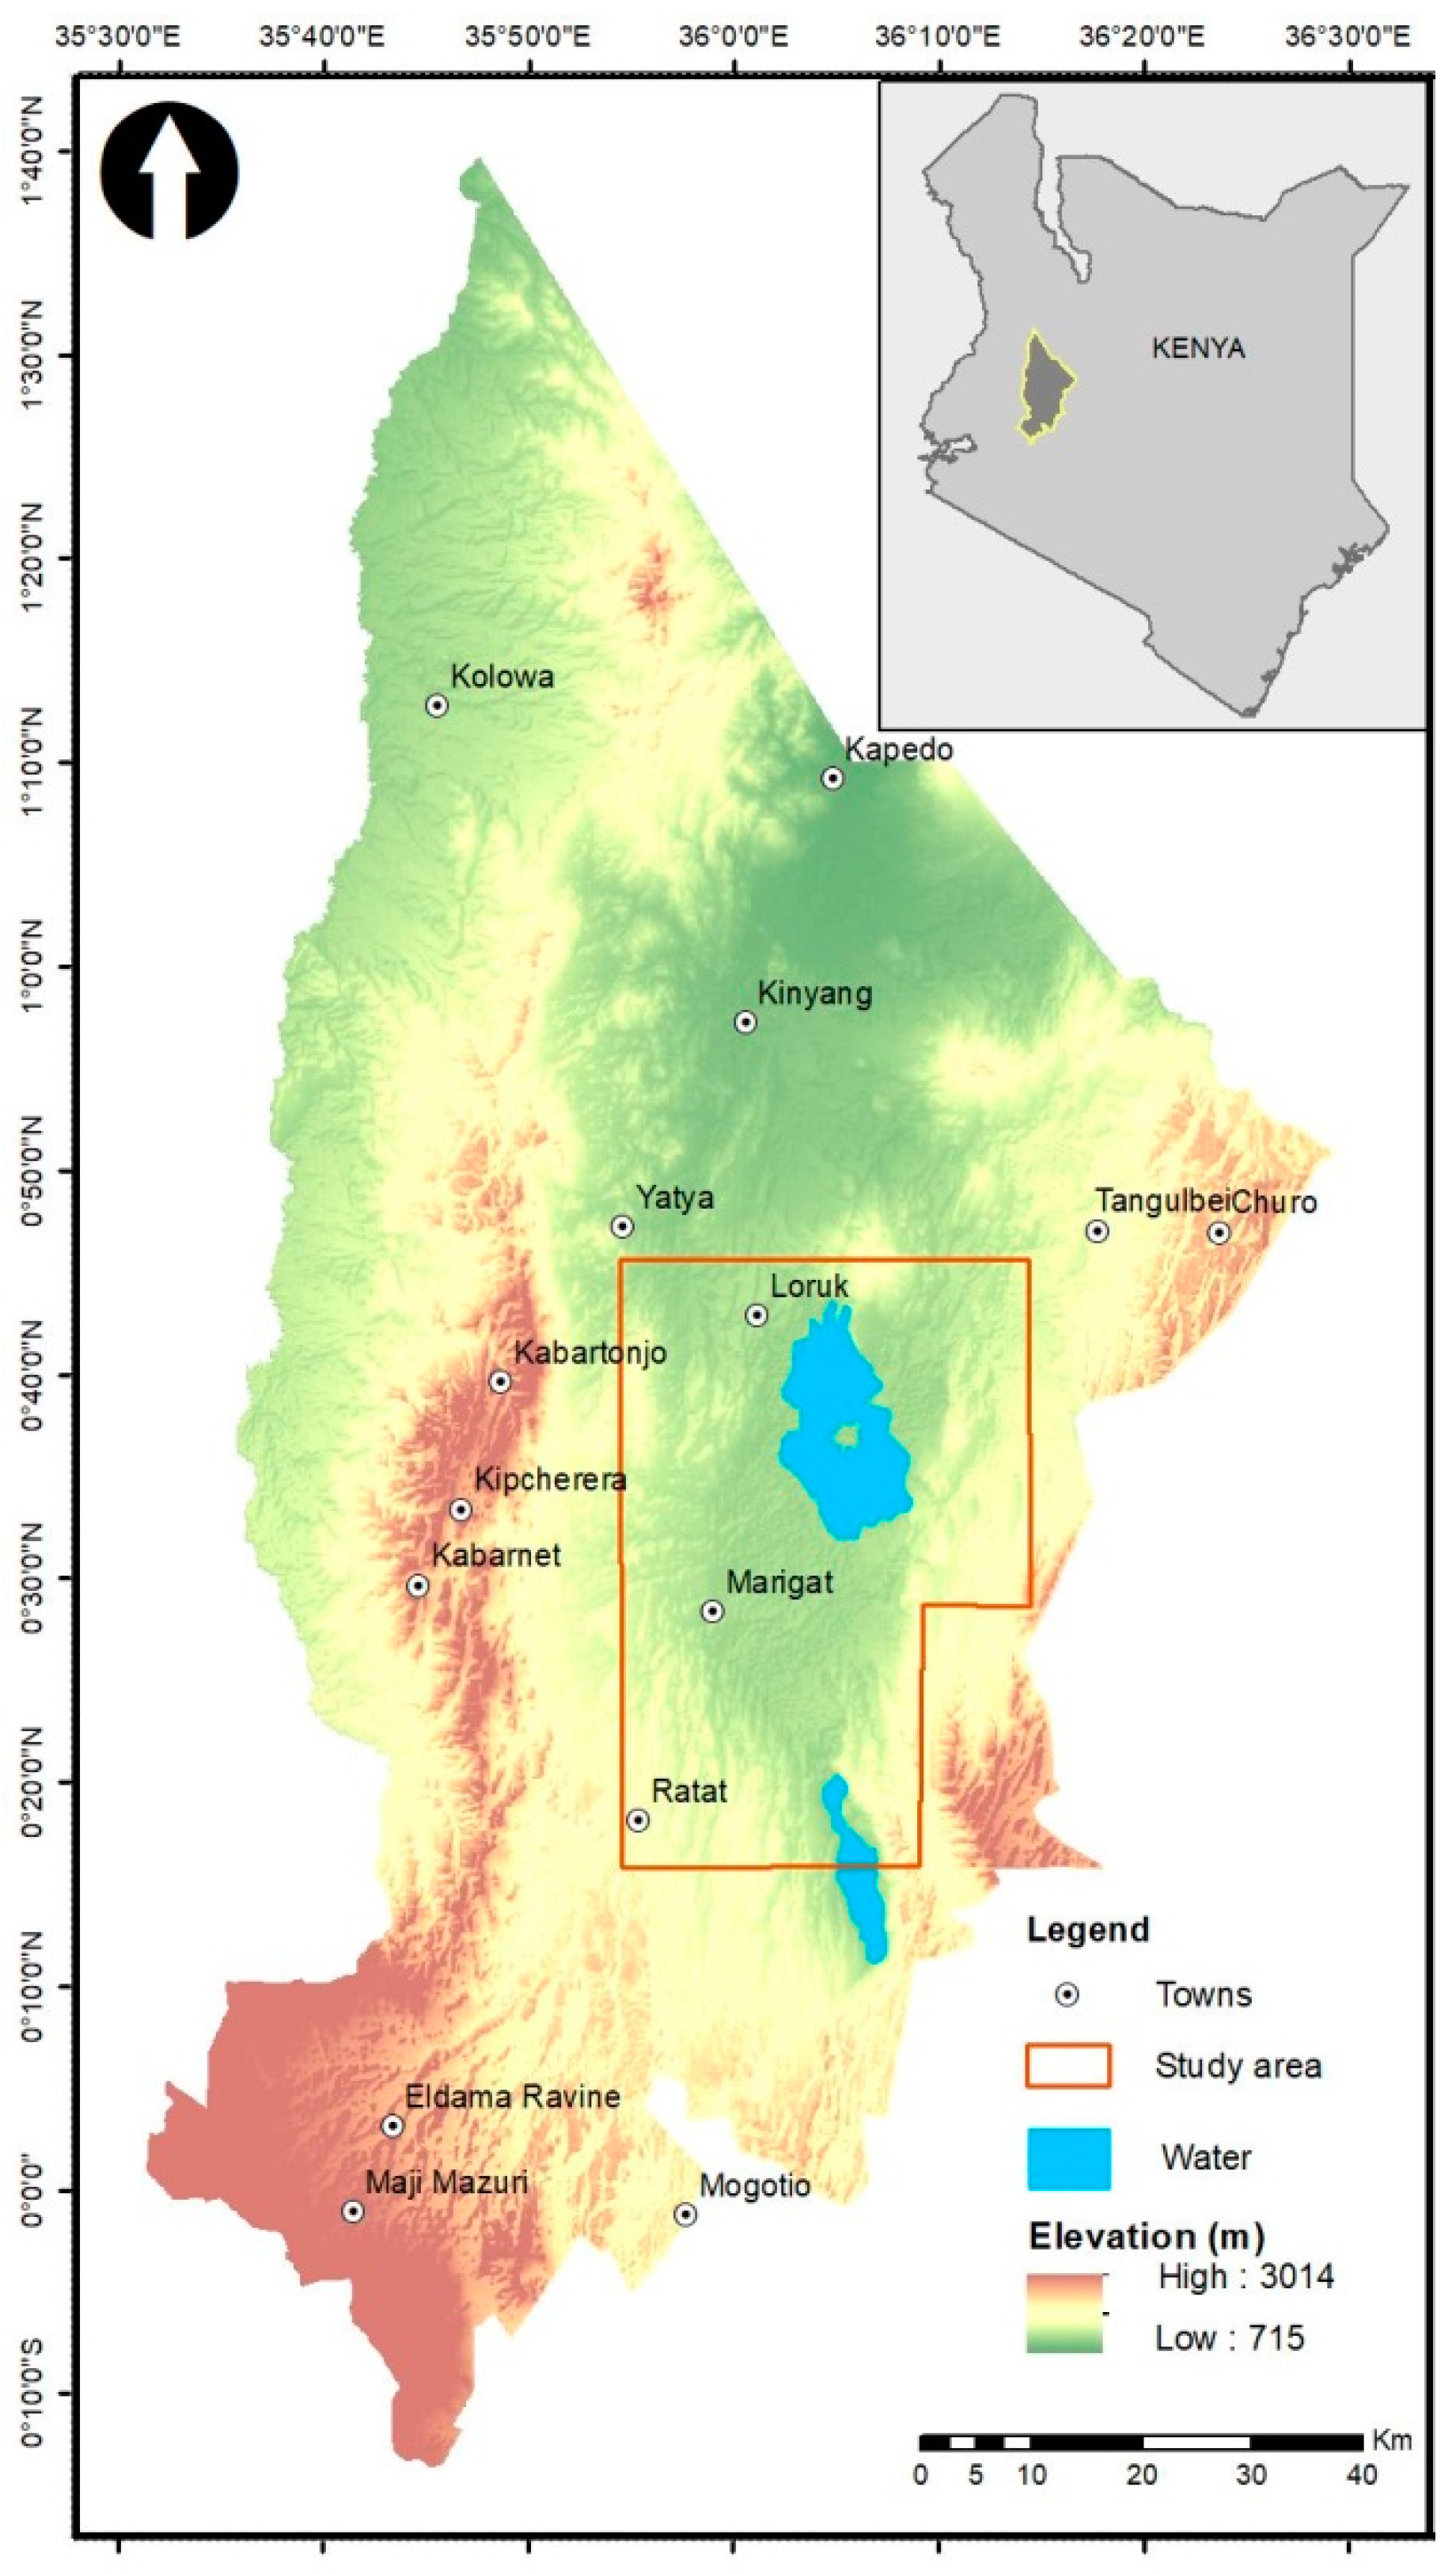
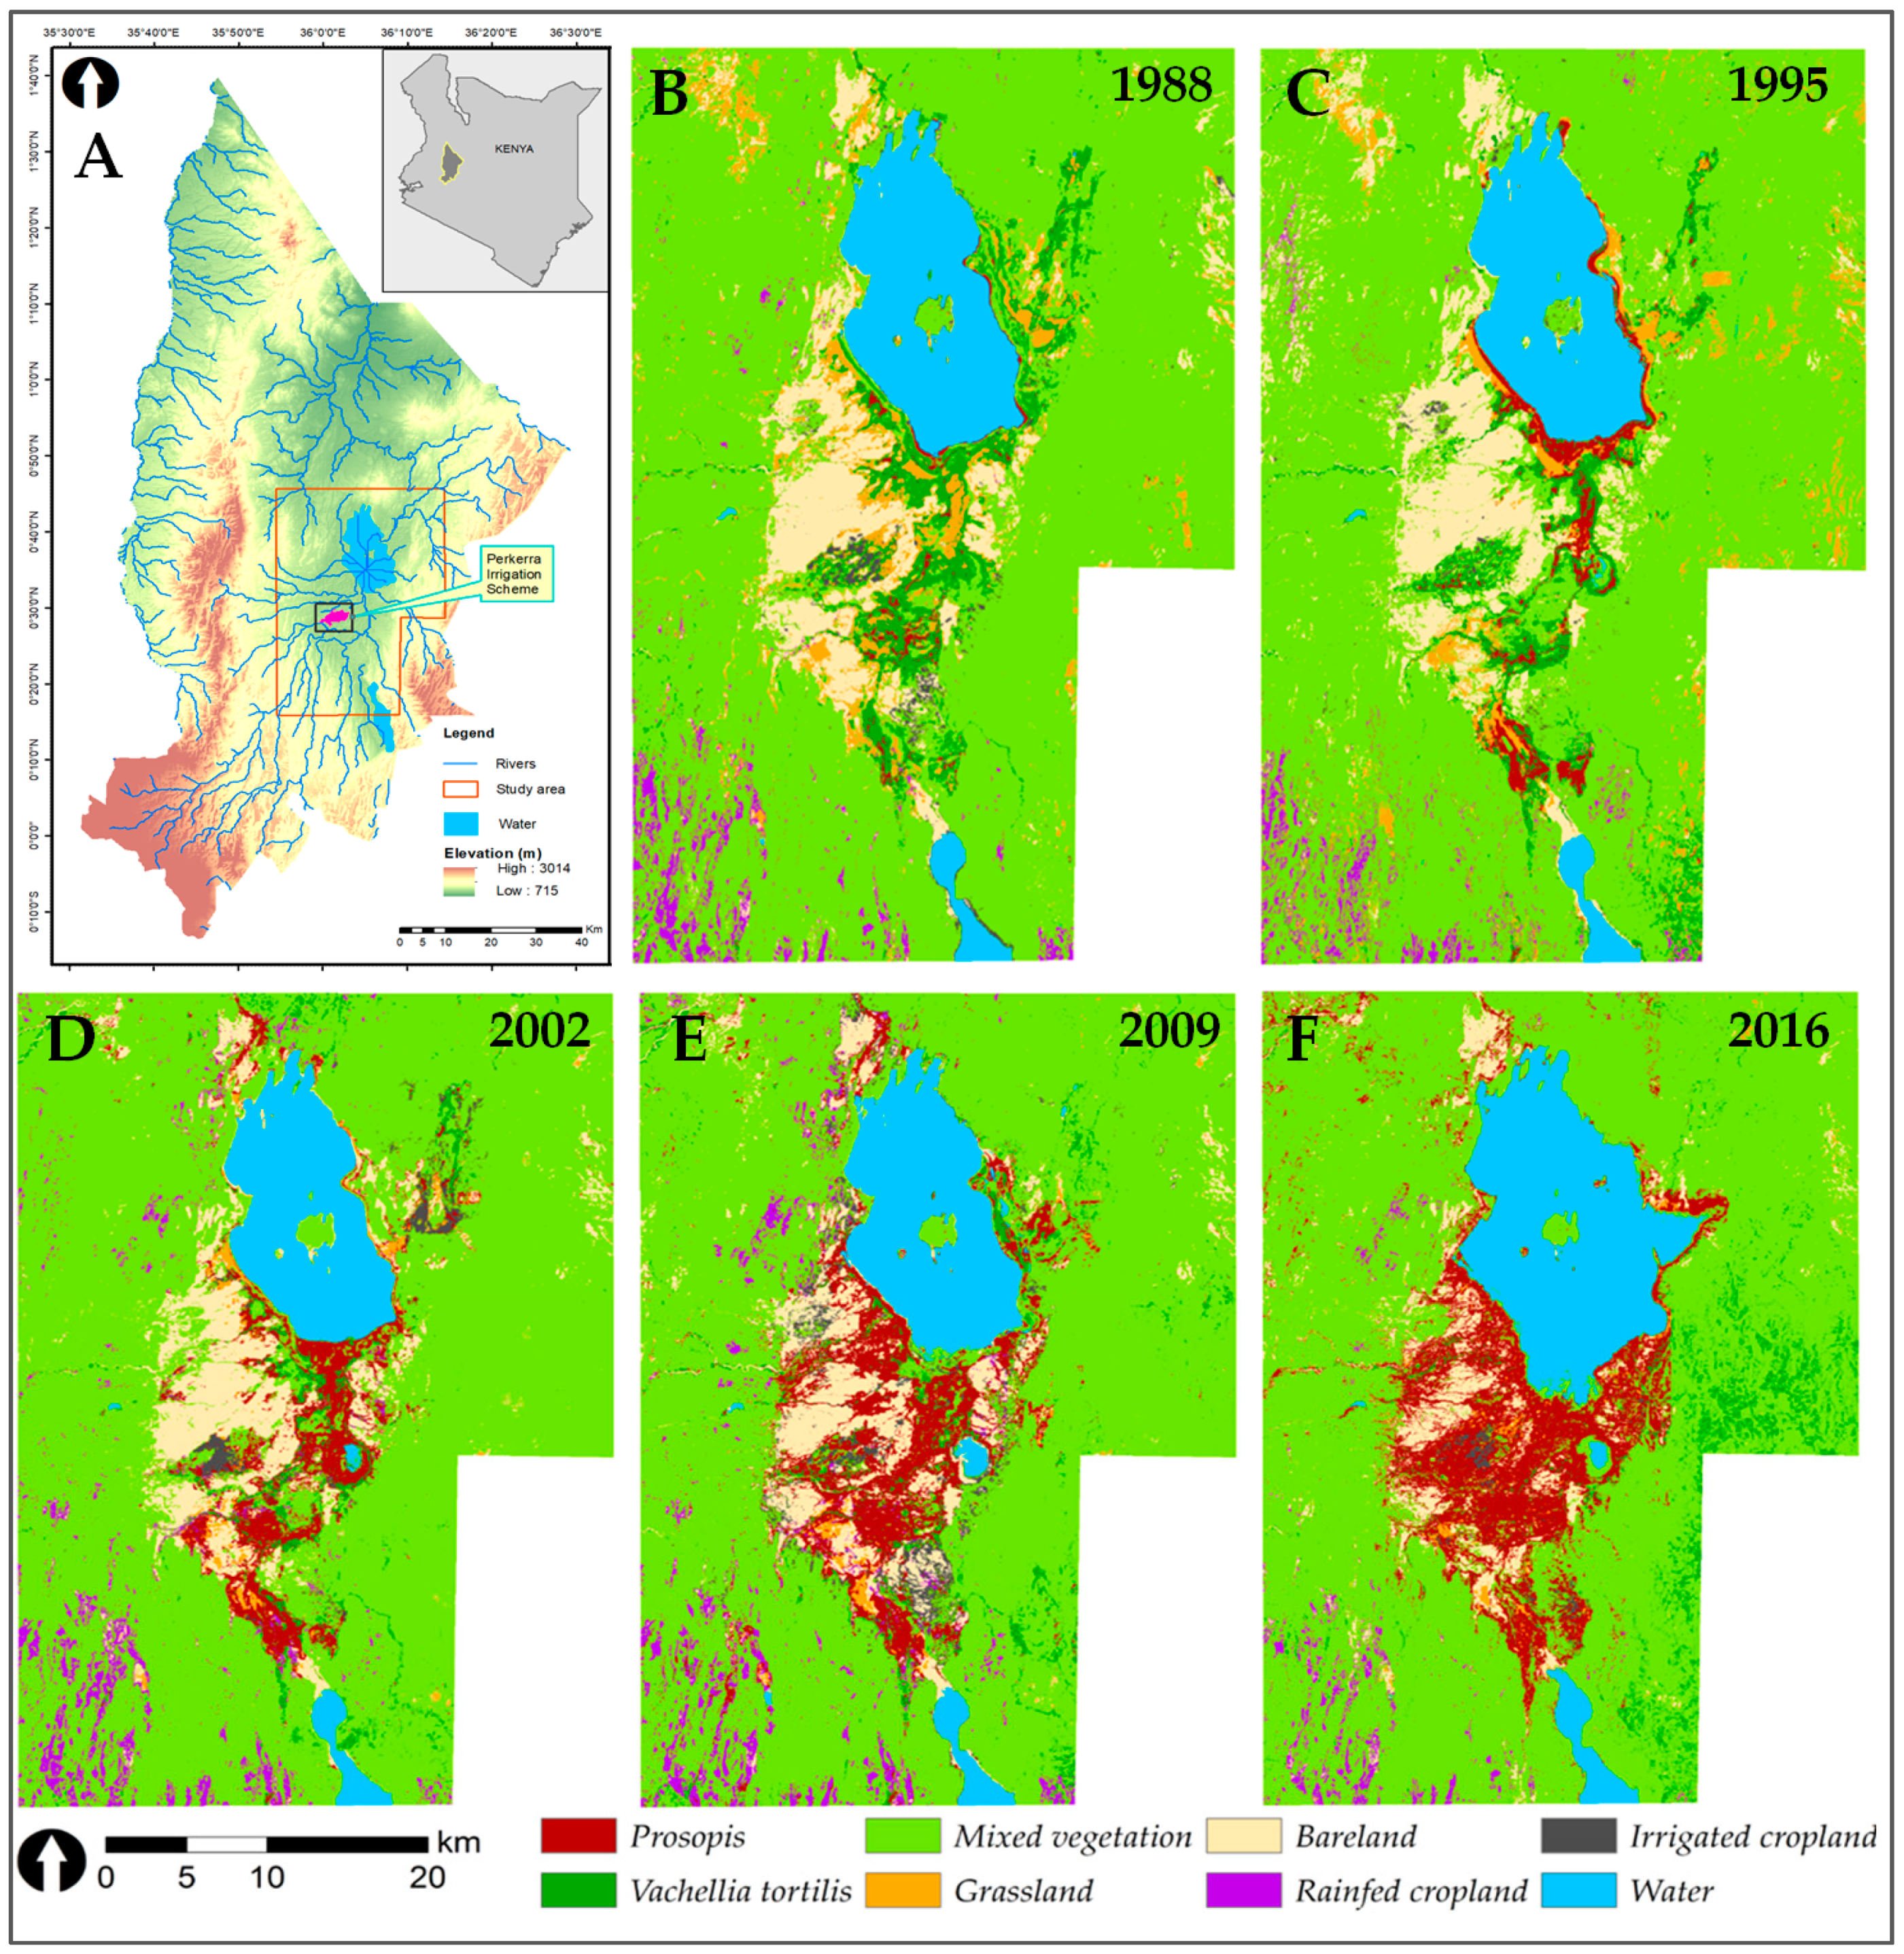
2.1. Study Area

This study was conducted in Baringo County, located along the Great Rift Valley system in Kenya (large map, Figure 1). It is characterized by a unique combination of altitude, precipitation, soil, and vegetation. The lowland “Njemps flats” are slightly undulating and dominated by rangeland, with an average altitude of 700 m above sea level. They are surrounded by Laikipia Escarpment on the east and Tugen Hills and Elgeyo Escarpment on the west, as well as the ridges and plateaus of the Lake Baringo catchment with peaks of over 3000 m a.s.l. [31]. The Tugen Hills form a conspicuous topographic feature which trends north–south and mainly consists of volcanic rocks. The steep slopes on escarpments end down the valleys forming prominent gullies and very deep gorges. The total annual precipitation is between 1000–1500 mm in the highlands [31] and between 300–700 mm in the lowlands, and is characterized by a bimodal distribution with two peaks in April and November [32]. Temperatures range from 10 °C to 35 °C. Presently, the vegetation is predominantly a woody mixture of indigenous and exotic species. It ranges from Vachellia-dominated deciduous shrubland on the valley floor to the evergreen forests in the highlands [33]. Prosopis juliflora currently dominates the lowland flats around the mid-east and mid-west of Lake Baringo and further stretching southwards up the northern tip of Lake Bogoria [10,21,31,33]. Historically, the flat parts in the lowlands of Baringo County consisted of a mosaic of grasslands and Vachellia-dominated shrubland [34,35].
Prosopis was introduced at these lowland zones between 1982–1983 through the Fuelwood Afforestation Extension Project [36,37]. The major objective of the project was to involve local communities in tree planting for mitigating problems such as lack of firewood and desertification [36]. In total, more than 20 plantations were established, covering an area of over 250 ha [10].
Our study area (red polygon area, Figure 1) focuses on the Marigat subregion because a) it is the zone where Prosopis was first introduced and invasion progress can be observed, b) Baringo County has three distinct eco-regions, but Prosopis is predominantly found in the lowlands, and c) because the most important LULC classes for local communities’ livelihoods are concentrated in this zone, while the surrounding hilly and rocky escarpments are predominantly arid and have limited ecosystem services to offer. To analyze the relevant LULC changes, we focused on the LULC classes that are present in the invasion hotspot region around Lake Baringo and toward Lake Bogoria.

2.2. Assessment of Land-Use and Land-Cover Changes

2.2.1. Field Reference Data

Field reference data were collected in the field between October 2015 and June 2016, which is a period that cuts across the dry and wet seasons. Reference points distributed across the study area were collected using a handheld GPS receiver. For the historical imagery, reference data was collected by the visual interpretation of VHR satellite imagery available via Google Earth Pro [38]—details are provided in Supplementary Materials SI2—by visual interpretation of the Landsat satellite data itself in combination with field verification from local long-term residents familiar with the study area and its historic LULC. The selection of reference data was also highly informed by the distinct species occurrence characteristics such as along rivers, roads, vegetation differentiation because of elevation and soil types, homogeneity, and contiguity. Being a semi-arid zone, the vegetation is scanty; this is largely associated with historical degradation in the study area [30], which is a factor that enhanced identification. Additionally, the dominant vegetation is the generic species of Vachellia and Prosopis. Their identification was enhanced by seasonality as described in Section 2.2.2. For historical dates where VHR was not available, we heavily relied on local expert knowledge and vegetation occurrence characteristics to collect reference data. After the visual interpretation, we digitized small polygons, i.e., regions of interest (ROIs) for each LULC class (Supplementary Materials SI2). We performed a classification on 13 LULC classes that were later aggregated to eight classes. ‘Mixed vegetation’, for example, is an aggregation of several landscape components (i.e., sub-classes). The criteria for aggregation were informed by our study objectives and the LULC present in the invaded areas. The defined classes are presented and described in Table 1. We did not include settlements because the area is sparsely populated, and settlements are pastoral in nature; they are small semi-permanent structures that are generally not easily identifiable on 30m Landsat data.

2.2.2. Satellite Data Selection and Pre-processing

This study focuses on a period between 1988–2016, for which Landsat satellite data with a spatial resolution of 30m were available. We chose cloud-free good quality imagery of 1988 (base year) because before this date, Prosopis was barely visible on Landsat data, and invaded areas were small and mostly within the plantations’ perimeter.
We downloaded Landsat data from the Landsat Surface Reflectance Climate Data Record (Landsat CDR), which has been atmospherically corrected [39,40]. For all Landsat datasets, we selected the bands blue, green, red, near infrared (nir), as well as the two shortwave infrared bands (swir1 and swir2). In consideration of the limitation posed by multispectral sensors such as Landsat in mapping vegetation species, we enhanced the ability of our data to detect the species in our study area by additionally calculating the normalized difference vegetation index (NDVI) for both the dry and wet season. NDVI is a ratio-based index, which introduces information about biophysical properties, thereby increasing the separability of landscape components [41]. We considered both the dry and wet season because our study context is a semi-arid zone with two distinct seasons. The choice of the two periods allowed the maximization of the spectral differences between Prosopis and other native vegetation such as the dominant Vachellia spp. and seasonal herbaceous vegetation. Prosopis is evergreen, unlike the deciduous Vachellia; hence, it tends to maintain a higher vigor and canopy than the native vegetation during the dry season [26]. Per temporal step, satellite images were selected between January and March for the dry season, and between April and August for the wet season (Table 2). To further improve our data in each combined dataset, we also included the digital elevation model generated by the Shuttle Radar Topography Mission (SRTM). In the study region, Prosopis grows exclusively at elevations below 1500 m a.s.l [42]. In total, we created five data stacks consisting of 15 bands each. Pre-processing included mosaicking, cloud masking, and the stacking of dry and wet season bands. To ensure optimal data quality, we manually selected the best images; the main criteria were (i) the acquisitions date, and (ii) the absence of cloud cover.

2.2.3. Classification of Satellite Data

For classification, we used the Random Forest (RF) algorithm, which we implemented using the function provided in the randomForest package in R statistical software version 3.4.4 [43,44]. RF is a non-parametric machine learning algorithm that consists of an ensemble of randomly grown trees, whereby predictions are made by each individual tree, which are then averaged [45]. Each tree is grown using a different random bootstrap sample with two-thirds used for building the random forest model, and one-third used for estimating the prediction and the associated error, which is also known as the ‘out-of-bag’ (OOB) error [46,47,48]. Once the RF model is built using reliable reference samples for training, the RF model can then be applied to the data to be classified. In this study, we generated a model for each point in time. We used 70% of the manually delineated ROIs described in Section 2.2.1 for training each RF model, and then applied it to the corresponding satellite data stack. Nearly one-third (30%) of training samples were used for validation purposes. For each RF model, we used 1000 trees. All the other arguments of the randomForest function were kept at the default setting [48].

2.2.4. Accuracy Assessment

Besides the calculation of the OOB, we performed an additional and independent 10-fold cross-validation accuracy assessment. Cross-validation (CV) is a robust statistical method that is used to evaluate the model accuracy by dividing the reference data into a training and a validation set. It assumes that data are identically distributed and that training and validation samples are independent [47]. In k-fold cross-validation, data are first randomly partitioned into k equally (or nearly equally) sized folds. Subsequently, k iterations of training and validation are performed such that within each iteration, a different fold of the data is used for validation, while the remaining k-1 folds are used for learning [49]. The validation is performed on a pixel level, so that each pixel inside a validation polygon is compared with the reference class. Then, the k results from the folds can be combined to produce a single estimation. In this study, we ran a 10-fold cross-validation, where the training dataset was randomly split 10 times with 90% for training and 10% for validation, respectively. Then, the 10 results for each classification were summarized, and confusion matrices were generated for the calculation of overall, users’, and producers’ accuracies (OA, UA, PA) as well as Cohen’s kappa (K). Cross-validation was performed independently for each of the five classification outputs.

2.3. Land-Use and Land-Cover Change Analysis

We assessed LULC change by creating cross-tabulation matrices for the intervals from 1988 to 1995, 1995 to 2002, 2002 to 2009, 2009 to 2016, and 1988 to 2016, and subsequently calculated gains, losses, net changes, and rates of change. LULC gains and losses were visualized using charts and tables. In addition, interval-specific Prosopis areal coverage and invasion rates were determined. To determine how Prosopis invasion impacted individual LULC and at which time interval, the net changes per class per time interval were derived from subtracting the contributions of each class to Prosopis (Losses to P) from their respective gains from Prosopis (Gains from P).
To understand the invasion pattern originating from the initial plantations, we analyzed change statistics and visually assessed the LULC maps. Knowledge of seasonal socio-economic activities such as irrigation farming, charcoal production, and flood events also informed the interpretation of the change output and distribution patterns. This knowledge was acquired through field observations, focus group discussions, and interactions with the host community.

3. Results

Random Forest classifier achieved acceptable to good producer’s and user’s accuracies of above 70% for all classes, except for V. tortilis (Forssk) Galasso and Banfi in 2016 (PA = 53.5%) and for Prosopis in 2002 (PA = 64.8%). Overall accuracy ranged between 98.1–98.5%. The kappa coefficient ranged between 0.93–0.96. Generally, the highest accuracies were realized for the 2016 classification, and the lowest accuracies were realized for the 1988 classification (Tables S1–S5: Supplementary Materials).

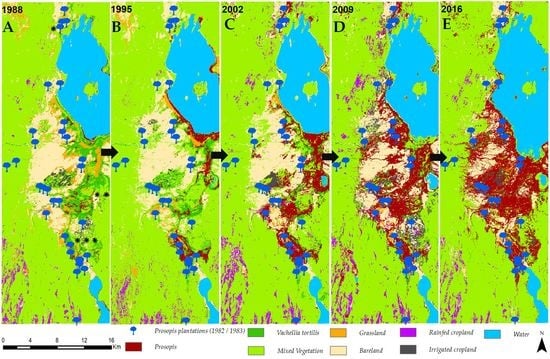
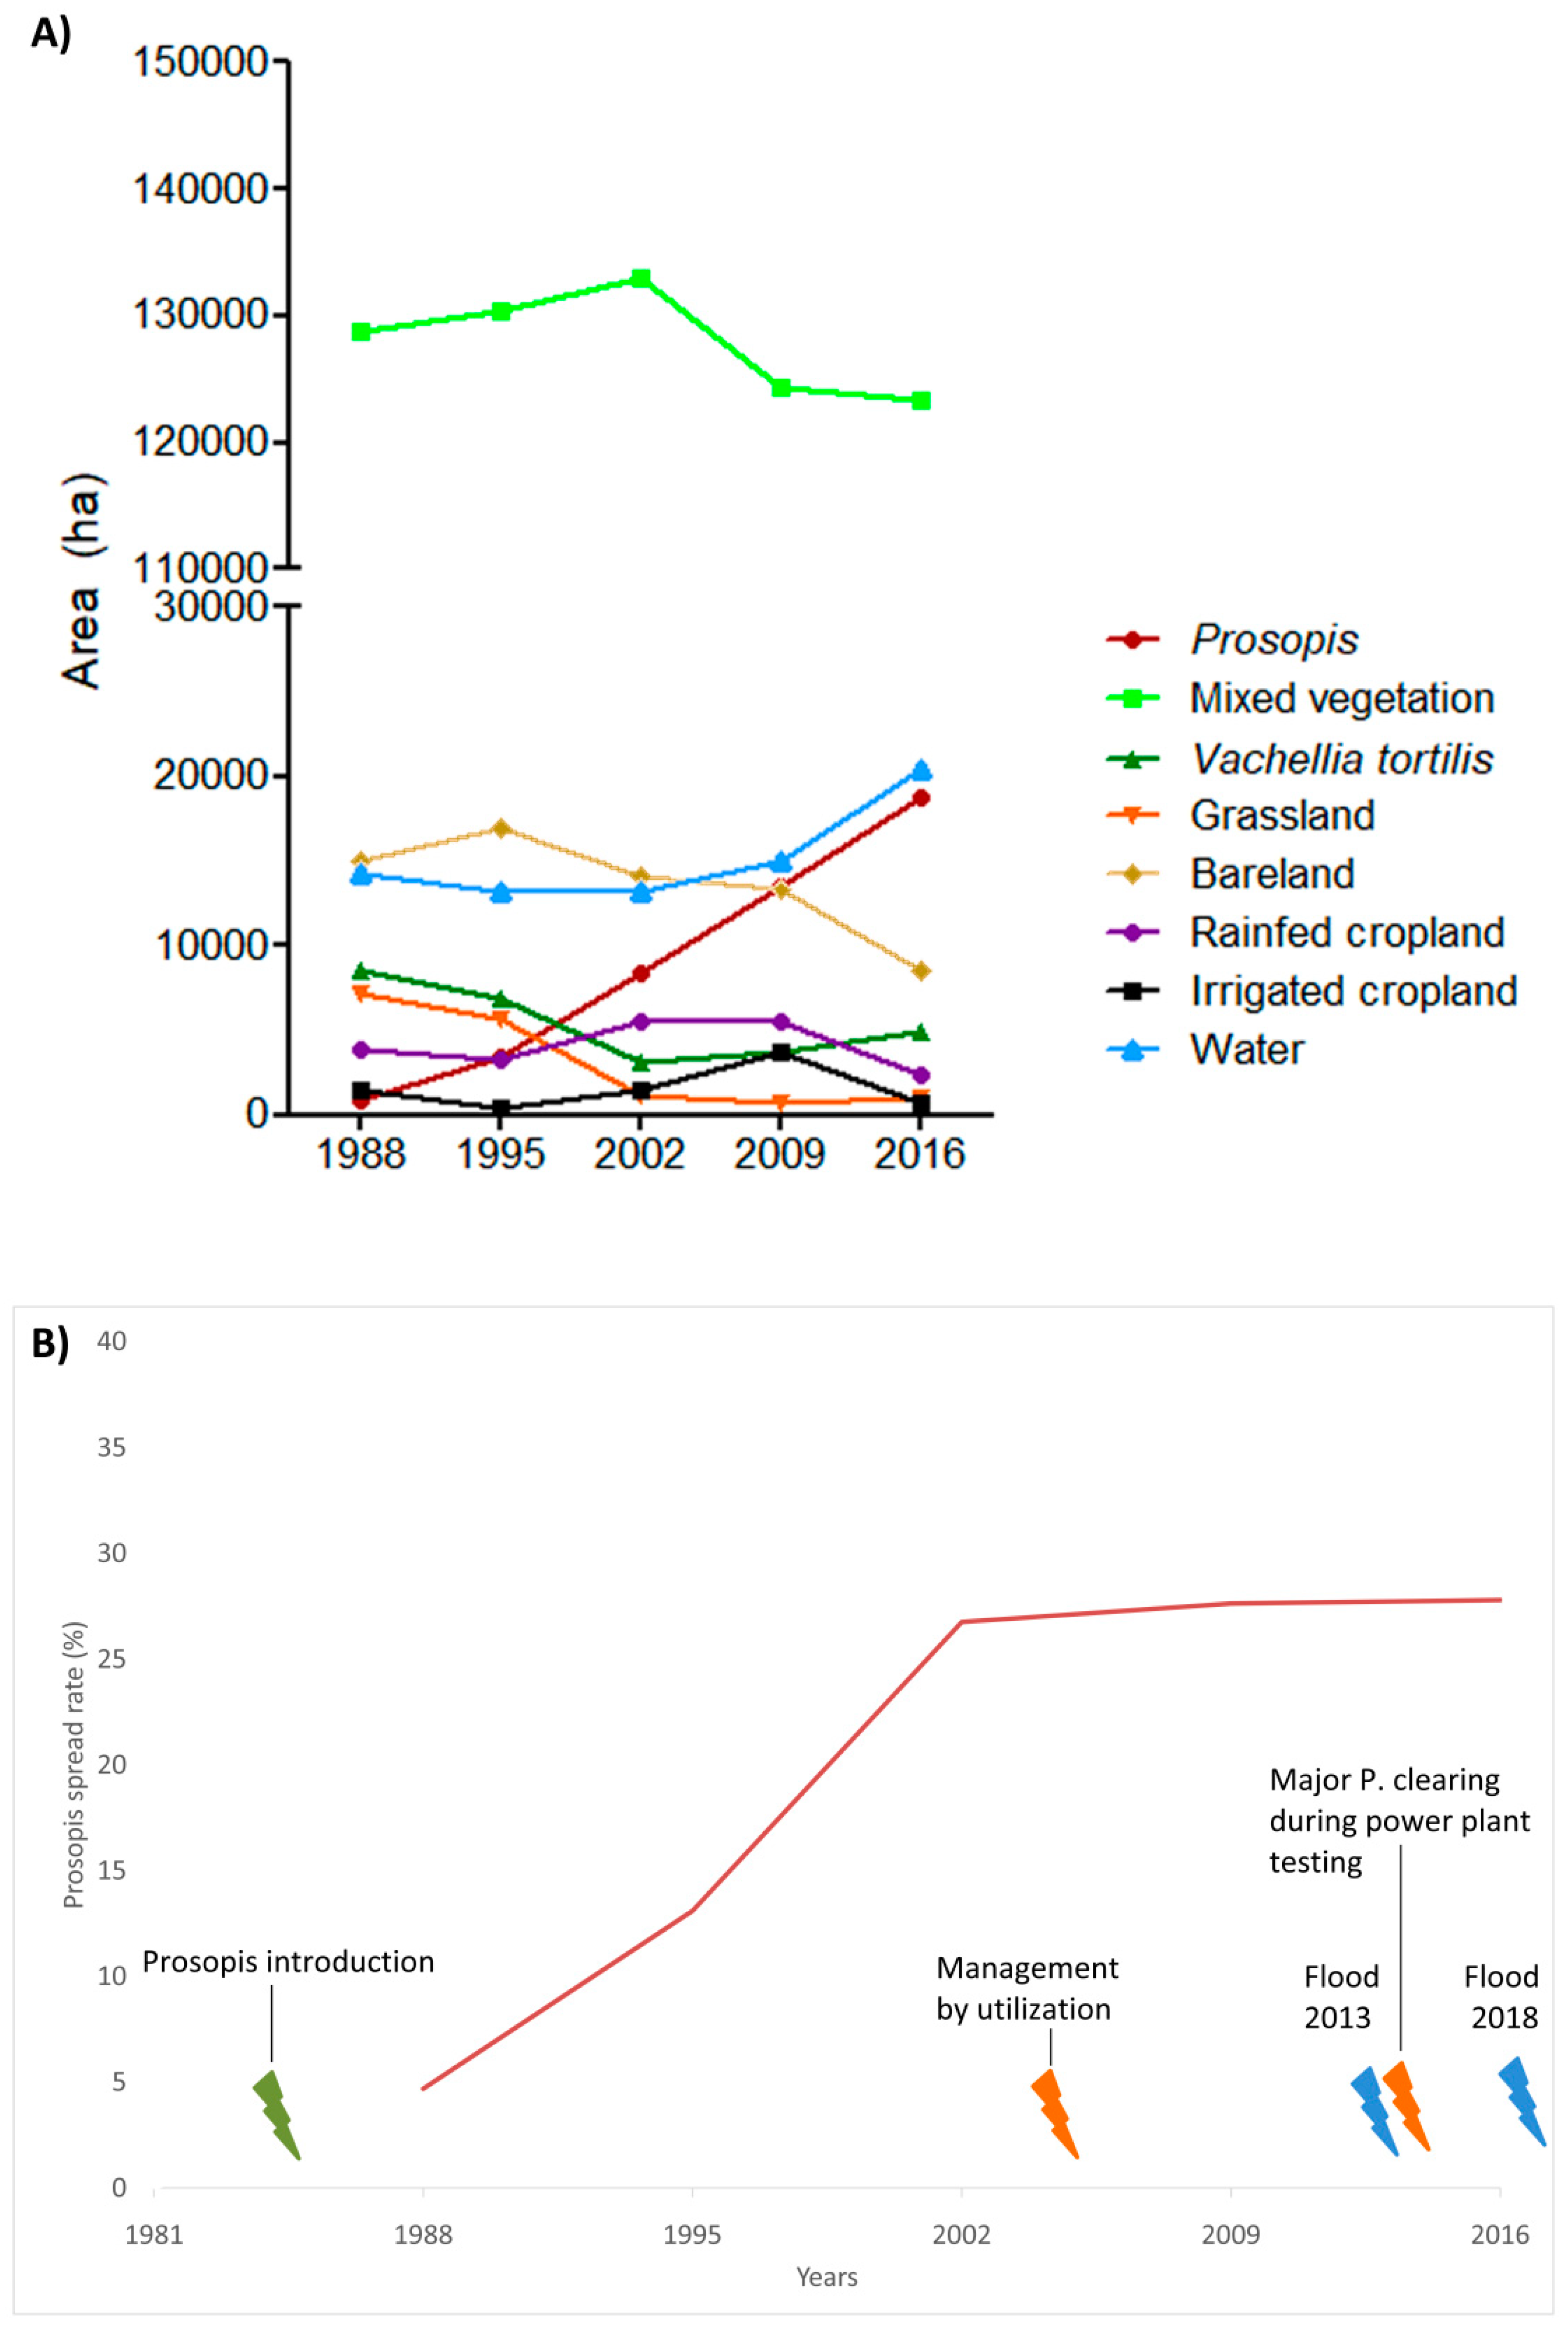
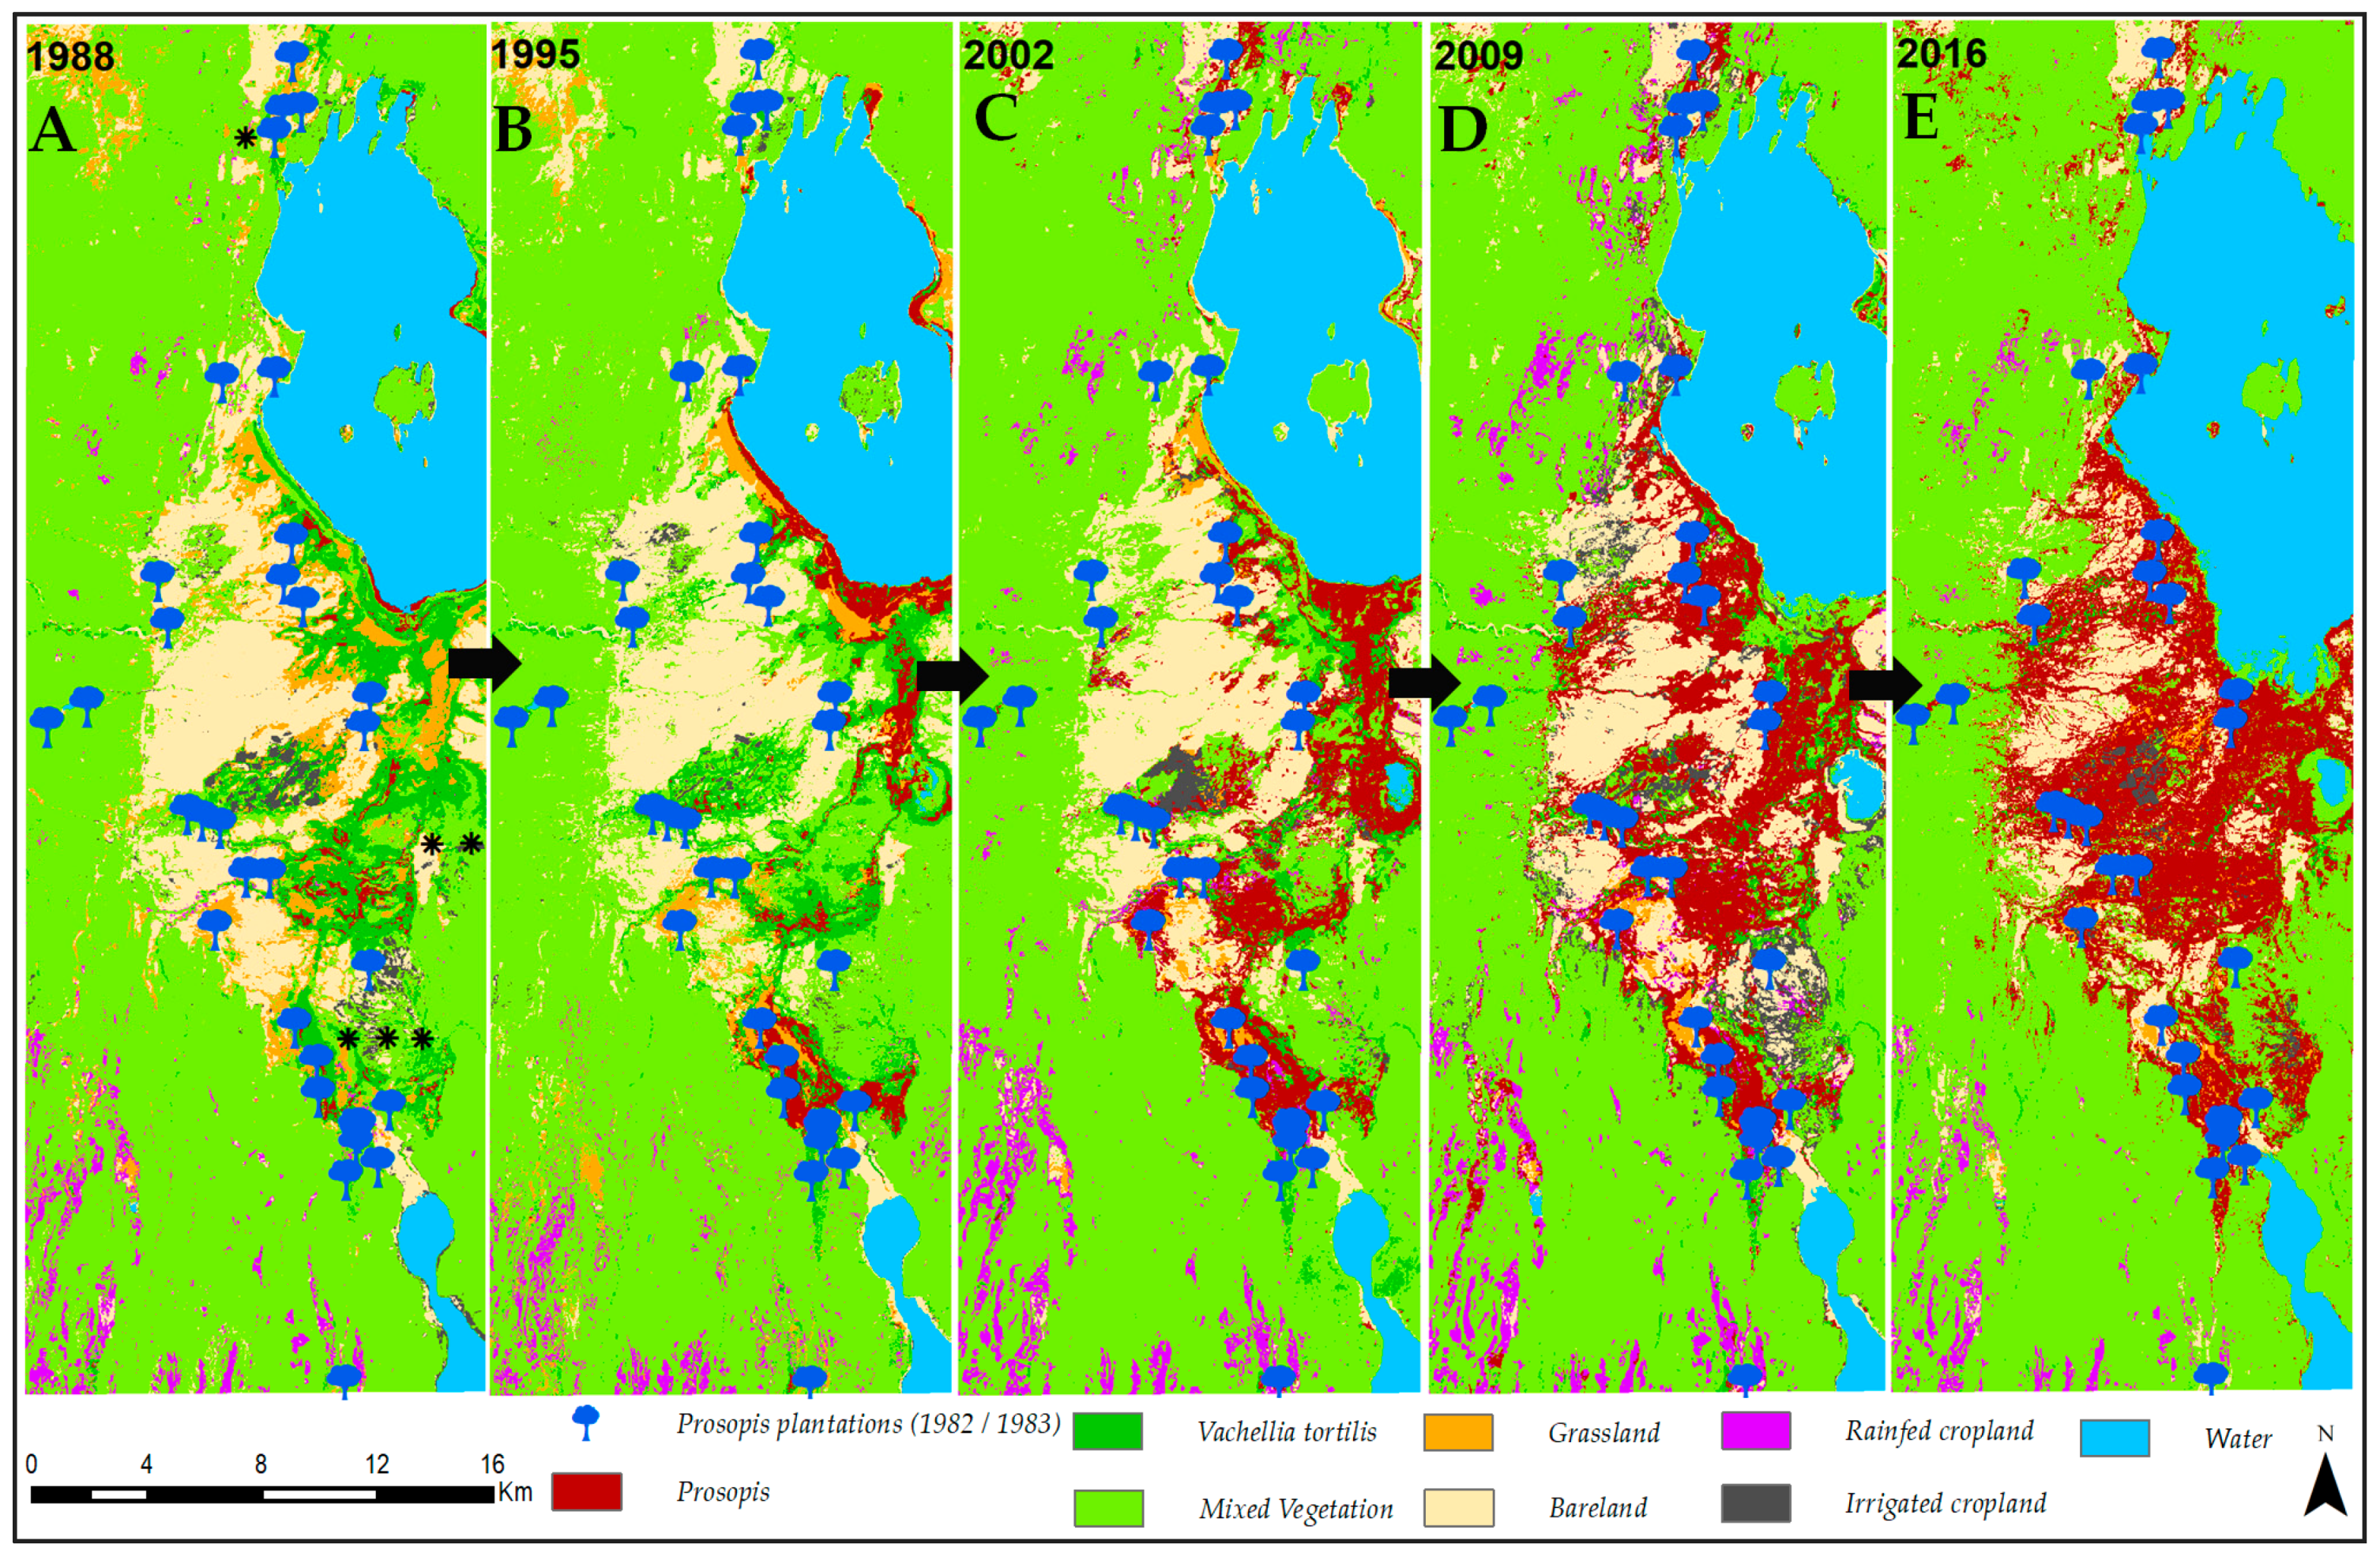
3.1. Invasion History of Prosopis from 1988 to 2016

In 1988, the dominant LULCs in the 180,000-ha large study area were mixed vegetation and bareland at 71.5% and 8.3% of total study area, respectively (Figure 2). At that time, there was subtle Prosopis coverage mainly on the shores of Lake Baringo and a few Prosopis patches in the Eldume and Kailer sublocations. Initially, the prominent invasion pathways were mostly along the rivers (i.e., Molo, Perkerra, Loboi, Endao, Lembus, Chemeron, and Sandai), road networks, and irrigation canals (Figure 2B). In Figure 2C, an invasion corridor from Lake Baringo southwards to Lake Bogoria through the water marshes (that currently form Lake 94, which is located between lakes Baringo and Bogoria) and the riparian zones of rivers draining into the lakes can be identified. From this corridor, Prosopis continued to spread into the surrounding areas, covering largely bareland predominantly on the south and southwestern zones of Lake Baringo. This led to the invasion of the Perkerra irrigation scheme (indicated in Figure 2A), which is a key agricultural facility that was established during the colonial times in the 1950s. In contrast to the rapid spread of Prosopis in the southeastern part of the study area, its spread toward the northern and eastern zones of Lake Baringo appears to be considerably slower.
Over the study period, there was a sharp and steady increase in Prosopis coverage, from 882 ha in 1988 to 18,792 ha in 2016 (Table 3, Figure 3A,B). However, Prosopis did not spread at the same rate over that time (Figure 3). The rate in the seven-year intervals increased continuously from 4.7% until 1988 to 13.1% in 1995 and stabilized at around 27% since 2002. This can be translated into a yearly spread rate of 3.8–4.0% per year since 2002.

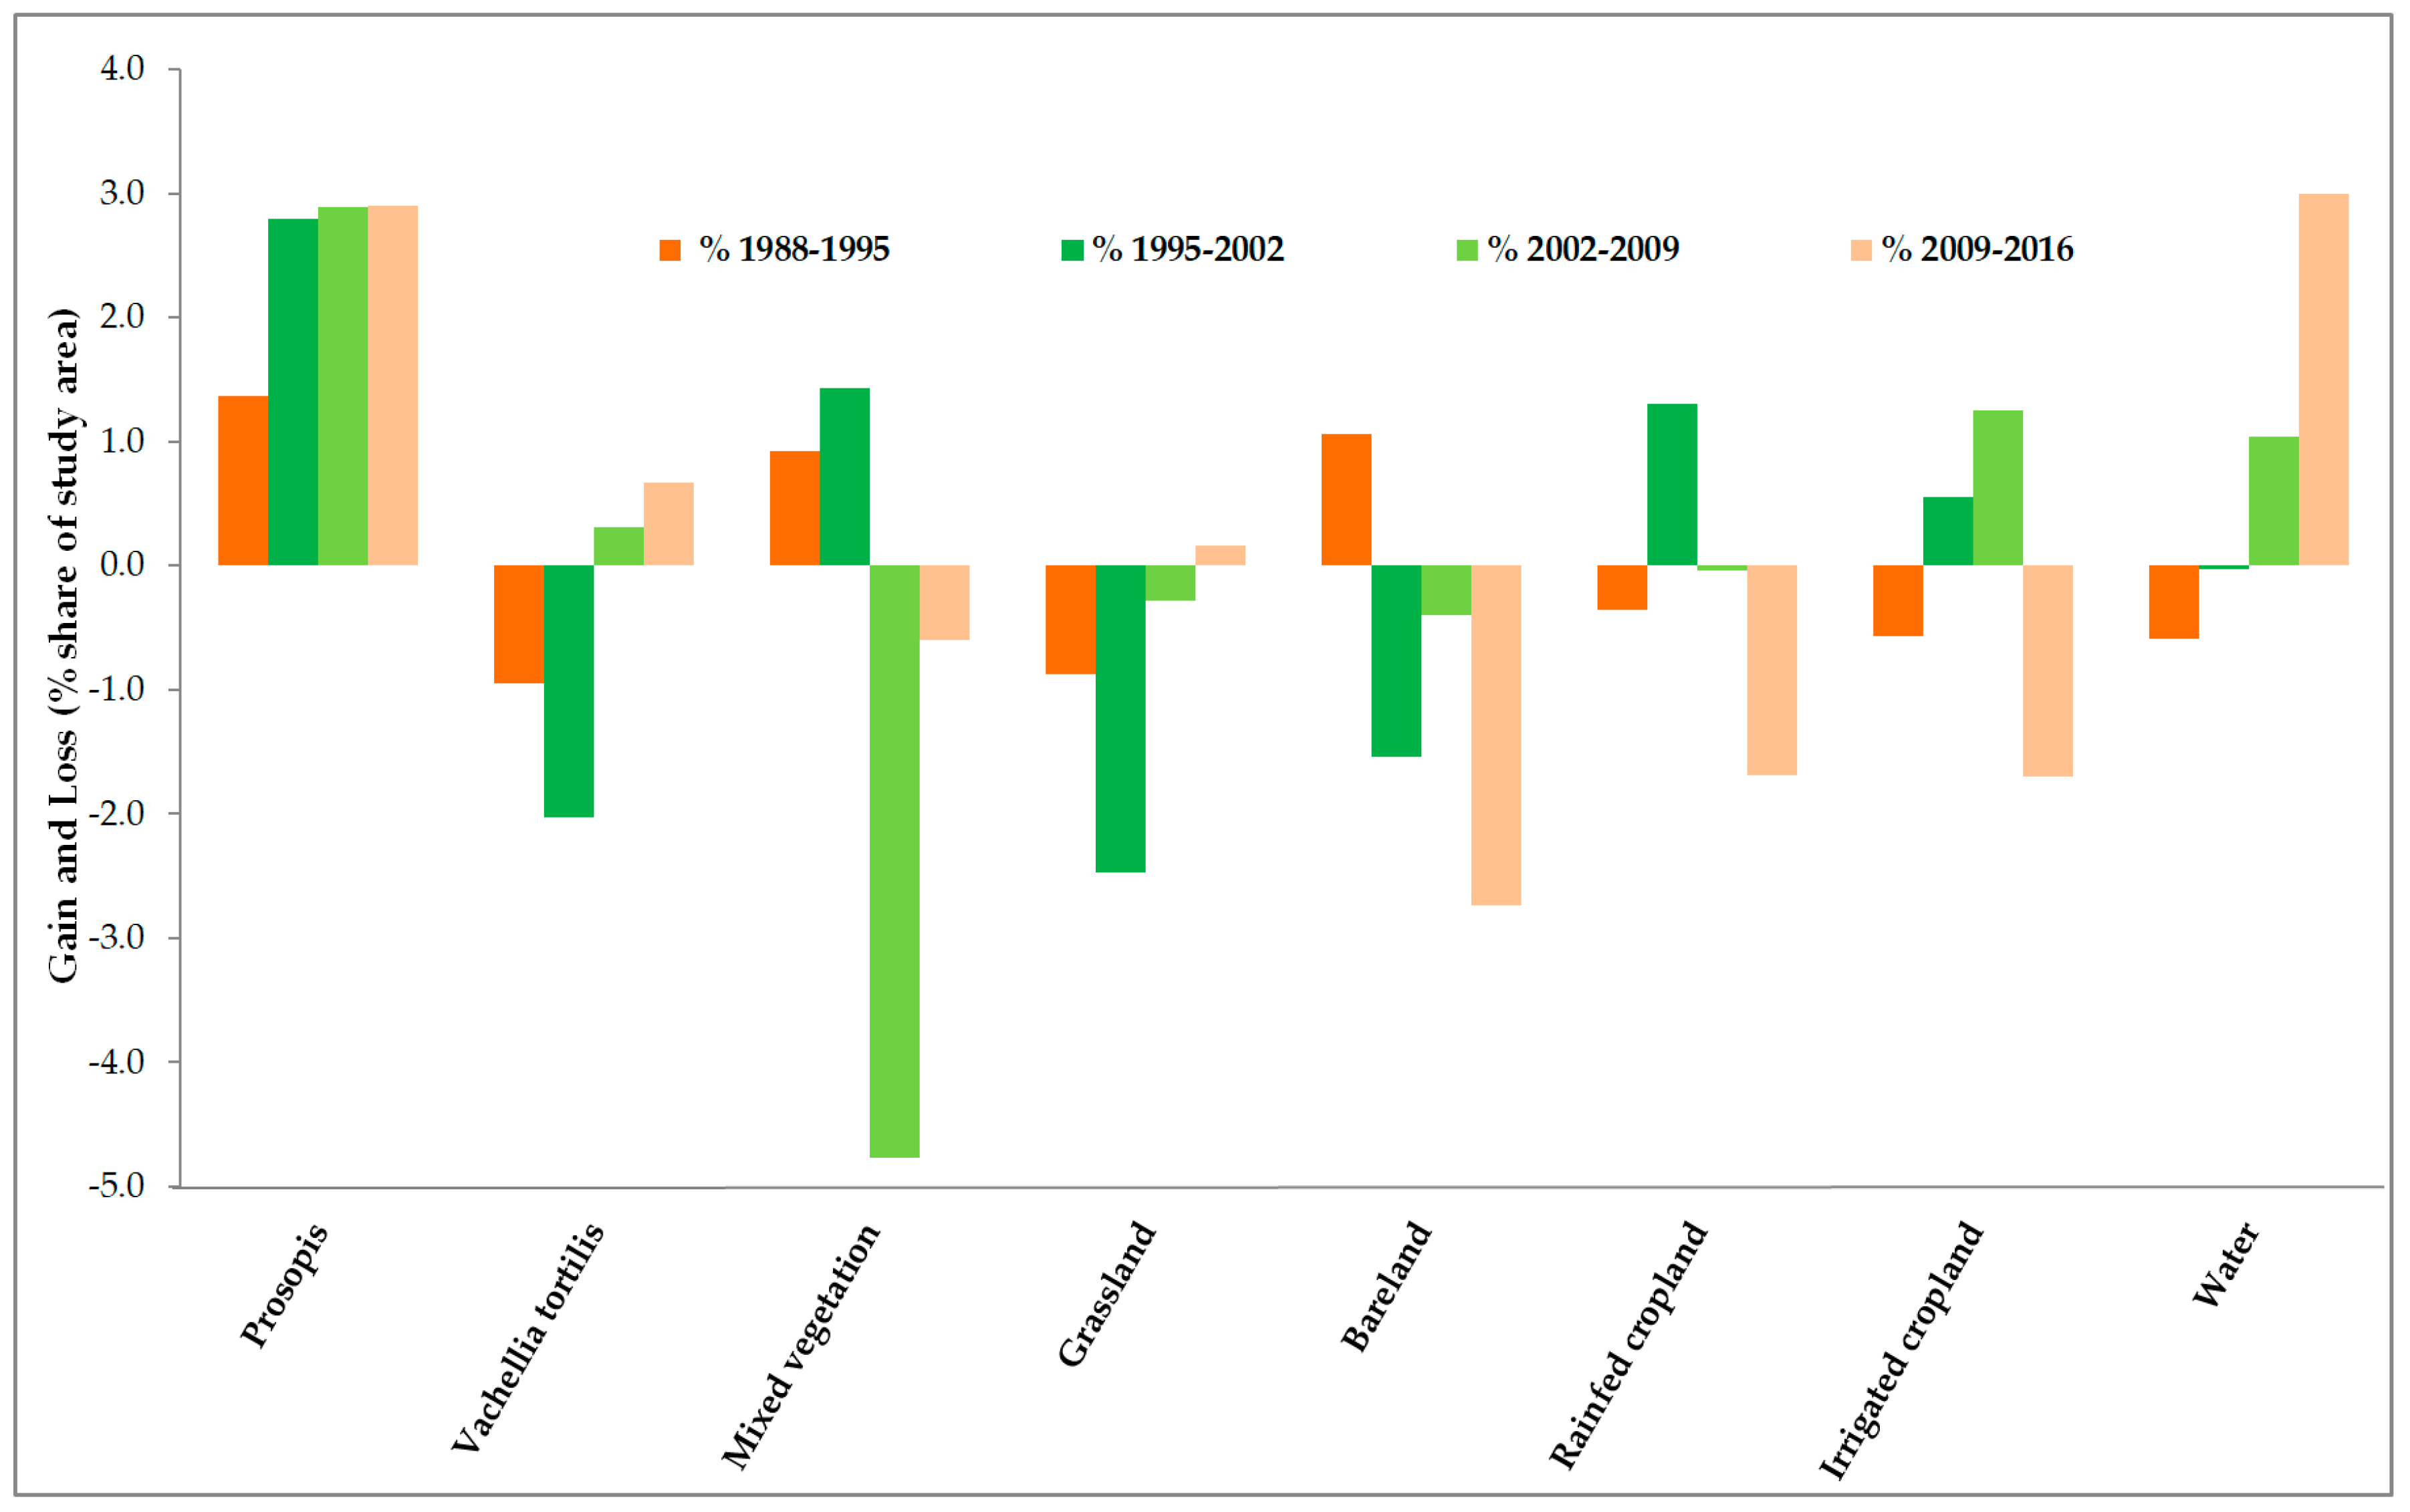
3.2. Land-Use and Land-Cover Changes between 1988 and 2016

During the 28-year period, two of the eight LULC classes (Prosopis and water) increased in spatial coverage by 2031% and 42%, respectively, while the rest decreased (Table 4 and Figure 3A). Increases in the Prosopis invaded area is more or less constant since 1995, and was not affected by the implementation of ‘management by utilization’ and the flooding event in 2013 (Figure 3A,B). Water levels first declined, but started to increase again since 2009 (Figure 3A).
Overall, the highest losses were found in grasslands by 86%, followed by irrigated cropland at 57%, bareland at 43%, V. tortilis at 42%, rainfed cropland at 37%, and the least was mixed vegetation at 4% (Table 4). However, some the classes that generally declined also showed some spontaneous slight increases during certain intervals such as bareland in 1995, croplands in 2002 and 2009, and V. tortilis in 2016 (Figure 4). Prosopis showed a steady increase across all the intervals (Table 4 and Figure 3A and Figure 4). In the early years (1988–2002) of invasion, the most affected LULCs were V. tortilis (–5359 ha) and grasslands (–6035 ha) which are key resources for pastoralists, while in the latter years (2002–2016), mixed vegetation (–9659 ha), bareland (–5626 ha), rainfed cropland (–3123 ha), and irrigated cropland (–811 ha), registered the most changes (Figure 3A).

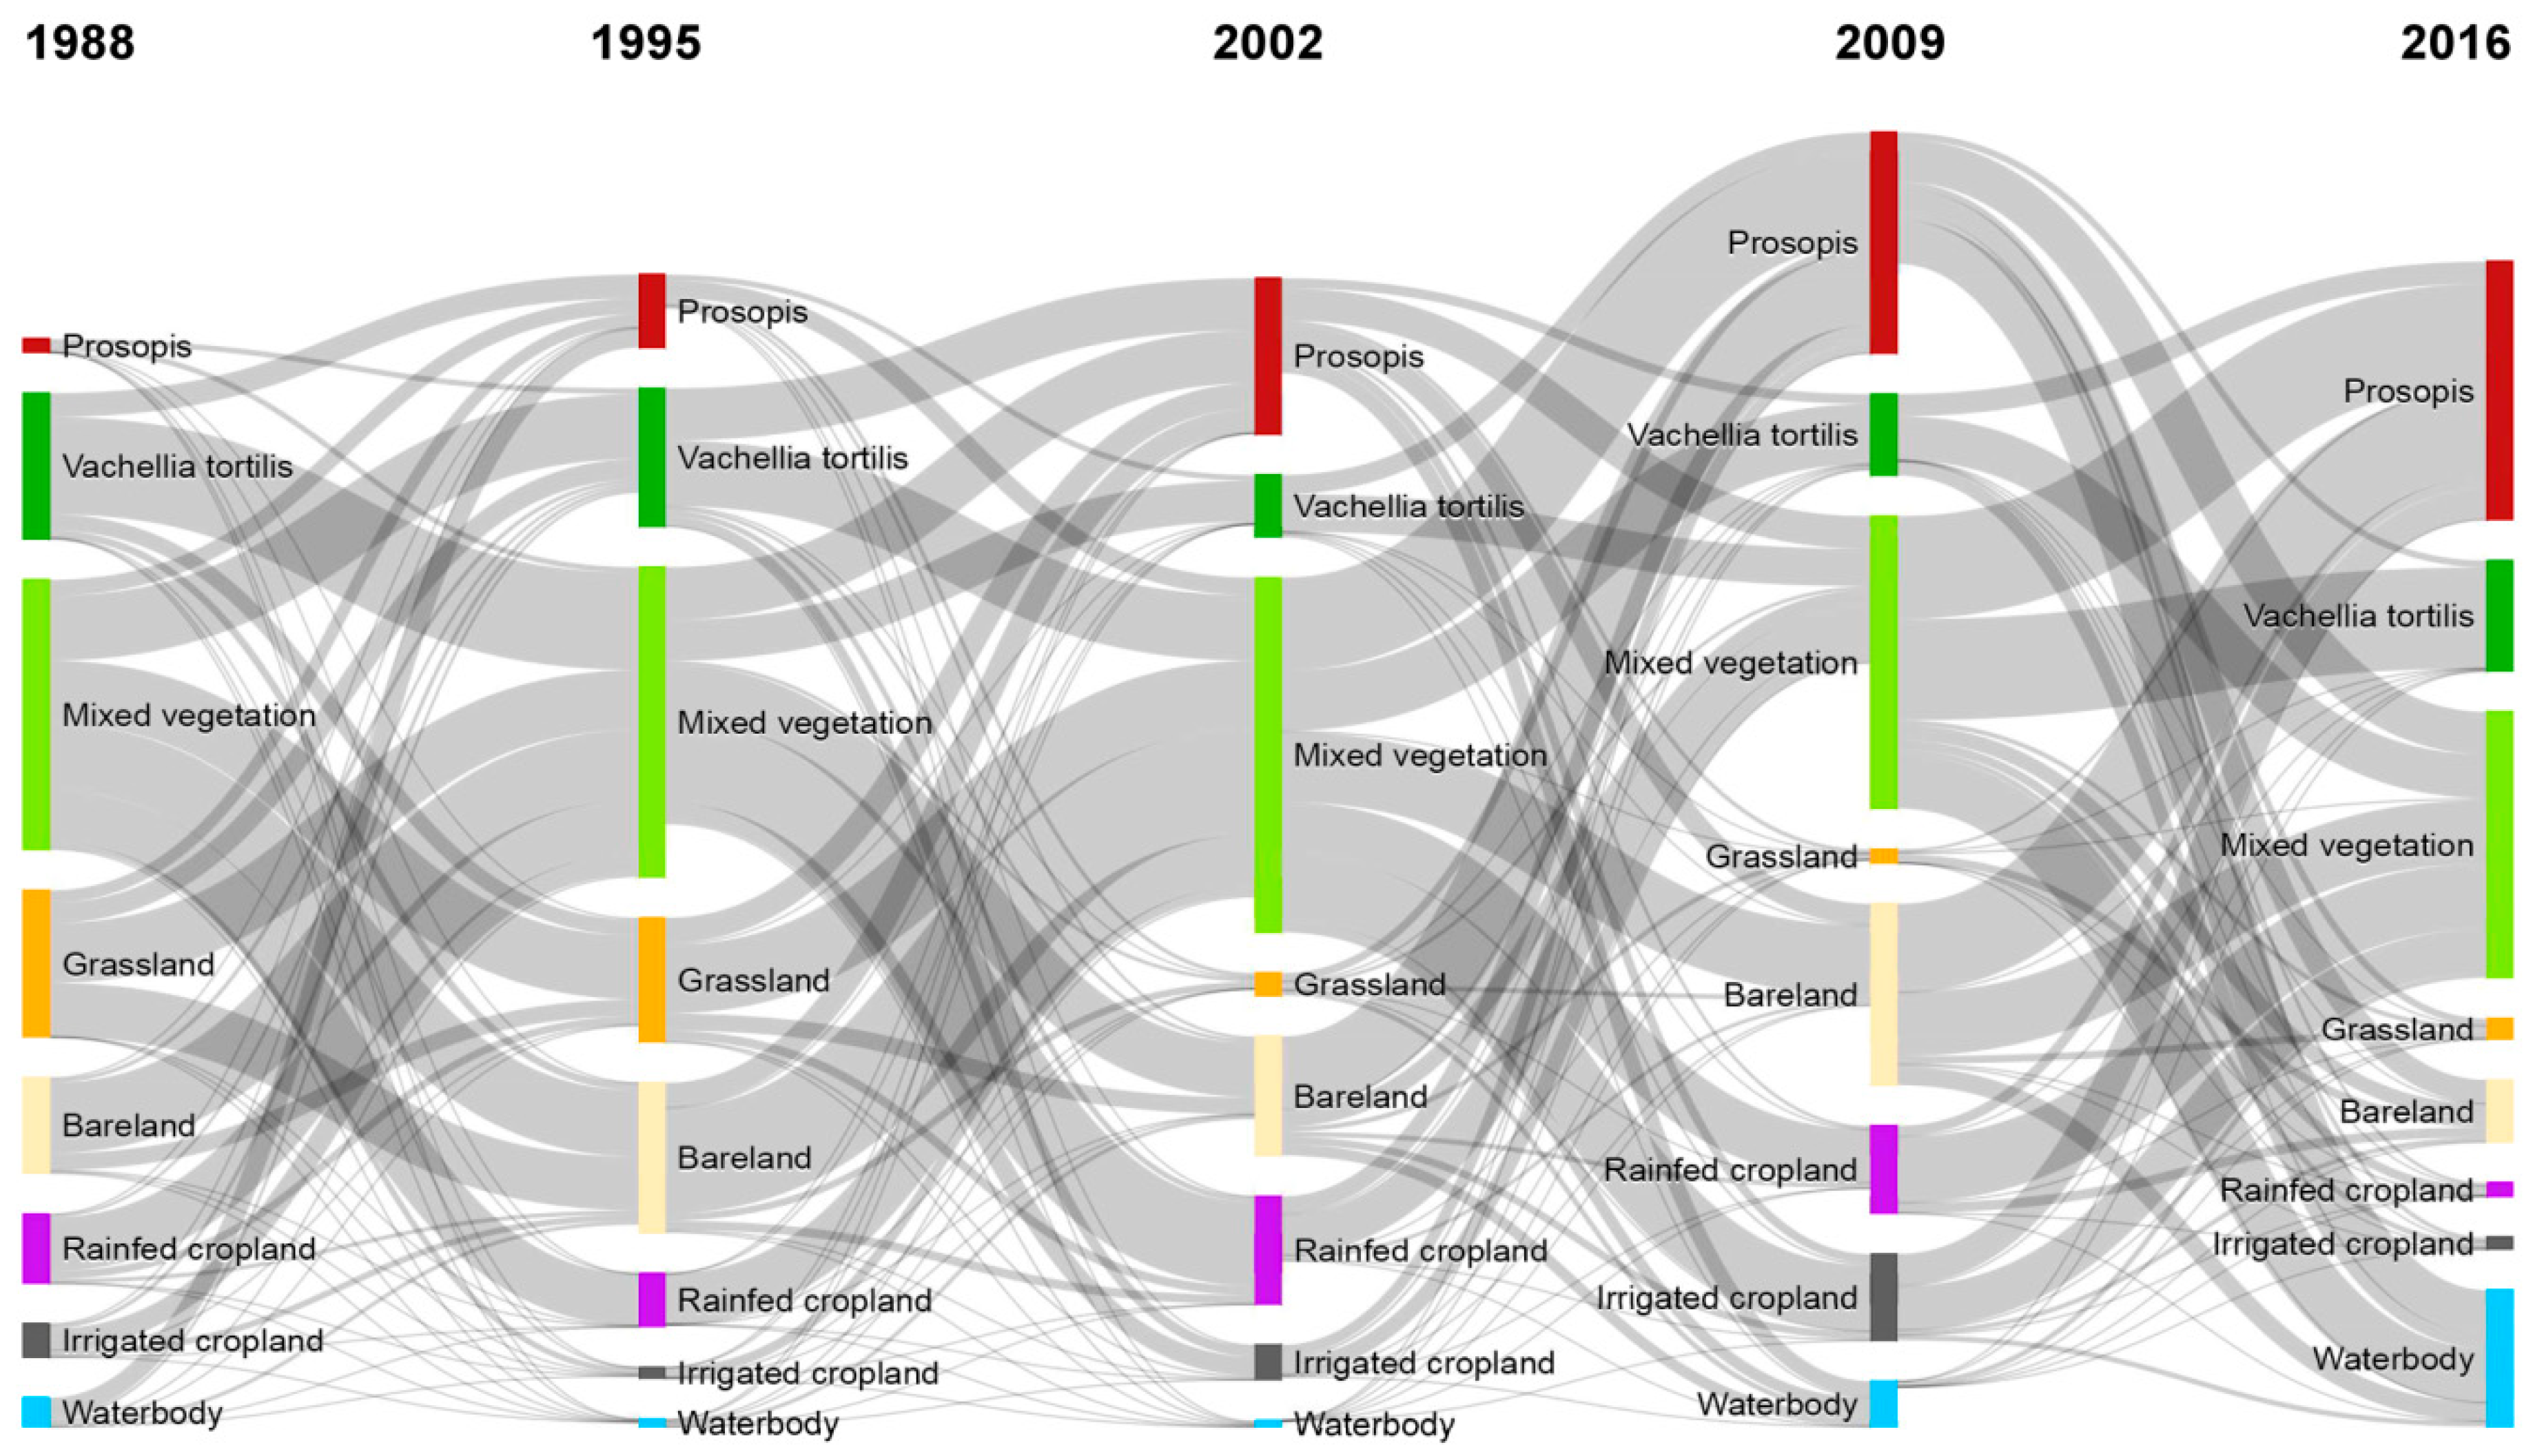
3.3. Prosopis-Specific Induced Changes on other LULC

Our results show that V. tortilis and grasslands were mostly lost to Prosopis during the period 1995 to 2002 (by 22% and 12% respectively), while mixed vegetation, bareland, and irrigated cropland were mostly lost to Prosopis during the period 2009 to 2016 (by 1.94%, 18%, and 74%, respectively; Table 5 and Figure 5). Generally, Prosopis induced the most changes in LULC in the study area between 2009–2016, while the least impacts were observed between 1988–1995.
Cumulatively, within almost three decades, Prosopis invasion has resulted in LULC losses of V. tortilis by 3452 ha (41%), grasslands by 2675 ha (37%), bareland by 5351 ha (36%), irrigated cropland by 373 ha (25%), mixed vegetation by 6215 ha (5%), and rainfed cropland by 129 ha (3%). The three largest donors to Prosopis were, in order of ranking, mixed vegetation, which comprises mostly indigenous trees and shrubs, bareland, and V. tortilis, with a mean annual loss of 222 ha/a, 191 ha/a, and 123 ha/a, respectively. Grasslands and irrigated croplands, which are the basic livelihood support system for the agro-pastoral community, annually lost 96 ha and 13 ha, respectively.

4. Discussion

4.1. Spatial Evolution of Prosopis Invasion

Owing to its invasive nature, Prosopis has the potential to colonize and dominate a variety of landscapes, especially in the tropical ASALs [50]. However, despite this well-known fact, there remains a significant lack of understanding of the rate of invasion in affected regions and the consequences for LULC dynamics. We assessed the evolution of Prosopis invasion and the associated LULC changes over time and space by using multi-temporal and multispectral Landsat satellite imagery as well as by verification of mapping outputs with historical Google Earth Imagery [38] and local expert knowledge. Applying Random Forest on the Landsat data provided good estimations and reliable accuracies, which has also been reported in other studies [21,51,52,53,54]. This provides potential for the long-term monitoring of Prosopis invasion. Moreover, its processing chain can be easily repeated, which is particularly useful when performing time-series analysis, and can also be applied to other studies with some fine-tuning [21]. Our study covered the entire invasion history, and used rigorous methods to assess the evolution of Prosopis. We showed how the invasion dynamics have influenced LULC in the study area, which was information that was lacking in previous studies. The use of seasonality, especially the dry season information, was very useful in the accurate mapping of Prosopis from the coexisting native vegetation and other LULC. However, we would like to note that our study was limited by inaccessibility to the areas to the east of Lake Baringo. This is a hotspot zone for community-based violence [55] and at the time of field data collection, the area was quarantined. Therefore, we did not succeed in collecting ground truth information for that particular zone.
Zooming into a heavily invaded region with original Prosopis plantations further illustrates how the combination of multi-temporal Landsat satellite imagery and Random Forest helped in identifying and visualizing invasion processes at multiple scales (Figure 6). Both the temporal and spatial patterns detected at the case study level and at smaller scales revealed that Prosopis initially spread away from plantations mainly along roads and waterbodies or lakeshores. This is in line with findings from the Afar region in Ethiopia, where waterbodies and roads have been identified as key drivers of Prosopis invasion [16]. Subsequently, it invaded areas away from waterbodies, particularly V. tortilis, grassland, and mixed vegetation and more recently also, mixed vegetation on the slopes of the surrounding hills, particularly by following riverbeds upstream. This raises the question of to what extent and at what rate Prosopis will also be able to displace mixed vegetation on the surrounding hills and escarpments, which was facilitated by Prosopis seed dispersal by migrating livestock [16].
It is likely that in our analysis, grasslands were partially under-represented or over-represented at certain intervals. This is because some grasslands in the study area are dominated by annuals, while the perennial grasses are stressed due to overgrazing. As such, grasslands are more abundant during the wet season when weather conditions are favorable, which is a time when other herbaceous vegetation is also at its peak. Furthermore, it was challenging to separate dry perennial grasses from bareland. Another challenge in our analysis was the differentiation between V. tortilis and Prosopis along rivers and in wetlands. It was relatively easy to differentiate V. tortilis from Prosopis during the dry season in areas away from water, because, unlike Prosopis, it sheds leaves. However, in riparian habitats, V. tortilis, as well as another common native, Balanites aegyptica, sometimes behaves similar to evergreen species, due to the close proximity to water. All these species are closely related in spectral reflectance [21], which posed a challenge in their effective discrimination in the riparian and wetland zones using Landsat data.

4.2. Spatial Changes in Prosopis Coverage

In 1982 and 1983, Prosopis was introduced in 31 locations in the study area [10] to alleviate fuelwood scarcity and to rehabilitate heavily overgrazed drylands [13,36,50]. These plantations were established within the productive lowland zones along rivers, grasslands, and irrigation schemes in order to enhance the tree survival rate in this harsh semi-arid environment. These zones are more prone to invasion than other areas, because they are convergent zones for waterborne and animal-dispersed seeds, and are more conducive for plant growth [22]. Our findings that by 1988 Prosopis covered some 882 ha is comparable to estimates reported by Mwangi and Swallow [33] (739.5 ha by 1990). Our estimate of the average annual increase in Prosopis coverage (640 ha) is within the range reported by Kyuma et al. [25], who reported that Prosopis spread at an average annual rate of around 532 ha/a on hillslopes and of 13 to 1309 ha/a in the floodplains in Kajiado County in southern Kenya. Visual comparisons of our Prosopis map with the mapping output from Ng et al. [21] using higher spatial resolution data (Sentinel-2 and Pléiades) also show an agreement of the invasion distribution. Hence, our results confirm that Prosopis is an aggressive invader in Baringo County, which is in line with observations from other regions in Africa [16,27,56,57,58,59]. The rapid spread of the species can be explained by different factors: (a) the massive reproduction of seeds, (b) effective seed dispersal agents (e.g., livestock and wildlife) and pathways (rivers and roads), or (c) favorable climatic conditions. The flooding event in 2013 [21] may also have contributed to the further spread of Prosopis.
Figure 6 reveals a discriminative invasion pattern from the plantations. As already observed by Andersson [10], the establishment of an initial plantation did not automatically result in the invasion of the surrounding habitats. However, the areas (Sandai, Logumgum and Loruk) that initially remained free from Prosopis invasion became invaded eventually, i.e., about a decade after these plantations were established (Figure 6). It should be noted that some sites received P. juliflora only, some received P. pallida only, and some sites received both species [13,60]. Prosopis juliflora is known to be highly invasive, while Prosopis pallida appears to be less invasive, or not invasive at all in Baringo County (Purity Rima Mbaabu, personal observations). It remains to be shown whether the varying level of invasion around plantations is driven by the taxonomic composition of the plantations or by variation in the local environmental conditions [10], which may lead to a ‘time lag’ in the invasion process. Our findings suggest that Prosopis invasion in our study area follows a regular and gradual pattern of increase.

4.3. LULC Changes in the Study Area

The Lake Baringo ecosystem presents a good example of a semi-arid landscape experiencing remarkable LULC changes over the course of a few decades [30]. While the area invaded by the alien Prosopis increased more than 20-fold since 1988, LULC classes with native vegetation and agricultural areas decreased. Thus, the local communities have been losing land-cover classes that form part of their key livelihood support system, such as grasslands and irrigated croplands, at an alarming rate. Our results corroborate the findings of Kiage et al. [30], who assessed LULC changes around Lake Baringo also using Landsat imagery, and found that the forest area (which corresponds to our V. tortilis class) dropped by 40% within a 14-year period (1986–2000). Our study shows that Prosopis invasion directly accounts for over 30% of the LULC changes in the study area. We would like to note that this may be an underestimation of the current state of invasion, because, a) considering that there is usually a lag-phase between Prosopis introduction and the actual detection on satellite image, and b) the use of a 30 m Landsat imagery poses a challenge in detecting young but sparse Prosopis invasions.
Besides Prosopis invasion, human activities such as deforestation, land clearing, and overgrazing, together with climate change, are likely to have contributed to the observed LULC dynamics in Baringo County [30,61]. Yet, regardless of the factors triggering the LULC dynamics, Prosopis tends to be more adaptive to the observed environmental change than native plant species [62,63]. This is because, due to its deep-reaching roots, Prosopis is able to survive in areas where nothings else seems to grow [14,64]. In addition, Prosopis has been shown to directly interfere with the survival of native plant species, probably via competition for water or allelopathy [65]. Losses in key agro-pastoral livelihood supporting LULCs (i.e., V. tortilis, grassland, and irrigated cropland) showed variable patterns across the study period; while the decline in areas covered by V. tortilis and grasslands was more prevalent during the first decade after Prosopis introduction (1988–2002), the highest losses in rainfed and irrigated cropland occurred between 2009–2016 (Table 3). Most of the V. tortilis and grassland areas still present at the beginning of the study period were at close proximity to the plantations (Figure 6), which may explain why they were first invaded by Prosopis.
Over the last 100 years, Baringo County has experienced a history of land degradation [10,61], and the increase in bareland between 1988–1995 may be considered as a continuation of this trend (Table 3). This matches with the findings of Kiage et al. [30], who observed that bare areas increased around Lake Baringo area between 1986–2000. Land degradation in Baringo County was likely to be caused by a combination of an increase in human population and livestock numbers, as pastoralism used to be the main economic activity for local communities [66]. Additionally, low levels of precipitation experienced in the area between 1978–1996 (annual average = 51.7 mm) may have further contributed to the increase of bareland [67]. Variation in rainfall is particularly pronounced in semi-arid areas such as the Baringo lowlands. Moreover, the long-term average precipitation in the region shows a slight downward trend since the 1960s [68]. This may also explain why the lakes’ water levels declined between 1988–2002.
However, since 2009, the area under water increased again, which was a phenomenon that has also been observed in other waterbodies within the Great Rift Valley system. While the causes of this increase remain unclear to date, some sources attribute the increase to increased rainfall, to plate tectonic movements, or to land-use changes and its associated siltation downstream [69].
Agricultural activities started to increase in Baringo County at the beginning of the 21st century, but the cultivated area considerably decreased again after 2009 (Table 3 and Table 4). The initial increase in irrigated cropland resulted from an expansion of irrigation schemes in the study area [70]. Small-scale irrigated farming activities in the area are largely seasonal in nature. They depend on water availability and seed production demand by the contracting seed companies such as Kenya Seed [71]. These companies contract farmers for various seed production, which is usually on a rotational and annual basis. However, if in a certain year farmers are not engaged in this activity, their farms usually remain idle, which leaves the farms vulnerable to Prosopis invasion, particularly after crop harvesting, when the livestock keepers freely graze their animals, which is a key vector of Prosopis seed dispersal, on crop residues [72]. For instance, in 1995, there were minimal farming activities in the Perkerra irrigation scheme. This coincided with the start of Prosopis invasion in the irrigation scheme, which eventually resulted into rapid Prosopis spread in subsequent years (Figure 7). It should be noted that most of the irrigated and rainfed cropland within the boundaries of the area invaded by Prosopis actually also bear a significant Prosopis soil seed bank, and will thus need increased maintenance efforts; otherwise, this land will be reinvaded within a few months (Purity Rima Mbaabu, personal observations).
In the study area, charcoal production is a thriving economic activity with charcoal from V. tortilis being preferred on the market to that from Prosopis [21]. As such, V. tortilis was intensively harvested for charcoal production in the years before the millennium. Around 2007, during a National Field Day, the Kenya Forest Service (KFS) in Marigat expressed the need to ban the utilization of V. tortilis [73]. As an alternative, the communities were encouraged to utilize Prosopis, which was also regarded as a way of managing Prosopis invasion. The observed increase in V. tortilis after 2009 might be an effect of this ban, but we would like to point out that our accuracy assessment suggests a slight overestimation of V. tortilis in the southeast of our study area in the 2016 image. This arose due to misclassifications of this particular class, as depicted by the low producers’ accuracy of 53.5% (Supplementary Materials; Table S5), which may partly be explained by our study limitation already described in paragraph 1, Section 4.1.
By 2005, Prosopis invasion had intensified, and was perceived by the pastoralists as the cause of the dwindling grasslands for their livestock, which prompted a legal suit between the host pastoral community and the Kenyan government [74]. In response, the government began a sensitization program through which the affected communities were trained on Prosopis management by manual or physical removal and reseeding the cleared areas with grass species [13,29,75]. This practice was gradually adopted by the pastoralists as a new way of enhancing the fodder that was available for their livestock and income generation through commercial grass seed production. It has consequently led to an increase in the number of grass fodder farms in the area [75], and might explain the increase of grasslands in the last observed interval, between 2009–2016. However, our results show that the adoption of the ‘management by utilization’ approach promoted by the Kenyan government has not been effective in curtailing the further spread of Prosopis. On the contrary, utilization results in the coppicing of multiple Prosopis stems from the harvested stem, which creates impenetrable thickets and fuels the further spread of Prosopis through multiplied seed production by coppiced stems [59,76,77]. Building on the long-term management experience gained in Australia, we propose that sustainable and effective Prosopis management can only be achieved by combining different management options such as chemical, biological, and mechanical control. In addition, a regular inspection of areas at risk of invasion and the targeted removal of small Prosopis populations at the invasion front is recommended [77].
Another interesting observation was the expansion of agricultural activities, particularly irrigated cropland, which increased between 2002–2009. During this time, several seed companies contracted farmers to produce cereal seeds. Small-scale irrigated farming activities in the area are largely seasonal in nature. They depend on water availability and levels of seed demand by the contracting seed companies, which vary from one year to another. As such, if in a certain year farmers are not engaged in this activity, their farms usually remain idle. This inactivity leaves the farms vulnerable to Prosopis invasion, particularly after crop harvesting, when the livestock keepers freely graze their animals on crop residues, which is a key pathway for Prosopis seed dispersal in the croplands [72,78]. For instance, we observed that in 1995, there were minimal farming activities in the Perkerra irrigation scheme. This coincided with the start of Prosopis invasion in the irrigation scheme, which eventually resulted into rapid Prosopis spread in the subsequent years (Figure 7). Our observation suggests that active land use plays a critical role in controlling Prosopis spread.
Finally, the drylands of Baringo are often characterized by inter-community violence [55]. The main cause of these conflicts is competition for scarce but vital resources, particularly water and fodder for livestock. Invasion into the grasslands has significantly reduced available fodder, because high densities of Prosopis (>50% canopy cover) have been reported to suppress grass growth and reduce understory species diversity [10,79,80,81]. This is likely to exacerbate these resource-use conflicts between the local communities. Moreover, high-density Prosopis cover impedes accessibility to water points for people and livestock, and limits livestock mobility to grazing areas [50]. Further, Prosopis is known to consume substantial amounts of groundwater [82,83,84,85], but the effect of Prosopis invasion on the groundwater level in Baringo County is currently unknown.

5. Conclusions

Baringo County has a long history of LULC changes, even prior to Prosopis invasion. Historically, the main drivers of LULC changes are considered to be a growing human population and an increase in livestock numbers, which lead to an unsustainable exploitation of the natural resources in the region. This in turn prompted the introduction of Prosopis and other exotic tree species in Baringo County and other parts of Kenya.
Our study provides evidence that over the last 30 years, Prosopis has become an additional driver of LULC changes in Baringo County. While Prosopis has become a key source of wood and the invasion of bareland can improve the microclimate in the area and increase soil stability, the substantial invasion of grasslands, Vachellia tortilis-dominated land, and cropland as revealed in this study has serious consequences for the delivery of traditional ecosystem services provided to (agro-)pastoralists, and thus on the livelihood of rural people living in the invaded area. Based on our findings, we draw the following conclusions:
  • Freely available Landsat data analyzed with the implementation of Random Forest machine learning algorithm in the open source R software are useful in assessing spatial temporal LULC changes, especially in regions where commercial data and software is economically inaccessible. The RF algorithm has the ability to separate various landscape components with reliable accuracies.
  • The use of bi-seasonal (dry and wet) multispectral data combinations and the Random Forest algorithm allowed us to spatially and quantitatively investigate the evolution of Prosopis invasion, its current extent, and the changes in LULC in the semi-arid environment. The use of dry season images enhanced the ability to differentiate the evergreen Prosopis from deciduous native Vachellia species on the medium-resolution Landsat imagery.
  • Prosopis has rapidly increased in the study area since its introduction in 1982. It currently stands at approximately 18,792 ha, invading at a rate of 640 ha per annum. This rapid spread was facilitated by effective seed dispersal agents such as livestock and wildlife, a lack of natural enemies, and favorable climate, among other factors. Our findings indicate that Prosopis has been a key driver of LULC changes in the semi-arid lowlands of Baringo, directly accounting for over a third of the LULC changes observed over the last three decades.
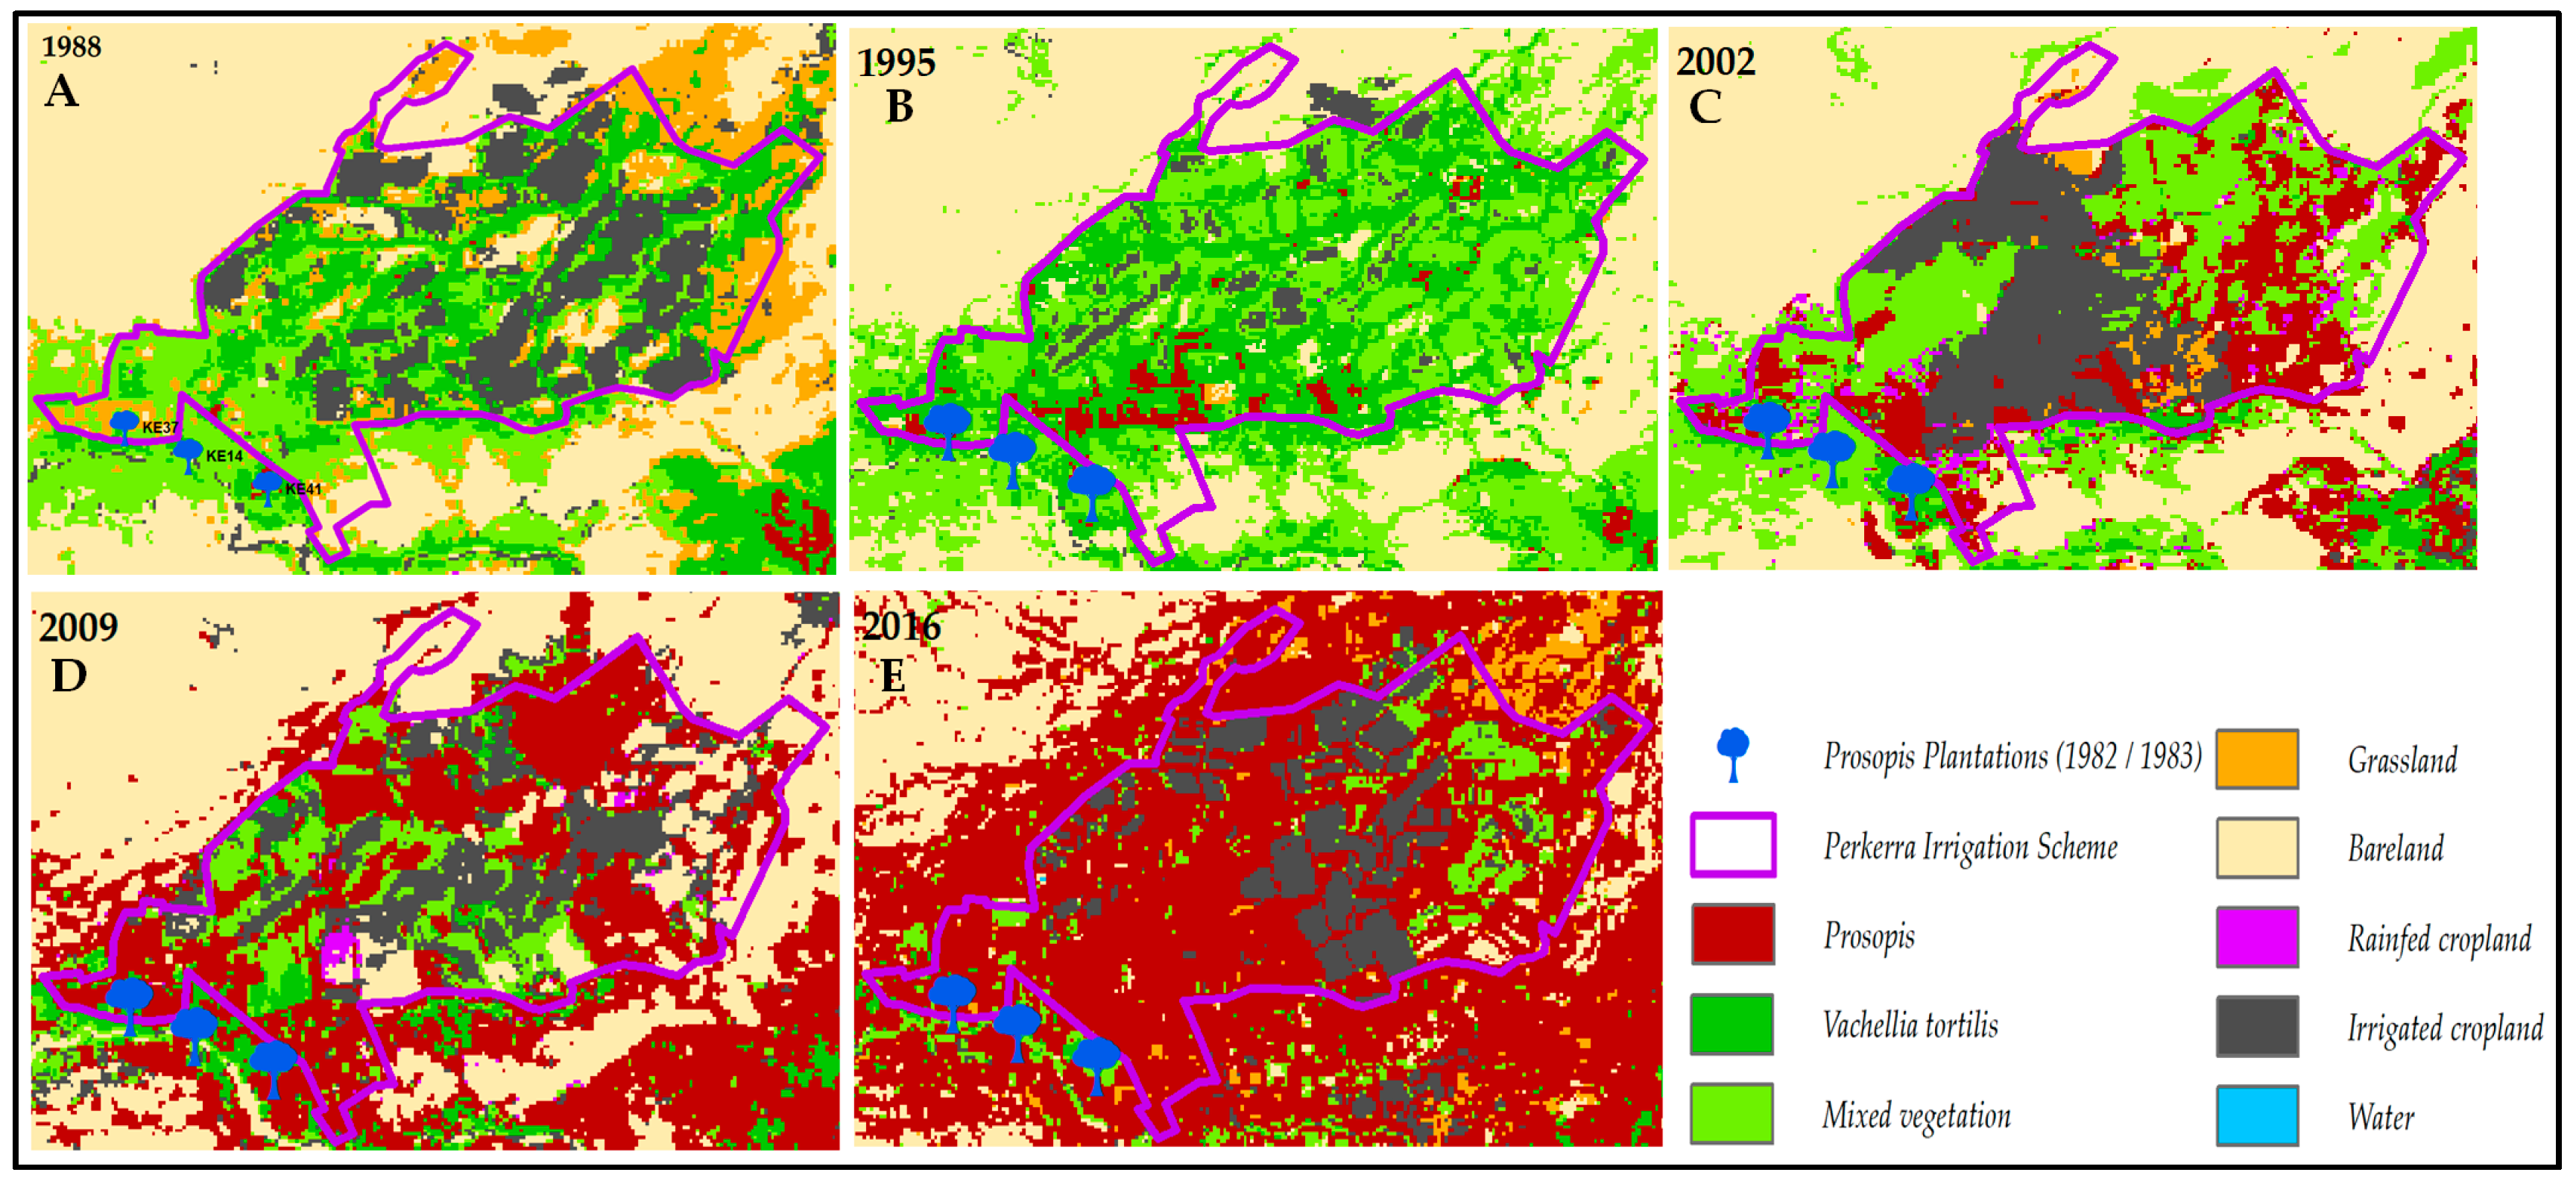
  • The LULC classes most vulnerable to Prosopis invasion are grasslands, V. tortilis-dominated zones, and fallow irrigated agricultural fields. Their vulnerability is enhanced by their ecological niche also favoring Prosopis growth and the presence of Prosopis seed dispersal vectors such as livestock, wildlife, water, and humans.
Our study provides important baseline data and information for policy management. The results indicate that the ‘management by utilization’ approach that has been promoted in Baringo for 10–15 years has not curtailed the further spread of Prosopis. In order to achieve the sustainable management of Prosopis and reverse its adverse impacts manifested in the loss of ecosystem services and livelihood to the local communities, we suggest that this species be targeted with an integrated and coordinated management strategy.

Supplementary Materials

The following are available online at https://0-www-mdpi-com.brum.beds.ac.uk/2072-4292/11/10/1217/s1, Table S1: 1988 Classification Accuracy Report, Table S2: 1995 Classification Accuracy Report, Table S3: 2002 Classification Accuracy Report, Table S4: 2009 Classification Accuracy Report, S5: 2016 Classification Accuracy Report, Table S6: Reference data for 1988 classification, Table S7: Reference data for 1995 classification, Table S8: Reference data for 2002 classification, Table S9: Reference data for 2009 classification, Table S10: Reference data for 2016 classification, S2: Figure S1–S5: Reference data distribution map for 1988–2016 classifications, Figure S6: Photograph.

Author Contributions

P.R.M., S.E., U.S. and W.-T.N. conceived and designed the research study, P.R.M. and W.-T.N. collected, processed and analyzed the data, and all authors contributed to the writing of the manuscript.

Funding

This research was funded by the Swiss National Science Foundation (SNSF) and the Swiss Agency for Development and Cooperation (SDC) as part of the Swiss Programme for Research on Global Issues for Development (r4d), for the project “Woody invasive alien species in East Africa: Assessing and mitigating their negative impact on ecosystem services and rural livelihood” (Grant Number: 400440_152085). Urs Schaffner was supported by CABI with core financial support from its member countries (see http://www.cabi.org/about-cabi/who-we-work-with/key-donors/).

Acknowledgments

We thank the Kenya Forestry Research Institute (KEFRI) for facilitating the fieldwork activities and data analysis, and KEFRI staff, particularly Simon Choge for general administrative support, technical support and writing assistance. We furthermore thank the Woody Weeds project team who provided thematic and methodological insight and expertise that greatly assisted the research. Finally, we would like to thank the University of Natural Resources and Life Sciences, Vienna (BOKU), in particularly Francesco Vuolo, for providing expertise on Landsat processing.

Conflicts of Interest

The authors declare no conflict of interest. The funders had no role in the design of the study; in the collection, analyses, or interpretation of data; in the writing of the manuscript, or in the decision to publish the results.

References

  1. Pimentel, D.; Zuniga, R.; Morrison, D. Update on the Environmental and Economic Costs Associated with Alien-Invasive Species in the United States. Ecol. Econ. 2005, 52, 273–288. [Google Scholar] [CrossRef]
  2. Mooney, H.A. Invasive Alien Species: The Nature of the Problem; Island Press: Washington, DC, USA, 2005. [Google Scholar]
  3. McGinley, M.; Duffy, J.E. Invasive Species. In Encyclopedia of Life; Encyclopedia of Earth: Washington, DC, USA, 2010. [Google Scholar]
  4. Brahic, C. Africa Trapped in Mega-Drought Cycle. NewScientist, 16 April 2009. Available online: https://www.newscientist.com/article/dn16967-africa-trapped-in-mega-drought-cycle/ (accessed on 28 January 2019).
  5. Ouden, J.; Mohren, G.M.J. Prosopis Upsurge in Kenya: Cause and Effects; Wageningen University & Research: Wageningen, The Netherlands, 2011. [Google Scholar]
  6. Gaulter, S. Analysis: Understanding the Sahel Drought. Scientists Say That the Current Drought in the Sahel Began as Far Back the 1960s; Al Jazeera Media Network: Doha, Qatar, 2012. [Google Scholar]
  7. Maghembe, A.J.; Kariuki, M.E.; Haller, D.R. Biomass and Nutrient Accumulation in Young Prosopis Juliflora at Mombasa, Kenya. Agrofor. Syst. 1983, 1, 313–321. [Google Scholar] [CrossRef]
  8. Herlocker, D.J.; Barrow, E.G.C.; Paetkau, P. A Preliminary Report on Trial Plantings of Woody Species in Arid and Semi-Arid Northern Kenya. In Proceedings of the Kenya National Seminar on Agroforestry; Buck, L., Ed.; [November, 1980]; ICRAF: Nairobi, Kenya, 1981; pp. 511–534. [Google Scholar]
  9. Pasiecznik, N.M.; Felker, P.; Harris, P.J.C.; Cruz, G.; Tewari, J.C.; Cadoret, K.; Maldonado, L.J. The Prosopis Julifora-Prosopis Pallida Complex: A Monograph; HDRA: Coventry, UK, 2001. [Google Scholar]
  10. Andersson, S. Spread of the Introduced Tree Species Prosopis Juliflora (Sw.) DC in the Lake Baringo Area, Kenya; Institutionen för Skoglig Vegetationsekologi Sveriges lantbruksuniversitet: UMEA, Sweden, 2005; pp. 1652–4918. [Google Scholar]
  11. Kaur, R.; Gonzáles, W.L.; Llambi, L.D.; Soriano, P.J.; Callaway, R.M.; Rout, M.E.; Gallaher, T.J.; Inderjit. Community Impacts of Prosopis Juliflora Invasion: Biogeographic and Congeneric Comparisons. PLoS ONE 2012, 7, e44966. [Google Scholar] [CrossRef]
  12. Kinyua, P.I.D. Agroforestry in Arid and Semi Arid Areas. In Agroforestry Development in Kenya: Proceedings of the Kenya National Seminar on Agroforestry, Held in Nairobi, Kenya, 7–16 November 1988; Kilewe, A.M., Kealey, K.M., Kebaara, K.K., Eds.; ICRAF: Nairobi, Kenya, 1989; pp. 442–450. [Google Scholar]
  13. Choge, S.K.; Pasiecznik, N.M. The Challenges of Eradicating Prosopis in Kenya; HDRA: London, UK, 2005. Available online: assets.publishing.service.gov.uk (accessed on 9 June 2016).
  14. Mwangi, E.; Swallow, B. Invasion of Prosopis Juliflora and Local Livelihoods: Case Study from the Lake Baringo Area of Kenya; World Agroforestry Center: Nairobi, Kenya, 2005. [Google Scholar]
  15. Brown, J.R.; Carter, J. Spatial and Temporal Patterns of Exotic Shrub Invasion in an Australian Tropical Grassland. Landsc. Ecol. 1998, 13, 93–102. [Google Scholar] [CrossRef]
  16. Shiferaw, H.; Schaffner, U.; Bewket, W.; Alamirew, T.; Zeleke, G.; Teketay, D.; Eckert, S. Modelling the Current Fractional Cover of an Invasive Alien Plant and Drivers of Its Invasion in a Dryland Ecosystem. Sci. Rep. 2019, 9, 1576. [Google Scholar] [CrossRef]
  17. Mirik, M.; Ansley, R. Comparison of Ground-Measured and Image-Classified Mesquite (Prosopis Glandulosa) Canopy Cover. Rangeland Ecol. Manag. 2012, 65, 85–95. [Google Scholar] [CrossRef]
  18. Adams, V.M.; Setterfield, S.A. Optimal Dynamic Control of Invasions: Applying a Systematic Conservation Approach. Ecol. Appl. 2015, 25, 1131–1141. [Google Scholar] [CrossRef] [PubMed]
  19. Grice, A.C.; Clarkson, J.R.; Calvert, M. Geographic Differentiation of Management Objectives for Invasive Species: A Case Study of Hymenachne Amplexicaulis in Australia. Environ. Sci. Policy 2011, 14, 986–997. [Google Scholar] [CrossRef]
  20. Huang, C.; Asner, G.P. Applications of Remote Sensing to Alien Invasive Plant Studies. Sensors 2009, 9, 4869–4889. [Google Scholar] [CrossRef] [Green Version]
  21. Ng, W.-T.; Rima, P.; Einzmann, K.; Immitzer, M.; Atzberger, C.; Eckert, S. Assessing the Potential of Sentinel-2 and Pléiades Data for the Detection of Prosopis and Vachellia Spp. in Kenya. Remote Sens. 2017, 9, 74. [Google Scholar] [CrossRef]
  22. Robinson, T.P.; Van Klinken, R.D.; Metternicht, G. Spatial and Temporal Rates and Patterns of Mesquite (Prosopis Species) Invasion in Western Australia. J. Arid Environ. 2008, 72, 175–188. [Google Scholar] [CrossRef]
  23. Adam, E.; Mureriwa, N.; Newete, S. Mapping Prosopis Glandulosa (Mesquite) in the Semi-Arid Environment of South Africa Using High-Resolution WorldView-2 Imagery and Machine Learning Classifiers. J. Aid Environ. 2017, 145, 43–51. [Google Scholar] [CrossRef]
  24. Van den Berg, E.C.; Kotze, I.; Beukes, H. Detection, Quantification and Monitoring of Prosopis in the Northern Cape Province of South Africa Using Remote Sensing and GIS. S. Afr. J. Geomat. 2013, 2, 68–81. [Google Scholar]
  25. Kyuma, R.K.; Wahome, R.G.; Kinama, J.M.; Wasonga, V.O. Temporal Relationship between Climate Variability, Prosopis Juliflora Invasion and Livestock Numbers in the Drylands of Magadi, Kenya. Afr. J. Environ. Sci. Technol. 2016, 10, 129–140. [Google Scholar] [CrossRef]
  26. Rembold, F.; Leonardi, U.; Ng, W.-T.; Gadain, H.; Meroni, M.; Atzberger, C. Mapping Areas Invaded by Prosopis Juliflora in Somaliland on Landsat 8 Imagery. In Proceedings of the SPIE Remote Sensing, Volume 9637, Remote Sensing for Agriculture, Ecosystems, and Hydrology XVII, Toulouse, France, 2015; p. 963723. [Google Scholar]
  27. Meroni, M.; Ng, W.-T.; Rembold, F.; Leonardi, U.; Atzberger, C.; Gadain, H.; Shaiye, M. Mapping Prosopis Juliflora in West Somaliland with Landsat 8 Satellite Imagery and Ground Information. Land Degrad. Dev. 2017, 28, 494–506. [Google Scholar] [CrossRef]
  28. Kigomo, J.N.; Luvanda, A.M.; Epodo, L. Experiences of Management and Utilization of Invasive Prosopis Juliflora in Turkana District. In Recent Advances in Forestry Research for Environmental Conservation, Improved Livelihood and Economic Development; Kenya Forestry Research Institute: Nairobi, Kenya, 2008; pp. 172–181. [Google Scholar]
  29. Choge, S.K.; Muthike, G. Experiences of Managing Prosopis Juliflora Invasions by Communities in Kenya: Challenges and Opportunities. In Proceedings of the Regional conference on Managing Prosopis Juliflora for better (agro-)pastoral Livelihoods in the Horn of Africa, Addis Ababa, Ethiopia, 1–2 May 2014; pp. 93–103. [Google Scholar]
  30. Kiage, K.-B.; Liu, K.B.; Walker, N.D.; Lam, N.; Huh, O.K. Recent Land-cover/Use Change Associated with Land Degradation in the Lake Baringo Catchment, Kenya, East Africa: Evidence from Landsat TM and ETM+. Int. J. Remote Sens. 2007, 28, 4285–4309. [Google Scholar] [CrossRef]
  31. Keitany, W.; Cherogony, E.; Riamangura, E.; Lentupuru, C.; Sadalla, L.; Kwonyike, A.; Bartenge, G.; Tomno, J.; Atuko, M.; Barno, J. First County Integrated Development Plan 2013–2017: Kenya Vision 2013, Towards a Globally Competitive and Prosperous Nation; County Government of Baringo: Kabarnet, Kenya, 2013. [Google Scholar]
  32. Olang, M.O. Classification of Kenya Rangeland. In Proceedings of the Third Workshop on African Forage Plant Genetic Resources, Evaluation of Forage Germplasm and Extensive Livestock Production Systems, Arusha, Tanzania, 27–30 April 1987; ILRI (aka ILCA and ILRAD): Nairobi, Kenya, 1988. [Google Scholar]
  33. Mwangi, E.; Swallow, B. Prosopis Juliflora Invasion and Rural Livelihoods in the Lake Baringo Area of Kenya. Conserv. Soc. 2008, 6, 130. [Google Scholar]
  34. Mwasi, B. Landscape Change Dynamics in a Semi-Arid Part of Baringo District, Kenya, Based on Landsat-TM Data and GIS Analysis; Universiteit van Amsterdam, IBED: Amsterdam, The Netherland, 2004. [Google Scholar]
  35. Wetang’ula, G.N.; Kubo, B.M.; Were, J.O. Environmental Baseline Study for Geothermal Developments: Case Study Arus-Bogoria Geothermal Prospects, Kenya. In Proceedings of the Short Course II on Surface Exploration for Geothermal Resources, Lake Naivasha, Kenya, 2–17 November 2007; Kenya Electricity Generating Company Ltd.: Lake Naivasha, Kenya, 2007. [Google Scholar]
  36. Kariuki, P. A Social Forestry Project in Baringo, Kenya: A Critical Analysis; University of Queensland: Brisbane, Australia, 1993. [Google Scholar]
  37. Getahum, A. Agroforestry for Development in Kenya. In Proceedings of the Kenya National Seminar on Agroforestry Agroforestry Developemnt in Kenya, Nairobi, Kenya, 7–16 November 1988; Kilewe, A.M., Kealey, K.M., Kebaara, K.K., Eds.; World Agroforestry (ICRAF): Nairobi, Kenya, 1989; pp. 85–109. [Google Scholar]
  38. Google Earth Pro. Google Earth Pro 7.3.2.5495. Baringo County, Kenya. 00 36′16.06″N, 35058′23.24″E. Viewed July 2016–December 2018. 2018 Google, US Dept. of State Geographer, Image archive for 1987–2016. Available online: https://softfamous.com/google-earth-pro/download/ (accessed on 20 December 2018).
  39. Masek, J.; Vermote, E.; Saleous, N.; Wolfe, R.; Hall, F.; Huemmrich, K.F.; Gao, F.; Kutler, J.; Lim, T.-K. A Landsat Surface Reflectance Data Set for North America, 1990–2000. IEEE Geosci. Remote Sens. Lett. 2006, 3, 68–72. [Google Scholar] [CrossRef]
  40. Roy, D.P.; Kovalskyy, V.; Zhang, H.K.; Vermote, E.F.; Yan, L.; Kumar, S.S.; Egorov, A. Characterization of Landsat-7 to Landsat-8 Reflective Wavelength and Normalized Difference Vegetation Index Continuity. Remote Sens. Environ. 2016, 185, 57–70. [Google Scholar] [CrossRef]
  41. Vidhya, R.; Duraisamy, V.; Ramakrishnan, S.S. Mapping Invasive Plant Prosopis Juliflora in Arid Land Using High Resolution Remote Sensing Data and Biophysical Parameters. Indian J. Geo-Mar. Sci. 2017, 46, 1135–1144. [Google Scholar]
  42. Orwa, C.; Mutua, A.; Kindt, R.; Jamnadass, R.; Simons, A. Agroforestree Database: A Tree Reference and Selection Guide Version 4.0. 2009; World Agroforestry (ICRAF): Nairobi, Kenya, 2012. [Google Scholar]
  43. R Core Team. R: A Language and Environment for Statistical Computing; R Foundation for Statistical Computing: Vienna, Austria, 2018. [Google Scholar]
  44. Breiman, L. Random Forests. Mach. Learn. 2001, 45, 5–32. [Google Scholar] [CrossRef] [Green Version]
  45. Cutler, D.R.; Edwards, T.C.; Beard, K.H.; Cutler, A.; Hess, K.T.; Gibson, J.; Lawler, J.J. Random Forests for Classification in Ecology. Ecology 2007, 88, 2783–2792. [Google Scholar] [CrossRef]
  46. Liaw, A.; Wiener, M. Package “RandomForest”: Breiman and Cutler’s Random Forests for Classification and Regression; cran.r-project, R Package Version 4-10: Vienna, Austria, 2014; Volume 4. [Google Scholar]
  47. Arlot, S.; Celisse, A. A Survey of Cross Validation Procedures for Model Selection. Stat. Surv. 2009, 4, 40–79. [Google Scholar] [CrossRef]
  48. Liaw, A.; Weiner, M. Random Forest: Breiman and Cutler’s Random Forests for Classification and Regression; cran.r-project, R Package Version 4.6-7: Vienna, Austria, 2012. [Google Scholar]
  49. Refaeilzadeh, P.; Tang, L.; Liu, H. Cross-Validation. In Encyclopedia of Database Systems; Liu, L., Özsu, M.T., Eds.; Springer: Boston, MA, USA, 2009; pp. 532–538. [Google Scholar]
  50. Maundu, P.; Kibet, S.; Morimoto, Y.; Imbumi, M.; Deka, R. Impacts of Prosopis Juliflora on Kenya’s Semi-Arid and Arid Ecosystems and Local Livelihoods. J. Life Earth 2009, 10, 17. [Google Scholar]
  51. Li, M.; Im, J.; Beier, C. Machine Learning Approaches for Forest Classification and Change Analysis Using Multi-Temporal Landsat TM Images over Huntington Wildlife Forest. GIScience Remote Sens. 2013, 50. [Google Scholar] [CrossRef]
  52. LI, Z.; Xin, X.; Tang, H.; Yang, F.; Chen, B.; Zhang, B. Estimating Grassland LAI Using the Random Forests Approach and Landsat Imagery in the Meadow Steppe of Hulunber, China. J. Integr. Agric. 2017, 16, 286–297. [Google Scholar] [CrossRef]
  53. Reynolds, J.; Wesson, K.; Desbiez, A.; Ochoa-Quintero, J.; Leimgruber, P. Using Remote Sensing and Random Forest to Assess the Conservation Status of Critical Cerrado Habitats in Mato Grosso Do Sul, Brazil. Land 2016, 5, 12. [Google Scholar] [CrossRef]
  54. Immitzer, M.; Böck, S.; Einzmann, K.; Vuolo, F.; Pinnel, N.; Wallner, A.; Atzberger, C. Fractional Cover Mapping of Spruce and Pine at 1 Ha Resolution Combining Very High and Medium Spatial Resolution Satellite Imagery. Remote Sens. Environ. 2018, 204, 690–703. [Google Scholar] [CrossRef]
  55. Relief Web. Baringo Residents Struggle with Drought and Conflict over Resources; ReliefWeb, UNOCHA: New York, NY, USA; Geneva, Switzerland, 2017. [Google Scholar]
  56. Wakie, T.T.; Laituri, M.; Evangelista, P.H. Assessing the Distribution and Impacts of Prosopis Juliflora through Participatory Approaches. Appl. Geogr. 2016, 66, 132–143. [Google Scholar] [CrossRef]
  57. Ndhlovu, T.; Milton, S.J.; Esler, K.J. Effect of Prosopis (Mesquite) Invasion and Clearing on Vegetation Cover in Semi-Arid Nama Karoo Rangeland, South Africa AU—Ndhlovu, Thabisisani. Afr. J. Range For. Sci. 2016, 33, 11–19. [Google Scholar] [CrossRef]
  58. Henderson, L. Invasive, Naturalized and Casual Alien Plants in Southern Africa: A Sum mary Based on the Southern African Plant Invaders Atlas (SAPIA). Bothalia 2007, 37, 215–248. [Google Scholar] [CrossRef]
  59. Babiker, A.G.T. Mesquite (Prosopis Spp.) in Sudan: History, Distribution and Control. Available online: WordPress.com (accessed on 27 January 2018).
  60. Muturi, G.M.; Mohren, G.M.J.; Kimani, J.N. Prediction of Prosopis Species Invasion in Kenya Using Geographical Information System Techniques. Afr. J. Ecol. 2009, 48, 628–636. [Google Scholar] [CrossRef]
  61. Kimosop, W.; Kidundo, M.; Musila, F.; Cheruiyot, M.; Kangogo, M.; Ngeche, K.; Chepkonga, S.; Koros, D.; Meto, J.; Harper, D. Lake Bogoria National Reserve: Integrated Management Plan 2007–2012; 2007 County Council of Baringo, County Council of Koibatek and WWF-EARPO: Baringo, Kenya, 2007. [Google Scholar]
  62. Muthana, K.D.; Arora, G.D. Prosopis Juliflora (Swartz) D.C., a Fast Growing Tree to Bloom the Desert. Director, Central Arid Zone Research Institute, printed at Rajasthan Law Weekly Press, Jodhpur—342 003, INDIA, CAZRI Monograph No. 22. December 1983. [Google Scholar]
  63. Dubow, A.Z. Mapping and Managing the Spread of Prosopis Juliflora in Garissa County, Kenya; Kenyatta University: Nairobi City, Kenya, 2005. [Google Scholar]
  64. Villagra, P.; Vilela, A.; Giordano, C.; Alvarez, J. Ecophysiology of Prosopis Species from the Arid Lands of Argentina: What Do We Know About Adaptation to Stressful Environments? In Desert Plants Biology and Biotechnology; Springer: Berlin/Heidelberg, Germany, 2010; Volume 321–340, pp. 321–340. [Google Scholar]
  65. Schachtschneider, K.; February, E.C. Impact of Prosopis Invasion on a Keystone Tree Species in the Kalahari Desert. Plant Ecol. 2013, 214, 597–605. [Google Scholar] [CrossRef]
  66. WIKIPEDIA. Perkerra River. Available online: wikipedia.org (accessed on 8 February 2019).
  67. KALRO, K. Rainfall Data for Marigat for 39 Years _1970–2008; KALRO: Marigat, Kenya, 2016. [Google Scholar]
  68. Nicholson, S.E.; Funk, C.; Fink, A.H. Rainfall over the African Continent from the 19th through the 21st Century. Glob. Planet. Chang. 2018, 165, 114–127. [Google Scholar] [CrossRef]
  69. Daily Nation. Why Water Levels Are Rising in Kenya’s Rift Valley Lakes. Kenya. Available online: www.nation.co.ke (accessed on 15 April 2019).
  70. Choge, S.K.; KEFRI, Baringo Sub-Centre, Marigat, Kenya. Irrigation Activities in Marigat. Personal communication, 18 September 2018. [Google Scholar]
  71. Ng’etich, P. Seed Firms’ Offer of Life for Famished Baringo. 2008. Available online: www.nation.co.ke (accessed on 19 February 2019).
  72. Kilawe, C.J.; Mbwambo, J.R.; Kajembe, G.C.; Mwakalukwa, E.E. Mrashia: Prosopis Has Started Invading Pastures and Agricultural Lands in Tanzania. The Woody Weeds Project. 2017. Available online: www.woodyweeds.org (accessed on 6 February 2019).
  73. Choge, S.K.; KEFRI, Baringo Sub-Centre, Marigat, Kenya; Lekruito, J.; CPA Chairman, Ngambo Sublocation, Marigat, Kenya. Ban on Vachellia Utilization in Marigat. Personal communication, 21 June 2018. [Google Scholar]
  74. Kenya Law. CHARLES LEKUYEN NABORI & 9 OTHERS v ATTORNEY GENERAL & 3 OTHERS [2007] EKLR, Petition 466 of 2006. 2007. Available online: kenyalaw.org (accessed on 20 February 2019).
  75. Lugusa, K. Fodder Production as an Adaptation Strategy in the Drylands: A Case Study of Producer Groups in Baringo County, Kenya; University of Nairobi Research Archive: Nairobi, Kenya, 2015. [Google Scholar] [CrossRef]
  76. Goel, V.L.; Behl, H.M. Growth, biomass estimations and fuel quality evaluation of coppice plants of Prosopis Juliflora on sodic soil site. J. Trop. For. Sci. 2000, 12, 139–148. [Google Scholar]
  77. Shackleton, R.T.; Le Maitre, D.C.; Pasiecznik, N.M.; Richardson, D.M. Prosopis: A Global Assessment of the Biogeography, Benefits, Impacts and Management of One of the World’s Worst Woody Invasive Plant Taxa. AoB Plants 2014, 6, plu027. [Google Scholar] [CrossRef]
  78. Van Klinken, R.D.; Campbell, S.D. The Biology of Australian Weeds 3 Prosopis L. Species. Plant Prot. Q. 2001, 16, 1–19. [Google Scholar]
  79. Muturi, G.M.; Poorter, L.; Mohren, G.M.J.; Kigomo, B.N. Ecological Impact of Prosopis Species Invasion in Turkwel Riverine Forest, Kenya. J. Arid Environ. 2013, 92, 89–97. [Google Scholar] [CrossRef]
  80. Ayanu, Y.; Jentsch, A.; Müller-Mahn, D.; Rettberg, S.; Romankiewicz, C.; Koellner, T. Ecosystem Engineer Unleashed: Prosopis Juliflora Threatening Ecosystem Services? Reg. Environ. Chang. 2015, 15, 155–167. [Google Scholar] [CrossRef]
  81. Dahl, E.B.; Sosebee, R.; Goen, J.P.; Brumley, C.S. Will Mesquite Control with 2,4,5-T Enhance Grass Production? J. Range Manag. 1978, 31, 129. [Google Scholar] [CrossRef]
  82. Ntshidi, Z.; Dzikiti, S.; Mazvimavi, D.; Bugan, R.; Le Maitre, D.; Gush, M.; Jovanovic, N. Comparative use of groundwater by invasive alien Prosopis spp. and co-occurring indigenous v. Karroo in a semi-arid catchment. In Proceedings of the 14th Biennial Ground Water Division Conference and Exhibition, Muldersdrift, South Africa, 21–23 September 2015. [Google Scholar]
  83. Dzikiti, S.; Schachtschneider, K.; Naiken, V.; Gush, M.; Moses, G.; Le Maitre, D.C. Water Relations and the Effects of Clearing Invasive Prosopis Trees on Groundwater in an Arid Environment in the Northern Cape, South Africa. J. Arid Environ. 2013, 90, 103–113. [Google Scholar] [CrossRef]
  84. Dzikiti, S.; Ntshidi, Z.; Le Maitre, D.C.; Bugan, R.D.H.; Mazvimavi, D.; Schachtschneider, K.; Jovanovic, N.Z.; Pienaar, H.H. Assessing Water Use by Prosopis Invasions and Vachellia Karroo Trees: Implications for Groundwater Recovery Following Alien Plant Removal in an Arid Catchment in South Africa. For. Ecol. Manag. 2017, 398, 153–163. [Google Scholar] [CrossRef]
  85. Fourie, F.; Mbatha, K.; Verster, H.; Dyk, G.V. The Effect of Vegetation (Prosopis Sp.) on Groundwater Levels in Rugseer River, Kenhardt, South Africa. Available online: http://www.dwaf.gov.za (accessed on 4 April 2019).
Figure 1. Overview of the study area (red box) covering the Marigat subregion, located in Baringo County, Kenya.
Remotesensing 11 01217 g001
Figure 2. Overview map (A) and LULC maps (BF) of the Marigat subregion, Baringo County, Kenya, for the years 1988, 1995, 2002, 2009, and 2016. The overview map shows the topography, waterways, lakes, and the Perkerra irrigation scheme. The red boundary zone is the extent of the study area.
Remotesensing 11 01217 g002
Figure 3. (a) LULC trends in hectares for each class from 1988 to 2016. (b) Invasion spread rate for each observed seven-year time interval (not per year) from Prosopis introduction until 2016 (with the totally invaded area in 2016 considered as 100%).
Remotesensing 11 01217 g003
Figure 4. The gain and loss of each LULC in percent shares of the total study area for 1988–1995, 1995–2002, 2002–2009, and 2009–2016.
Remotesensing 11 01217 g004
Figure 5. A Sankey plot showing the area changes from one class to the other for all time intervals.
Remotesensing 11 01217 g005
Figure 6. Invasion pattern of Prosopis from original plantations of 1982 and 1983. The blue trees represent the plantations, and the Prosopis invaded areas are shown in deep red. The sequence of LULC maps showing a zoom view south of Lake Baringo illustrates the gradual increase in Prosopis spatial coverage and a general decline in most of the other LULC, particularly grassland and V. tortilis over time (AE). Locations Loruk*, Logumgum**, and Sandai*** are indicated with a symbol in the 1988 map.
Remotesensing 11 01217 g006
Figure 7. Sequence of LULC maps of Perkerra irrigation scheme showing Prosopis introduction (three plantations) at the southwestern border of the irrigation scheme and its subsequent spread into the irrigation scheme over time (AE).
Remotesensing 11 01217 g007
Table 1. Land-use and land-cover (LULC) classes present in the study area.
Class IDLULCClassification Description
1ProsopisRefers to P. juliflora, which is an evergreen woody alien shrub predominating the lowland areas around Lake Baringo
2Vachellia tortilisAn indigenous tree species predominantly found within the tropical arid and semi-arid lands (ASALs)
3Mixed VegetationA combination of natural trees and shrubs that exist as a mix of single stands or as small patches and water weeds
4GrasslandAreas predominantly under grass cover
5BarelandDegraded areas usually with little or no vegetation (uncovered soils)
6Rainfed croplandAreas for farming that depend on rainfall for water
7Irrigated croplandAreas for farming equipped to provide water
8WaterRivers, lakes, and dams
Table 2. Characteristics of satellite images used for classification.
SensorAcquisition DateYear Assigned to Classification
Dry SeasonWet Season
Landsat 5 TMMar, 1989July, 19871988
Landsat 5 TMJan, 1995Mar,19951995
Landsat 5 TMFeb, 2002July, 20022002
Landsat 5 TMJan, 2010June, 20082009
Landsat 8 OLIFeb, 2016July, 20152016
Table 3. LULC proportions for each class in hectares (ha) and percent share of the total area for 1988, 1995, 2002, 2009, and 2016.
LULC Classes19881995200220092016
ha% Shareha% Shareha% Shareha% Shareha% Share
Prosopis8820.533451.983754.713,5687.518,79210.4
Vachellia tortilis85174.768093.831581.837182.149152.7
Mixed vegetation128,72771.5130,38572.4132,96973.9124,39269.1123,31068.5
Grassland72294.056523.111940.76910.49770.5
Bareland15,0018.316,9049.414,1307.913,4207.585034.7
Rainfed cropland38402.131891.855313.154533.024081.3
Irrigated cropland15010.84730.314630.837082.16520.4
Water14,3258.013,2647.413,2047.315,0718.420,46411.4
Table 4. The overall net changes of LULC in hectares (ha) and percent class shares of total study area and percent class shares of base class area in 1988. Changes were calculated for 1988–1995, 1995–2002, 2002–2009, 2009–2016, 1988–2016.
Net Changes1988–19951995–20022002–20092009–20161988–2016
LULCha% Total Area% of Class Area in 1988ha% Total Area% of Class Area in 1988ha% Total Area% of Class Area in 1988ha% Total Area% of Class Area in 1988ha% Total Area% of Class Area in 1988
Prosopis24631.4279.450302.8570.451932.9589.052242.9592.51791010.02031.3
Vachellia tortilis−1708−1.0−20.1−3651−2.0−42.95600.36.611970.714.1−3602−2.0−42.3
Mixed vegetation16580.91.325831.42.0−8576−4.8−6.7−1082−0.6−0.8−5417−3.0−4.2
Grassland−1577−0.9−21.8−4458−2.5−61.7−503−0.3−7.02860.24.0−6252−3.5−86.5
Bareland19031.112.7−2774−1.5−18.5−709−0.4−4.7−4917−2.7−32.8−6498−3.6−43.3
Rainfed cropland−651−0.4−17.023421.361.0−78−0.0−2.0−3045−1.7−79.3−1432−0.8−37.3
Irrigated cropland−1027−0.6−68.59890.666.022461.3149.7−3056−1.7−203.7−849−0.5−56.6
Water−1061−0.6−7.4−61−0.0−0.418681.013.053933.037.661393.442.9
Table 5. The net impact of Prosopis invasion on individual LULC for 1988–1995, 1995–2002, 2002–2009, 2009–2016, and for 1988–2016. The numbers represent the time interval, V (Vachellia tortilis), P (Prosopis), M (Mixed vegetation), G (Grassland), B (Bareland), R (Rainfed cropland), I (Irrigated cropland), W (Water). Rows in bold represent periods with highest change, rows in italics periods with lowest change. The rows with border line represent the overall net changes associated with Prosopis invasion from 1988 to 2016.
Time PeriodLosses to P (ha)Gains from P (ha)Net Change (ha)% of Class Area in 1988
V88-P95984235−750−8.8
V95-P022146237−1909−22.4
V02-P09789409−381−4.5
V09-P16913281−633−7.4
V88-P16347826−3453−40.5
M88-P95651227−424−0.3
M95-P022183725−1458−1.1
M02-P0938371340−2498−1.9
M09-P1642471753−2494−1.9
M88-P16630893−6215−4.8
G88-P9551082−428−5.9
G95-P021042163−879−12.2
G02-P09341170−171−2.4
G09-P161262851592.2
G88-P16268813−2675−37
B88-P95505−44−0.3
B95-P021009124−885−5.9
B02-P092977856−2121−14.1
B09-P163644974−2670−17.8
B88-P16536110−5351−35.7
R88-P95170.7−17−0.4
R95-P02516110.3
R02-P09709139−571−14.9
R09-P16423136−287−7.5
R88-P161313−129−3.4
I88-P95440−44−2.9
I95-P02758513.4
I02-P09456368−89−5.9
I09-P161287173−1115−74.3
I88-P163785−373−24.9
W88-P957581−757−5.3
W95-P024484400.3
W02-P090.16376364.4
W09-P1671822181412.7
W88-P16102952852

