Characterization of Electromagnetic Properties of In Situ Soils for the Design of Landmine Detection Sensors: Application in Donbass, Ukraine


 , , and
Abstract
:1. Introduction
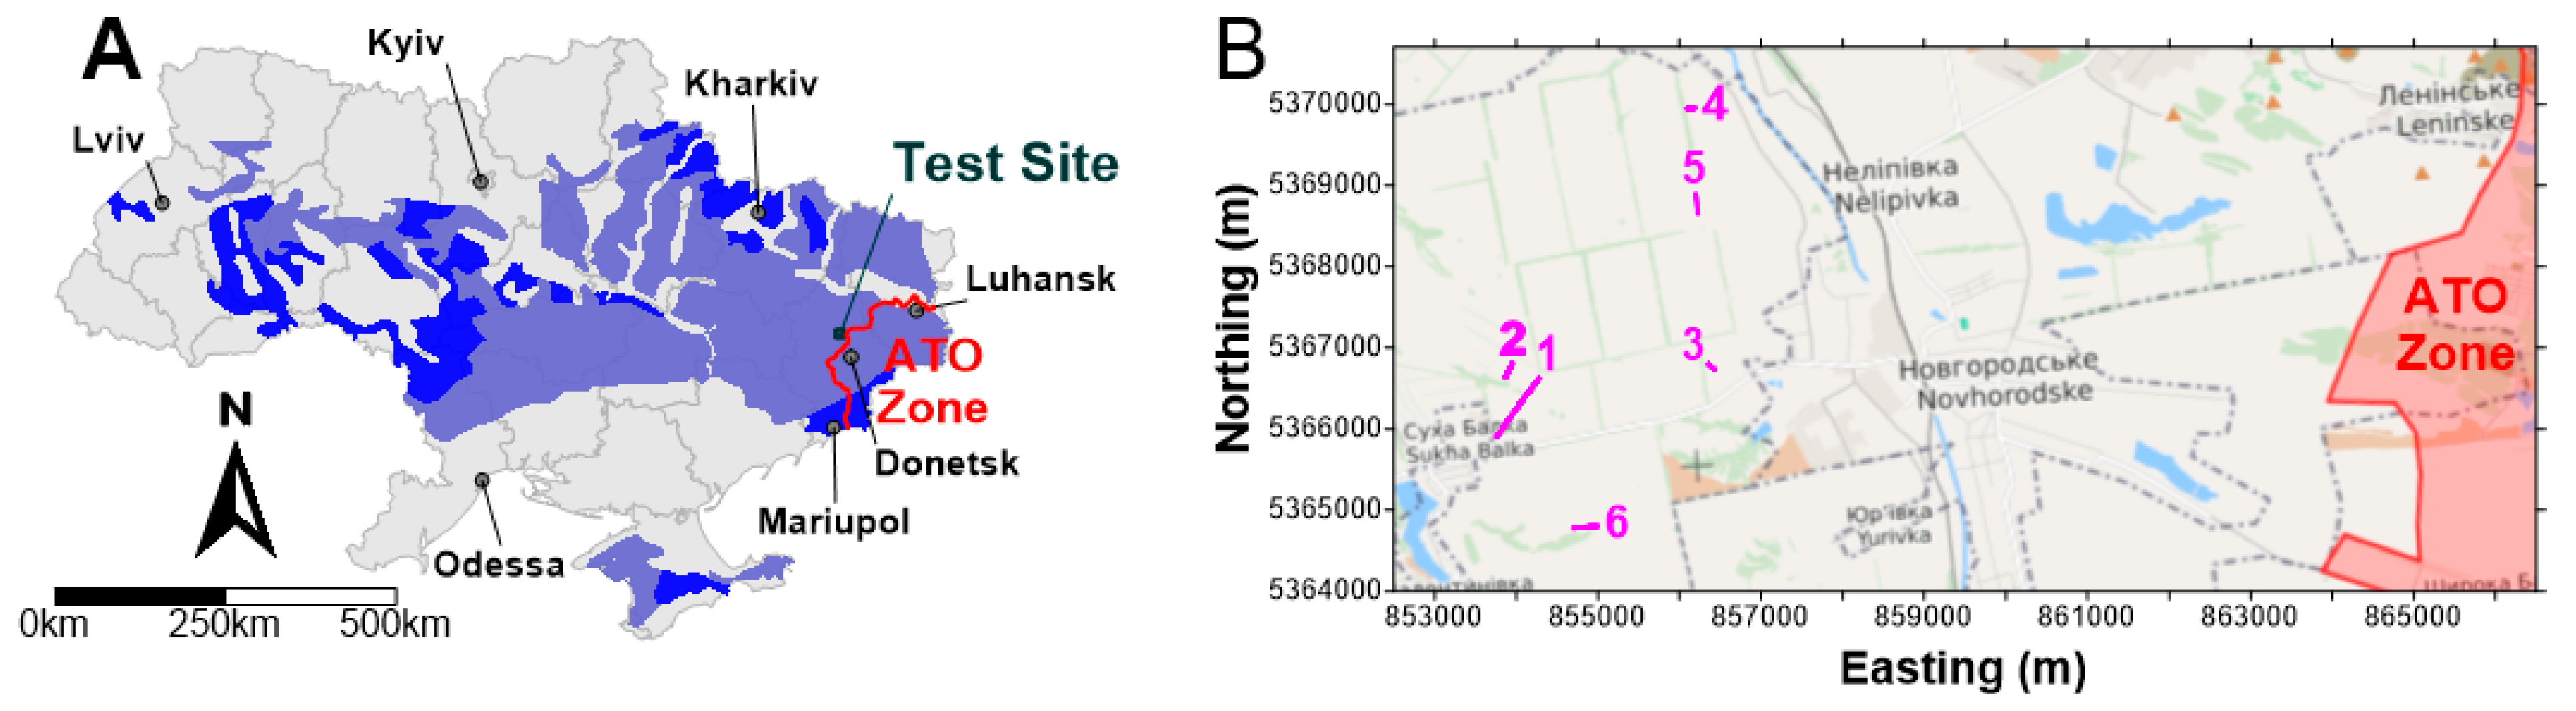
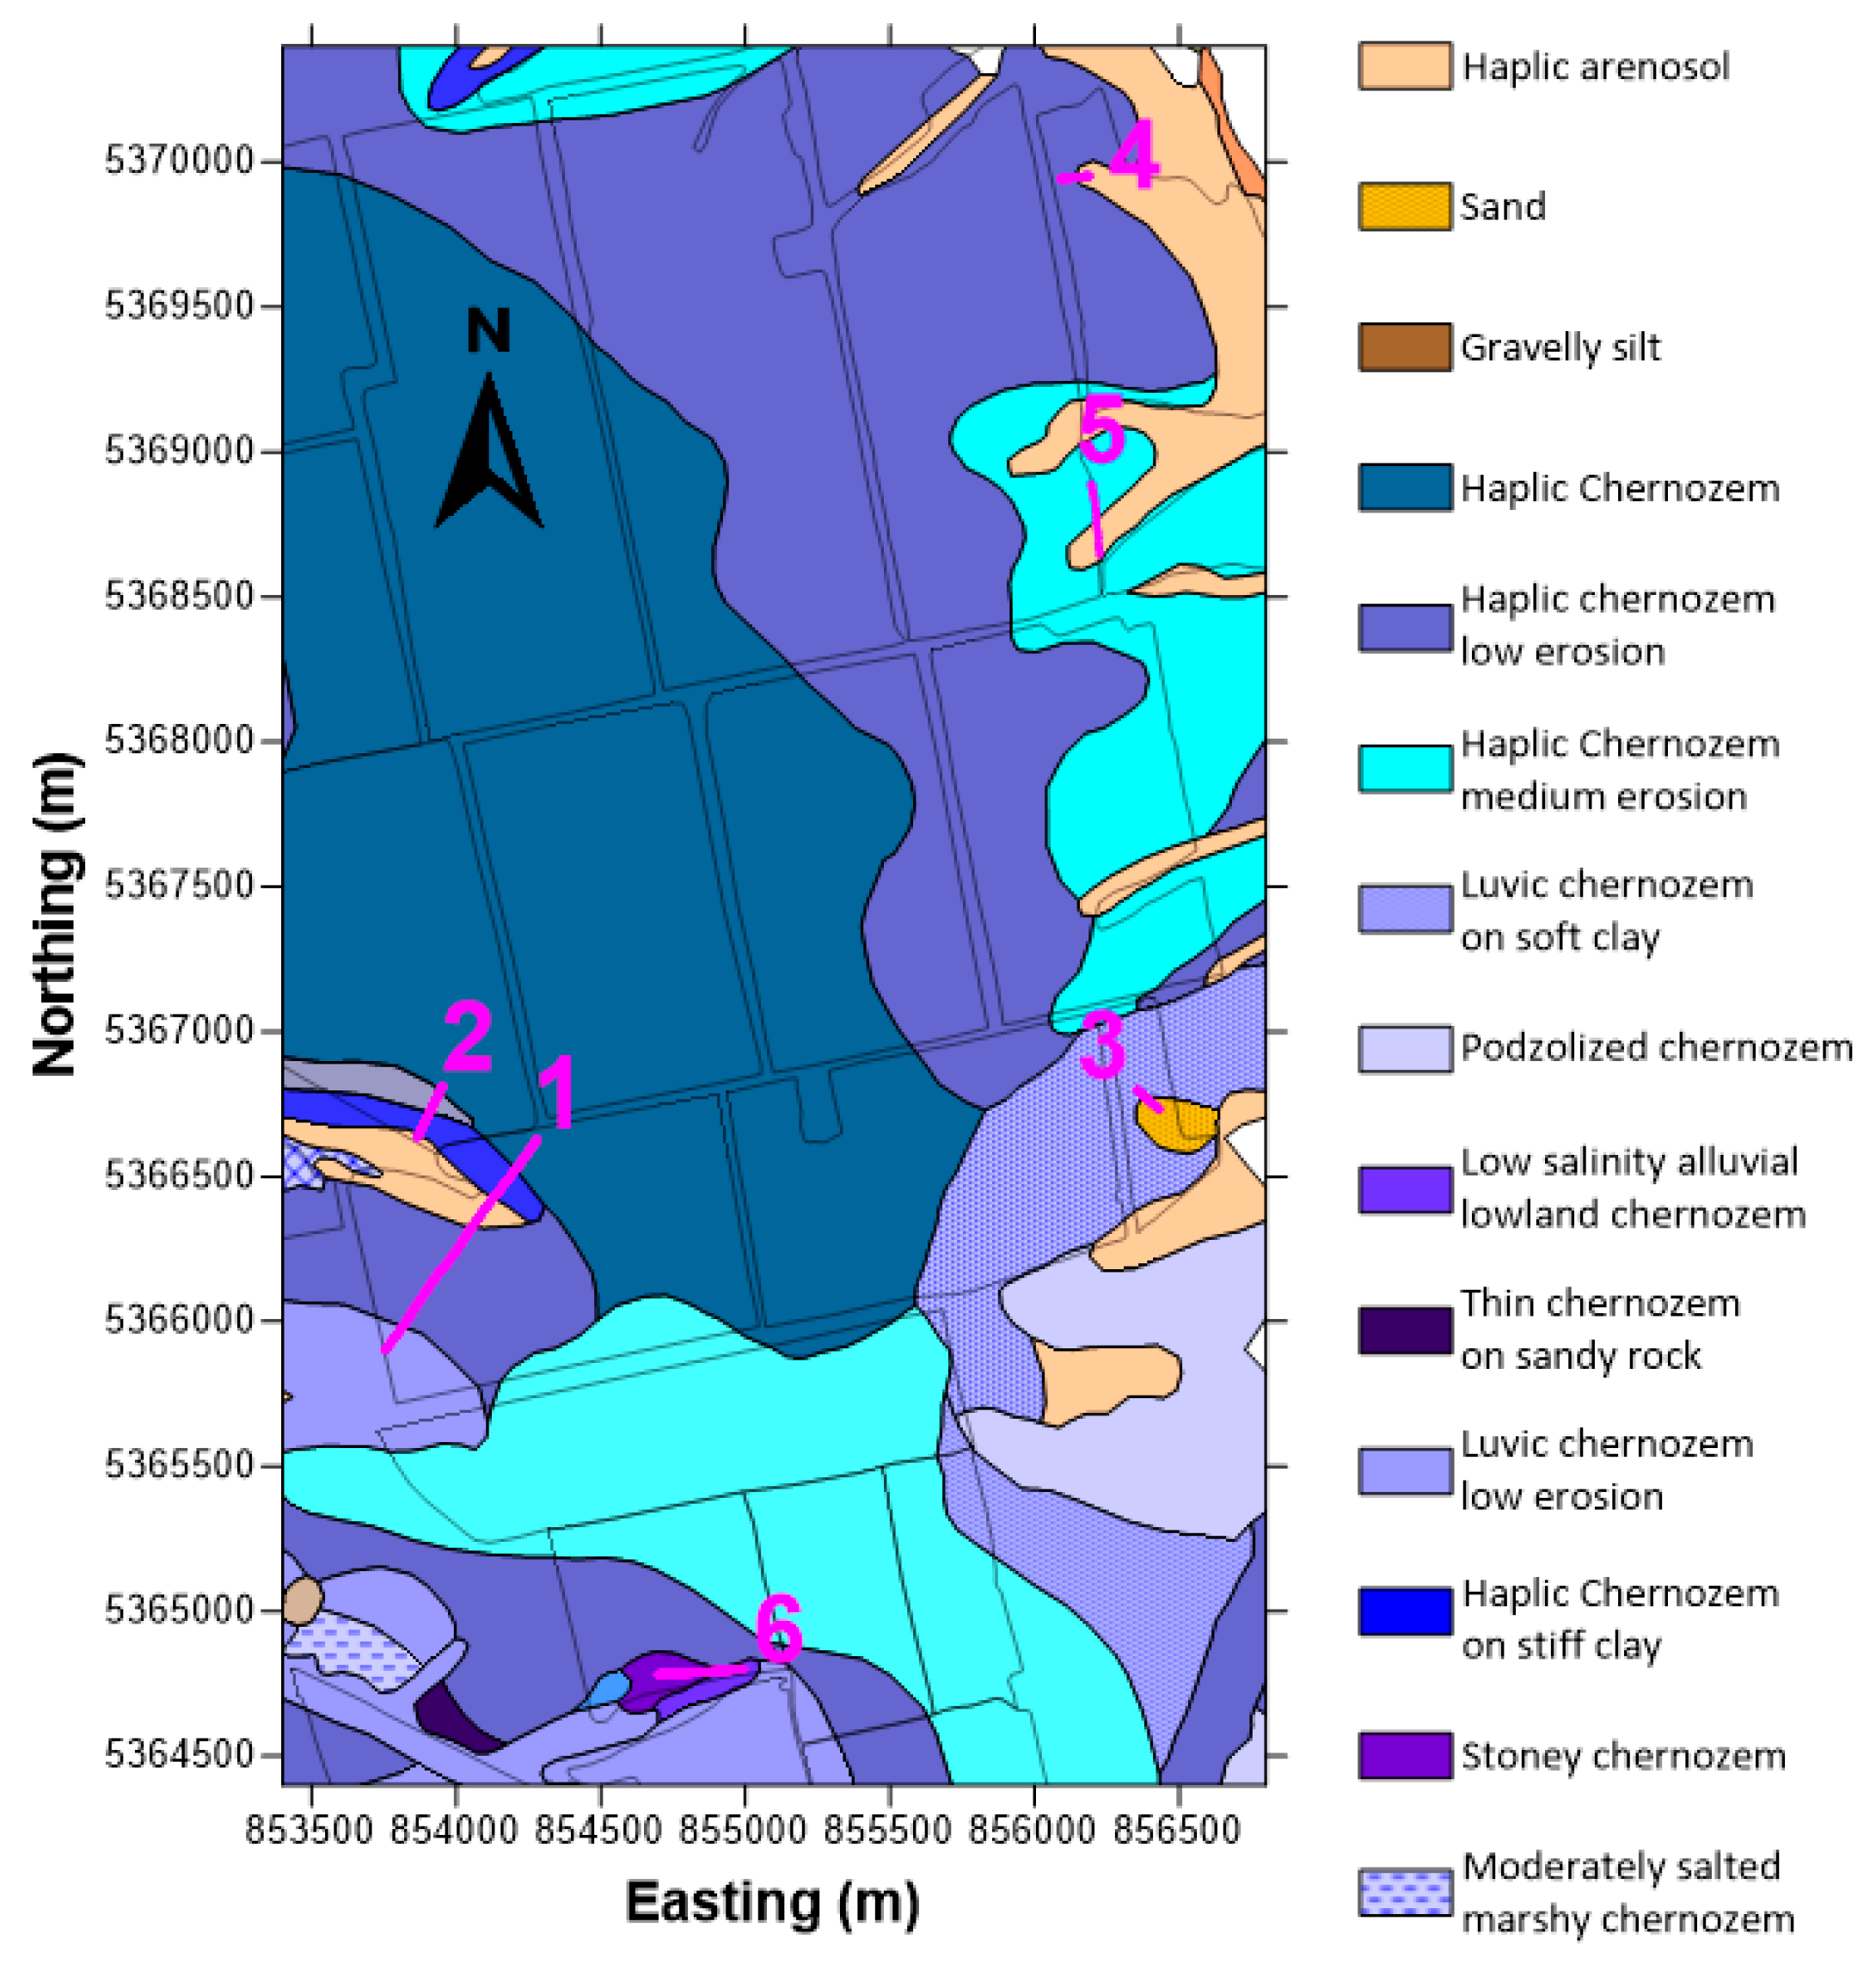
2. Soils in Donbass
3. Field Methods
4. Measurement Results
5. Conclusions
Author Contributions
Funding
Acknowledgments
Conflicts of Interest
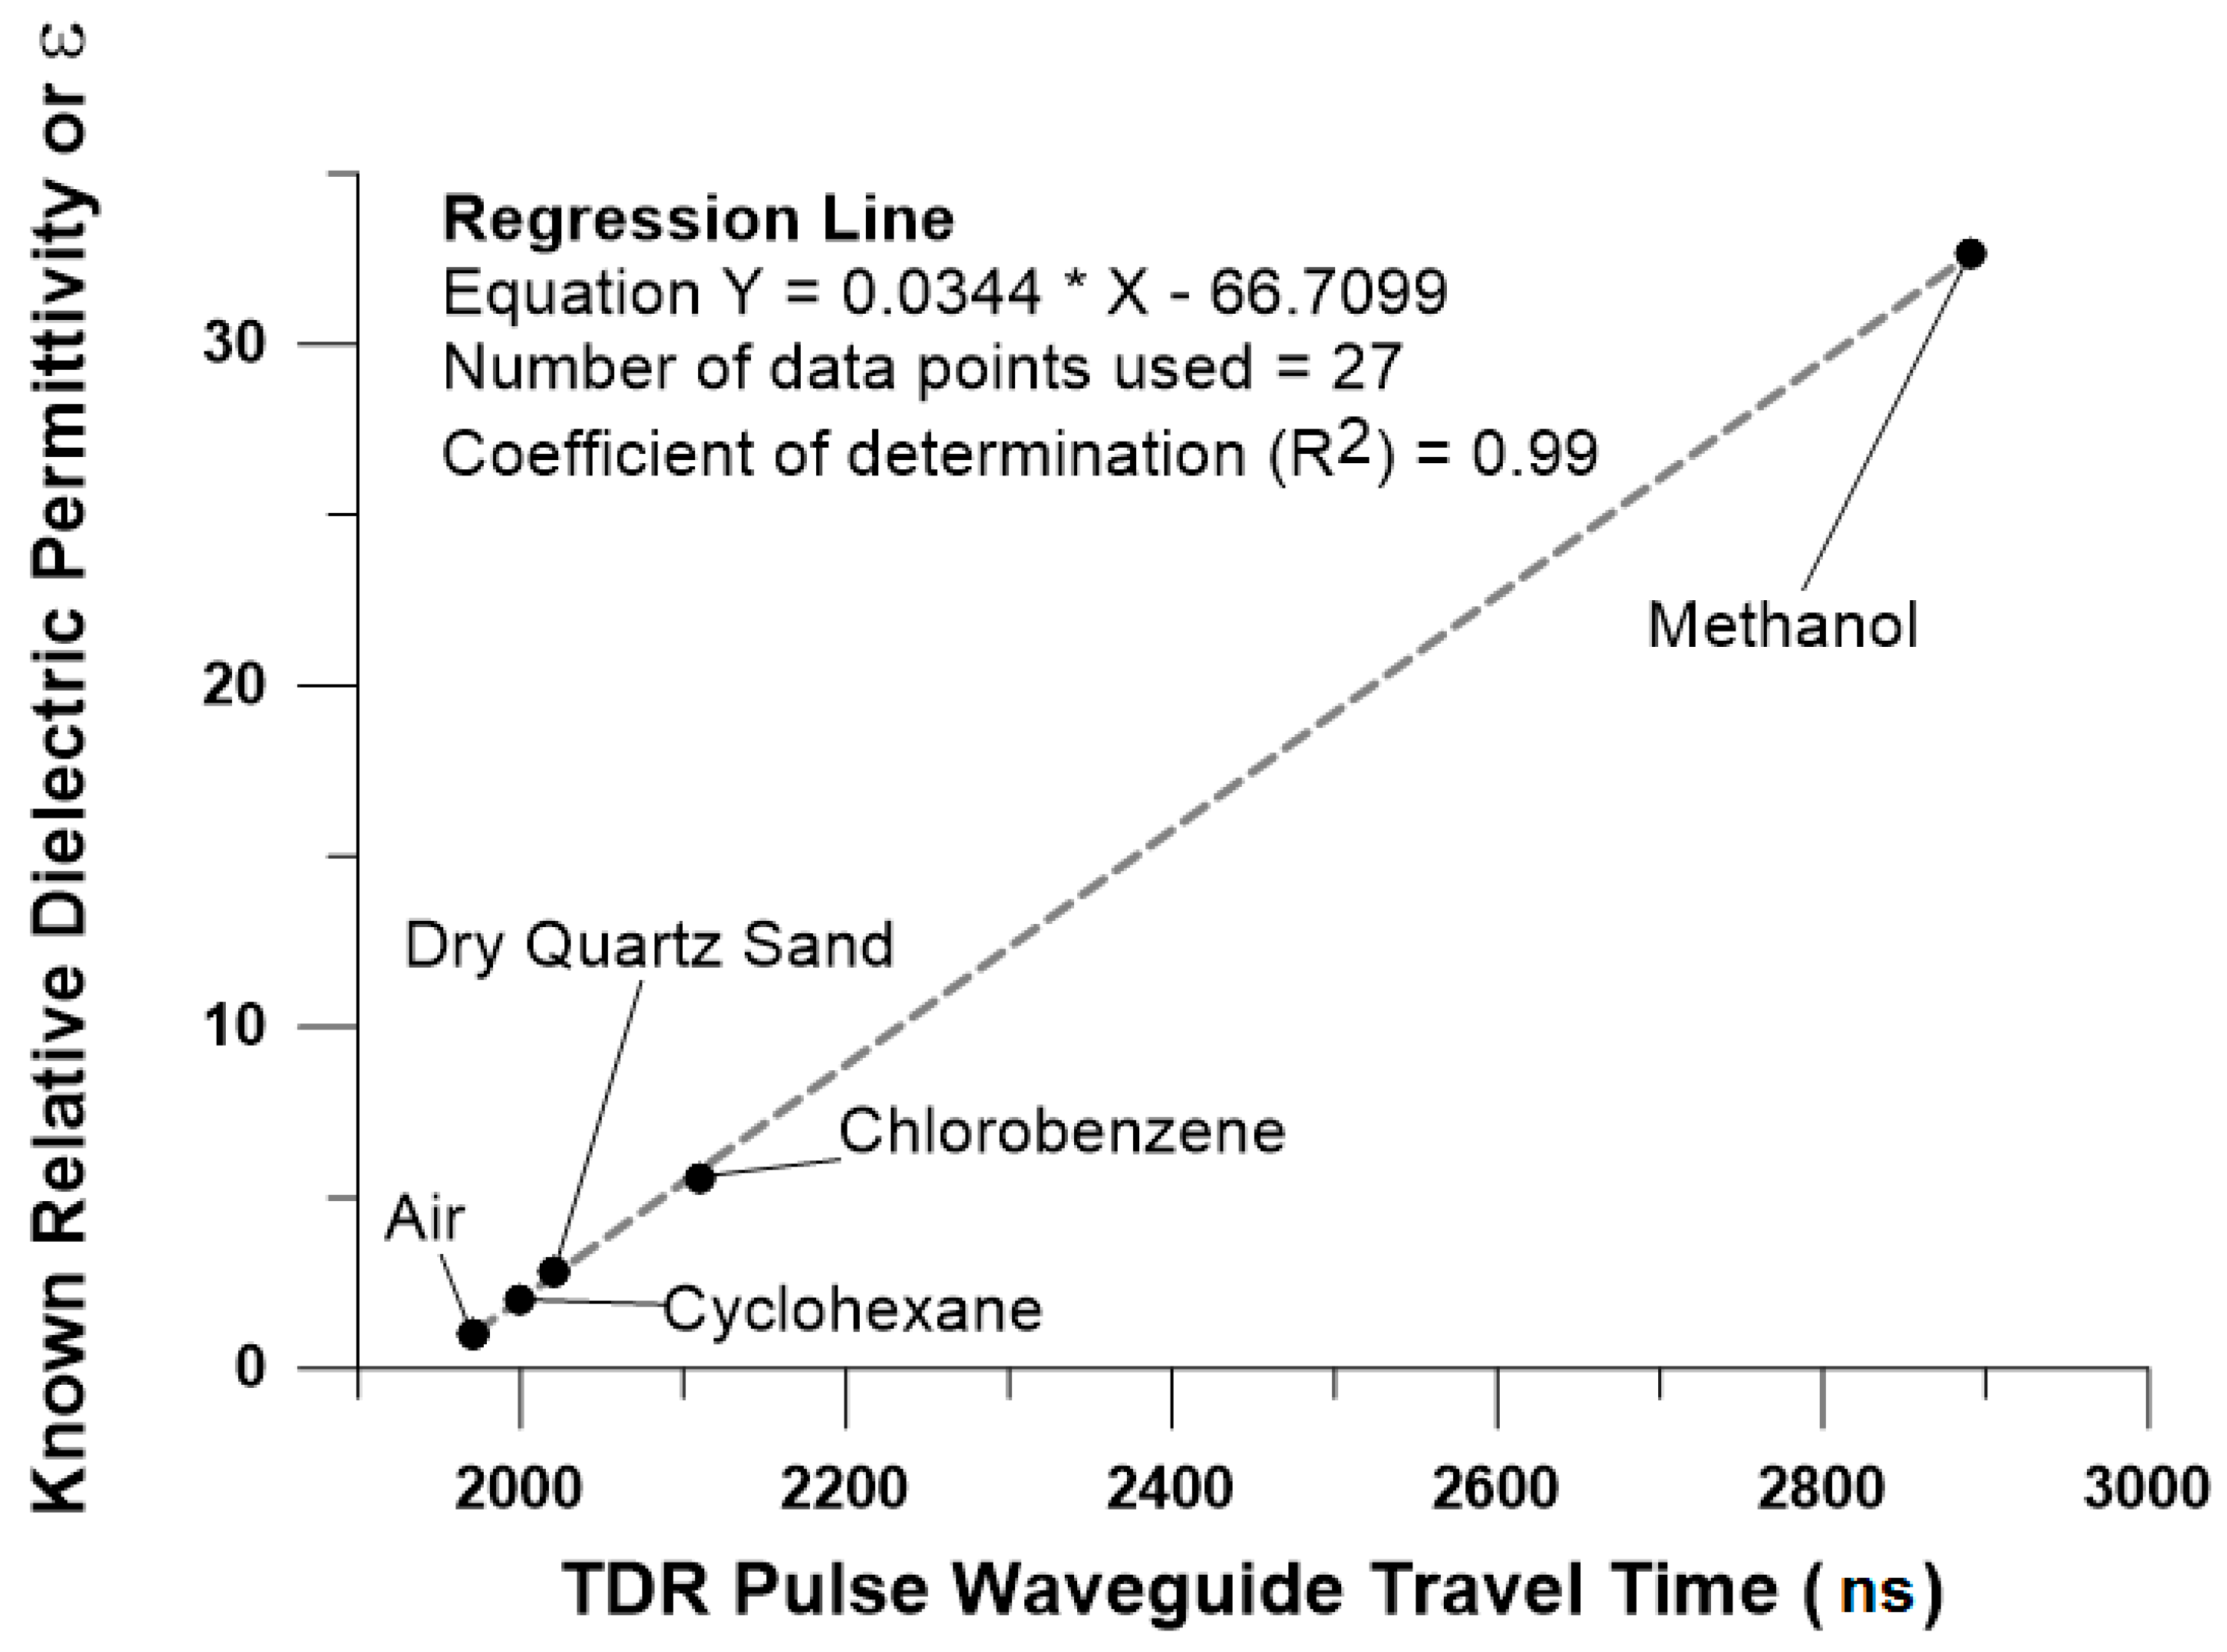
Appendix A. GPR Calibration in a Dry Sand Test Bed


Appendix A.1. Time of Flight Method

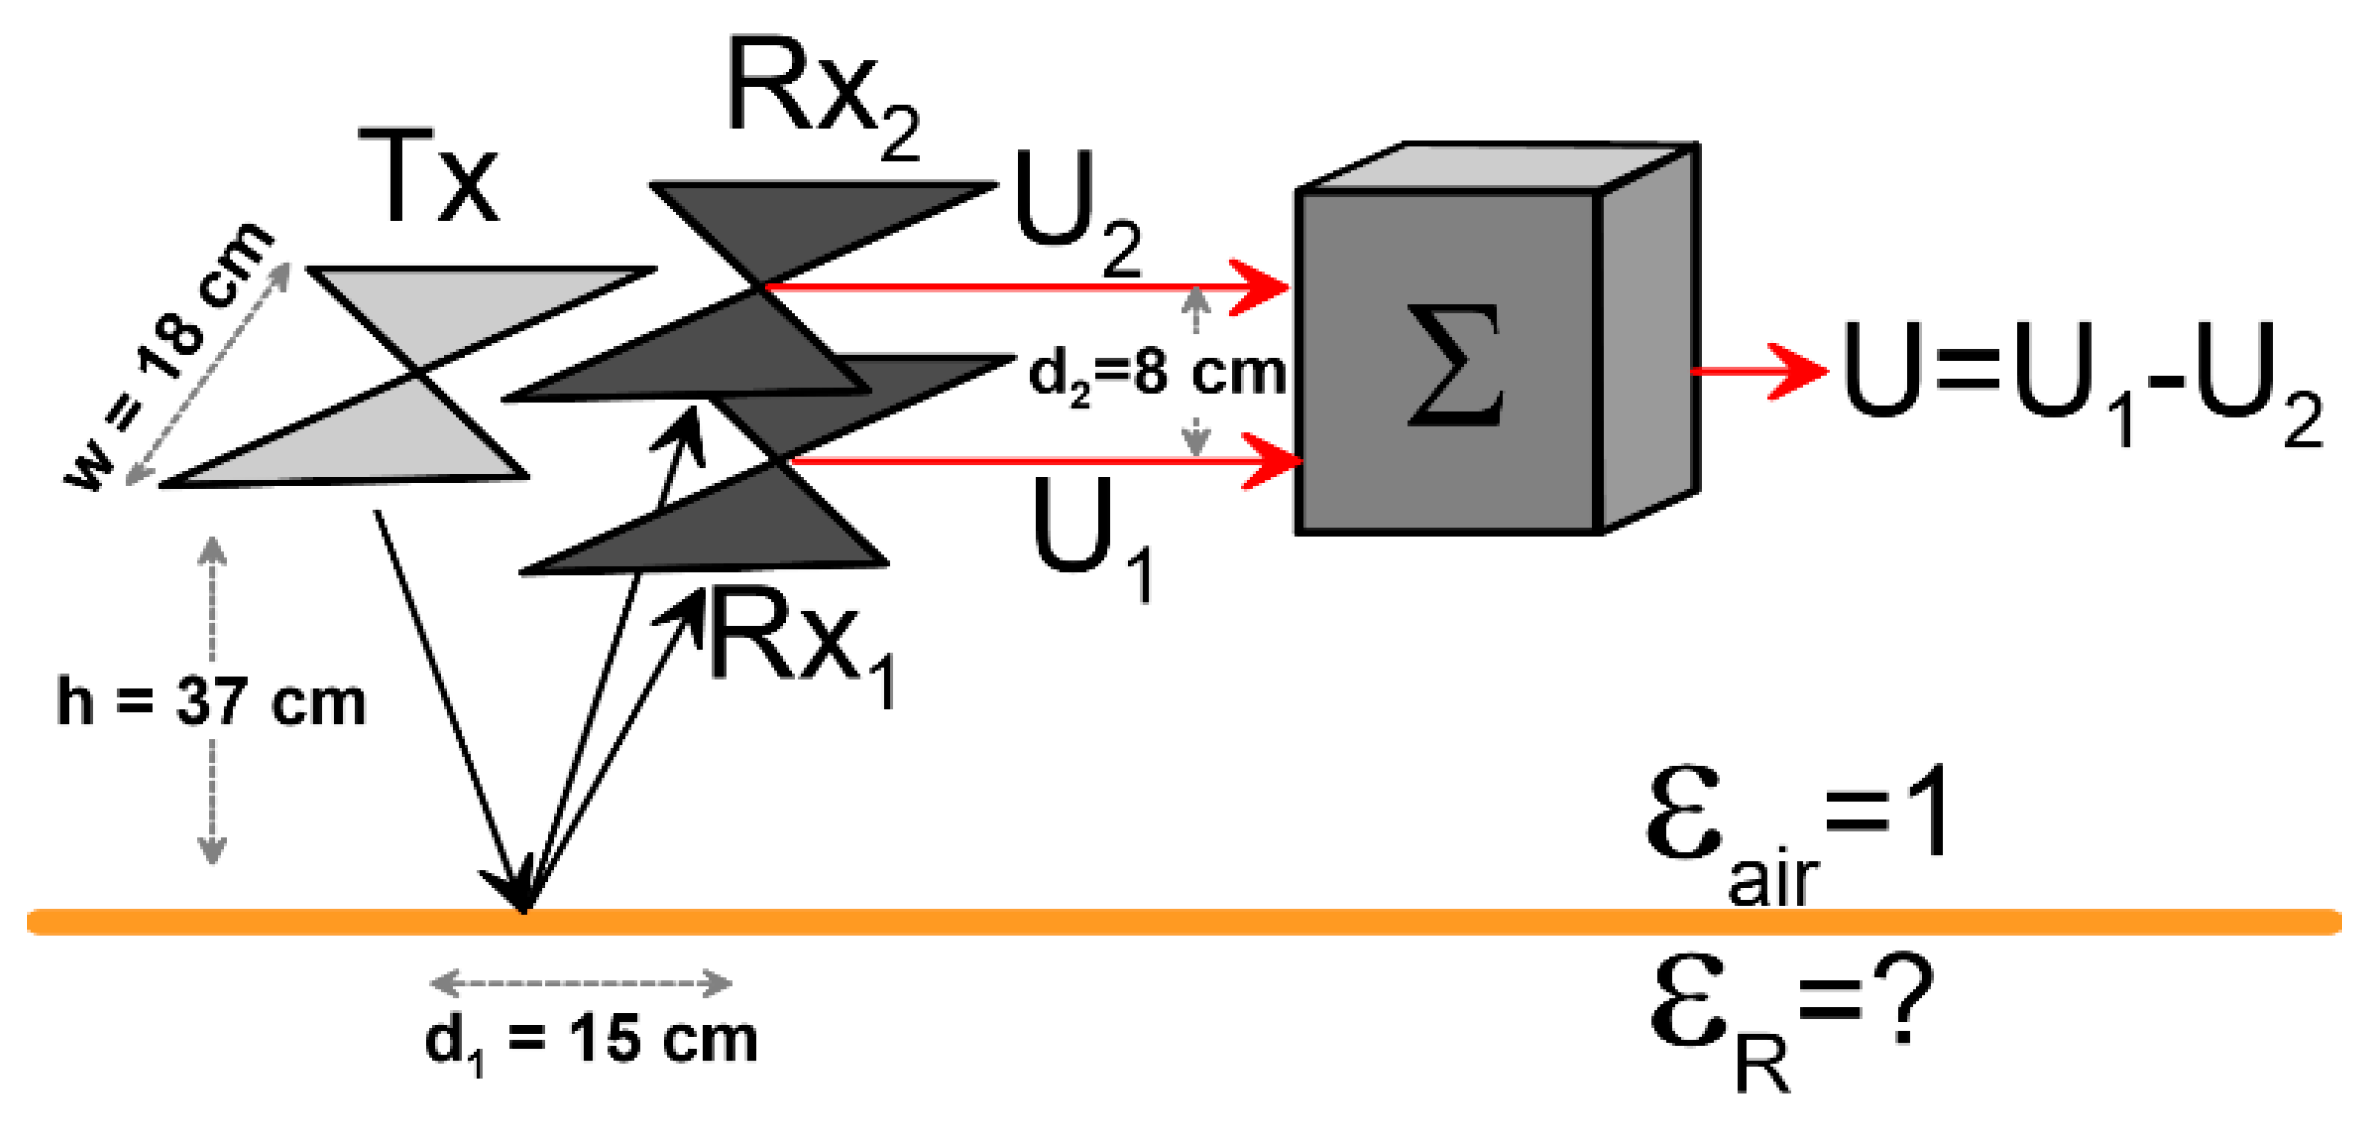
Appendix A.2. Reflection Coefficient Method
References
- UNODA. Fact Sheet; Convention on the Prohibition of the Use, Stockpiling, Production, and Transfer of Anti-Personnel Mines, and on their Destruction; UNODA: New York, NY, USA, 2016. [Google Scholar]
- Marchenko, G. Humanitarian Demining Measures in the De-Occupied Areas of Donetsk and Luhansk Oblasts of Ukraine and Assistance to Victims of Explosive Ordnance and Military Operation of Russian Terrorist Groups; GICHD: Geneva, Switzerland, 2015. [Google Scholar]
- MacDonald, J.; Lockwood, J.R.; McFee, J.; Altshuler, T.; Broach, T. Alternatives for landmine Detection; Rand Corp: Santa Monica, CA, USA, 2003. [Google Scholar]
- Ivashov, S.I.; Capineri, L.; Bechtel, D.T. Holographic Subsurface Radar Technology and Applications in Ultrawideb and Radar, Applications and Design; Taylor, J.D., Ed.; CRC Press: Boca Raton, FL, USA, 2012; pp. 421–444. [Google Scholar]
- Pochanin, G.P.; Masalov, S.A.; Ruban, V.P.; Kholod, P.V.; Batrakov, D.O.; Batrakova, A.G.; Varianytsia-Roshchupkina, L.A.; Urdzik, S.N.; Pochanin, O.G. Advances in Short-Range Distance and Permittivity Ground Penetrating Radar Measurements for Road Surface Surveying in Advanced Ultrawideband Radar, Signals, Targets, and Applications; Taylor, J.D., Ed.; CRC Press: Boca Raton, FL, USA, 2016; pp. 19–64. [Google Scholar]
- Borgioli, G.; Bulletti, A.; Calzolai, M.; Capineri, L. A New sensorized prodder device for the detection of vibrational characteristics of buried objects. IEEE Trans. Geosci. Remote Sens. 2014, 52, 3440–3452. [Google Scholar] [CrossRef]
- Bechtel, T.; Capineri, L.; Windsor, C.; Inagaki, M.; Ivashov, S. Comparison of ROC Curves for Landmine Detection by Holographic Radar with ROC Data from Other Methods. In Proceedings of the 8th International Workshop on Advanced Ground Penetrating Radar (IWAGPR), Florence, Italy, 7–10 July 2015; IEEE: Piscataway, NJ, USA, 2015. [Google Scholar]
- King, C. Demining: Enhancing the Process, in Landmines and Human Security: International Politics and War’s Hidden Legacy; Matthew, R.A., McDonald, B., Rutherford, K.R., Eds.; SUNY Press: New York, NY, USA, 2004; pp. 139–149. [Google Scholar]
- Bechtel, T.; Truskavetsky, S.; Capineri, L.; Pochanin, G.; Simic, N.; Viatkin, K.; Sherstyuk, A.; Byndych, N.; Falorni, P.; Bulletti, A.; et al. Survey of Electromagnetic Characteristics of Soils in the Donbass Region (Ukraine) for Evaluation of the Applicability of GPR and MD for Landmine Detection. In Proceedings of the 16th International Conference on Ground Penetrating Radar (GPR), Hong Kong, China, 13–16 June 2016; pp. 1–6, IWAGPR. [Google Scholar]
- Pochanin, G.P.; Kholod, P.; Glazounov, V.; Efimova, N. New Lines of Approach to the Problem of Plastic Mines Detection by GPR Method. In Proceedings of the European Association of Geoscientists & Engineers 63rd Conference and Technical Exhibition, Amsterdam, Houten, The Netherlands, 11–15 June 2001; pp. 143–148. [Google Scholar]
- Miller, T.W.; Borchers, B.; Hendrickx, J.M.H.; Hong, S.; Dekker, L.W.; Ritsema, C.J. Effects of Soil Physical Properties on GPR for Landmine Detection. In Proceedings of the Fifth International Symposium on Technology and the Mine Problem, Monterey, CA, USA, 22–26 April 2002. [Google Scholar]
- Riahi, M.; Tavangar, A. Prediction of GPR Performance in Landmine Detection. In Proceedings of SPIE, Nondestructive Characterization for Composite Materials, Aerospace Engineering, Civil Infrastructure, and Homeland Security; SPIE: Bellingham, WA, USA, 2009; Volume 7294. [Google Scholar]
- Borchers, B.J.; Hendrickx, J.M.H.; Das, B.S.; Hong, S. Enhancing Dielectric Contrast Between Land Mines and the Soil Environment by Watering: Modeling, Design, and Experimental Results. In Proceedings of SPIE; SPIE: Bellingham, WA, USA, 2000; Volume 4038, pp. 993–1000. [Google Scholar]
- Igel, J.; Preetz, H. Small-Scale Variability of Electromagnetic Soil Properties and Their Influence on Landmine Detection: How to Measure, How to Analyze, and How to Interpret? In Proceedings of SPIE, Detection and Sensing of Mines, Explosive Objects, and Obscured Targets XIV, 730312; SPIE: Bellingham, WA, USA, 2009; Volume 7303. [Google Scholar]
- Petrenko, V.D.; Kovalevych, V.V. The Results of the Defect Places Investigation of Donetsk Railway Road Bed by Ground Penetrating Radar Complex. Science and Progress in Transport. Bull. Dnepropetr. Natl. Univ. Railw. Trans. 2014, 5. [Google Scholar] [CrossRef]
- Sugak VGBukin, A.V.; Reznichenko, N.G.; Djadoo, A. Forward Looking Ground Penetrating Radar with Synthetic Antenna Aperture for Buried Explosive Hazards Detection. In Proceedings of the 9th International Kharkiv Symposium on Physics and Engineering of Microwaves, Millimeter and Submillimeter Waves (MSMW), Kharkiv, Ukraine, 20–24 June 2016; IEEE: Piscataway, NJ, USA, 2016. [Google Scholar]
- Koshovyy, V.; Alokhina, O.; Skierucha, W.; Wilczek, A.; Pastuszka, T.; Cymerman, J. Peculiarities of soil moisture and temperature dynamics based on TDR-measurement results for 2008–2012 in the western Polesie territory of Ukraine Acta Agrophysica. Acta Agrophys. 2013, 20, 577–593. [Google Scholar]
- Food and Agriculture Organization. Digital Soil Map of the World; World Soil Resources Report; FAO: Rome, Italy, 2009. [Google Scholar]
- Yarovenko, F. Soils of Donetsk Region, Donetsk: “Donbass”; Kharkov Agricultural Institute: Kharkov, Ukrainian SSR, 1969; 56p. (In Ukranian) [Google Scholar]
- Krupsky, N.K.; Polupan, N.I. Atlas of soils of the Ukrainian SSR, Kiev: “Harvest”; Urozhai: Kyiv, Ukrainian SSR, 1979; 160p. (In Russian) [Google Scholar]
- Medvedev, V.V.; Laktionova, T.M.; Kanash, O.P. Soils of the Ukraine (Genesis and Agronomical Characteristics); University Publishing House: Kharkiv, Ukraine, 2003; 68p. (In Ukranian) [Google Scholar]
- Daniels, D.J. Ground Penetrating Radar for Buried Landmine and IED Detection. In Unexploded Ordnance Detection and Mitigation; NATO Science for Peace and Security Series B: Physics and Biophysics; Byrnes, J., Ed.; Springer: Dordrecht, The Netherlands, 2009; pp. 89–111. [Google Scholar]
- Comité Européen De Normalisation (Europäisches Komitee Für Normung). Humanitarian Mine Action-Test and Evaluation-Part 1: Metal Detectors; De Normalisation, Comité Européen, and Europäisches Komitee Für Normung: Brussels, Belgium, 2003. [Google Scholar]
- Takahashi, K.; Holger, P.; Igel, J. Soil properties and performance of landmine detection by metal detector and ground-penetrating radar—Soil characterisation and its verification by a field test. J. Appl. Geophys. 2011, 73, 368–377. [Google Scholar] [CrossRef]
- Finkelshtain, M.I.; Karpukhin, V.I.; Kutev, V.A.; Metelkin, V.N. Subsurface Radiolocation; Radio I Sviaz: Moscow, Russia, 1994; p. 216. [Google Scholar]
- Lecoanet, H.; Lévêque, F.; Segura, S. Magnetic Susceptibility in Environmental Applications: Comparison of Field Probes. Phys. Earth Planet. Inter. 1999, 115, 191–204. [Google Scholar] [CrossRef]
- Samouëlian, A.; Isabelle, C.; Alain, T.; Bruand, A.; Guy, R. Electrical resistivity survey in soil science: A review. Soil Tillage Res. 2005, 83, 173–193. [Google Scholar] [CrossRef]
- Robinson, D.A.; Jones, S.B.; Wraith, J.M.; Or, D.; Friedman, S.P. A review of advances in dielectric and electrical conductivity measurement in soils using time domain reflectometry. Vadose Zone J. 2003, 2, 444–475. [Google Scholar] [CrossRef]
- AMaryott, A.; Smith, E.R. Table of Dielectric Constants of Pure Liquids; No. NBS-514; National Bureau of Standards: Gaithersburg, MD, USA, 1951.
- Epp, L.W.; Mittra, R.; McCormack, R.G. Summary of Methods for Measuring Electrical Properties of Geological Strata to Estimate Electromagnetic Shielding Effectiveness; Construction Engineering Research Laboratory: Champaign, IL, USA; National Technical Information Service: Springfield, VA, USA, 1988.
- Capineri, L.; Daniels, D.J.; Falorni, P.; Lopera, O.L.; Windsor, C.G. Estimation of relative permittivity of shallow soils by using the ground penetrating radar response from different buried targets. Prog. Electromagn. Res. Lett. 2008, 2, 63–71. [Google Scholar] [CrossRef]
- Golovko, M.M.; Pochanin, G.P. Automatic Measurement of Ground Permittivity and Automatic Detection of Object Location with GPR Images Containing a Response from A Local Object in Ultrawideband Radar Applications and Design; Taylor, J.D., Ed.; CRC Press: Boca Raton, FL, USA, 2012; pp. 231–251. [Google Scholar]
- Jol, H.M. Ground Penetrating Radar: Theory and Applications; Elsevier Science: Amsterdam, The Netherlands, 2009. [Google Scholar]
- Igel, J. The small-Scale Variability of Electrical Soil Properties—Influence on GPR Measurements. In Proceedings of the 12th International Conference on Ground Penetrating Radar, Birmingham, UK, 16–19 June 2008. [Google Scholar]
- Pochanin, G.; Varianytsia-Roshchupkina, L.; Ruban, V.; Pochanina, I.; Falorni, P.; Borgioli, G.; Capineri, L.; Bechtel, T. Design and Simulation of a Single Transmitter—Four Receiver Impulse GPR for Detection of Buried Landmines. In Proceedings of the 9th International Workshop on Advanced Ground Penetrating Radar (IWAGPR), Edinburgh, UK, 28–30 June 2017; pp. 1–5. [Google Scholar]
- Soldovieri, F.; Prisco, G.; Persico, R.; Golovko, M.; Pochanin, G. Two Strategies for the Determination of Soil Permittivity by GPR Data. In Proceedings of the 12th International Conference on Ground Penetrating Radar University of Birmingham, Birmingham, UK, 15–19 June 2008. [Google Scholar]
- Lambot, S.; Slob, E.C.; van den Bosch, I.; Stockbroeckx, B.; Scheers, B.; Vanclooster, M. Estimating soil electric properties from monostatic ground-penetrating radar signal inversion in the frequency domain. Water Resour. Res. 2004, 40. [Google Scholar] [CrossRef] [Green Version]
- Kopylov, Y.A.; Masalov, S.A.; Pochanin, G.P. Method for Decoupling Between Transmitting and Receiving Modules of Antenna System. U.A. Patent 81652, 25 January 2008. [Google Scholar]
- LVarianytsia-Roshchupkina; Pochanin, G.P.; Pochanina, I.Y.; Masalov, S.A. Comparison of Different Antenna Configurations for Probing of Layered Media. In Proceedings of the 8th International Workshop on Advanced Ground Penetrating Radar, Florence, Italy, 7–10 July 2015; IEEE: Piscataway, NJ, USA, 2015. [Google Scholar]
- Herz, N.; Garrison, E.G. Geological Methods for Archaeology; Oxford University Press: Oxford, UK, 1997. [Google Scholar]
- Hari, S.N. (Ed.) Handbook of low and High Dielectric Constant Materials and Their Applications; Two-Volume Set; Academic Press: Cambridge, MA, USA, 1999. [Google Scholar]
- Turner, G.; Anthony, F.S. Constant Q Attenuation of Subsurface Radar Pulses. Geophysics 1994, 59, 1192–1200. [Google Scholar] [CrossRef]
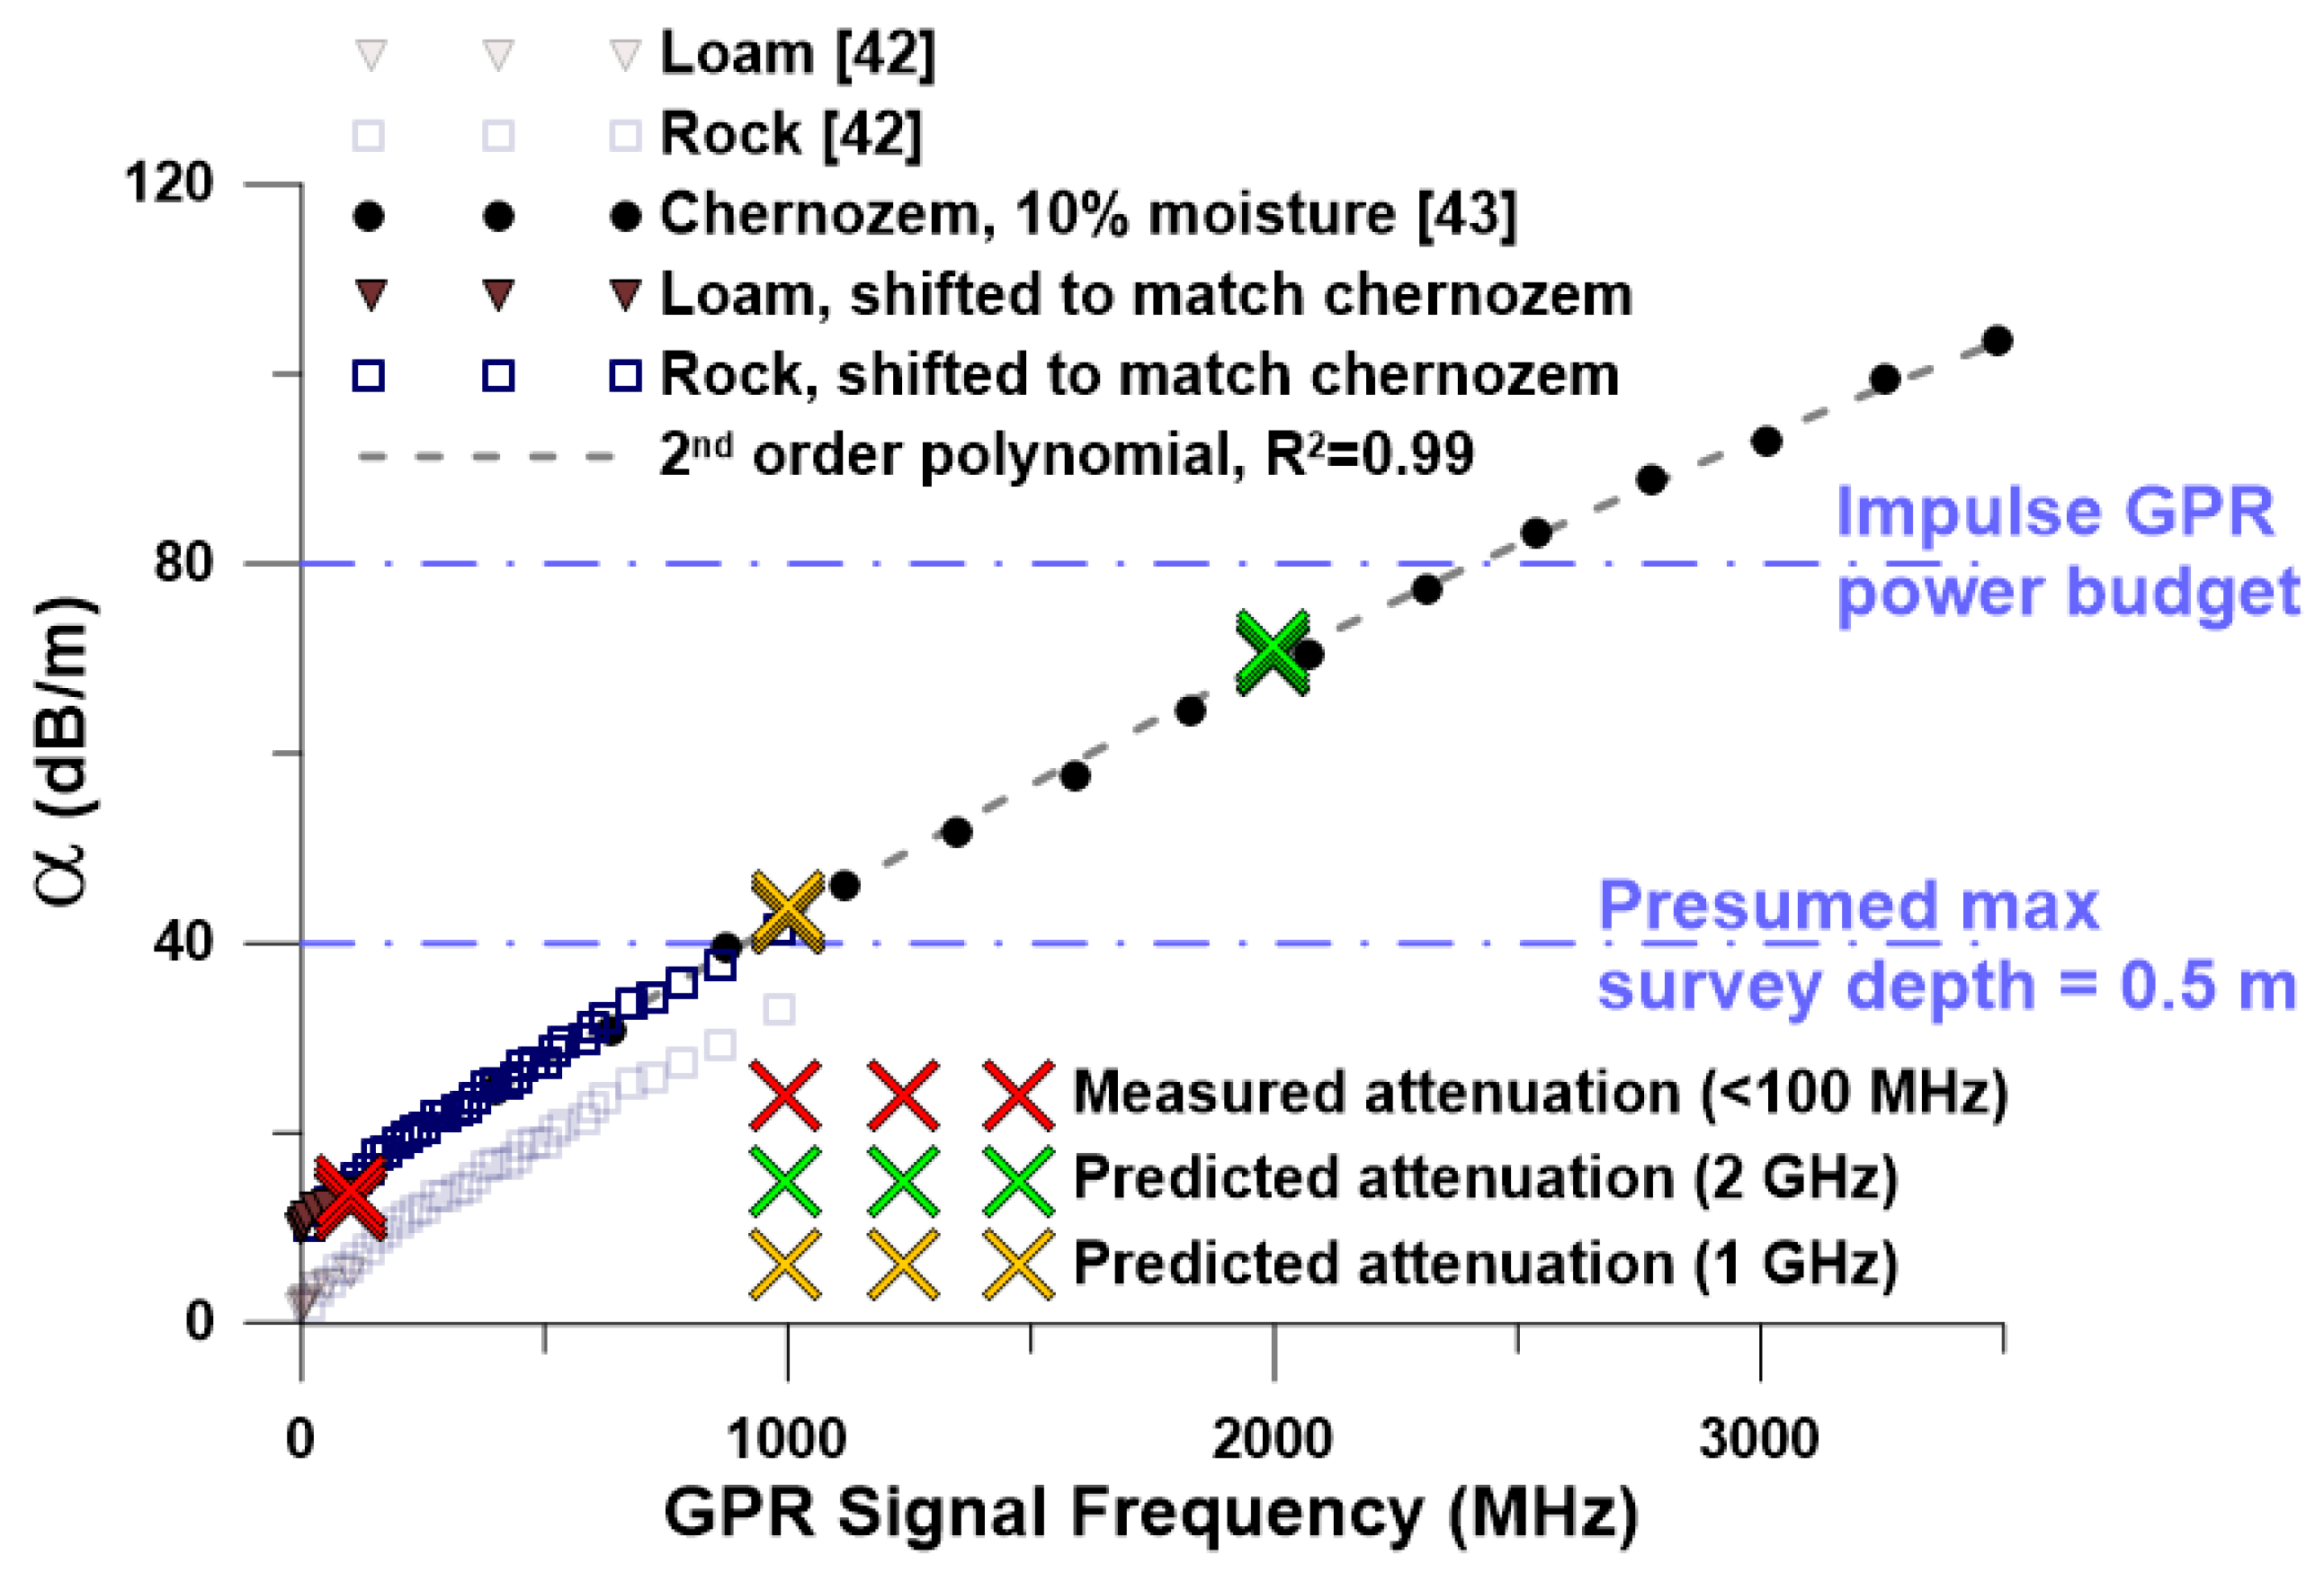
- Filonenko, V.A.; Chubinsky, N.P. Measuring the electric parameters of chernozem with various moisture contents in the frequency range 250–3500 MHz. J. Commun. Technol. Electron. 2006, 51, 685–690. [Google Scholar] [CrossRef]


| Type * | Use | Diameter (mm) | Length (mm) | Casing | Metal Parts |
|---|---|---|---|---|---|
| PMN-2 | AP | 121 | Plastic | Yes | |
| PMN-4 | AP | 95 | Plastic | Yes | |
| PTM-1G | AT | 69 | 337 | Plastic | Yes |
| TM-62M | AT | 320 | Metal | Yes | |
| TMM62-P3 | AT | 320 | Plastic | Yes |
| Parameter | Manufacturer | Model | OF | Deployment Details |
|---|---|---|---|---|
| COF | ||||
| Magnetic permeability µ | Bartington | MS2 | 580 Hz | MS2F probe fully inserted into soil |
| -- | ||||
| Electrical conductivity σ | L and R Instruments | MiniRes | DC | Wenner array; 10-cm electrode spacing |
| -- | ||||
| Dielectric permittivity εTDR | Spectrum Technologies | Field Scout 300 | ~100 MHz | 7.5 cm probes |
| -- | ||||
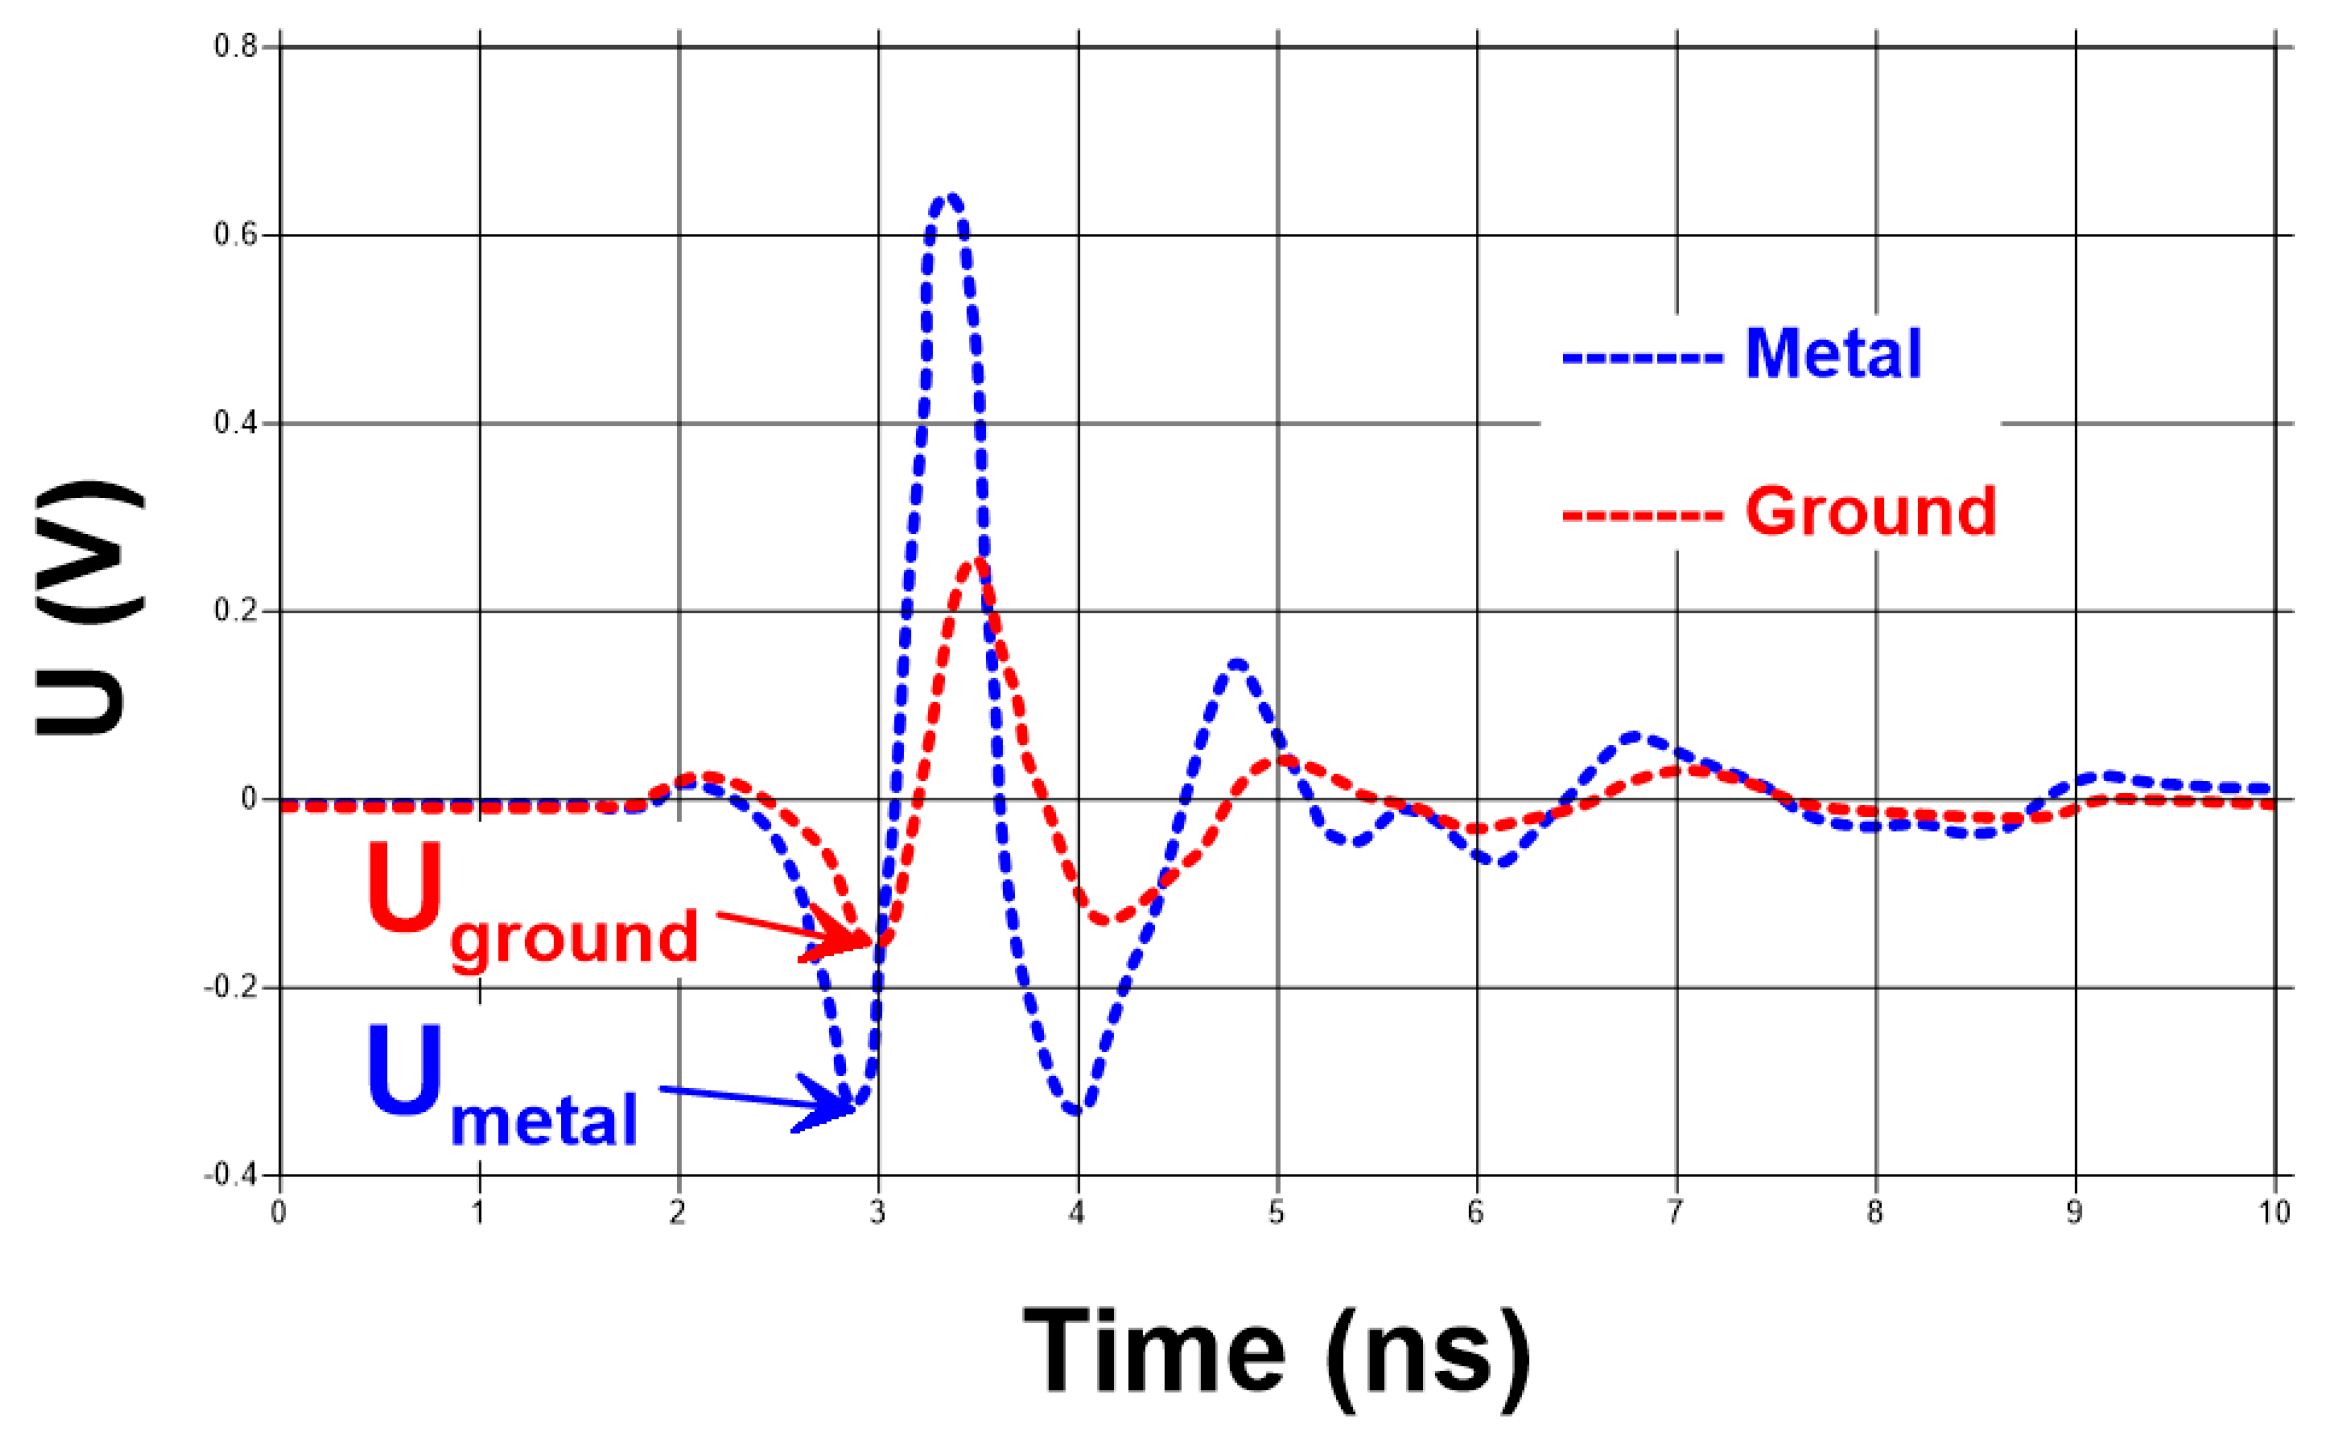
| Dielectric permittivity εR | Custom | -- | -- | 1-transmitter, 2-receiver impulse GPR; paired measurements over aluminum sheet and ground |
| 1.2 GHz |
| Soil Type | No. of Samples | Average v | σ |
|---|---|---|---|
| (m/ns) | |||
| Haplic Arenosol | 98 | 0.058 | 0.011 |
| Haplic Chernozem | 358 | 0.058 | 0.01 |
| Luvic Chernozem | 190 | 0.059 | 0.013 |
| Sand | 28 | 0.061 | 0.007 |
| Stony Chernozem | 113 | 0.064 | 0.011 |
| Low Salinity Alluvial Lowland Chernozem | 38 | 0.056 | 0.008 |
© 2019 by the authors. Licensee MDPI, Basel, Switzerland. This article is an open access article distributed under the terms and conditions of the Creative Commons Attribution (CC BY) license (http://creativecommons.org/licenses/by/4.0/).
Share and Cite
Bechtel, T.; Truskavetsky, S.; Pochanin, G.; Capineri, L.; Sherstyuk, A.; Viatkin, K.; Byndych, T.; Ruban, V.; Varyanitza-Roschupkina, L.; Orlenko, O.; et al. Characterization of Electromagnetic Properties of In Situ Soils for the Design of Landmine Detection Sensors: Application in Donbass, Ukraine. Remote Sens. 2019, 11, 1232. https://0-doi-org.brum.beds.ac.uk/10.3390/rs11101232
Bechtel T, Truskavetsky S, Pochanin G, Capineri L, Sherstyuk A, Viatkin K, Byndych T, Ruban V, Varyanitza-Roschupkina L, Orlenko O, et al. Characterization of Electromagnetic Properties of In Situ Soils for the Design of Landmine Detection Sensors: Application in Donbass, Ukraine. Remote Sensing. 2019; 11(10):1232. https://0-doi-org.brum.beds.ac.uk/10.3390/rs11101232
Chicago/Turabian StyleBechtel, Timothy, Stanislav Truskavetsky, Gennadiy Pochanin, Lorenzo Capineri, Alexander Sherstyuk, Konstantin Viatkin, Tatyana Byndych, Vadym Ruban, Liudmyla Varyanitza-Roschupkina, Oleksander Orlenko, and et al. 2019. "Characterization of Electromagnetic Properties of In Situ Soils for the Design of Landmine Detection Sensors: Application in Donbass, Ukraine" Remote Sensing 11, no. 10: 1232. https://0-doi-org.brum.beds.ac.uk/10.3390/rs11101232