Identifying Dry-Season Rice-Planting Patterns in Bangladesh Using the Landsat Archive


1
College of Agriculture, Arkansas State University, Jonesboro, AR 72467, USA
2
Environmental Science and Policy, University of California, Davis, CA 95616, USA
*
Author to whom correspondence should be addressed.
Remote Sens. 2019, 11(10), 1235; https://0-doi-org.brum.beds.ac.uk/10.3390/rs11101235
Submission received: 17 April 2019
/
Revised: 15 May 2019
/
Accepted: 22 May 2019
/
Published: 24 May 2019
Abstract
:In many countries, in situ agricultural data is not available and cost-prohibitive to obtain. While remote sensing provides a unique opportunity to map agricultural areas and management characteristics, major efforts are needed to expand our understanding of cropping patterns and the potential for remotely monitoring crop production because this could support predictions of food shortages and improve resource allocation. In this study, we demonstrate a new method to map paddy rice using Google Earth Engine (GEE) and the Landsat archive in Bangladesh during the dry (boro) season. Using GEE and Landsat, dry-season rice areas were mapped at 30 m resolution for approximately 90,000 km2 annually between 2014 and 2018. The method first reconstructs spectral vegetation indices (VIs) for individual pixels using a harmonic time series (HTS) model to minimize the effect of any sensor inconsistencies and atmospheric noise, and then combines the time series indices with a rule-based algorithm to identify characteristics of rice phenology to classify rice pixels. To our knowledge, this is the first time an annual pixel-based time series model has been applied to Landsat at the national level in a multiyear analysis of rice. Findings suggest that the harmonic-time-series-based vegetation indices (HTS-VIs) model has the potential to map rice production across fragmented landscapes and heterogeneous production practices with comparable results to other estimates, but without local management or in situ information as inputs. The HTS-VIs model identified 4.285, 4.425, 4.645, 4.117, and 4.407 million rice-producing hectares for 2014, 2015, 2016, 2017, and 2018, respectively, which correlates well with national and district estimates from official sources at an average R-squared of 0.8. Moreover, accuracy assessment with independent validation locations resulted in an overall accuracy of 91% and a kappa coefficient of 0.83 for the boro/non-boro stable rice map from 2014 to 2018. We conclude with a discussion of potential improvements and future research pathways for this approach to spatiotemporal mapping of rice in heterogeneous landscapes.
1. Introduction
Rice (Oryza sativa) is the major source of caloric energy in the diet of more than 160 million people in Bangladesh, and represents the primary agricultural crop in multiple seasons [1]. Dry-season (boro) rice production, a form of rice intensification, has become crucial to meeting and maintaining progress toward food security goals in Bangladesh [2]. Historically, farmers in Bangladesh have grown a traditional variety of low-yielding rice during the monsoon (aman) season and only planted small gardens or small rice plots during the dry season. In a few areas in northern Bangladesh, an early summer season (aus) has also been grown but accounts for a rather small proportion of total production. As a result, households have often depleted their food stores before the following monsoon production harvest. This period of depleted food storage is also known as the lean season, or monga. In recent decades, Bangladesh has made substantial progress in reducing lean season impacts on food security through the introduction and widespread adoption of a second season of irrigated paddy rice production, which primarily consists of high-yielding variety (HYV) rice [3]. Additional production in the dry season has made major contributions toward self-sufficiency in rice supplies for the country as a whole and has reduced the occurrence of a lean season in some regions [4]. However, volatility in rice markets, increasing pressures on arable land from population growth and climate change, and changing management practices and technologies continue to create barriers for sustaining rice self-sufficiency in Bangladesh [2]. Moreover, addressing still rampant food insecurity in regions such as the coastal zone remains a major challenge [5]. Importantly, fine spatial scale information on rice production during the boro season could help policymakers and agricultural development practitioners focus their efforts on improving production where it could potentially make the greatest impact. Yet, in situ data is rarely available at both the spatial and temporal detail required for impactful agricultural monitoring and intervention. Therefore, remote sensing has been investigated as a potential solution to ongoing efforts to monitor and evaluate rice production [6,7,8,9,10,11,12,13,14,15]. This study extends those previous efforts toward this endeavor, and highlights improvements in spatiotemporal rice mapping in the heterogeneous landscape of Bangladesh during the dry season.
Over the last three decades, different methods for rice mapping and monitoring have been developed using remote sensing data [16,17,18]. The spatial extents of these studies range from experimental plots to continental scales and employ unsupervised and supervised [19,20,21,22] rule-based [23], phenology-based [11,24], and time series algorithms [18,24,25]. The Moderate Resolution Imaging Spectroradiometer (MODIS) sensors have been one of the most widely used platforms for rice mapping and monitoring applications at larger regional scales because of the daily revisit, relatively small data size, and availability of spectral information that is particularly pertinent to agriculture [9,10,23,26,27]. MODIS time series images have also been combined with synthetic aperture radar (SAR) data for rice monitoring [28,29], exemplifying new initiatives and innovative techniques that are becoming available with the advent of free access to remotely sensed datasets and improved information on regional rice production systems. However, MODIS has only been available since the year 2000, and its moderate spatial resolution is not suitable for heterogeneous landscapes such as Bangladesh, where the average farm size is less than one quarter of a hectare [30]. As such, the Landsat platform is more appropriate for rice mapping in regions like Bangladesh.
Similar to MODIS, Landsat bands are particularly suitable for agricultural monitoring and come in 30 m resolution, albeit with a revisit time of approximately 16 days [9,31,32]. Earlier analyses of Landsat data for rice mapping were often limited to only a single image, or a few images within smaller regions, due to the size of datasets and computational limitations [16,33]. In fact, to the best of our knowledge, only one pilot study for multiyear analysis of rice mapping exists—a demonstration of the Landsat-RICE algorithm for a single Landsat tile (i.e., path/row) in northeastern China in five-year windows [24]. The Landsat-RICE algorithm incorporates rules based on weather and phenology information to identify rice pixels in five-year epochs rather than on an annual basis. More recently, Dong et al. [11] analyzed hundreds of Landsat images over Northeast Asia for a single year of rice pixels to demonstrate the power and potential of Google Earth Engine (GEE), a cloud-based geospatial data analysis platform [34]. Importantly, these studies illustrate the evolution of rice mapping in recent years and discuss gaps and limitations to various methods that have been employed. Generally, these concerns are related to validating results and tradeoffs of scale in the implementation of different methodological approaches.
Improvements of rice mapping and monitoring using remote sensing techniques have hinged on the creation of algorithms that can adequately account for both spatial and temporal characteristics of rice production, while simultaneously providing flexibility across the many environments and agricultural systems suitable for rice [23,28]. The most successful rice identifying algorithms to date incorporate pixel-based time series to find patterns in phenology and management that characterize what we know about rice production. These time series algorithms generally include a number of spectral or vegetation indices (to be discussed more below) that are sensitive to different characteristics of the rice throughout the growing season, namely flooding and transplanting, flowering, and grain-filling and harvest [10,13,14,24]. However, strict rules on these indices implemented for rice identification are not ideal where genetics, environment, or management vary substantially across space and time. Based on some of these issues, Boschetti et al. [23] introduced the PhenoRice algorithm to improve accuracy in rice mapping across three unique rice-producing environments by including expert knowledge of genetics, environmental characteristics, and management. This work has been extended to analyze multiseasonal rice production characteristics in Senegal and Mauritania [35]. While PhenoRice is leading the way in rice mapping, it has primarily been applied with MODIS data and requires some knowledge of local rice production practices, which can be limiting for country-scale analysis with multiple production systems.
In Bangladesh, traditional and HYV rice have different season lengths, and management practices are diverse [3]. Strict rules on vegetation indices (VIs) may not account for flooding of fields in weeks preceding the dry season, which is problematic where grass, green cover, or other crops may be planted later [23,28,36]. This scenario would likely generate a positive signature (i.e., a Type II error) for rice, even though some other crop (wheat, pulses, etc.) is actually being grown. Therefore, the natural next step is to adapt the PhenoRice algorithm for use in more heterogeneous rice systems. As such, we attempt to identify rice at finer resolution and over a longer time period than has previously been done in the literature by implementing the advantages of the PhenoRice algorithm and using the newfound computational capacity provided by GEE [34]. Additionally, we seek to bridge the existing gap in linking finer resolution imagery, such as 30 m Landsat, with multiyear time series rice mapping at the country scale [31,37].
Overall, this study aims to identify spatiotemporal patterns in dry-season rice production for all of Bangladesh in order to better understand the current status and potential of double- and triple-cropped rice systems, as well as to provide a more robust platform for rice system monitoring in areas without in situ data. Specifically, we integrate spatial and temporal aspects of rice classification into a procedure which is regionally flexible and requires few parameters as model input. We construct a time series of Landsat data based on a harmonic model to overcome the sparse availability of observations (~16 days) and minimize the effect of atmospheric noise and sensor differences. Therefore, the objectives of this study are: (i) To demonstrate the use of a harmonic-time-series-based vegetation indices (HTS-VIs) model with Landsat in providing consistent estimates of areas annually planted to boro rice in Bangladesh from 2014–2018; (ii) To analyze regional differences in boro rice phenology and production; and (iii) To compare and contrast the results of the HTS-VIs model with reference sources for boro rice areas in Bangladesh.
2. Study Area
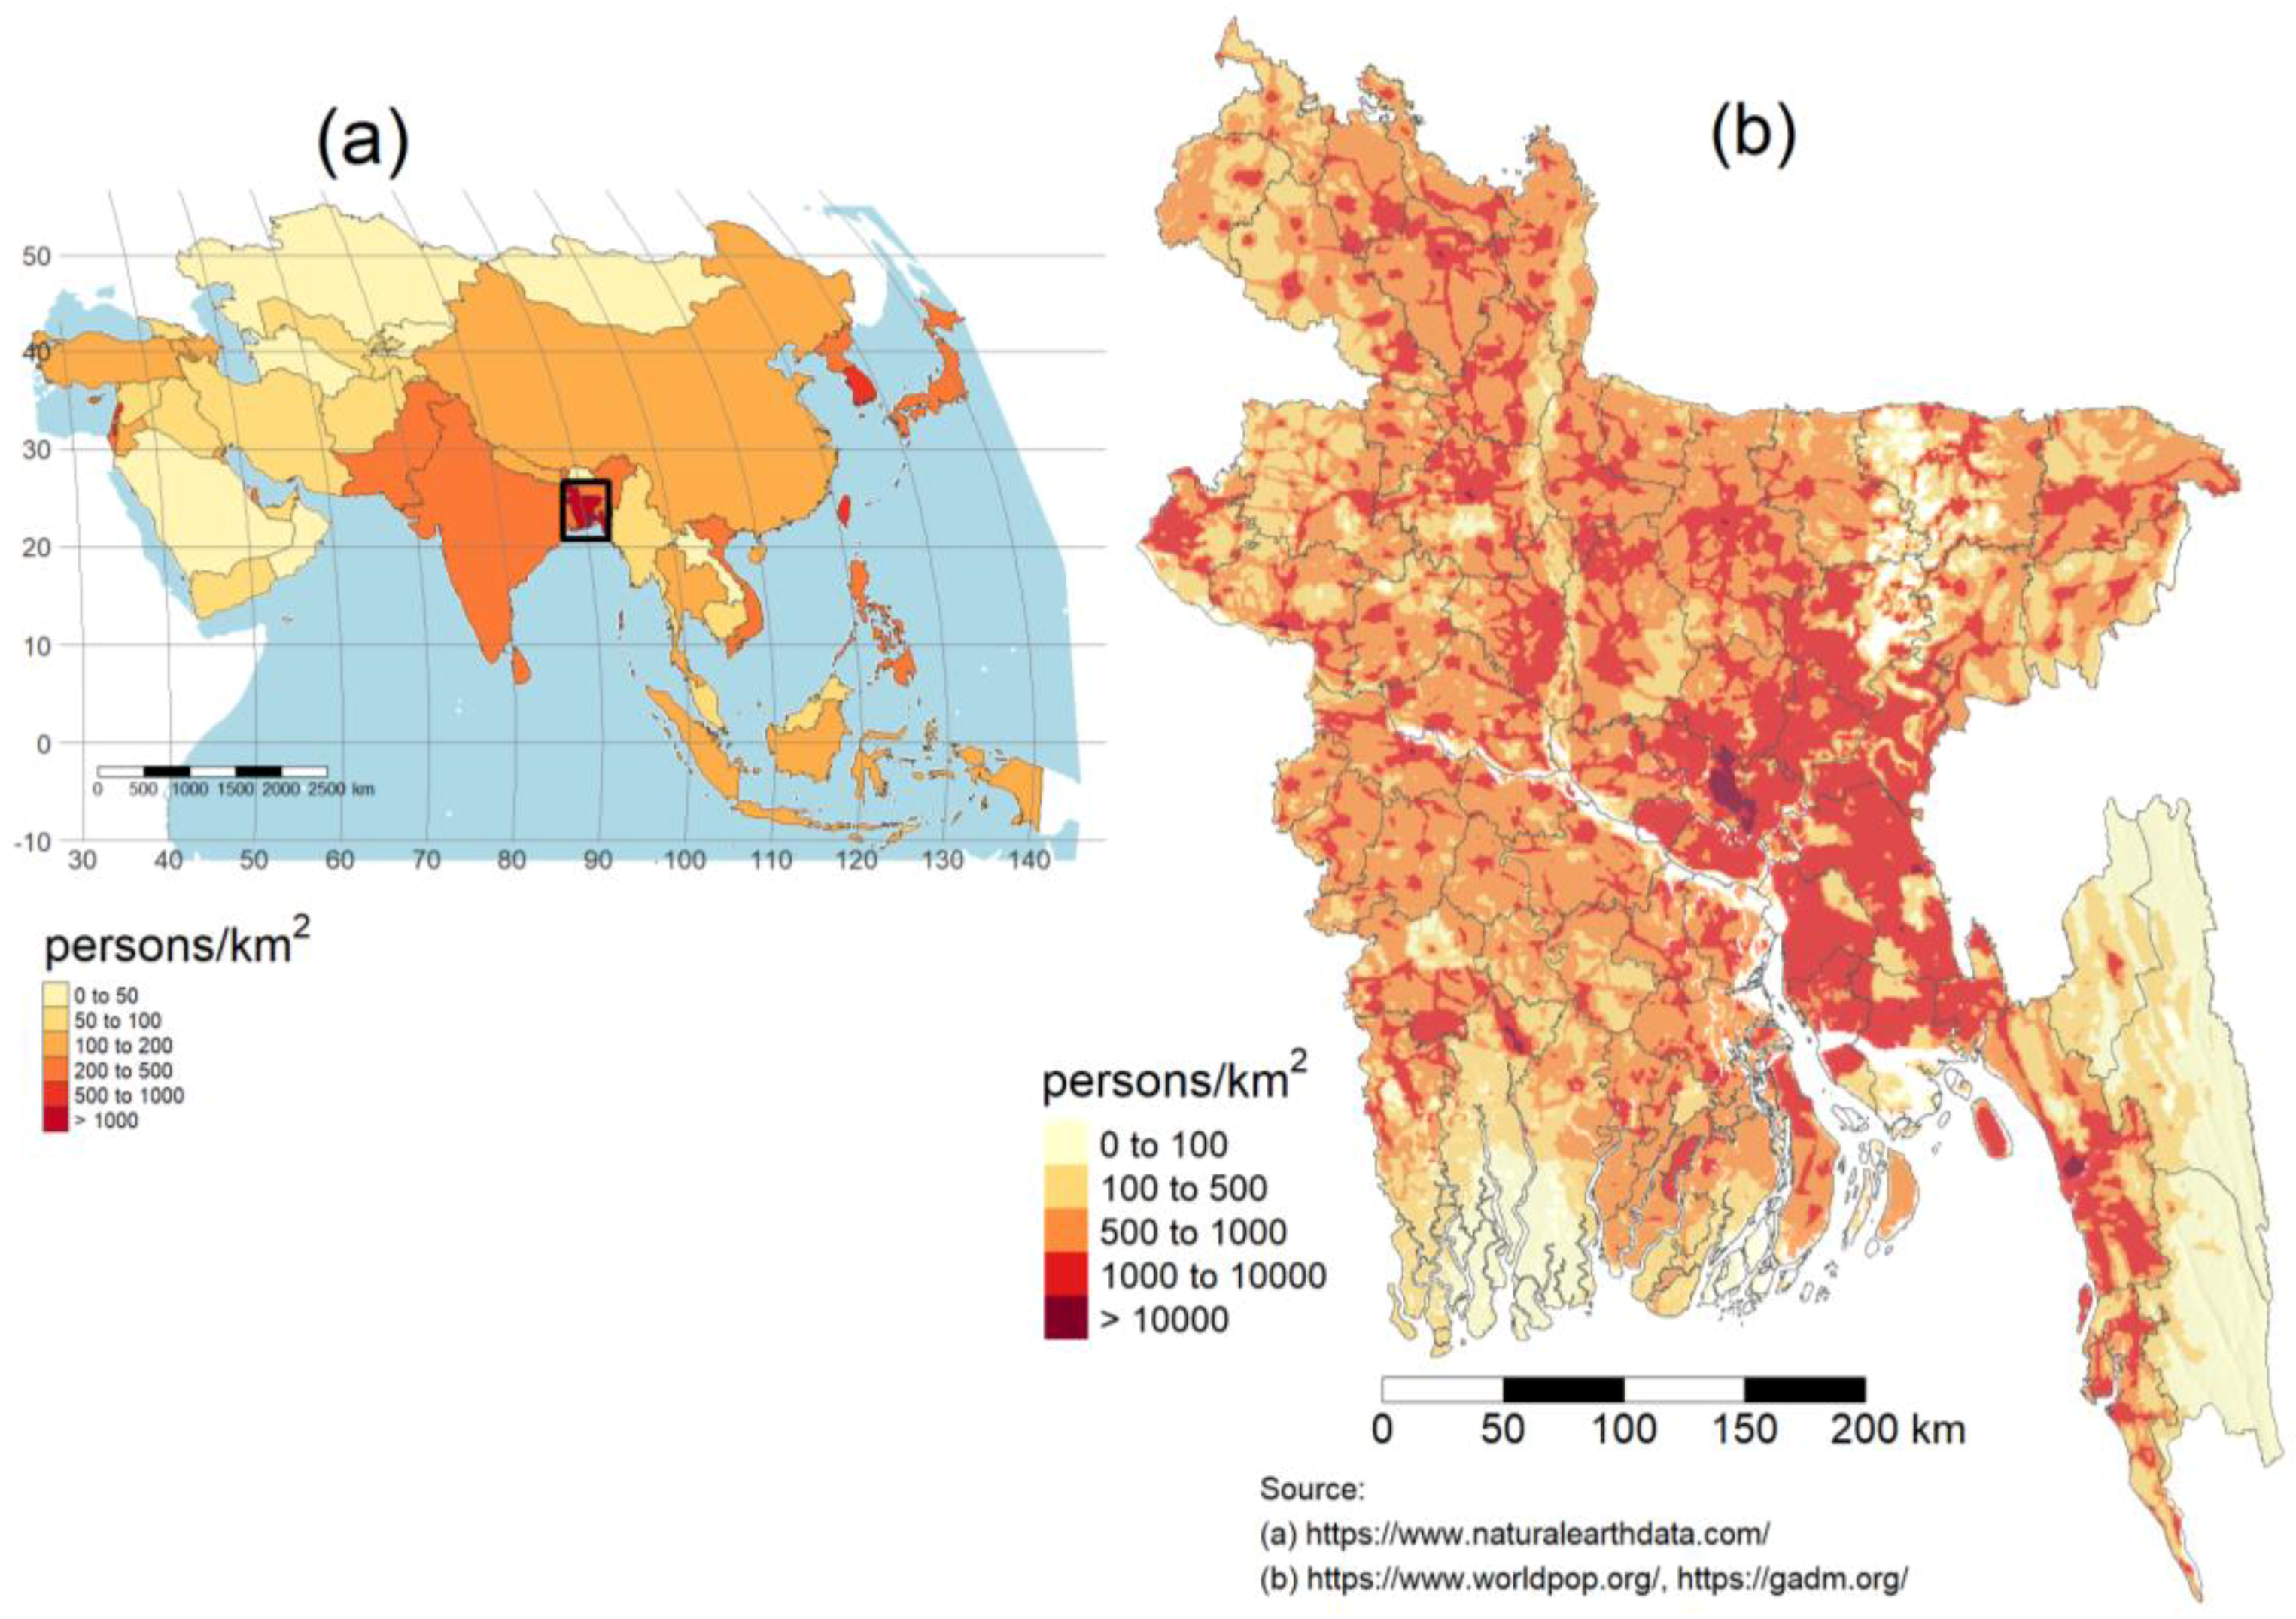
Bangladesh (spanned across 88°E to 92.5°E and 20.5°N to 26.6°N) is one of the most densely populated countries on earth, with a population of approximately 160 million people and a land area of about 130,000 square kilometers. There are 8 divisions, 64 districts, and 490 upazila (subdistricts) in the Bangladeshi administrative hierarchy (Figure 1). Bangladesh has significantly improved the livelihood of its citizens since its independence in 1971. Life expectancy has increased from below 50 in the 1970s to over 70 in 2013, and most metrics for health and food security, i.e., wasting, stunting, mortality rates for children under 5, etc., have improved [38]. Approximately 50 percent of people in Bangladesh rely directly on rice production for both income and food, and due to rapid land use and land cover changes in the country [39], there are increasing pressures on agriculture as a whole and for rice production specifically. In the coastal region, many farmers face increasingly extreme flood events and salinity intrusion [40]. In the northwest, farmers deal with more frequent and severe droughts [41], and the highly productive northeast region experience flash floods that may lead to food shortage at national level [42]. Additionally, urbanization and population growth have contributed to decreases in arable land, making agricultural resilience to environmental changes and the adoption of resource-use-efficient cropping systems all the more vital to overcoming current and future food security challenges [39].
As the primary staple food, rice is of utmost importance in Bangladesh and throughout Asia [43]. The landscape and agricultural production systems vary regionally within the country, resulting in temporally and spatially fragmented rice-production areas [25,28]. There are three rice producing seasons: The primary production season during the monsoon (aman) generally begins in July or August and ends between November and January depending on the region and rice cultivars planted; dry (boro) irrigated rice production follows aman production in some regions, especially in the north and east, with planting generally in December or January and harvest in March or April. Finally, the early summer season (aus) is a short rice season which precedes aman in a few areas. (See Supplementary Information Table S1 for national statistics on yield by season).
Most arable land with access to sufficient fresh water is planted to paddy rice in the aman season. However, adoption of boro or aus rice in double- or (seldom) triple-cropping systems is limited due to environmental and climatic factors [44]. Some regions lack fresh water during the dry season for irrigating boro rice, or may even face salinity intrusion in soils as in some coastal regions [40,45]. Regions that do have adequate fresh water from ground or surface sources may grow a second season of rice, often hybrid or HYV, because of the shorter growing season requirements compared to traditional cultivars (~90–120 days) [28]. Second season (and specifically hybrid and HYV) rice production in Bangladesh may contribute significantly to sustainable intensification of agriculture in coming decades. This is particularly critical for Bangladesh because arable land is decreasing, populations are increasing, and rice consumption per capita is one of the highest in the world [46].
3. Materials and Methods
3.1. Paddy Rice Phenology with Remote Sensing
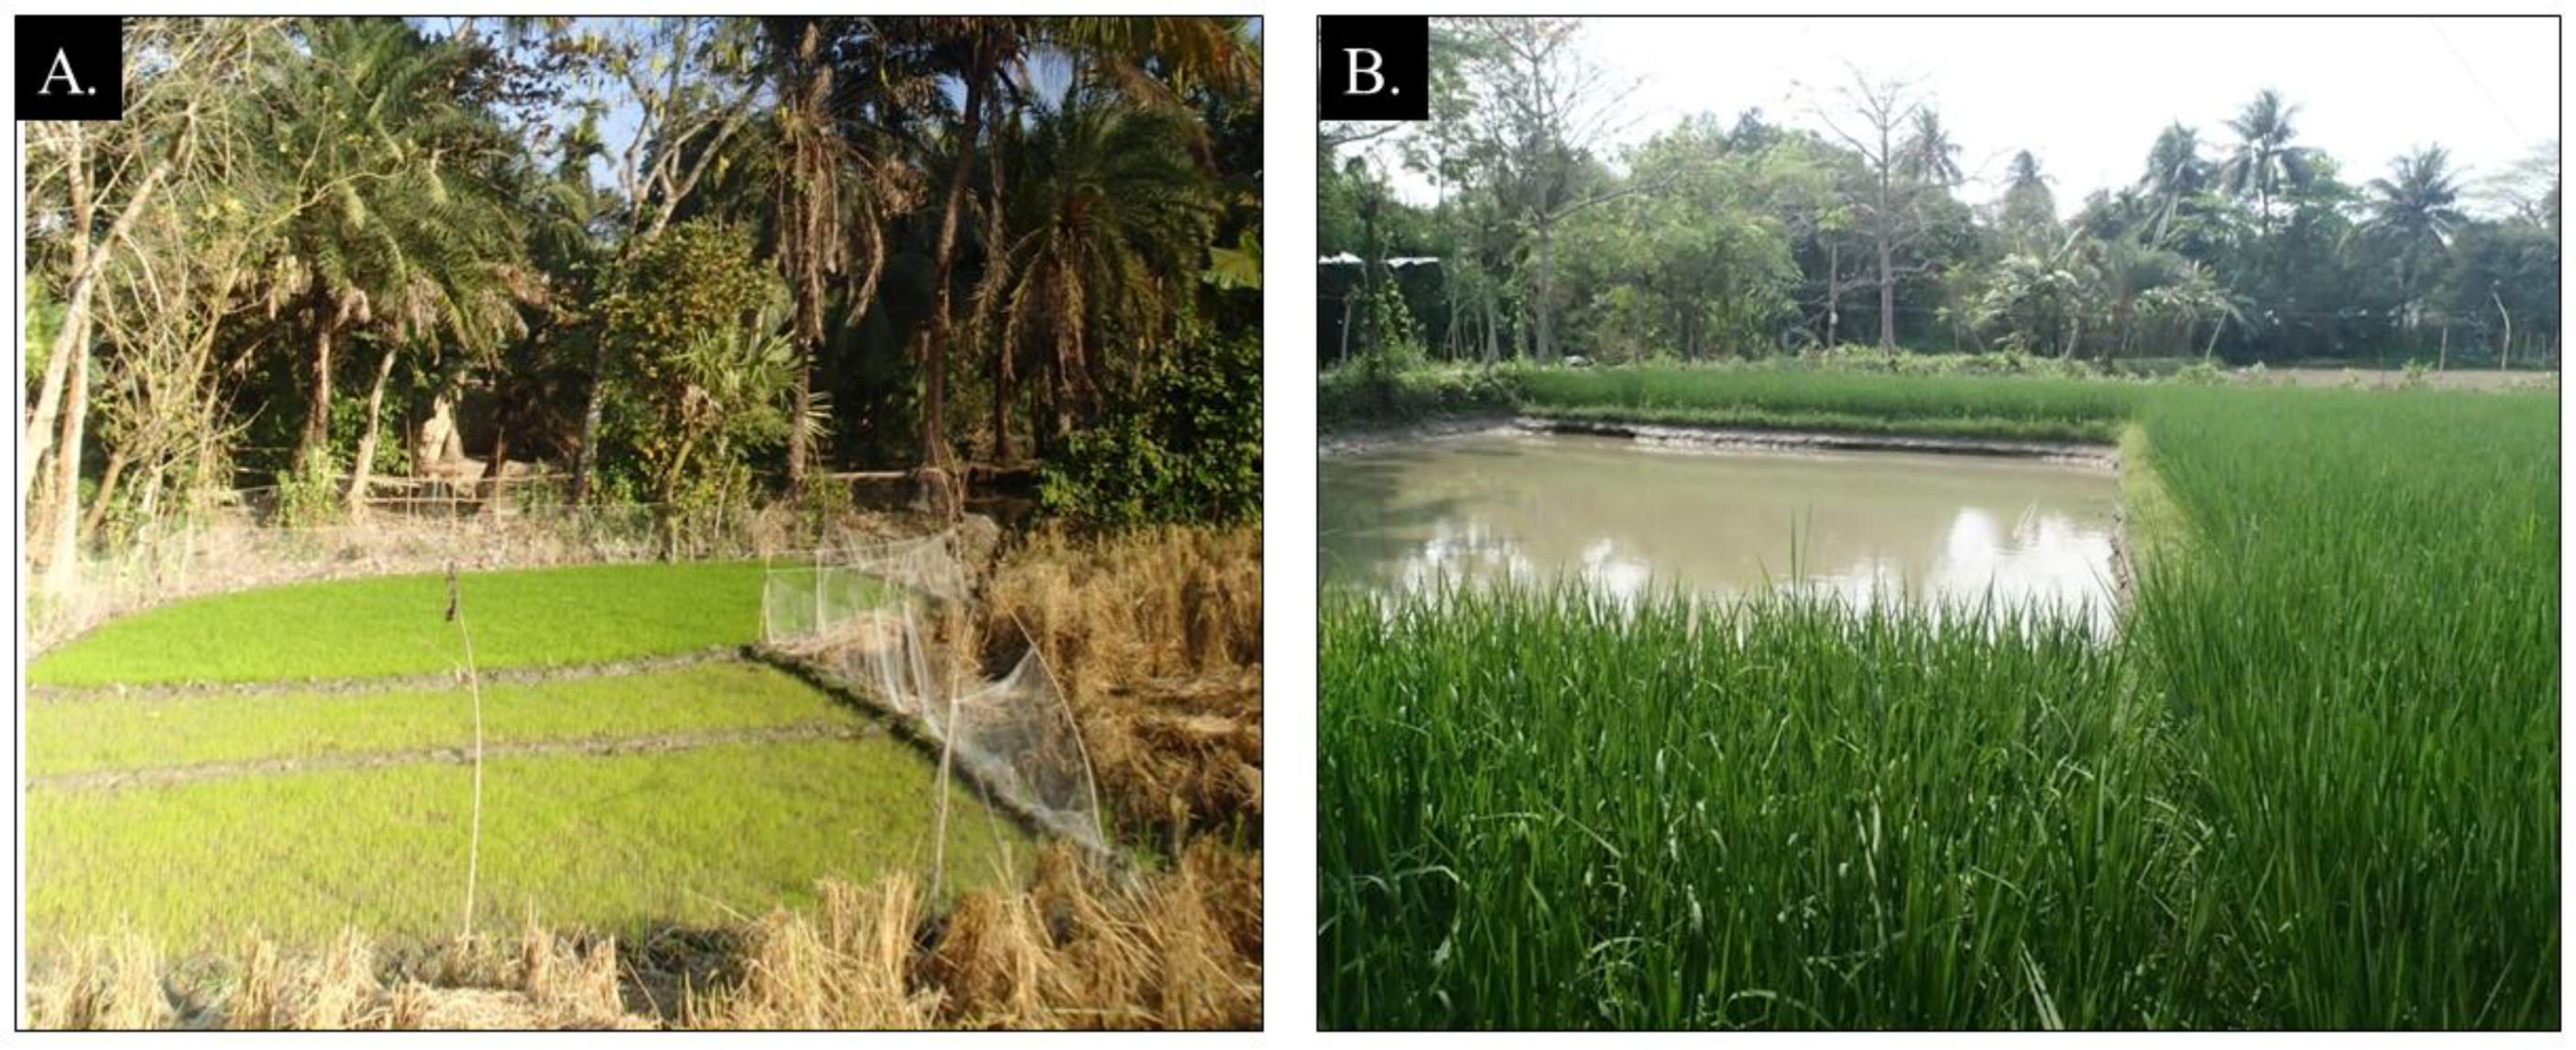
Paddy rice, which accounts for more than 90% of rice production worldwide and is the main focus of this study [6], typically follows three stages during the growing season: (1) A flooding and transplanting phase, (2) a flowering and tillering phase, and (3) a grain-filling and harvest stage [3,18,43,47]. During the flooding and transplanting phase, rice fields have exposed soil with little to no vegetative cover, followed by water infiltration and flooding, which slowly transitions to light vegetation after rice seedlings are transplanted (Figure 2). As the seedlings grow, the canopy of the rice begins to cover the flooded soil below and vegetation rapidly increases to usher in the flowering and tillering phase. This second phase is defined by rapid vegetative growth, rice flowering, germination, and pollination, as well as panicle greening, lengthening, and thickening. Finally, the grain-filling and harvest stage follows as rice matures, browns, and dries. When the grain reaches ~20% moisture or less, harvest time commences and rice is cut from the fields, which return to brown exposed soil with dry stubble residue [3]. Importantly, the time frame for each of these primary phenological phases changes depending on the rice varietal planted and the local planting times, as determined by weather and management decisions. Thus, any model for rice identification that relies on these phenological stages must be flexible to changes in the length of the growing season, e.g., ~90–120 days for an HYV or hybrid versus 130+ days for many traditional varieties, as well as flexible to the commencement of the timing of the transplanting phase.
The majority of previous rice-mapping research attempted to identify pixels that show the characteristic temporal pattern of flooding followed by transplanting using remote sensing indicators such as spectral VIs [10,13,14,23]. Specifically, these VIs are the green vegetation index [26,48,49,50,51], which are sensitive to leaf chlorophyll content or plant greenness, and the water or flood index [26], which are sensitive to leaf water content and soil moisture/submersion. Notably, Boschetti et al. [26] found that enhanced vegetation index (EVI) and normalized difference flood index (NDFI) are more sensitive in their response to vegetation and water reflectance than other VIs such as normalized difference vegetation index (NDVI) and land surface water index (LSWI). So, this present study primarily focused on EVI and NDFI. Time series plots (Figure 3) are provided for EVI and NDFI indices to further demonstrate land surface phenology. The two indices are calculated based on the following formulas:
where represents reflectance of corresponding bands. When NDFI is greater than EVI after transplanting, the signature represents a transition from plant cover or dry soil to primarily water or saturated soil and indicates the likely timeframe during which rice transplanting takes place. We refer to this as the flooding and transplanting signature. More details about this process can be found in Xiao et al. [13,14], although it should be noted that the original process was outlined for MODIS imagery in China and has been modified in the PhenoRice algorithm most recently for rice mapping applications in Senegal [12].
3.2. Satellite Data Preprocessing
In this study, we used orthorectified Landsat 7 (LE7) and Landsat 8 (LC8) Tier 1 (T1) top-of-atmosphere (TOA) reflectance imagery to analyze dry-season rice production in Bangladesh in the GEE platform. GEE is a cloud-based geospatial data analysis platform built on Google infrastructure and capable of processing petabyte-scale remote sensing data [34,52,53]. In previous studies, Landsat imagery could not be analyzed on larger regional or national scales because of high computational requirements. Instead, regional and national scale analyses were limited to moderate- or low-resolution imagery platforms [18], but with GEE, there are newfound opportunities for spatiotemporal analysis of Landsat imagery.
LE7 and LC8 imaged the entire earth every 16 days with a pixel resolution of 30 m and multiple spectral bands [31,37]. We used TOA collection rather than Surface Reflectance (SR) because of higher inconsistencies in the corresponding bands recorded for LE7 and LC8 for time series applications [54] and due to limited SR data availability in Google bucket for Bangladesh during the time of the analysis. We filtered the T1 TOA image collection spatially to cover all regions within the current borders of Bangladesh. The entire Bangladeshi territory is covered by approximately 24 Landsat tiles. These orthorectified time series images provide an opportunity for analyzing pixel-level changes from year-to-year and season-to-season. We used a cloud-masking algorithm available in GEE platform to remove cloudy pixels above a 60 percent threshold. The resulting imagery after spatial filtering and cloud masking were combined into one composite collection for model fitting, which is described in more detail below.
Significant cloud cover rests over Bangladesh throughout the year, especially during the monsoon season between late June and October and in some northern regions during the dry season. Because of this, there are missing observations in addition to the atmospheric and sensor noise in the recorded bands of the imagery, which has to be considered within the estimation of VIs, specifically EVI [54,55,56]. The use of both LE7 and LC8 collection resulted in an unequal number of observations for each pixels at 1-day (tile overlapping regions) to 16-days interval or more depending on cloud cover. Also, LE7 suffers from Scan Line Corrector failure, resulting in a large number of missing pixels around the edges of each tile, which reduces the number of observations for those pixels. To correct for these issues, we employed a harmonic model to create a synthetic standardized time series of EVI values for each pixel across the study region at 16-days interval [50,57,58]. The model used to estimate EVI value () at each time () was based on the following equation:
where is the spectral indices value at time t (Julian date), is number of days per year, represents an estimated intercept, is a coefficient for the overall trend in , is a coefficient for the secondary trend in t, and and are coefficients of the intra-annual change corresponding to highest possible annual cropping intensity (explained below). We used two calendar years of data (e.g., 1 January 2017 to 31 December 2018) to ensure sufficient number of clear observations that is needed to find the coefficients in Equation (3) for each growing season. In this model, we considered three frequencies per annum () to account for the three potential cropping seasons—aus, aman, and boro—that occur in a given crop-calendar year in Bangladesh. Years in the context of agricultural records are represented by two years, e.g., “2017–2018” functionally represents 1 July 2017 to 30 June 2018. This includes the aus, aman, and boro seasons for a given production year. It is important to mention that the synthetic time series may not be ideal for studies requiring absolute measurements (e.g., relating ground observations with satellite measurements); but the method used in this study relies on the detection of relative trends across time.
3.3. Ruleset for Rice Pixel Identification
Following model fitting, we first limit the analysis to the dry season (boro) by using only the fitted HTS-VIs results between 1 November and 31 May, which accounts for potential early planting in some areas and late harvest in others for a maximum length of the boro season across the entire country [4,25,47,59]. Then, we impose a rule-based algorithm on the resulting time series in order to identify rice from 2013–2018. The following criterion were implemented to identify pixels as rice candidates:
- (i)
- First, we found the maximum EVI (and date) during boro and restricted rice-candidate pixels to be greater than 0.4 EVI.
- (ii)
- Then, we identified the minimum EVI within 90 days prior to the maximum (left on time series plots) and restricted pixels such that at least one calculated NDFI value had to be greater than EVI between the left minimum EVI and the maximum EVI.
- (iii)
- Lastly, we found the trend between the left minimum EVI as well as the right minimum (harvest) EVI and ensured that EVI had a positive trend before and a negative trend after maximum EVI, respectively.
The first rule (i) above excludes pixels exhibiting low greenness throughout the growing season. We selected the value 0.4 based on our knowledge of the study area, range of LE7-based EVI values, and recommendation from earlier studies [11,18,24]. The second rule (ii) further limits the pixels with NDFI-based flooding and transplanting detection [11,12,23,28,35]. The final rule (iii) ensures that the overall trend in EVI before and after the heading and flowering stage is representative of rice vegetative growth and drying down for harvest, which is typically distinct from other vegetative land cover phenologies. The second and third rules relate to those employed in the PhenoRice model [12,23,26,35], though with slight differences due to the analysis of Landsat data in the GEE platform. The final rule is critical to separate the rice areas from land covers like mangrove forest having both high EVI and a strong water signal.
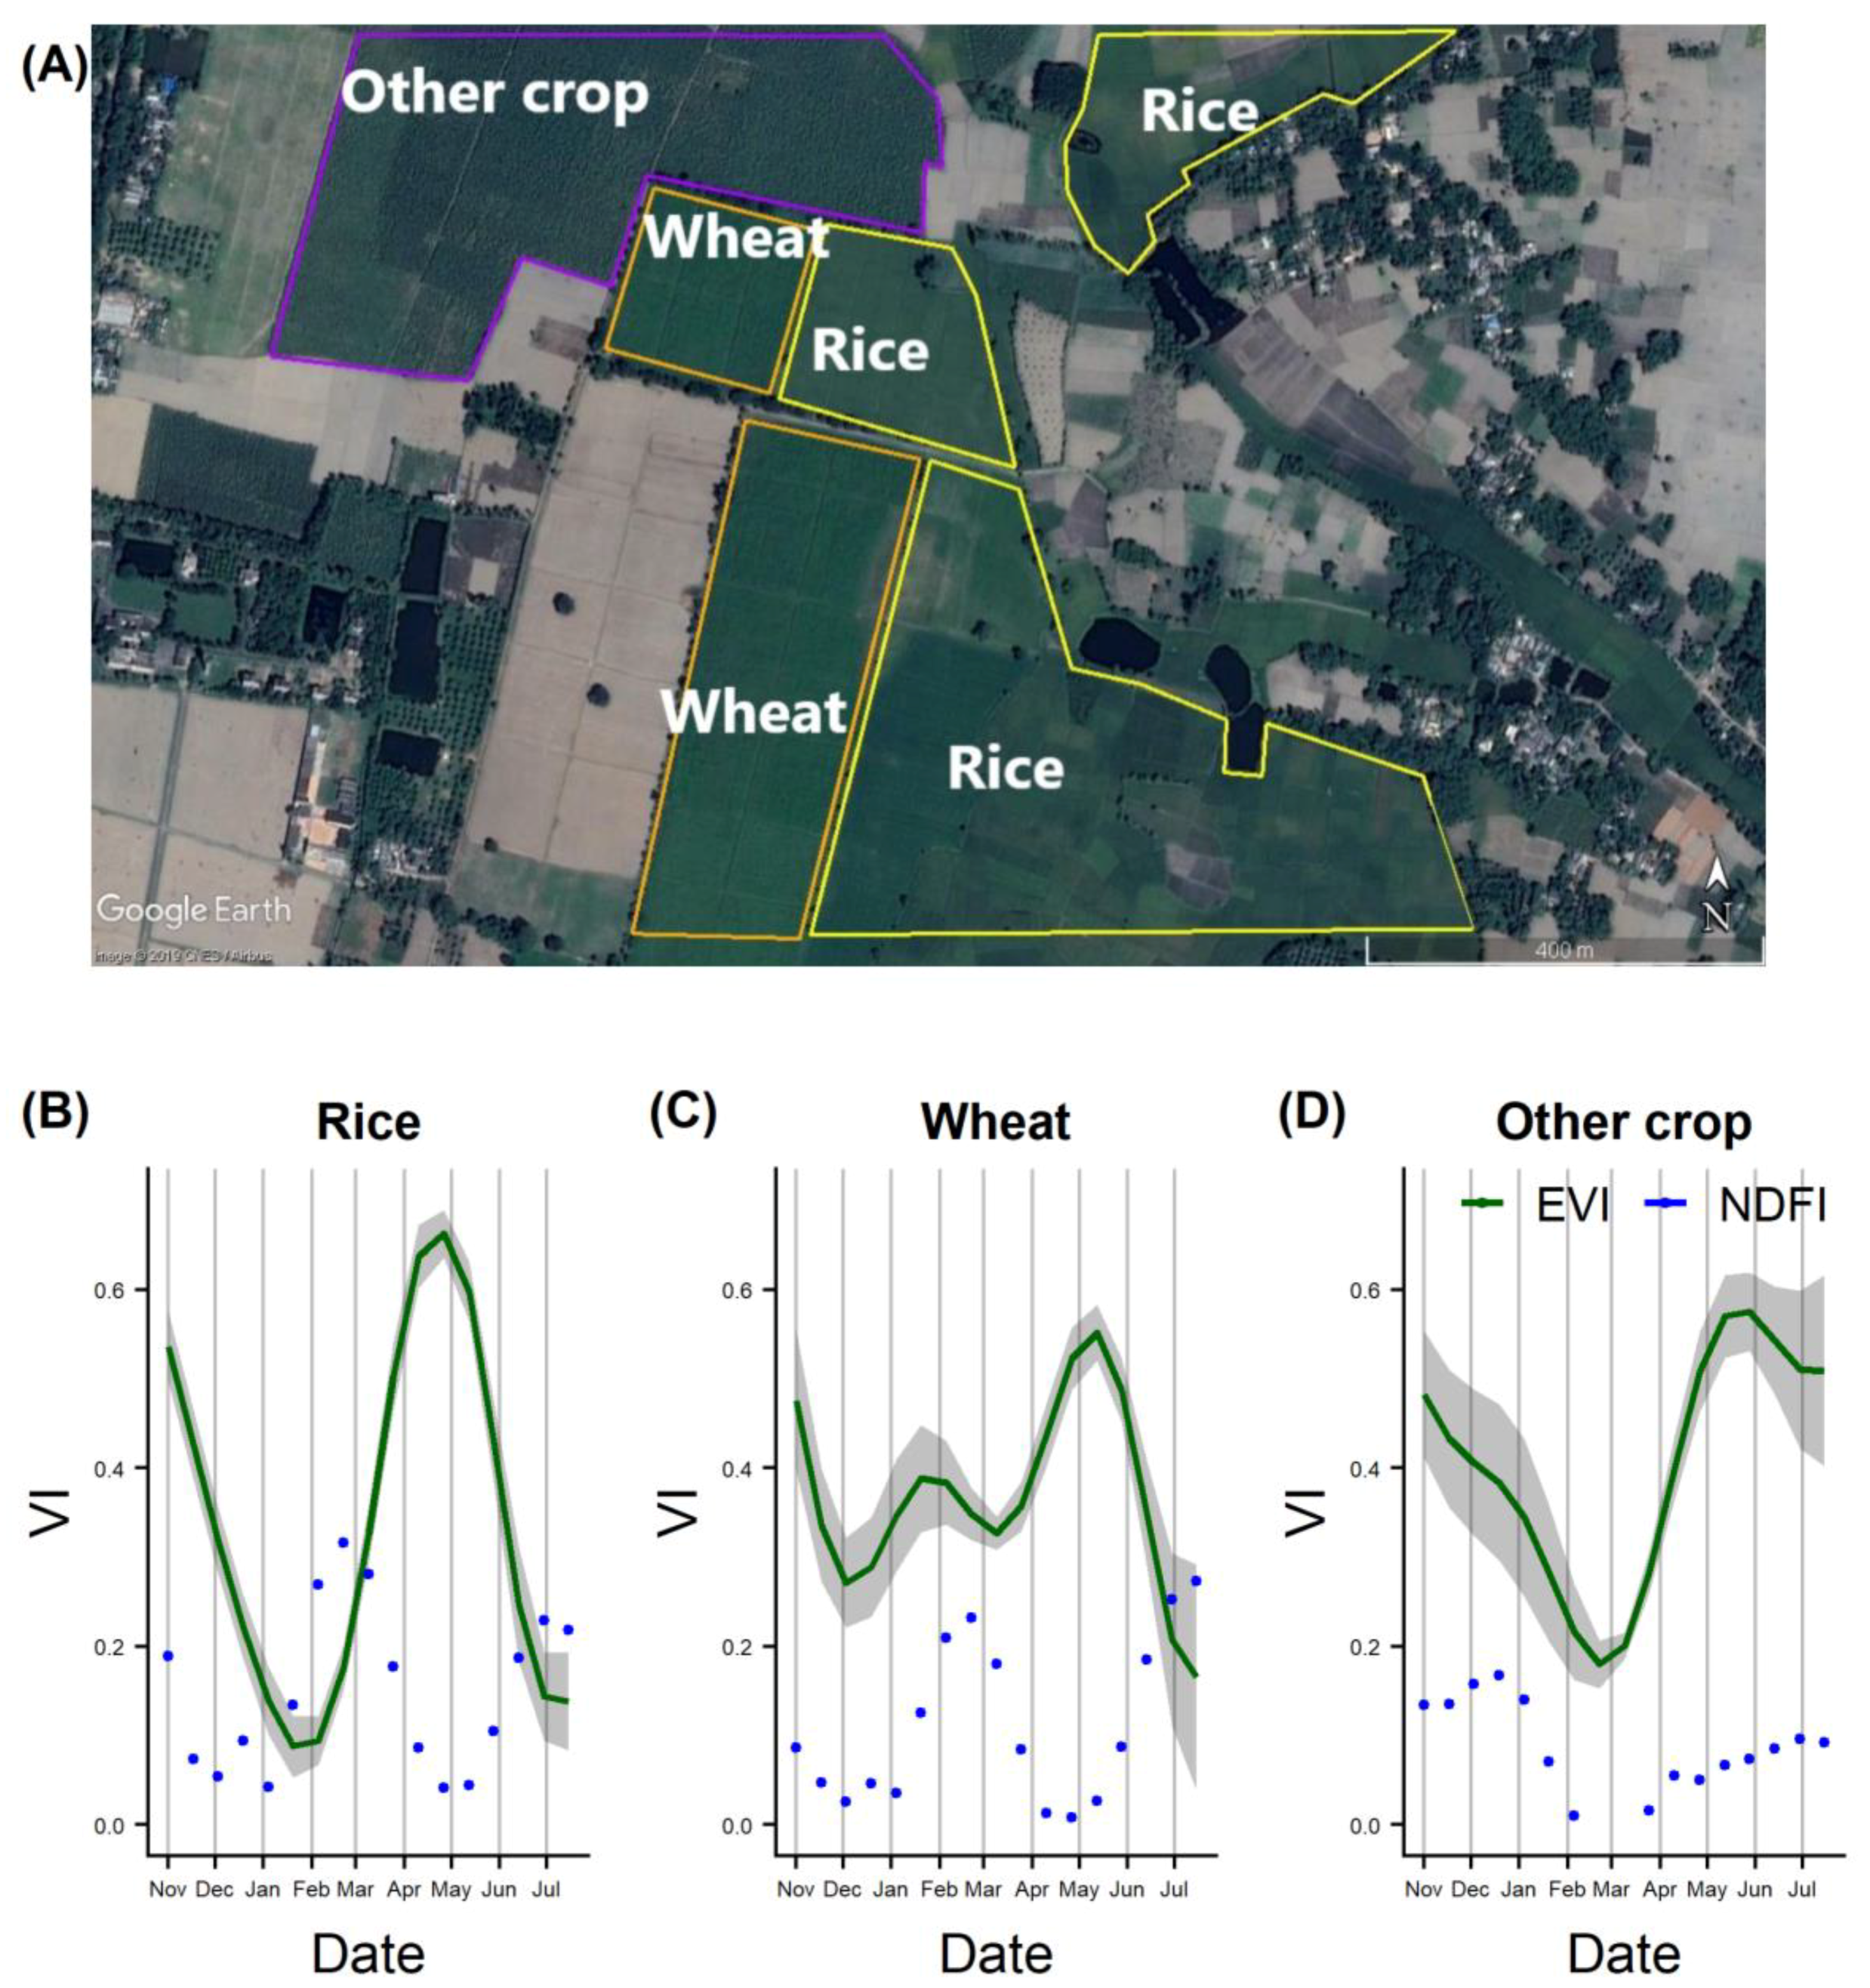
In the plot below (Figure 3), we then compared phenology information of rice with wheat and other crop growing plots. The major difference between the plots is the behavior of NDFI between planting and flowering stages (maximum EVI), even while the other two conditions have been met to make the pixel a crop candidate. Thus, the pixel would be classified as rice for the boro season of the year plotted (since these types of time series plots depict the phenology of rice, these will be identified as “phenoplots” for later reference). Given the fact that planting dates vary year-to-year and regionally, and phenological stages change by variety, we attempted to develop a flexible model for rice pixel identification without requiring detailed knowledge of rice-growing seasons, environmental characteristics, or local management practices.
3.4. Validation
3.4.1. Comparison with Bangladesh Bureau of Statistics (BBS) Estimates
We compared our results with secondary sources for boro rice areas. Given the spatiotemporal coverage, we collected data for subregional comparison, which we collectively call the “reference data” throughout the rest of the study. Primarily, these reference data consist of boro rice planted areas at the district scale made available through the BBS. Notably, no validation of BBS data exists, but BBS data are considered the best available estimates for regional rice-growing areas in Bangladesh. The BBS data are estimates gathered based on local extension offices, regional agricultural data collection centers, and sampling surveys of farmers in each region [60]. The data are aggregated areal estimates at the district level and do not provide explicit spatial details or location-specific management details (e.g., flooding, transplanting, harvesting dates, or length of growing season). We extracted the area covered by “possible” rice pixels from the HTS-VIs results. We further include phenoplots for each major division in Bangladesh derived from a 2000 random sample of rice-candidate pixels detected by the model. For the random sample of pixels, we also fit the HTS-VIs model for EVI on MODIS [14] pixels at 250 m to examine the differences with a moderate spatial resolution but with more frequent return time (1 day). This comparison offers validation for relative within-season variation in EVI that is constructed by the HTS-VIs model. In addition, we included the EVI derived from Landsat (both LC8 and LE7) Surface Reflectance (SR) to understand the effect of atmospheric corrections on time series modeling of vegetation properties and how that may impact the rice mapping results.
3.4.2. Accuracy Assessment with High-resolution Images
In the absence of reference data collected from field surveys, we interpreted high-resolution imagery from Google Earth to create a comprehensive validation database of boro rice locations to estimate the accuracy of the HTS-VIs model. To support image interpretation, we used two different sources of field survey data. We downloaded cropland locations for Bangladesh from the Global Food Security Analysis-Support Data at 30 Meters (GFSAD30) project field data (available at https://croplands.org/app/data/search). The 129 locations identified were physically visited in 2010. Therefore, we checked individual locations in Google Earth Pro from 2013 to 2018 and marked those as boro rice only if certain conditions were met for respective locations: (i) At least two high-resolution images available for any particular year, (ii) indication of transplanting or early stages of growth between December to February, and (iii) plots surrounding the locations show dark green crop cover (grain-filling or later stage) between March and May. For each location, we also searched nearby areas that satisfied these three criteria to collect additional points for comparison with the HTS-VIs results.
For southern Bangladesh, additional field data points on polder 30 were collected as part of the Sustainable Intensification Innovation Lab project (https://www.k-state.edu/siil/whatwedo/currentprojects/bangladesh/). To maintain consistency, these points were also subjected to the criteria mentioned above. Since we did not mask any other land use land cover categories before implementing the HTS-VIs model to find boro rice pixels, we collected additional samples of other crops (any crop class except boro rice, which may include wheat, potato, maize, sugarcane, mustard, vegetables), fallow land (seasonal and annual), tree (large canopies including mangrove, orchard), water (aquaculture, river, lakes), and other vegetation (grassland, water hyacinth). In total, we collected 221 boro rice locations and 189 other classes (locations are shown in Supplementary Figure S1). We used these validation samples to calculate overall accuracy and kappa statistics to assess the performance of the HTS-VIs models.
4. Results and Discussion
4.1. Spatial Extent of Boro Rice
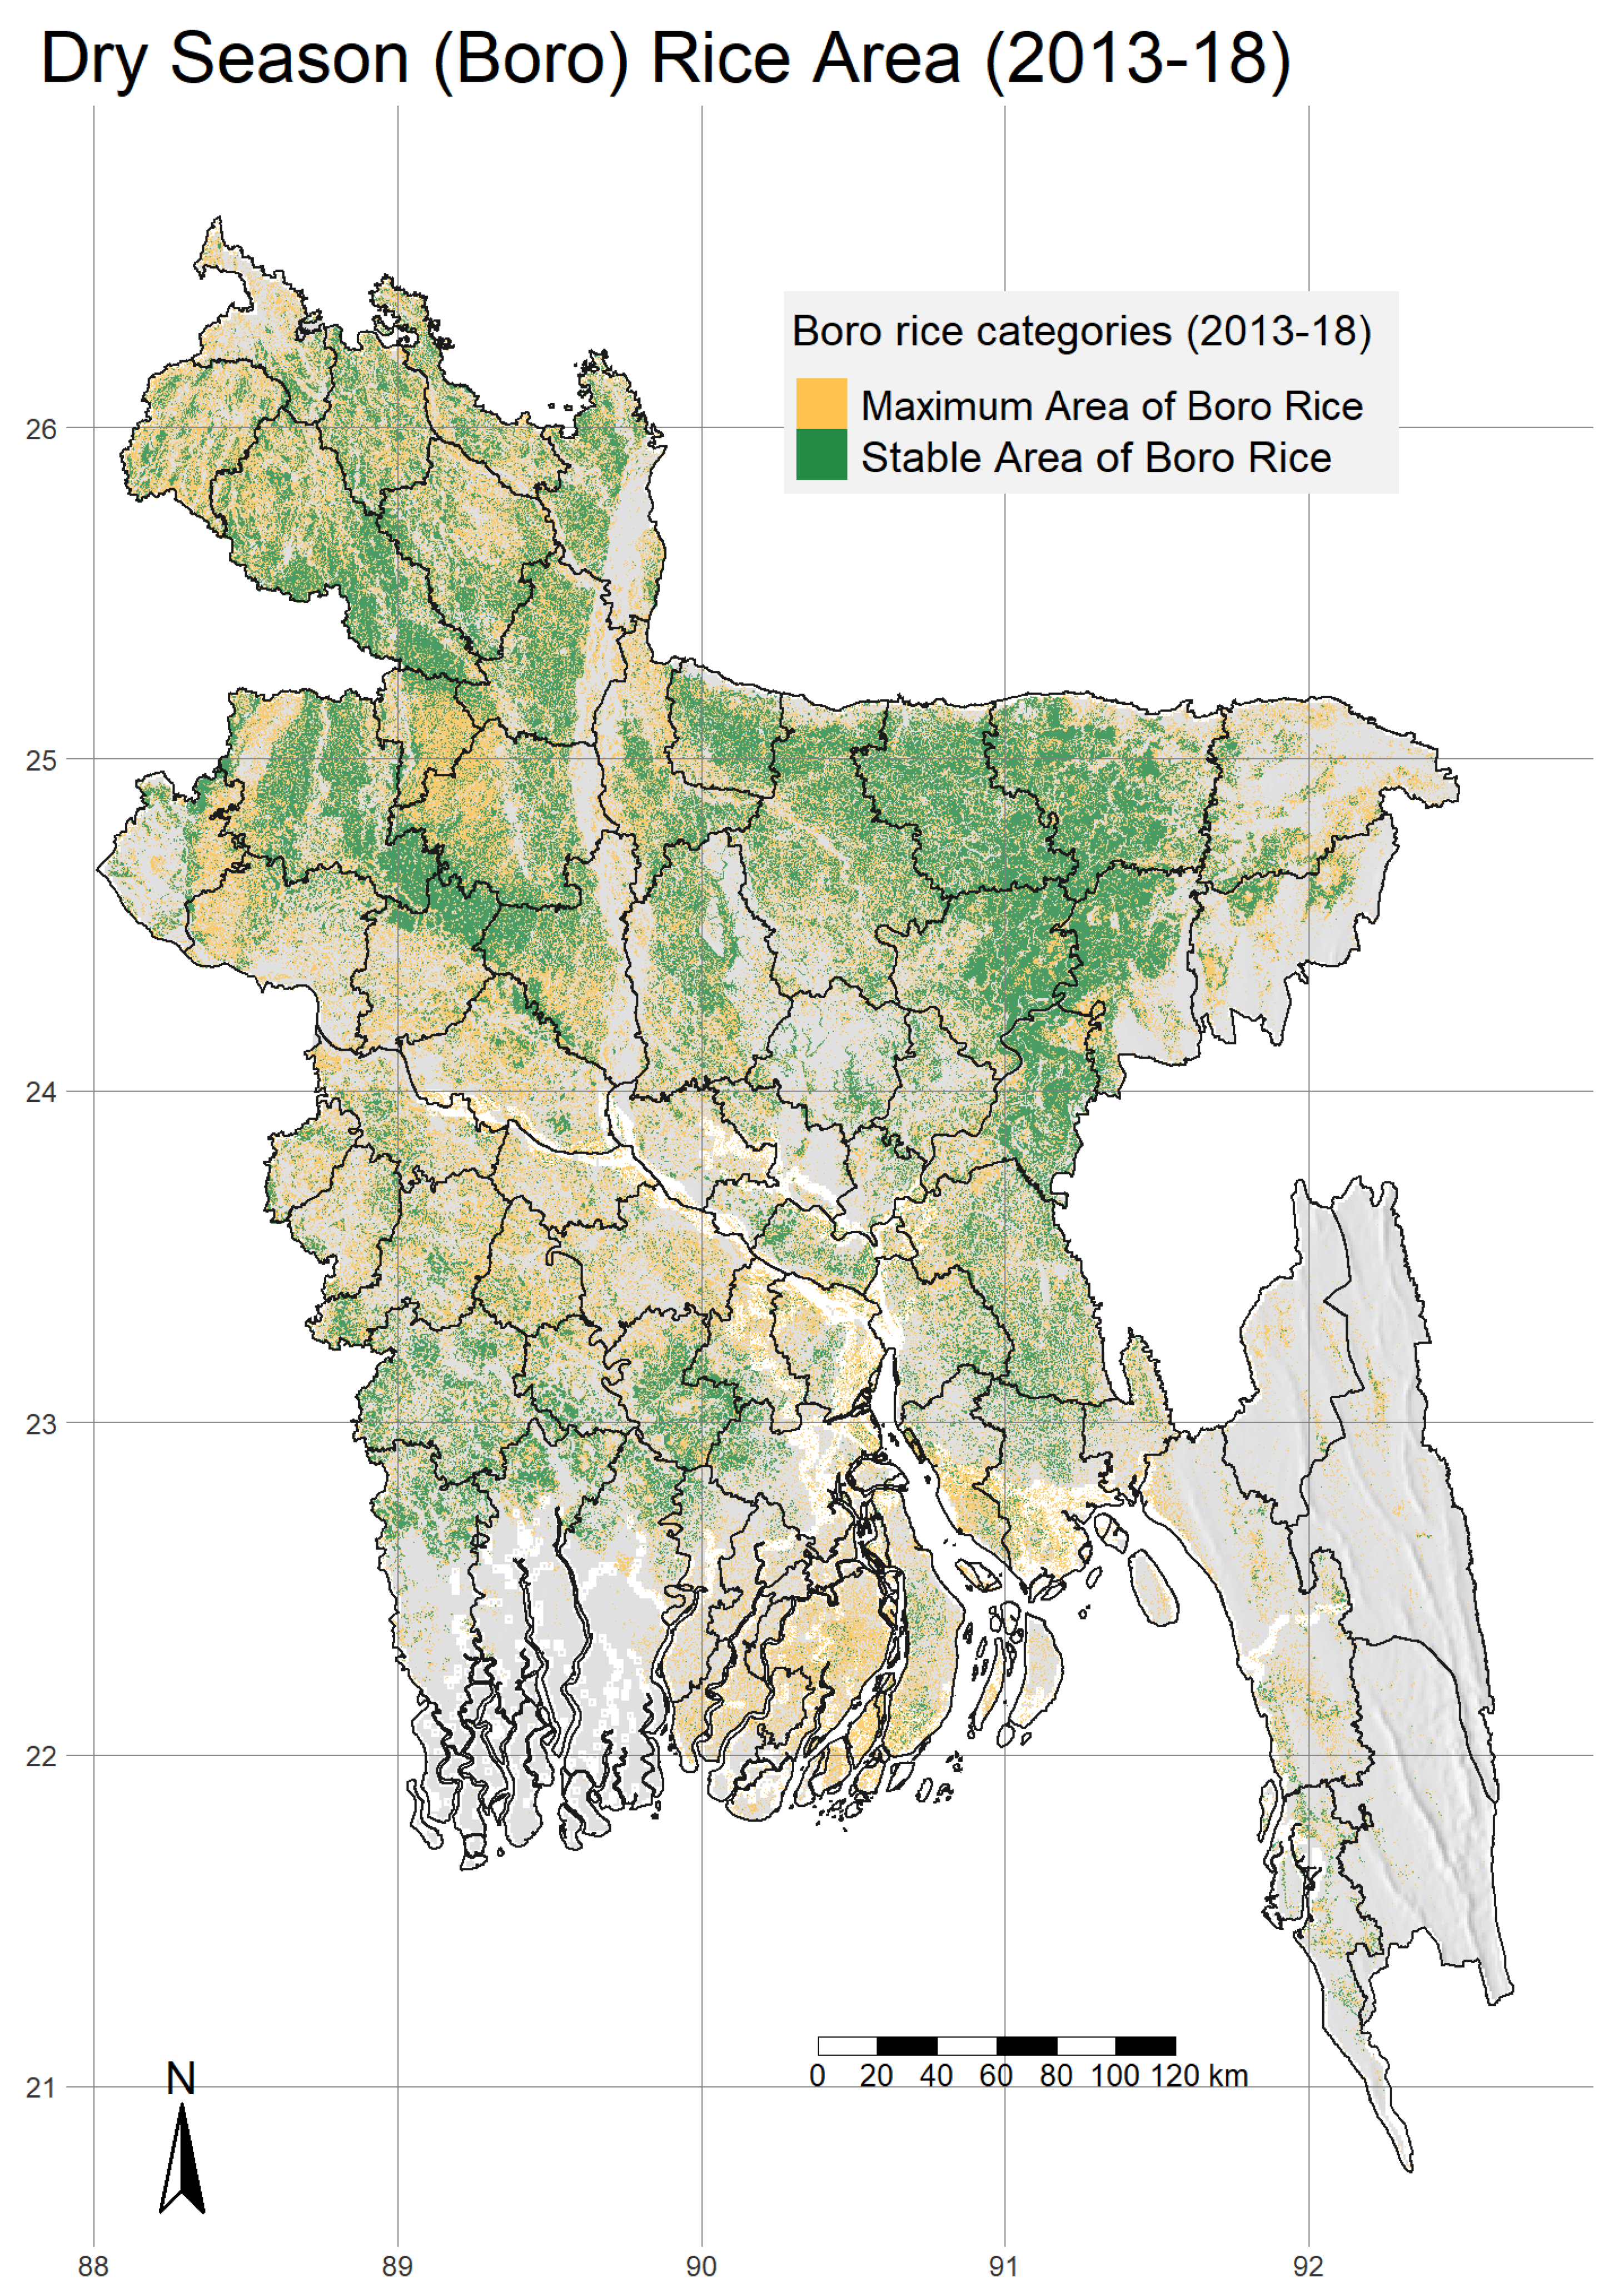
Overall, the HTS-VIs model resulted in a regionally flexible identification strategy for rice-candidate pixels. The spatiotemporal algorithm smooths noise and fills missing information from Landsat while maintaining enough adaptive capacity to demonstrate a peak in EVI, as well as a signature for NDFI during the flooding stage, even with major variations in landscape and environment across the Bangladeshi Divisions. The results are similar to those estimated by BBS at the district scale, and compare well to previous and coarser analysis of rice area in Bangladesh [25]. Figure 4 shows the HTS-VIs results for all of Bangladesh at 30 m with information on the persistence of rice areas through time. Specifically, the patterns show persistent rice areas in the northern and central regions of Bangladesh, which aligns with a priori knowledge of dry-season rice production. The map also shows areas that produced rice for at least one year of the five years included in the analysis, 2014–2018. This persistence of rice areas may indicate which regions are more marginal for dry-season rice production due to environmental and management conditions, e.g., flooding, drought, soils, access to irrigation, etc. It may also imply that areas of dry-season rice are expanding in some regions, such as the coastal areas or the northwestern division, while they may be contracting in others such as Dhaka. We also think smallholder framers frequently change their cropping practices in dry seasons (e.g., rice-wheat to rice-rice) to adapt with unexpected circumstances. Expansion of boro rice in northwestern division can be due to the wheat blast outbreak in 2016, after which a large number of farmers may have started growing rice instead of wheat for few years. With further years included in the analysis, expansion and contraction of boro rice could be investigated. Here, the result primarily illustrates the stability of dry-season rice areas.
4.2. Spatial Diversity of Boro Rice Cropping Practices
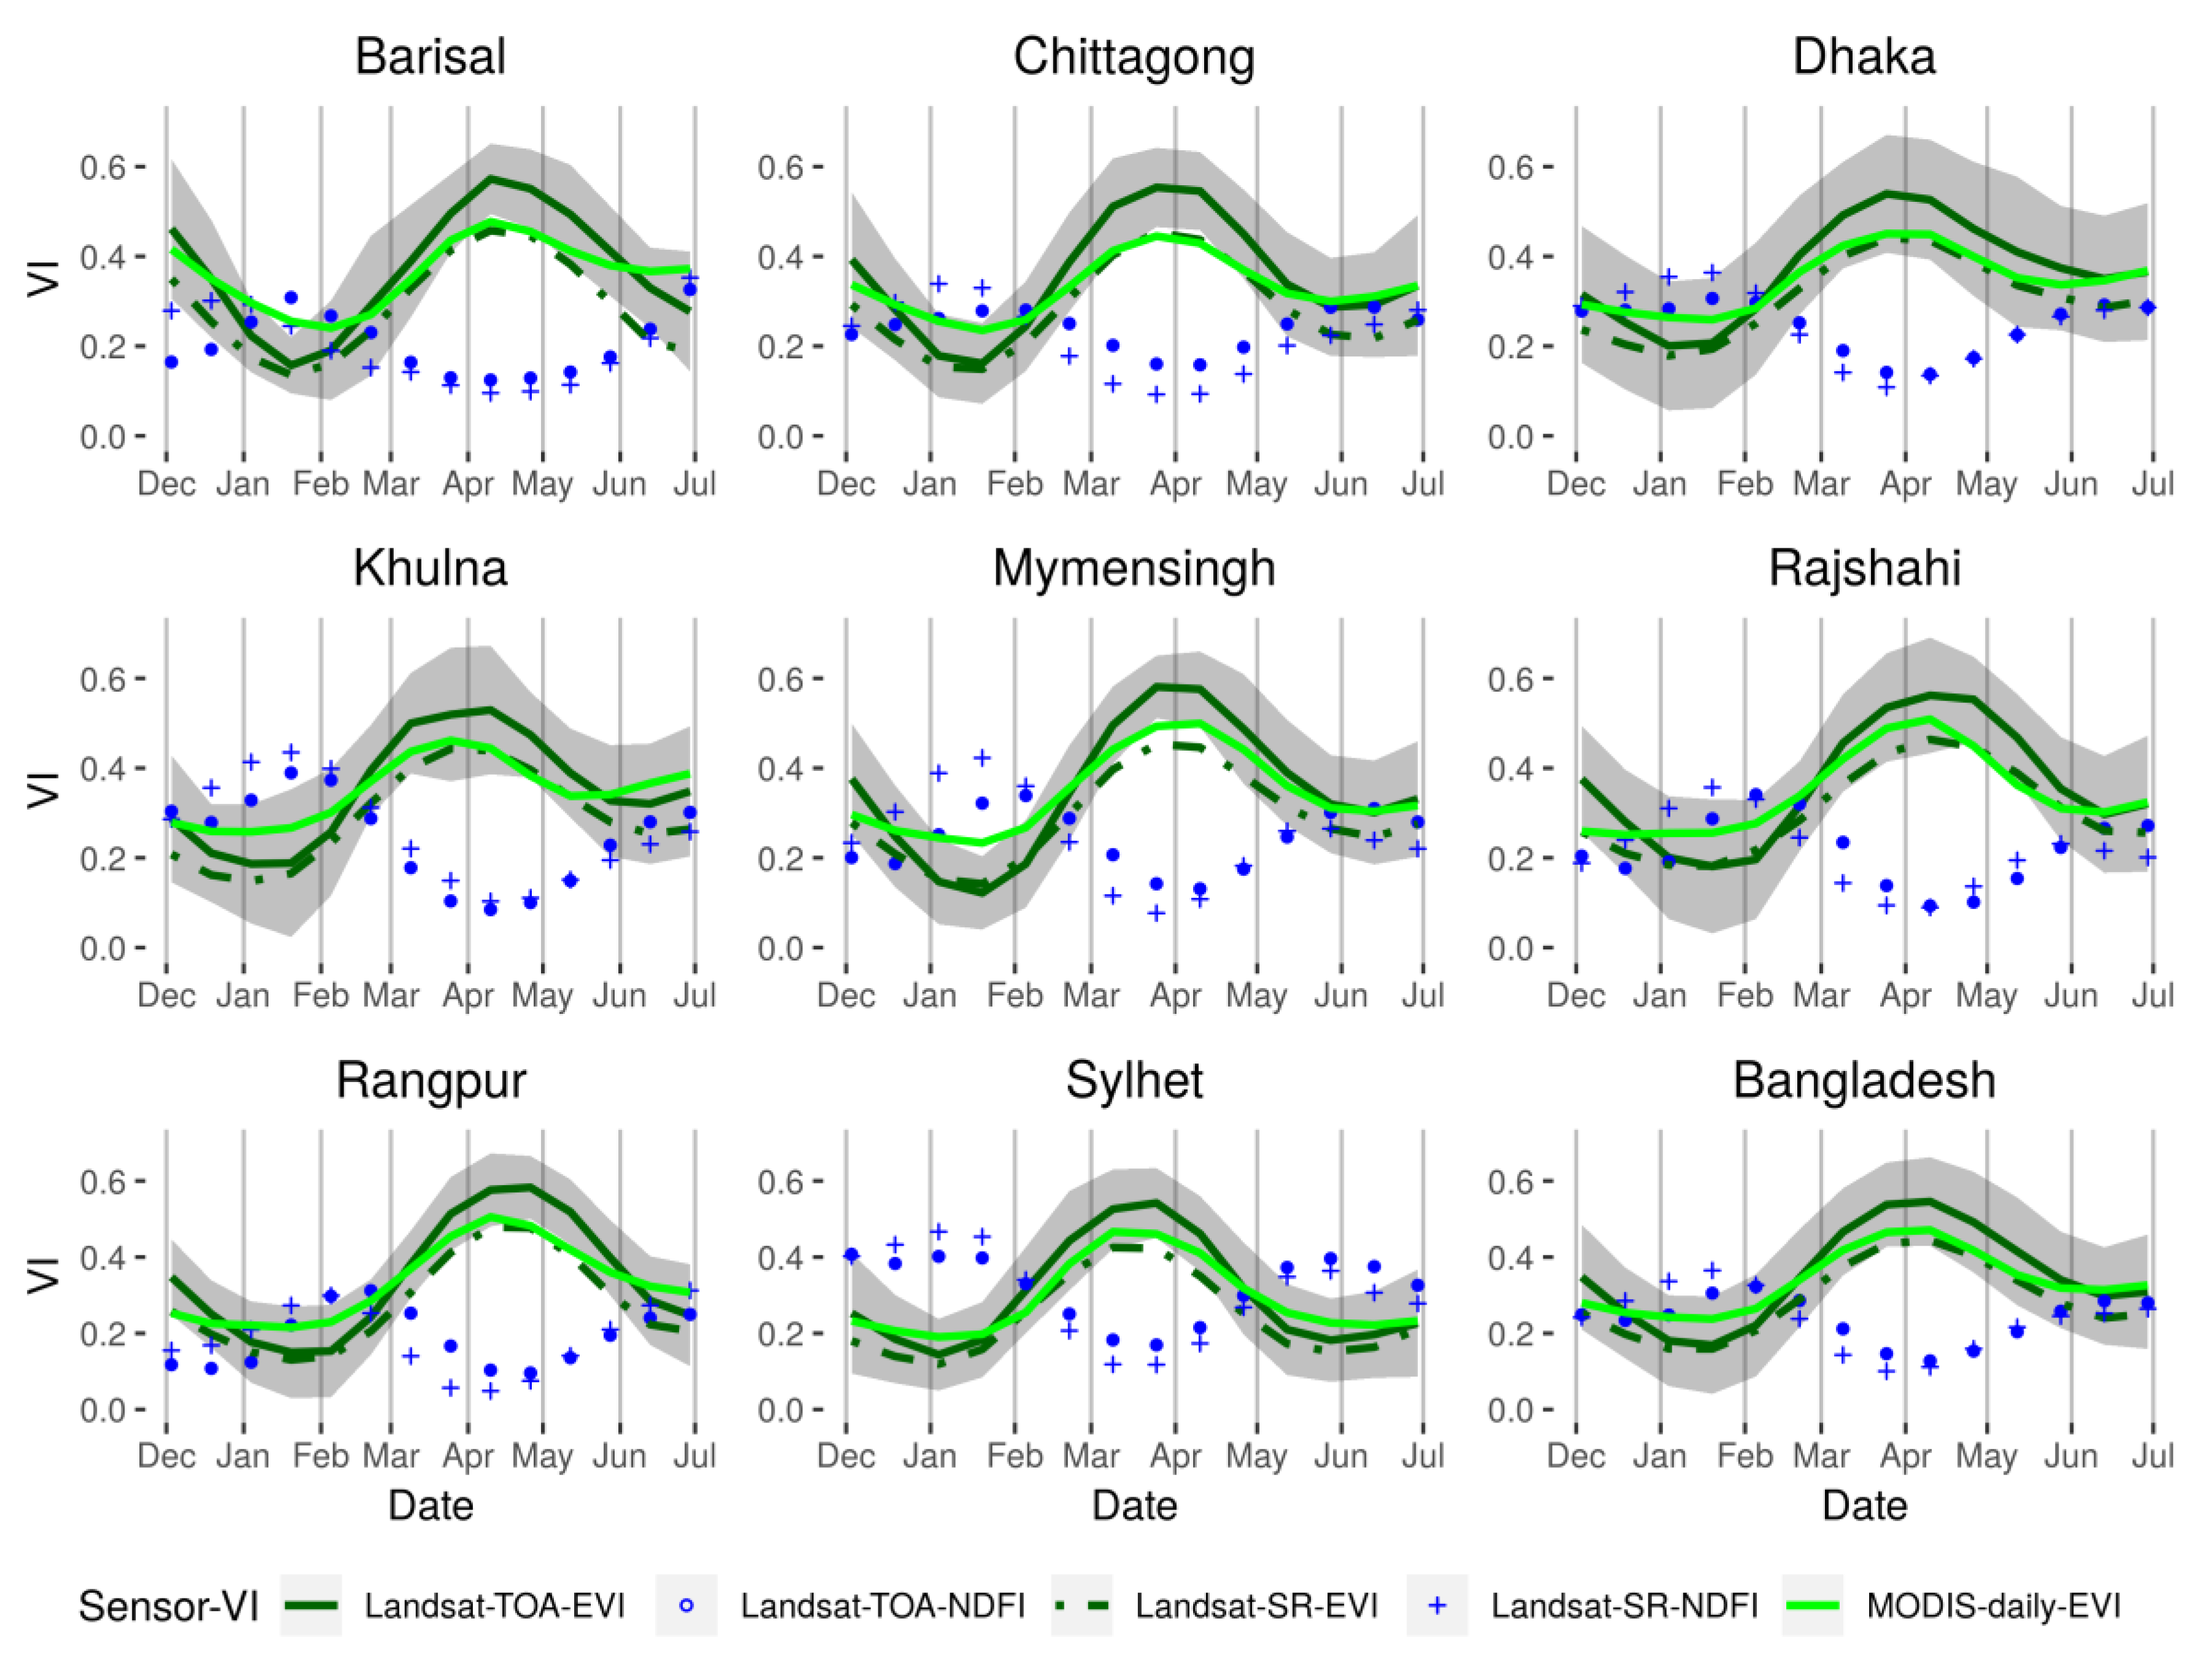
In Figure 5, 2000 random rice-candidate pixels were selected from all of the stable boro rice pixels in Bangladesh to demonstrate how the algorithm adapts to different environments, management practices, and sensor products. The phenoplots show the fitted EVI for the boro season during 2018 using the same HTS model fitted to Landsat TOA, Landsat SR, and MODIS Terra daily EVI products (see https://developers.google.com/earth-engine/datasets/catalog/MODIS_MOD09GA_006_EVI for more information). The Landsat TOA and SR products were modeled with the exact same HTS specifications for both EVI and NDFI. The MODIS Terra daily EVI products were smoothed and gap-filled using an iterative spline method, minimizing the difference in actual and predicted values. The iterative smoothing techniques for MODIS have shown to produce better results by other researchers [23]. Overall, the three EVI time series exhibited similar patterns across growth stages in rice-candidate pixels. Similar patterns between TOA and SR products for Sentinel-2 sensors have also been reported [61]. It is worth mentioning that the Landsat TOA- and SR-based NDFI also showed similar temporal profiles across all the regions. However, the TOA was more sensitive to spectral changes than the Landsat SR and MODIS EVI and consistently had higher values during the growing season. Apart from the sensor characteristics, a number of external factors could contribute to this systematic difference, including aerosol interference in the shorter wavelength regions, different cloud-masking techniques in SR and TOA products, and a lower number of SR observations in some locations. Nonetheless, we do not expect significant differences in the overall results of the HTS-VIs output if SR products are used. We, however, recommend using different threshold values for SR-based VIs.
The phenoplots illustrate the regional variations in the start-of-season (SoS) at minimum EVI prior to the maximum EVI which signifies heading and flowering. Moreover, the end-of-season (EoS) is highlighted by the convergence of NDFI and EVI after the maximum of EVI. Note the length of seasons vary by division, but the characteristics necessary to be a rice-candidate pixel remain. This may suggest that the HTS-VIs model is flexible enough to account for local environmental differences found in Bangladesh, such as pre- and post-dry season (pre-monsoon) flooding in Sylhet [58]. In this case, NDFI is substantially higher for a longer period before EVI rises after transplanting, and quickly rises again after the grain-filling and harvesting stage. The variation in the temporal signature, represented by the grey area (standard deviation) surrounding mean EVI (green line), implies that some regions such as Dhaka or Khulna Divisions are much more variable in management practices or landscape conditions whereas regions such as Mymensingh or Rangpur are more stable. In Dhaka, variation in EVI may stem from adaptation to population growth and urban expansion, while in Khulna, it could represent issues with salinity, flooding, or other changes due to proximity to the coast.
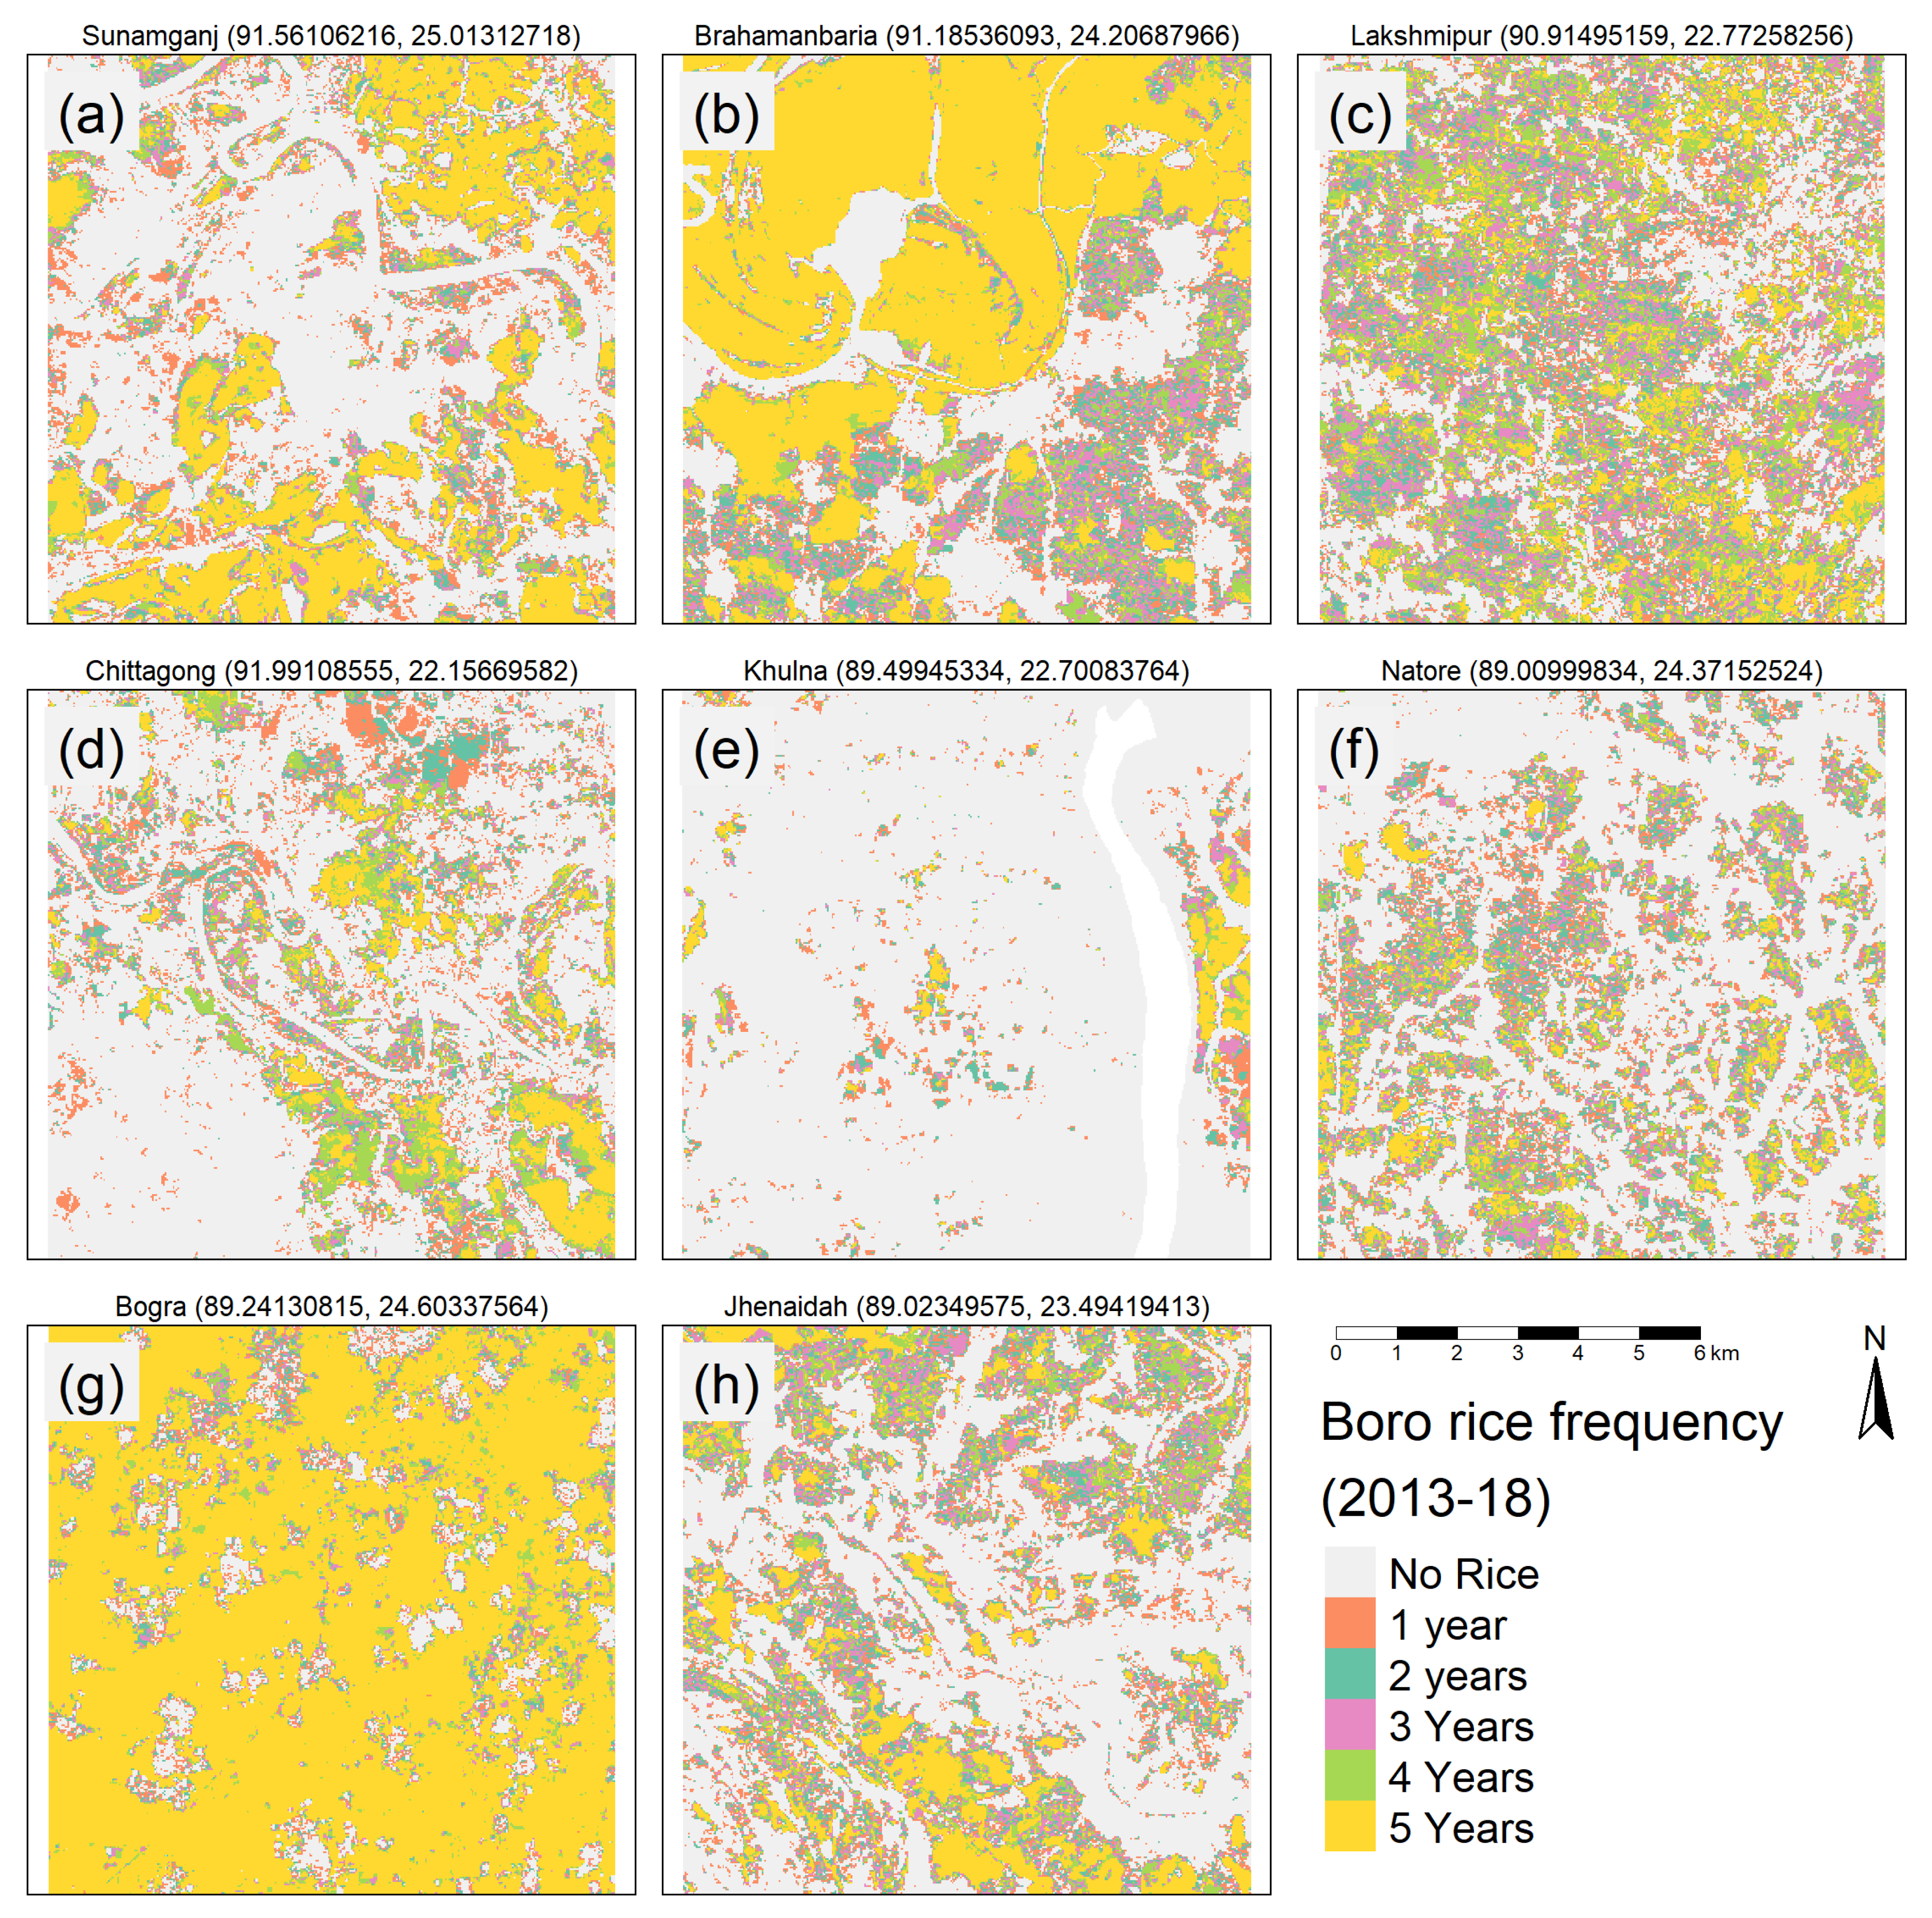
In Figure 6, eight regions are highlighted based on different rice-planting frequencies between 2014 and 2018. The maps consist of 10 km2 plots with the central coordinates and upazila names listed above. Notably, Brahmanbaria and Bogra demonstrate areas where boro rice is consistently planted year-to-year. On the other hand, dry-season rice production in Lakshmipur, Natore, and Jhenaidah is highly variable, with no consistent pattern for how many years of rice were planted from 2014–2018. Some of this pattern can be explained by the wheat blast outbreak in 2016 affecting at least eight districts in northwest Bangladesh [62]. Following the event, all farmers in those districts were advised against planting wheat in the following year(s) [63]. Based on the spatiotemporal patterns of boro rice area that emerged from our analysis, we believe many of the farmers planted rice in the dry season instead of wheat. Sunamgonj and Chittagong are divergent, showing substantial areas where boro rice was consistently produced alongside many pixels that seem more marginal and less frequently identified as rice-producing. Khulna illustrates the coastal region where boro rice is much scarcer. This provides a closer multiyear of boro rice production stability at the regional level compared to the map presented in Figure 4 above, and it further illustrates the adaptability of the HTS-VIs model.
4.3. Temporal Patterns of Boro Rice Production
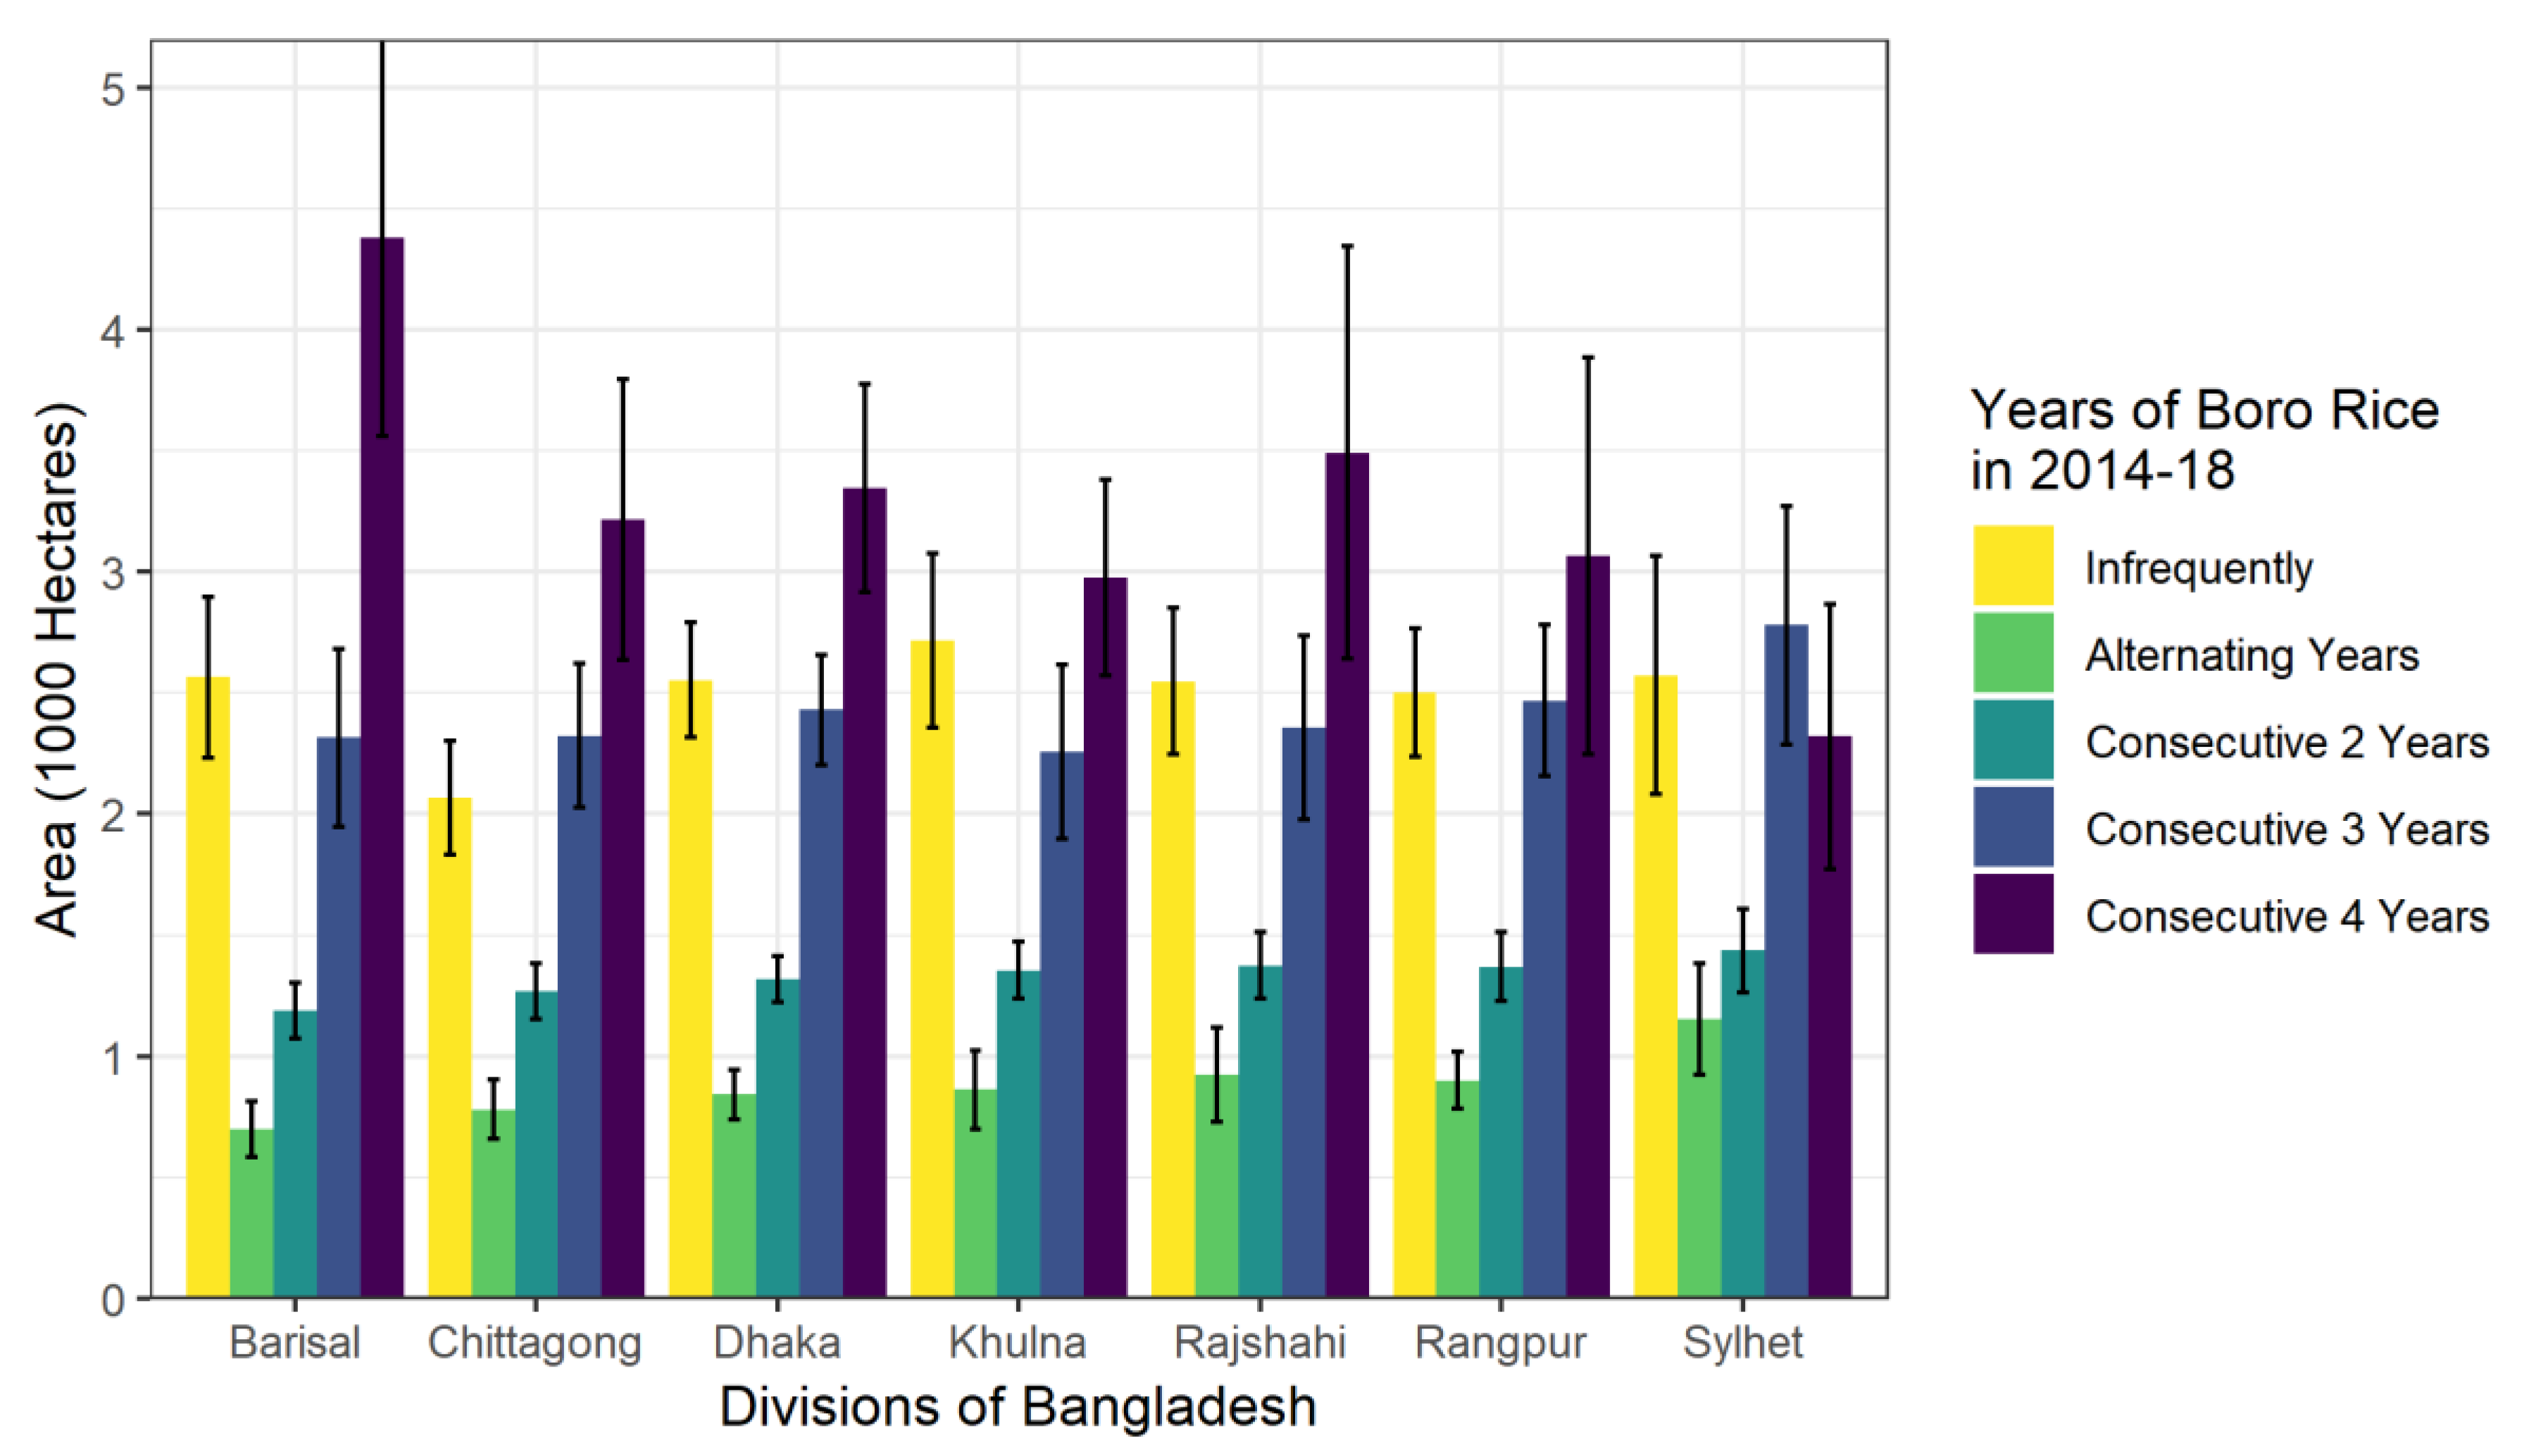
To further extend the HTS-VIs results, the temporal patterns of boro rice production were also analyzed for consecutiveness based on results shown in Figure 7. Pixels not identified as rice for all five years were merely considered unstable above, but here the temporal consecutiveness of rice planting is summarized for each of the eight Bangladeshi Divisions. We introduced the following common temporal categories: “Infrequent,” “alternating,” “two,” “three,” and “four,” and summarized for the total area and standard errors for districts in each division. Infrequent represents the number of district pixels within the division that had one year of boro rice or more than one non-boro rice years in between two boro rice production. Alternating represents the pattern for a one year break between boro rice production. Two, three, and four embody any scenario where the pixel had consecutive boro rice for that number of years, with the larger number of consecutive years counting only once. Of these signatures for consecutive years, four was the most common rice-candidate pixel signature for consecutiveness in all divisions except for Sylhet, where boro rice production was seemingly more infrequent. Notably, “five” was omitted as it is represented by the stable rice pixels in Figure 4, and five was the most common rice pixel category with greater than 250,000 pixels in each of the eight divisions.
4.4. Comparison of HTS-VIs with BBS District Rice Area Estimates
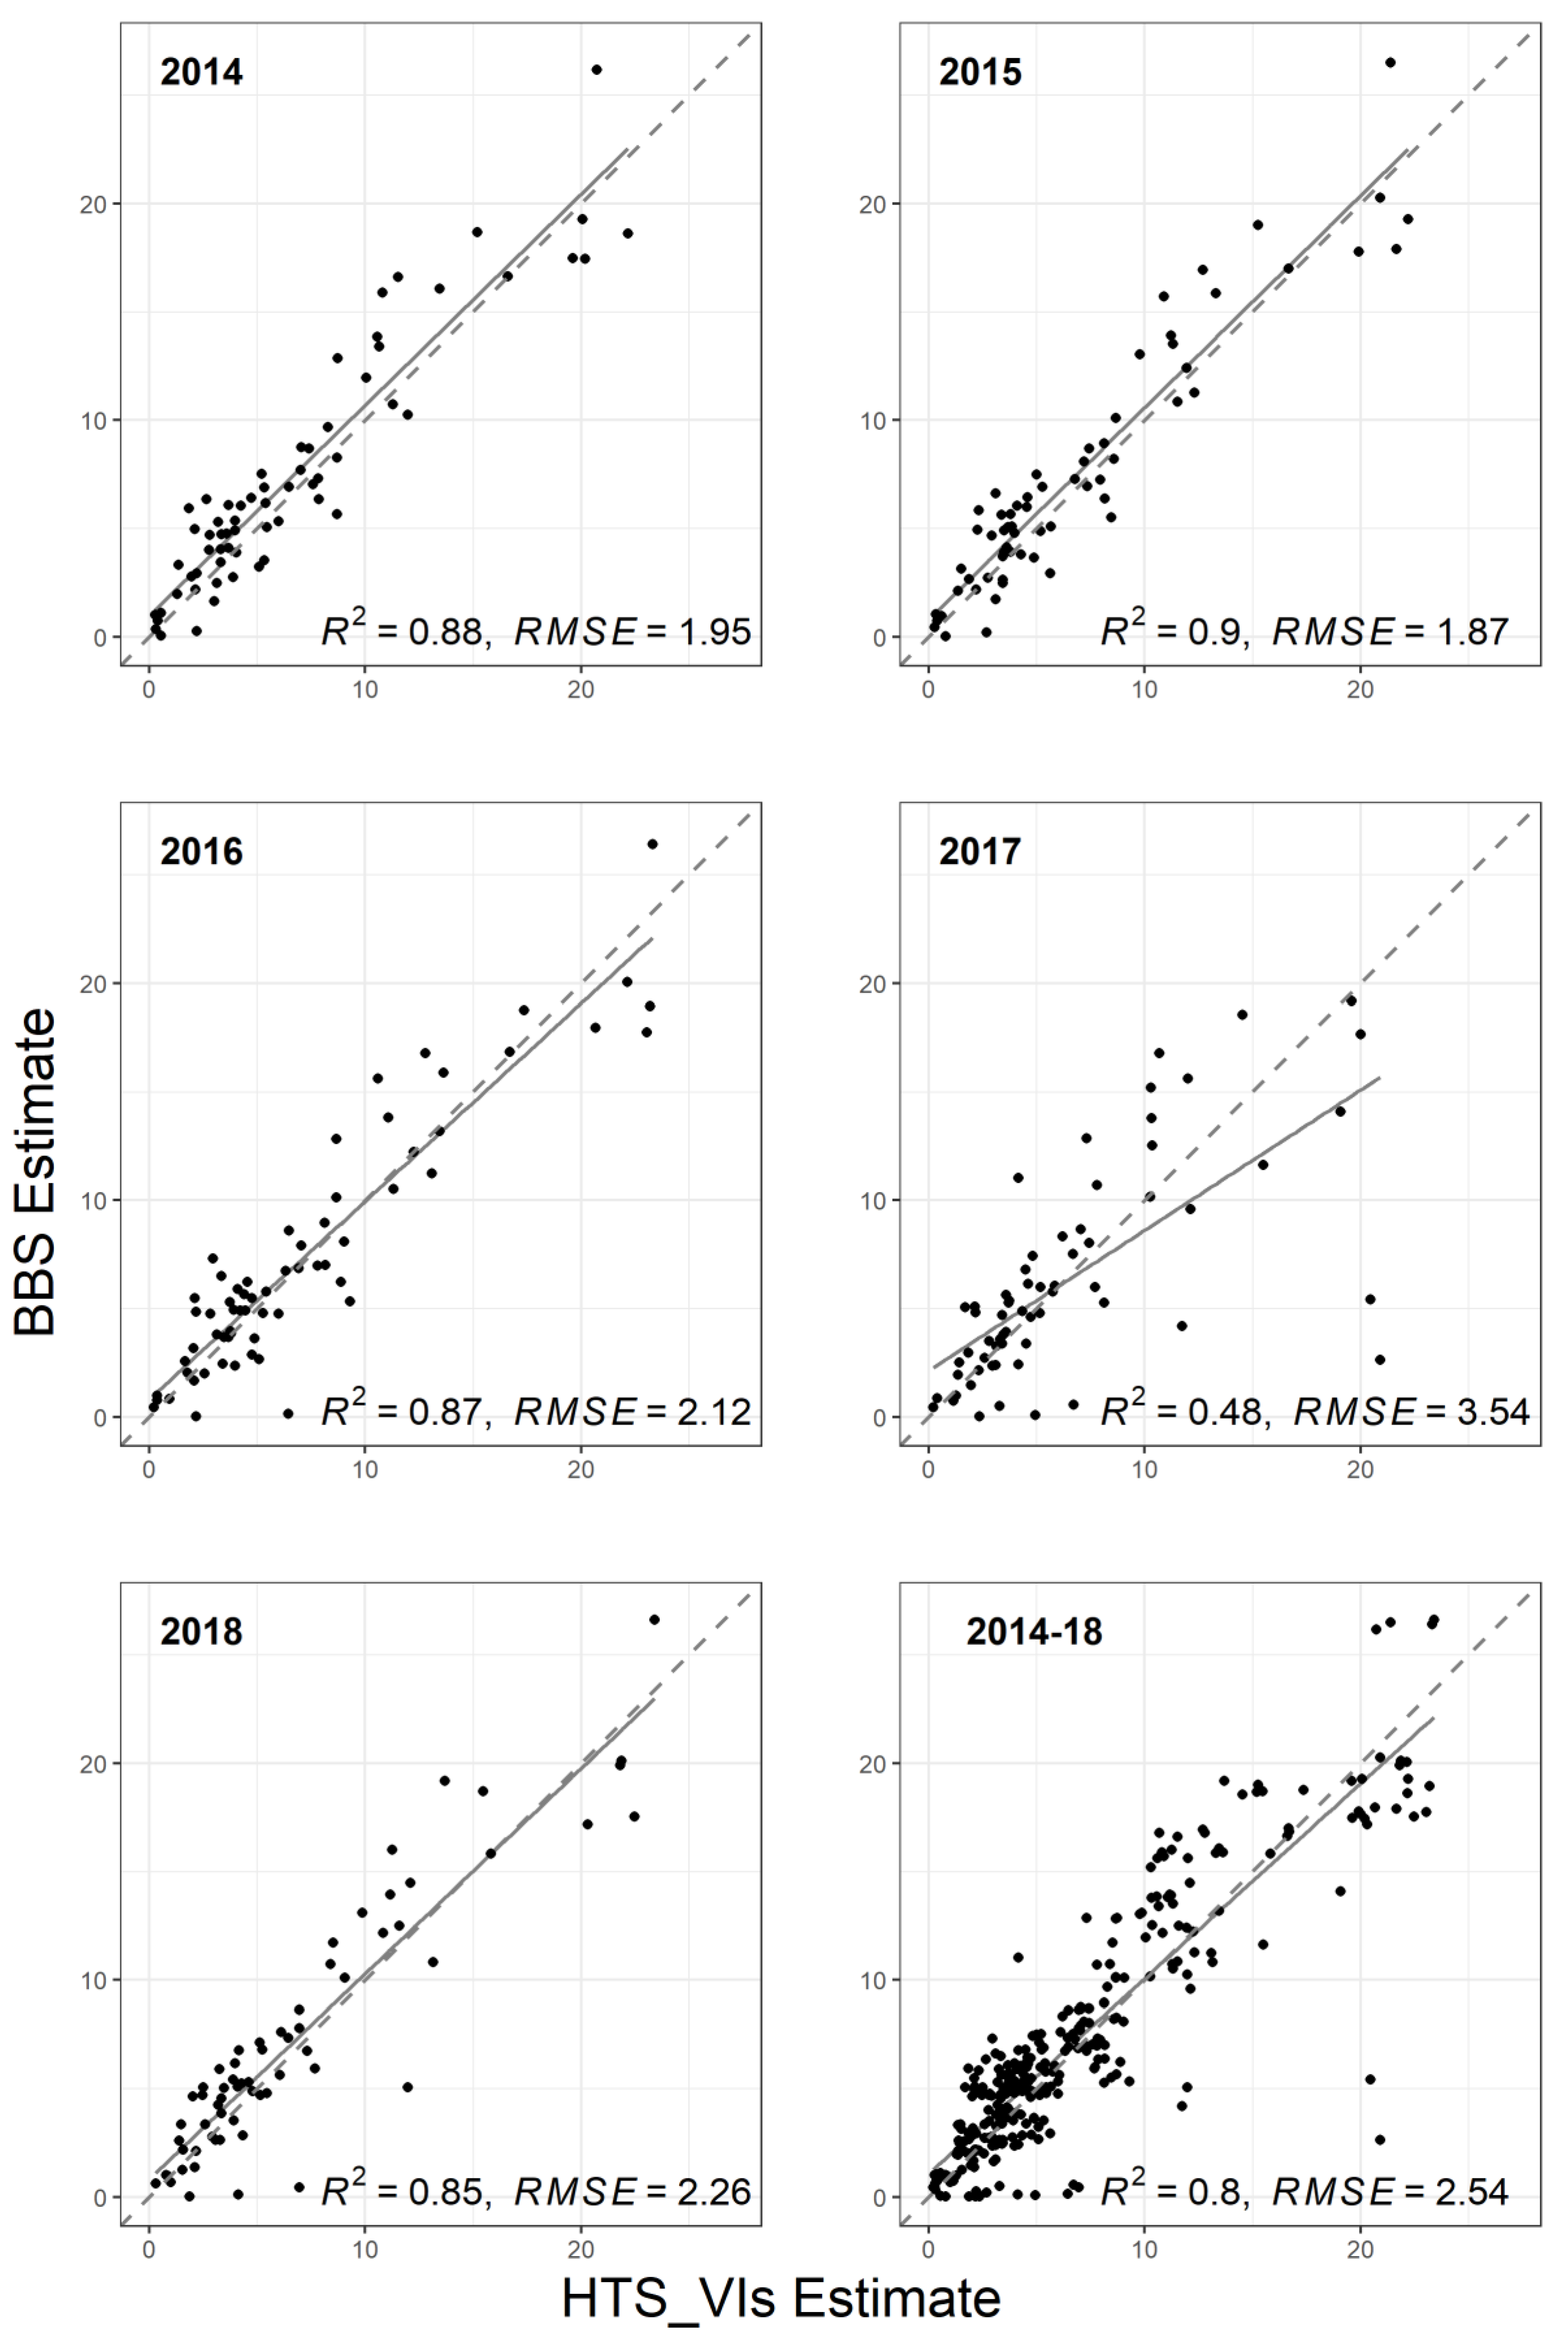
District-wise results of the HTS-VIs model follow similar regional patterns to those estimated in BBS. Estimates from the HTS-VIs implementation and the BBS estimates are in close agreement, approximately 80% of the time, across all production years between 2013–2014 and 2017–2018, as demonstrated by the scatterplots and trend lines in Figure 8. The R-squared across all years is significantly affected by the low correlation between the BBS and HTS-VIs estimates during 2017 (R2 = 0.48). All other years (2014–2016, 2018) were between 85 and 90% correlated with an average R2 = 0.88. This may be explained by the fact that BBS reports harvested areas only, whereas the HTS-VIs estimates total planted areas. In 2017, some rice-planted areas in Northeastern Bangladesh experienced substantial flooding and less rice hectares were harvested as a result, which may explain the difference between BBS and HTS-VIs during that year as seen in the 2017 panel of Figure 8 [42].
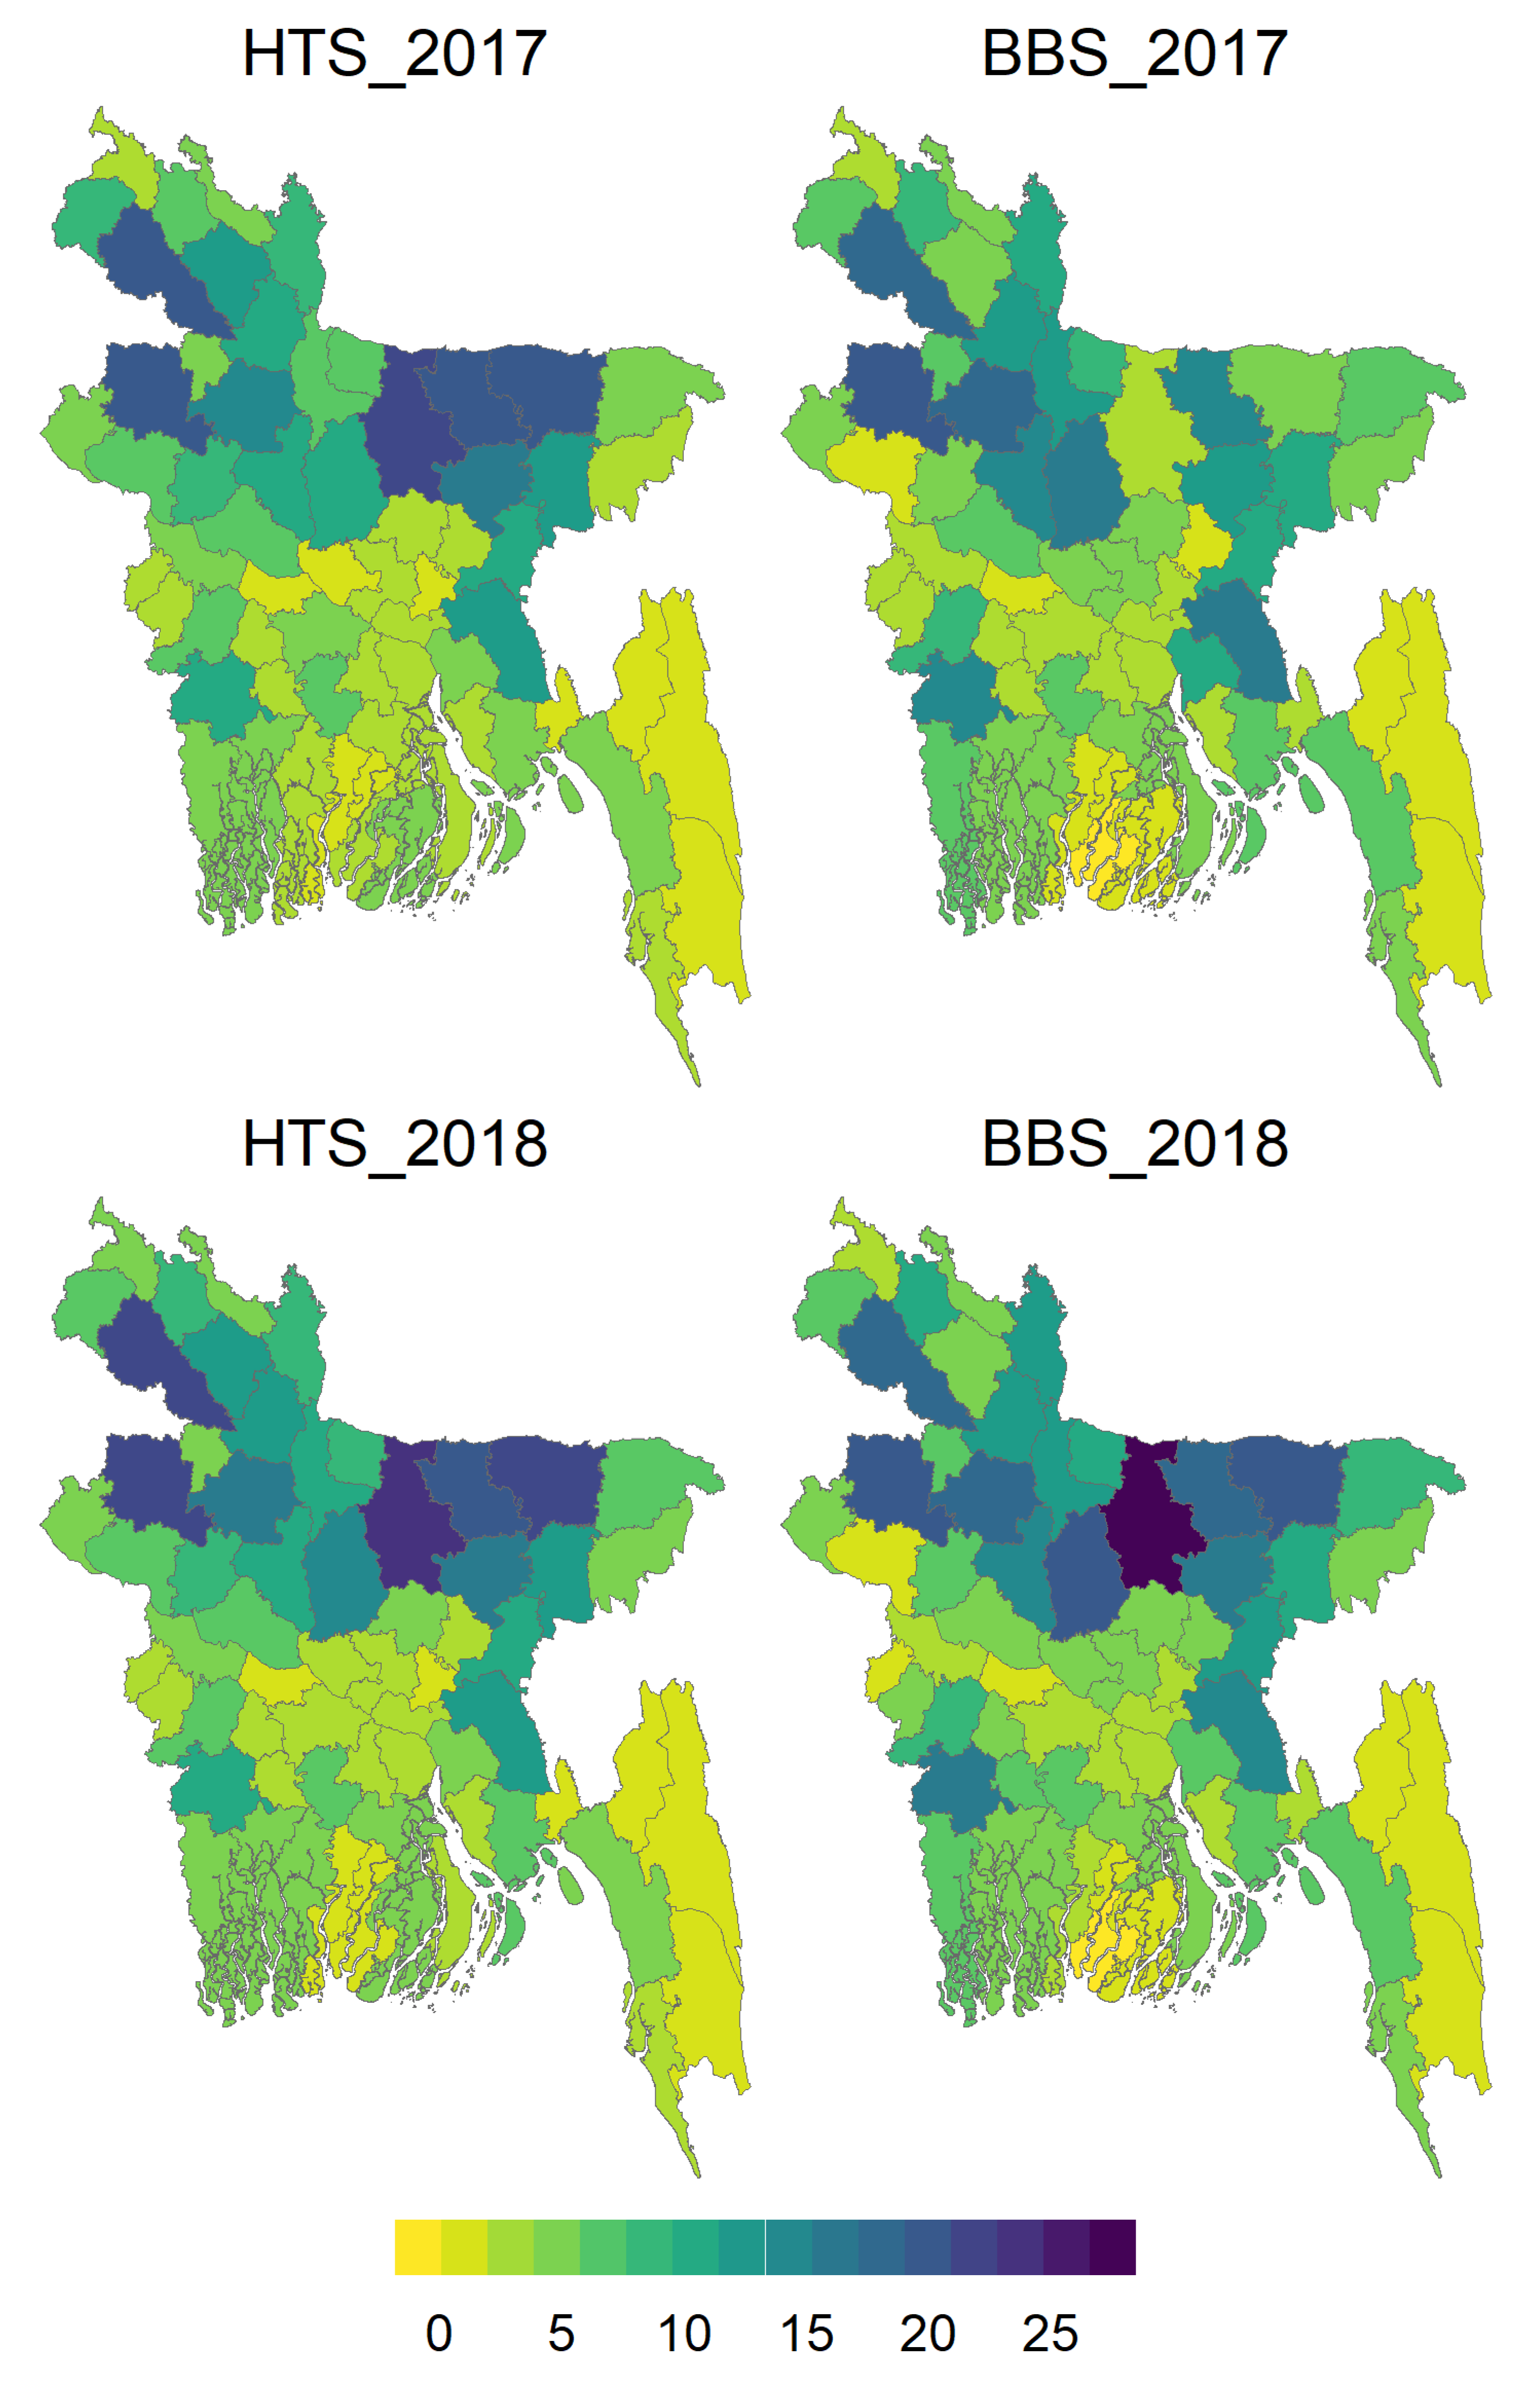
In most districts, the HTS-VIs tracked relatively closely with BBS estimates by year. Figure 9 illustrates the HTS-VIs estimates compared to BBS by district for 2017 and 2018 (see Figure S2 in Supplementary Information for other years). In 2018, the district results were particularly close between BBS and HTS-VIs and the regional pattern of rice-growing areas during the dry season were consistent with a priori knowledge. The northern and central regions are the boro rice belt, while the southern areas are less consistently planted to rice for a host of environmental reasons, and the northeastern areas often wait to plant aus summer-season rice. The 2017 maps show a sharp divergence in BBS and HTS-VIs area estimates in Sylhet and Mymensingh, specifically, while other regional estimates remain similar. This is likely due to the major flood events that occurred in the mid- to late-boro season in 2017 and destroyed many rice planted fields, as noted above [42].
4.5. Accuracy Assessment with High-Resolution Imagery
The validation samples included boro rice locations from different years depending on the availability of high-resolution imagery in Google Earth Pro. However, frequent crop rotation in dry season presented a unique challenge for accuracy assessment of yearly rice maps. Therefore, we created a stable map of boro rice areas where the model predicted at least 4 years of boro rice from 2014 to 2018. When tested against the high-resolution imagery with expert interpretation, the HTS-VIs model stable boro rice map achieved an overall accuracy of 91% with a kappa coefficient of 0.83. We found that the major source of error was due to mixing boro rice and other crop classes, which was expected given factors such as crop rotation, smaller field sizes, and heterogeneity in agricultural landscapes.
4.6. Limitations, Synergistic Research, and Future Steps
In this study, we limited ourselves to introducing the HTS-VIs model with Bangladesh as an example in order to demonstrate its effectiveness and potential for capturing rice-producing areas in a fragmented landscape with diverse agricultural systems, but further validation and testing is needed for the HTS-VIs model. Our results compare well with the BBS district rice areas, but BBS data has not been validated for quality itself. We also created reference data and interpreted high-resolution images for additional validation. In an ideal scenario, we would collect in situ ground truth information from multiple regions and different management systems to monitor boro rice from planting to harvest dates. This would provide a more robust validation for the HTS-VIs model. However, in situ data collection in Bangladesh poses challenges, including high costs among other issues. Therefore, the primary aim of this study was to present an initial framework for the model to identify boro rice pixels with the regional comparison to demonstrate its potential relative to current methods of rice area estimation. The HTS-VIs model may lead to improved, cost-reducing rice area estimations where on-the-ground information are lacking or difficult and cost-prohibitive to obtain.
While not included in this study, weather covariates and general soil types could be included in the HTS-VIs model in future work. Specifically, precipitation and soils could provide a control for flooding impacts on rice area estimates, and minimum and maximum temperatures could indicate rice phenology responses to day- and night-time heat stress. Given the potential of global climate change to impact rice (and other crops), models such as HTS-VIs could provide a crucial platform for not only mapping but monitoring production throughout the growing season. Many empirical and simulated crop models rely on regional production and management information, which is difficult to obtain. The HTS-VIs model could be implemented to identify sampling regions for such empirical or crop models to ensure representativeness and maximum effectiveness in estimating regional production outcomes. Moreover, when crop trial information has details on management information, the location (and timing) of such trials could be combined with HTS-VIs for synergistic investigations of rice production and yield prediction at finer spatial resolutions.
We choose Landsat for this analysis due to the unique historical coverage offered by the archive. Mapping long-term adoption process of boro rice in Bangladesh would require consistent time series using Landsat archive for the past decades. However, the publicly available Landsat archive is not complete [64] and research efforts should focus on multisensor image fusion for creating the time series information [65]. Further effort is needed to compare additional smoothing (e.g., Savitzky–Golay filter) and gap-filling tools (e.g., https://landsat.usgs.gov/filling-gaps-use-scientific-analysis) for extracting specific information associated with cropping practices (e.g., planting, heading, flowering, and harvesting dates) or predicting rice yield for individual plots. While Landsat and MODIS have been the primary choice for rice mapping, future research projects can benefit from Sentinel-2A and -2B products that offer superior spectral and spatial (10–20 m) information with more frequent observations (five-day revisit period) for the spectral indices used in this study.
5. Conclusions
In this study, we demonstrated the implementation of a harmonic time series (HTS) model with EVI and NDFI (VIs) to identify rice production areas during the boro season in Bangladesh for 2014–2018. To our knowledge, this is the first time an annual pixel-based time series model has been applied to Landsat at the national level in a multiyear analysis of rice. We found that, the HTS-VIs model has the potential to map rice production across fragmented landscapes and heterogeneous production practices with comparable results to other model and governmental estimates but without local management or in situ information as inputs. The HTS-VIs model identified 4.285, 4.425, 4.645, 4.117, and 4.407 million rice-producing hectares for 2014, 2015, 2016, 2017, and 2018, respectively, which correlates well with national estimates by BBS. Moreover, the results relate strongly with the BBS district estimates of rice area with an average R-squared of 0.88. The HTS-VIs model extends previous efforts to map rice in fragmented landscapes, and the results of our study demonstrate its use in a complex environment. In future work, the model may be improved by comparing results with on-the-ground information to further validate and affirm the potential of this rice-mapping technique. As agricultural monitoring via remote sensing becomes more widespread and important in meeting global food security needs, we suggest that models like the HTS-VIs introduced here could improve the accuracy and efficiency with which scientists are able to do so, giving policy-makers and development practitioners an enhanced platform for their work.
Supplementary Materials
The following are available online at https://0-www-mdpi-com.brum.beds.ac.uk/2072-4292/11/10/1235/s1, Figure S1: Locations of boro other classes as identified by high resolution image interpretation, Figure S2: District-wise Map of the HTS-VIs Results for 2014-2018, Table S1: Rice Seasons and Production, BBS Reporting for 2013-2016 (area presented in 10,000 hectares).
Author Contributions
The authors contributed equally to this article.
Funding
This study was made possible by the support of the American People provided to the Feed the Future Innovation Lab for Sustainable Intensification through the United States Agency for International Development (USAID). Program activities were funded by the United States Agency for International Development (USAID) under Cooperative Agreement No. AID-OAA- L-14- 00006. The contents are the sole responsibility of the authors and do not necessarily reflect the views of USAID or the United States Government. This work was also supported by the National Science Foundation Graduate Research Fellowship Program [Grant No. DGE-1450079].
Acknowledgments
We acknowledge the GEE developer team for providing technical assistance required for successful completion of this project.
Conflicts of Interest
The authors declare no conflict of interest.
References
- Beal, T.; Belden, C.; Hijmans, R.J.; Mandel, A.; Norton, M.; Riggio, J. Country Profiles: Bangladesh; Sustainable Intensification Innovation Lab; UC Davis: Davis, CA, USA; Available online: https://gfc.ucdavis.edu/profiles/rst/bgd.html (accessed on 1 November 2018).
- Timsina, J.; Wolf, J.; Guilpart, N.; van Bussel, L.G.J.; Grassini, P.; van Wart, J.; Hossain, A.; Rashid, H.; Islam, S.; van Ittersum, M.K. Can Bangladesh produce enough cereals to meet future demand? Agric. Syst. 2016, 163, 36–44. [Google Scholar] [CrossRef] [PubMed]
- Shelley, I.J.; Takahashi-Nosaka, M.; Kano-Nakata, M.; Haque, M.S.; Inukai, Y. Rice Cultivation in Bangladesh: Present Scenario, Problems, and Prospects. J. Int. Coop. Agric. Dev. 2016, 14, 20–29. [Google Scholar]
- Shew, A.M.; Durand-Morat, A.; Putman, B.; Nalley, L.L.; Ghosh, A. Rice intensification in Bangladesh improves economic and environmental welfare. Environ. Sci. Policy 2019, 95, 46–57. [Google Scholar] [CrossRef]
- Lázár, A.N.; Clarke, D.; Adams, H.; Akanda, A.R.; Szabo, S.; Nicholls, R.J.; Matthews, Z.; Begum, D.; Saleh, A.F.M.; Abedin, M.A.; et al. Agricultural livelihoods in coastal Bangladesh under climate and environmental change—A model framework. Environ. Sci. Process. Impacts 2015, 17, 1018–1031. [Google Scholar] [CrossRef] [PubMed]
- Kuenzer, C.; Knauer, K. Remote sensing of rice crop areas. Int. J. Remote Sens. 2013, 34, 2101–2139. [Google Scholar] [CrossRef]
- Smith, P.; Martino, D.; Cai, Z.; Gwary, D.; Janzen, H.; Kumar, P.; McCarl, B.; Ogle, S.; O’Mara, F.; Rice, C.; et al. Greenhouse gas mitigation in agriculture. Philos. Trans. R. Soc. B Biol. Sci. 2008, 363, 789–813. [Google Scholar] [CrossRef]
- van Groenigen, K.J.; van Kessel, C.; Hungate, B.A. Increased greenhouse-gas intensity of rice production under future atmospheric conditions. Nat. Clim. Chang. 2012, 3, 288–291. [Google Scholar] [CrossRef]
- Whitcraft, A.; Becker-Reshef, I.; Justice, C. A Framework for Defining Spatially Explicit Earth Observation Requirements for a Global Agricultural Monitoring Initiative (GEOGLAM). Remote Sens. 2015, 7, 1461–1481. [Google Scholar] [CrossRef] [Green Version]
- Zhang, G.; Xiao, X.; Biradar, C.M.; Dong, J.; Qin, Y.; Menarguez, M.A.; Zhou, Y.; Zhang, Y.; Jin, C.; Wang, J.; et al. Spatiotemporal patterns of paddy rice croplands in China and India from 2000 to 2015. Sci. Total Environ. 2017, 579, 82–92. [Google Scholar] [CrossRef]
- Dong, J.; Xiao, X.; Menarguez, M.A.; Zhang, G.; Qin, Y.; Thau, D.; Biradar, C.; Moore, B. Mapping paddy rice planting area in northeastern Asia with Landsat 8 images, phenology-based algorithm and Google Earth Engine. Remote Sens. Environ. 2016, 185, 142–154. [Google Scholar] [CrossRef] [PubMed] [Green Version]
- Busetto, L.; Zwart, S.J.; Boschetti, M. Analysing spatial–temporal changes in rice cultivation practices in the Senegal River Valley using MODIS time-series and the PhenoRice algorithm. Int. J. Appl. Earth Obs. Geoinf. 2019, 75, 15–28. [Google Scholar] [CrossRef]
- Xiao, X.; Boles, S.; Frolking, S.; Li, C.; Babu, J.Y.; Salas, W.; Moore, B. Mapping paddy rice agriculture in South and Southeast Asia using multi-temporal MODIS images. Remote Sens. Environ. 2006, 100, 95–113. [Google Scholar] [CrossRef]
- Xiao, X.; Boles, S.; Liu, J.; Zhuang, D.; Frolking, S.; Li, C.; Salas, W.; Moore, B. Mapping paddy rice agriculture in southern China using multi-temporal MODIS images. Remote Sens. Environ. 2005, 95, 480–492. [Google Scholar] [CrossRef]
- Busetto, L.; Casteleyn, S.; Granell, C.; Pepe, M.; Barbieri, M.; Campos-Taberner, M.; Casa, R.; Collivignarelli, F.; Confalonieri, R.; Crema, A.; et al. Downstream Services for Rice Crop Monitoring in Europe: From Regional to Local Scale. IEEE J. Sel. Top. Appl. Earth Obs. Remote Sens. 2017, 10, 5423–5441. [Google Scholar] [CrossRef] [Green Version]
- McCLOY, K.R.; Smith, F.R.; Robinson, M.R. Monitoring rice areas using LANDSAT MSS data. Int. J. Remote Sens. 1987, 8, 741–749. [Google Scholar] [CrossRef]
- Fang, H.; Wu, B.; Liu, H.; Huang, X. Using NOAA AVHRR and Landsat TM to estimate rice area year-by-year. Int. J. Remote Sens. 1998, 19, 521–525. [Google Scholar] [CrossRef]
- Dong, J.; Xiao, X. Evolution of regional to global paddy rice mapping methods: A review. Isprs J. Photogramm. Remote Sens. 2016, 119, 214–227. [Google Scholar] [CrossRef] [Green Version]
- Shiu, Y.-S.; Chu, T.-H.; Lin, M.-L.; Huang, C.-H. Mapping paddy rice agriculture in a highly fragmented area using a geographic information system object-based post classification process. J. Appl. Remote Sens. 2012, 6, 063526. [Google Scholar]
- Konishi, T.; Omatu, S.; Suga, Y. Extraction of rice-planted area using a self-organizing feature map. Artif. Life Robot. 2007, 11, 215–218. [Google Scholar] [CrossRef]
- Turner, M.D.; Congalton, R.G. Classification of multi-temporal SPOT-XS satellite data for mapping rice fields on a West African floodplain. Int. J. Remote Sens. 1998, 19, 21–41. [Google Scholar] [CrossRef]
- Cheema, M.J.M.; Bastiaanssen, W.G.M. Land use and land cover classification in the irrigated Indus Basin using growth phenology information from satellite data to support water management analysis. Agric. Water Manag. 2010, 97, 1541–1552. [Google Scholar] [CrossRef]
- Boschetti, M.; Busetto, L.; Manfron, G.; Laborte, A.; Asilo, S.; Pazhanivelan, S.; Nelson, A. PhenoRice: A method for automatic extraction of spatio-temporal information on rice crops using satellite data time series. Remote Sens. Environ. 2017, 194, 347–365. [Google Scholar] [CrossRef] [Green Version]
- Dong, J.; Xiao, X.; Kou, W.; Qin, Y.; Zhang, G.; Li, L.; Jin, C.; Zhou, Y.; Wang, J.; Biradar, C.; et al. Tracking the dynamics of paddy rice planting area in 1986–2010 through time series Landsat images and phenology-based algorithms. Remote Sens. Environ. 2015, 160, 99–113. [Google Scholar] [CrossRef]
- Gumma, M.K.; Thenkabail, P.S.; Maunahan, A.; Islam, S.; Nelson, A. Mapping seasonal rice cropland extent and area in the high cropping intensity environment of Bangladesh using MODIS 500m data for the year 2010. Isprs J. Photogramm. Remote Sens. 2014, 91, 98–113. [Google Scholar] [CrossRef]
- Boschetti, M.; Nutini, F.; Manfron, G.; Brivio, P.A.; Nelson, A. Comparative Analysis of Normalised Difference Spectral Indices Derived from MODIS for Detecting Surface Water in Flooded Rice Cropping Systems. PLoS ONE 2014, 9, e88741. [Google Scholar] [CrossRef]
- Okamoto, K. Estimation of rice-planted area in the tropical zone using a combination of optical and microwave satellite sensor data. Int. J. Remote Sens. 1999, 20, 1045–1048. [Google Scholar] [CrossRef]
- Nelson, A.; Setiyono, T.; Rala, A.; Quicho, E.; Raviz, J.; Abonete, P.; Maunahan, A.; Garcia, C.; Bhatti, H.; Villano, L.; et al. Towards an Operational SAR-Based Rice Monitoring System in Asia: Examples from 13 Demonstration Sites across Asia in the RIICE Project. Remote Sens. 2014, 6, 10773–10812. [Google Scholar] [CrossRef] [Green Version]
- Park, S.; Im, J.; Park, S.; Yoo, C.; Han, H.; Rhee, J. Classification and Mapping of Paddy Rice by Combining Landsat and SAR Time Series Data. Remote Sens. 2018, 10, 447. [Google Scholar] [CrossRef]
- Rapsomanikis, G. The Economic Lives of Smallholder Farmers; FAO: Rome, Italy, 2015. [Google Scholar]
- Wulder, M.A.; White, J.C.; Loveland, T.R.; Woodcock, C.E.; Belward, A.S.; Cohen, W.B.; Fosnight, E.A.; Shaw, J.; Masek, J.G.; Roy, D.P. The global Landsat archive: Status, consolidation, and direction. Remote Sens. Environ. 2016, 185, 271–283. [Google Scholar] [CrossRef] [Green Version]
- Wulder, M.A.; White, J.C.; Goward, S.N.; Masek, J.G.; Irons, J.R.; Herold, M.; Cohen, W.B.; Loveland, T.R.; Woodcock, C.E. Landsat continuity: Issues and opportunities for land cover monitoring. Remote Sens. Environ. 2008, 112, 955–969. [Google Scholar] [CrossRef]
- Panigrahy, S.; Parihar, J.S. Role of middle infrared bands of Landsat thematic mapper in determining the classification accuracy of rice. Int. J. Remote Sens. 1992, 13, 2943–2949. [Google Scholar] [CrossRef]
- Gorelick, N.; Hancher, M.; Dixon, M.; Ilyushchenko, S.; Thau, D.; Moore, R. Google Earth Engine: Planetary-scale geospatial analysis for everyone. Remote Sens. Environ. 2017, 202, 18–27. [Google Scholar] [CrossRef]
- Zwart, S.; Busetto, L.; Diagne, M.; Boschetti, M.; Nelson, A. Mapping Changes in Area and the Cropping Season of Irrigated Rice in Senegal and Mauritania between 2003 and 2014 Using the PhenoRice Algorithm and MODIS Imagery. Agu Fall Meet. Abstr. 2017. Available online: http://adsabs.harvard.edu/abs/2017AGUFM.B11C1684Z (accessed on 1 November 2018).
- Zhang, R.; Zhu, D. Study of land cover classification based on knowledge rules using high-resolution remote sensing images. Expert Syst. Appl. 2011, 38, 3647–3652. [Google Scholar] [CrossRef]
- Roy, D.P.; Wulder, M.A.; Loveland, T.R.; Woodcock, C.E.; Allen, R.G.; Anderson, M.C.; Helder, D.; Irons, J.R.; Johnson, D.M.; Kennedy, R.; et al. Landsat-8: Science and product vision for terrestrial global change research. Remote Sens. Environ. 2014, 145, 154–172. [Google Scholar] [CrossRef] [Green Version]
- UNICEF. UNICEF Annual Report, 2014: Bangladesh; UNICEF: New York, NY, USA, 2014. [Google Scholar]
- Dewan, A.M.; Yamaguchi, Y. Land use and land cover change in Greater Dhaka, Bangladesh: Using remote sensing to promote sustainable urbanization. Appl. Geogr. 2009, 29, 390–401. [Google Scholar] [CrossRef]
- Dasgupta, S.; Hossain, M.M.; Huq, M.; Wheeler, D. Climate Change, Soil Salinity, and the Economics of High-Yield Rice Production in Coastal Bangladesh; World Bank: Washington, DC, USA, 2014. [Google Scholar]
- Kabir, M.J.; Alauddin, M.; Crimp, S. Farm-level adaptation to climate change in Western Bangladesh: An analysis of adaptation dynamics, profitability and risks. Land Use Policy 2017, 64, 212–224. [Google Scholar] [CrossRef] [Green Version]
- Ahmed, M.; Rahaman, K.; Kok, A.; Hassan, Q. Remote Sensing-Based Quantification of the Impact of Flash Flooding on the Rice Production: A Case Study over Northeastern Bangladesh. Sensors 2017, 17, 2347. [Google Scholar] [CrossRef]
- Wassmann, R.; Jagadish, S.V.K.; Sumfleth, K.; Pathak, H.; Howell, G.; Ismail, A.; Serraj, R.; Redona, E.; Singh, R.K.; Heuer, S. Regional Vulnerability of Climate Change Impacts on Asian Rice Production and Scope for Adaptation. Adv. Agron. 2009, 102, 91–133. [Google Scholar]
- Monirul Qader Mirza, M. Global warming and changes in the probability of occurrence of floods in Bangladesh and implications. Glob. Environ. Chang. 2002, 12, 127–138. [Google Scholar] [CrossRef]
- Mondal, M.K.; Bhuiyan, S.I.; Franco, D.T. Soil salinity reduction and prediction of salt dynamics in the coastal ricelands of Bangladesh. Agric. Water Manag. 2001, 47, 9–23. [Google Scholar] [CrossRef]
- FAO. Rice Market Monitor; UN Food and Agriculture Organization, 2017. Available online: www.fao.org/3/a-i7964e.pdf (accessed on 1 November 2018).
- Mahmood, R. Impacts of air temperature variations on the boro rice phenology in Bangladesh: Implications for irrigation requirements. Agric. For. Meteorol. 1997, 84, 233–247. [Google Scholar] [CrossRef]
- Huete, A. A comparison of vegetation indices over a global set of TM images for EOS-MODIS. Remote Sens. Environ. 1997, 59, 440–451. [Google Scholar] [CrossRef]
- Huete, A.; Didan, K.; Miura, T.; Rodriguez, E.P.; Gao, X.; Ferreira, L.G. Overview of the radiometric and biophysical performance of the MODIS vegetation indices. Remote Sens. Environ. 2002, 83, 195–213. [Google Scholar] [CrossRef]
- Zhu, Z.; Fu, Y.; Woodcock, C.E.; Olofsson, P.; Vogelmann, J.E.; Holden, C.; Wang, M.; Dai, S.; Yu, Y. Including land cover change in analysis of greenness trends using all available Landsat 5, 7, and 8 images: A case study from Guangzhou, China (2000–2014). Remote Sens. Environ. 2016, 185, 243–257. [Google Scholar] [CrossRef]
- USGS. Landsat Surface Reflectance-Derived Spectral Indices; USGS: Washington, DC, USA, 2019.
- Moore, R.T.; Hansen, M.C. Google Earth Engine: A new cloud-computing platform for global-scale earth observation data and analysis. Agu Fall Meet. Abstr. 2011, 43. Available online: http://adsabs.harvard.edu/abs/2011AGUFMIN43C..02M (accessed on 1 November 2018).
- Hansen, M.C.; Potapov, P.V.; Moore, R.; Hancher, M.; Turubanova, S.A.; Tyukavina, A.; Thau, D.; Stehman, S.V.; Goetz, S.J.; Loveland, T.R.; et al. High-Resolution Global Maps of 21st-Century Forest Cover Change. Science 2013, 342, 850–853. [Google Scholar] [CrossRef] [Green Version]
- Holden, C.E.; Woodcock, C.E. An analysis of Landsat 7 and Landsat 8 underflight data and the implications for time series investigations. Remote Sens. Environ. 2016, 185, 16–36. [Google Scholar] [CrossRef] [Green Version]
- Verbesselt, J.; Hyndman, R.; Newnham, G.; Culvenor, D. Detecting trend and seasonal changes in satellite image time series. Remote Sens. Environ. 2010, 114, 106–115. [Google Scholar] [CrossRef]
- Roy, D.P.; Borak, J.S.; Devadiga, S.; Wolfe, R.E.; Zheng, M.; Descloitres, J. The MODIS Land product quality assessment approach. Remote Sens. Environ. 2002, 83, 62–76. [Google Scholar] [CrossRef]
- Zhu, Z.; Woodcock, C.E.; Holden, C.; Yang, Z. Generating synthetic Landsat images based on all available Landsat data: Predicting Landsat surface reflectance at any given time. Remote Sens. Environ. 2015, 162, 67–83. [Google Scholar] [CrossRef]
- Schmidt, M.; Pringle, M.; Devadas, R.; Denham, R.; Tindall, D. A Framework for Large-Area Mapping of Past and Present Cropping Activity Using Seasonal Landsat Images and Time Series Metrics. Remote Sens. 2016, 8, 312. [Google Scholar] [CrossRef]
- Acharjee, T.K.; van Halsema, G.; Ludwig, F.; Hellegers, P. Declining trends of water requirements of dry season Boro rice in the north-west Bangladesh. Agric. Water Manag. 2017, 180, 148–159. [Google Scholar] [CrossRef]
- BBS. Statistical Pocketbook, Bangladesh; Bangladesh Bureau of Statistics, Ministry of Planning: Dhaka, Bangladesh, 2014.
- Jin, Z.; Azzari, G.; You, C.; Di Tommaso, S.; Aston, S.; Burke, M.; Lobell, D.B. Smallholder maize area and yield mapping at national scales with Google Earth Engine. Remote Sens. Environ. 2019, 228, 115–128. [Google Scholar] [CrossRef]
- Islam, M.T.; Croll, D.; Gladieux, P.; Soanes, D.M.; Persoons, A.; Bhattacharjee, P.; Hossain, M.S.; Gupta, D.R.; Rahman, M.M.; Mahboob, M.G.; et al. Emergence of wheat blast in Bangladesh was caused by a South American lineage of Magnaporthe oryzae. BMC Biol. 2016, 14, 84. [Google Scholar] [CrossRef]
- Islam, M.T.; Kim, K.-H.; Choi, J. Wheat Blast in Bangladesh: The Current Situation and Future Impacts. Plant Pathol. J. 2019, 35, 1–10. [Google Scholar]
- Zhu, Z.; Wulder, M.A.; Roy, D.P.; Woodcock, C.E.; Hansen, M.C.; Radeloff, V.C.; Healey, S.P.; Schaaf, C.; Hostert, P.; Strobl, P.; et al. Benefits of the free and open Landsat data policy. Remote Sens. Environ. 2019, 224, 382–385. [Google Scholar] [CrossRef]
- Hilker, T.; Wulder, M.A.; Coops, N.C.; Seitz, N.; White, J.C.; Gao, F.; Masek, J.G.; Stenhouse, G. Generation of dense time series synthetic Landsat data through data blending with MODIS using a spatial and temporal adaptive reflectance fusion model. Remote Sens. Environ. 2009, 113, 1988–1999. [Google Scholar] [CrossRef]
Figure 1.
Study area map: Population density in Asia and Bangladesh. (a) Population in persons/km2 in Asian countries. (b) Population in persons/km2 in Bangladesh. Bangladesh is among the most densely populated countries in the world and as population density increases, so does the demand for food staples like rice. Boro season rice production helps meet the growing demand for food, and typically improves the efficiency of rice production with higher yields per unit of area. As arable land decreases due to urbanization and other factors, understanding where rice is grown will be increasingly important.

Figure 2.
Images of rice production near Khulna, Bangladesh. (A) Rice seedling preparation for boro season (January 2016) near Khulna, Bangladesh, and (B) high-yielding variety rice during the boro season (March 2015) near Khulna, Bangladesh. Photo credit: Aaron Shew.
Figure 2.
Images of rice production near Khulna, Bangladesh. (A) Rice seedling preparation for boro season (January 2016) near Khulna, Bangladesh, and (B) high-yielding variety rice during the boro season (March 2015) near Khulna, Bangladesh. Photo credit: Aaron Shew.

Figure 3.
Crop phenology for the boro season with a high-resolution image using harmonic-time-series-based vegetation indices (HTS-VIs). (A) High-resolution satellite image from Google Earth in Nashipur (88.67918 N, 25.74691 E), Dinajpur, Bangladesh (near the Wheat Research Centre, BARI). (B) Rice phenoplot for the yellow outlined fields in image A. (C) Wheat phenoplot for the orange outlined fields in image A. (D) Other crop phenoplot for the purple outlined fields in image A. The phenoplots demonstrate the HTS-VIs model output for rice, wheat, and other crops summarized by the pixel values within each highlighted field (high-resolution image and time series vegetation indices (VI) are from the 2018 boro season). Rice has a distinct flood signature where normalized difference flood index (NDFI) is greater than enhanced vegetation index (EVI) prior to EVI trending to a maximum above 0.6. Wheat and other crops do not have a flood signature prior to the peak in EVI, and both wheat and other crops do show the EVI pattern typical of a crop with steep slopes leading into the flowering vegetation phase and decreasing through harvest.

Figure 4.
HTS-VIs rice map of Bangladesh based on the Landsat Archive, 2013–2018 crop years.

Figure 5.
The HTS-VIs model by division in Bangladesh for 2018 (with MODIS comparison). SR: Surface Reflectance; TOA: Top-of-atmosphere.
Figure 5.
The HTS-VIs model by division in Bangladesh for 2018 (with MODIS comparison). SR: Surface Reflectance; TOA: Top-of-atmosphere.

Figure 6.
Regional differences in rice-planting frequency. (a–h). Boro rice frequency plots at the center coordinates alongside the upazila name listed above each 10 km2 map. In the legend, no rice includes all other land use land cover including crops where rice was never grown during 2013 and 2018; 1 year to 5 years represent pixels classified as boro rice for the period of time between 2013 and 2018.

Figure 7.
Temporal consistency in boro rice cropping patterns.

Figure 8.
Comparison of district rice area (10,000 hectares) estimates for Bangladesh Bureau of Statistics (BBS) and HTS-VIs.
Figure 8.
Comparison of district rice area (10,000 hectares) estimates for Bangladesh Bureau of Statistics (BBS) and HTS-VIs.

Figure 9.
District-wise map of the HTS-VIs (left) predicted rice area compared to BBS (right) estimates for 2017 and 2018 (area presented in 10,000 hectares).
Figure 9.
District-wise map of the HTS-VIs (left) predicted rice area compared to BBS (right) estimates for 2017 and 2018 (area presented in 10,000 hectares).

© 2019 by the authors. Licensee MDPI, Basel, Switzerland. This article is an open access article distributed under the terms and conditions of the Creative Commons Attribution (CC BY) license (http://creativecommons.org/licenses/by/4.0/).
Share and Cite
MDPI and ACS Style
Shew, A.M.; Ghosh, A. Identifying Dry-Season Rice-Planting Patterns in Bangladesh Using the Landsat Archive. Remote Sens. 2019, 11, 1235. https://0-doi-org.brum.beds.ac.uk/10.3390/rs11101235
AMA Style
Shew AM, Ghosh A. Identifying Dry-Season Rice-Planting Patterns in Bangladesh Using the Landsat Archive. Remote Sensing. 2019; 11(10):1235. https://0-doi-org.brum.beds.ac.uk/10.3390/rs11101235
Chicago/Turabian StyleShew, Aaron M., and Aniruddha Ghosh. 2019. "Identifying Dry-Season Rice-Planting Patterns in Bangladesh Using the Landsat Archive" Remote Sensing 11, no. 10: 1235. https://0-doi-org.brum.beds.ac.uk/10.3390/rs11101235
Note that from the first issue of 2016, this journal uses article numbers instead of page numbers. See further details here.