1. Introduction
The recognition of spectral signatures related to the genetic characteristics of crop cultivars contributes to remote monitoring of large agricultural areas required for different crop management tasks. Certification activities applied in the food authentication process [
1], crop disease protection plans when different cultivar susceptibility should be taken into account [
2], and yield and production forecasts [
3] are among the management tasks that could be positively supported by remote-sensing instruments and approaches.
The effectiveness of visible and near-infrared reflectance spectroscopy to non-destructively discriminate crop varieties was achieved in several species, such as wheat [
4,
5,
6], Chinese bayberry [
7], peach varieties [
8], and Thai tangerine varieties [
9].
Schmidt et al. [
10], using a four-channel digital multispectral video camera (450, 550, 650, and 750 nm), reported that it was possible to discriminate between sugarcane varieties, although a significant degree of within-variety variability was noted. Thenkbail [
11] found that the best discrimination between several agricultural crops was found using four different narrow bands located at 547, 675, 718, and 904 nm.
Anyway, individual bands often result as being less sensitive to vegetation parameters, whereas their combination, known as vegetation indices (VIs), can functionally relate crop characteristics and spectral reflectance [
12]. Silva Junior et al. [
13] were able to discriminate different soybean cultivars through multivariate analysis of different VIs. Caturegli et al. [
14], in a study focused on 20 turfgrass species/cultivars, measured crop reflectance in the visible and near-infrared spectra, calculating 15 different VIs that could discriminate between different cultivars within species.
Nevertheless, the efficacy of remote crop/plant spectral characterization is strictly related to canopy segmentation approaches which require high-resolution images. In recent years, unmanned aerial vehicle (UAV)-based sensors contributed to the efficacy of remote-monitoring activities mainly due to their high spatial and temporal resolution, which is unparalleled compared with remote-sensing technologies based on satellites [
15].
Several authors combined advanced object-based image analysis (OBIA) and multispectral observations, assessing plant parameters such as height, diameter, and volume [
16,
17,
18,
19,
20,
21], and this approach yielded a precise definition of the target (tree crown) to be characterized in terms of spectral signature.
To date, no study on cultivar recognition was performed on olive trees from UAV high-resolution imagery. The few attempts to apply remotely sensed VIs to an olive grove focused on correlating the capacity of VIs in estimating transpiration to develop and calibrate a site-specific predictive model [
22]. Nevertheless, there is no evidence on the variation of spectral characteristics due to different varieties.
With this in mind, in this study, we combined a segmentation approach (digital surface model), improving the target (tree crown) recognition, and VIs obtained from multispectral reflectance data to effectively discriminate field-grown olive cultivars in an experimental plantation with different scion/rootstock combinations.
2. Materials and Methods
2.1. Study Site and Plant Materials
The study was conducted on an olive grove of the Santa Paolina experimental farm located in Follonica, central Italy (42°56′39″ north (N); 10°46′16″ east (E); 38 m above sea level (masl)).
The olive grove was planted in 1992 with a 7 × 5 m spacing. Scions of two Italian olive cultivars, Frantoio and Leccino, were grafted on self-rooted plants belonging to Carolea, Coratina, Cipressino, Frantoio, and Leccino cultivars.
The olives were planted using a completely randomized design with at least three replicates, and they were trained as bush-vase with biennial pruning using local, traditional rainfed olive grove management. Since planting, the whole grove underwent the same agronomic treatment until data acquisition, with no differences among scions, rootstocks, and their combination.
2.2. UAV-Based Data Acquisition and Processing
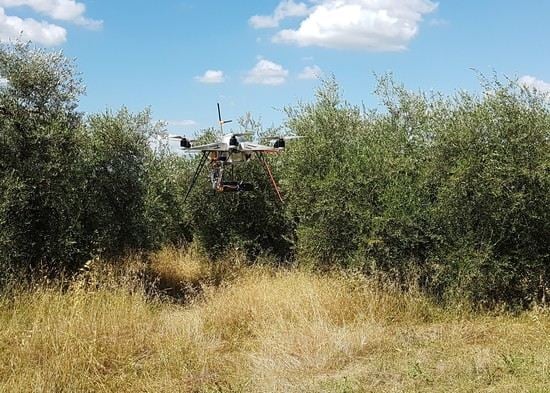
The remote images were acquired with a multispectral camera Tetracam ADC Snap (Tetracam, Inc., Gainesville, FL, USA) mounted on a modified multi-rotor Mikrokopter (HiSystems GmbH, Moomerland, Germany). The UAV platform described in Reference [
23] performed a single flight at midday on 3 October 2018 at 25 m above ground level, yielding a ground resolution of 0.02 m/pixel. The flight plan was designed to obtain over 80% forward and lateral overlap, which was enough to achieve the highest accuracy in the mosaicking elaboration step. The images were recorded in clear sky conditions. Tetracam ADC Snap acquires the radiance of three spectral bands with the following wavelength ranges: green (520–600 nm), red (630–690 nm), and near-infrared (760–900 nm). For the conversion into reflectance, a vicarious calibration based on the absolute radiance method was chosen [
24], and the radiometric calibration process was realized acquiring, during the flight, images from three OptoPolymer (OptoPolymer, Werner Sanftenberg, Munich, Germany) reference panels, with 95%, 50%, and 5% reflectance.
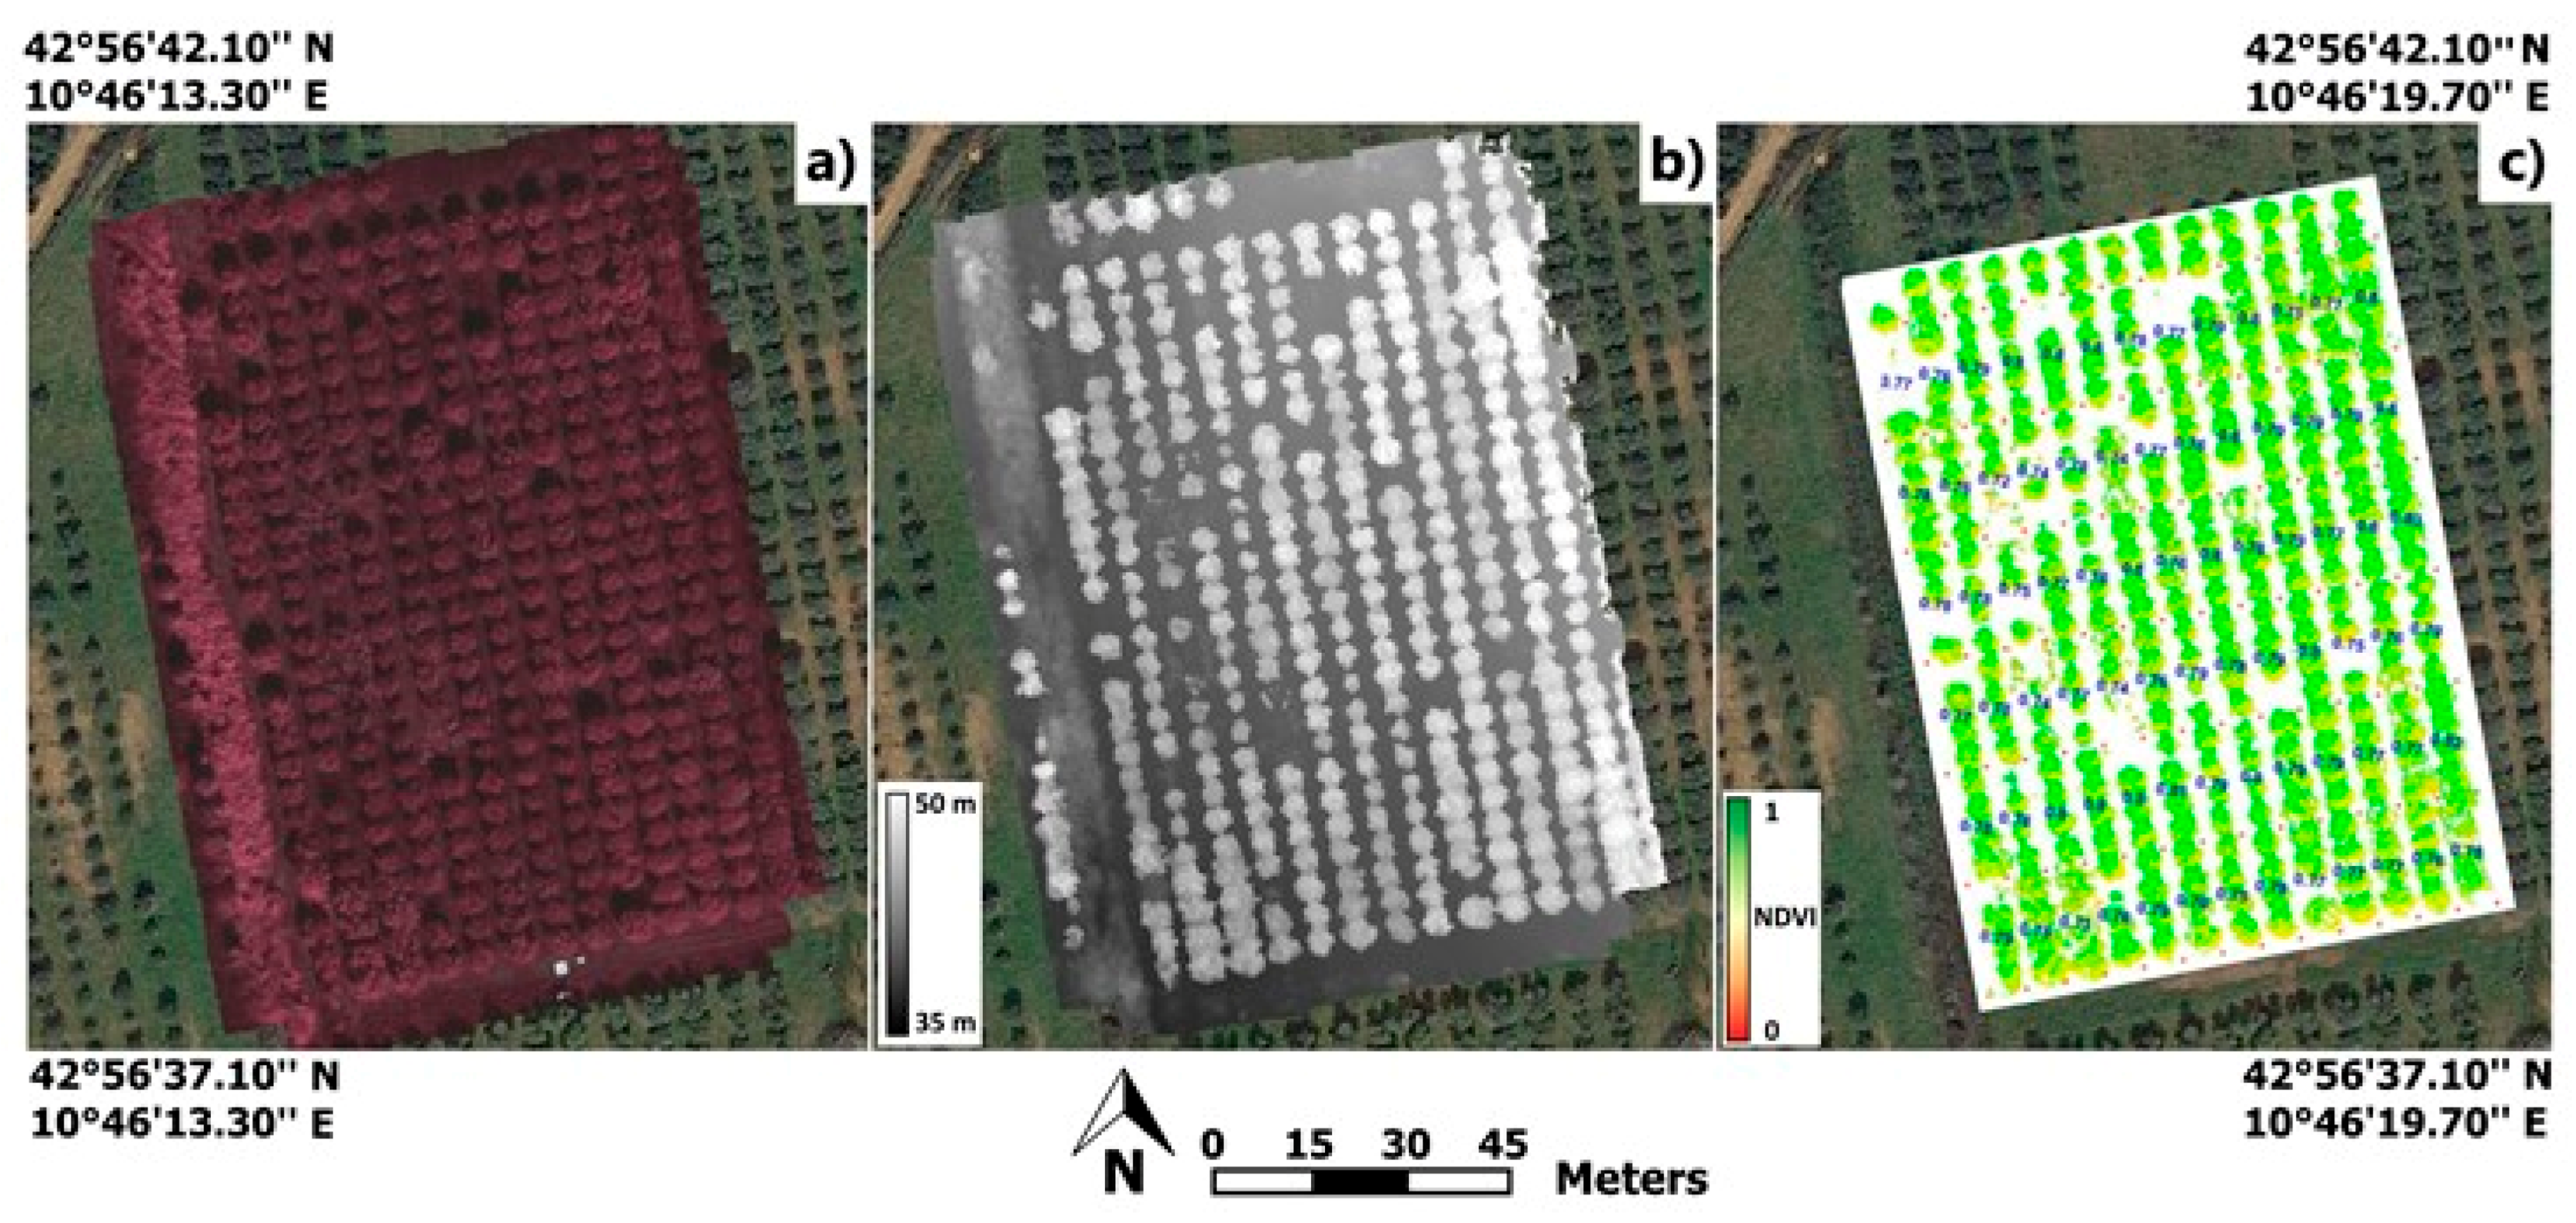
Multispectral images acquired by UAV were mosaicked using Agisoft Photoscan Professional Edition 1.1.6 (Agisoft LLC, St. Petersburg, Russia). This commercial software allows geotagged image alignment, dense cloud generation, and the creation of a high-resolution orthomosaic and a digital surface model (DSM) of the site. A filtering procedure of each olive crown pixel was then assessed using the canopy height model (CHM) derived from the DSM (
Figure 1). This approach allows an accurate vegetation pixel extraction, on the basis that olive plants have a greater height than the ground and can easily be discriminated by Otsu global thresholding, an algorithm that allows discrimination of two different zones (in this case, olive crown and ground) [
25].
Average values of different VIs were calculated from multispectral data extracted for each plant.
2.3. Vegetation Indices
This study aimed at correlating a series of derivative reflectance indices from green (520–600 nm), red (630–690 nm), and near-infrared (760–900 nm) bands, in order to discriminate different olive scion/rootstock combinations. We calculated 14 VIs (
Table 1) closely related to leaf area index, cover geometry, and greenness. The wavelength used to derive the indices, the formulae, and their references [
26,
27,
28,
29,
30,
31,
32,
33,
34,
35,
36,
37,
38,
39] are reported in
Table 1.
2.4. Statistical Analysis
Data were processed different statistical approaches. A two-way completely randomized ANOVA was conducted, assuming scion (Frantoio and Leccino) and rootstock (Carolea, Cipressino, Coratina, Frantoio, and Leccino) as the first and second factors, respectively, and each thesis (scion/rootstock) had at least three replications. ANOVAs were conducted using CoStat ver 6.400 (CoHort Software, Monterey, CA, USA) with unequal sample sizes, using unweighted means and Type III SS.
The multivariate statistical technique of principal component analysis (PCA) was then applied to the whole set of studied VIs, to extract information from spectral data and transform the data into a set of uncorrelated orthogonal variables called principal components (PCs). The PCs with eigenvalues greater than 1 and loading coefficients greater than 0.6 were selected for the component interpretation. The analysis was conducted using the MS Excel™ statistical package StatistiXL2 (StatistiXL Ltd., Broadway, Western Australia).
Linear discriminant analysis (LDA) was applied using Systat 11 (Systat Software Inc., San Jose, CA, USA) to complement the findings of PCA to assess the adequacy of the data collected in classifying the plants into groups determined by the scion or rootstock. The objective of LDA is to develop a discriminant function to examine whether significant differences exist among the groups, in terms of the predictor variables. The accuracy of the classification was applied by means of a training/validation routine conducted on subsets of 21 and 22 data points, respectively.
3. Results
F-values of ANOVA for each VI in response to the studied factors are shown in
Table 2. For seven (normalized difference VI (NDVI), simple ratio (SR), green NDVI (GNDVI), green red NDVI (GRNDVI), simple ratio near-infrared (NIR)/green ratio VI (GRVI), normalized difference green/red index (NGRDI), and ratio VI (RVI)) of the 14 vegetation indices, highly significant effects were achieved in response to studied scions, whereas minor and no effects were attained for rootstock and interaction, respectively.
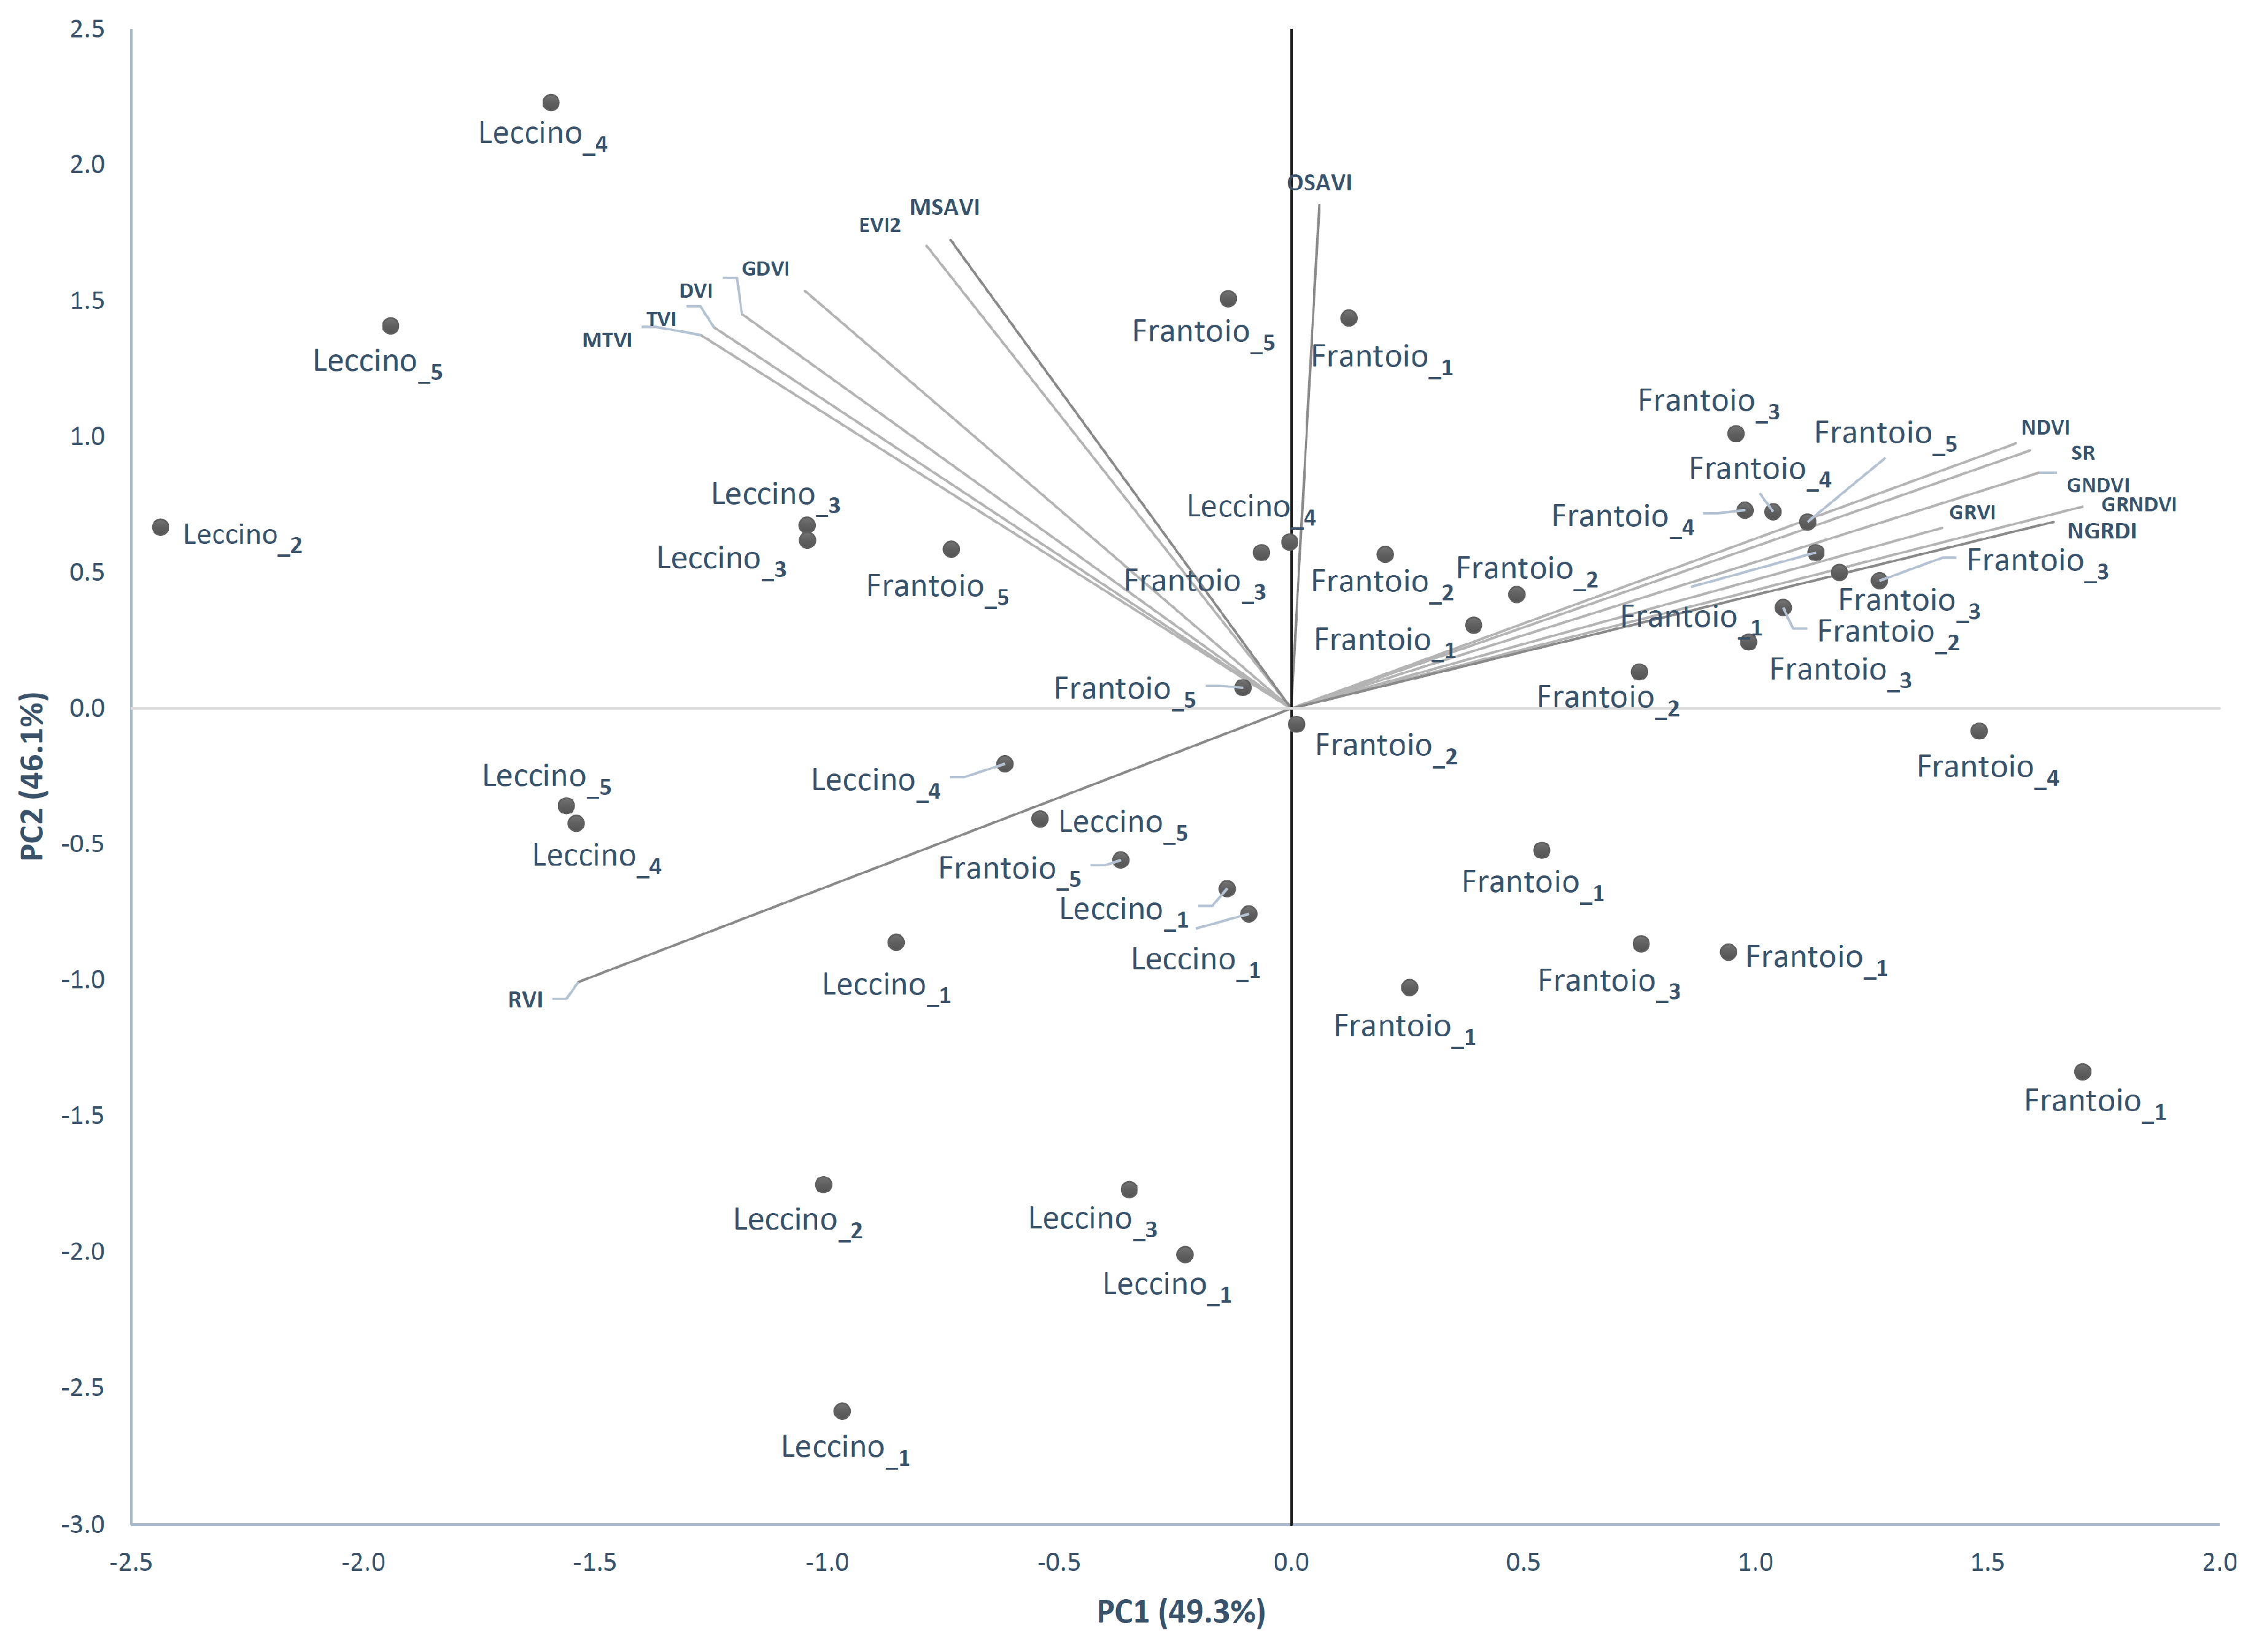
The PCA showed that 98.6% of the variation was explained by the first two components, and that each scion had its own reflectance behavior with few overlaps (
Figure 2). The VIs that had a strong and positive contribution to the first component (PC1—49.3% of variance) were NDVI, GNDVI, GRNDVI, SR, GRVI, and NGRDI, whereas RVI was negatively correlated. The variables that contributed more to the second component (PC2—46.1% of variance) were enhanced VI 2 (EVI2), generalized difference VI (GDVI), difference VI (DVI), transformed VI (TVI), modified triangular VI (MTVI), optimized soil-adjusted VI (OSAVI), and modified soil-adjusted VI (MSAVI).
These results allowed the traits to be differentiated across the first dimension of PCA, assumed to be informative for comparative assessment of scions. In fact, with very few exceptions, Leccino scions lay on the left of the first PCA axis, whereas Frantoio scions were positioned toward the right of the first axis. Otherwise, the distribution observed for rootstocks appeared unclear.
The results of LDA analysis confirmed the efficacy of VI application to discriminate between scions with an accuracy of 90.9%, whereas the recognition of rootstocks failed in more than 68.2% of cases (
Table 3). Moreover, the iterative process conducted within the discriminant analysis showed that, using only two variables (NDVI and DVI), it was possible to predict the membership of the plant to its scion group with an average accuracy of 95% (data not shown). The canonical discriminant function calculated for scion recognition attained a discriminant score of −52.932 + 75.438 × NDVI − 22.337 × DVI, being the mean of canonical scores 1.279 for Frantoio and −1.956 for Leccino. Furthermore, with the restricted VI dataset, a correct classification of plants into the group based on rootstock was not achieved.
4. Discussion
The efficacy of spectral indices in scion recognition emerged clearly from all the applied statistical approaches. In particular, the highly significant effects on scion discriminating ability emerging in ANOVA for seven of the VIs (NDVI, SR, GNDVI, GRNDVI, GRVI, NGRDI, and RVI), was confirmed by both applied multivariate analyses (PCA and LDA). All the above mentioned VIs were derived from the whole set of visible and NIR wavelengths applied, except for NGRDI, where only green and red wavelengths contributed to the calculation. The formulae used for the remaining indices (OSAVI, MSAVI, EVI2, TVI, GDVI, MTIV, and DVI) relied on constants and coefficients proposed and tested to counteract disturbance effects (such as soil), which were efficiently overcome applying the Otsu thresholding algorithm.
Within the few experiments conducted on variety discrimination, Silva et al. [
13] reported the effectiveness of the GNDVI index in terms of cultivar discrimination for soybean, with a smaller contribution emerging for some of the indices that resulted as not very informative in our experiment (OSAVI, EVI2, TVI, and SAVI). Kyratzis et al. [
6] observed statistically significant differences between a set of 20 durum wheat variety genotypes for VIs (NDVI, SR, and GNDVI). In an attempt to discriminate between commercial sugarcane cultivars, Johnson et al. [
40] observed clear differences in reflectance values within seven cultivars, with varieties being significantly different from each other in 76% of cases. The level of discrimination could be increased to 81% using SR and NDVI vegetation indices.
On the contrary, Basso et al. [
41] ascertained that NDVI was not able to discriminate between two potato cultivars, because of the influence of soil reflectance and leaf distribution, whereas MCARI/OSAVI, TCARI, and EVI better responded in discriminating the cultivars. In fact, basic vegetation indices such as NDVI are very sensitive to the soil background factor, and, when background brightness is increased, NDVI also increases systematically. Taking unsegmented vegetation into account, the adjusted soil vegetation indices provide the best performance in describing the spectral behavior of vegetation with soil background. The difference that emerged with our results is related to the reduction of soil disturbance effects obtained by means of the segmentation process.
Even though grafting on rootstock is a widely applied and, in many cases, essential agronomic practice, producing relevant effects on crop productivity or pest tolerance/resistance mechanisms, limited effects on spectral response of the canopy emerged in our experiment. In particular, even though the two-way ANOVA results reported significant effects for all the VIs but GRVI, with the multivariate statistical approach, weak relationships emerged in response to rootstock.
5. Conclusions
The results obtained in this study demonstrate the possibility to discriminate between two olive scions applying a multivariate approach to the elaboration of VI data. Relevant differences in index sensitivity emerged; however, the multivariate statistical approach contributed to compensating for the limits of each index, while stating the effectiveness of a limited set of indices (NDVI and DVI) to reach the same discriminant accuracy reported for the whole set of calculated VIs. Further efforts should be addressed to test our results on a wider range of cultivars, as well as in different environmental and agronomic conditions.
Author Contributions
All authors conceived and designed the study. C.C., S.F.D.G., and A.M. designed the experiment. E.R., G.A., C.C., S.F.D.G., and A.M. formulated the research methodology and wrote the manuscript. F.M. and G.T. provided necessary data curation. All authors reviewed and edited the draft.
Acknowledgments
This research was partially supported by the ESF operational program (OP) for Sicily 2014-2020 (Avviso 11/ 2017 “Rafforzare l’occupabilità nel Sistema della R&S e la nascita di Spin Off di Ricerca in Sicilia” 2014.IT.05.SFOP.014/3/10.4/9.2.10/0007).
Conflicts of Interest
The authors declare no conflicts of interest.
References
- Rabiei, Z.; Enferadi, S.T. Traceability of origin and authenticity of olive oil. Olive Oil—Constituents, Quality, Health Properties and Bioconversions. Available online: https://www.intechopen.com/download/pdf/27032 (accessed on 24 May 2019).
- Kuska, M.T.; Mahlein, A.K. Aiming at decision making in plant disease protection and phenotyping by the use of optical sensors. Eur. J. Plant Pathol. 2018, 152, 987–992. [Google Scholar] [CrossRef]
- da Silva Junior, C.A; Nanni, M.R.; Teodoro, P.E.; Silva, G.F.C. Vegetation indices for discrimination of soybean areas: A new approach. Agron. J. 2017, 109, 1331–1343. [Google Scholar] [CrossRef]
- Gutierrez, M.; Reynolds, M.P.; Klatt, A.R. Association of water spectral indices with plant and soil water relations in contrasting wheat genotypes. J. Exp. Bot. 2010, 61, 3291–3303. [Google Scholar] [CrossRef] [Green Version]
- Gizaw, S.A.; Garland-Campbell, K.; Carter, A.H. Evaluation of agronomic traits and spectral reflectance in Pacific Northwest winter wheat under rain-fed and irrigated conditions. Field Crop Res. 2016, 196, 168–179. [Google Scholar] [CrossRef] [Green Version]
- Kyratzis, A.C.; Skarlatos, D.P.; Menexes, G.C.; Vamvakousis, V.F.; Katsiotis, A. Assessment of vegetation indices derived by UAV imagery for durum wheat phenotyping under a water limited and heat stressed Mediterranean environment. Front Plant Sci. 2017, 8. [Google Scholar] [CrossRef] [PubMed]
- Li, X.; He, Y.; Fang, H. Non-destructive discrimination of Chinese bayberry varieties using Vis/NIR spectroscopy. J. Food Eng. 2007, 81, 357–363. [Google Scholar] [CrossRef]
- Guo, W.; Gu, J.; Liu, D.; Shang, L. Peach variety identification using near-infrared diffuse reflectance spectroscopy. Comput. Electron. Agric. 2016, 123, 297–303. [Google Scholar] [CrossRef]
- Suphamitmongkol, W.; Nie, G.; Liu, R.; Kasemsumran, S.; Shi, Y. An alternative approach for the classification of orange varieties based on near infrared spectroscopy. Comput. Electron. Agric. 2016, 91, 87–93. [Google Scholar] [CrossRef]
- Schmidt, E.J.; Narciso, G.; Frost, P.; Gers, C. Application of remote sensing technology in the SA Sugar Industry—A review of recent research findings. Proc. S. Afr. Sugar Technol. Assoc. 2000, 74, 192–201. [Google Scholar]
- Thenkabail, P.S. Optimal hyperspectral narrow bands for discriminating agricultural crops. Remote Sens. Environ. 2002, 20, 257–291. [Google Scholar]
- Wiegand, C.L.; Gerbermann, A.H.; Gallo, K.P.; Blad, B.L.; Dusek, D. Multisite analyses of spectral-biophysical data for corn. Remote Sens. Environ. 1990, 33, 1–16. [Google Scholar] [CrossRef]
- da Silva Junior, C.A.; Nanni, M.R.; Shakir, M.; Teodoro, P.E.; de Oliveira-Júnior, J.F.; Cezar, E.; de Gois, G.; Lima, M.; Wojciechowski, J.C.; Shiratsuchi, L.S. Soybean varieties discrimination using non-imaging hyperspectral sensor. Infrared Phys. Technol. 2018, 89, 338–350. [Google Scholar] [CrossRef]
- Caturegli, L.; Lulli, F.; Foschi, L.; Guglielminetti, L.; Bonari, E.; Volterrani, M. Monitoring turfgrass species and cultivars by spectral reflectance. Eur. J. Hortic. Sci. 2014, 79, 97–107. [Google Scholar]
- Matese, A.; Toscano, P.; Di Gennaro, S.F.; Genesio, L.; Vaccari, F.P.; Primicerio, J.; Belli, C.; Zaldei, A.; Bianconi, R.; Gioli, B. Intercomparison of UAV, aircraft and satellite remote sensing platforms for precision viticulture. Remote Sens. 2015, 7, 2971–2990. [Google Scholar] [CrossRef]
- Díaz-Varela, R.A.; de la Rosa, R.; León, L.; Zarco-Tejada, P.J. High-resolution airborne UAV imagery to assess olive tree crown parameters using 3D photo reconstruction: Application in breeding trials. Remote Sens. 2015, 7, 4213–4232. [Google Scholar] [CrossRef]
- Torres-Sánchez, J.; López-Granados, F.; Serrano, N.; Arquero, O.; Peña, J.M. High-throughput 3-D monitoring of agricultural-tree plantations with unmanned aerial vehicle (UAV) technology. PLoS ONE 2015, 10, e0130479. [Google Scholar] [CrossRef] [PubMed]
- Zarco-Tejada, P.J.; Diaz-Varela, R.; Angileri, V.; Loudjani, P. Tree height quantification using very high resolution imagery acquired from an unmanned aerial vehicle (UAV) and automatic 3D photo-reconstruction methods. Eur. J. Agron. 2014, 55, 89–99. [Google Scholar] [CrossRef]
- Jiménez-Brenes, F.M.; López-Granados, F.; de Castro, A.I.; Torres-Sánchez, J.; Serrano, N.; Peña, J.M. Quantifying pruning impacts on olive tree architecture and annual canopy growth by using UAV-based 3D modelling. Plant Methods 2017, 13. [Google Scholar] [CrossRef] [PubMed]
- Torres-Sánchez, J.; López-Granados, F.; Borra-Serrano, I.; Peña, J.M. Assessing UAV-collected image overlap influence on computation time and digital surface model accuracy in olive orchards. Precis. Agric. 2018, 19, 115–133. [Google Scholar] [CrossRef]
- Baena, S.; Moat, J.; Whaley, O.; Boyd, D.S. Identifying species from the air: UAVs and the very high resolution challenge for plant conservation. PLoS ONE 2017, 12, e0188714. [Google Scholar] [CrossRef] [PubMed]
- Santos, F.L.; Ramos, A.F. Transpiration and crop coefficients for irrigated olives with predictive equations derived from MODIS remotely sensed vegetation indices and ground-based temperature data. In Proceedings of the 4th International Conference for Olive Tree and Olive Products, Chania, Crete, Greece, 31 October–4 November 2011. [Google Scholar]
- Matese, A.; Di Gennaro, S.F. Practical applications of a multisensor UAV Platform based on multispectral, thermal and RGB high resolution images in Precision Viticulture. Agriculture 2018, 8, 116. [Google Scholar] [CrossRef]
- Kelcey, J.; Lucieer, A. Sensor correction of a 6-band multispectral imaging sensor for UAV remote sensing. Remote Sens. 2012, 4, 1462–1493. [Google Scholar] [CrossRef]
- Matese, A.; Di Gennaro, S.F.; Berton, A. Assessment of a canopy height model (CHM) in a vineyard using UAV-based multispectral imaging. Int. J. Remote Sens. 2017, 38, 2150–2160. [Google Scholar] [CrossRef]
- Rouse, J.W.; Haas, R.H.; Schell, J.A.; Deering, D.W. Monitoring vegetation systems in the Great Plains with ERTS. In Proceedings of the Third ERTS-1 Symposium, Washington, DC, USA, 10–14 December 1974. [Google Scholar]
- Gitelson, A.A.; Kaufman, Y.; Merzlyak, M.N. Use of a green channel in remote sensing of global vegetation from EOS-MODIS. Remote Sens. Environ. 1996, 58, 289–298. [Google Scholar] [CrossRef]
- Wang, F.; Huang, J.; Tang, Y.L.; Wang, X. New vegetation index and its application in estimating leaf area index of rice. Rice Sci. 2007, 14, 195–203. [Google Scholar] [CrossRef]
- Sripada, R.P.; Heiniger, R.W.; White, J.G.; Weisz, R. Aerial color infrared photography for determining late-season nitrogen requirements in corn. Agron. J. 2006, 97, 1443–1451. [Google Scholar] [CrossRef]
- Jordan, C.F. Derivation of leaf area index from quality of light on the forest floor. Ecology 1969, 50, 663–666. [Google Scholar] [CrossRef]
- Richardson, A.J.; Wiegand, C.L. Distinguishing vegetation from soil background information. Photogramm. Eng. 1977, 43, 1541–1552. [Google Scholar]
- Tucker, C.J. Red and photographic infrared linear combinations for monitoring vegetation. Remote Sens. Environ. 1979, 8, 127–150. [Google Scholar] [CrossRef] [Green Version]
- Tucker, C.J. Remote sensing of leaf water content in the near infrared. Remote Sens. Environ. 1980, 10, 23–32. [Google Scholar] [CrossRef]
- Jiang, Z.; Huete, A.; Didan, K.; Miura, T. Development of a two-band enhanced vegetation index without a blue band. Remote Sens. Environ. 2008, 112, 3833–3845. [Google Scholar] [CrossRef]
- Wu, W. The Generalized Difference Vegetation Index (GDVI) for dryland characterization. Remote Sens. 2014, 6, 1211–1233. [Google Scholar] [CrossRef]
- Broge, N.; Leblanc, E. Comparing prediction power and stability of broadband and hyperspectral vegetation indices for estimation of green leaf area index and canopy chlorophyll density. Remote Sens. Environ. 2001, 76, 156–172. [Google Scholar] [CrossRef]
- Haboudane, D.; Miller, J.R.; Pattey, E.; Zarco-Tejada, P.J. Hyperspectral vegetation indices and novel algorithms for predicting green LAI of crop canopies: Modeling and validation in the context of precision agriculture. Remote Sens. Environ. 2004, 90, 337–352. [Google Scholar] [CrossRef]
- Qi, J.; Chehbouni, A.; Huete, A.; Kerr, Y.H.; Sorooshian, S. A modified soil adjusted vegetation index. Remote Sens. Environ. 1994, 48, 119–126. [Google Scholar] [CrossRef]
- Rondeaux, G.; Steven, M.; Frederic, B. Optimization of soil-adjusted vegetation indices. Remote Sens. Environ. 1996, 55, 95–107. [Google Scholar] [CrossRef]
- Johnson, R.M.; Viator, R.P.; Veremis, J.C.; Richard, P.E.; Zimba, P.V. Discrimination of sugarcane varieties with pigment profiles and high resolution, hyperspectral leaf reflectance data. J. Am. Soc. Sugar Cane Technol. 2008, 28, 63–75. [Google Scholar]
- Basso, B.; Cammarano, D.; Cafiero, G.; Marino, S.; Alvino, A. Cultivar discrimination at different site elevations with remotely sensed vegetation indices. Ital. J. Agron. 2011, 6, 1–5. [Google Scholar] [CrossRef]
© 2019 by the authors. Licensee MDPI, Basel, Switzerland. This article is an open access article distributed under the terms and conditions of the Creative Commons Attribution (CC BY) license (http://creativecommons.org/licenses/by/4.0/).

 ,
, 


