Article

Transition Characteristics of the Dry-Wet Regime and Vegetation Dynamic Responses over the Yarlung Zangbo River Basin, Southeast Qinghai-Tibet Plateau

1
College of Water Resources and Civil Engineering, China Agricultural University, Beijing 100083, China
2
Center for Agricultural Water Research in China, China Agricultural University, Beijing 100083, China
3
College of Water Sciences, Beijing Normal University, Beijing 100875, China
4
Beijing Key Laboratory of Urban Hydrological Cycle and Sponge City Technology, Beijing 100875, China
*
Author to whom correspondence should be addressed.
Remote Sens. 2019, 11(10), 1254; https://0-doi-org.brum.beds.ac.uk/10.3390/rs11101254
Submission received: 26 April 2019 / Revised: 21 May 2019 / Accepted: 24 May 2019 / Published: 27 May 2019
(This article belongs to the Special Issue Remote Sensing of the Terrestrial Hydrologic Cycle)

Abstract

:
The dry-wet transition is of great importance for vegetation dynamics, however the response mechanism of vegetation variations is still unclear due to the complicated effects of climate change. As a critical ecologically fragile area located in the southeast Qinghai-Tibet Plateau, the Yarlung Zangbo River (YZR) basin, which was selected as the typical area in this study, is significantly sensitive and vulnerable to climate change. The standardized precipitation evapotranspiration index (SPEI) and the normalized difference vegetation index (NDVI) based on the GLDAS-NOAH products and the GIMMS-NDVI remote sensing data from 1982 to 2015 were employed to investigate the spatio-temporal characteristics of the dry-wet regime and the vegetation dynamic responses. The results showed that: (1) The spatio-temporal patterns of the precipitation and temperature simulated by the GLDAS-NOAH fitted well with those of the in-situ data. (2) During the period of 1982–2015, the whole YZR basin exhibited an overall wetting tendency. However, the spatio-temporal characteristics of the dry-wet regime exhibited a reversal phenomenon before and after 2000, which was jointly identified by the SPEI and runoff. That is, the YZR basin showed a wetting trend before 2000 and a drying trend after 2000; the arid areas in the basin showed a tendency of wetting whereas the humid areas exhibited a trend of drying. (3) The region where NDVI was positively correlated with SPEI accounted for approximately 70% of the basin area, demonstrating a similar spatio-temporal reversal phenomenon of the vegetation around 2000, indicating that the dry-wet condition is of great importance for the evolution of vegetation. (4) The SPEI showed a much more significant positive correlation with the soil water content which accounted for more than 95% of the basin area, implying that the soil water content was an important indicator to identify the dry-wet transition in the YZR basin.

Graphical Abstract

1. Introduction

The current level of global climate change has been unprecedented in the past decades or even nearly a thousand years. Almost the entire world is experiencing a warming process, which is mainly characterized by rising temperatures, rising sea levels, retreating glaciers, and so on [1,2]. Global warming has exacerbated the global water cycle over the past century, causing a significant increase in the number of extreme weather events, such as storms, heat waves, floods, and droughts [3,4,5,6,7,8,9]. Droughts are one of the most threatening natural disasters in the world. They are caused by the below-average level of precipitation over a long period of time and are generally characterized by their high frequency, long duration, and wide range [10,11]. In the context of global warming, the frequency and intensity of droughts have increased significantly [12,13], which has seriously affected agricultural production, water resources, and ecosystems, and have led to economic losses, famines, epidemics, and desertification [14,15,16,17,18,19,20,21]. Because of the complexity of drought variability, it is challenging to objectively quantify the intensity, duration, and spatial extent of droughts [22,23,24]. Thus, numerous studies have attempted to improve drought detection and monitoring; a few objective indices have been developed on the basis of readily available climate data, such as the Palmer Drought Severity Index (PDSI) [25], Standard Precipitation Index (SPI) [26], and Standard Precipitation Evapotranspiration Index (SPEI) [27]. Among these indices, the PDSI, which is based on the supply and demand in the water balance, is one of the most widely used drought indices in the world. However, the PDSI has several deficiencies, including the strong influence of the calibration period, the limitation in spatial comparability, and the subjectivity in relating drought conditions to the index values [28]. The SPI can effectively represent the multiscale characteristics of droughts; however only the precipitation variability is considered in the SPI calculation, and the role of temperature is ignored. The effect of temperature is evident in initiating droughts, although droughts are primarily caused by a below-average level of precipitation [29]. Therefore, the SPEI was developed by Vicente-Serrano et al. [27], which not only considered the effects of temperature on drought severity but also considered the multiscale characteristics that were incorporated in the SPI. Since it was proposed in 2010, the SPEI has been widely used to monitor and assess the dry-wet conditions around the world [30,31,32,33].
Vegetation, linking the atmosphere, hydrosphere, and biosphere [34], is an important component in the terrestrial ecological system and has an obvious relationship with climate change through the physiological responses of plants, such as plant photosynthesis, respiration, and evapotranspiration. The dynamic changes of vegetation play a predictive role in regional climate change [35,36]. Climate change can also affect the spatial-temporal pattern of vegetation. Drought is one of the most frequent natural disasters and the response of vegetation to drought is a considerable scientific problem [37]. In general, an increased frequency of extreme drought was associated with decreased vegetation growth [19,38,39]. For example, Symeonakis et al. (2004) pointed out that drought was the main factor resulting in vegetation and soil degradation in sub-Saharan Africa [39]. Ahmadi et al. (2019) indicated that drought could affect the efficiency of water use in the ecosystem, subsequently disturbing the composition and functionality of terrestrial ecosystems [19]. In Northern China, drought-induced water stress caused a reduction in the terrestrial gross primary production [40]. Studies on the Qinghai-Tibet Plateau (QTP) and the Loess Plateau have revealed that there is a remarkable correlation between vegetation cover reduction and climate change [41,42]. Nevertheless, the magnitude of the response of vegetation to dry-wet conditions remains uncertain due to the complexity of the dry-wet transition and intrinsic drought sensitivity among vegetation types [21,43]. The intensity, duration, and timing of drought partly determine the effect of drought on vegetation productivity, where moderate drought with higher temperatures increases the net primary production (NPP), while severe drought causes a delayed response of NPP to precipitation [22,44]. As a satisfactory indicator of vegetation activities, the Normalized Difference Vegetation Index (NDVI), which was used in this study, has been widely and successfully used to detect the vegetation variations [36,37,38,39,40,41,42,43,44].
The Yarlung Zangbo River (YZR) basin located in the southeast QTP, is the most important river to understand the water cycle in the QTP because it is not only the largest river system in QTP with the largest mean annual flow (56% flows from the QTP), but also an important moisture transportation channel from the Indian Ocean to the inner region of QTP. Owing to great spatial heterogeneities of climatic conditions and enormous biological diversity, the YZR basin has always been the crucial area of global diversity and ecological protection [45]. A considerable amount of research on the impact of climate change on vegetation variations in the YZR basin has been conducted, revealing that vegetation and precipitation are positively correlated in the whole basin and that the vegetation cover change is restrained by the dry-wet regime, terrain, and other factors simultaneously [46,47,48]. Song et al. (2011) and Li et al. (2015) have demonstrated that the warming rate of the YZR basin was significantly higher than that of the global average, and the duration and magnitude of the drought have gradually aggravated [49,50]. The water resources problem would become more severe under the impact of precipitation and temperature due to the significant warming of the YZR basin in the future [51]. The rising temperature drives a basin-wide vegetation cover improvement, however it seems that decreasing precipitation does not inverse the overall vegetation greening trend [51]. Similar results occurred in Nepal, bounded by the Tibetan highland and the Himalaya, indicating that the correlation between NDVI and temperature was significantly positive, while NDVI exhibited a negative relationship with precipitation [52]. To sum up, the dry-wet transition is of great importance for the vegetation dynamics, whereas the response mechanism of vegetation to dynamic variations is still unclear. In addition, the special terrain, vulnerable ecological environment, and sensitivity to climate change make the YZR basin one of the hotspot regions for the studies of water-ecology-environment sustainable development under global warming. Therefore, it is crucial to investigate the transition characteristics of the dry-wet regime in the YZR basin and quantify its effect on the vegetation dynamic variations, which could provide a scientific reference for the sustainable development of the environment and ecosystem in the Qinghai-Tibet Plateau. The primary objectives of this study are: (1) to detect the changes of the dry-wet regime in the YZR basin; (2) to quantify the spatial-temporal variations of vegetation from long-term satellite-based NDVI data; and (3) to investigate the dynamic responses of vegetation to possible drivers of the dry-wet transition in the YZR basin.

2. Materials and Methods
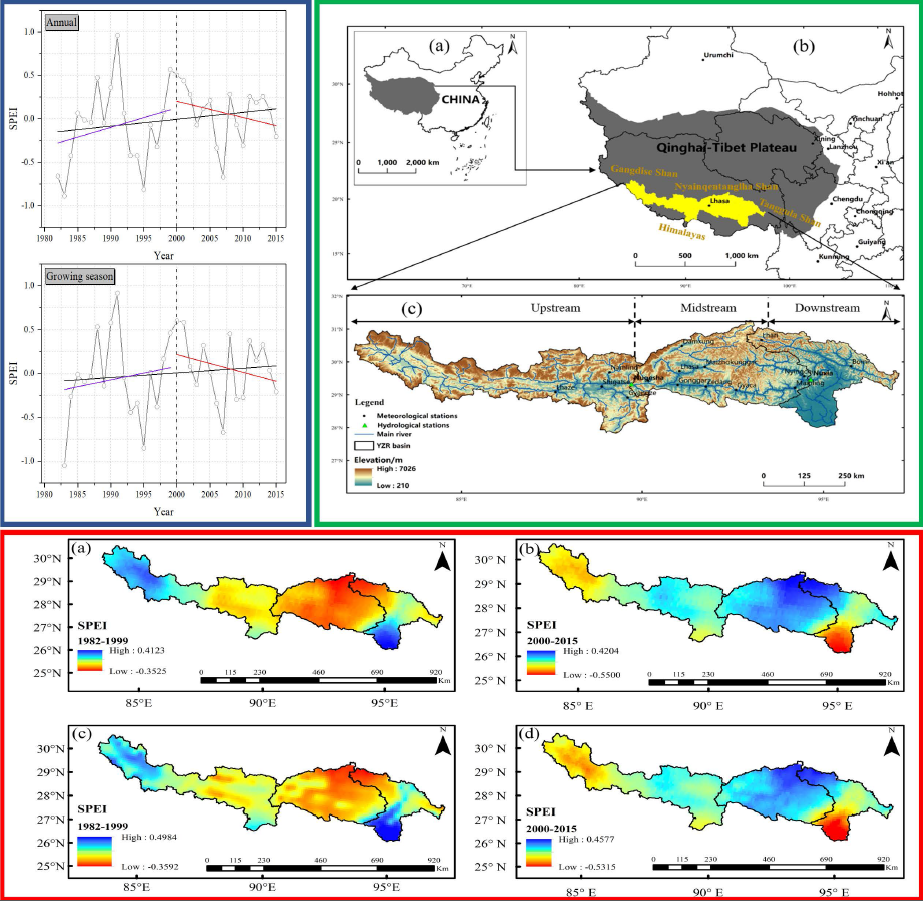
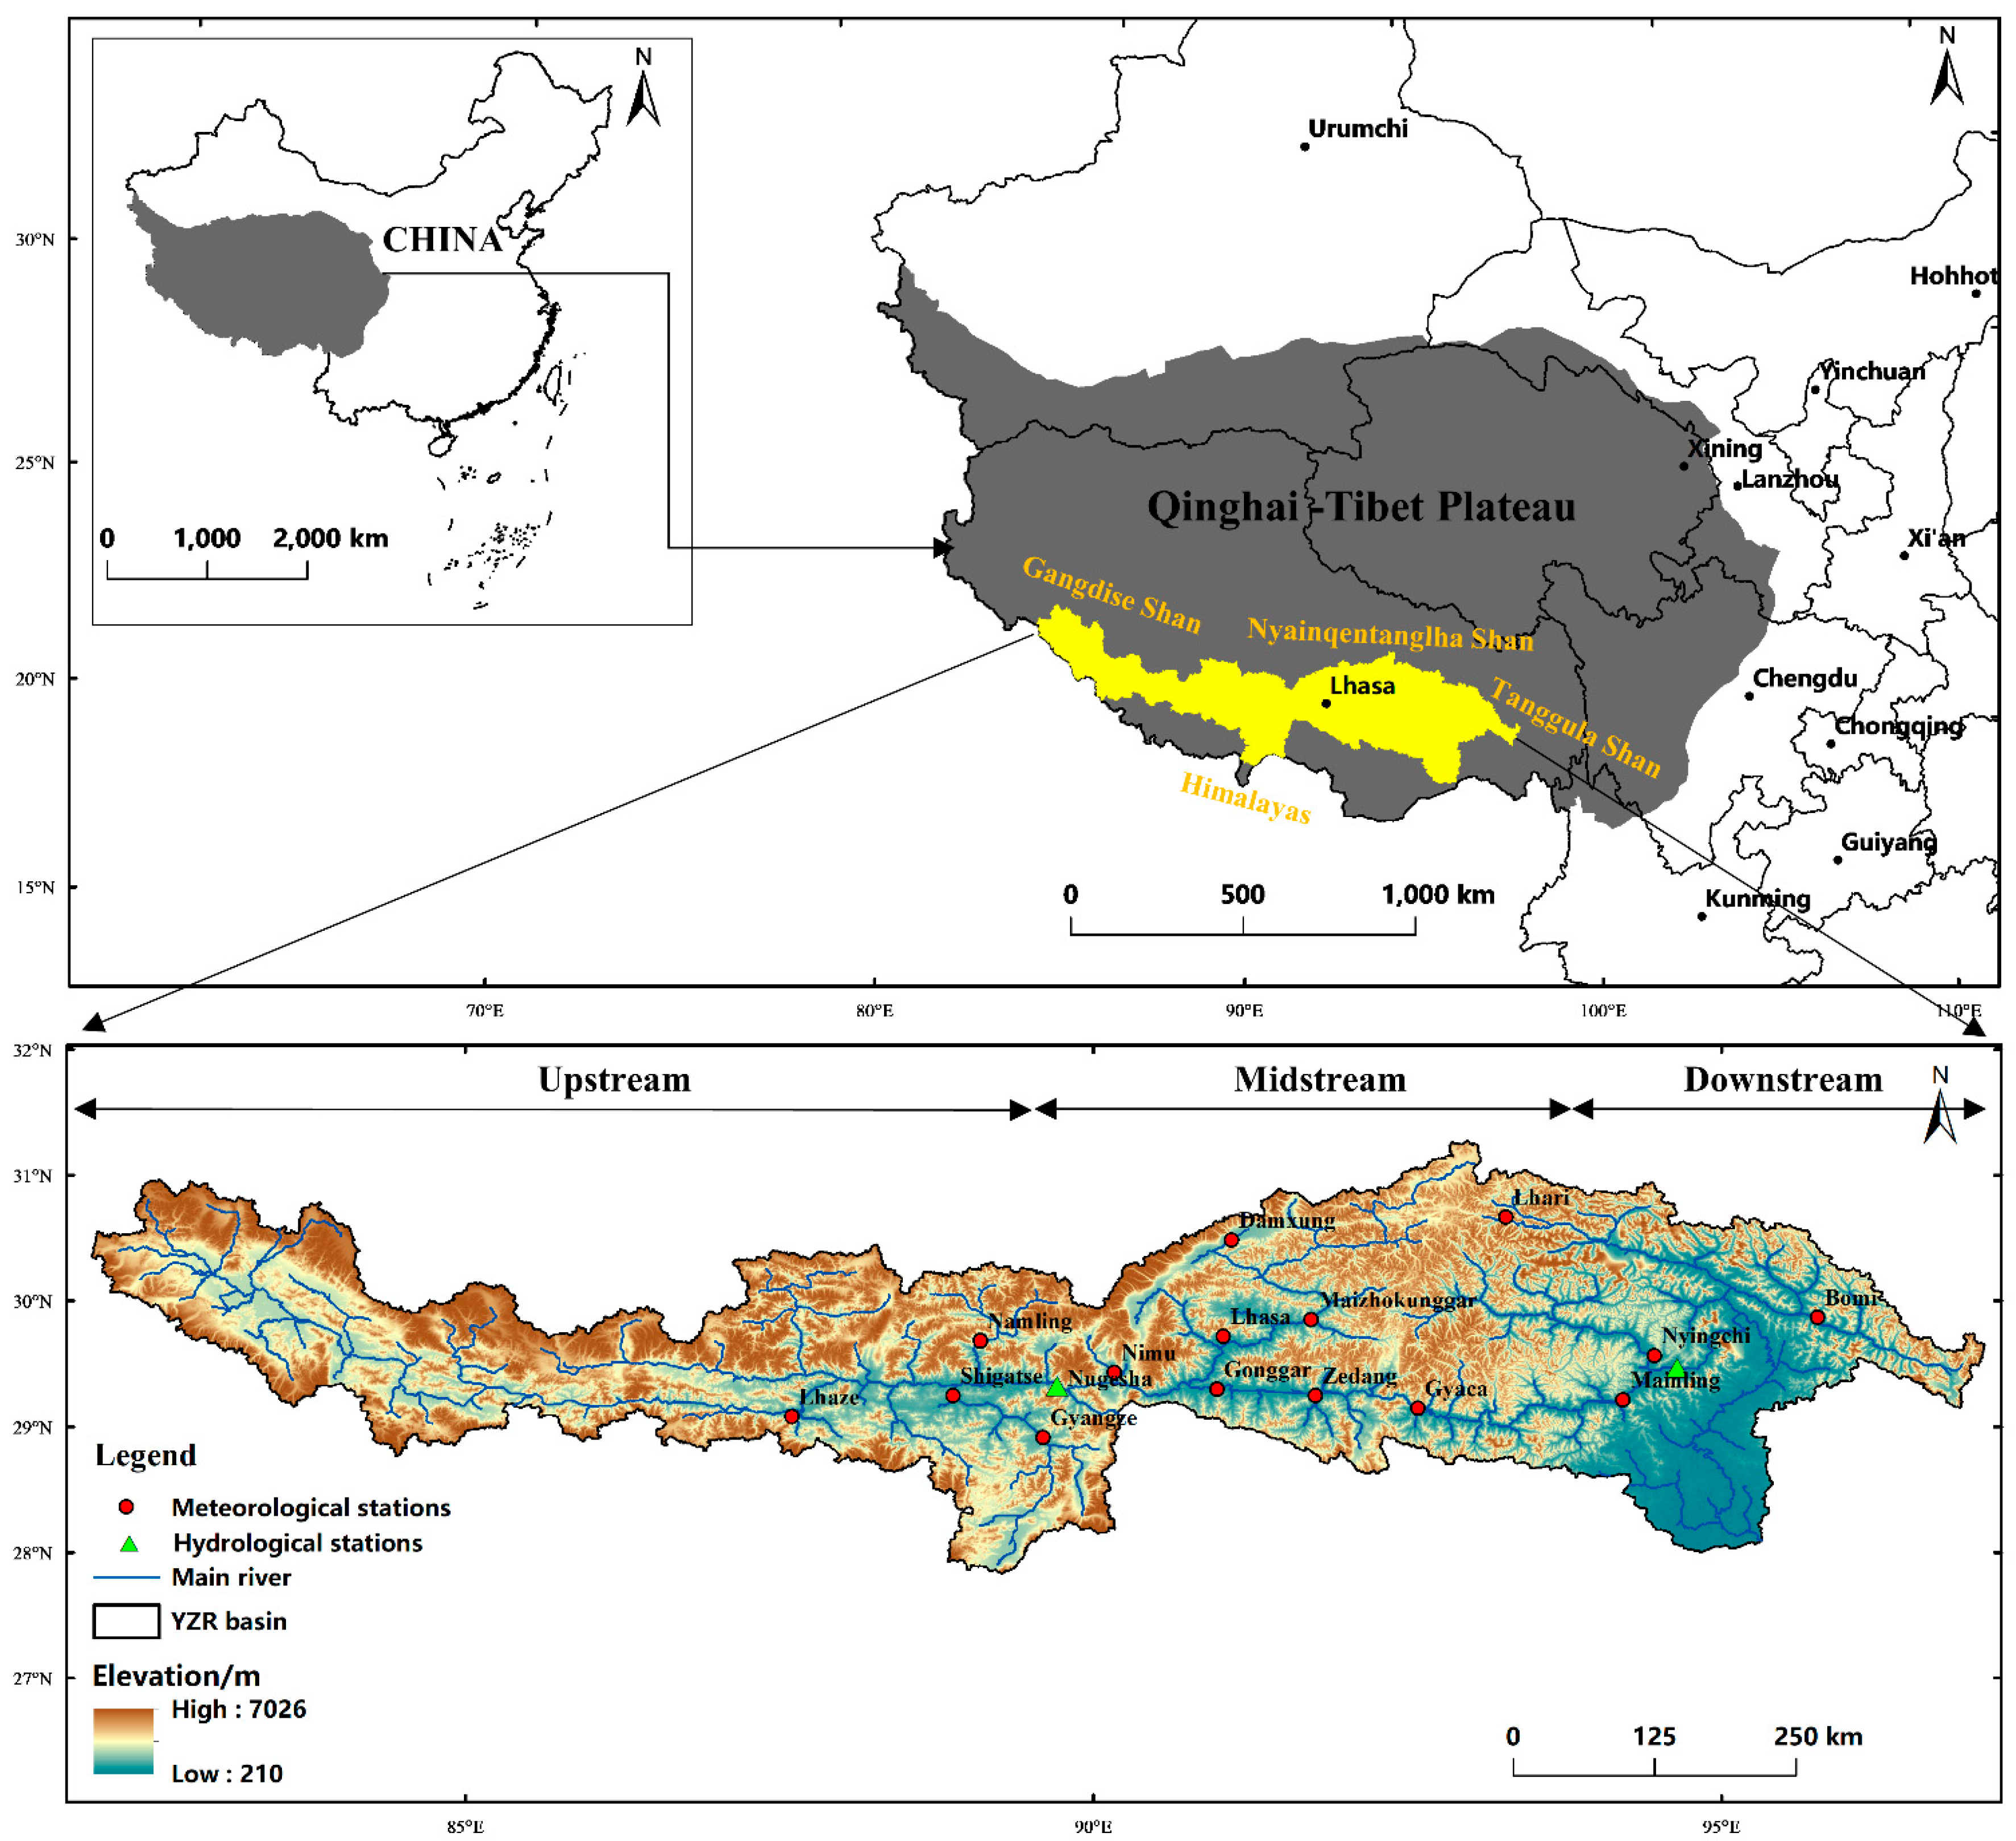
2.1. Study Area

The Yarlung Zangbo River originates from the Gyama Langdzom Glacier is one of the highest rivers around the world. It is mainly composed of five tributaries, namely the Duoxiong Zangbo River, the Nianchu River, the Lhasa River, the Nyang River, and the Parlung Tsangpo River. The YZR basin, with a latitude of 28°00 ‘N–31°16’ N and longitude of 82°00 ‘E–97°07’ E, is located in the southeast QTP (Figure 1), with an area of about 24 km2 and average altitude of more than 4000 m (ranging from 132 m to 7258 m). The climate of the YZR basin is characterized as cold plateau mountain climate with intense solar radiation and low air temperatures. The amount of precipitation gradually increases from northwest to southeast in the basin, which is mainly affected by the warm and humid airflow from the Bay of Bengal and the Indian Ocean. The mean annual precipitation in the basin is 300–500 mm, and the rate increases with elevation by 10–30 mm/100 m [52]. The total rainfall from June to September accounts for 60%–90% of the mean annual precipitation in the whole basin, indicating the precipitation has an uneven distribution within a year. Due to the complex topographical features and high altitude, the vegetation cover within the area exhibits distinct vertical zonality and varies from mountain forest, mountain broad-leaved forest, mountain coniferous forest, and subalpine shrub meadow to alpine meadow along with rising elevation [53].

2.2. Data

NDVI has been widely applied to detect and quantify the dynamic changes of vegetation in an extensive range [54]. Currently, various remote sensing satellite instruments can provide NDVI data, such as MODIS, SPOT/VEGETATION, and NOAA/AVHRR, etc. Compared with other vegetation index dataset, the GIMMS-NDVI3g, featured by its long time series and wide coverage, has proven to be one of the best datasets in describing vegetation growth dynamic changes [55]. Previous studies have shown that GIMMS NDVI dataset is significantly better than that of MODIS NDVI in reflecting dynamic changes over the Qinghai-Tibet Plateau [56]. In this study, the NOAA/AVHRR GIMMS production with a spatial resolution of 8 km × 8 km was used to calculate the NDVI. The data from January 1982 to December 2015 was derived from the third generation GIMMS NDV3g dataset, developed by the Goddard Aerospace Agency (http://ecocast.arc.nasa.gov/data/pub/gimms/3g/). Meanwhile, to further minimize the impact of clouds, atmosphere, and solar radiation angles on the NDVI values, the GIMMS NDVI3g data was preprocessed by employing S-G Filtering and Maximum Value Composite techniques to ensure the reliability of the research data and the accuracy of the results.
The Global Land Data Assimilation System (GLDAS), consisting of four different land surface models, i.e., CLM, NOAH, MOSAIC, and VIC [57], is a high-resolution land surface data assimilation system that is jointly managed by the American Goddard Space Flight Center and Environmental Forecast Center (http://ldas.gsfc.nasa.gov/gldas/GLDAS vegetation.php), with two spatial resolutions (0.25° × 0.25° and 0.5° × 0.5°) and two temporal resolutions (3 hours and 1 month). The dataset with extensive sources is a combination of the surface observed data and the remote sensing satellite data. Compared to other remote sensing datasets, the GLDAS-NOAH data has a higher spatial and temporal resolution, a longer time span (1970 to present), and 28 variables (precipitation, air temperature, and soil moisture content, etc.). In this study, due to the limited number of meteorological gauging stations in the YZR basin, especially in the upper reaches, the monthly GLDAS-NOAH data at the 0.25° × 0.25° spatial resolution from 1982 to 2015 were used to analyze the dry-wet transitions of the YZR basin, and to calculate the SPEI based on the performance evaluation of the GLDAS-NOAH data.
In-situ observations of the precipitation and surface air temperature from twenty meteorological gauging stations (as shown in Figure 1) in the YZR basin were used to evaluate the performance of the GLDAS-NOAH data.

2.3. Methods

The SPEI is a drought index based on the probability model, which was constructed by combining the potential evapotranspiration (PET) with the SPI [58]. Given the input and output of water resources, the calculation results of the SPEI mainly depicted the excess or deficit of water in an ecosystem within a certain period. The computational procedure of the SPEI can be divided into the following—calculation of the potential evapotranspiration (PET) based on the Thornthwaite method; computation of the difference value D between the precipitation and evapotranspiration, and finally, normalization of the value D. The specific calculation methods were as follows:
Firstly, the potential evapotranspiration was calculated and the difference between the potential evapotranspiration and precipitation was defined as:
D i = P i P E T i
where Di is the difference between monthly precipitation Pi and potential evapotranspiration PETi.
Secondly, the D i data series was normalized—the SPEI, which is similar to SPI, adopts the log-logistic of three parameters to normalize the cumulative values of the sequence of D i data. The calculation formula was:
F ( x ) = [ 1 + ( α x γ ) β   ] 1
where F(x) is the probability distribution function, α, β, and γ represent the respective ratio, shape and source parameter, which could all be estimated by the linear distance method.
Finally, the cumulative probability P for a given time scale was derived, and then the normalized value of SPEI was calculated. The equations were as follows:
P = 1 F ( x )
When P<0.5
W = 2 l n ( p )
S P E I = W C 0 + C 1 W + C 2 W 2 1 + d 1 W + d 2 w 2 + d 3 w 3
When P>0.5
P = 1 P
S P E I = ( W C 0 + C 1 W + C 2 W 2 1 + d 1 W + d 2 W 2 + d 3 W 3 )
The constants included C0 = 2.515517, C1 = 0.802853, C2 = 0.010328, d1 = 1.432788, d2 = 0.189269, and d3 = 0.001308. A negative SPEI value indicates dryness whereas a positive value represents wetness. The Table 1 lists the SPEI-based drought index classification criteria [27].
One-dimensional linear regression was employed to analyze SPEI and NDVI in the study area to describe the spatio-temporal trends of SPEI and NDVI between 1982 and 2015 [59]. The calculation formula was:
s l o p e = n i = 1 n ( i × C i ) i = 1 n i × i = 1 n C i n × i = 1 n i 2 ( i = 1 n i ) 2
where Slope represents the changing trends of NDVI and SPEI, n is the study temporal interval, n = 34, and Ci represents SPEI or NDVI for the year i. A significance test was performed on the changing trends of NDVI and SPEI (P < 0.01 indicates an extremely significant change, P < 0.05 indicates a significant change, and P > 0. 05 indicated the change is not significant).
The correlation coefficient (R) was used to investigate the linear relationship between NDVI and SPEI at the pixel scale in this study, which was defined as:
R = i = 1 n [ ( x x ¯ ) ( y y ¯ ) ] i = 1 n ( x i x ¯ ) 2 i = 1 n ( y i y ¯ ) 2
where x i and y i represent the respective annual SPEI and NDVI values for the year i, x ¯ represents the mean annual SPEI values, and y ¯ represents the mean annual NDVI values. The significance test was used to illustrate the correlation between SPEI and NDVI (P < 0.01 indicates an extremely significant correlation, P < 0.05 indicates a significant correlation, and P > 0.05 indicates the correlation is not statistically significant).
Four statistical indicators were used in this study to evaluate the performance of the GLDAS-NOAH outputs in the YZR basin, which were the Pearson correlation coefficient (R), mean bias (MB), root-mean-square error (RMSE), and Nash-Sutcliffe efficiency coefficient (NSE). The Pearson correlation analysis was used to reflect the strength of the linear relationship between the compared datasets. The MB and RMSE revealed the degree of deviation of the paired data. The MB provided information on the absolute overestimation or underestimation of the two paired datasets, whereas the RMSE was a good reflection of the procedural precision. The NSE ranged from [−∞, 1], and the credibility of the simulation was much higher when it was approaching 1. These statistical indicators were defined as follows:
M B = 1 n i = 1 n ( x i y i )
R M S E = 1 n i = 1 n ( x i y i ) 2
N S E = 1 i = 1 n ( x o i x m i ) 2 i = 1 n ( x o i x o ¯ ) 2
where n is the number of the data, and xi nd yi are the observed data and GLDAS-NOAH data, respectively. In Equation (12), x o i and x m i separately represent the observed value and model simulated value of the variable; x o ¯ is the average value of the observed data. Generally, if the monthly NSE > 0.5 and monthly R > 0.77 (corresponding to the determination coefficient R2 > 0.6), the model performance was considered to be acceptable [60].
As an effective and practical statistical method recommended by the World Meteorological Organization, the Mann-Kendall nonparametric test was applied to detect the significance of the trend. The detailed information can be obtained in [61,62,63]. In this study, the 0.1 significance level was used.

3. Results

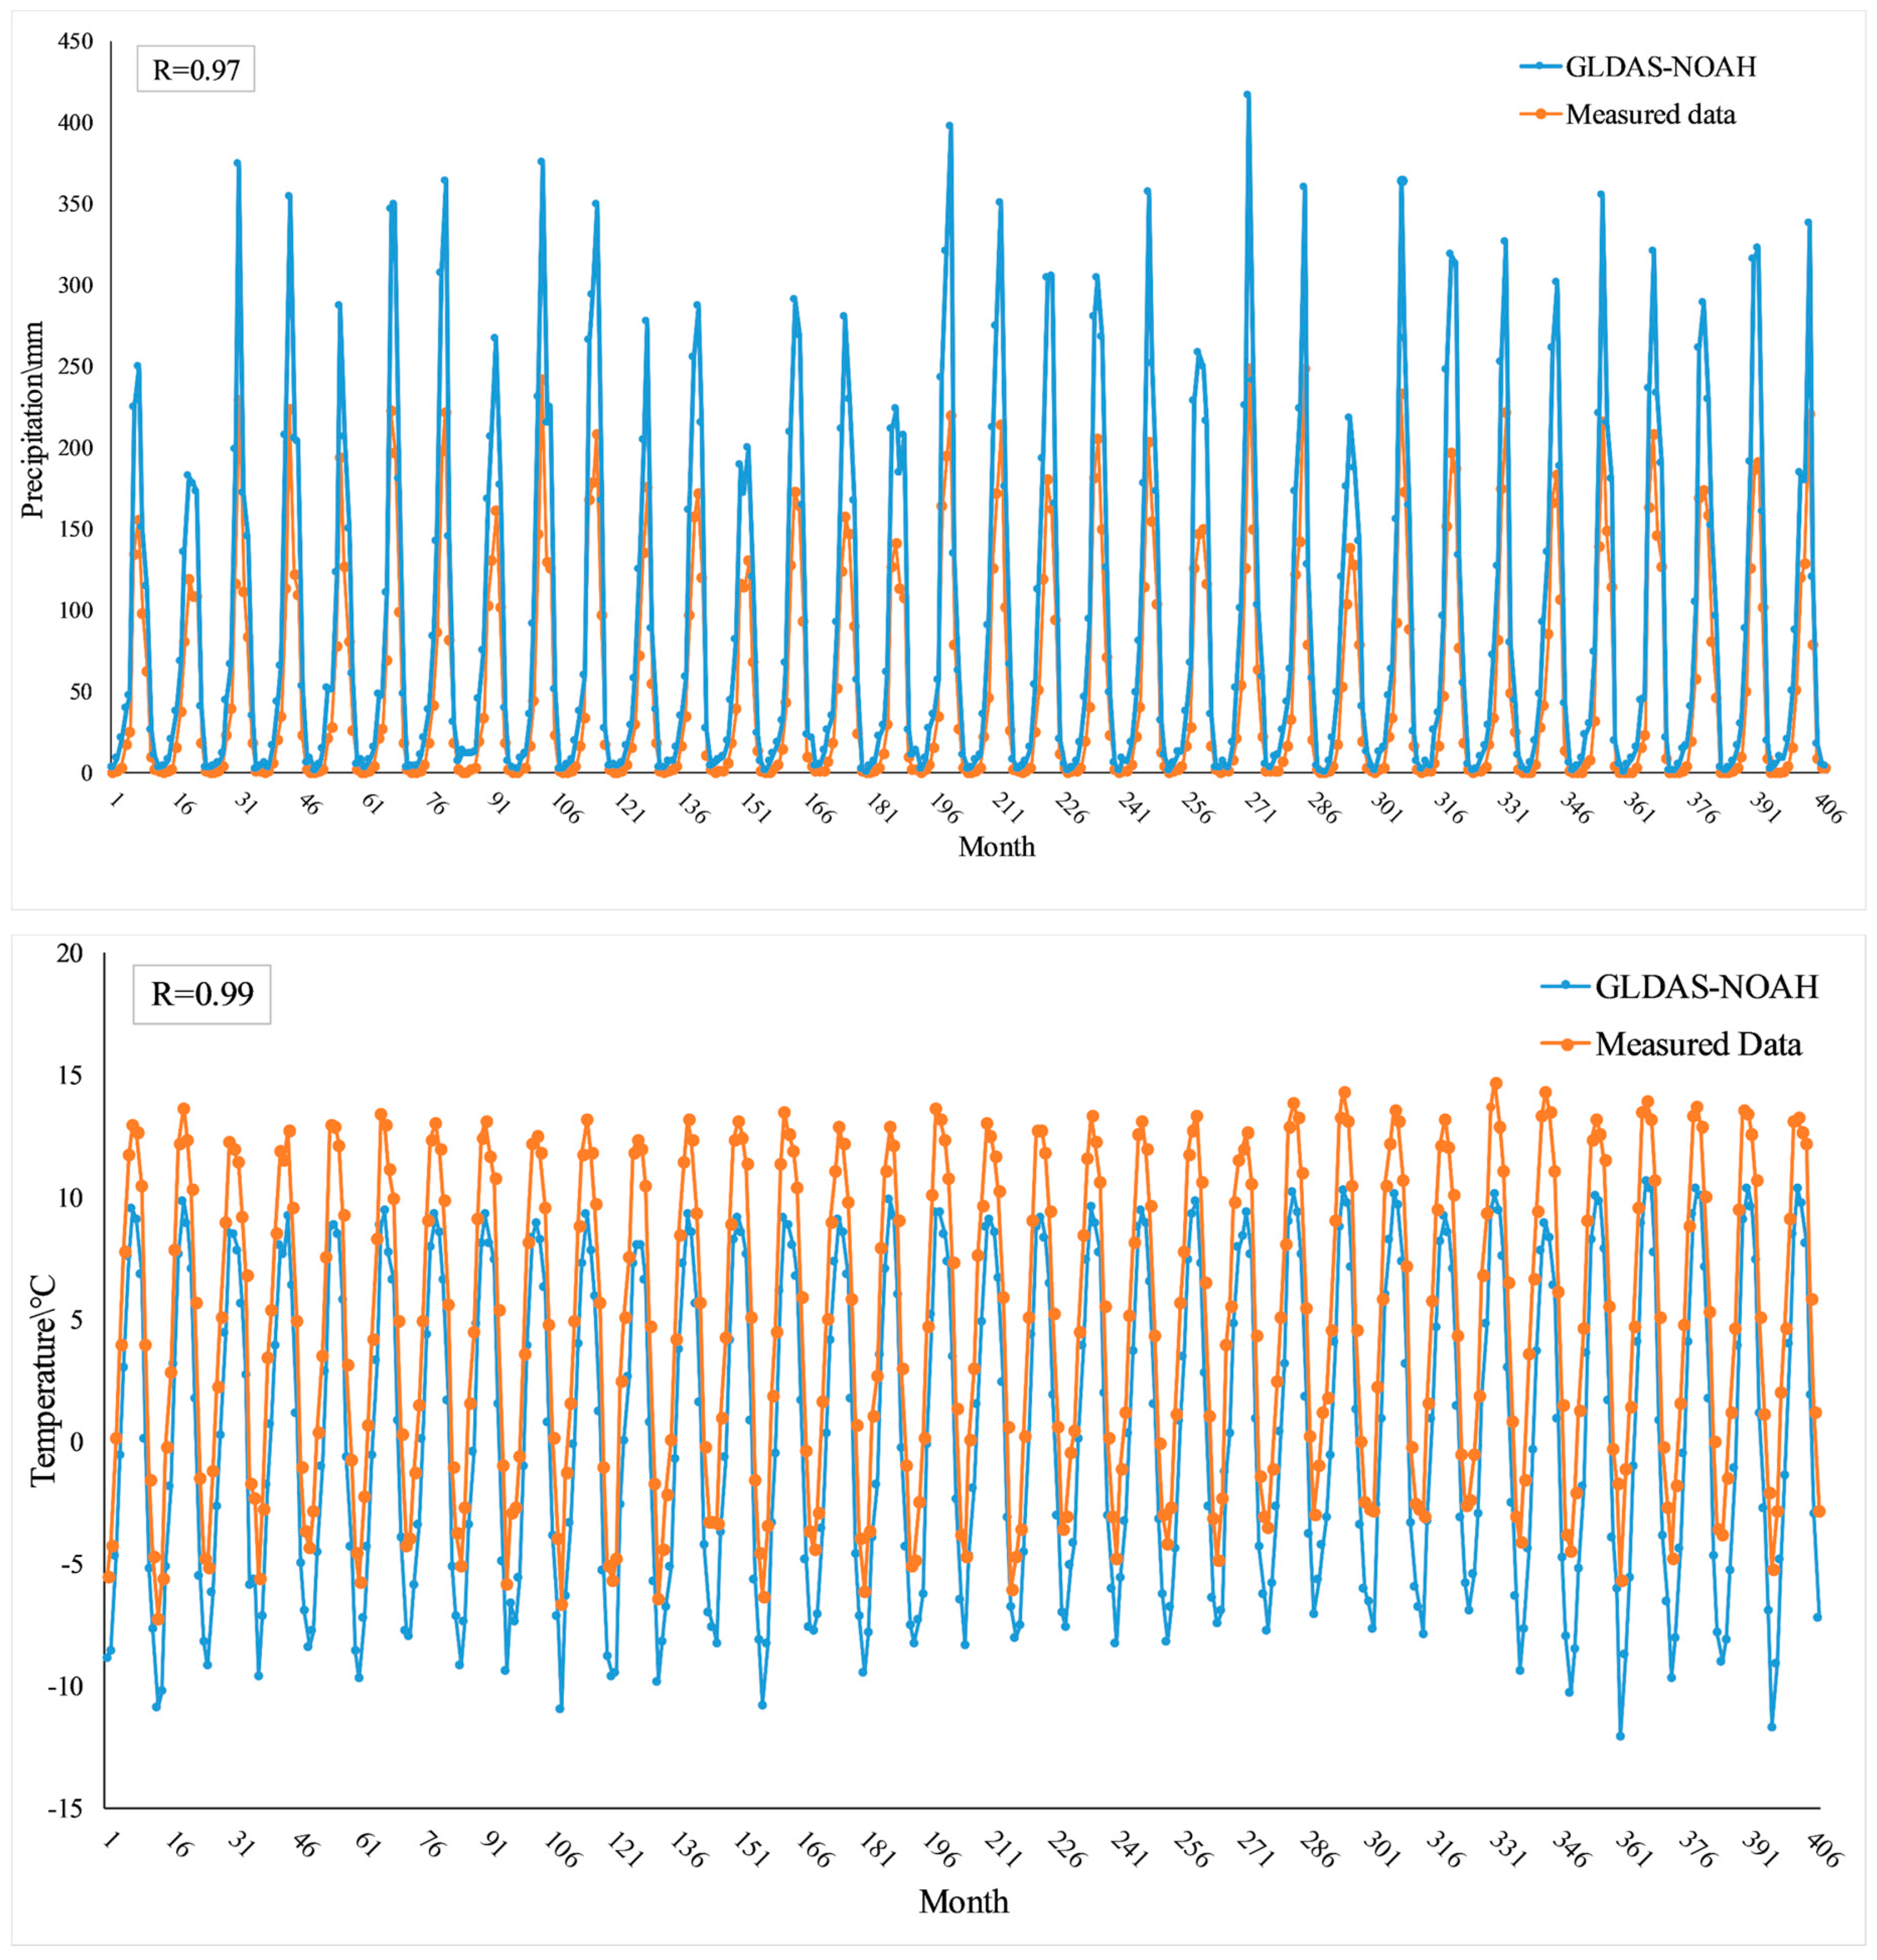
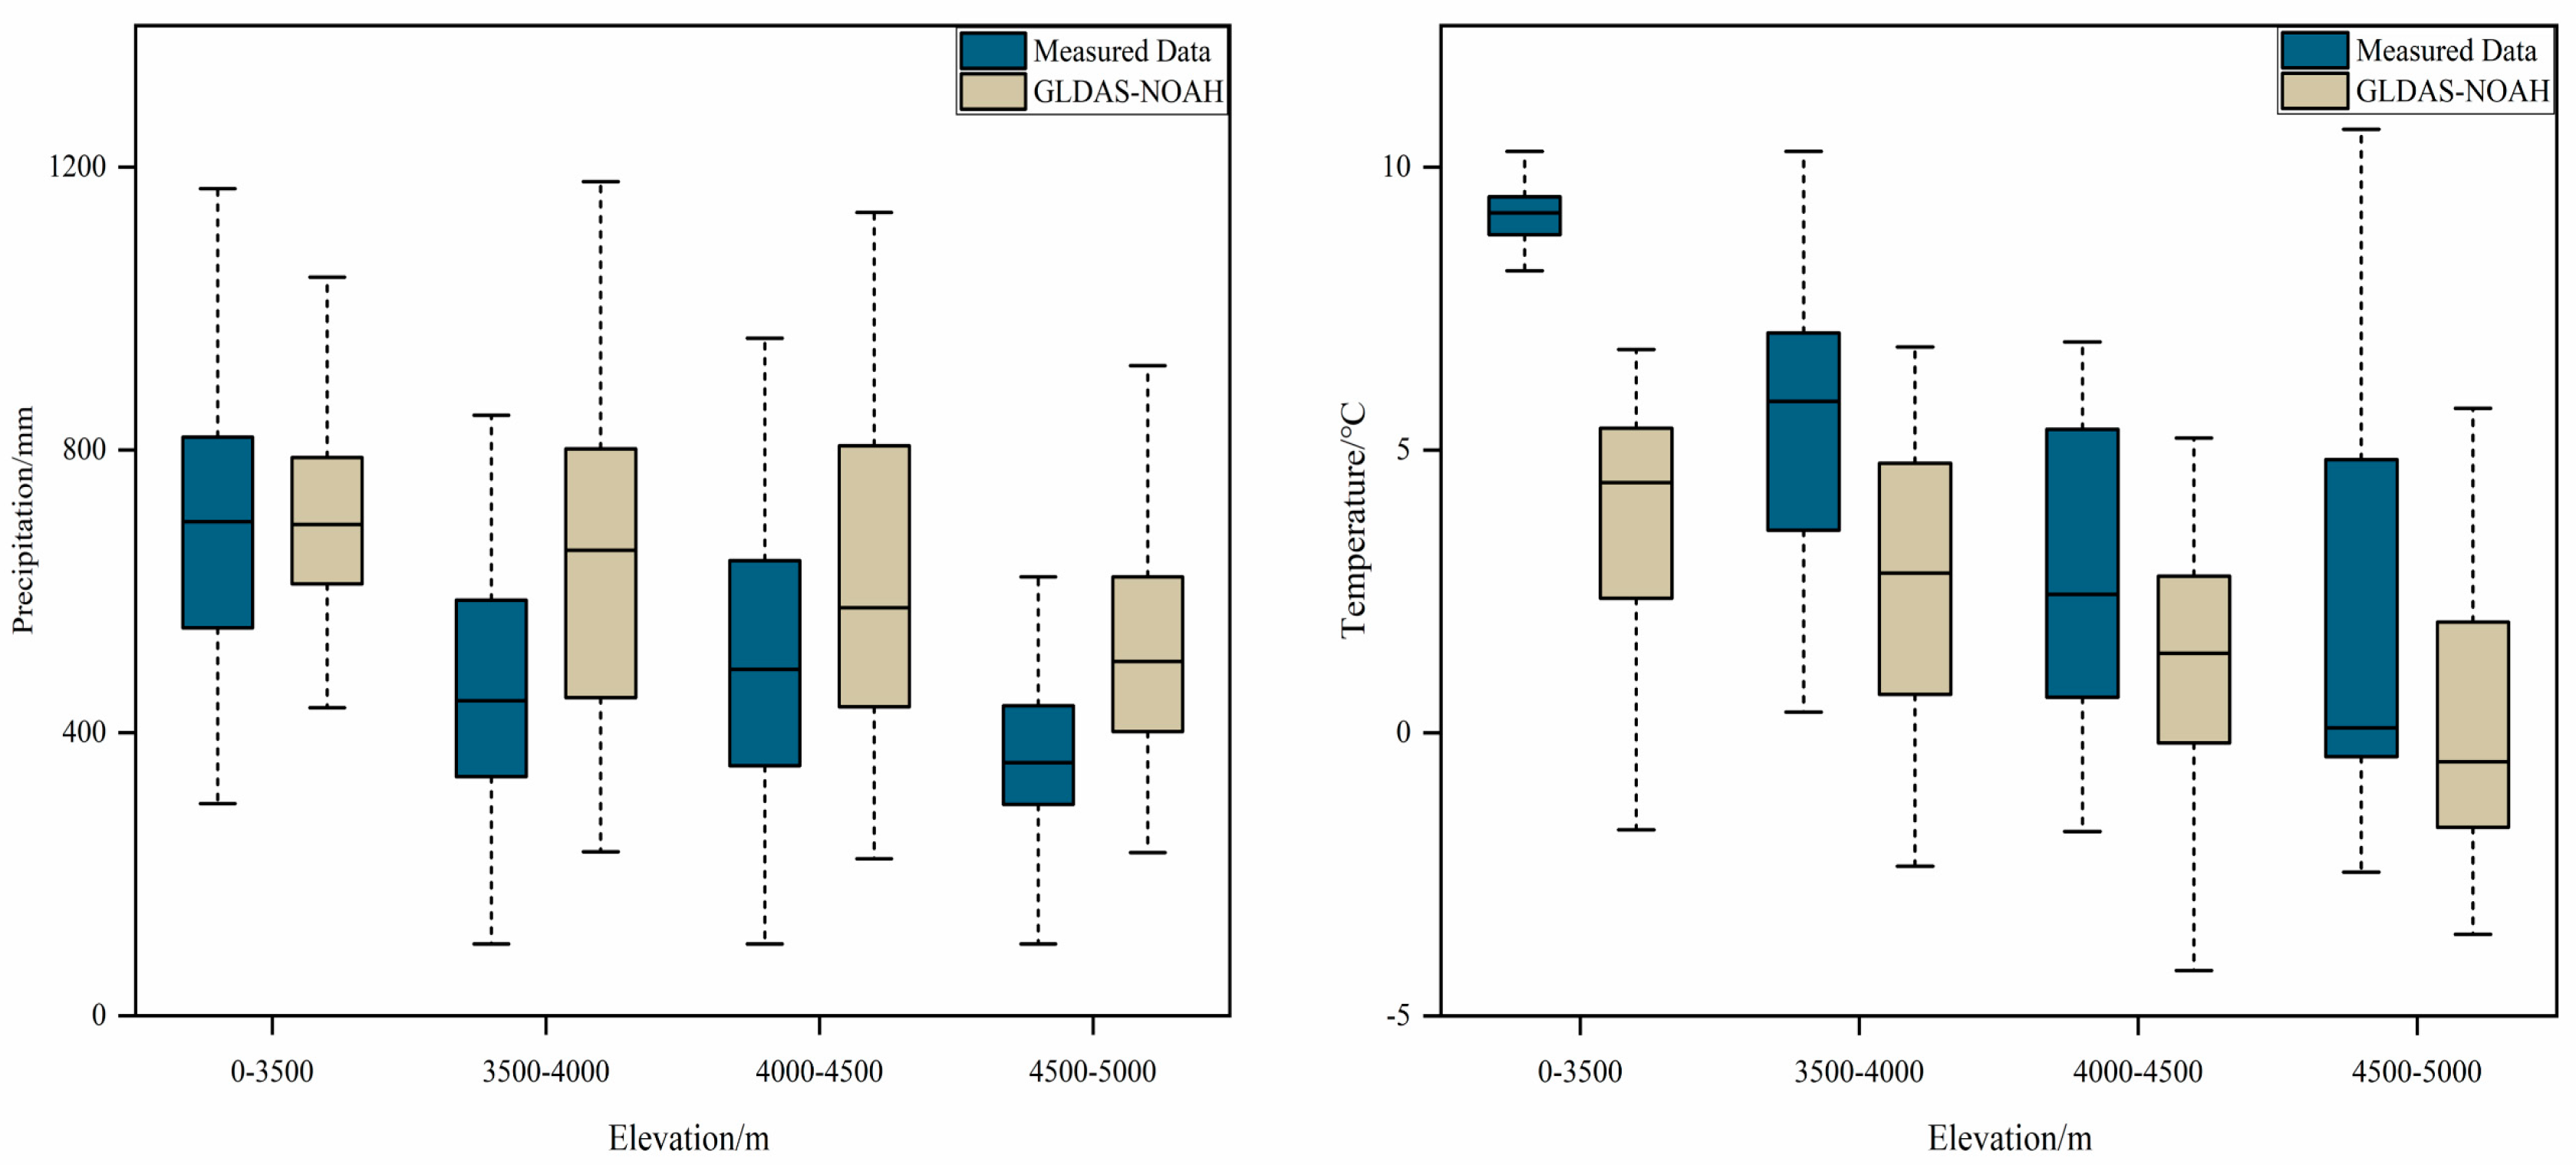
3.1. Performance Evaluation of the GLDAS-NOAH Data

Due to the strong heterogeneity of the underlying factors over the YZR basin, such as the vegetation, soil type, and elevation, etc., it is essential to evaluate the performance of the GLDAS-NOAH data at both the site scale and the river basin scale. In this study, the observed monthly precipitation and temperature data from 1982–2015 from the twenty meteorological gauging stations covering the upper, middle, and lower reaches of the YZR basin (Figure 1) and extracted model outputs of corresponding grids from the GLDAS-NOAH dataset were utilized to conduct the performance evaluation.

3.1.1. Precipitation Performance at Site Scale

The correlation coefficients between the gridded monthly GLDAS-NOAH precipitation and the corresponding observed monthly precipitation showed high consistency (R > 0.80), except the Bomi station, which had a relatively lower R value of 0.57 (Table 2). This can be partly attributed to the dramatic topographic variations around the Bomi station ranging from 3100 m to 5000 m, whereas the elevation of the gauging station was 1300 m, which may have insufficiently represented the regional precipitation within the GLADS-NOAH grid area of approximately 625 km2 (0.25° × 0.25°). Lv et al. [61] demonstrated a similar conclusion in the study on the performance evaluation of the TRMM satellite precipitation data in the YZR basin. As shown in Table 2, the MB between the GLDAS-NOAH outputs and in-situ measurements ranged from −49.95 mm to 22.99 mm (accounting for 0.07%–17.47% of annual precipitation) and the RMSE ranged from 21.23 mm to 81.45 mm (accounting for 4.20%–29.44% of annual precipitation), which may be attributed to the mismatch of the point and grid scale.

3.1.2. Temperature Performance at Site Scale

As shown in Table 3, the GLDAS-NOAH data and in-situ measurements showed a high agreement, i.e., R ≥ 0.81, −0.63 ≤ NSE ≤ 0.97, −1.01 °C ≤ MB ≤ 6.85 °C, and RMSE ≤ 7.25 °C. In the Bomi station, the GLDAS-NOAH surface air temperature showed a larger discrepancy, i.e., the absolute value of MB = 6.85 °C and ≤4.59 °C for other stations, and RMSE = 7.25 °C and ≤5.37 °C for other stations. Similar to the performance of precipitation, the worse performance of temperature could be partly attributed to the dramatic topographic variations around the Bomi station, which may have caused uncertainties in the temperature estimation. Given that the monthly NSE > 0.5 and monthly R > 0.77 implied a good simulation, the high R and NSE from all stations indicates the high representation of the GLDAS-NOAH surface air temperature over the YZR basin.

3.1.3. Spatio-Temporal Patterns at River Basin Scale

In this study, the monthly precipitation and temperature in the entire YZR basin were calculated from 1982–2015 to further investigate the correspondence between the measured and GLDAS-NOAH data. As shown in Figure 2, the R values of precipitation and temperature of the two datasets reached 0.97 and 0.99 respectively, meaning there were good consistencies between the temporal variation patterns of precipitation and temperature, while the GLDAS-NOAH precipitation was larger than the measured precipitation, and the GLDAS-NOAH temperature was smaller than the measured data. Although the GLDAS-NOAH overestimates and underestimates the precipitation and temperature respectively, such inconsistency is not the key issue in this study because of the following two reasons. Firstly, the observed data were at the point scale, while GLDAS-NOAH data represented the average performance at the pixel scale, approximately an area of 25 km × 25 km. With the high divergence of underlying factors, such as vegetation, soil type, and elevation, etc. over the YZR basin, it is rather hard for the scarce observed data to represent the pixel average features. Th gauge-based precipitation data showed that the difference in annual precipitation between Jiangzi and Shigatse was as much as 40%, while their distance was only 80km [64]. Secondly, this study focused on the spatio-temporal variation trends rather than absolute magnitudes. That is, the systematic overestimation or underestimation could be reasonably eliminated on a tendency or relationship analysis, if the variation patterns of the GLDAS-NOAH data fitted well with those of the in-situ data.
In order to identify the spatial performance between the observed and the GLDAS-NOAH data, especially the vertical zonality characteristics, 20 meteorological stations and the corresponding grids were divided into four bands by elevation, i.e., 0–3500 m, 3500–4000 m, 4000–4500 m, and 4500–5000 m. As shown in Table 4 and Figure 3, the precipitation and temperature from the GLDAS-NOAH and in-situ data both decreased with the increase in elevation, implying that the GLDAS-NOAH data could represent the climate characteristics of the vertical zonality in the YZR basin. In terms of precipitation, the mean values of the observed data in 3500–4000 m and 4000–4500 m were 457.6 and 500.4 mm respectively, while those of the GLDAS-NOAH data were 640.4 mm and 619.7 mm respectively. This discrepancy was owing to the large MB values of the Lhunze and Nyemo stations as shown in Table 2. However, the variation ranges of the GLDAS-NOAH and in-situ precipitation at the four elevation bands were similar. Compared to the precipitation, the vertical variation characteristic of the GLDAS-NOAH temperature at the four elevation bands was much closer to that of the observed data. Although the observed temperature in the first elevation band seemed much bigger than the GLDAS-NOAH data, which was mainly ascribed to only three gauging stations in this elevation band, the GLDAS-NOAH temperature at the other three elevation bands exhibited a high agreement with the observed data, regardless of whether it was from the perspective of the mean values or from the perspective of the variation ranges. Similar results of the GLDAS performance in the YZR basin and QTP were demonstrated by Zhang et al. [65] and Zhang et al. [66].

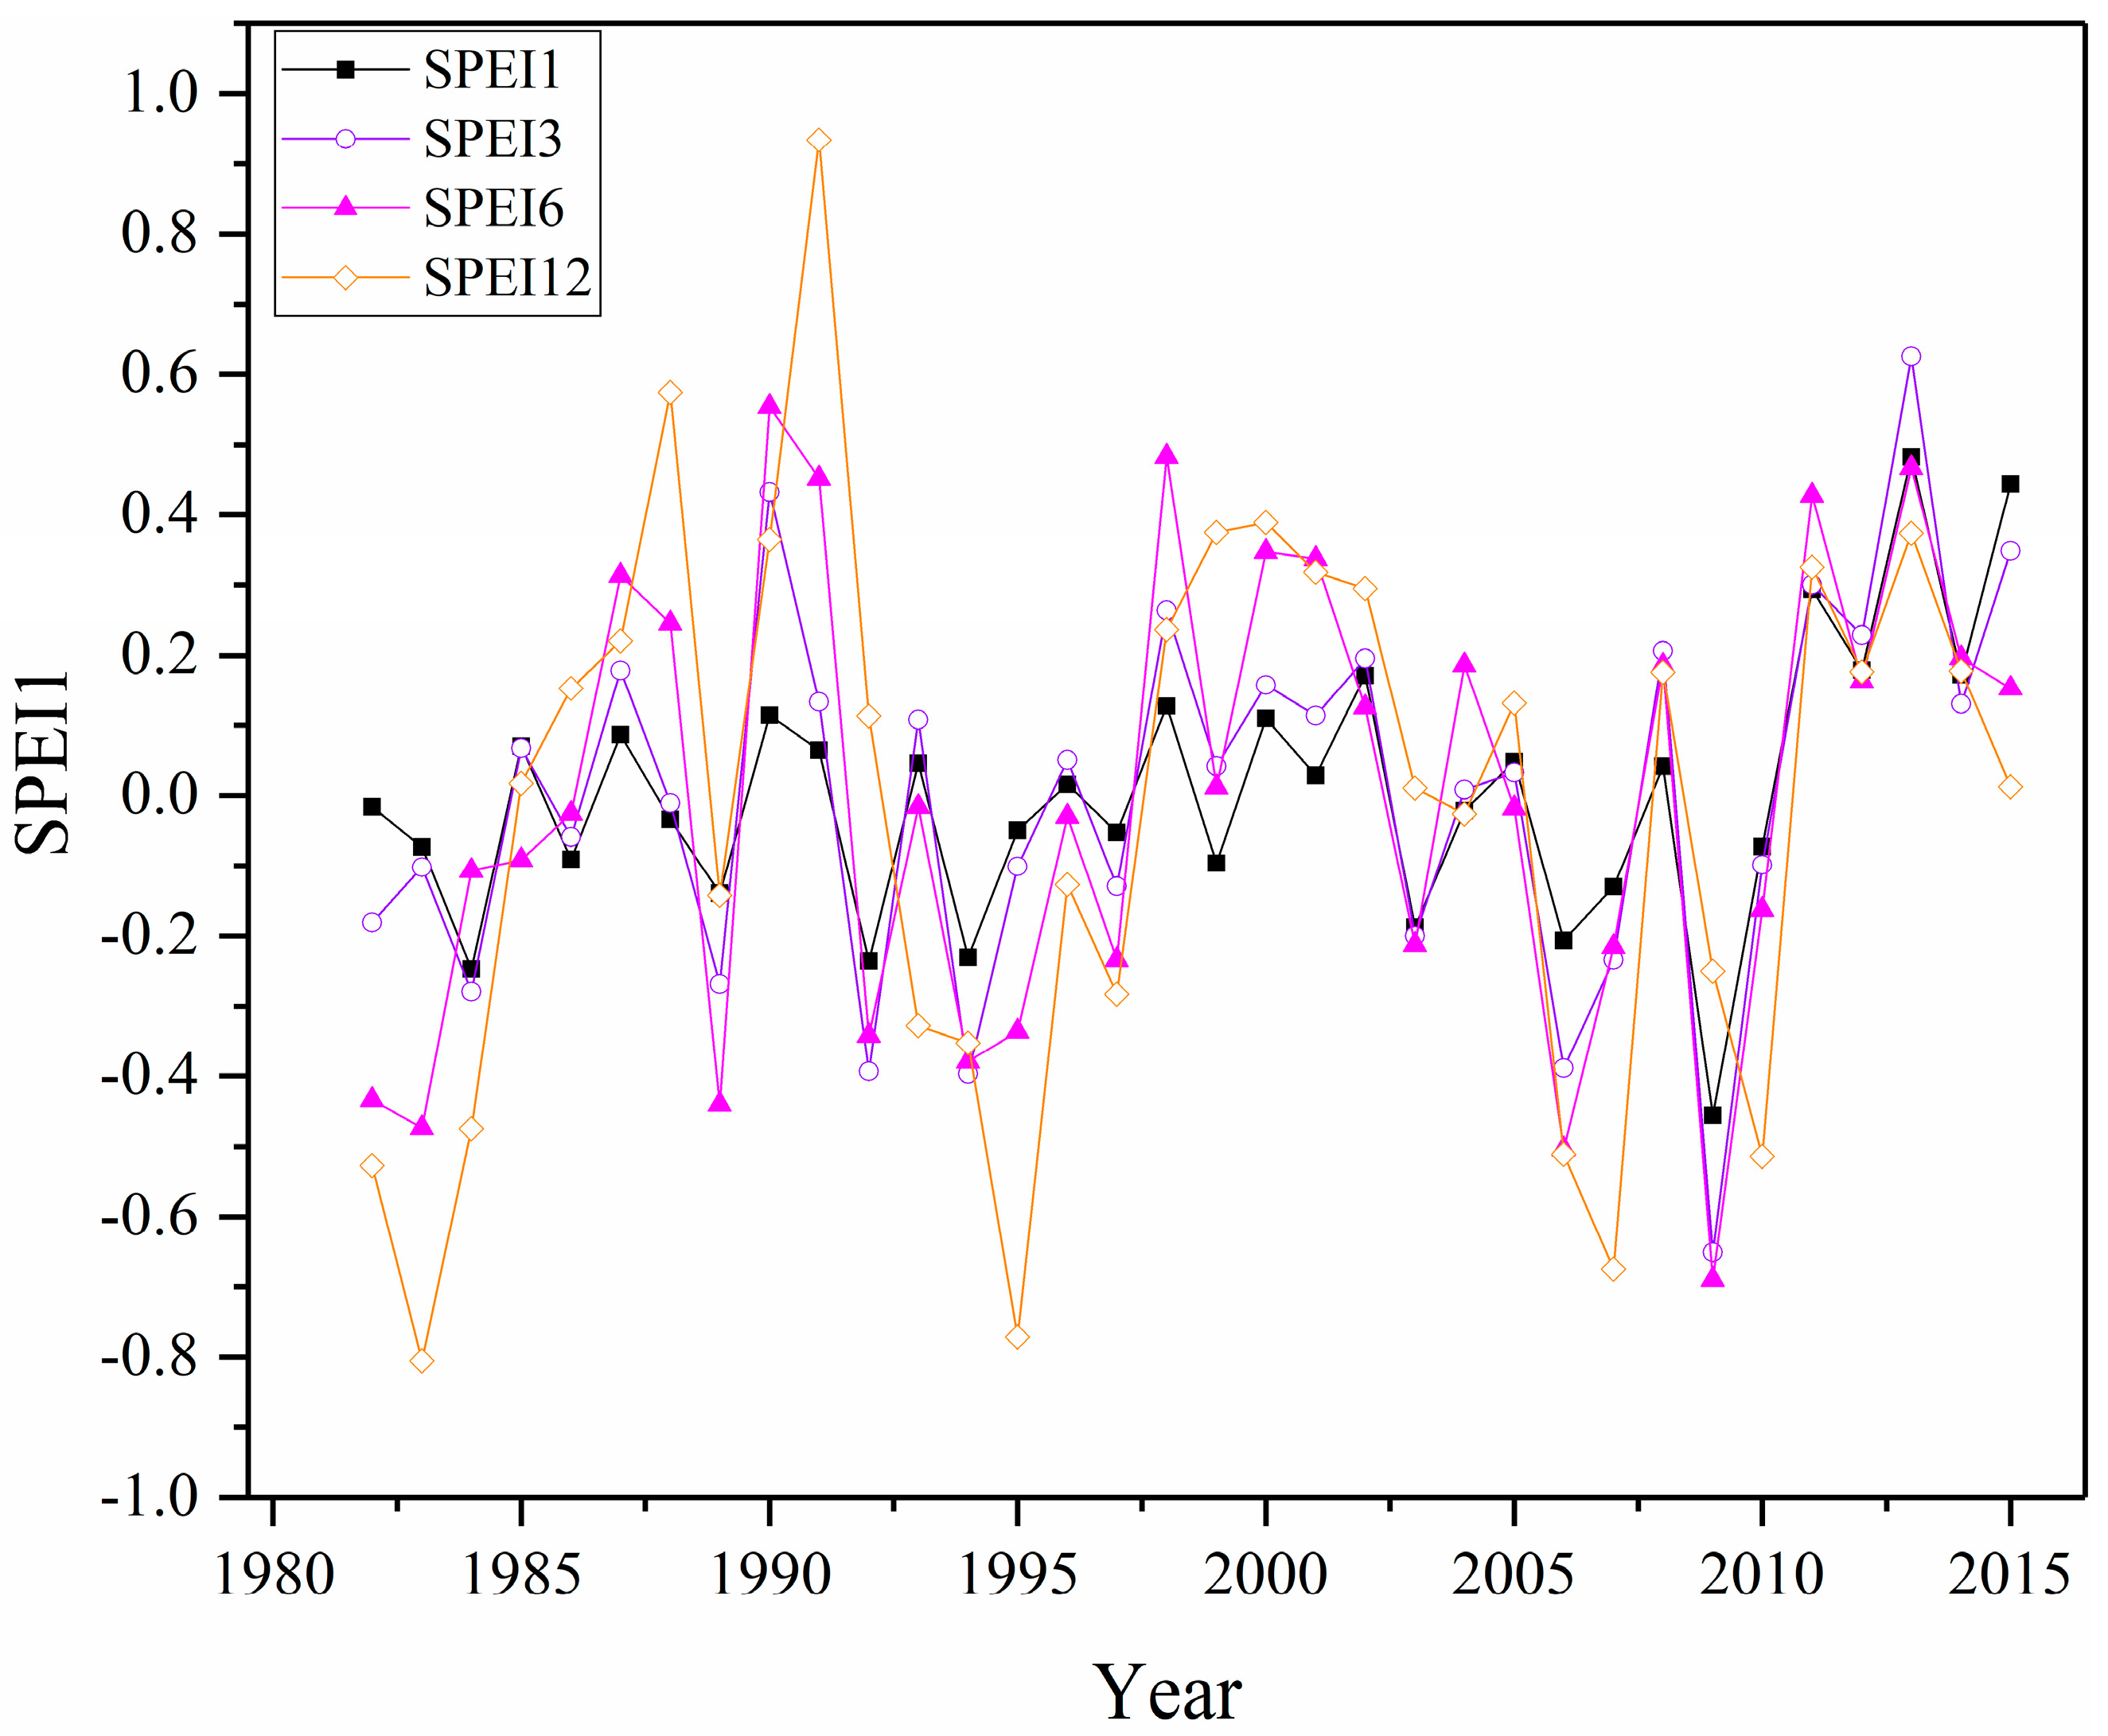
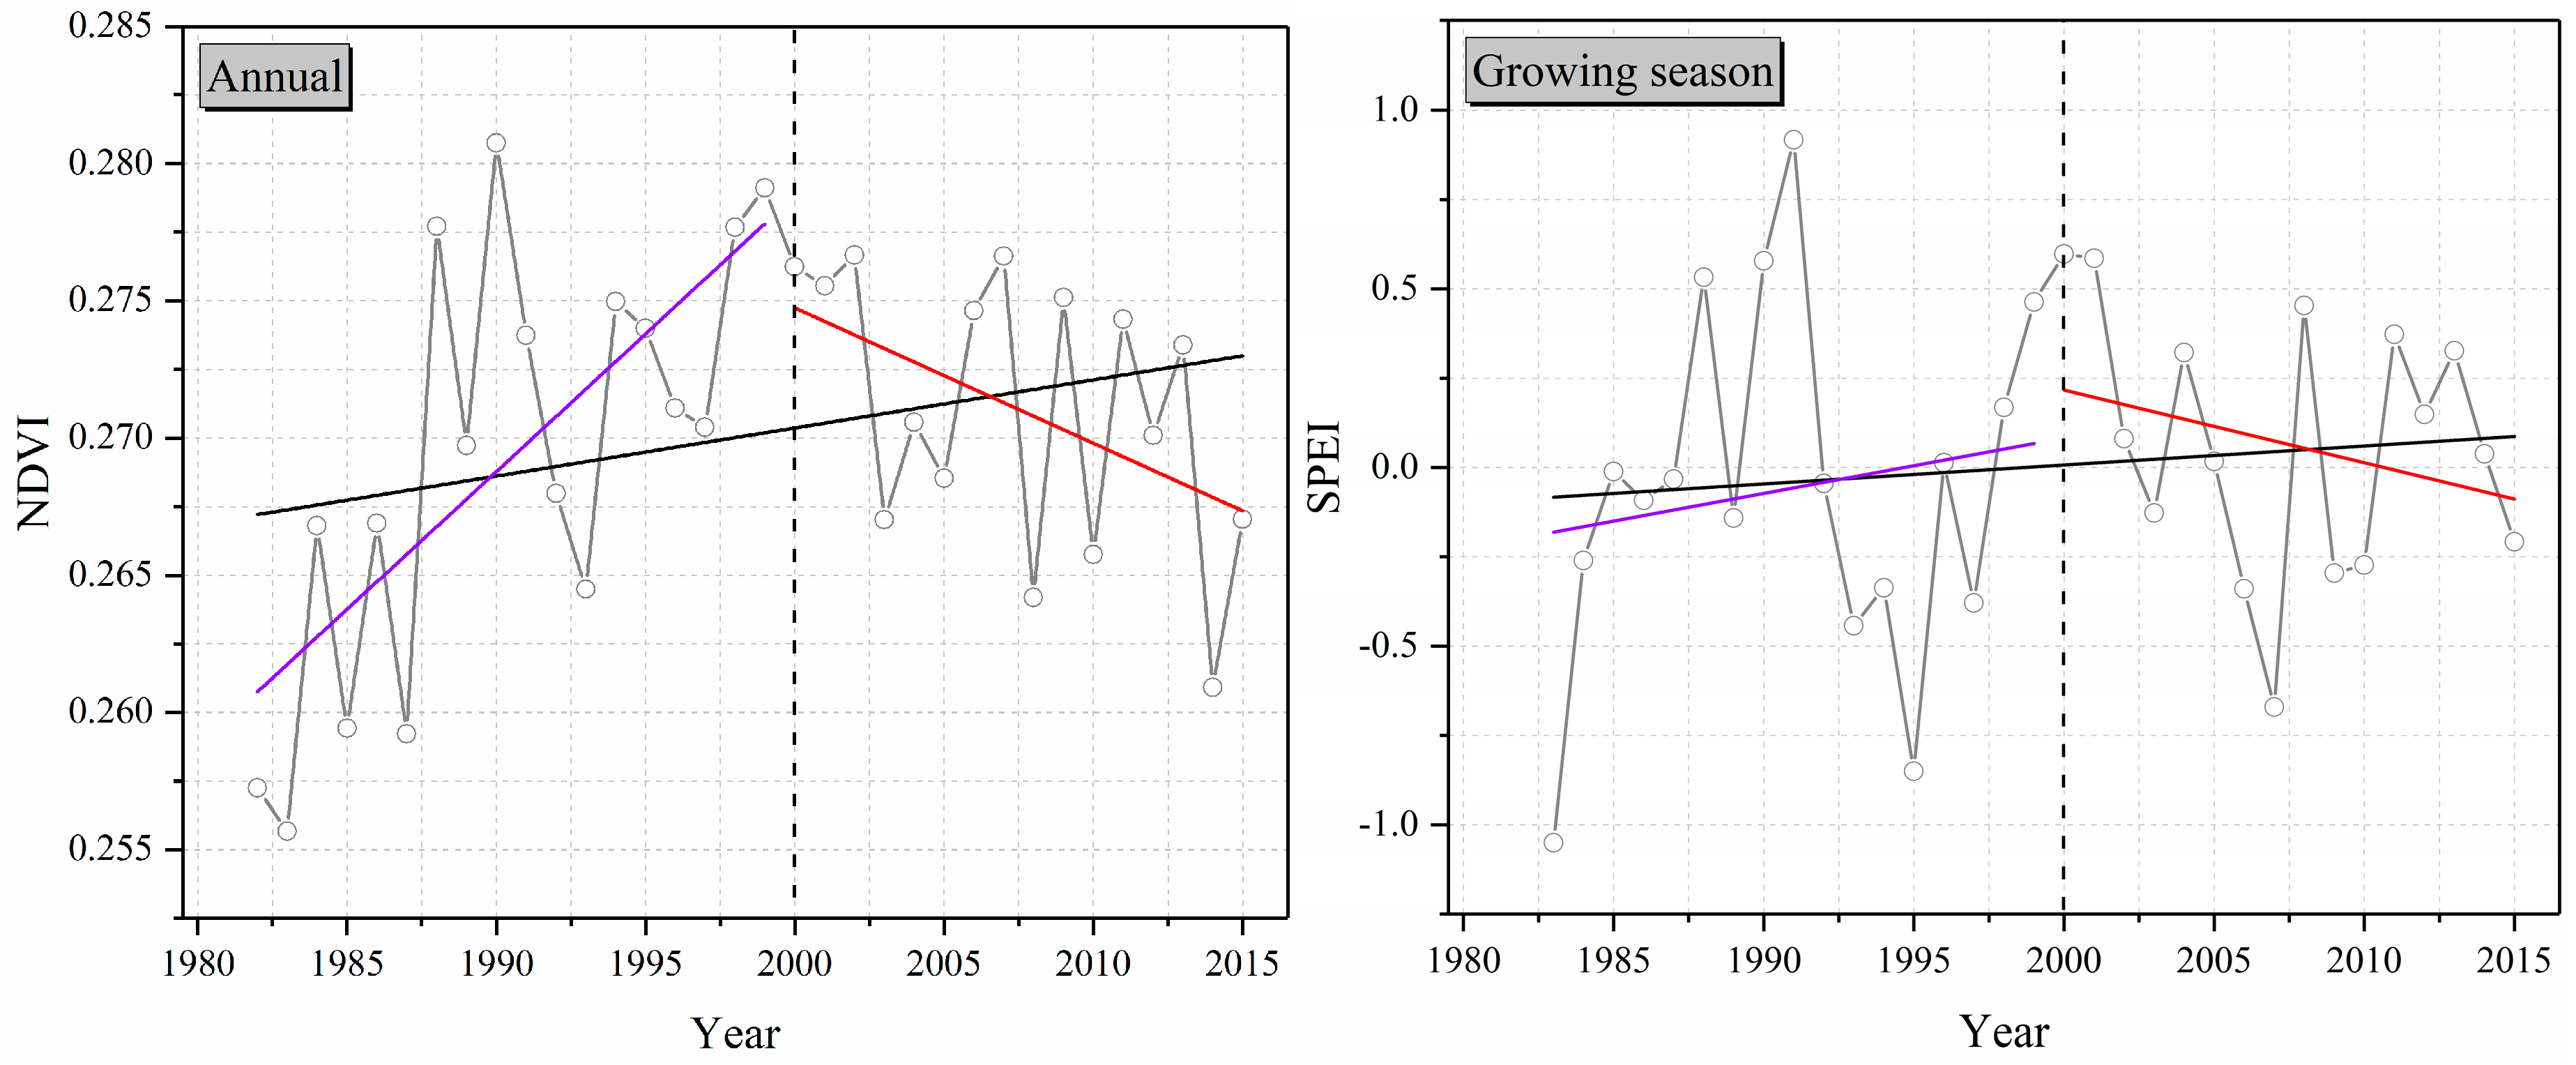
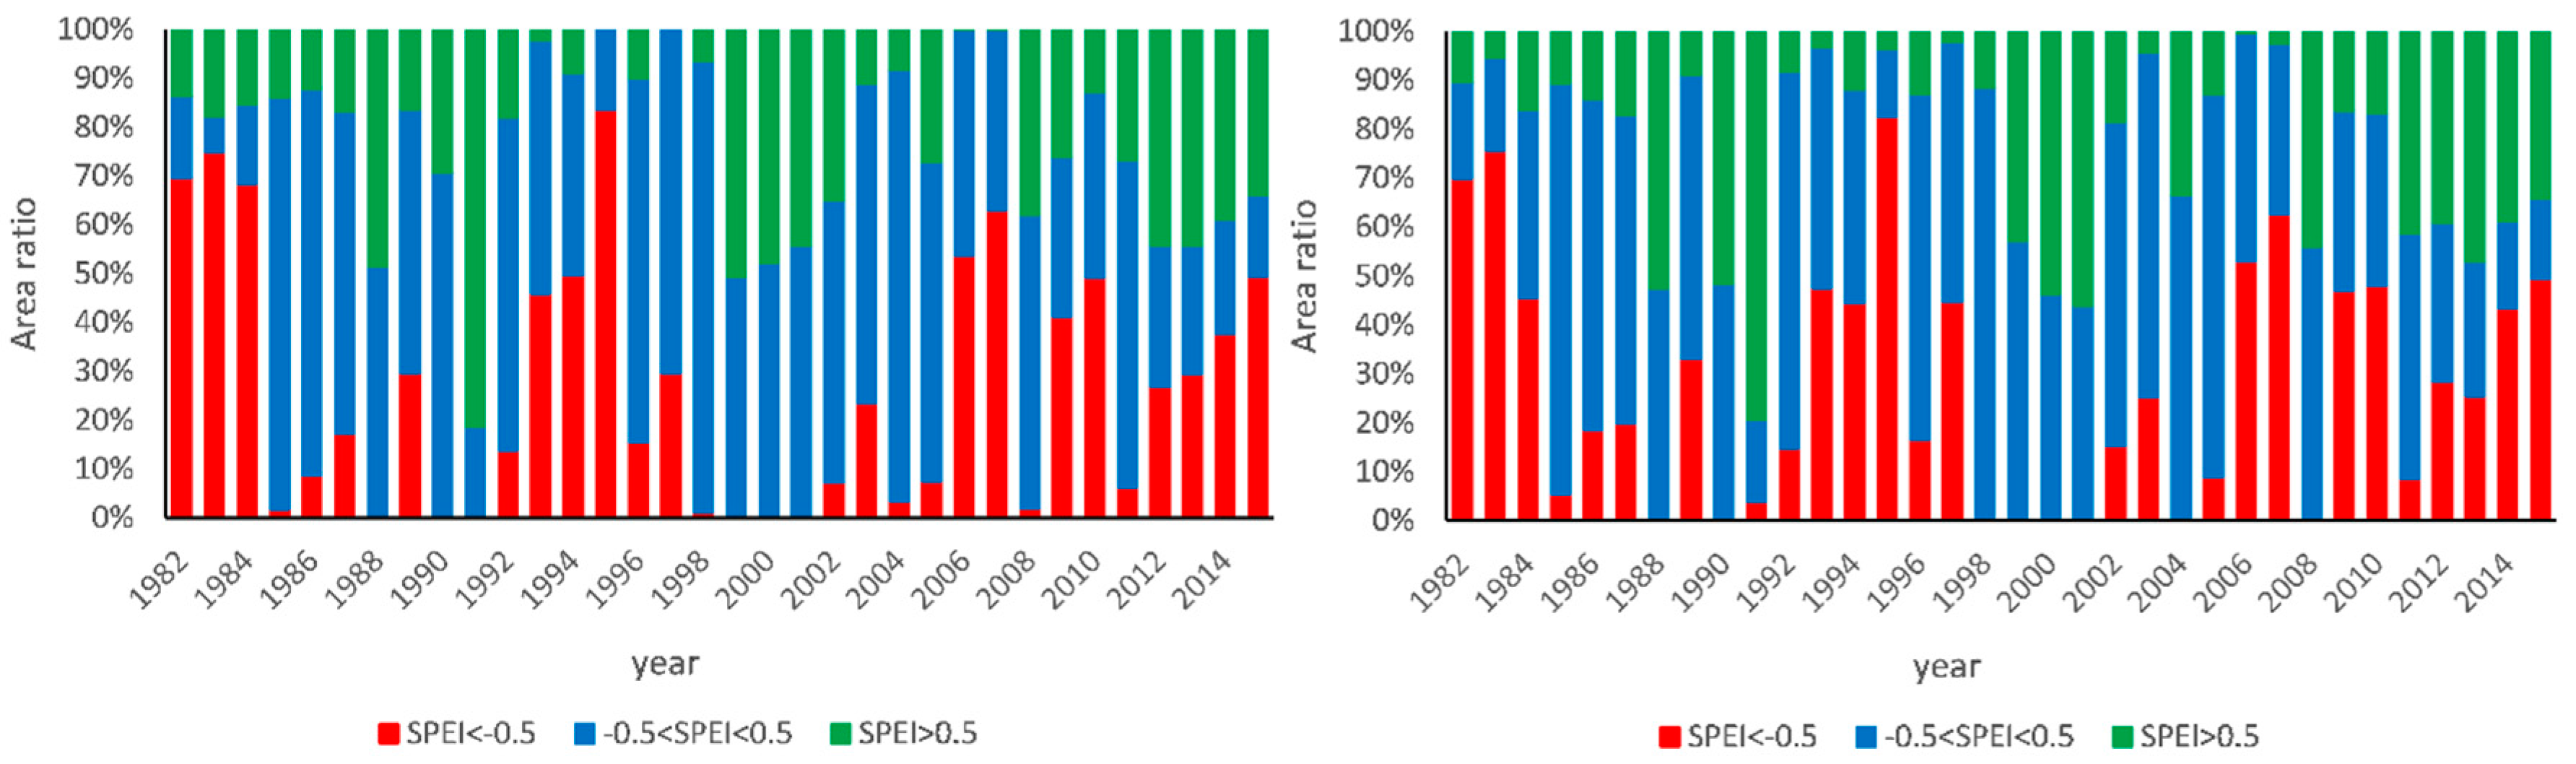
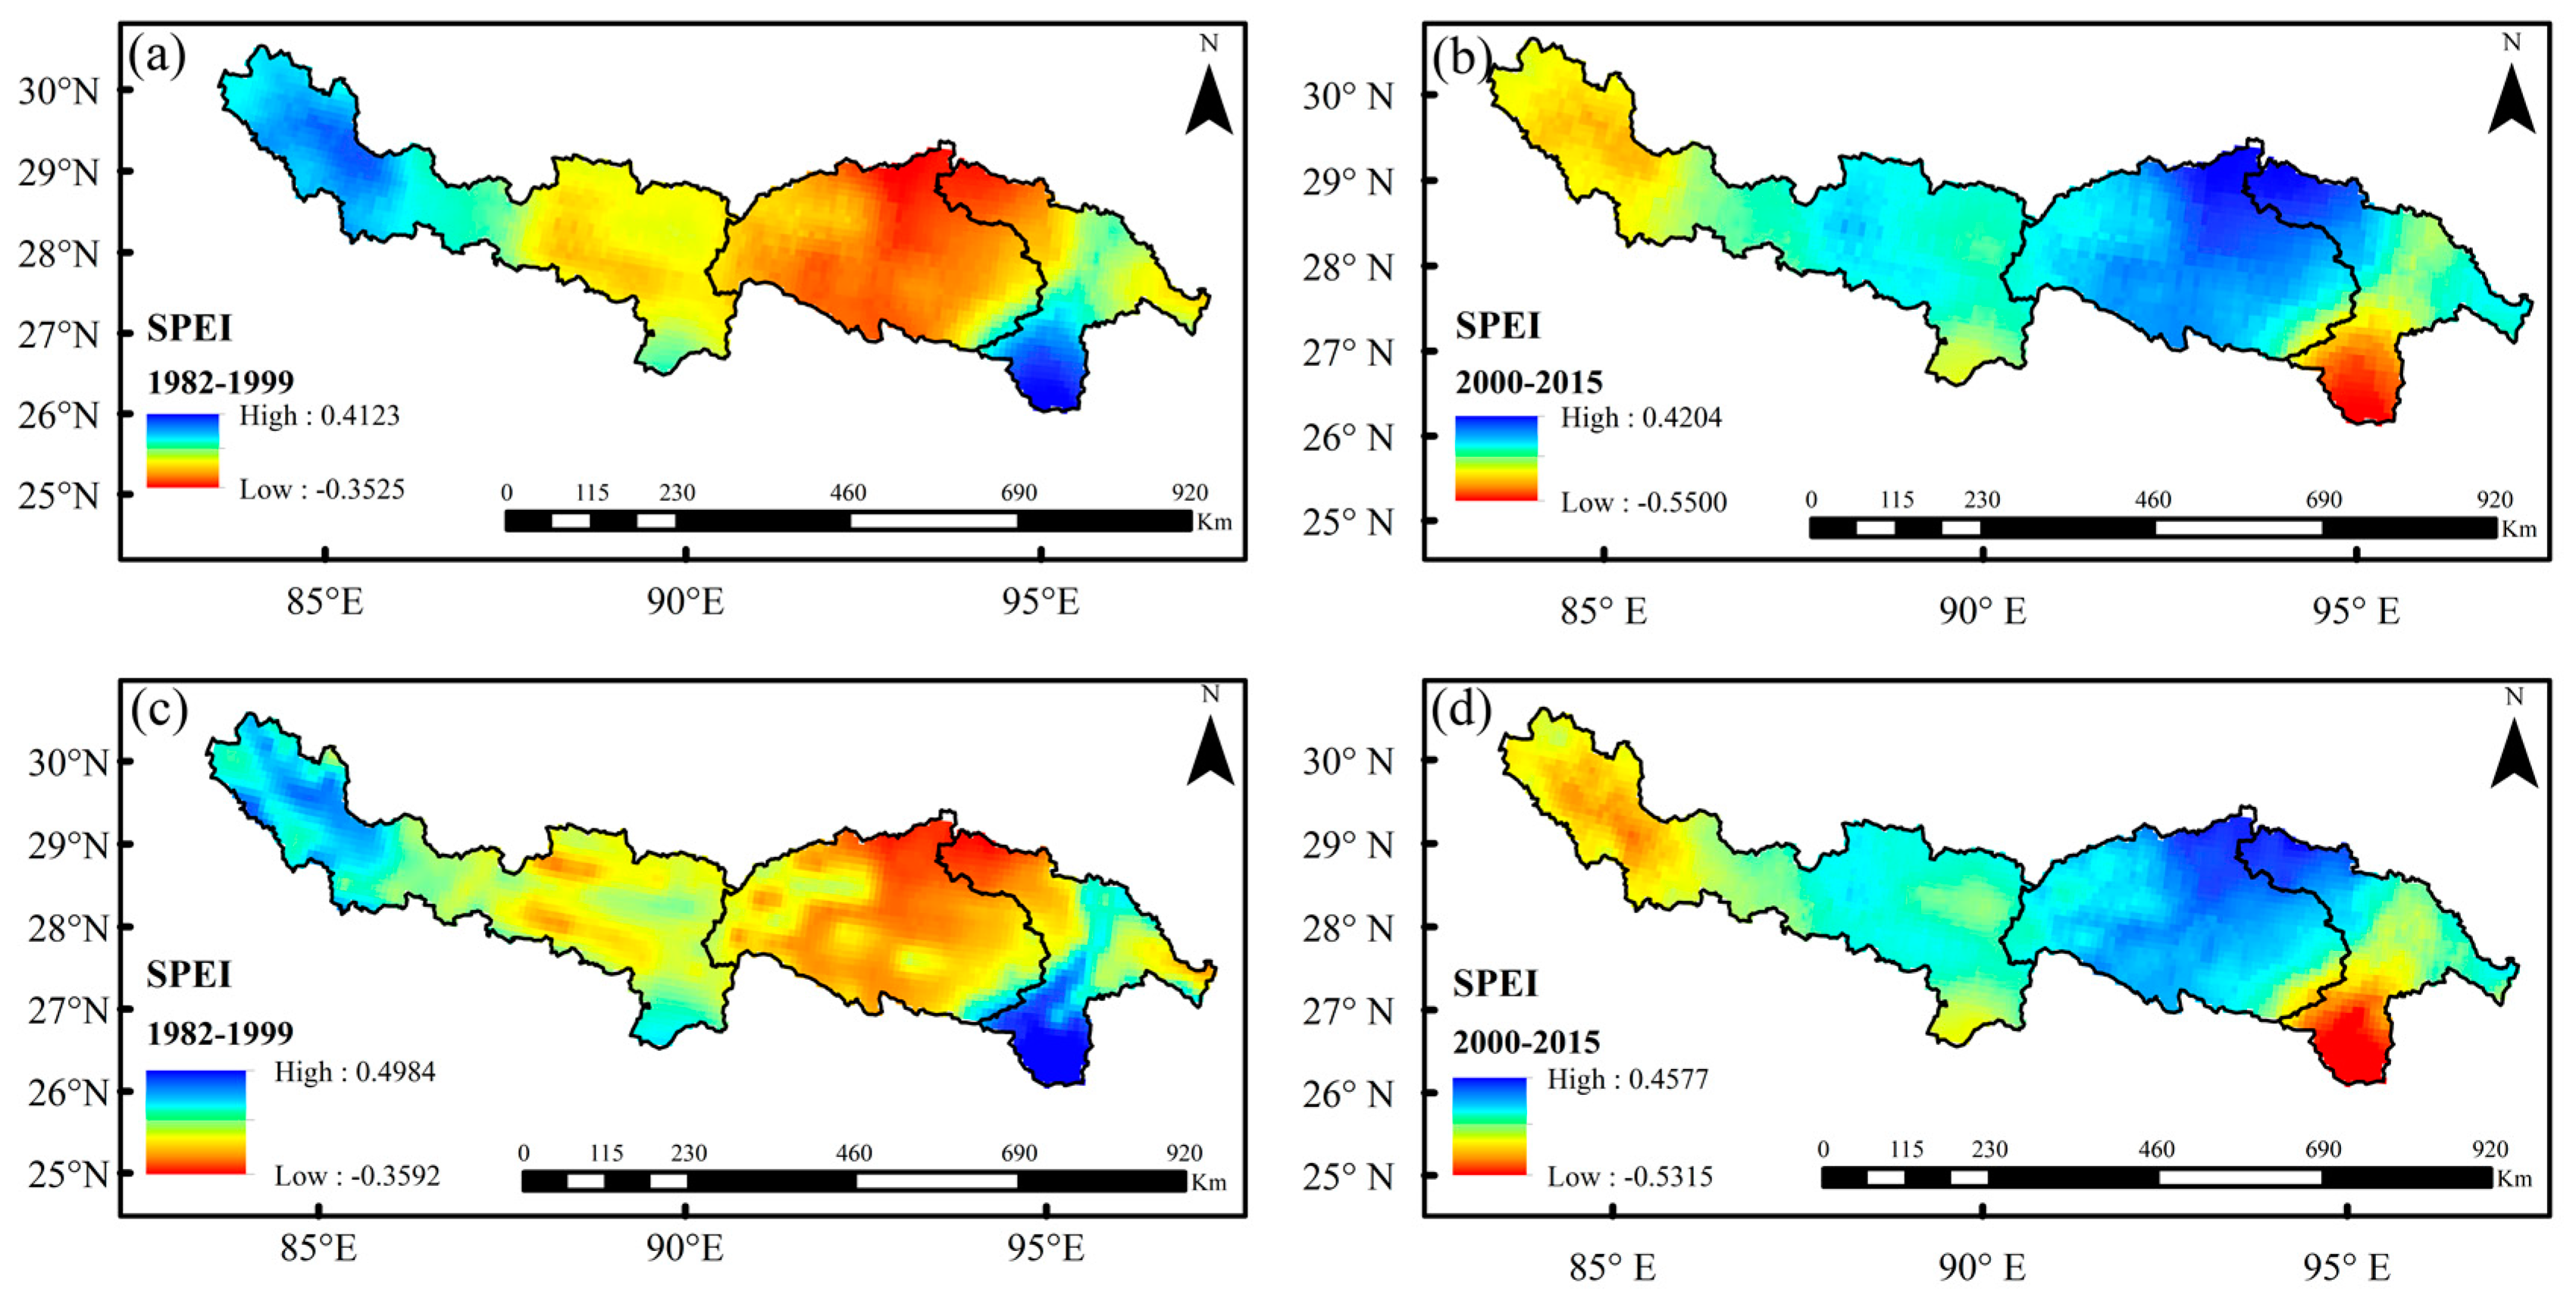
3.2. Transition Characteristics of the Dry-Wet Regime

The SPEI values at four time scales of 1-month, 3-month, 6-month, and 12-month were calculated from 1982 to 2015. SPEI 1 represented that when calculating monthly SPEI, the water deficit condition was taken into account only within the current month. SPEI 3 represented that the water deficit conditions of both the first two months and the current month were considered, and similar representations were used for SPEI 6 and SPEI 12. As shown in Figure 4 and Figure 5, the temporal variations of the SPEI at the four time scales representing the dry-wet conditions in the YZR basin showed that SPEI 12 exhibited the highest agreement with the NDVI at both the annual and growing seasonal (from May to September) scales (R ≥ 0.6), indicating that the highest dependency of the present dry-wet condition was on that of the preceding 12 months. In this study, SPEI 12 was used as the indicator to analyze the spatio-temporal variations of the dry-wet conditions at the annual and growing season scales in the YZR basin.
As shown in Figure 5, in terms of the annual time scale, the SPEI showed a significantly increasing trend with a rate of 0.07/decade from 1982 to 2015 (P < 0.1, n = 34), implying an overall wetting tendency in the YZR basin. However, Wang (2016) and Liu (2015) demonstrated that the precipitation, temperature, and potential evapotranspiration, which were closely related to the dry-wet conditions in the YZR basin, all changed significantly in the late 1990s [67,68]. In order to detect whether there was a transition from wet to dry during the 1990s in the YZR basin, the year of 2000 was taken as the turning point to investigate the variation characteristics of SPEI. Interestingly, the two periods divided by 2000 exhibited the opposite changing trends, i.e., the wetting period was from 1982 to 1999 with a slightly increasing rate of 0.225/decade (P > 0.1, n = 18), and the drying period was from 2000 to 2015 with a significantly decreasing rate of 0.25/decade (P < 0.1, n = 16). Compared to the variation trend of the annual SPEI, the growing season SPEI showed a relatively non-significantly increasing trend with a rate of 0.053/decade from 1982 to 2015 (P > 0.1, n = 34). The opposite changing trend before and after 2000 was also exhibited at the growing season scale, where there was a slightly increasing trend with a rate of 0.16/decade (P > 0.1, n = 18) from 1982 to 1999 and a slightly decreasing trend with a rate of 0.21/decade (P > 0.1, n = 16) from 2000 to 2015.
In order to explore the spatial evolution characteristics of the dry-wet regime in the YZR basin, the SPEI was divided into three categories according to Table 1, i.e., SPEI < −0.5 (Dry), −0.5 < SPEI < 0.5 (Normal), and SPEI > 0.5 (Wet). Figure 6 shows the area ratios occupied by the different ranges of SPEI from 1982 to 2015 in the YZR basin at both the annual and growing season scales. The proportions of the annual variation pattern of the dry, wet, and normal areas were consistent with those of the growing season. Unlike the temporal opposite variation trend that occurred before and after 2000, the spatial reversal phenomenon of the dry-wet regime occurred in the three-year wet period from 1999 to 2001. Before this wet period, the proportion of wet areas showed an increasing trend, while the proportion of dry areas declined, causing a wetting condition of the YZR basin. The dry-wet regime reversed after this period, which experienced a drying period as implied by the decrease in wet areas and the increase in dry areas.
The determination of the turning point of the dry-wet regime in the YZR basin was of great importance to conduct further investigation in this study. As the most direct evidence for the dry-wet condition at the river basin scale, runoff has been widely used to represent the dry-wet characteristics [69,70,71]. The Nuxia hydrological station located downstream of the YZR basin, controls about 80% of the drainage areas of the YZR basin, and its long-term variation of runoff could be used to effectively indicate the dry-wet transition in the YZR basin. In this study, time series of runoff from 1982 to 2015 at the Nuxia hydrological station were adopted to further detect the transition point of the dry-wet regime by using the Mann-Kendall nonparametric test. The results of the Mann-Kendall significance test showed that the runoff showed a significantly increasing trend from 1982 to 1999 (Zc = 1.89, P < 0.1), while the runoff exhibited a significantly decreasing trend (Zc = −1.76, P < 0.1) from 2000 to 2015. Meanwhile, there was no point detected from 1982 to 2015 that could divide the time series into two parts with a significantly increasing and decreasing trend respectively. Combining with the SPEI spatio-temporal variations, it could be concluded that there was a transition of the dry-wet regime in the YZR basin, which occurred at the year 2000.
To investigate the spatial variation of the dry-wet regime and given the high spatial heterogeneity of the climate conditions in the YZR basin, the spatial distributions of the mean annual and growing season SPEI before and after 2000 were interpolated by using the Kriging method (Figure 7). It could be seen that the annual spatial distribution of the SPEI showed a high consistency with that of the growing season during both periods (1982–1999 and 2000–2015). Before 2000, the dry areas were mainly located in the eastern upstream and midstream regions of the study area, while the western upstream and southeastern downstream regions were relatively wet. Similar to the temporal reversal phenomenon at the year of 2000, the spatial pattern of the SPEI also displayed a reversal phenomenon. The annual and growing season spatial distribution of the SPEI indicated that the spatial distribution of the dry-wet regime in the YZR basin before and after 2000 was opposite. According to Figure 5 and Figure 7, the overall wetting tendency of the YZR basin was mainly attributed to the remarkable wetting trend of the midstream region over the past 34 years, while the prominent trend of drying from 2000 to 2015 in the basin was ascribed to the fact that the western upstream and southeastern downstream turned drier.
To further explore the mechanism of the spatial reversal of the dry-wet regime in the YZR basin around 2000, the annual and growing season slopes of the SPEI from 1982 to 2015 with the significance test were analyzed at the pixel scale (Figure 8). It could be found that the western upstream and southeastern downstream regions in the YZR basin presented a gradually drying trend over the past 34 years, while the eastern upstream and midstream regions became wetter, which was consistent with characteristics shown in Figure 7. According to Figure 8a, the mean annual SPEI exhibited an upward trend (slope > 0) accounting for 55.07% of the total basin area, indicating a humidification process, whereas an opposite trend (slope < 0) occurred in the remainder of the basin. As shown in Table 5, the results of the significance test at the pixel scale indicated that the areas where the annual SPEI showed an extremely significant decrease and a significantly decreasing trend accounted for 10.9% and 2.3% of the total basin respectively, while the areas with an extremely significant increase and a significantly increasing trend of the annual SPEI accounted for 18.05% and 8.25% respectively, inducing an overall wetting process from 1982 to 2015 in the YZR basin. Similar to the annual SPEI, the growing season SPEI indicated a wetting trend (slope > 0) across 55.54% of the basin area, while a drying trend (slope < 0) occurred in the remaining areas. The results of the significance test for the growing season SPEI at the pixel scale indicated that the area proportions with an extremely significant decrease and a significant decrease in SPEI were 8.7% and 2.03% respectively, while the areas with an extremely significant increase and a significant increase in SPEI occupied 15.21% and 8.87% of the basin respectively.
Comprehensively taking the results of the temporal variations (Figure 5), spatial distribution characteristics (Figure 7), and trend analysis with the significance test (Figure 8) of the annual and growing season SPEI into account, the annual spatio-temporal variation characteristics of the SPEI were consistent with those of the growth season, which both showed a reversed phenomenon before and after 2000. In terms of the temporal variation, the YZR basin presented a wetting trend before 2000 and a drying trend after 2000, while from the perspective of the spatial pattern, the arid areas became wetter and humid areas became drier.

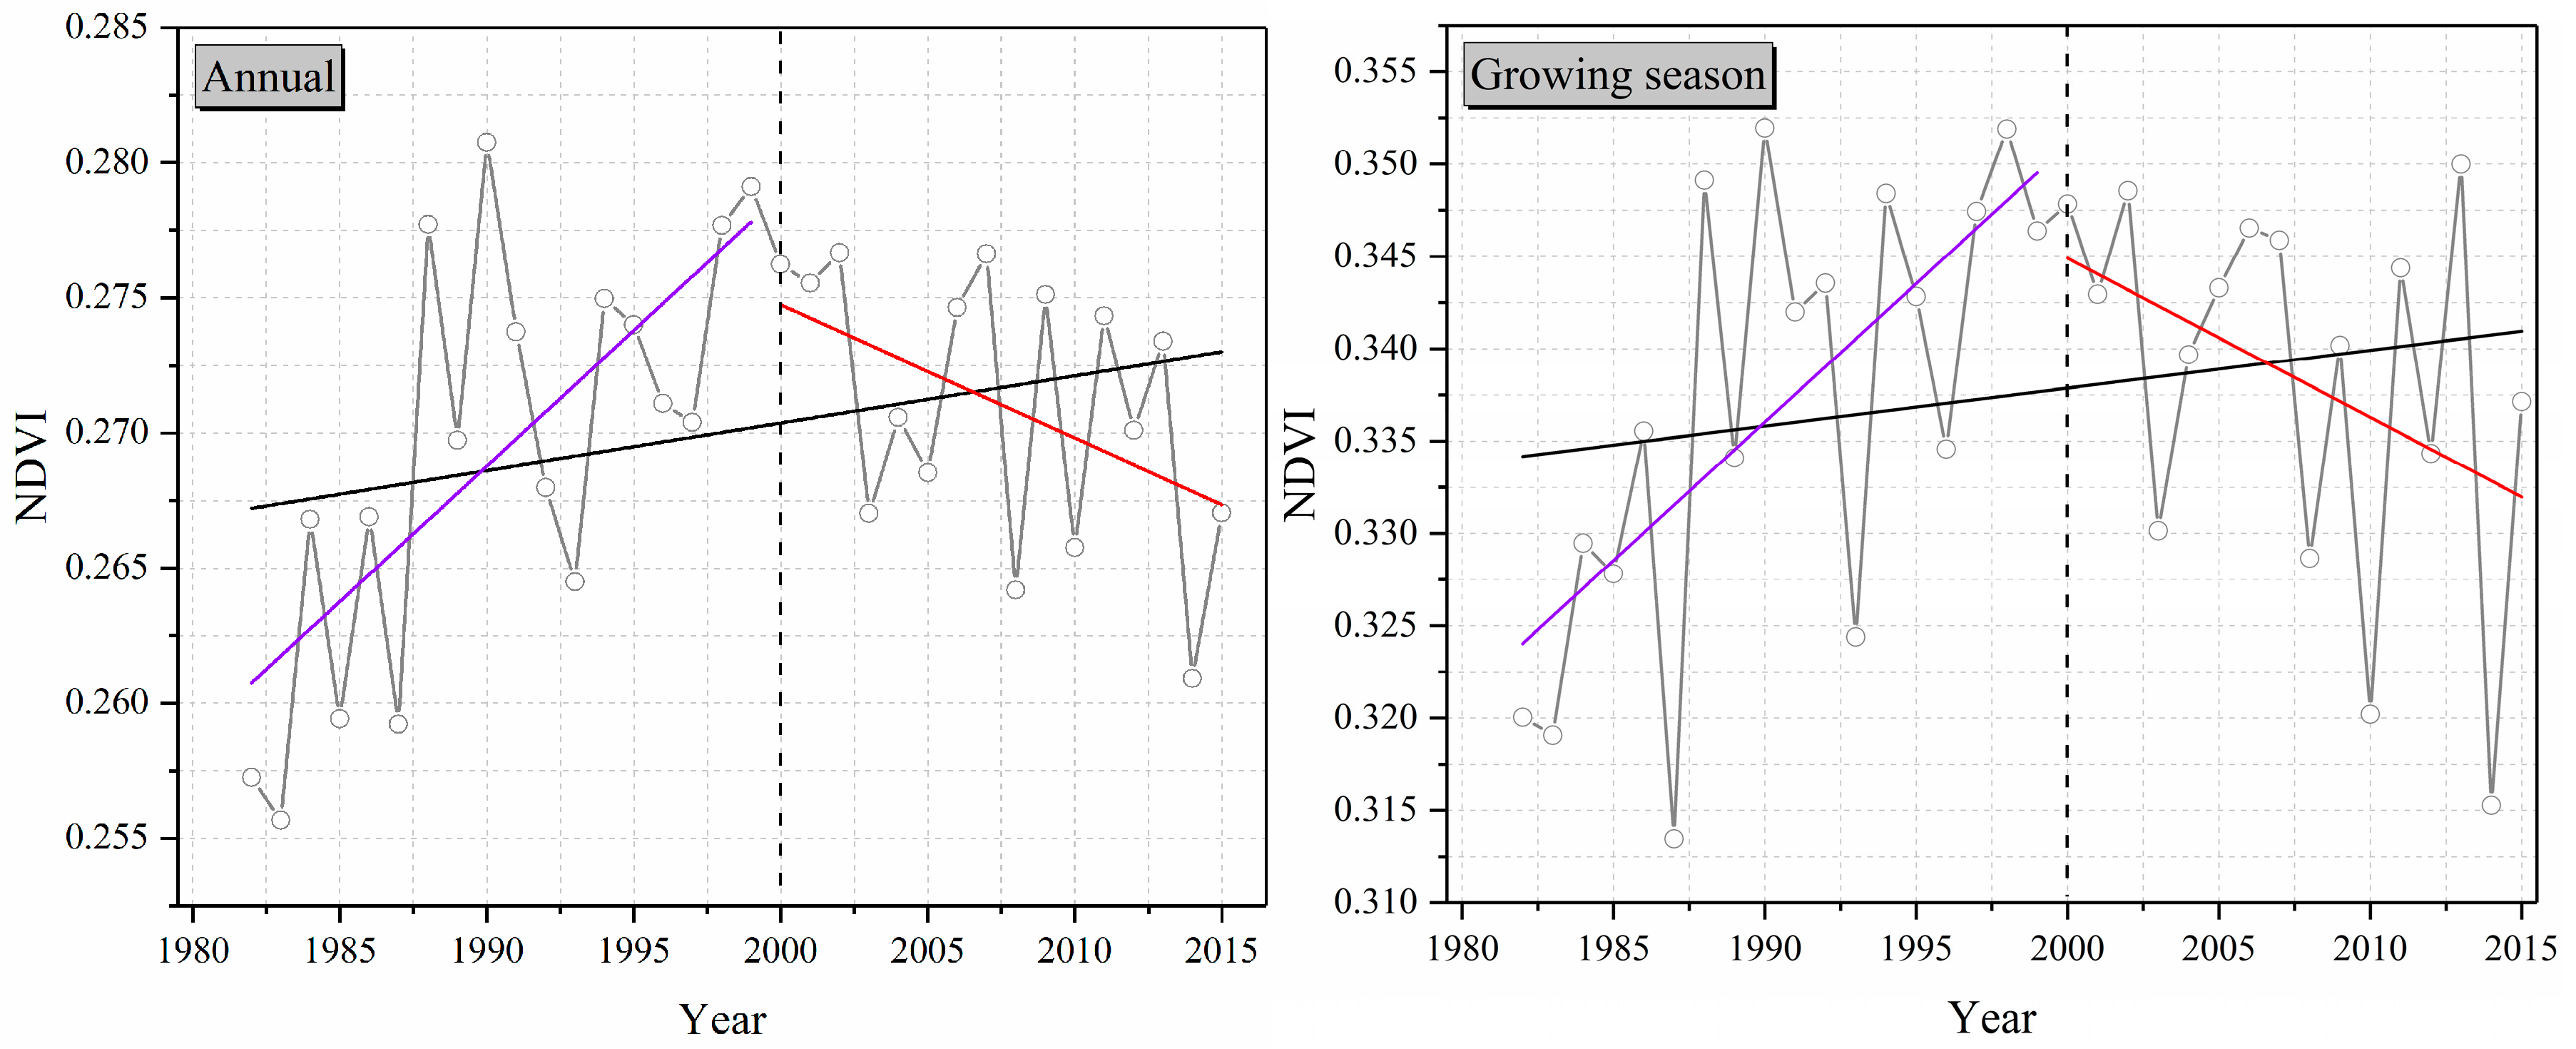
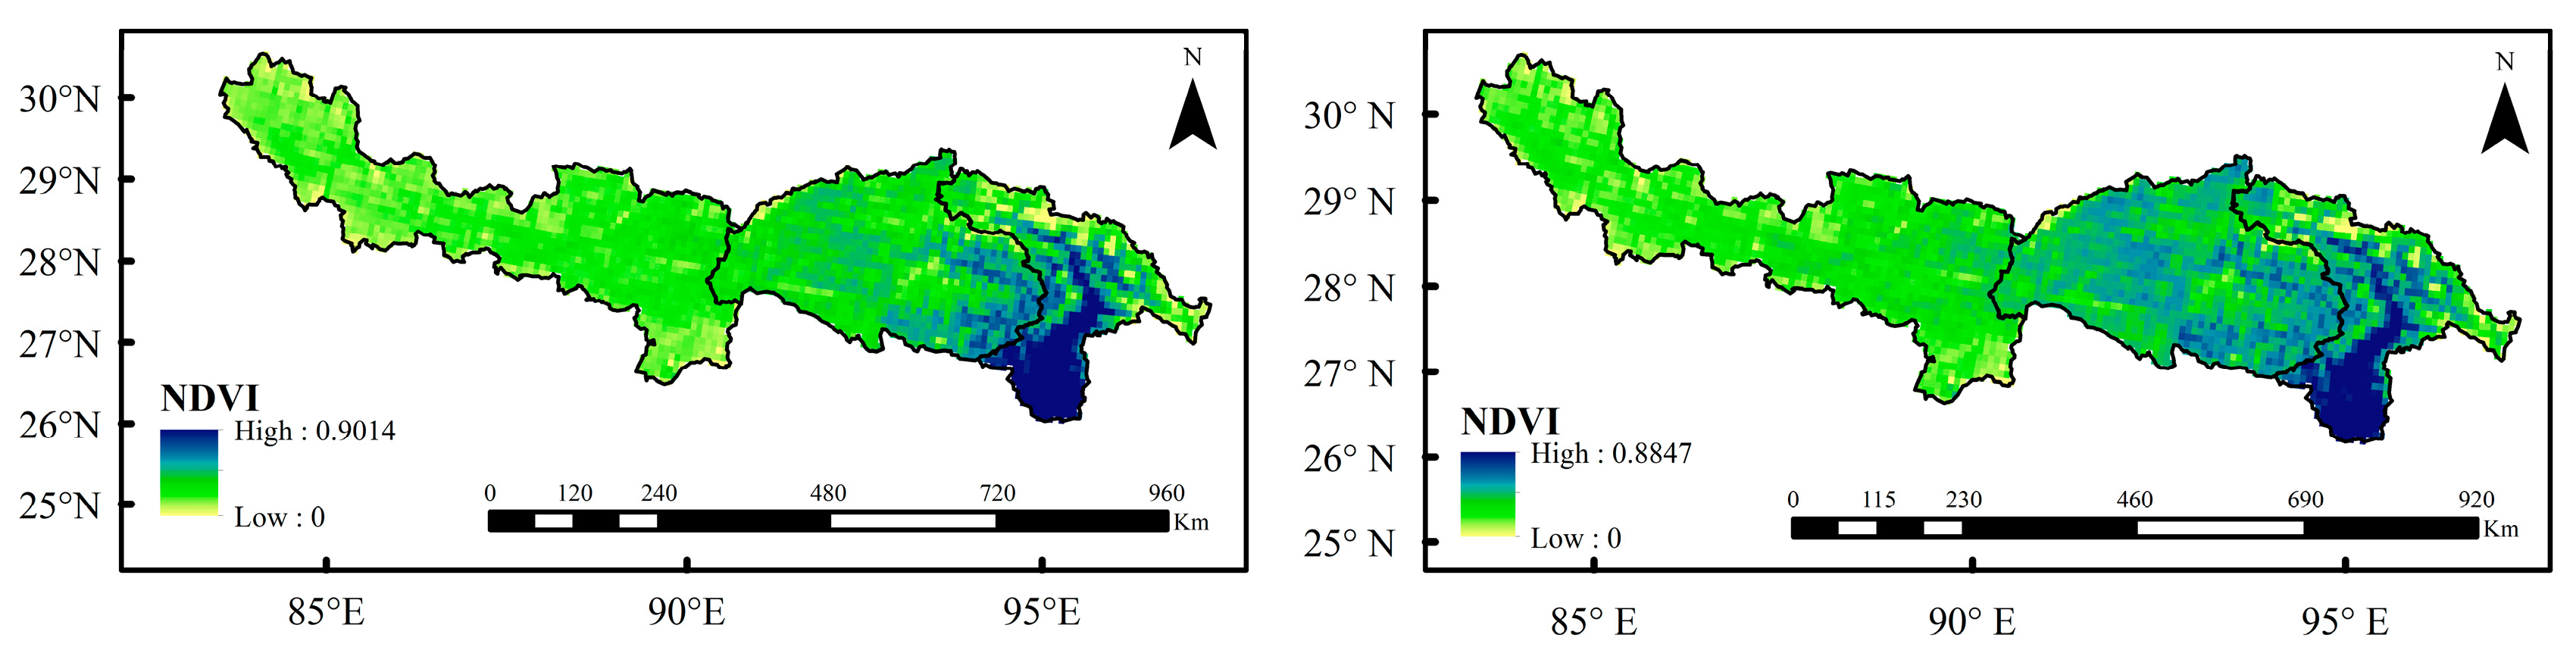
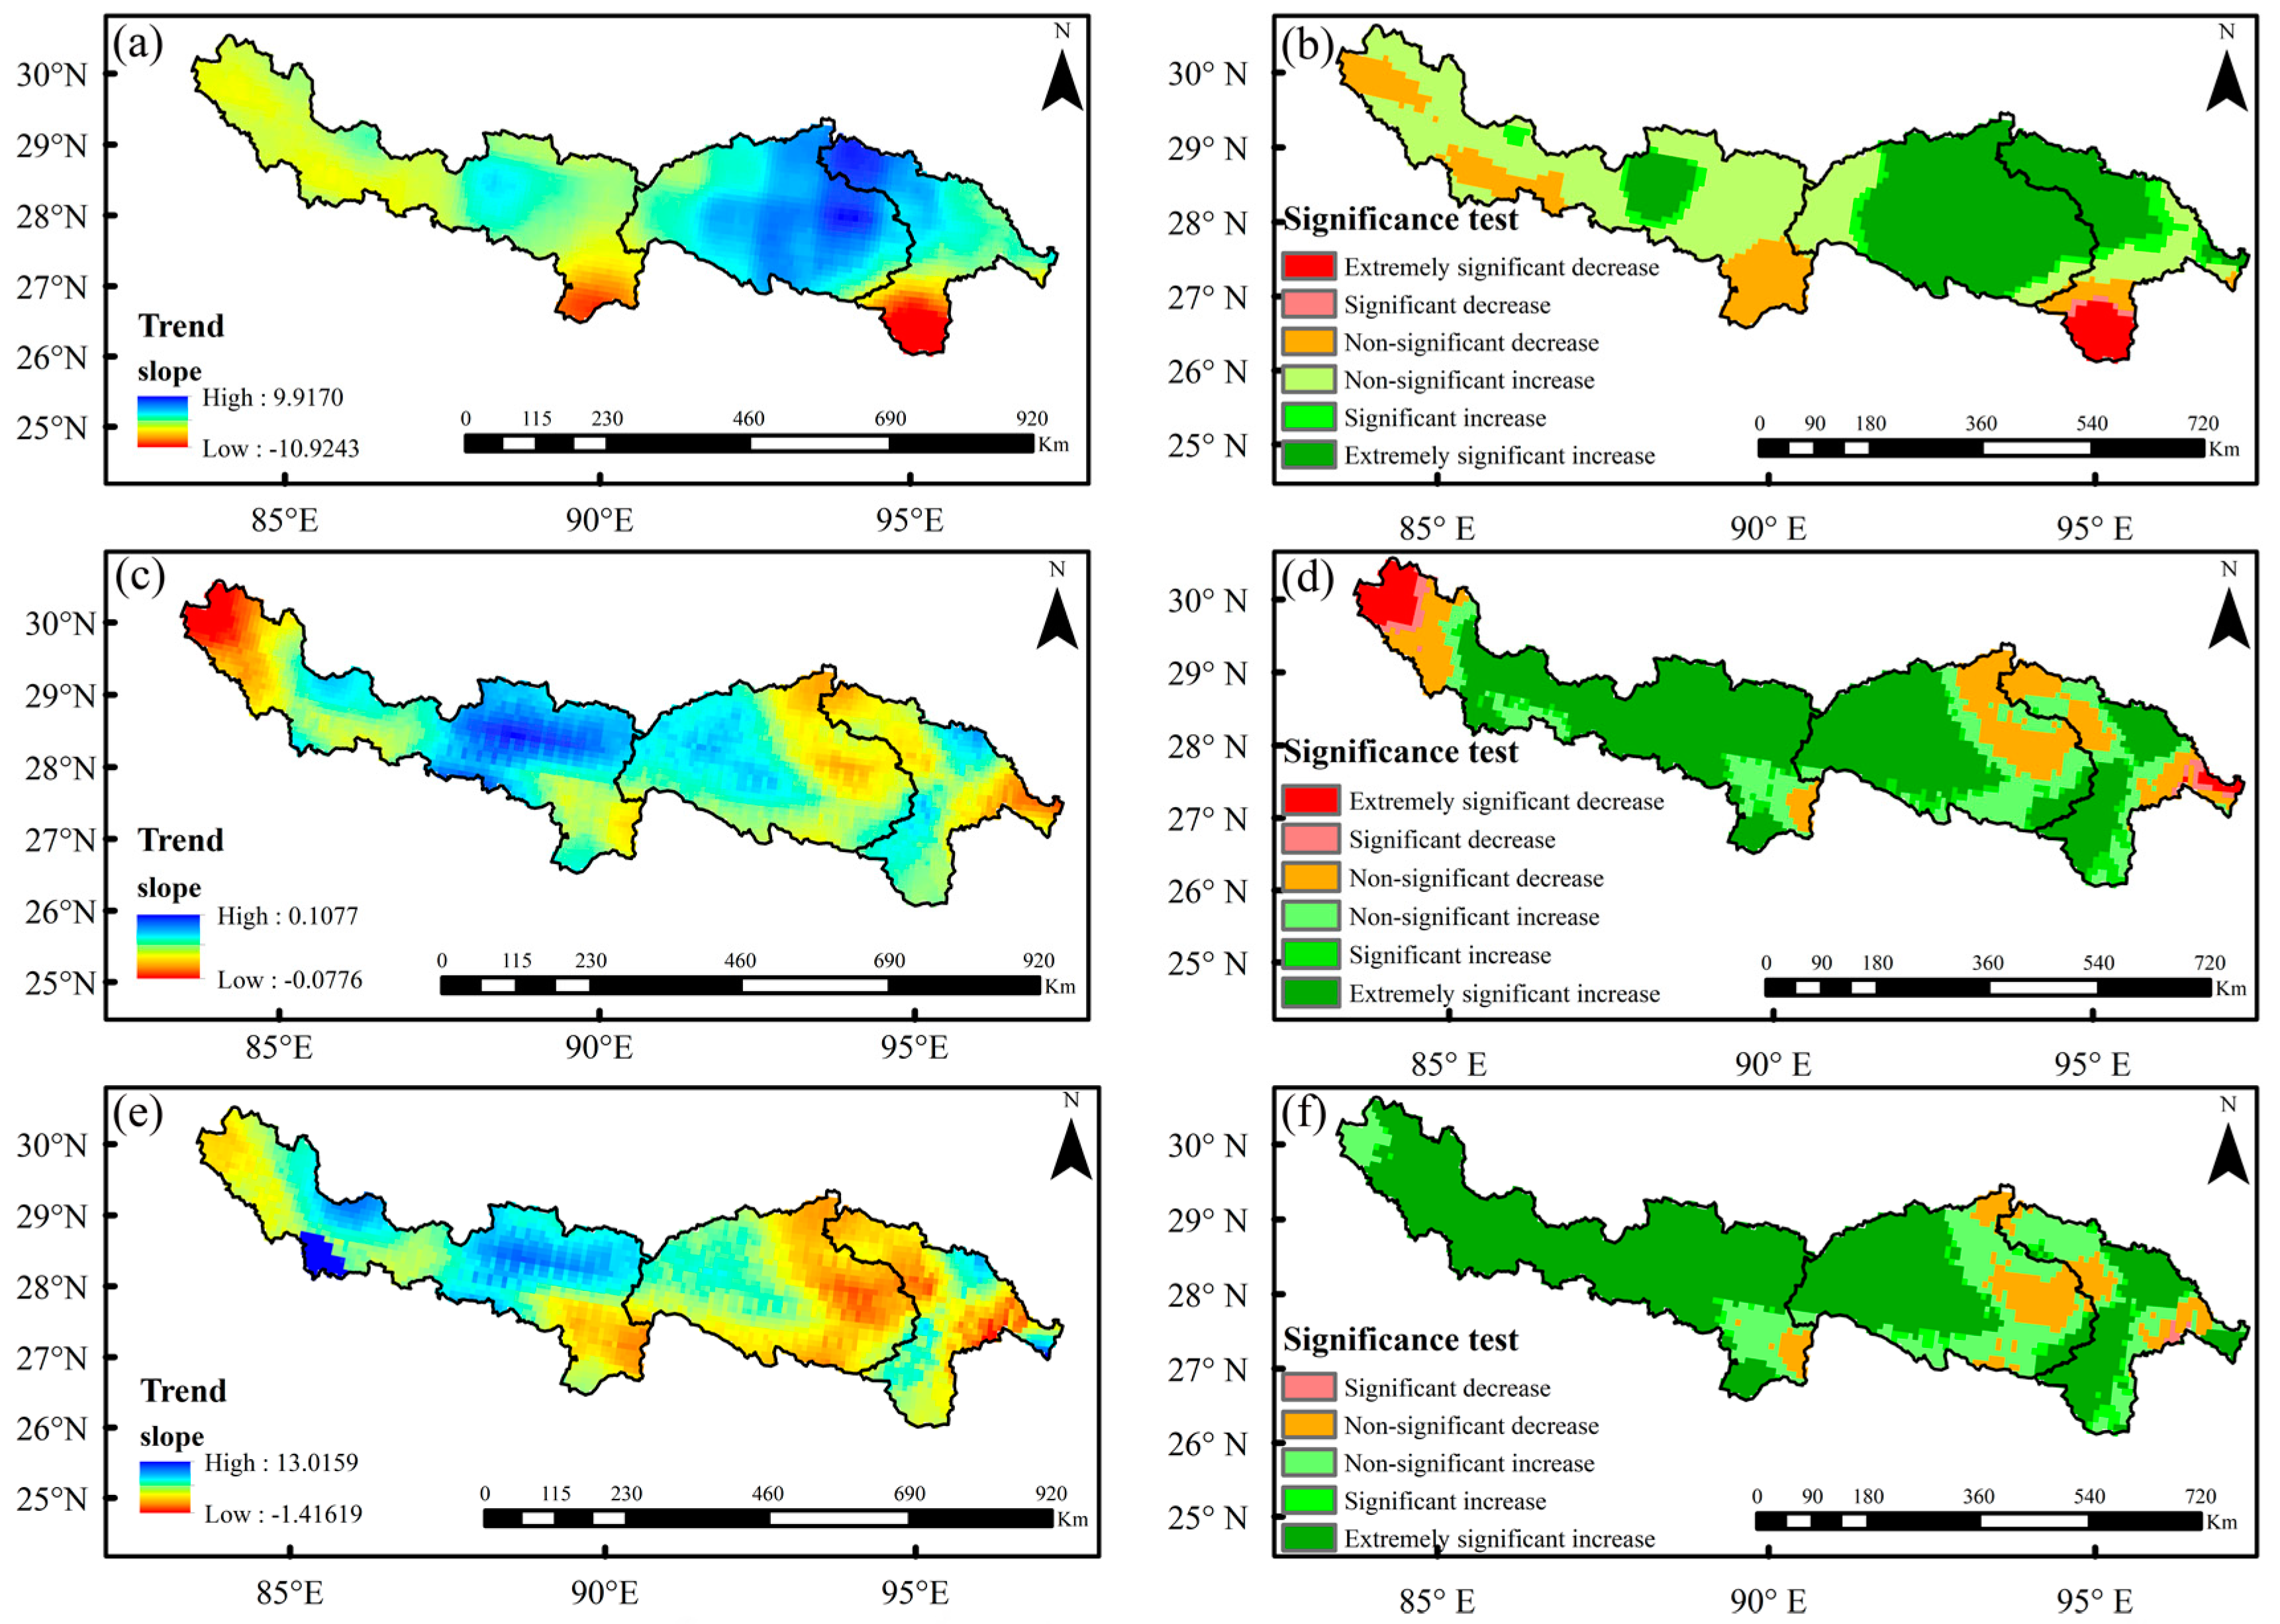
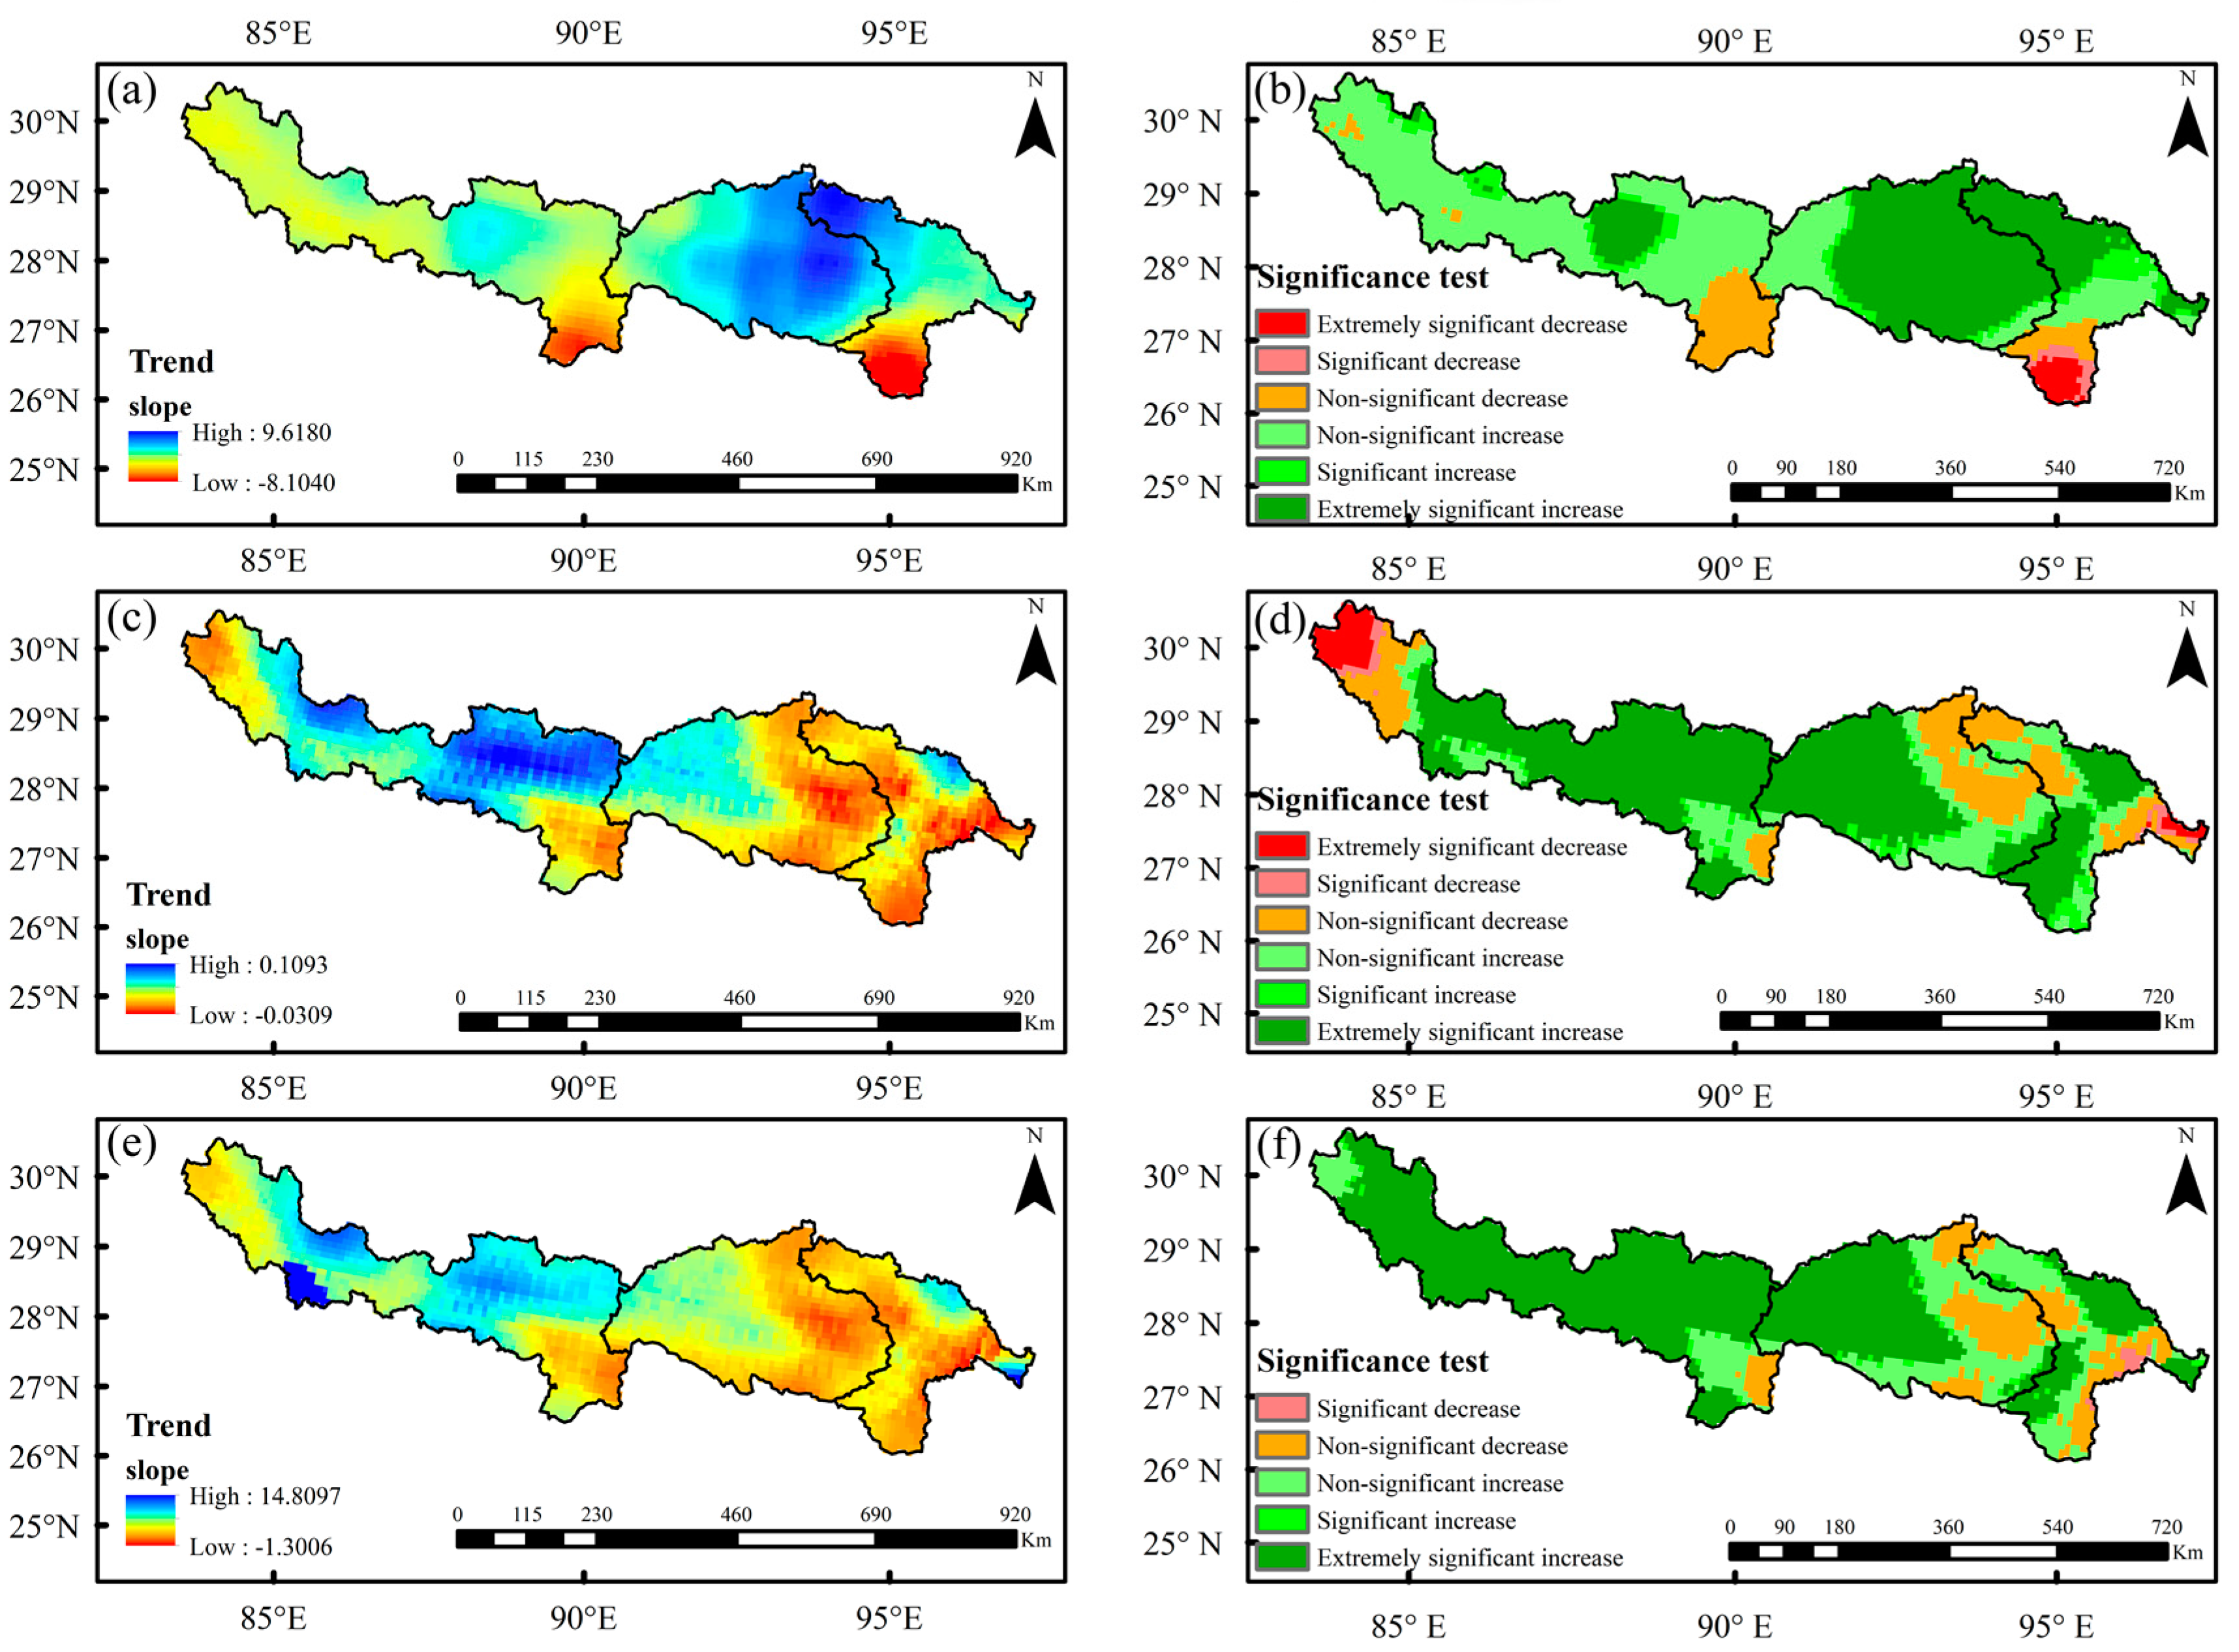
3.3. Spatio-Temporal Characteristics of Vegetation

Regarding 2000 as a turning point indicated by the transition of the dry-wet regime in the YZR basin, temporal variations of the annual and growing season NDVI were analyzed (Figure 9). The mean annual NDVI was 0.27, which fluctuated between 0.25 and 0.28 over the past 34 years and significantly increased at a rate of 0.002/decade (P < 0.1, n = 34), implying a gradual improvement of the vegetation cover in the YZR basin. However, the NDVI before and after 2000 showed a completely opposite tendency, that is, the NDVI increased significantly at a rate of 0.01/decade before 2000 (P < 0.1, n = 18), and decreased significantly at a rate of 0.006/decade after 2000 (P < 0.1, n = 16). With respect to the variations of the growing season NDVI, the mean NDVI was 0.34, which fluctuated between 0.31 and 0.35 during the past 34 years and increased non-significantly at a rate of 0.002/decade (P > 0.1, n = 34). Similar to the changes of the annual NDVI, the growing season NDVI before 2000 showed a significantly increasing trend at a rate of 0.015/decade (P < 0.1, n = 18), and a significantly decreasing trend at a rate of 0.009/decade after 2000 (P < 0.1, n = 16). To sum up, the NDVI-indicated vegetation in the YZR basin gradually improved from the perspective of the annual and growing season NDVI variations from 1982 to 2015. However, since the beginning of the 21st century, the vegetation cover has decreased noticeably which corresponds with the simultaneously drying tendency in the whole basin, demonstrating that the improvement of the vegetation cover before 2000 was mainly induced by the gradual wetting of the basin while the degradation of the vegetation cover was attributed to the drying of the basin after 2000.
The mean annual and growing season spatial distributions of the NDVI from 1982 to 2015 are portrayed in Figure 10. For the mean annual NDVI, the areas where the NDVI values ranged from 0.1 to 0.3 accounted for approximately 61.08% of the YZR basin, and were mainly located in the upper and middle reaches and high-altitude areas of the downstream regions. Only 5.59% of the area had an NDVI value above 0.7, and were largely concentrated in the midstream and southeastern downstream regions. From the perspective of the whole basin, the mean annual NDVI values gradually increased from northwest to southeast, implying a consistent improvement of the vegetation cover. The growing season vegetation cover indicated by the growing season NDVI exhibited a similar spatial distribution of the mean annual vegetation cover. The spatial variations of the NDVI-indicated vegetation in this study were similar to the vegetation cover dynamic monitoring results in the YZR basin reported by Jiang et al. [45].
The spatial characteristics of the variation trends for the mean annual and growing season NDVI indicated by the NDVI slope in the YZR basin from 1982 to 2015 are depicted in Figure 11a,c respectively. In terms of the mean annual NDVI, approximately 59.4% of the NDVI slope in the basin was greater than 0, denoting an increasing trend of the vegetation cover, while the slope of the NDVI in the remaining areas was less than 0, implying a degradation of the vegetation cover. As shown in Figure 11b, d and Table 6, the results of the significance test showed that the areas with an extremely significant decrease and significant decrease of NDVI accounted for 7.3% and 4.84% of the whole study area respectively, while the areas with a non-significant increase and non-significant decrease of NDVI took up 31.24% and 27.86% respectively, and the areas with an extremely significant increase and significant increase of NDVI mainly located in the middle reaches occupied 22.76% and 6.1% respectively. The growing season NDVI showed a similar variation characteristic with that of the annual NDVI, i.e., the areas with increased vegetation cover had a proportion of 57.13% while the NDVI slope of the other areas was less than 0, indicating the degraded vegetation cover.
In terms of the spatial variation characteristics for both the mean annual and growing season NDVI, it could be found that the vegetation cover upstream of the YZR basin seldom changed, which could be attributed to the specific land cover types in the upper reaches including the Gobi Desert, glaciers, and plateau meadows, which were less affected by climate change. However, in the midstream region, except for the high-altitude areas at the edge of the basin, the vegetation cover showed a dramatical upward tendency, while in the downstream region, except for the high-altitude areas such as Bomi, the vegetation cover presented a tendency of extremely significant decrease, which were consistent with the results obtained by Lv et al. [72]. Combined with the transition characteristics of the dry-wet regime in the YZR basin, it could be revealed that the vegetation cover increased in the midstream and eastern upstream regions where the climate became wetter, while the vegetation cover in the downstream and western upstream regions decreased where the climate turned drier.

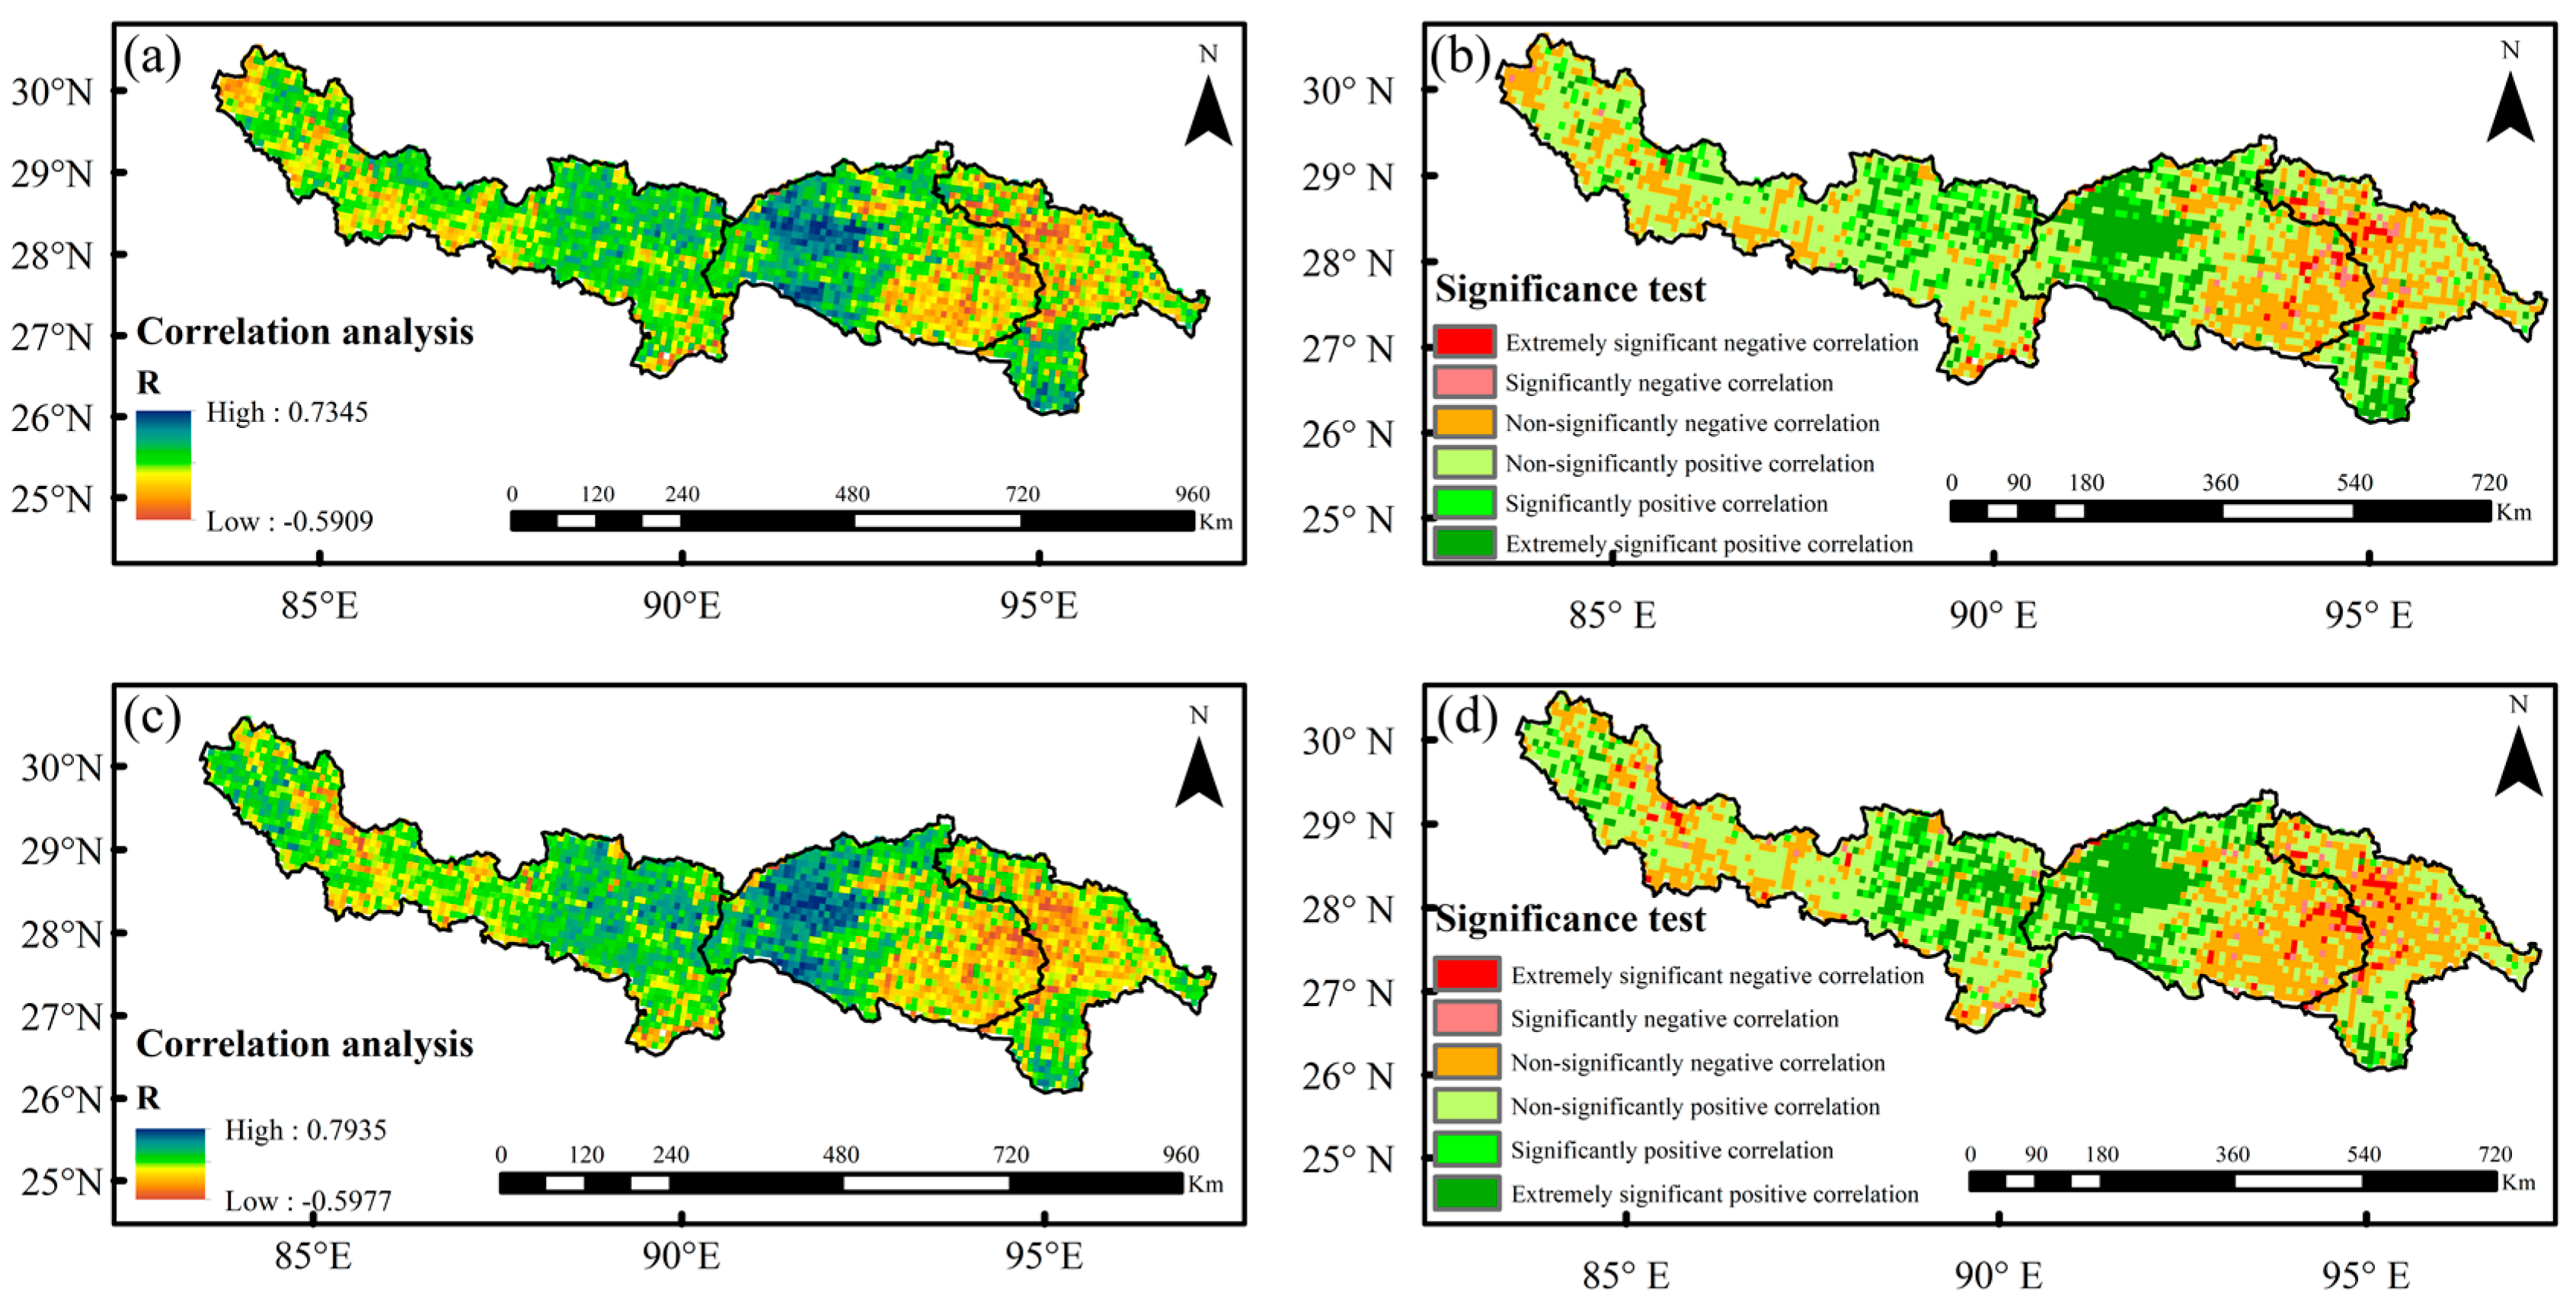
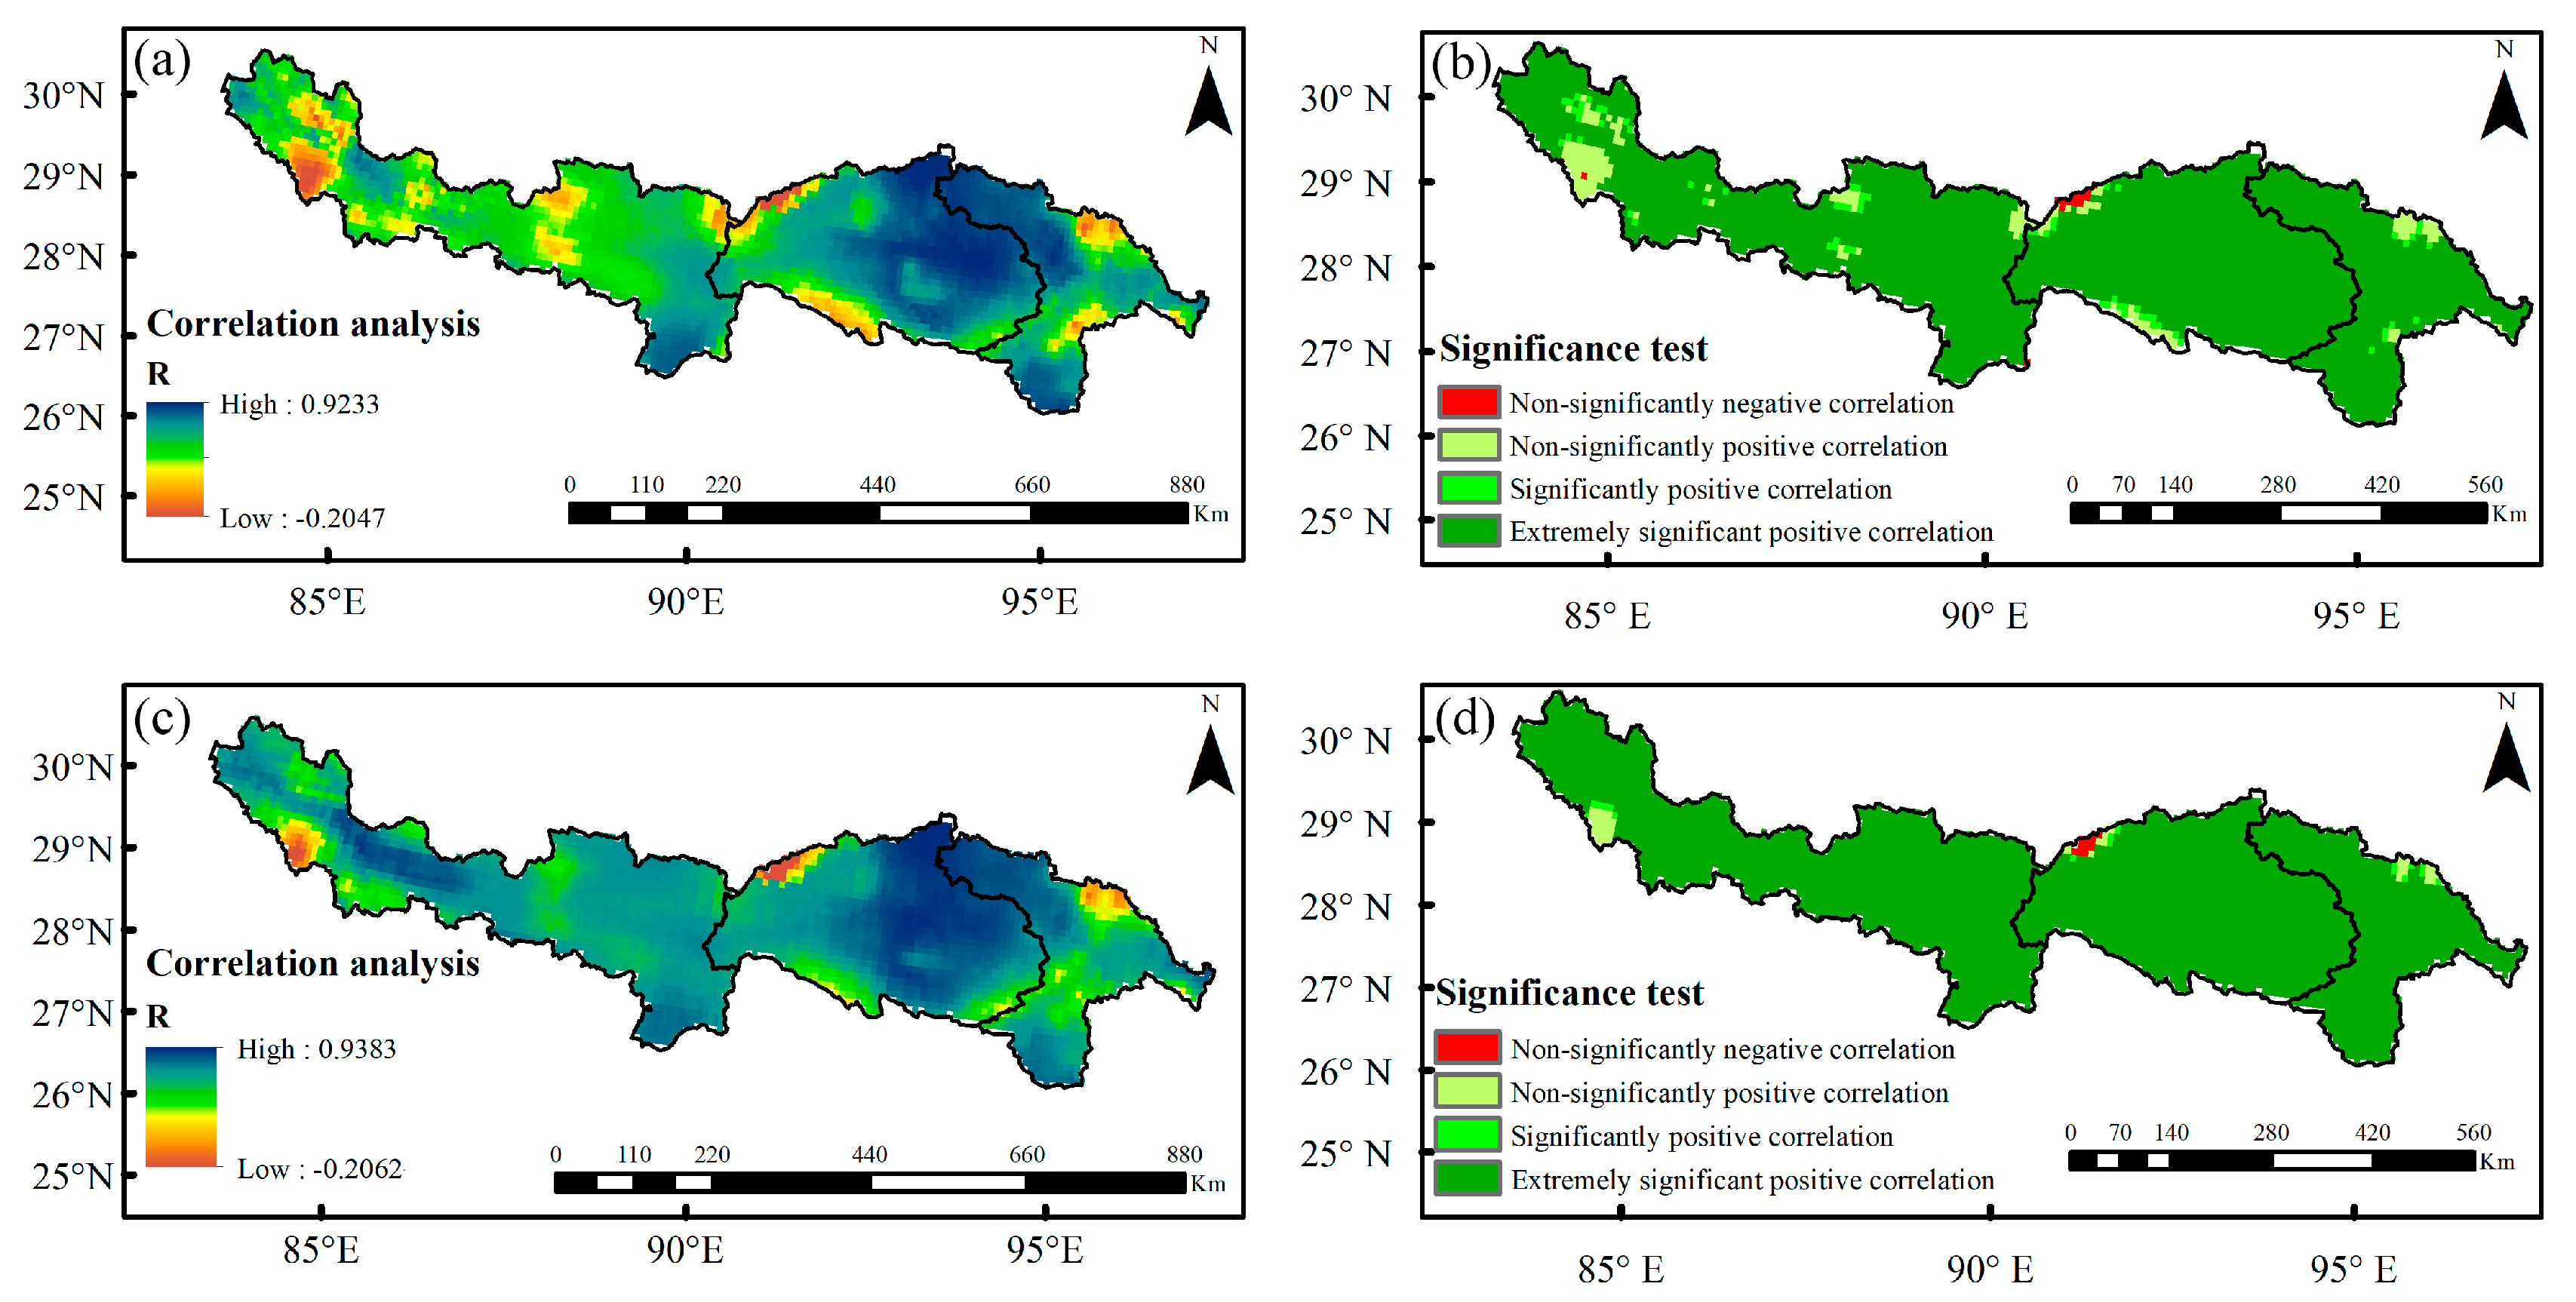
3.4. Response of the Vegetation to the Dry-Wet Transition

Based on the analysis results of the spatio-temporal evolution characteristics of the SPEI and NDVI, it could be seen that the vegetation cover was closely related to the dry-wet regime in the YZR basin. To further explore the influence of the dry-wet conditions on vegetation cover, a correlation analysis between the SPEI and NDVI for both annual and growing season from 1982 to 2015 at the pixel scale was conducted. As shown in Figure 12, about 71.57% of the basin area showed a positive correlation between the mean annual SPEI and NDVI, while the remaining areas exhibited no or negative correlations. The results of the significance test as shown in Table 7 demonstrated that the areas where the NDVI was extremely significantly negatively correlated and significantly negatively correlated with the SPEI accounted for 0.85% and 0.95% respectively, and were mainly located in the eastern midstream and northwestern downstream regions. The areas showing a non-significantly positive correlation and non-significantly negative correlation between the NDVI and SPEI took up 56.28% and 26.37% of the basin area respectively, and were mainly concentrated in the western upstream and part of the midstream regions. In addition, the areas where the NDVI was extremely significantly positive and significantly positively correlated with the SPEI occupied 10.28% and 5.27% of the basin respectively, and were mostly concentrated in the junctions of the middle and upper reaches and the southeastern downstream regions. As for the correlation analysis between the growing season NDVI and SPEI, approximately 65.96% of the total area presented a positive correlation. The results of the significance test indicated that the areas showing an extremely significantly negative correlation and a significantly negative correlation between the NDVI and SPEI took up 1.36% and 1.55% respectively, while the areas where the NDVI showed a non-significantly positive correlation and a non-significantly negative correlation with the SPEI accounted for 49.62% and 30.98% respectively. The extremely significantly positive and significantly positive correlation between the NDVI and SPEI accounted for 10.73% and 5.8% of the total area respectively.
By combining the temporal variations (Figure 5 and Figure 9) with the spatial distributions of the variation trends (Figure 8 and Figure 11) for the SPEI and NDVI, it was unequivocal that the spatio-temporal variation characteristics of the SPEI were consistent with those of the NDVI in the YZR basin, implying the important role of the dry-wet conditions on the vegetation dynamic variations. In terms of the temporal variation, before 2000, the YZR basin exhibited a wetting tendency and simultaneously the vegetation cover increased, while a tendency of drying was presented after 2000, and the vegetation cover consistently decreased. Such a synchronization phenomenon was also revealed from the perspective of the spatial distribution where the western upstream and southeastern downstream regions showed a drying trend with decreasing vegetation cover, while the midstream and eastern upstream regions displayed a wetting trend with increasing vegetation cover.

4. Discussion

4.1. Implication of the Soil Water Content for the Dry-Wet Regime

The soil water content is the link between the water cycle, carbon cycle, and energy cycle [73]. It is also a key factor in associating vegetation growth with precipitation [74]. Although drought is are caused by the below-average level of precipitation over a long period of time, it is also accompanied by the rising temperature, decreasing atmospheric humidity, increasing evapotranspiration, and declining soil water content [75]. Moreover, the soil water content is an important indicator of drought which could be used to efficiently identify dry-wet conditions, and the acquaintance of the soil water content variation is of great significance to agricultural production, ecological environment, resource allocation, and social-economic development in China [76]. To further identify the spatio-temporal characteristics of the dry-wet transition in the YZR basin, the soil water content variation associated with the SPEI was investigated in this study. The soil water content was characterized by the sum of soil moisture in four soil layers (0–10 cm, 10–40 cm, 40–100 cm, and 100–200 cm) extracted from the GLDAS-NOAH dataset, which was represented by the water depth in millimeters.

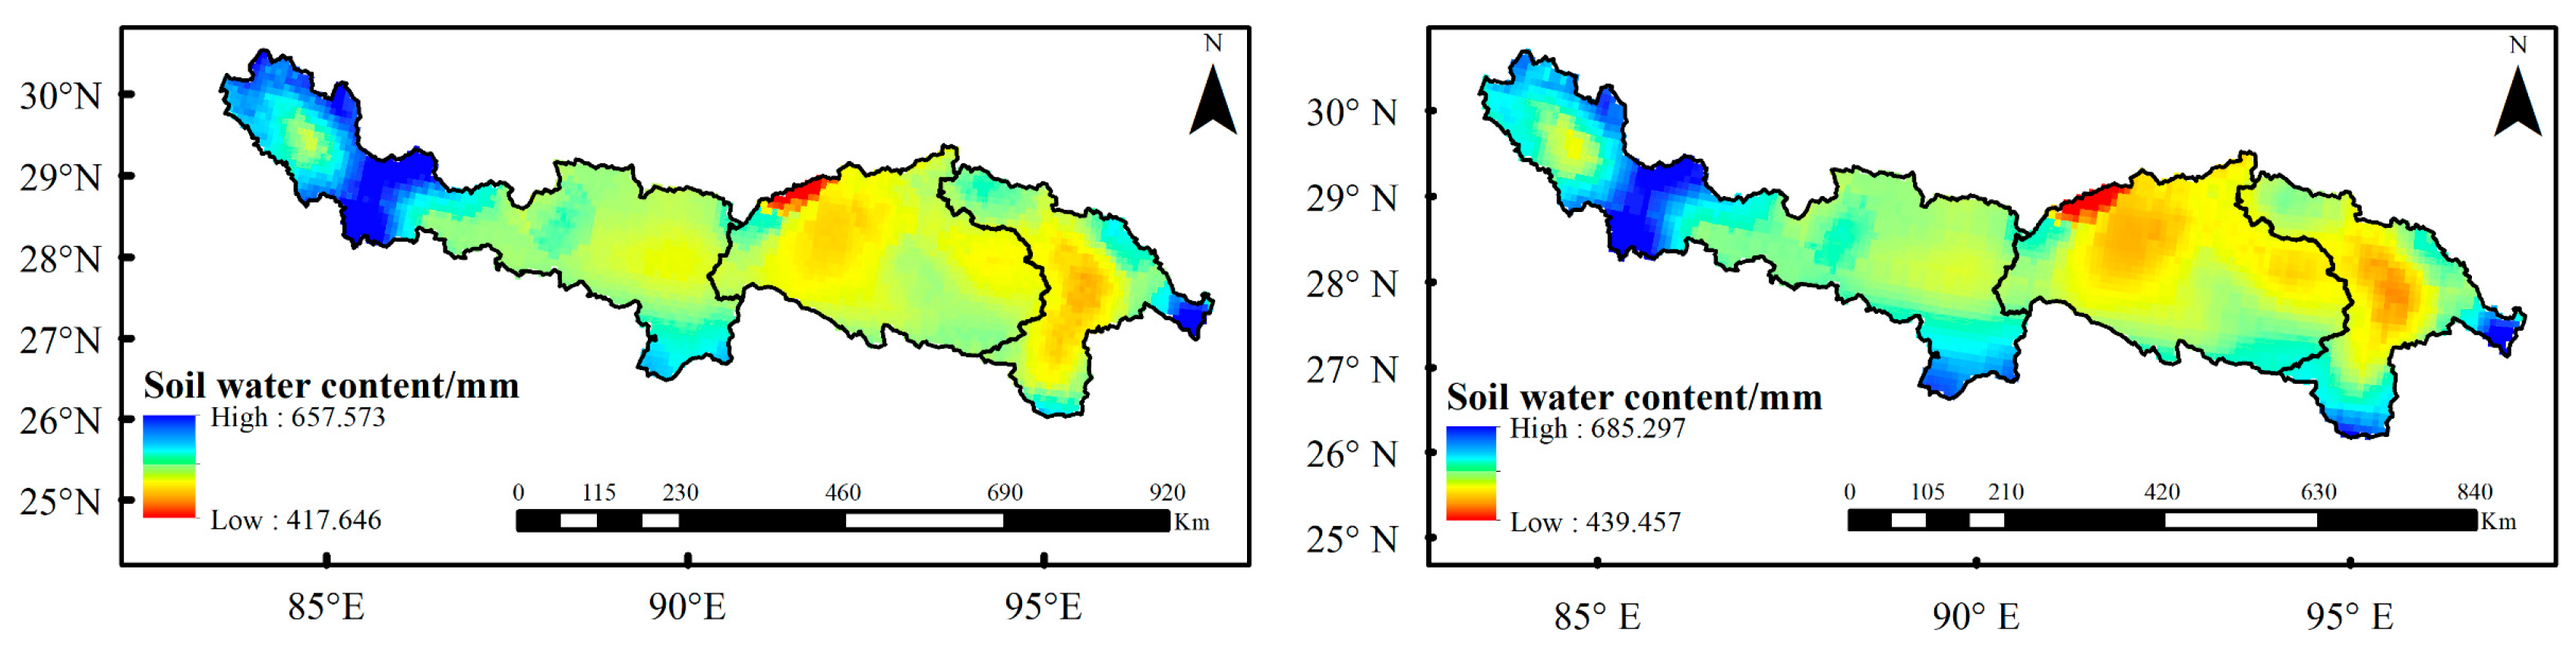
4.1.1. Spatio-Temporal Variation of the Soil Water Content

The spatial distributions of the mean annual and growing season soil water content in the YZR basin are shown in Figure 13. It could be seen that the regions with higher soil water content were mainly concentrated in the high-altitude areas such as the western upstream and the boundary of the middle and lower reaches. Except for the above areas, the soil water content decreased gradually from northwest to southeast. To analyze the spatial variation trend of the soil water, the slope was calculated at the pixel scale by utilizing the mean annual and growing season soil water content from 1982 to 2015. As shown in Figure 14, the regions with higher soil water content showed a downward tendency, while the regions with lower soil water content exhibited an increasing trend, which was consistent with the spatio-temporal variations of the SPEI. According to the results of the significance test, the areas showing an extremely significant decrease and significant decrease in soil water content were mostly distributed in the upstream and southeastern downstream regions. The areas with a non-significant increase and non-significant decrease in soil water content accounted for a small percentage of the total basin, and were mainly concentrated in Gongga, Lhasa, and Namling, while the areas where the soil water content increased significantly and extremely significantly were mainly situated in the midstream and northern downstream regions.

4.1.2. Relationship Between the Soil Water Content and SPEI

In order to further elaborate on the transition of the dry-wet regime in the YZR basin during 1982–2015, the correlation analysis with the significance test between the annual and growing season soil water content and SPEI are illustrated in Figure 15. The correlation coefficient between the mean annual soil water content and the SPEI ranged from −0.204 to 0.923 in the basin, and nearly 99.59% of the total area showed a positive correlation between the soil water content and the SPEI. According to the results of the significance test, the area where the soil water content was extremely significantly positively correlated with the SPEI in the basin accounted for approximately 92.17% of the basin area. The correlation coefficient between the growing season soil water content and SPEI ranged from −0.206 to 0.938, and the soil water content was positively correlated with the SPEI in nearly 99.65% of the basin area, among which the areas with an extremely significant positive correlation reached 97.66%. Such close relationship between the soil water content and SPEI indicates the significantly important role of the soil moisture for identifying the dry-wet condition in the YZR basin [56,67,76].

4.2. Possible Climatic Drivers for the Dry-Wet Regime

The dry-wet transition is a comprehensive effect of climate change. Global warming leads to an increase in the terrestrial temperature, while the rising temperature also generates an increase in evapotranspiration, which results in drought and other meteorological disasters [77]. To further investigate the possible physical mechanism of the reversal phenomenon of the dry-wet regime in the YZR basin before and after 2000, the spatial distributions of variation trends for the mean annual and growing season precipitation, temperature, and potential evapotranspiration (PET) were comparatively analyzed. As shown in Figure 16 and Figure 17, the spatial variation trends of the annual and growing season precipitation, temperature, and PET during 1982–2015 showed identical consistencies in the YZR basin, i.e., the precipitation in the western upstream and southeastern downstream gradually decreased, while the temperature and PET exhibited an increasing trend in the same areas; the increasing trends of the precipitation, temperature, and PET all occurred in the western upstream and eastern midstream; and a tendency for the increase in precipitation in the eastern midstream appeared, while there was a declining tendency for temperature and PET. Compared to the spatial variation characteristics of the SPEI (Figure 7 and Figure 8), in the humid regions within the basin, the precipitation presented an increasing trend while the temperature and PET showed a decreasing trend, whereas, the reversal phenomenon occurred in the arid region within the basin, i.e., there was a decreasing trend in the precipitation and an increasing trend in the temperature and PET. To sum up, the spatial distributions and variation trends with the significance test of the precipitation, temperature, PET, and soil water content showed high consistencies with those of the dry-wet regime indicated by the SPEI in the YZR basin, especially the soil water content.

5. Conclusions

Based on the performance evaluation of the GLDAS-NOAH data by using the in-situ data from 20 gauging meteorological stations, the transition characteristics of the dry-wet regime in the YZR basin indicated by the SPEI and runoff were identified, which were combined with the satellite-based NDVI to investigate the dynamic responses of the vegetation. The hydro-meteorological factors including the soil water content, precipitation, surface air temperature, and PET were taken into consideration to explore the possible driving mechanisms of the dry-wet transition from 1982 to 2015 and the comprehensive impacts on vegetation dynamic variations. The conclusions are as follows:
(1) During the period of 1982–2015, the precipitation and surface air temperature simulated by the GLDAS-NOAH both showed high consistencies with the in-situ observed data in terms of the spatial and temporal variation patterns, implying a reasonable performance of the GLDAS-NOAH data in the YZR basin.
(2) The transition characteristics of the dry-wet regime indicated by the SPEI from 1982 to 2015 revealed that the YZR basin presented an overall wetting tendency, while the spatial and temporal characteristics of the dry-wet conditions reversed before and after 2000, that is, the basin showed a wetting trend before 2000 and a drying trend after 2000; the arid areas in the basin showed a tendency of wetting, whereas the humid areas exhibited a trend of drying.
(3) The NDVI-based vegetation in the YZR basin exhibited an overall increasing trend during 1982–2015, implying an improvement in the vegetation cover. However, a simultaneously reversal phenomenon of the vegetation variation was also detected before and after 2000, i.e., the vegetation cover in the basin increased before 2000 and decreased after 2000. From the perspective of spatial distribution, the area with higher NDVI values showed a degrading trend of vegetation cover, while the areas with lower NDVI values presented a greening trend with the improvement of vegetation cover.
(4) Approximately 70% of the basin area showed a positive correlation between the SPEI and NDVI, and were mainly located in the middle and lower reaches with high vegetation cover. However, the proportion of areas showing a negative correlation between SPEI and NDVI was small and not statistically significant. The high consistencies between the spatial and temporal variation characteristics of the NDVI and SPEI indicated that the dry-wet conditions played an important role in vegetation variations in the YZR basin.
(5) The investigation of possible driving factors for the dry-wet regime demonstrated that the spatial distributions and variation trends with the significance test of the precipitation, temperature, PET, and soil water content showed high consistencies with those of the dry-wet regime indicated by the SPEI in the YZR basin, emphasizing a great necessity to explore the physical mechanism of the dry-wet transition associated with the vegetation dynamics.

Author Contributions

Conceptualization, L.L.; methodology, L.L. and J.H.; software, J.H.; validation, Q.N., J.H. and L.L.; formal analysis, Q.N. and J.H.; investigation, Q.N. and J.H.; resources, L.L.; data curation, J.H. and H.L.; writing—original draft preparation, L.L and Q.N.; writing—review and editing, L.L. and H.L.; visualization, Q.N., J.H. and H.L.; supervision, L.L.; project administration, L.L. and Z.X.; funding acquisition, L.L. and Z.X.

Funding

This research was financially supported by the National Natural Science Foundation of China (91647202, 41890822, 51509247).

Acknowledgments

Thank the National Meteorological Information Center of China Meteorological Administration for archiving the observed climate data (http://data.cma.cn/). Thank the GIMMS team and the Global Land Data Assimilation System team for making the data freely available. Authors have great thanks to the anonymous reviewers for providing so valuable comments.

Conflicts of Interest

The authors declare no conflict of interest.

References

  1. Shen, Y.P.; Wang, G.Y. Key Findings and Assessment Results of IPCC WGI Fifth Assessment Report. J. Glaciol. Geocryol. 2013, 35, 1068–1076. [Google Scholar] [CrossRef]
  2. Vaughan, D.G.; Comiso, J.C.; Allison, I.; Carrasco, J.; Kaser, G.; Mote, P.; Murray, T.; Paul, F.; Ren, J.; Rignot, E.; Solomina, O.; Steffen, K.; Zhang, T. Observations: Cryosphere 2013. In Contribution of Working Group I to the Fifth Assessment Report of the Intergovernmental Panel on Climate Change; Stocker, T.F., Ed.; Cambridge University Press: Cambridge, UK.
  3. Ziegler, A.D.; Sheffield, J.; Maurer, E.P.; Nijssen, B.; Lettenmaier, D.P. Detection of Intensification in Global and Continental-Scale Hydrological Cycles: Temporal Scale of Evaluation. J. Clim. 2003, 16, 535–547. [Google Scholar] [CrossRef]
  4. Allan, R.P.; Soden, B.J. Atmospheric warming and the amplification of precipitation extremes. Science 2008, 321, 1481–1484. [Google Scholar] [CrossRef] [PubMed]
  5. Yang, H.B.; Yang, D.W. Climatic factors influencing changing pan evaporation across China from 1961 to 2001. J. Hydrol. 2012, 414, 184–193. [Google Scholar] [CrossRef]
  6. Yang, H.B.; Yang, D.W.; Hu, Q.F.; Lv, H.F. Spatial variability of the trends in climatic variables across China during 1961–2010. Theor. Appl. Climatol. 2015, 120, 773–783. [Google Scholar] [CrossRef]
  7. Huang, S.Z.; Leng, G.Y.; Huang, Q.; Xie, Y.Y.; Liu, S.Y.; Meng, E.H.; Li, P. The asymmetric impact of global warming on US drought types and distributions in a large ensemble of 97 hydro-climatic simulations. Sci. Rep. UK 2017, 7, 5891. [Google Scholar] [CrossRef] [PubMed] [Green Version]
  8. Tong, S.; Lai, Q.; Zhang, J.; Bao, Y.; Lusi, A.; Ma, Q.; Li, X.; Zhang, F. Spatiotemporal drought variability on the Mongolian Plateau from 1980-2014 based on the SPEI-PM, intensity analysis and Hurst exponent. Sci. Total Environ. 2018, 615, 1557–1565. [Google Scholar] [CrossRef] [PubMed]
  9. Gian-Reto, W.; Eric, P.; Peter, C.; Annette, M.; Camille, P.; Beebee, T.J.C.; Jean-Marc, F.; Ove, H.G.; Franz, B. Ecological responses to recent climate change. Nature 2018, 416, 389–395. [Google Scholar] [CrossRef]
  10. Wang, H.R.; Hong, S.Y.; Qin, D.Q. Discussion on related issues of drought and water shortage. Water Resour. Prot. 2017, 33, 1–4. [Google Scholar]
  11. Zhang, Q.; Yao, Y.B.; Li, Y.H.; Luo, Z.X.; Zhang, C.J.; Li, D.L.; Wang, R.Y.; Wang, J.S.; Chen, T.Y.; Xiao, G.J.; et al. Research progress and prospect on the monitoring and early warning and mitigation technology of meteorological drouglU disaster in northwest China. Adv. Earth Sci. 2015, 30, 196–213. [Google Scholar] [CrossRef]
  12. Dai, A. Drought Under Global Warming: A Review. Wiley Interdiscip. Rev. Clim. Chang. 2010, 2, 45–65. [Google Scholar] [CrossRef]
  13. Dai, A. Increasing drought under global warming in observations and models. Nat. Clim. Chang. 2013, 3, 52–58. [Google Scholar] [CrossRef]
  14. Beguería, S.; Vicente-Serrano, S.M.; Angulo-Martínez, M. A Multiscalar Global Drought Dataset: The SPEI base: A New Gridded Product for the Analysis of Drought Variability and Impacts. Bull. Am. Meteorol. Soc. 2010, 91, 1351–1356. [Google Scholar] [CrossRef]
  15. Liu, Z.Y.; Zhou, P.; Zhang, F.Q.; Liu, X.D.; Chen, G. Spatiotemporal characteristics of dryness/wetness conditions across Qinghai Province, Northwest China. Agric. For. Meteorol. 2013, 182–183, 101–108. [Google Scholar] [CrossRef]
  16. Lobell, D.B.; Field, C.B. Global scale climate crop yield relationships and the impacts of recent warming. Environ. Res. Lett. 2007, 2, 14002. [Google Scholar] [CrossRef]
  17. Tao, F.L.; Yokozawa, M.; Xu, Y.L.; Hayashi, Y.; Zhang, Z. Climate changes and trends in phenology and yields of field crops in China, 1981–2000. Agric. For. Meteorol. 2006, 138, 92. [Google Scholar] [CrossRef]
  18. Liu, Y.; Wang, E.L.; Yang, X.G.; Wang, J. Contributions of climatic and crop varietal changes to crop production in the North China Plain, since 1980s. Glob. Chang. Biol. 2010, 16, 2287–2299. [Google Scholar] [CrossRef]
  19. Ahmadi, B.; Ahmadalipour, A.; Tootle, G.; Moradkhani, H. Remote Sensing of Water Use Efficiency and Terrestrial Drought Recovery across the Contiguous United States. Remote Sens. Basel 2019, 11, 731. [Google Scholar] [CrossRef]
  20. Huang, L.; He, B.; Han, L.; Liu, J.J.; Wang, H.Y.; Chen, Z.Y. A global examination of the response of ecosystem water-use efficiency to drought based on MODIS data. Sci. Total Environ. 2017, 601–602, 1097–1107. [Google Scholar] [CrossRef]
  21. Yu, Z.; Wang, J.; Liu, S.; Rentch, J.S.; Sun, P.; Lu, C. Global gross primary productivity and water use efficiency changes under drought stress. Environ. Res. Lett. 2017, 12, 14016. [Google Scholar] [CrossRef] [Green Version]
  22. Jiang, Y.L.; Wang, R.H.; Peng, Q.; Wu, X.Q.; Ning, H.S.; Cheng, L. The relationship between drought activity and vegetation cover in Northwest China from 1982 to 2013. Nat. Hazards 2018, 1–19. [Google Scholar] [CrossRef]
  23. Duan, W.L.; Hanasaki, N.; Shiogama, H.; Chen, Y.N.; Zou, S.; Nover, D.; Zhou, B.T.; Wang, Y. Evaluation and Future Projection of Chinese Precipitation Extremes Using Large Ensemble High-Resolution Climate Simulations. J. Clim. 2019, 32, 2169–2183. [Google Scholar] [CrossRef]
  24. Duan, W.L.; He, B.; Takara, K.; Luo, P.P.; Hu, M.C.; Alias, N.E.; Nover, D. Changes of precipitation amounts and extremes over Japan between 1901 and 2012 and their connection to climate indices. Clim. Dyn. 2015, 45, 2273–2292. [Google Scholar] [CrossRef]
  25. Palmer, W.C. Meteorological Drought. In Weather Bureau Research Paper; US Weather Bureau: Washington, DC, USA, 1965; Volume 45, pp. 1–58. [Google Scholar]
  26. McKee, T.B.; Doesken, N.J.; Kleist, J. The Relationship of Drought Frequency and Duration to Time Scales; American Meteorological Society: Boston, MA, USA, 1993; Volume 22, pp. 179–183. [Google Scholar]
  27. Vicente-Serrano, S.M.; Beguería, S.; Lópezmoreno, J.I. A multiscalar drought index sensitive to global warming: the standardized precipitation evapotranspiration index. J. Clim. 2010, 23, 1696–1718. [Google Scholar] [CrossRef]
  28. Chen, H.P.; Sun, J.Q. Changes in Drought Characteristics over China Using the Standardized Precipitation Evapotranspiration Index. J. Clim. 2015, 28, 75745793. [Google Scholar] [CrossRef]
  29. Yang, Q.; Li, M.X.; Zheng, Z.Y.; Ma, Z.G. Regional applicability of seven meteorological drought indices in China. Science China Earth Sciences. Sci. China Earth Sci. 2017, 60, 745–760. [Google Scholar] [CrossRef]
  30. Lorenzo-Lacruz, J.; Vicente-Serrano, S.M.; López-Moreno, J.I.; Beguería, S.; García-Ruiz, J.M.; Cuadrat, J.M. The impact of droughts and water management on various hydrological systems in the headwaters of the Tagus River (central Spain). J. Hydrol. 2010, 386, 13–26. [Google Scholar] [CrossRef] [Green Version]
  31. Kumar, K.N.; Rajeevan, M.; Pai, D.S.; Srivastava, A.K.; Preethi, B. On the observed variability of monsoon droughts over India. Weather Clim. Extremes 2013, 1, 42–50. [Google Scholar] [CrossRef] [Green Version]
  32. Mcclaran, M.P.; Wei, H. Recent drought phase in a 73-year record at two spatial scales: Implications for livestock production on rangelands in the Southwestern United States. Agric. For. Meteorol. 2014, 197, 40–51. [Google Scholar] [CrossRef]
  33. Xu, K.; Yang, D.W.; Yang, H.B.; Li, Z.; Qin, Y.; Shen, Y. Spatio-temporal variation of drought in China during 1961–2012: A climatic perspective. J. Hydrol. 2015, 526, 253–264. [Google Scholar] [CrossRef]
  34. Sun, H.Y.; Wang, C.Y.; Niu, Z.; Bukhosor; Li, B. Analysis of the Vegetation Cover Change and the Relationship between NDVI and Environmental Factors by Using NOAA Time Series Data. J. Remote Sens. 1998, 2, 204–210. [Google Scholar] [CrossRef]
  35. Zhang, X.L.; Wu, S.; Yan, X.D.; Chen, Z.J. A global classification of vegetation based on NDVI, rainfall and temperature. Int. J. Clim. 2016, 37. [Google Scholar] [CrossRef]
  36. Wang, T.; Peng, S.S.; Lin, X.; Chang, J.F. Declining snow cover may affect spring phenological trend on the Tibetan Plateau. Proc. Natl. Acad. Sci. USA 2013, 110, E2854–E2855. [Google Scholar] [CrossRef] [Green Version]
  37. Zhang, Q.; Kong, D.D.; Singh, V.P.; Shi, P.J. Response of vegetation to different time-scales drought across China: Spatiotemporal patterns, causes and implications. Glob. Planet. Chang. 2017, 152, 1–11. [Google Scholar] [CrossRef] [Green Version]
  38. Xu, X.T.; Piao, S.L.; Wang, X.H.; Chen, A.P.; Ciais, P.; Myneni, R.B. Spatio-temporal patterns of the area experiencing negative vegetation growth anomalies in China over the last three decades. Environ. Res. Lett. 2012, 7, 35701. [Google Scholar] [CrossRef]
  39. Symeonakis, E.; Drake, N. Monitoring desertification and land degradation over sub-Saharan Africa. Int. J. Remote Sens. 2004, 25, 573–592. [Google Scholar] [CrossRef]
  40. Yuan, W.P.; Liu, D.; Dong, W.J.; Liu, S.G. Multiyear precipitation reduction strongly decrease carbon uptake over North China. J. Geophys. Res. Biogeosci. 2014, 119, 881–896. [Google Scholar] [CrossRef]
  41. Sun, W.Y.; Song, X.Y.; Mu, X.M.; Gao, P.; Wang, F.; Zhao, G.G. Spatiotemporal vegetation cover variations associated with climate change and ecological restoration in the Loess Plateau. Agric. For. Meteorol. 2015, 209–210, 87–99. [Google Scholar] [CrossRef]
  42. Chen, Y.N.; Deng, H.J.; Li, B.F.; Zhi, L.; Xu, C.C. Abrupt change of temperature and precipitation extremes in the arid region of Northwest China. Quat. Int. 2014, 336, 35–43. [Google Scholar] [CrossRef]
  43. Smith, M.D. An ecological perspective on extreme climatic events: A synthetic definition and framework to guide future research. J. Ecol. 2011, 99, 656–663. [Google Scholar] [CrossRef]
  44. Sun, B.F.; Zhao, H.; Wang, X.K. Effects of drought on net primary productivity: Roles of temperature, drought intensity, and duration. Chin. Geogr. Sci. 2016, 26, 270–282. [Google Scholar] [CrossRef] [Green Version]
  45. Jiang, L.; Feng, W.L.; Guo, B. Analysis of Dynamic Monitoring of Vegetation Change And the Correlation With Precipitation Factor in Yalu Tsangpo River Basin During the Past 13 Years. Res. Environ. Yangtze Basin 2014, 23, 1610–1619. [Google Scholar] [CrossRef]
  46. Li, H.D.; Li, Y.K.; Shen, W.S.; Li, Y.N.; Jie, L.; Lu, X.Y.; Xia, X.; Jiang, J. Elevation-Dependent Vegetation Greening of the Yarlung Zangbo River Basin in the Southern Tibetan Plateau, 1999–2013. Remote Sens. Basel 2015, 7, 16672–16687. [Google Scholar] [CrossRef]
  47. Zhang, W.; Fu, X.F. Analysis and Evaluation of principal climatic factors of NDVI in the Yarlung Zangbo River Basin. J. Phys. Conf. Ser. 2015, 622, 12048. [Google Scholar] [CrossRef]
  48. Guo, B.; Jiang, L.; Da-Zhuan, G.E.; Shang, M. Driving Mechanism of Vegetation Coverage Change in the Yarlung Zangbo River Basin under the Stress of Global Warming. J. Trop. Subtrop. Bot. 2017, 25, 209–217. [Google Scholar] [CrossRef]
  49. Li, B.Q.; Zhou, W.; Zhao, Y.Y.; Ju, Q.; Yu, Z.B.; Liang, Z.M.; Acharya, K. Using the SPEI to Assess Recent Climate Change in the Yarlung Zangbo River Basin, South Tibet. Water 2015, 7, 5474–5486. [Google Scholar] [CrossRef] [Green Version]
  50. Song, M.H.; Ma, Y.M.; Zhang, Y.; Li, M.S.; Ma, W.Q.; Sun, F.L. Analyses of characteristics and trend of temperature variation along the Brahmaputra valley. Clim. Environ. Res. 2011, 16, 760–766. [Google Scholar] [CrossRef]
  51. Liu, W.F.; Xu, Z.X.; Li, F.P.; Su, L.Q. Climate Change Scenarios in the Yarlung Zangbo River Basin Based on ASD Model. Plateau Meteorol. 2014, 33, 26–36. [Google Scholar]
  52. Gong, T.L. Mechanism of Hydrological Cycle and Water Resources Management Tragedy in the Yarlung Tsangpo River Basin. Ph.D. Thesis, Beijing Normal University, Beijing, China, 2006. [Google Scholar]
  53. Liu, Z.; Yao, Z.; Huang, H.; Wu, S.; Liu, G. Land use and climate changes and their impacts on runoff in the Yarlung Zangbo River Basin, China. Land Degrad. Dev. 2014, 25, 203–215. [Google Scholar] [CrossRef]
  54. Zhong, L.; Suhy, M. Assessment of vegetation dynamics and their response to variations in precipitation and temperature in the Tibetan Plateau. Clim. Chang. 2010, 3–4, 519–535. [Google Scholar] [CrossRef]
  55. Beck, P.S.A.; Goetz, S.J. Satellite observations of high northern latitude vegetation productivity changes between 1982 and 2008: Ecological variability and regional differences. Environ. Res. Lett. 2011, 6, 45501–45510. [Google Scholar] [CrossRef]
  56. Du, J.Q.; Shu, J.M.; Wang, Y.H.; Li, Y.C.; Zhang, L.B.; Guo, Y. Comparison of GIMMS and MODIS normalized vegetation index composite data for Qing-hai Tibet Plateau. Chin. J. Appl. Ecol. 2014, 25, 533–544. [Google Scholar] [CrossRef]
  57. Li, X.; Gao, Y.H.; Wang, W.Z.; Lan, Y.C.; Xu, J.W.; Li, K. Climate Change and Applicability of GLDAS in the Headwater of the Yellow River Basin. Adv. Earth Sci. 2014, 29, 531–540. [Google Scholar] [CrossRef]
  58. Wang, Z.L.; Huang, Z.Q.; Li, J.; Zhong, R.D.; Huang, W.W. Assessing impacts of meteorological drought on vegetation at catchment scale in China based nn SPEI and NDVI. Trans. Chin. Soc. Agric. Eng. 2016, 32, 177–186. [Google Scholar] [CrossRef]
  59. Lv, Y.; Yang, S.T.; Cai, M.Y.; Zhou, Q.W.; Dong, G.T. The Applicability Analysis of TRMM Precipitation Data in the Yarlung Zangbo River Basin. J. Nat. Resour. 2013, 28, 1414–1425. [Google Scholar]
  60. Santhi, C.; Arnold, J.G.; Williams, J.R.; Dugas, W.A.; Srinivasan, R.; Hauck, L.M. Validation of the swat model on a large river basin with point and nonpoint sources. J. Am. Water Resour. Assoc. 2001, 5, 1169–1188. [Google Scholar] [CrossRef]
  61. Yang, Y.H.; Tian, F. Abrupt change of runoff and its major driving factors in Haihe River Catchment, China. J. Hydrol. 2009, 374, 373–383. [Google Scholar] [CrossRef]
  62. Huang, S.Z.; Chang, J.X.; Qiang, H.; Chen, Y.T. Spatio-temporal Changes and Frequency Analysis of Drought in the Wei River Basin, China. Water Resour. Manag. 2014, 28, 3095–3110. [Google Scholar] [CrossRef]
  63. Zhang, Q.; Singh, V.P.; Bai, Y.G. SPI-based evaluation of drought events in Xinjiang, China. Nat. Hazards 2012, 64, 481–492. [Google Scholar] [CrossRef]
  64. Huang, X.; Wang, Z.G.; Sang, Y.F.; Yang, M.Y.; Liu, X.C.; Gong, T.L. Precision of data in three precipitation datasets of the Yarlung Zangbo River Basin. Prog. Geogr. 2016, 35, 339–348. [Google Scholar] [CrossRef]
  65. Zhang, H.; Zhang, L.L.; Li, J.; An, R.D.; Deng, Y. Climate and Hydrological Change Characteristics and Applicability of GLDAS Data in the Yarlung Zangbo River Basin, China. Water 2018, 10, 254. [Google Scholar] [CrossRef]
  66. Zhang, H.B.; Zhang, F.; Ye, M.; Che, T.; Zhang, G.Q. Estimating daily air temperatures over the Tibetan Plateau by dynamically integrating MODIS LST data. J. Geophys. Res. Atmos. 2016, 121, 11, 411–425, 441. [Google Scholar] [CrossRef]
  67. Wang, L. Study on Hydrochemical Characteristics and Its Influencing Factors in Yarlung Tsangpo River Basin. Ph.D. Thesis, Institute of Geographic Sciences and Natural Resources Research, CAS, Beijing, China, 2016. [Google Scholar]
  68. Liu, X.W. Analysis of the Meteorological and Hydrological Charateristics in the Yarlung Zangbo River Basins. Master’s Thesis, Tsinghua University, Beijing, China, 2015. [Google Scholar]
  69. Holden, J.; Burt, T.P. Laboratory experiments on drought and runoff in blanket peat. Eur. J. Soil Sci. 2010, 53, 675–690. [Google Scholar] [CrossRef]
  70. Dai, Z.; Du, J.; Li, J.; Li, W.; Chen, J. Runoff characteristics of the Changjiang River during 2006: Effect of extreme drought and the impounding of the Three Gorges Dam. Geophys. Res. Lett. 2008, 35, 521–539. [Google Scholar] [CrossRef]
  71. Yuan, B.; Xu, H.; Ling, H. Drought–flood variation and its correlation with runoff in three headstreams of Tarim River, Xinjiang, China. Environ. Earth Sci. 2014, 71, 1297–1309. [Google Scholar] [CrossRef]
  72. Lv, Y.; Dong, G.T.; Yang, S.T.; Zhou, Q.W.; Cai, M.Y. Spatio-Temporal Variation in NDVI in the Yarlung Zangbo River Basin and Its Relationship with Precipitation and Elevation. Resour. Sci. 2014, 36, 603–611. [Google Scholar]
  73. Mishra, A.; Vu, T.; Valiyaveettil, A.; Entekhabi, D. Drought Monitoring with Soil Moisture Active Passive (SMAP) Measurements. J. Hydrol. 2017, 552, 620–632. [Google Scholar] [CrossRef]
  74. Tucker, C.J.; Slayback, D.A.; Pinzon, J.E.; Los, S.O.; Myneni, R.B.; Taylor, M.G. Higher northern latitude normalized difference vegetation index and growing season trends from 1982 to 1999. Int. J. Biometeorol. 2001, 45, 184–190. [Google Scholar] [CrossRef]
  75. Easterling, D.R.; Wallis, T.W.R.; Lawrimore, J.H.; Heim, R.R. Effects of temperature and precipitation trends on U.S. drought. Geophys. Res. Lett. 2007, 34, 396. [Google Scholar] [CrossRef]
  76. LIiu, Q.H.; Xin, J.F.; Xin, X.Z.; Tian, G.L.; Yang, G.J. Monitoring Agricultural Drought by Vegetation Index and Remotely Sensed Temperature. Pap. Remote Sens. Monit. 2007, 25, 12–18. [Google Scholar] [CrossRef]
  77. Callaghan, J.; Power, S.B. Variability and decline in the number of severe tropical cyclones making land-fall over eastern Australia since the late nineteenth century. Clim. Dyn. 2011, 37, 647–662. [Google Scholar] [CrossRef]
Figure 1. Location of the Yarlung Zangbo River basin and distribution of the hydro-meteorological stations.
Remotesensing 11 01254 g001
Figure 2. GLDAS-NOAH and measured monthly precipitation and temperature from 1982 to 2015.
Remotesensing 11 01254 g002
Figure 3. Spatial performance of the measured and GLDAS-NOAH precipitation (left) and temperature (right).
Remotesensing 11 01254 g003
Figure 4. Changes of SPEI at different time scales.
Remotesensing 11 01254 g004
Figure 5. Changes of the annual (left) and growing season (right) SPEI.
Remotesensing 11 01254 g005
Figure 6. Area proportions of the dry, wet, and normal areas indicated by the annual (left) and growing season (right) SPEI in different ranges.
Remotesensing 11 01254 g006
Figure 7. Annual (a, b) and growing season (c, d) spatial distributions of SPEI.
Remotesensing 11 01254 g007
Figure 8. Annual (a, b) and growing season (c, d) variation trends of SPEI with the significance test.
Remotesensing 11 01254 g008
Figure 9. Changes of the annual (left) and growing season (right) NDVI.
Remotesensing 11 01254 g009
Figure 10. Annual (left) and growing season (right) spatial distributions of NDVI.
Remotesensing 11 01254 g010
Figure 11. Annual (a, b) and growing season (c, d) spatial variations of NDVI with the significance test.
Remotesensing 11 01254 g011
Figure 12. Annual (a, b) and growing season (c, d) correlation analysis between the SPEI and NDVI with the significance test.
Remotesensing 11 01254 g012
Figure 13. Annual (left) and growing season (right) spatial distributions of the soil water content.
Remotesensing 11 01254 g013
Figure 14. Annual (a, b) and growing season (c, d) spatial variation trends of the soil water content with the significance test.
Remotesensing 11 01254 g014
Figure 15. Annual (a, b) and growing season (c, d) correlation analysis between the SPEI and soil water content with the significance test.
Remotesensing 11 01254 g015
Figure 16. Analysis on the spatial variation trends of the annual precipitation (a, b), temperature (c, d), and PET (e, f) with the significance test.
Remotesensing 11 01254 g016
Figure 17. Analysis on the spatial variation trends of the growing season precipitation (a, b), temperature (c, d), and PET (e, f) with the significance test.
Remotesensing 11 01254 g017
Table 1. SPEI meteorological drought index classification [27].
SPEI ValueClassification
[2, +∞] > 2.00Extremely wet
[1.5, 1.99]Severely wet
[1.0, 1.49]Moderately wet
[0.5, 0.99]Slightly wet
[−0.49, 0.49] Normal
[−0.99, −0.5]Slightly dry
[−1.49, −1.0]Moderately dry
[−1.99, −1.5]Severely dry
[−∞, −2]Extremely dry
Table 2. Statistical indicators of precipitation between the GLDAS-NOAH and gauging stations.
Gauging StationRRMSEMBNSE
Bomi0.5761.1722.990.20
Jiali0.8637.7221.090.69
Tsetang0.8951.17−28.76−0.24
Shigatse0.9152.03−29.660.26
Nyingchi0.929.33−0.50.78
Lhasa0.9436.51−18.960.54
Jiangzi0.8781.27−48.23−4.02
Dangxiong0.9323.84−3.650.79
Baingoin0.930.26−9.830.31
Dengqen0.8731.215.760.69
Gyaca0.8840.46−17.950.48
Riwoqe0.8730.0712.970.70
Lhunze0.8881.45−49.95−4.7
Haolong0.8130.72−5.920.24
Maltrogangkar0.9424.92−4.200.84
Nagqu0.9121.233.340.78
Namling0.9146.01−22.110.36
Nyemo0.9060.06−33.43−0.94
Xainza0.9334.65−14.620.25
Sog County0.8135.3815.360.58
Table 3. Statistical indicators of temperature between the GLDAS-NOAH and gauging stations.
Gauging StationRRMSEMBNSE
Bomi0.927.256.85−0.63
Jiali0.863.71−1.010.88
Tsetang0.964.874.590.29
Shigatse0.962.431.600.87
Nyingchi0.974.093.830.40
Lhasa0.973.342.950.69
Jiangzi0.962.111.090.90
Dangxiong0.93 2.53 0.04 0.97
Baingoin0.903.300.650.73
Dengqen0.874.512.850.47
Gyaca0.814.942.970.39
Riwoqe0.845.373.870.28
Lhunze0.874.443.150.47
Haolong0.835.373.780.28
Maltrogangkar0.843.891.070.59
Nagqu0.913.32−0.450.78
Namling0.854.562.820.40
Nyemo0.834.201.850.57
Xainza0.904.122.610.60
Sog County0.884.061.860.63
Table 4. Elevations of the 20 gauging stations.
Gauging StationElevation/m
Bomi2926
Jiali4286
Tsetang4656
Shigatse3873
Nyingchi3006
Lhasa3794
Jiangzi4025
Dangxiong4279
Baingoin4724
Dengqen3954
Gyaca3242
Riwoqe3810
Lhunze3922
Haolong3794
Maltrogangkar3810
Nagqu4527
Namling4001
Nyemo3813
Xainza4658
Sog County4078
Table 5. Area ratios of the SPEI occupied by different trends.
Significance LevelArea Ratio (%)
AnnualGrowing Season
Extremely significant decrease10.98.7
Significant decrease2.32.03
Non-significant decrease31.3233.65
Non-significant increase29.1731.54
Significant increase8.258.87
Extremely significant increase18.0515.21
Table 6. Area ratios of NDVI with different change trends.
Significance LevelArea Ratio (%)
AnnualGrowing Season
Extremely significant decrease7.38.7
Significant decrease4.843.7
Non-significant decrease27.8629.26
Non-significant increase31.2431.57
Significant increase6.14.5
Extremely significant increase22.7622.28
Table 7. Area ratios of NDVI and SPEI in different correlation degrees.
Significance LevelArea Ratio (%)
AnnualGrowing Season
Extremely significant negative correlation0.851.36
Significantly negative correlation0.951.55
Non-significantly negative correlation26.3730.98
Non-significantly positive correlation56.2849.62
Significantly positive correlation5.275.8
Extremely significant positive correlation10.2810.73

