COSMO-SkyMed SAR for Detection and Monitoring of Archaeological and Cultural Heritage Sites


Italian Space Agency (ASI), Via del Politecnico snc, 00133 Rome, Italy
*
Author to whom correspondence should be addressed.
Remote Sens. 2019, 11(11), 1326; https://0-doi-org.brum.beds.ac.uk/10.3390/rs11111326
Submission received: 26 April 2019
/
Revised: 20 May 2019
/
Accepted: 24 May 2019
/
Published: 2 June 2019
(This article belongs to the Special Issue Satellite and Aerial Remote Sensing of Hazards in Cultural and Natural Heritage Sites)
Abstract
:Synthetic aperture radar (SAR) imagery has long been used in archaeology since the earliest space radar missions in the 1980s. In the current scenario of SAR missions, the Italian Space Agency (ASI)’s COnstellation of small Satellites for Mediterranean basin Observation (COSMO-SkyMed) has peculiar properties that make this mission of potential use by archaeologists and heritage practitioners: high to very high spatial resolution, site revisit of up to one day, and conspicuous image archives over cultural heritage sites across the globe. While recent literature and the number of research projects using COSMO-SkyMed data for science and applied research suggest a growing interest in these data, it is felt that COSMO-SkyMed still needs to be further disseminated across the archaeological remote sensing community. This paper therefore offers a portfolio of use-cases that were developed in the last two years in the Scientific Research Unit of ASI, where COSMO-SkyMed data were analysed to study and monitor cultural landscapes and heritage sites. SAR-based applications in archaeological and cultural heritage sites in Peru, Syria, Italy, and Iraq, provide evidence on how subsurface and buried features can be detected by interpreting SAR backscatter, its spatial and temporal changes, and interferometric coherence, and how SAR-derived digital elevation models (DEM) can be used to survey surface archaeological features. The use-cases also showcase how high temporal revisit SAR time series can support environmental monitoring of land surface processes, and condition assessment of archaeological heritage and landscape disturbance due to anthropogenic impact (e.g., agriculture, mining, looting). For the first time, this paper provides an overview of the capabilities of COSMO-SkyMed imagery in StripMap Himage and Spotlight-2 mode to support archaeological studies, with the aim to encourage remote sensing scientists and archaeologists to search for and exploit these data for their investigations and research activities. Furthermore, some considerations are made with regard to the perspectives opened by the upcoming launch of ASI’s COSMO-SkyMed Second Generation constellation.

1. Introduction
Synthetic aperture radar (SAR) imaging systems, either space-borne or ground-based, are increasingly used for studies of archaeological landscapes, archaeological prospection and condition assessment of cultural heritage [1]. Amplitude and phase are the two key pieces of information collected in a complex SAR image, with the first parameter directly relating to the backscattering properties of the observed object (including structural and dielectric properties), and the second one allowing the retrieval of the position of the target on the ground. At a first approximation, we can state that SAR applications of archaeological prospection are mostly based on amplitude, while those of condition assessment are chiefly based on phase [2].
For monitoring purposes, the most common technique used is differential interferometric SAR (InSAR), given the capability of this family of multi-temporal techniques (e.g., small baseline subset—SBAS; persistent scatterer interferometry—PSI) to provide estimates of structural deformation and instability of historical buildings, monuments and archaeological ruins [3,4,5,6]. Such applications are nowadays quite established in the scientific community and increasingly known among the practitioner community [7]. This evidence has also come out in recent events addressed to heritage stakeholders (e.g., [8,9]). However, it has been demonstrated that interferometric coherence and changes of SAR backscattering can also be used as proxies to infer the condition of archaeological features and heritage assets [2].
In the field of archaeological prospection, SAR systems have been employed since the 1980s to investigate both tropical and subtropical territories [10] and arid environments [11]. The peculiar penetration capability of longer microwave wavelengths (i.e., higher penetration with wavelengths of 15–30 cm in L-band than 2.5–3.75 cm in X-band) was crucial to reveal hidden features and palaeo-landscapes in different environments across the world [12,13].
However, despite this body of literature and the recent publication of reviews outlining the value of SAR for archaeology [1,2,14] and thematic special issues in specialist journals [15], SAR imagery and its derived products based on InSAR or change detection methods are not used as much as optical imagery at very high spatial resolution and digital elevation models (DEM) generated from airborne LiDAR or stereoscopic pairs. These latter data remain the preferred sources of geospatial information across the practitioner community for remote archaeological prospection and regional surveying. Barriers to the use of SAR data in archaeology have been recognized in [1,2]: difficulties to access data, lack of specialist expertise to be able to handle and process these data, claimed coarse spatial resolution of SAR images, considered not adequate to identify small archaeological features. In this regard, Opitz and Herrmann [16] have recently argued that “too many projects attempt to “get something out of” lower resolution data and start off with unrealistic expectations, resulting in a general frustration with remote sensing as an approach”, and cited the papers by Lasaponara et al. [17] and Linck et al. [18] that have used X-band SAR data from space missions. The same authors, on the other side, suggest that the availability of high resolution data and image archives covering also less well-resourced regions could play an important role, alongside the reframing of the research agenda to take landscape change at a broader scale into account, to encourage the exploitation of lower resolution (5–10 m) data.
These are among the key properties characterizing the COnstellation of small Satellites for Mediterranean basin Observation (COSMO-SkyMed) mission of the Italian Space Agency (ASI). In the current space scenario of Earth observation satellites (Figure 1), COSMO-SkyMed is the only SAR constellation consisting of four identical space-crafts (i.e., CSK1, CSK2, CSK3, and CKS4), each equipped with multimode SAR sensors operating in the X-band (9.6 GHz frequency; 3.1 cm wavelength), with the first satellite launched in 2007, and the constellation fully deployed and operational since 2011.
The COSMO-SkyMed constellation allows a revisiting time of 16 days over the same area of the Earth with the same acquisition mode and beam with each satellite. The site revisit decreases to 8, 4, 3 and up to 1 day by exploiting the entire constellation, with a 1-day revisit achieved by the tandem configuration of CSK2 and CSK3 (until May 2019), or CSK4 and CSK2 (starting from June 2019). Additionally, the constellation can even provide site revisits in less than 12 hours, owing to the high agility in tasking the four satellites. This unique property explains the successful implementation of COSMO-SkyMed as a satellite system designed, developed, and operated to support emergency management operations worldwide [19].
The consistency in interferometric acquisition parameters over long periods of time, instead, is the reason for COSMO-SkyMed data to have been increasingly accessed and processed by means of InSAR techniques, to monitor and assess the impact of geohazards on cultural heritage sites [7]. This fits very well with the findings of the recent statistical analysis undertaken in ASI and published by Battagliere et al. [20], by which “geo-hazard risk management” is the major primary application domain of COSMO-SkyMed during the period from 2014 to 2017, accounting for 56% of the total users’ requests and data exploitation. The same analysis revealed that “archaeological applications” and “cultural heritage monitoring” are included within the domain “other”, which accounts for 9% of the total volume of data exploitation. This would suggest the presence of a niche community interested in and testing COSMO-SkyMed data in this field of research and development.
By screening the scientific literature focused on the use of COSMO-SkyMed in archaeological studies, it however appears that this is still limited and sparse. Chen et al. [21] were the first to analyse COSMO-SkyMed data in different contexts and environmental conditions, in particular to detect archaeological marks that they proposed to categorize as “shadow marks”, “crop marks” and “soil and damp marks”. Stewart [22] investigated the potential use of interferometric coherence to identify archaeological residues in vegetated areas. In the framework of a case study in Spain, Monterroso Checa and Martínez Reche [23] found examples where soil moisture contributed to the visibility of archaeological Roman features in COSMO-SkyMed images that were used to survey a large rural landscape. Nevertheless, despite these interesting and promising findings, there is still no clear evidence that these research experiences have been followed by a wider use of COSMO-SkyMed data across the archaeological community.
Furthermore, there is not yet a systematic study providing an overview of the capabilities of COSMO-SkyMed data to support archaeological studies, so other remote sensing scientists and archaeologists could be encouraged to search for and exploit these data. The present paper therefore aims to fill this gap, through a portfolio of use-cases that have been developed in the last two years in the Scientific Research Unit at ASI.
In Section 2 we recall the key features of the COSMO-SkyMed mission, highlight those that suit the purposes of archaeological studies and monitoring of cultural heritage sites, and make a comparison with other SAR missions. Section 3 is structured around use-cases and brief accounts on the respective image analysis approach used, with focus on the following common tasks and applications in the archaeological and cultural heritage science practice: image interpretation and feature reconnaissance, archaeological surveying of surface features with DEM, archaeological prospection of subsurface and buried features, environmental monitoring with amplitude change detection, condition assessment and monitoring of landscape disturbance, and damage assessment in areas of conflict. The use-cases were intentionally chosen to discuss capabilities and limitations of COSMO-SkyMed and prove that a correct selection and tasking of data, as well as of the processing method implementation, can lead to satisfactory results. In Section 4 we finally conclude with the perspectives opened by the future launch of the second generation of COSMO-SkyMed satellites. The improvements of the second generation compared to the current COSMO-SkyMed constellation will provide enhanced functionalities that could potentially generate significant impact on archaeological studies and cultural heritage applications.
2. Materials and Methods
2.1. COSMO-SkyMed Mission Overview
In the current scenario of space SAR missions, COSMO-SkyMed is the largest constellation in orbit operating in the X-band (Figure 1). The mission is a dual-use (i.e., civilian and defence) end-to-end Earth observation system, funded by ASI and the Italian Ministry of Defence [24,25]. The four COSMO-SkyMed satellites were successfully launched on 8th June (CSK1) and 9th December 2007 (CSK2), 25th October 2009 (CSK3), and 6th November 2010 (CSK4). The constellation was therefore fully deployed and operational starting from early 2011, after CSK4 deployment in its final orbit position.
The nominal (full sized) constellation orbiting configuration is conceived to achieve the best trade-off between cost and performance, providing a global Earth access at constellation level of a few hours, with at least two opportunities in one day to access the same target site on the Earth under different observing conditions (incidence angle) [25]. All of the four satellites are positioned on the same sun-synchronous near-polar orbit with 97.86° of inclination, orbit cycle of 16 days, 14.8125 revolutions per day and nominal orbit height of 619.6 km. The orbit is kept within an orbital tube that guarantees a position within ±1 km from a reference ground track.
In nominal conditions and until May 2019, CSK2 was positioned at 180° with respect to CSK1, CSK3 at 67.5° with respect to CSK2, and CSK4 at 90° with respect to CSK1. This configuration resulted in the following main interferometric couples: 8-day CSK1–CSK2; 4-day CSK4–CSK1; 3-day CSK3–CSK4; and 1-day CSK2–CSK3 (i.e., “tandem-like” configuration). Other combinations could be achieved, for instance with 7-days CSK3–CSK1, 9 days CSK1–CSK3, 12 days CSK1–CSK4 and CSK4–CSK2, and so on. Since June 2019, the orbital position of CSK3 and CSK4 satellites has been changed in view of the forthcoming launch of the first satellite of the second generation constellation, thus resulting into a different scheme. While CSK1 and CSK2 remain mutually positioned at 180°, CSK4 is at 67.5° with respect to CSK2 and they now form the new “tandem-like” configuration, and CSK3 is positioned at 90° with respect to CSK2. Therefore, the interferometric sequence has changed from 8-1-3-4 days interval to 4-3-1-8 days.
Three different SAR imaging modes are provided by the constellation, the details of which are summarized in Table 1:
- Spotlight (Spotlight-1, and Spotlight-2 or Enhanced Spotlight), very high resolution, and relatively small image area;
- StripMap (Himage, and PingPong), high and medium resolution, and medium-sized image area;
- ScanSAR (Wide Region, and Huge Region), medium and low resolution, and large image area.
Each image acquired according to one of the above imaging modes can be delivered as a standard product. Standard products include, in increasing order of processing level [25]:
- Level 0, raw products, containing the unpacked echo data in complex in-phase and quadrature signal (I and Q) format.
- Level 1A, single-look complex slant products (SCS), i.e., raw data focused in slant range and zero Doppler projection (i.e., the sensor natural acquisition projection). The product contains in-phase and quadrature of the focused data, weighted and radiometrically equalized.
- Level 1B, detected ground multi-look product (DGM), obtained by detecting, multi-looking and projecting the SCS data onto a regular ground grid. The only exception is for Enhanced Spotlight data that are not multi-looked and therefore are provided with nominal 1 m × 1 m geometric resolution.
- Level 1C/1D, geocoded ellipsoid-corrected (GEC) and geocoded terrain-corrected (GTC) products, respectively. They are obtained by projecting the DGM product onto a regular grid in a chosen cartographic reference system. In case of Level 1C the surface is the Earth ellipsoid, while for the Level 1D a DEM is used to approximate the real Earth surface. In particular, the DEM employed is the NASA’s Shuttle Radar Topography Mission (SRTM) global DEM at 3 arc-sec spatial resolution, i.e., ~90 m, so Level 1D products are available only within the latitudes of 60° N and 56° S.
Standard products, particularly SCS, are typically the starting processing level of COSMO-SkyMed data requiring further analysis to generate change detection products, such as maps showing the changes in SAR amplitude, InSAR displacement maps, or grids of persistent scatterers.
Higher level products that users can also access include [25]:
- Co-registered products, i.e., two or more SCS or DGM products co-registered (i.e., superimposed) to a single master as reference. This is helpful for InSAR and change detection, as this is a compulsory processing step in this type of analyses, that otherwise the users would need to implement themselves.
- Mosaicked products, i.e., DGM, GEC or GTC assembled into a common grid. This option could be recommended, for example, for those users interested in regional surveying over large areas.
- Speckle filtered image, i.e., an image with an increased equivalent number of looks (ENL), wherein the radiometric resolution of the SAR images was improved by reducing the intrinsic multiplicative-like speckle noise. However, the ground range and azimuth resolutions are degraded compared to SCS products, e.g., ≤4.5 m in Enhanced Spotlight, ≤25 m in StripMap Himage and ≤90 m in StripMap PingPong.
- Interferometric products, containing interferometric coherence and phase, are obtained by processing Level 1A co-registered data, taken in any acquisition mode (except for polarimetric ones), and processed to generate the wrapped interferometric phase and its coherence map. Spacing features of the interferometric products are inherited from the co-registered input SAR image pairs, but due to interferometric multi-looking, spacing and corresponding size are reduced by a factor of three in range and four in azimuth for Spotlight, and four and five for StripMap Himage.
- DEM products are generated by means of interferometric processing of Level 1A co-registered products, in any acquisition mode (except for polarimetric ones) and are provided as an ellipsoidal height map and associated height error map. For relative and absolute height and horizontal accuracies, as well as posting, the reader can refer to Reference [25].
All the imaging modes (Table 1), except Spotlight-1, can be requested for civilian use and accessed by users under the “COSMO-SkyMed Data Policy”. The two main classes of civilian users are institutional users (i.e., legal entities who pursue institutional, scientific (non-profit oriented), and public objectives), and commercial users. The institutional users are directly managed and coordinated by ASI, whereas the commercial users can access the system through the commercial provider e-GEOS, an ASI-Telespazio Company. The whole COSMO-SkyMed civilian user community can access the catalogue through a dedicated website (catalog.e-geos.it). An updated overview of ASI’s exploitation strategy in the civilian domain is reported in Battagliere et al. [20].
2.2. COSMO-SkyMed Properties Useful for Archaeology and Cultural Heritage
Following the simple concept that reliable and accurate archaeological interpretations can be made when data are collected at a spatial resolution appropriate to the scale of the archaeological features that we are interested to observe and find [26], it is evident from Table 1 that COSMO-SkyMed Enhanced Spotlight data are most suited for local/site-scale investigations and fine archaeological mapping, while StripMap Himage mode provides the best trade-off between high spatial resolution (less than 5 m) and areal coverage. Outside COSMO-SkyMed, sub-meter spatial resolution in the X-band SAR domain can nowadays be achieved with the TerraSAR-X Staring Spotlight ([27,28] for archaeological applications), the PAZ ultra high resolution Staring Spotlight, the KOMPSAT-5 ultra high resolution, and RISAT-2 Spotlight modes. Comparable spatial resolution can be achieved with ALOS-2 Spotlight mode (3 m × 1 m), at much longer wavelength (22.9 cm, L-band; Figure 1) which should be more suited to achieve higher penetration of the topsoil.
Both COSMO-SkyMed Enhanced Spotlight and StripMap Himage can be acquired in single polarization, i.e., single orientation of the electromagnetic wave when it is transmitted horizontally (H) or vertically (V) from the sensor to the target on the ground and then it is received H or V once it has been scattered back to the sensor. Enhanced Spotlight mode can be acquired with “like-polarizations” only, i.e., horizontal transmit—horizontal receive (HH) or vertical transmit—vertical receive (VV), while StripMap Himage can be collected with cross-polarizations too, i.e., HV or VH.
Alternating polarizations are, instead, the key feature of StripMap PingPong, with increasing opportunities to differentiate backscattering responses in vegetated areas, agricultural areas and crops. However, the medium spatial resolution (15 m × 15 m) may constrain the applicability to fine scale observations. The few publications [29,30,31] attempting to use C-band RADARSAT-2 and L-band ALOS-PALSAR polarized images (Figure 1) in the field of archaeological prospection suggest that, at equal conditions of acquisition, spatial resolution may affect the visibility of buried archaeological features. On the other side, the wider swath of 30 km × 30 km can allow for discoveries of large palaeo-environmental features or marks of extended anthropogenic features such as linear structures.
The very high temporal frequency of observation which is peculiar of COSMO-SkyMed is highly advantageous to assess the impact on archaeology and cultural heritage caused by natural and anthropogenic hazard events in case of emergencies, as well as during armed conflicts. In these situations, imagery acquired timely and with short revisiting time is an asset. It also proves crucial to undertake routine monitoring of processes that change quickly and need to be tracked dynamically. No other currently active SAR mission can offer this capability or similar agility to increase or decrease the revisiting time during the acquisition of the time series. At equal spatial resolution, TerraSAR-X has a revisiting time of 11 days and ALOS-2 of 14 days. The comparable revisiting time of 6 days that the Copernicus Sentinel-1 constellation can provide for large portions of the globe according to fully open access policy is, anyway, counterbalanced by the coarser spatial resolution of the pre-defined acquisition scenario based on interferometric wide swath (IW) mode data, i.e. 5 m by 20 m, over 250-km swaths [32]. Although Sentinel-1 IW data prove ideal for regional-scale environmental monitoring [1,2], they are definitely not appealing for archaeologists interested in fine scale mapping or archaeological prospection at site scale.
While the SAR mission recommended to get access to accurate DEM of all parts of the globe is the TanDEM-X (TerraSAR-X add-on for Digital Elevation Measurement), implemented on behalf of the German Aerospace Centre (DLR) as a Public Private Partnership project operated in conjunction with Airbus Defence and Space [33], it should not be forgotten that DEM can be generated with COSMO-SkyMed data as well, by exploiting the 1-day interferometric configuration between CSK2 and CSK3 (until May 2019), or CSK4 and CSK2 (since June 2019), or any of the other short temporal baseline configurations achievable (see Section 2.1). In Section 3.2 an archaeological use-case based on high resolution DEM is presented to demonstrate the capabilities of this COSMO-SkyMed higher level product that seems to have been somewhat overlooked so far.
Finally, following the recommendations made by practitioners about the importance of building consistent image archives also in regions less-covered by SAR data (see Section 1), it is worth mentioning that COSMO-SkyMed has a background mission that was implemented starting from 2011 [34]. The background mission is a low-priority acquisition plan allowing the system exploitation to be maximized and consistent datasets to be collected, thus creating a strategic historical data archive [20]. Designation as a UNESCO World Heritage List site is among the main area selection criteria included in the background mission, in recognition of the “economic and strategic relevance” of these sites. The COSMO-SkyMed data archive, therefore, represents a unique source of historical records that otherwise would have been lost. For monitoring and change detection purposes, this is evidently an asset. A demonstrative use-case is presented in this regard in Section 3.5.
2.3. COSMO-SkyMed Data Used for the Use-Cases
The use-cases discussed in Section 3 have been developed by using COSMO-SkyMed data coming from either bespoke new acquisitions or the existing archive built thanks to the background mission. Details of these datasets are summarized in Table 2.
The selected archaeological and cultural heritage sites encompass common situations where archaeologists and practitioners use satellite data to assess the impact of either natural or anthropogenic hazards, thus exposing heritage assets to risk. Factors of threat and encroachment that were included according to classification schemes that are currently used by archaeologists and cultural heritage practitioners (e.g., [35]), are: agriculture and expansion of agricultural land, mining activities, infrastructure development and use, as well as archaeological looting.
3. Results and Discussion
3.1. Image Interpretation and Feature Reconnaissance
As recalled in the introduction, a constraint frequently encountered by users is the difficulty to analyze a SAR image compared to an optical image, which is interpreted by the human eye and brain more intuitively [36]. This limitation can be overcome with dedicated SAR training [1] and integration of SAR with other types of satellite data (e.g., panchromatic, multispectral) to appreciate the added value of SAR imagery [37]. Much of this constraint comes from the inherent side-looking geometry of the radar and consequent geometric distortions, and the presence of radar speckle (noise), which usually increases at higher spatial resolution. On the other hand, spatial resolution has long been claimed among the key limitations regarding the use of SAR imagery in archaeology (e.g., [16,36]). This limitation can be solved by either enhancing the quality of commonly available medium resolution images for instance via multi-temporal averaging, or exploiting the opportunity offered by some SAR missions to task tailored acquisitions at higher spatial resolution. Both these approaches are discussed in this section, with examples showcasing the improvement achieved.
Figure 2 shows the stunning quality of SAR imaging with COSMO-SkyMed at 3 m and 1 m spatial resolution over the archaeological site of the Lines and Geoglyphs of Nasca and Pampas de Jumana in Peru, that substantially improve what was possible by multi-temporal averaging of ENVISAT images at 25 m resolution [38], and equals the multi-scale assessment that can be done with similar beam modes of TerraSAR-X [1]. Despite the shallowness of these archaeological features—that are “negative geoglyphs” drawn by uncovering light grey-yellow clay underlying red-pebbles according to a pattern or motif—their extent can be delineated using the distinctive radar signature to separate the geoglyphs (characterized by lower backscatter) from the nearby soil made of darker pebbles (higher backscatter).
Figure 3 shows a COSMO-SkyMed Spotlight-2 (Enhanced) image of the Hellenistic town of Apamea in Syria, where the standing archaeological structures such as the Justinian Walls and the monumental colonnade running across the site from north to south are clearly imaged, alongside the areas where looting activities damaged the site. With this and even higher levels of definition that can be achieved with COSMO-SkyMed Enhanced Spotlight mode, or TerraSAR-X Staring Spotlight [27], SAR data can be used effectively to monitor the condition of archaeological heritage over time (see also Section 3.6), in addition to (commercial) very high resolution optical satellite imagery.
While it is commonly thought that the likelihood of detecting smaller archaeological features increases with the availability of higher spatial resolution data, there is some evidence in the literature that, depending on the type and morphological properties of the features, these may not be easily discernible even in imagery of spatial resolution higher than the size of the features themselves due to the presence of speckle. For example, Balz et al. [28] provided an interesting quantitative analysis of the rate of success they achieved during an exercise of detection of burial mounds in the Altai Mountains with X-band SAR images, and found that even the largest mounds (>30 m diameter) were only clearly identified in about 16% and 22% of the cases in Spotlight and StripMap mode images. The authors also concluded that, compared to optical imagery, the possibility to identify the archaeological features under investigation would require approximately a spatial resolution two- to three-times higher. On the other side, the authors were able to identify the larger mounds in optical images with a resolution of about one metre.
It is worth recalling, on the other hand, the benefit that can arise from the multi-temporal averaging of long series of SAR data with consistent acquisition geometry and mode, and the resulting, exceptionally enhanced, very high resolution overviews of the sites under investigation, as later discussed and shown in Figure 4c.
In some cases, the identification of archaeological features in SAR images is more successful when the radar return is stronger, so the radar backscatter dominates the entire pixel of the image [36]. However, even homogeneous surfaces may appear in the SAR image with a grainy texture, i.e., a variation of grey levels between adjacent resolution cells. This effect is known as speckle and consists in an incoherent sum of the radar returns from several scattering centres within each resolution cell whose elementary returns, by positive or negative interference, generate lighter or darker image brightness (“salt and pepper” effect). As such, speckle is seen as “noise” that degrades the quality of the SAR image and needs to be reduced.
Multi-looking is one of the most common approaches to reduce this noise and is based on the averaging of independent measurements of the same target (adjoining pixels) in order to smooth out the speckle. In practice, by averaging N statistically independent (non-overlapping) image pixels within a moving window, the speckle variance is reduced by a factor of N. This can be implemented along either or both the azimuth and slant-range direction. While the radiometric resolution of the multi-looked image (or speckle-reduced image) is improved, its geometric resolution is degraded. Therefore, the multi-looking requires a compromise between the acceptable level of speckle and the desired spatial resolution (Figure 4a,b). This also applies if speckle reduction is done using filters based on median or Gaussian weighting. Usefulness of different approaches of speckle filtering applied to single images to enhance archaeological marks is discussed in Chen et al. [21].
If multiple SAR images acquired at different times are available over the study area, the speckle can be reduced by means of temporal averaging of these images (once co-registered). The output is a single image representing the temporally averaged backscattering signal of the study area, which retains the pixel spacing (and therefore spatial resolution) of the input scenes and provides an enhanced level of detail, so features unchanged throughout the SAR image time series are better imaged and resolved (Figure 4c). A full description of the procedure is provided by Cigna et al. [39].
3.2. Archaeological Surveying of Surface Features with DEM
In archaeological studies it has now become common to use the global DEM produced by the NASA Shuttle Radar Topography Mission (SRTM; [40]) to either understand the regional environmental setting of the study area or perform topographic measurements and detect archaeological and (palaeo-) landscape features. SRTM was the first homogeneous, validated, and freely available nearly-global DEM of the Earth. The SRTM mission on-board the space shuttle Endeavour lasted 11 days (11–22 February 2000) and, through a dual-antenna single-pass interferometry configuration, successfully collected radar data over 80% of the Earth’s land surface between 60° N and 56° S latitude with data points posted every 1 arc-second (approximately 30 meters; SRTM-X). SRTM 1 arc-second global data are free to download from the United States Geological Survey (USGS) Earth Explorer user interface.
First studies using this product (available now for 97% of global landmass) for geomorphological applications and landscape archaeology are now appearing in the literature (e.g., [41]). Additionally, there are some studies (albeit still few) presenting the results achieved with DEMs purposely generated for archaeological applications using higher resolution SAR images. Erasmi et al. [42] tested experimental TanDEM-X DEMs at 7 m pixel spacing and resampled 2 m spatial resolution from StripMap and High Resolution Spotlight, respectively, in the alluvial plain of Cilicia in Turkey, and provided a comprehensive quantitative appraisal of the mean absolute and relative vertical accuracy of these elevation products compared to other global DEMs (e.g., SRTM), high resolution elevation data (HRE) standards from the National System for Geospatial Intelligence (NSG) and RTK-GPS field survey. The authors showed that, while the StripMap data were suitable to reconstruct a palaeo-channel in the alluvial plain, the High Resolution Spotlight DEM enabled the enhancement of the microtopography of the fortification towers, gates, theatre and stadium of the ancient city of Magarsos. The same DEM data were used by Rutishauser et al. [43] alongside historic CORONA imagery to achieve first indications for the reconstruction of former river channels.
In addition to the nowadays well-established use of TanDEM-X DEM in archaeological investigations, COSMO-SkyMed constellation can offer opportunities for DEM generation. Recent studies based on COSMO-SkyMed StripMap pairs specifically tasked with 1-day temporal baseline and 150–200 m perpendicular baseline proved that good absolute vertical accuracy can be achieved when atmospheric artefacts are properly mitigated [44].
The possibility to generate bespoke SAR-derived DEMs at high spatial resolution will certainly boost their exploitation by archaeologists requiring high level of detail over their study areas. Figure 5 showcases the improved capability in the detection of archaeological tells across the landscape of the Wasit region in Iraq, achieved with a DEM generated from a tandem pair of COSMO-SkyMed images in StripMap Himage mode at 3 m spatial resolution, with perpendicular baseline of 973 m (namely, a higher level product; see Section 2.1). In compliance with the product specifications [25], the COSMO-SkyMed StripMap Himage DEM provides a posting of 10 m. The direct comparison with the 30-m resolution ALOS Global Digital Surface Model (AW3D30 DSM) highlights not only the level of accuracy achieved by the COSMO-SkyMed StripMap DEM, but also the fine delineation of even the smaller mounds that were not clearly identified in the lower resolution AW3D30 DSM. The topographic features found in the COSMO-SkyMed DEM match extremely well with known sites and those mapped through Google Earth.
3.3. Archaeological Prospection of Subsurface and Buried Features
At present, the only SAR system providing newly acquired L-band data is ALOS-2 of the Japan Aerospace Exploration Agency (JAXA; Figure 1), with Spotlight mode at 3 m × 1 m spatial resolution over 25 km × 25 km swath and StripMap mode at 3 to 10 m over 50 to 70 km. At equal spatial resolution, according to the SAR theory, X-band COSMO-SkyMed and TerraSAR-X should have lower penetration capability [46].
However, there is increasing literature proving that in certain conditions X-band can be useful for archaeological prospection. Chen et al. [21] suggest that three categories of archaeological marks can be observed in SAR imagery: “shadow marks”, “crop marks”, and “soil and damp marks”. “Shadow marks” are found where very steep slopes generate shadows or, more frequently, when surface roughness is such that the feature is distinguished from flatter surroundings. Backscattering anomalies (“crop marks”) due to the presence of buried features under agricultural crops are more likely to be detected by comparing images of a time series covering the whole plant grow cycle. Variations in grain size, soil density and texture can be due to presence of archaeological material and therefore seen as an anomaly (“soil mark”). Signal penetration depths are an inverse function of water content, and the more water being within the target, the higher the backscatter and stronger the radar return. Therefore, moisture content retained by a buried feature may increase the dielectric constant and generate an anomaly (“damp mark”), while liquid water forming a small pond due to heavy rain will appear darker due to specular reflection. Examples of moisture contributing to the visibility of archaeological features in landscapes are discussed by Monterroso Checa and Martínez Reche [23], who conclude that periods of intense rain can make features be detectable in soils that have a moisture index much higher than the annual average and low temperatures (around 6–8 °C).
Figure 6 proves how backscattering anomalies can be very distinctive in bare ground, with limited vegetation coverage. The backscattering anomaly was imaged within an archaeological site during the summer with COSMO-SkyMed in Enhanced Spotlight mode with 39° incidence angle, and takes the shape of a circular pattern of pixels brighter than the surrounding soil, matching with an archaeological mark that is observed across seasons in very high resolution optical imagery and might indicate the presence of a buried structure at shallow depths. Recent studies (e.g., [47]) have identified shallowly buried archaeological relics, based on the detection of intermittent backscattering anomalies on space-borne COSMO-SkyMed images.
3.4. Environmental Monitoring with Amplitude Change Detection
The swath of COSMO-SkyMed StripMap and Spotlight SAR images allows the study area to be investigated within its wider environmental context. Archaeological sites and ancient settlements are frequently located in valleys where agricultural activities as well as fluvial processes can occur and change the physical environment, if not even impact on the conservation of local archaeological heritage. One of the best methods to capture the dynamic change of the landscape is to ratio the radar backscatter signal between pairs of SAR scenes from a long time series, to highlight the spatial extent and distribution of any changed areas.
The typical workflow to extract, convert to decibels (dB), and compare values of sigma nought (σ0) for purposes of landscape archaeology was first presented by Cigna et al. [39]. The formula to calculate the ratio of a pair made of SAR images k and z is:
where tk and tz are the acquisition times of scenes k and z respectively, and σ0 values are expressed using the linear scale. Rtz/tk(i) takes on values between 0 and 1 for pixels brighter at time tk with respect to tz, and greater than 1 for pixels brighter at tz with respect to tk. To account for data skewness, the resulting ratios are finally converted into decibel (dB), so negative values indicate pixels where the backscatter was greater at tk than tz, whereas positive values indicate pixels with greater backscatter at tz rather than tk.
An example of change detection map based on amplitude ratioing is showed in Figure 7 for the valley of Rio Ingenio, north of the Nasca Lines, Peru. The area is intensively cultivated and the changes captured by COSMO-SkyMed allow a discrimination of different properties between adjacent crops.
Geospatial analysis of σ0 changes can be also focused to find correlation between the distribution of ancient settlements and particular environments or natural processes. An interesting example was published by Conesa et al. [48] in the seasonally floodable areas of North Gujarat, India.
Other image processing approaches are based on the extraction of morphological features from the SAR images allowing the understanding and reconstruction of past environmental processes shaping the landscape. For instance, Bachofer et al. [49] used the backscatter associated to the geometry, roughness and surface cover of palaeo-shorelines to describe their spatial distribution, and applied a Canny edge detector to extract linear features that they validated with reference data from field surveys and literature review to reconstruct the palaeo-lake stages of Lake Manyara, in Northern Tanzania.
3.5. Condition Assessment and Monitoring of Landscape Disturbance
In the context of site condition assessment and monitoring of landscape disturbance, it is worth mentioning the potential use of interferometric coherence to identify archaeological residues in vegetated areas [22].
Coherence (γ) is a measure of interferometric phase correlation and can be computed as the cross-correlation coefficient of two complex SAR images using a small moving window of a few pixels in range and azimuth, once all the deterministic phase components (mainly caused by terrain elevation) are compensated for. Coherence therefore quantifies the degree of correlation between phase and amplitude information of the two images forming the pair, with γ = 0 indicating no coherence and γ = 1 a perfect correlation. Strong coherence means high homogeneity with no change of land surface properties, whereas low values are found over altered surfaces. In vegetated areas, coherence is usually low due to temporal decorrelation caused by random movements of individual scatterers (e.g., leaves blown by wind) with size comparable with the radar wavelength. Suitable SAR data for archaeological prospection based on coherence should be those acquired with wavelength less affected by temporal decorrelation (e.g., L-band better than C-band and X-band), and short perpendicular and temporal baselines. Additionally, knowledge of the crop type and height would be advantageous to establish a correlation between the observed coherence and crops. If the residues are located in topographic depressions, coherence anomalies could be the result of topography-induced moisture and soil differences resulting in differential vegetation growth [22]. A combined analysis of radar backscatter anomalies is always recommended, in order to search for association with coherent patterns.
Both interferometric coherence and amplitude change detection (Section 3.4) are effective SAR processing techniques to highlight patterns of radar properties changes caused by anthropogenic threats, such as encroachment due to agriculture, irrigation infrastructure, new construction or unregulated urban development, vandalism, re-use or improper use of land, lack of maintenance, and consequent weathering and erosion. As such, they provide quantitative and geospatial proxies to assess the condition of local heritage.
The capability to capture these events strongly depends on the availability of at least one archive image already acquired before the damage incident or anthropogenic disturbance, and the temporal granularity of the time series, so that the patterns found in the SAR pairs change detection analysis can be unequivocally attributed to a particular event.
The Lines and Geoglyphs of Nasca and Pampas de Jumana, in southern Peru, are among the UNESCO World Heritage sites most exposed to continuous or frequent interactions with local weather and natural surface processes, as well as the human presence and its use of the land. Earlier applications of interferometric coherence to investigate the environmental impact on cultural landscape and archaeological features were presented by Lefort et al. [50] and Baade and Schmullius [51]. Instead Tapete et al. [38] identified areas of likely illegal excavations in Cahuachi using multi-temporal change detection analysis of radar backscatter in ENVISAT images, albeit at their medium resolution.
Figure 8 instead showcases the benefit of a different SAR change detection paradigm relying on regular, frequent, and consistent COSMO-SkyMed time series, being acquired over the Nasca Lines every 16 days at 3 m spatial resolution since 2011 as part of the background mission, and thus allowing a higher probability that unexpected events can be captured in a timely manner, regardless of when the data analysis and creation of the associated digital record were undertaken [52].
In particular, Figure 8a,b shows an InSAR coherence map generated using one cross-event (10/07/2014–12/04/2015) COSMO-SkyMed pair, to retrospectively analyse the landscape disturbance caused by environmental activists accessing the area near the famous geoglyph “Hummingbird” (El Colibrí) on 08/12/2014. While the plateau where the geoglyph is drawn shows generally very high coherence with γ values of 0.8–0.9, the shape and extent of the decorrelated area due to the surface disturbance are very well delineated, and match with the evidence from independent aerial SAR investigations and in-situ reports.
In Figure 8c,d interferometric coherence patterns are instead used to substantiate the event of landscape disturbance occurred on 27/01/2018, when a truck drove off the Pan-American Highway and “plowed” into some geoglyphs, that soon after was reported by media and official governmental bodies [52]. In the cross-event (13/12/2017–30/01/2018) COSMO-SkyMed interferometric coherence map, coherence loss marks were observed along the highway due to vehicle transit, as well as off-road, demarking the exact path that was followed by the truck during the incident, with the main linear feature originating from the highway and moving off it towards the guardhouse.
The distinctiveness of these change patterns compared to environmental baselines makes incidents of landscape disturbance easily detectable across a wide landscape, as opposed to a systematic screening of the images that would be quite time-consuming. An incident of modern mining was identified east of the Pan-American Highway (Figure 9a,b) in the COSMO-SkyMed coherence map between 31/07/2013 and 16/06/2014 (Figure 9c), and its subsequent expansion was clearly picked up one year after, between 10/07/2014 and 05/07/2015 (Figure 9d).
3.6. Damage Assessment in Areas of Conflict
With space SAR systems able to acquire imagery with consistent parameters, under any weather conditions and at high temporal frequency and, in some cases, even upon specific tasking of new acquisitions with selected parameters (this is a specific feature of COSMO-SkyMed and TerraSAR-X), SAR is an established remote sensing technology for emergency mapping and damage assessment (see Reference [53] for an overview).
The same properties, alongside the improved spatial resolution up to the sub-metre level, were recently tested successfully to monitor cultural heritage in situations of crisis and in areas of conflict. For example, TerraSAR-X VV polarization StripMap images at 3 m resolution were used to compare the condition of the urban environment of the city of Homs in Syria, prior and after the recent civil war [1,54].
TerraSAR-X Staring Spotlight data (and more generally very high resolution SAR imagery) proved to be valid and reliable Earth observation data to monitor archaeological looting from space [27]. In very high resolution SAR images, looting pits were imaged along the slant-range geometry as a combined pattern of radar shadow and layover (the so-called “looting mark”), then re-projected onto the ground-range geometry. Within a single image, looting pits can be highlighted via the extraction of the image texture (Figure 10) and, in particular, based on the detection of the sharp spatial variations in backscatter occurring in the presence of looting holes. The resulting texture map can be reclassified to discriminate looted vs. unexcavated zones.
With multiple pairs of SAR images it is then possible to calculate the ratio Rtz/tk(i) of σ0 at different epochs (see Section 3.4) to extract the patterns of looting marks and measure the rate with which looting is occurring through time, and map spatially the dynamic evolution of this phenomenon across the study area.
The same σ0 ratioing approach is used in Figure 11 to identify changes to the condition of the archaeological site of Mari (Tell Hariri) in Syria. The site is sadly known for having been extensively looted between 2011 and 2014, alongside levelling of the walls in the religious precinct in the south-eastern part of the Royal Palace and damage to the covered temple area likely due to airstrikes or explosives, that were observed in optical satellite imagery between November and December 2017 [55,56]. Clusters of Rtz/tk(i) values higher than 10 dB are found where looting activities and damage to the covered temple area were reported (Figure 11).
This provides an evidence-base map contributing to the digital recording of the damages at site. However, in absence of intermediate images between 2010 and 2018, the change patterns were all summed together and it was not possible to separate the recorded events according to their temporal sequence. This further reminds about the importance of building regular image archives for application of multi-temporal condition and damage assessment.
4. Conclusions
The use-cases showed in this paper demonstrate that COSMO-SkyMed data have capabilities to support archaeological studies and monitoring of cultural heritage sites that are yet to be fully explored by users. This selection does not claim to be exhaustive. However, some considerations can be formulated, with wider validity than the specificity of the presented case studies.
With regard to image interpretation and feature reconnaissance, the metre-level spatial resolution offered by COSMO-SkyMed Enhanced Spotlight imaging mode increases the chances that a range of small-sized archaeological features are detected, thus bringing SAR to the level of very high resolution optical imagery and making it an additional source of information. Furthermore, in cases where multiple images are acquired over the area of interest with the same imaging mode, incidence angle and polarization, multi-averaging is a relatively simple processing step that can decrease the effect of speckle, and thus enhance the quality of the image. For observations of relatively unchanged landscapes and sites, this type of processing could be advantageous to achieve a better visibility of the features of interest. The accessibility to COSMO-SkyMed data, for example, for scientific purposes as part of the existing ASI’s Open Call [20] makes this approach viable, especially if archive images are available and cover the area of interest.
Regional surveying of features of archaeological interest can definitely benefit from the generation of high resolution DEM by means of interferometric processing of 1-day tandem image pairs (or, alternatively, pairs with small temporal baselines of few days). The literature suggests that there is still scarce knowledge of this COSMO-SkyMed higher level product. The use-case in Iraq presented in this paper demonstrates the scale of improvement that can be achieved compared with the open access DEM that are commonly used by archaeologists (e.g., ASTER GDEM, SRTM, ALOS AW3D30).
With the right selection of the imaging mode and incidence angle, as well as the circumstance of favourable environmental conditions on the ground (e.g., soil moisture content gradient, vegetation coverage), cropmarks indicating the presence of buried features can be successfully detected. This is in contrast with the common a priori claim that, since X-band cannot penetrate as much as L-band, no investigation of buried and/or subsurface features can be accomplished.
For monitoring cultural heritage sites at risk and vanishing landscapes, interferometric coherence, amplitude change detection and texture are all methods that consist in the quantitative identification, and then spatial and temporal mapping, of change patterns of a specific property in the SAR image that has been altered by the ongoing process. In the case of holes/pits of archaeological looting in Syria, the main changing property was the surface roughness and changes in the backscattering mechanisms, while in the incidents damaging the geoglyphs along the Pan-American Highway in Peru it was the loss of coherence. If consistent and frequent time series are available, the analysis could move from single pair to multi-pair change detection approaches, and unknown situations of changes can be discovered, in addition to substantiating the impact of known events.
An increased exploitation of COSMO-SkyMed data by a more diverse spectrum of practitioners, with different expertise and needs, would allow a direct feedback to further understand which impact this mission could bring in this field of remote sensing, and understand how to best address user requirements with future development of SAR space technologies. For example, during the user workshop organized by ASI at the end of 2017, users of COSMO-SkyMed data for InSAR applications of cultural heritage monitoring reported that: the 10 km × 10 km spatial coverage of Enhanced Spotlight imaging mode was not always useful for interferometry due to the limited extent of the frame; the presence of discontinuities in time series sometimes prevented a seamless analysis of the whole data stack; and planning of quad-pol acquisitions at defined temporal intervals could be a valuable add-on to include in the future COSMO-SkyMed exploitation strategy [57].
In this regard, with the look to the short-term evolution of the COSMO-SkyMed mission, it is worth mentioning the follow-on mission called COSMO-SkyMed Seconda Generazione (Second Generation; CSG) co-funded by the ASI and the Italian Ministry of Defence, that will consist of two satellites in Low Earth Orbit operating in X-band, the first of which is currently scheduled for launch by the end of 2019.
One of the CSG features of potential interest is the wider portfolio of Spotlight imaging modes, including new sub-metric Spotlight modes for civilian use [58]. In particular, Spotlight-2A will have an azimuth by range resolution ≤ 0.35 m × 0.55 m over a swath ≥ 3.1 km × 7.3 km, Spotlight-2B resolution ≤ 0.63 m × 0.63 m over a swath ≥ 10 km × 10 km, and Spotlight-2C resolution ≤ 0.80 m × 0.80 m over a swath ≥ 5 km × 10 km [59].
Additionally, couples of Spotlight images could be acquired simultaneously on two distinct swaths thanks to the new “non-standard” SAR mode called the Discrete Stepped Swath (DI2S) Multi-Swath Spot-Spot mode. This will mean that two Spotlight images could be acquired simultaneously on a given area (with same azimuth position, shifted in azimuth, or same range and shifted in azimuth), while at the moment they cannot because of violation of the time gap necessary between one acquisition and the other. Furthermore, with the “non-standard” SAR mode called Theatre Scenario, “squinted” SAR images could be taken over a given area, thus allowing a dynamic process of satellite tasking that will be shaped step-by-step around the user requirements and acquisition requests [59].
Finally, quad-pol StripMap images could be tasked over swath of 15 km, while for now only alternating polarization is achievable with StripMap PingPong acquisitions of the current constellation.
It is therefore envisaged that the improved spatial resolution to sub-meter level, the more agile and flexible spatial coverage and the increased polarization information, will be the CSG peculiarities with the highest likelihood to be tested for archaeological studies and monitoring of cultural heritage.
In a scenario where more and more COSMO-SkyMed data are becoming available and are used by archaeologists, these images may be part of the “big data” challenge that is currently dealt with in this field, for example with regard to the development of automated methods to aid in the discovery and mapping of archaeological sites and features [16]. At the moment, this development is happening in the field of InSAR applied to monitoring of surface deformation through the release of online platforms hosting processing tools (e.g., [60]), aiming to facilitate the access of established processing algorithms to a wider user spectrum. Yet this type of approach has not been fully investigated for applications such as site discovery or landscape archaeology with SAR images. However, the experiences with Google Earth Engine based on Landsat data [61,62] suggest that there is interest in the community for such facilities, and this type of platforms can trigger a wider use of SAR data and stimulate discussion about methodologies across the community.
Author Contributions
Conceptualization, D.T. and F.C.; methodology, D.T. and F.C.; software, F.C.; writing—original draft, D.T.; writing—review and editing, F.C.
Funding
This research received no external funding.
Acknowledgments
Research carried out using COSMO-SkyMed® Products, © of the Italian Space Agency (ASI), delivered under a license to use by ASI. In particular, the use-cases were developed during the research activities undertaken in the framework of the COSMO-SkyMed project/licenses “Multi-SAR” and “LARICI” led by Deodato Tapete, and “BigSAR” led by Francesca Cigna.
Conflicts of Interest
The authors declare no conflict of interest.
References
- Tapete, D.; Cigna, F. Trends and perspectives of space-borne SAR remote sensing for archaeological landscape and cultural heritage applications. J. Archaeol. Sci. Rep. 2017, 14, 716–726. [Google Scholar] [CrossRef] [Green Version]
- Tapete, D.; Cigna, F. SAR for Landscape Archaeology; Springer: Cham, Switzerland, 2017; pp. 101–116. [Google Scholar]
- Tapete, D.; Fanti, R.; Cecchi, R.; Petrangeli, P.; Casagli, N. Satellite radar interferometry for monitoring and early-stage warning of structural instability in archaeological sites. J. Geophys. Eng. 2012, 9, 10–25. [Google Scholar] [CrossRef]
- Tapete, D.; Casagli, N.; Luzi, G.; Fanti, R.; Gigli, G.; Leva, D. Integrating radar and laser-based remote sensing techniques for monitoring structural deformation of archaeological monuments. J. Archaeol. Sci. 2013, 40, 176–189. [Google Scholar] [CrossRef] [Green Version]
- Tang, P.; Chen, F.; Zhu, X.; Zhou, W.; Tang, P.; Chen, F.; Zhu, X.; Zhou, W. Monitoring Cultural Heritage Sites with Advanced Multi-Temporal InSAR Technique: The Case Study of the Summer Palace. Remote Sens. 2016, 8, 432. [Google Scholar] [CrossRef]
- Bonano, M.; Manzo, M.; Casu, F.; Manunta, M.; Lanari, R. DInSAR for the Monitoring of Cultural Heritage Sites; Springer: Cham, Switzerland, 2017; pp. 117–134. [Google Scholar]
- Tapete, D.; Cigna, F. InSAR data for geohazard assessment in UNESCO World Heritage sites: State-of-the-art and perspectives in the Copernicus era. Int. J. Appl. Earth Obs. Geoinf. 2017, 63, 24–32. [Google Scholar] [CrossRef]
- Copernicus for Cultural Heritage: Satellites to Preserve the Legacy from Our Past. Copernicus. Available online: https://www.copernicus.eu/en/copernicus-cultural-heritage-satellites-preserve-legacy-our-past (accessed on 26 April 2019).
- EURISY Space4Culture: Satellite Services for Historical and Creative Cities. Proceedings and Main Messages of the Conference. Available online: https://drive.google.com/file/d/1NKao-0HK2NPmVpwVRq2vbdHjrJ2AL6wY/view (accessed on 26 April 2019).
- Adams, R.E.; Brown, W.E.; Culbert, T.P. Radar mapping, archeology, and ancient Maya land use. Science 1981, 213, 1457–1468. [Google Scholar] [CrossRef]
- Elachi, C.; Roth, L.E.; Schaber, G.G. Spaceborne Radar Subsurface Imaging in Hyperarid Regions. IEEE Trans. Geosci. Remote Sens. 1984, 22, 383–388. [Google Scholar] [CrossRef]
- Moore, E.; Freeman, T.; Hensley, S. Spaceborne and Airborne Radar at Angkor: Introducing New Technology to the Ancient Site. In Remote Sensing in Archaeology; Springer: New York, NY, USA, 2006; pp. 185–216. [Google Scholar]
- Wiseman, J.; El-Baz, F. (Eds.) Interdisciplinary Contributions to Archaeology. In Remote Sensing in Archaeology; Springer: New York, NY, USA, 2007. [Google Scholar]
- Chen, F.; Lasaponara, R.; Masini, N. An overview of satellite synthetic aperture radar remote sensing in archaeology: From site detection to monitoring. J. Cult. Herit. 2017, 23, 5–11. [Google Scholar] [CrossRef]
- Lasaponara, R.; Masini, N. Satellite synthetic aperture radar in archaeology and cultural landscape: An overview. Archaeol. Prospect. 2013, 20, 71–78. [Google Scholar] [CrossRef]
- Opitz, R.; Herrmann, J. Recent Trends and Long-standing Problems in Archaeological Remote Sensing. J. Comput. Appl. Archaeol. 2018, 1, 19–41. [Google Scholar] [CrossRef] [Green Version]
- Lasaponara, R.; Masini, N.; Pecci, A.; Perciante, F.; Pozzi Escot, D.; Rizzo, E.; Scavone, M.; Sileo, M. Qualitative evaluation of COSMO SkyMed in the detection of earthen archaeological remains: The case of Pachamacac (Peru). J. Cult. Herit. 2017, 23, 55–62. [Google Scholar] [CrossRef]
- Linck, R.; Busche, T.; Buckreuss, S.; Fassbinder, J.W.E.; Seren, S. Possibilities of Archaeological Prospection by High-resolution X-band Satellite Radar—A Case Study from Syria. Archaeol. Prospect. 2013, 20, 97–108. [Google Scholar] [CrossRef]
- Grandoni, D.; Battagliere, M.L.; Daraio, M.G.; Sacco, P.; Coletta, A.; Di Federico, A.; Mastracci, F. Space-based Technology for Emergency Management: The COSMO-SkyMed Constellation Contribution. Procedia Technol. 2014, 16, 858–866. [Google Scholar] [CrossRef] [Green Version]
- Battagliere, M.L.; Virelli, M.; Lenti, F.; Lauretta, D.; Coletta, A. A Review of the Exploitation of the Operational Mission COSMO-SkyMed: Global Trends (2014–2017). Space Policy 2019. [Google Scholar] [CrossRef]
- Chen, F.; Masini, N.; Yang, R.; Milillo, P.; Feng, D.; Lasaponara, R. A space view of radar archaeological marks: First applications of COSMO-SkyMed X-band data. Remote Sens. 2015, 7, 24–50. [Google Scholar] [CrossRef]
- Stewart, C. Detection of archaeological residues in vegetated areas using satellite synthetic aperture radar. Remote Sens. 2017, 9, 118. [Google Scholar] [CrossRef]
- Monterroso Checa, A.; Martínez Reche, T. COSMO SkyMed X-Band SAR application—Combined with thermal and RGB images—In the archaeological landscape of Roman Mellaria (Fuente Obejuna-Córdoba, Spain). Archaeol. Prospect. 2018, 25, 301–314. [Google Scholar] [CrossRef]
- Covello, F.; Battazza, F.; Coletta, A.; Lopinto, E.; Fiorentino, C.; Pietranera, L.; Valentini, G.; Zoffoli, S. COSMO-SkyMed an existing opportunity for observing the Earth. J. Geodyn. 2010, 49, 171–180. [Google Scholar] [CrossRef] [Green Version]
- Italian Space Agency—ASI. COSMO—SkyMed Mission and Products Description; Doc. N° ASI-CSM-PMG-NT-001, 31 May 2016, issue 2; Italian Space Agency: Rome, Italy, 2016; p. 151. [Google Scholar]
- Schmidt, A.R.; Linford, P.; Linford, N.; David, A.; Gaffney, C.F.; Sarris, A.; Faßbinder, J. Europae Archaeologiae Consilium. In EAC Guidelines for the Use of Geophysics in Archaeology: Questions to Ask and Points to Consider: EAC Guidelines 2; Europae Archaeologia Consilium (EAC), Association Internationale sans But Lucratif (AISBL): Namur, Belgium, 2015. [Google Scholar]
- Tapete, D.; Cigna, F.; Donoghue, D.N.M. “Looting marks” in space-borne SAR imagery: Measuring rates of archaeological looting in Apamea (Syria) with TerraSAR-X Staring Spotlight. Remote Sens. Environ. 2016, 178, 42–58. [Google Scholar] [CrossRef]
- Balz, T.; Caspari, G.; Fu, B.; Liao, M. Discernibility of burial mounds in high-resolution X-Band SAR images for archaeological prospections in the Altai mountains. Remote Sens. 2016, 8, 817. [Google Scholar] [CrossRef]
- Stewart, C.; Lasaponara, R.; Schiavon, G. Multi-frequency, polarimetric SAR analysis for archaeological prospection. Int. J. Appl. Earth Obs. Geoinf. 2014, 28, 211–219. [Google Scholar] [CrossRef]
- Dore, N.; Patruno, J.; Pottier, E.; Crespi, M. New research in polarimetric SAR technique for archaeological purposes using ALOS PALSAR data. Archaeol. Prospect. 2013, 20, 79–87. [Google Scholar] [CrossRef]
- Patruno, J.; Dore, N.; Crespi, M.; Pottier, E. Polarimetric multifrequency and multi-incidence SAR sensors analysis for archaeological purposes. Archaeol. Prospect. 2013, 20, 89–96. [Google Scholar] [CrossRef]
- User Guides—Sentinel-1 SAR—Sentinel. Available online: https://sentinel.esa.int/web/sentinel/user-guides/sentinel-1-sar (accessed on 26 April 2019).
- DLR Microwaves and Radar Institute TanDEM-X—A New High Resolution Interferometric SAR Mission. Available online: https://www.dlr.de/dlr/en/desktopdefault.aspx/tabid-10293/427_read-19779/#/gallery/24722 (accessed on 31 May 2019).
- Battagliere, M.L.; Covello, F.; Coletta, A. COSMO-SkyMed Background Mission: Overview, Objectives and Results. In Proceedings of the 63rd International Astronautical Congress 2012, Naples, Italy, 1–5 October 2012. Paper IAC-12.B1.5.12. [Google Scholar]
- Rayne, L.; Bradbury, J.; Mattingly, D.; Philip, G.; Bewley, R.; Wilson, A. From Above and on the Ground: Geospatial Methods for Recording Endangered Archaeology in the Middle East and North Africa. Geosciences 2017, 7, 100. [Google Scholar] [CrossRef]
- Holcomb, D.W.; Shingiray, I.L. Imaging Radar in Archaeological Investigations: An Image Processing Perspective. In Remote Sensing in Archaeology; Springer: New York, NY, USA, 2006; pp. 11–45. [Google Scholar]
- Ford, J.P.; Cimino, J.B.; Elachi, C. Space Shuttle Columbia Views the World with Imaging Radar: The SIR-A Experiment; Jet Propulsion Laboratory: Pasadena, CA, USA, 1982; JPL Pub.82–95. [Google Scholar]
- Tapete, D.; Cigna, F.; Masini, N.; Lasaponara, R. Prospection and monitoring of the archaeological heritage of Nasca, Peru, with ENVISAT ASAR. Archaeol. Prospect. 2013, 20, 133–147. [Google Scholar] [CrossRef]
- Cigna, F.; Tapete, D.; Lasaponara, R.; Masini, N. Amplitude change detection with ENVISAT ASAR to image the cultural landscape of the Nasca region, Peru. Archaeol. Prospect. 2013, 20, 117–131. [Google Scholar] [CrossRef]
- Farr, T.G.; Rosen, P.A.; Caro, E.; Crippen, R.; Duren, R.; Hensley, S.; Kobrick, M.; Paller, M.; Rodriguez, E.; Roth, L.; et al. The Shuttle Radar Topography Mission. Rev. Geophys. 2007, 45. [Google Scholar] [CrossRef] [Green Version]
- Orengo, H.A.; Petrie, C.A. Multi-scale relief model (MSRM): A new algorithm for the visualization of subtle topographic change of variable size in digital elevation models. Earth Surf. Process. Landf. 2018, 43, 1361–1369. [Google Scholar] [CrossRef]
- Erasmi, S.; Rosenbauer, R.; Buchbach, R.; Busche, T.; Rutishauser, S. Evaluating the quality and accuracy of TanDEM-X digital elevation models at archaeological sites in the Cilician Plain, Turkey. Remote Sens. 2014, 6, 9475–9493. [Google Scholar] [CrossRef]
- Rutishauser, S.; Erasmi, S.; Rosenbauer, R.; Buchbach, R. SARchaeology—Detecting Palaeochannels Based on High Resolution Radar Data and Their Impact of Changes in the Settlement Pattern in Cilicia (Turkey). Geosciences 2017, 7, 109. [Google Scholar] [CrossRef]
- Lombardi, N.; Lorusso, R.; Milillo, G. Accuracy of high resolution CSK interferometric Digital Elevation Models. In Proceedings of the IEEE International Geoscience and Remote Sensing Symposium (IGARSS), Milan, Italy, 13–18 July 2015; pp. 2967–2970. [Google Scholar]
- Pedersén, O. Ancient Near East on Google Earth: Problems, Preliminary Results, and Prospects. In Proceedings of the 7th International Congress on the Archaeology of the Ancient Near East, London, UK, 12–16 April 2010; pp. 385–393. [Google Scholar]
- Ulaby, F.T.; Moore, R.K.; Fung, A.K. Microwave Remote Sensing: Active and Passive Volume II: Radar Remote Sensing and Surface Scattering and Emission Theory; Artech House: Norwood, MA, USA, 1982; p. 634. [Google Scholar]
- Jiang, A.; Chen, F.; Masini, N.; Capozzoli, L.; Romano, G.; Sileo, M.; Yang, R.; Tang, P.; Chen, P.; Lasaponara, R.; et al. Archeological crop marks identified from Cosmo-SkyMed time series: The case of Han-Wei capital city, Luoyang, China. Int. J. Digit. Earth 2017, 10, 846–860. [Google Scholar] [CrossRef]
- Conesa, F.C.; Devanthéry, N.; Balbo, A.L.; Madella, M.; Monserrat, O. Use of satellite SAR for understanding long-term human occupation dynamics in the monsoonal semi-arid plains of North Gujarat, India. Remote Sens. 2014, 6, 11420–11443. [Google Scholar] [CrossRef]
- Bachofer, F.; Quénéhervé, G.; Märker, M. The delineation of paleo-shorelines in the lake Manyara basin using TerraSAR-X data. Remote Sens. 2014, 6, 2195–2212. [Google Scholar] [CrossRef]
- Lefort, A.; Grippa, M.; Walker, N.; Stewart, L.J.; Woodhouse, I.H. Change detection across the Nasca pampa using spaceborne SAR interferometry. Int. J. Remote Sens. 2004, 25, 1799–1803. [Google Scholar] [CrossRef]
- Baade, J.; Schmullius, C. High-resolution mapping of fluvial landform change in arid environments using TerraSAR-X images. In Proceedings of the International Geoscience and Remote Sensing Symposium (IGARSS), Honolulu, HI, USA, 25–30 July 2010. [Google Scholar] [CrossRef]
- Cigna, F.; Tapete, D. Tracking human-induced landscape disturbance at the Nasca lines UNESCO World Heritage Site in Peru with COSMO-SkyMed InSAR. Remote Sens. 2018, 10, 572. [Google Scholar] [CrossRef]
- Plank, S. Rapid damage assessment by means of multi-temporal SAR-A comprehensive review and outlook to Sentinel-1. Remote Sens. 2014, 6, 4870–4906. [Google Scholar] [CrossRef]
- Tapete, D.; Cigna, F.; Donoghue, D.N.M.; Philip, G. Mapping changes and damages in areas of conflict: From archive C-band SAR data to new HR X-band imagery, towards the Sentinels. In Proceedings of the FRINGE 2015, Frascati, Italy, 23–27 March 2015. ESA-SP Vol. 731, id.37. [Google Scholar]
- American Association for the Advancement of Science—AAAS. Ancient History, Modern Destruction: Assessing the Status of Syria’s Tentative World Heritage Sites Using High-Resolution Satellite Imagery. Available online: https://www.aaas.org/resources/ancient-history-modern-destruction-assessing-status-syria-s-tentative-world-heritage-sites-7 (accessed on 31 May 2019).
- ASOR Cultural Heritage Initiatives. ASOR Cultural Heritage Initiatives Monthly Report (April 2018). Available online: http://www.asor-syrianheritage.org/wp-content/uploads/2018/06/ASOR_CHI_April18_Appendices.pdf (accessed on 31 May 2019).
- Benenati, L.; Dore, N.; Bernardi, L.; Monteleone, A. ArTeK Sistema di Monitoraggio con COSMO-SkyMed e Gestione dei Beni Culturali al Servizio di Gestori e Visitatori. Available online: https://www.asi.it/sites/default/files/attach/evento/06_asiworkshop_13-15_11_2017_16-9_-_nais_01.pdf (accessed on 26 April 2019).
- Lorusso, R.; Fasano, L.; Dini, L.; Facchinetti, C.; Varacalli, G.N. COSMO-SkyMed di Seconda Generazione—Civilian Product Specifications. In Proceedings of the 69th International Astronautical Congress (IAC), Bremen, Germany, 1–5 October 2018; Paper IAC-18-B1.2.13. pp. 1–15. [Google Scholar]
- Zampolini, E.; Faustini, M.P. COSMO Second Generation. State of Art Technologies and System Innovations for Earth Observation Servicing Excellence. Available online: https://www.asi.it/sites/default/files/attach/evento/02_asi_workshop_15-11-2017_csg_state_of_art_technologies_final.pdf (accessed on 26 April 2019).
- De Luca, C.; Cuccu, R.; Elefante, S.; Zinno, I.; Manunta, M.; Casola, V.; Rivolta, G.; Lanari, R.; Casu, F. An on-demand web tool for the unsupervised retrieval of earth’s surface deformation from SAR data: The P-SBAS service within the ESA G-POD environment. Remote Sens. 2015, 7, 15630–15650. [Google Scholar] [CrossRef]
- Agapiou, A. Remote sensing heritage in a petabyte-scale: Satellite data and heritage Earth Engine© applications. Int. J. Digit. Earth 2017, 10, 85–102. [Google Scholar] [CrossRef]
- Orengo, H.A.; Petrie, C.A. Large-scale, multi-temporal remote sensing of palaeo-river networks: A case study from Northwest India and its implications for the Indus civilisation. Remote Sens. 2017, 9, 735. [Google Scholar] [CrossRef]
Figure 1.
COnstellation of small Satellites for Mediterranean basin Observation (COSMO-SkyMed) in the context of past and current satellite synthetic aperture radar (SAR) systems distinguished by radar band as of 2019.
Figure 1.
COnstellation of small Satellites for Mediterranean basin Observation (COSMO-SkyMed) in the context of past and current satellite synthetic aperture radar (SAR) systems distinguished by radar band as of 2019.

Figure 2.
(a) A 2016 satellite view of the Nazca Lines (Peru), with indication of some rectangular geoglyphs (Google Earth image © 2018 DigitalGlobe); and comparison of SAR backscattering from COSMO-SkyMed ascending mode scenes acquired on (b) 05/07/2018 in StripMap Himage mode (~3 m ground resolution) with horizontal transmit—horizontal receive (HH) polarization and 27° incidence angle, and (c) 16/07/2018 in Enhanced Spotlight mode (~1 m ground resolution) with vertical transmit—vertical receive (VV) polarization and 39° incidence angle. COSMO-SkyMed® Products ©ASI—Italian Space Agency—2018. All Rights Reserved.

Figure 3.
(a) Northern sector of the archaeological site of Apamea in Syria captured by a COSMO-SkyMed Enhanced Spotlight image at 1-m ground resolution acquired on 16/07/2018 in ascending mode, using an incidence angle of 41°. Detailed views of: (b) the monumental colonnade which appears very bright owing to the high double-bounce; and (c) an area of extensive looting, east of the Cardo Maximus. COSMO-SkyMed® Product ©ASI—Italian Space Agency—2018. All Rights Reserved.

Figure 4.
Comparison of a COSMO-SkyMed Enhanced Spotlight image at 1-m ground resolution acquired on 14/08/2018 in descending mode, using an incidence angle of 42°, over the archaeological site of Capo Colonna, southern Italy: (a) prior; and (b) after multi-looking. (c) Multi-temporal average of 54 COSMO-SkyMed Enhanced Spotlight images acquired in 2017–2018. Notation of the features on the ground: T, Temple of the goddess Hera; C, monumental Doric column of the temple; R, archaeological ruins; L, lighthouse; CRs, corner reflectors installed to monitor the stability of the northern cliff. COSMO-SkyMed® Products ©ASI—Italian Space Agency—2017–2018. All Rights Reserved.

Figure 5.
Comparison of (a) high resolution DEM obtained from a tandem pair of COSMO-SkyMed StripMap Himage scenes acquired at 3 m spatial resolution in May 2018, and (b) 30-m resolution ALOS Global Digital Surface Model (AW3D30 DSM) over a study area within the Wasit region in Iraq. The COSMO-SkyMed DEM highlights the presence of archaeological tells that match with the “Ancient Near East placemarks” mapped by Pedersén [45] and the sites identified by the authors on Google Earth. Other rounded patterns are clearly observed and can represent remnants of unmapped tells. COSMO-SkyMed® Product ©ASI—Italian Space Agency—2018. All Rights Reserved.

Figure 6.
(a) Backscattering anomaly in bare ground observed in a COSMO-SkyMed Enhanced Spotlight image at 1-m ground resolution acquired in the summer with an incidence angle of 39°. The soil/damp mark is also visible in very high resolution optical satellite imagery (Google Earth © DigitalGlobe) acquired in (b) summer, (c) autumn and (d) winter. COSMO-SkyMed® Product ©ASI—Italian Space Agency—2018. All Rights Reserved.

Figure 7.
(a) Satellite view of the valley of Rio Ingenio, near the town of Lacra in Peru (Google Earth image © 2018 DigitalGlobe); and (b) change detection map based on the ratio of the SAR backscattering coefficient between a pair of COSMO-SkyMed StripMap Himage mode (~3 m ground resolution) scenes acquired on 03/06/2018 and 18/07/2017. Areas in yellow to red indicate a decrease in the SAR backscatter occurred between 2017 and 2018, while areas in light to dark blue indicate an increase in the SAR backscatter (e.g., increased soil moisture content). COSMO-SkyMed® Products ©ASI—Italian Space Agency—2017–2018. All Rights Reserved.

Figure 8.
(a) Area affected by the surface disturbance event occurred on 08/12/2014 at the Hummingbird geoglyph in Nasca, Peru (Google Earth image © 2018 DigitalGlobe) and (b) COSMO-SkyMed StripMap Himage (~3 m ground resolution) InSAR coherence from cross-event pair 10/07/2014–12/04/2015 with 14 m perpendicular baseline; (c) sketch of the “plowing” event occurred on 27/01/2018 when a truck drove off the Pan-American Highway, and (d) COSMO-SkyMed StripMap Himage InSAR coherence from cross-event pair 13/12/2017–30/01/2018 with 19 m perpendicular baseline. Modified from Reference [52]. COSMO-SkyMed® Products ©ASI—Italian Space Agency—2014–2018. All Rights Reserved.

Figure 9.
(a) The 2013 vs. (b) the 2016 satellite view of a desert area near Palpa (Peru), where a mining site was developed east of the Pan-American Highway (Google Earth images © 2018 DigitalGlobe); and InSAR coherence from two pairs of COSMO-SkyMed StripMap Himage mode (~3 m ground resolution) pairs: (c) 31/07/2013–16/06/2014 (5 m perpendicular baseline) and (d) 10/07/2014–05/07/2015 (30 m perpendicular baseline). COSMO-SkyMed® Products ©ASI—Italian Space Agency—2013–2015. All Rights Reserved.

Figure 10.
Texture map of the northern sector of the archaeological site of Apamea in Syria extracted from a COSMO-SkyMed Enhanced Spotlight image at 1-m ground resolution acquired on 16/07/2018 in ascending mode, using an incidence angle of 41°. Texture allows the looted areas to be separated from the un-looted fields in the privately-owned fields on the west (yellow dashed line). COSMO-SkyMed® Product ©ASI—Italian Space Agency—2018. All Rights Reserved.

Figure 11.
(a) Change detection map of the site of Mari (Tell Hariri), Syria, obtained by ratioing a pair of COSMO-SkyMed StripMap Himage images at 3 m resolution acquired on 10/03/2010 (prior to the civil war) and 10/08/2018 in descending mode, using an incidence angle of 40°. (b) The inset shows the area of the covered temple of the Royal Palace, where a pattern of increased backscatter is clearly observed. COSMO-SkyMed® Products ©ASI—Italian Space Agency—2010–2018. All Rights Reserved.


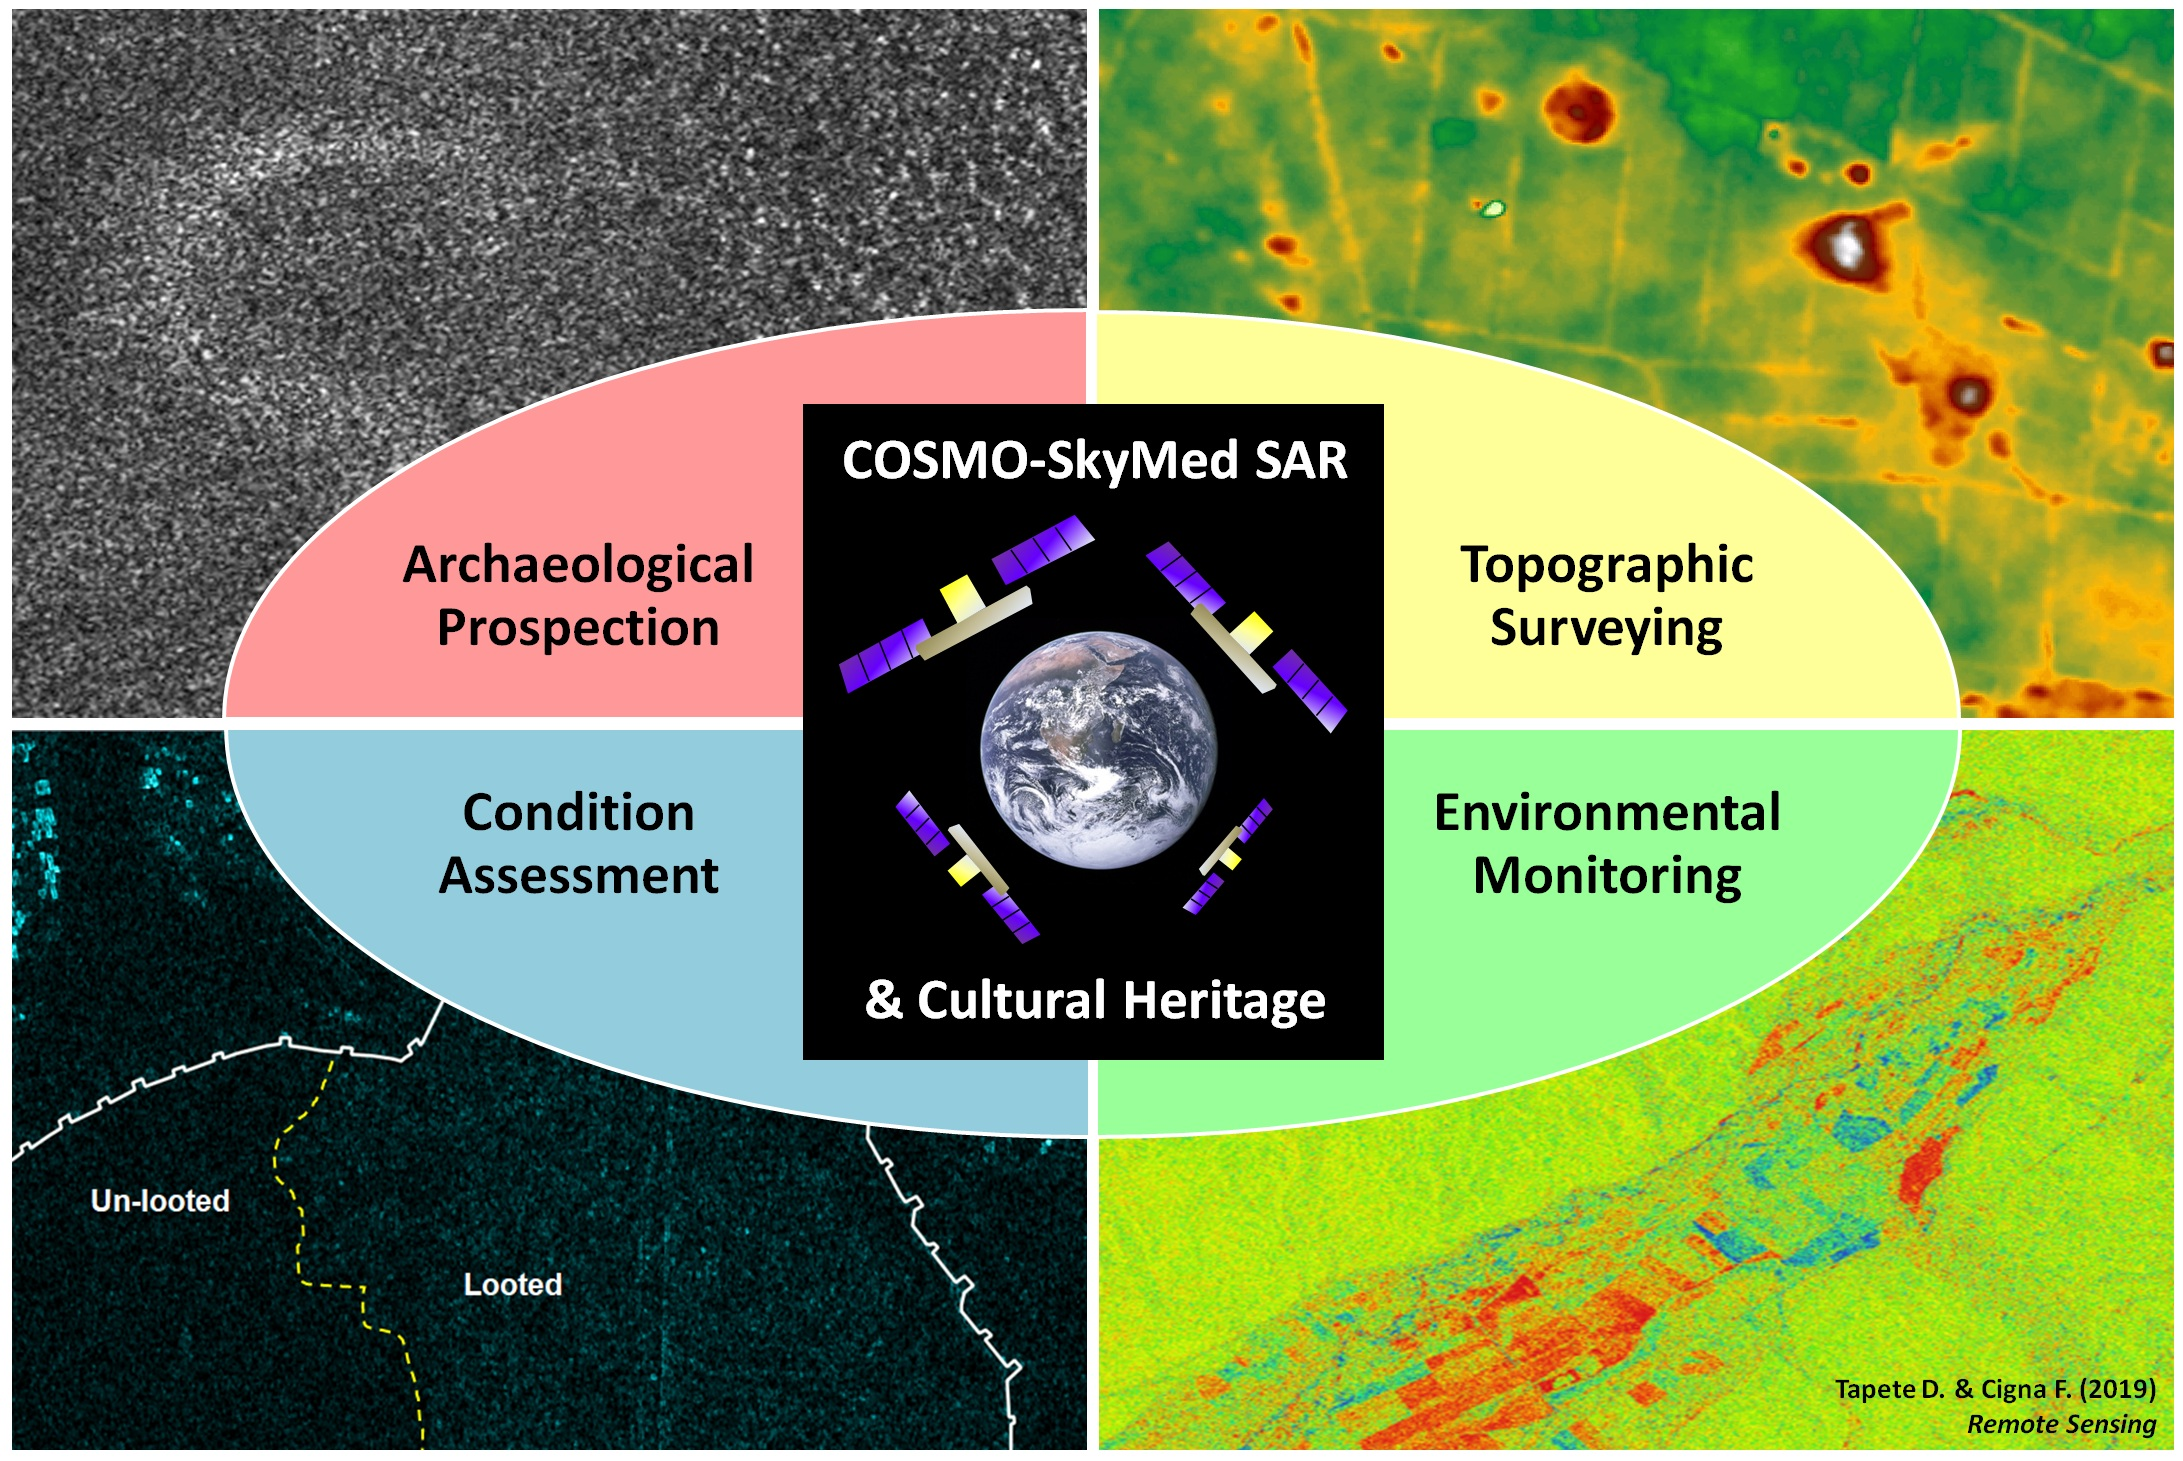
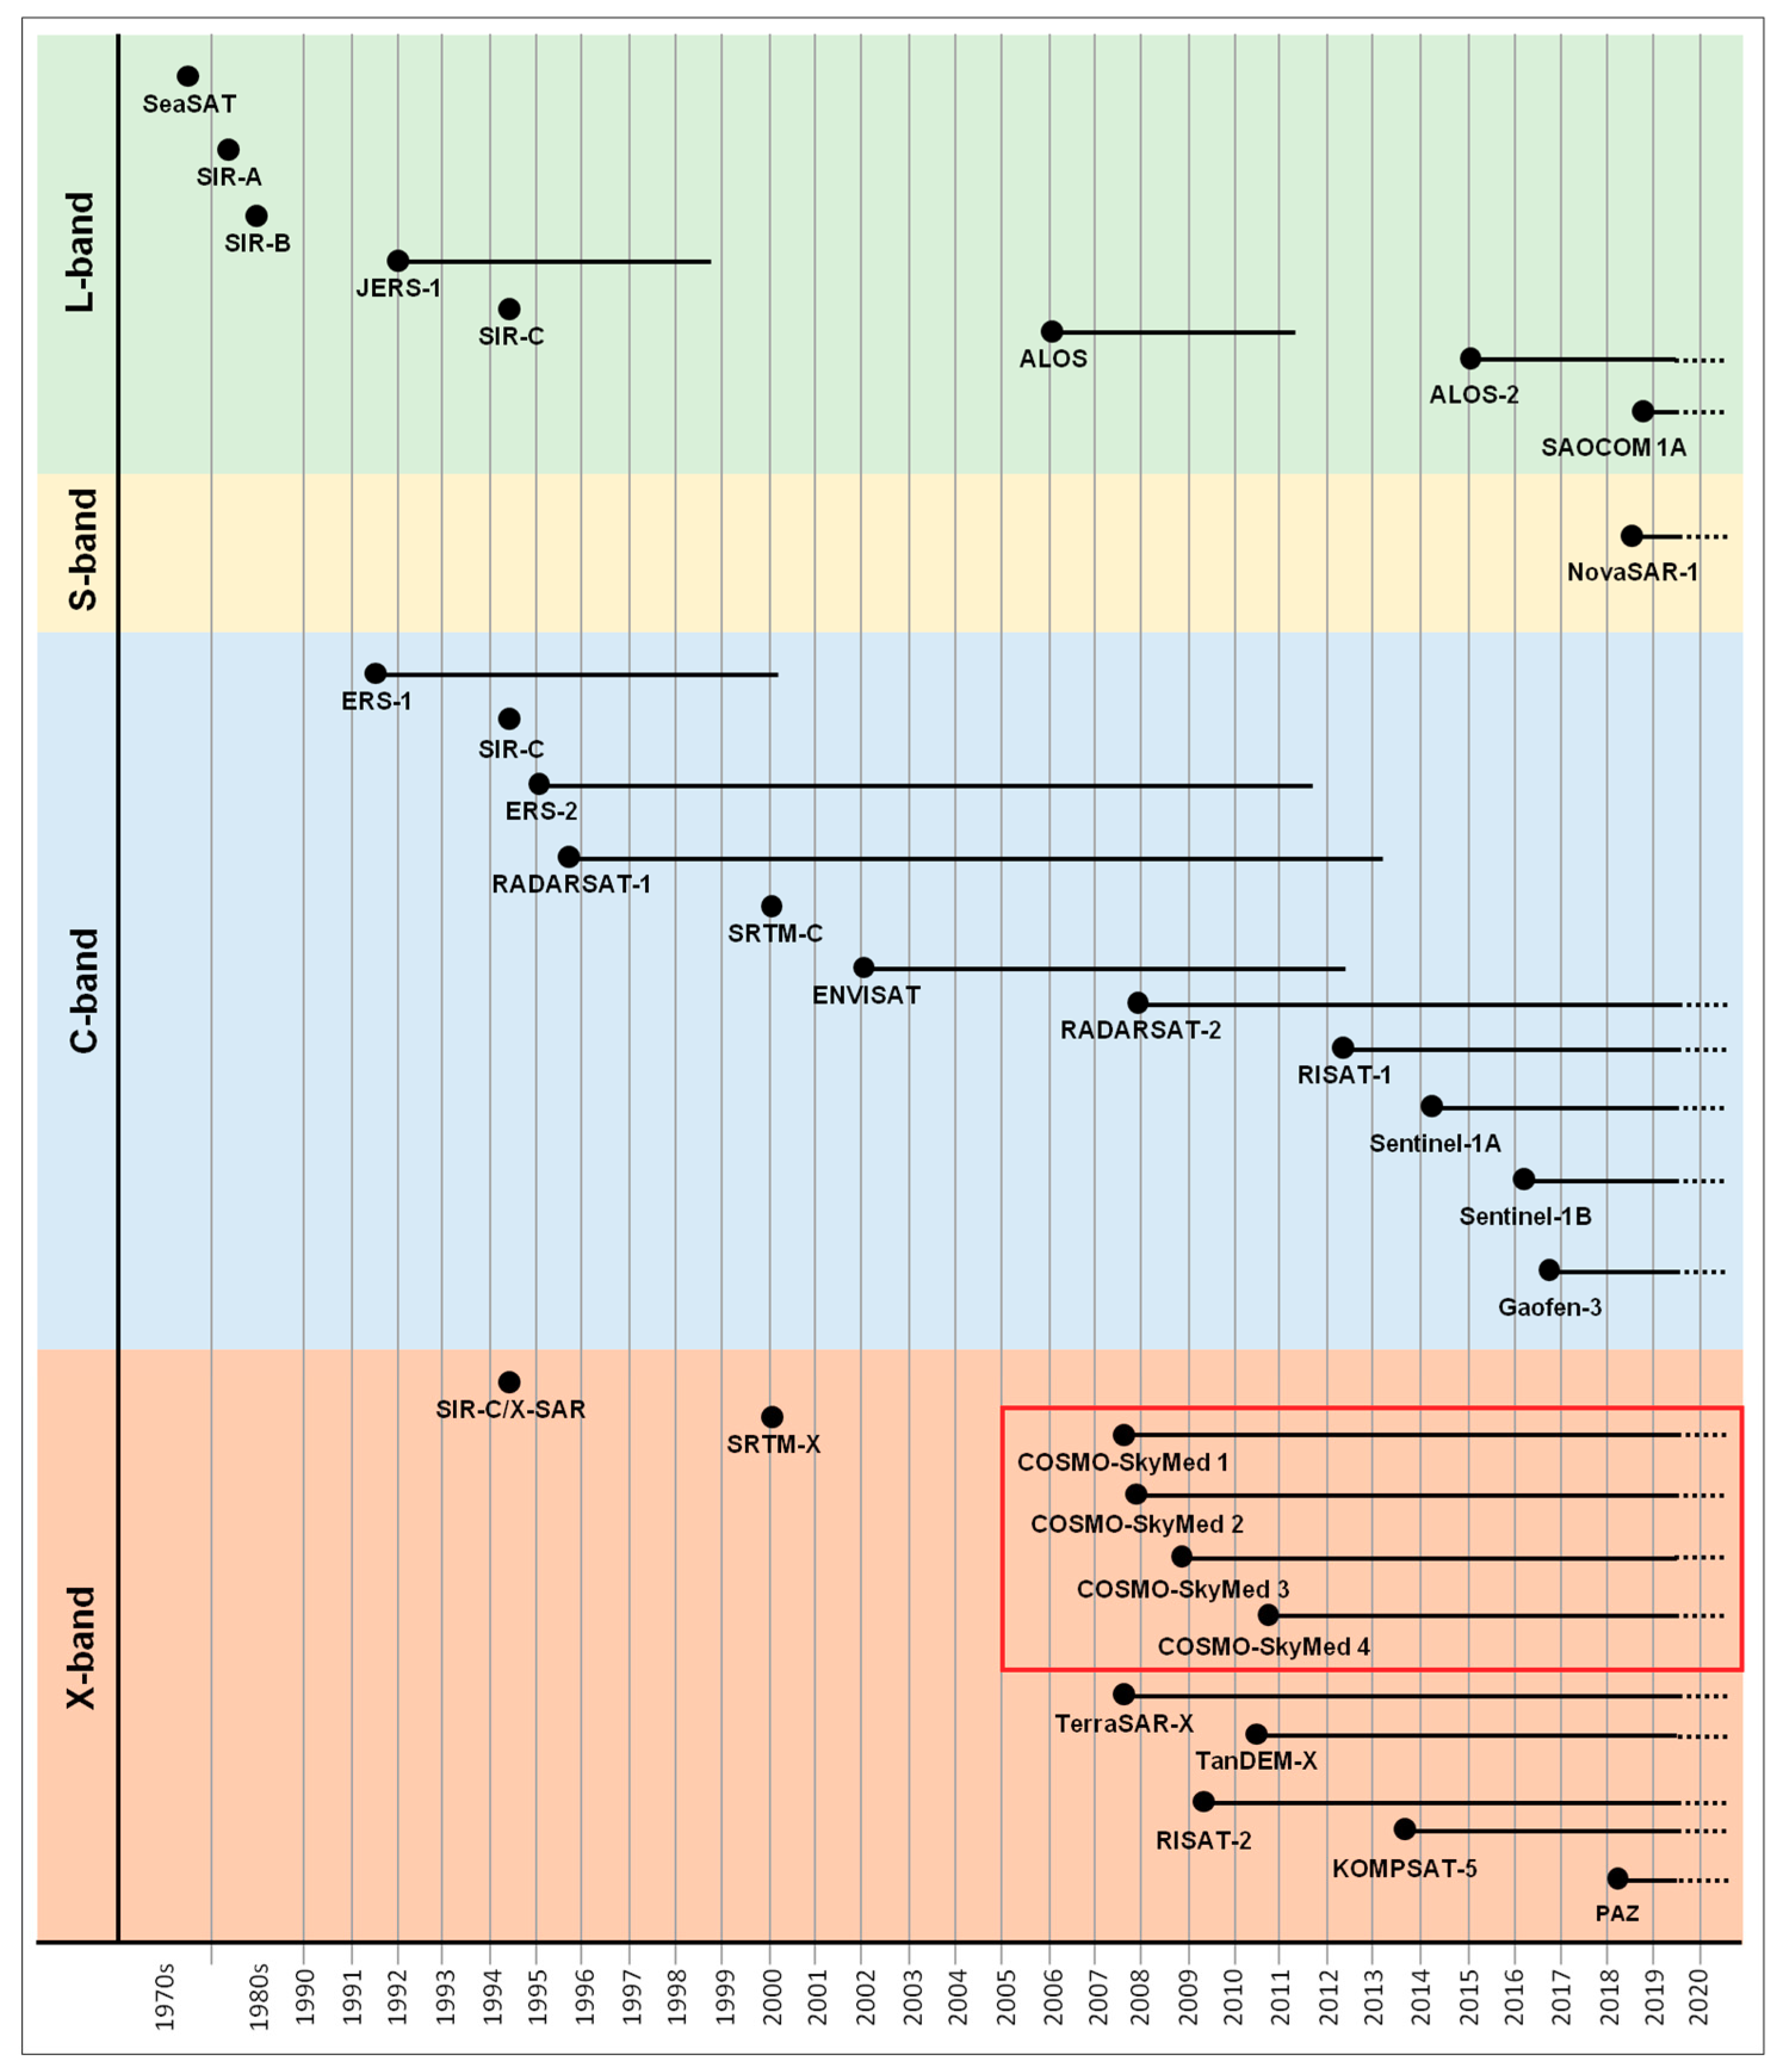
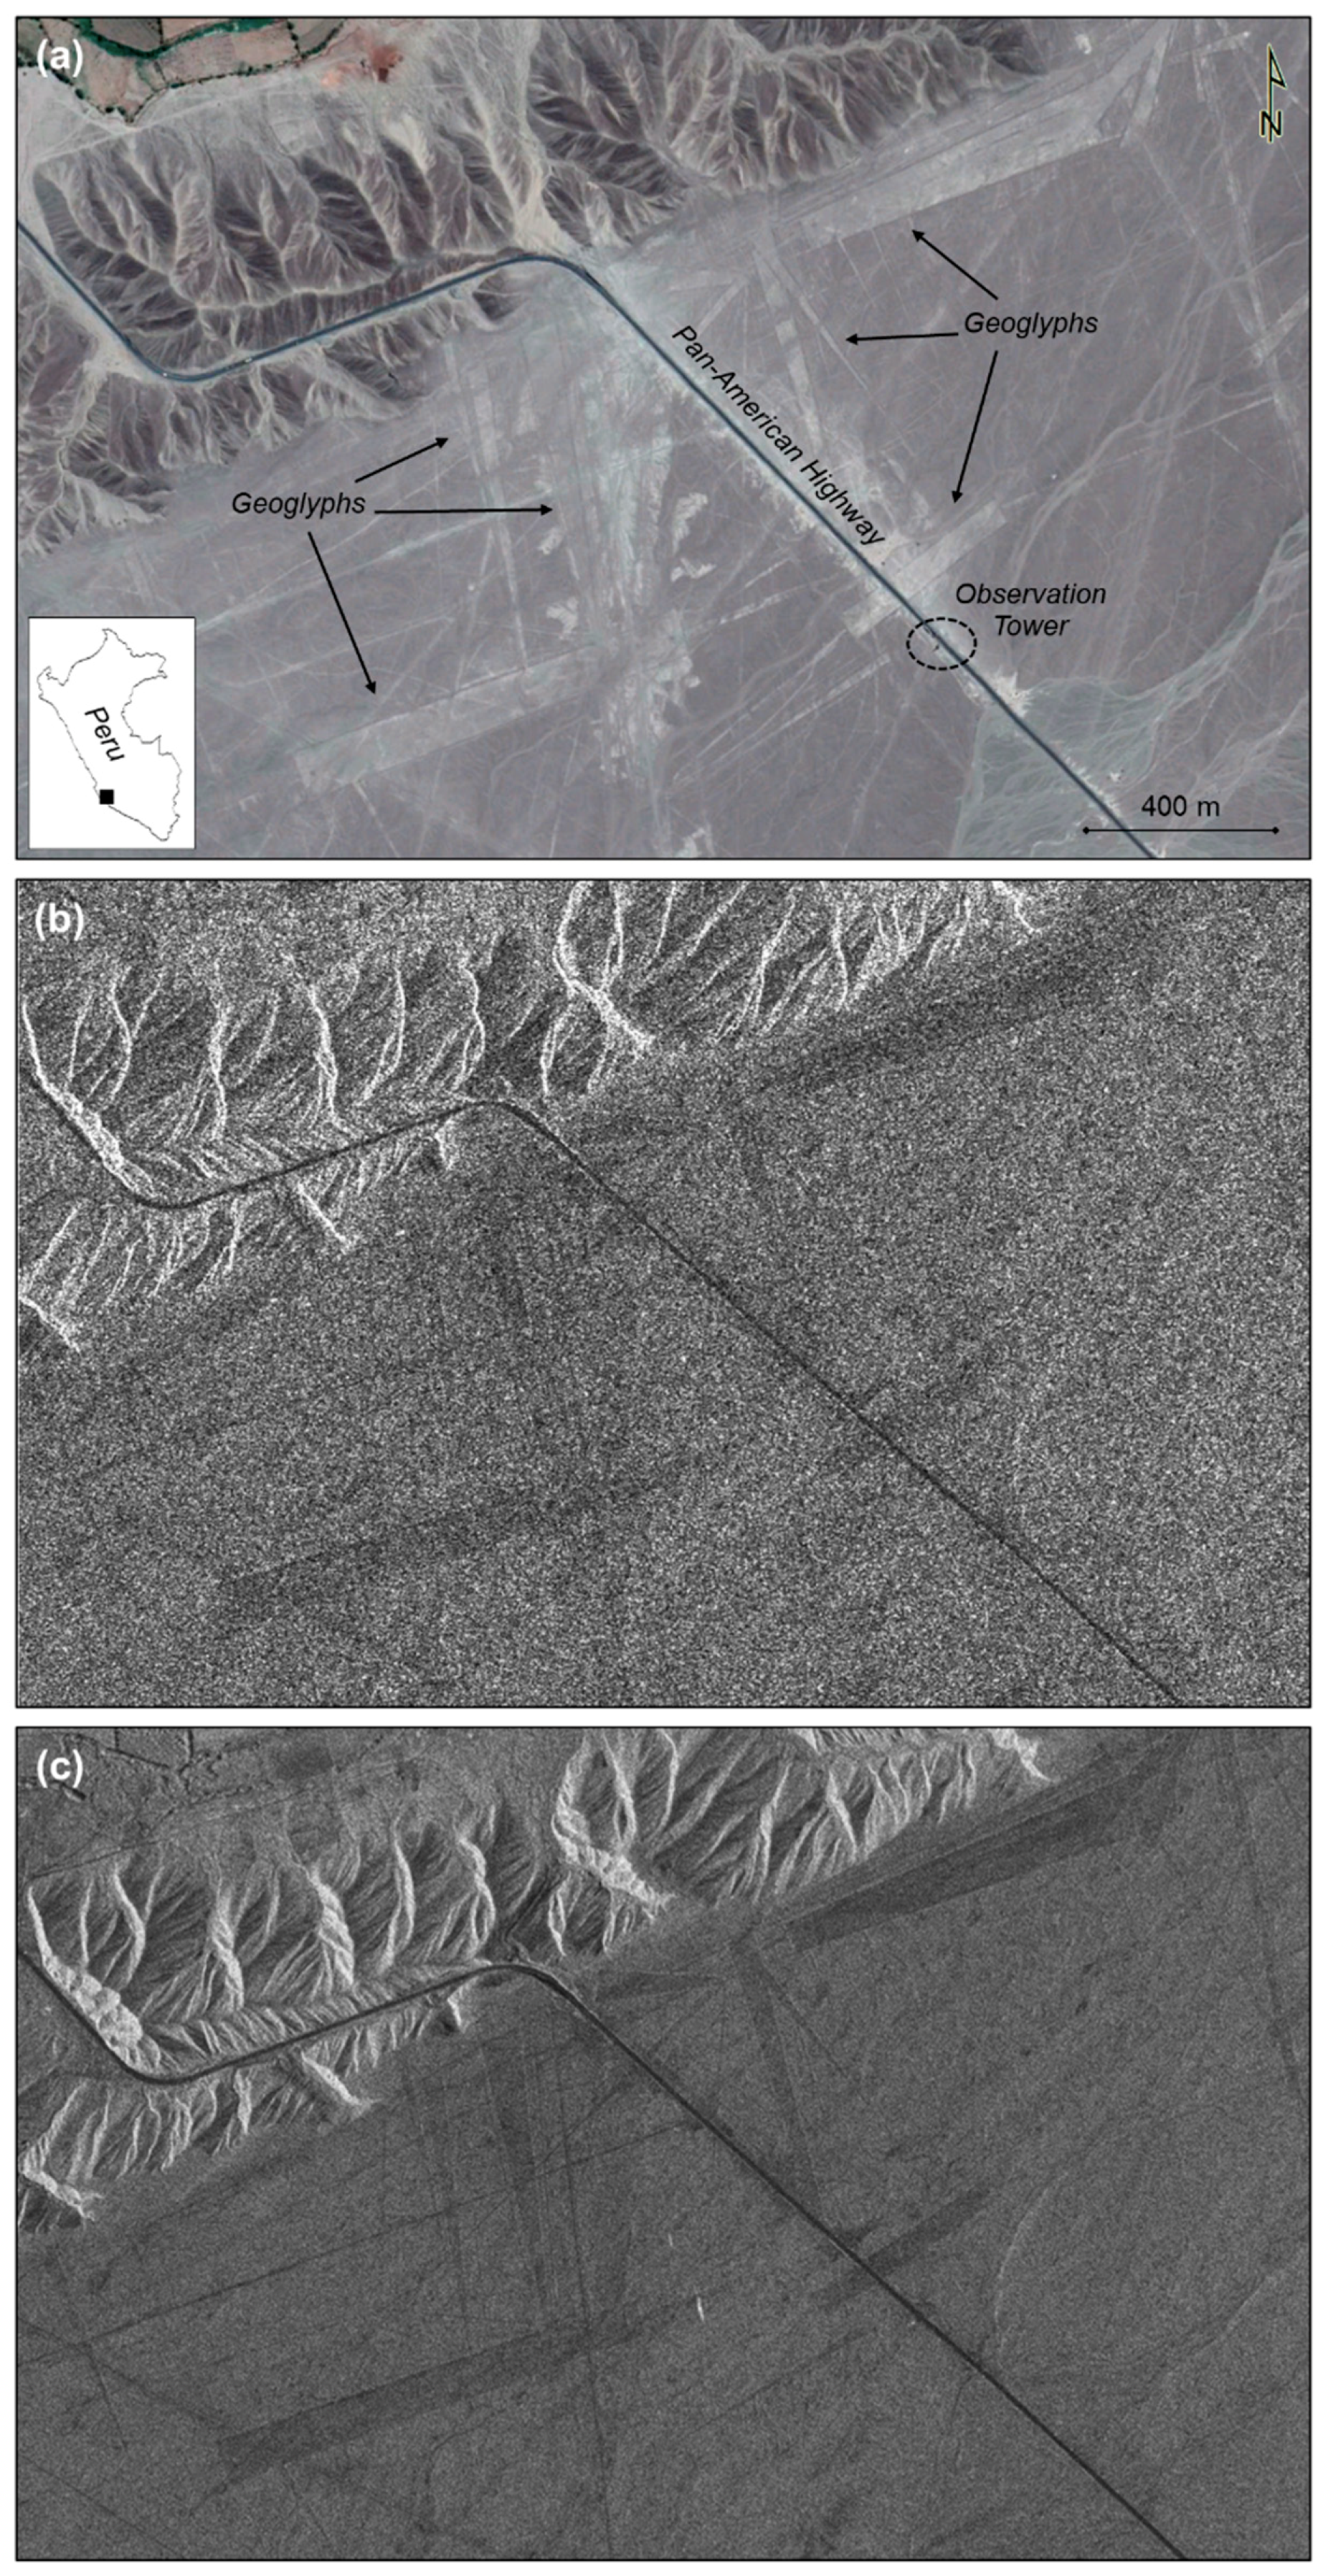
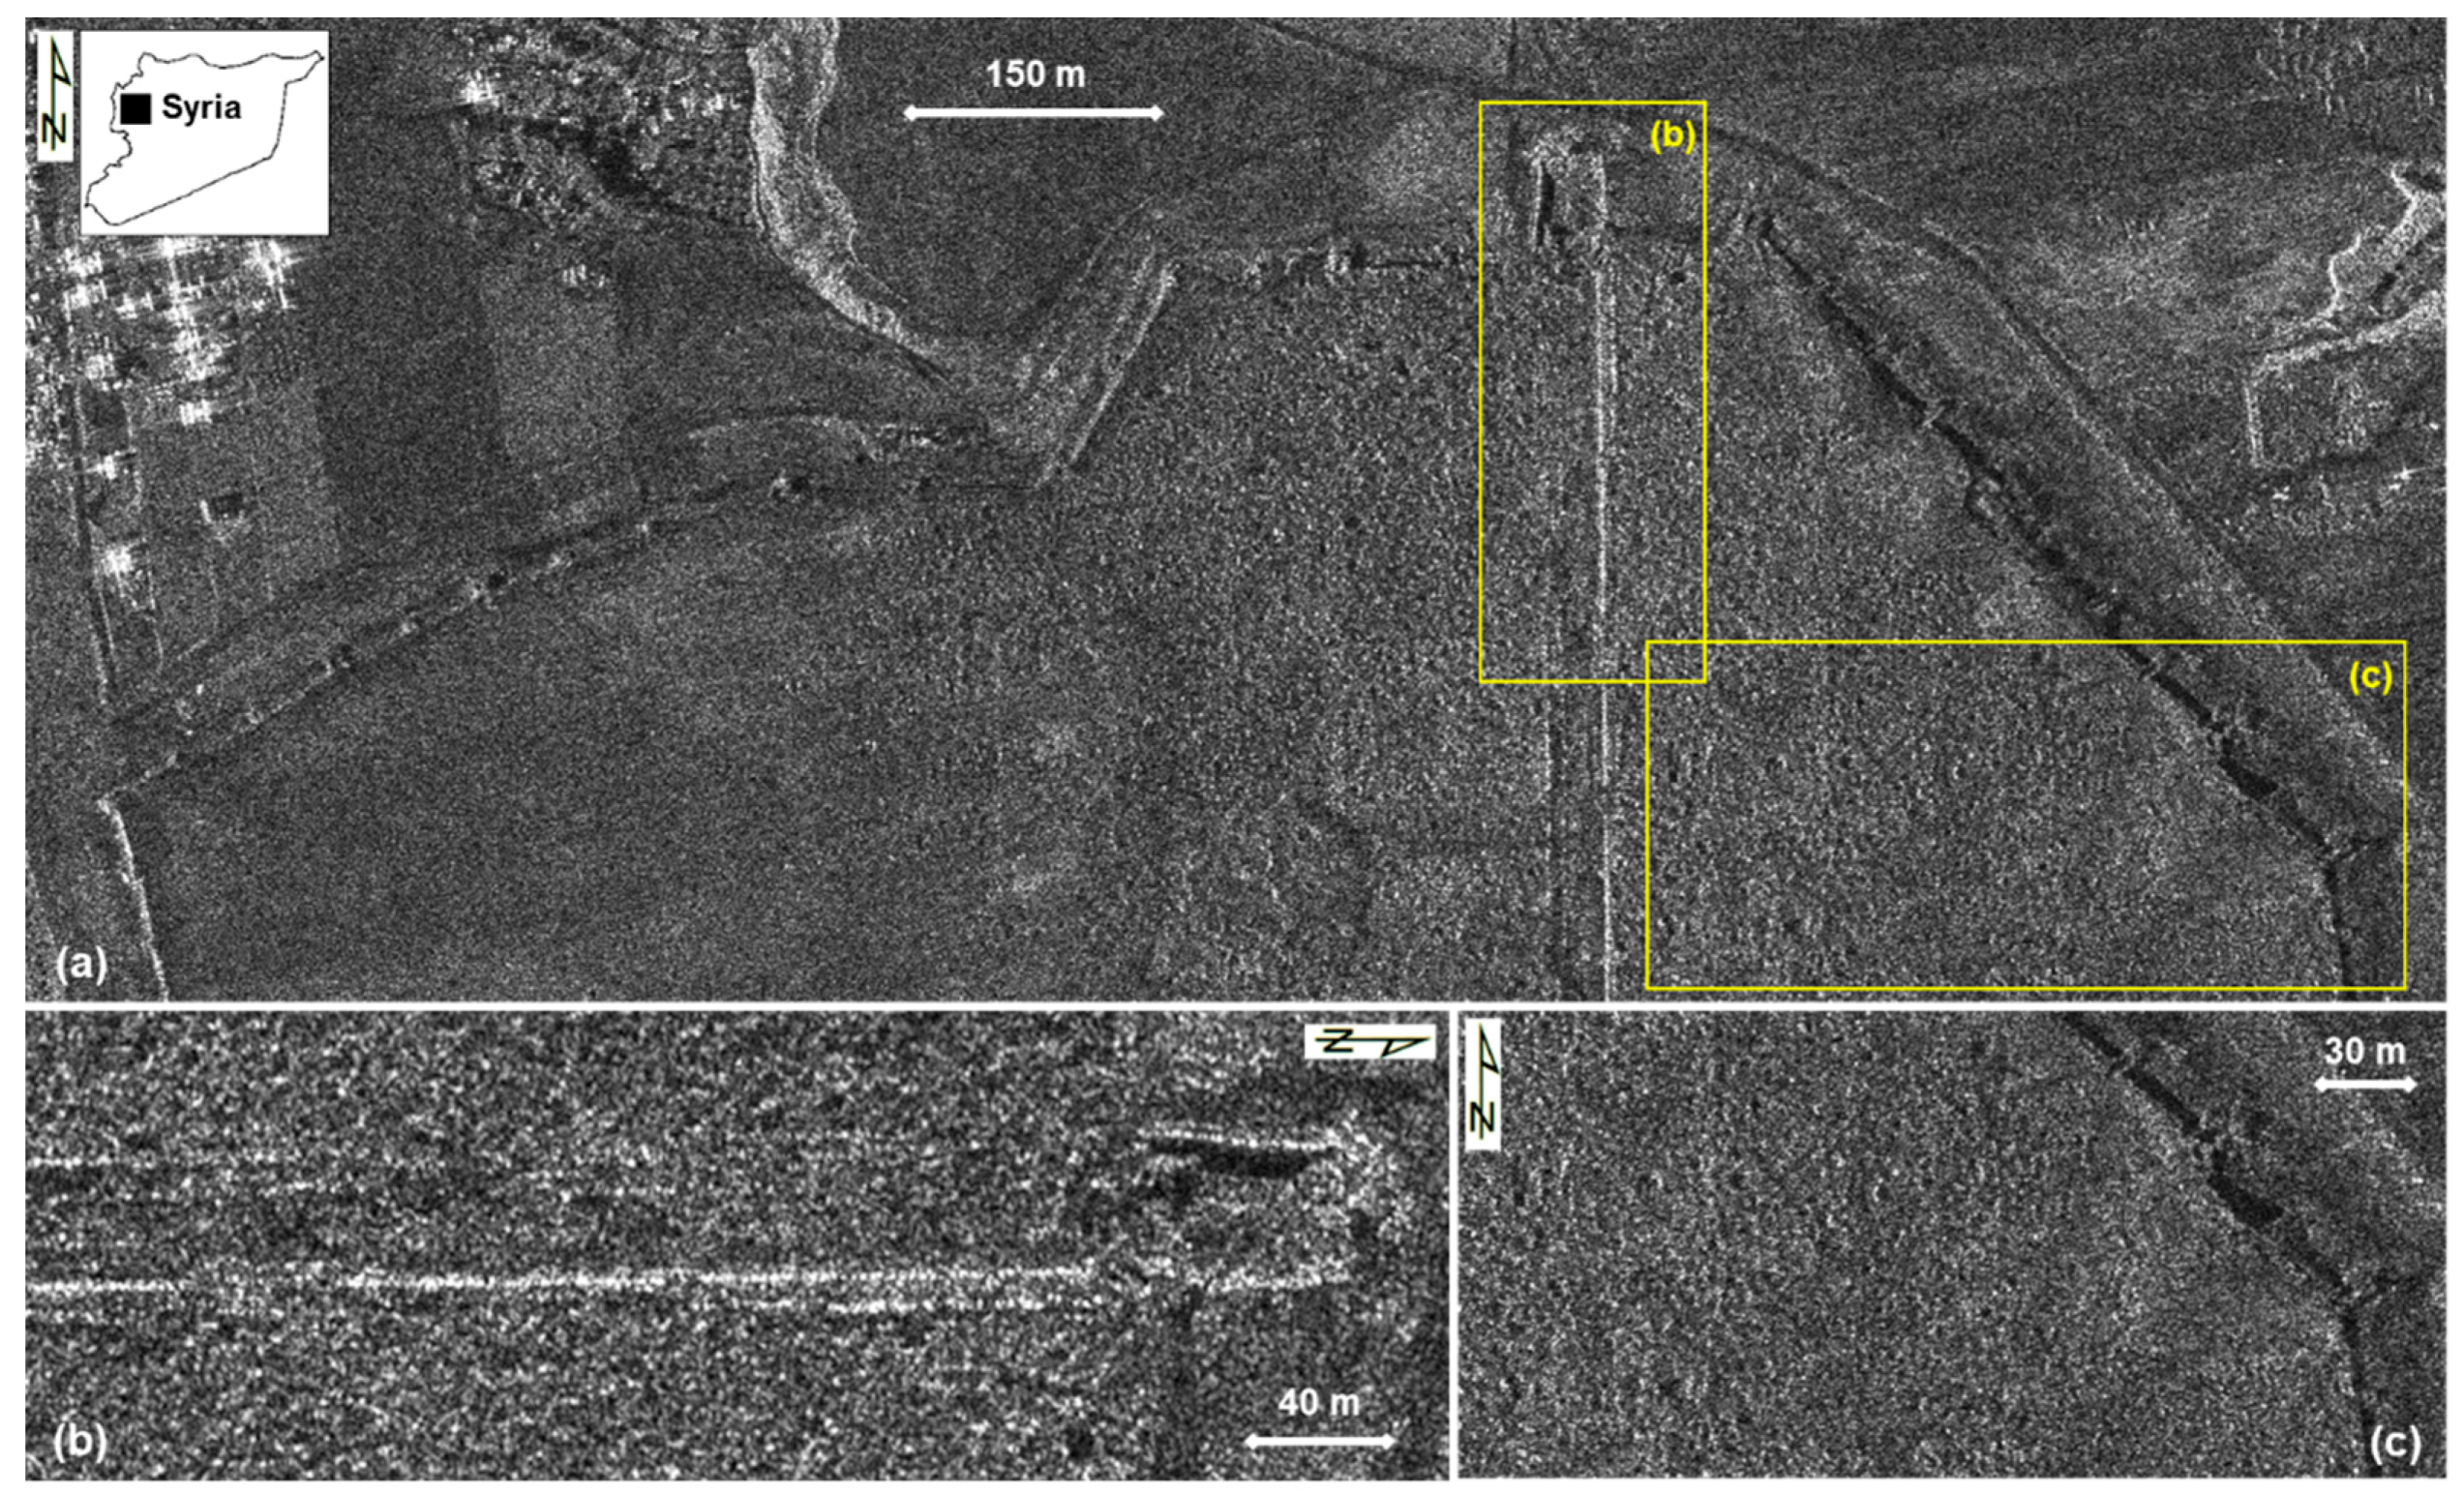
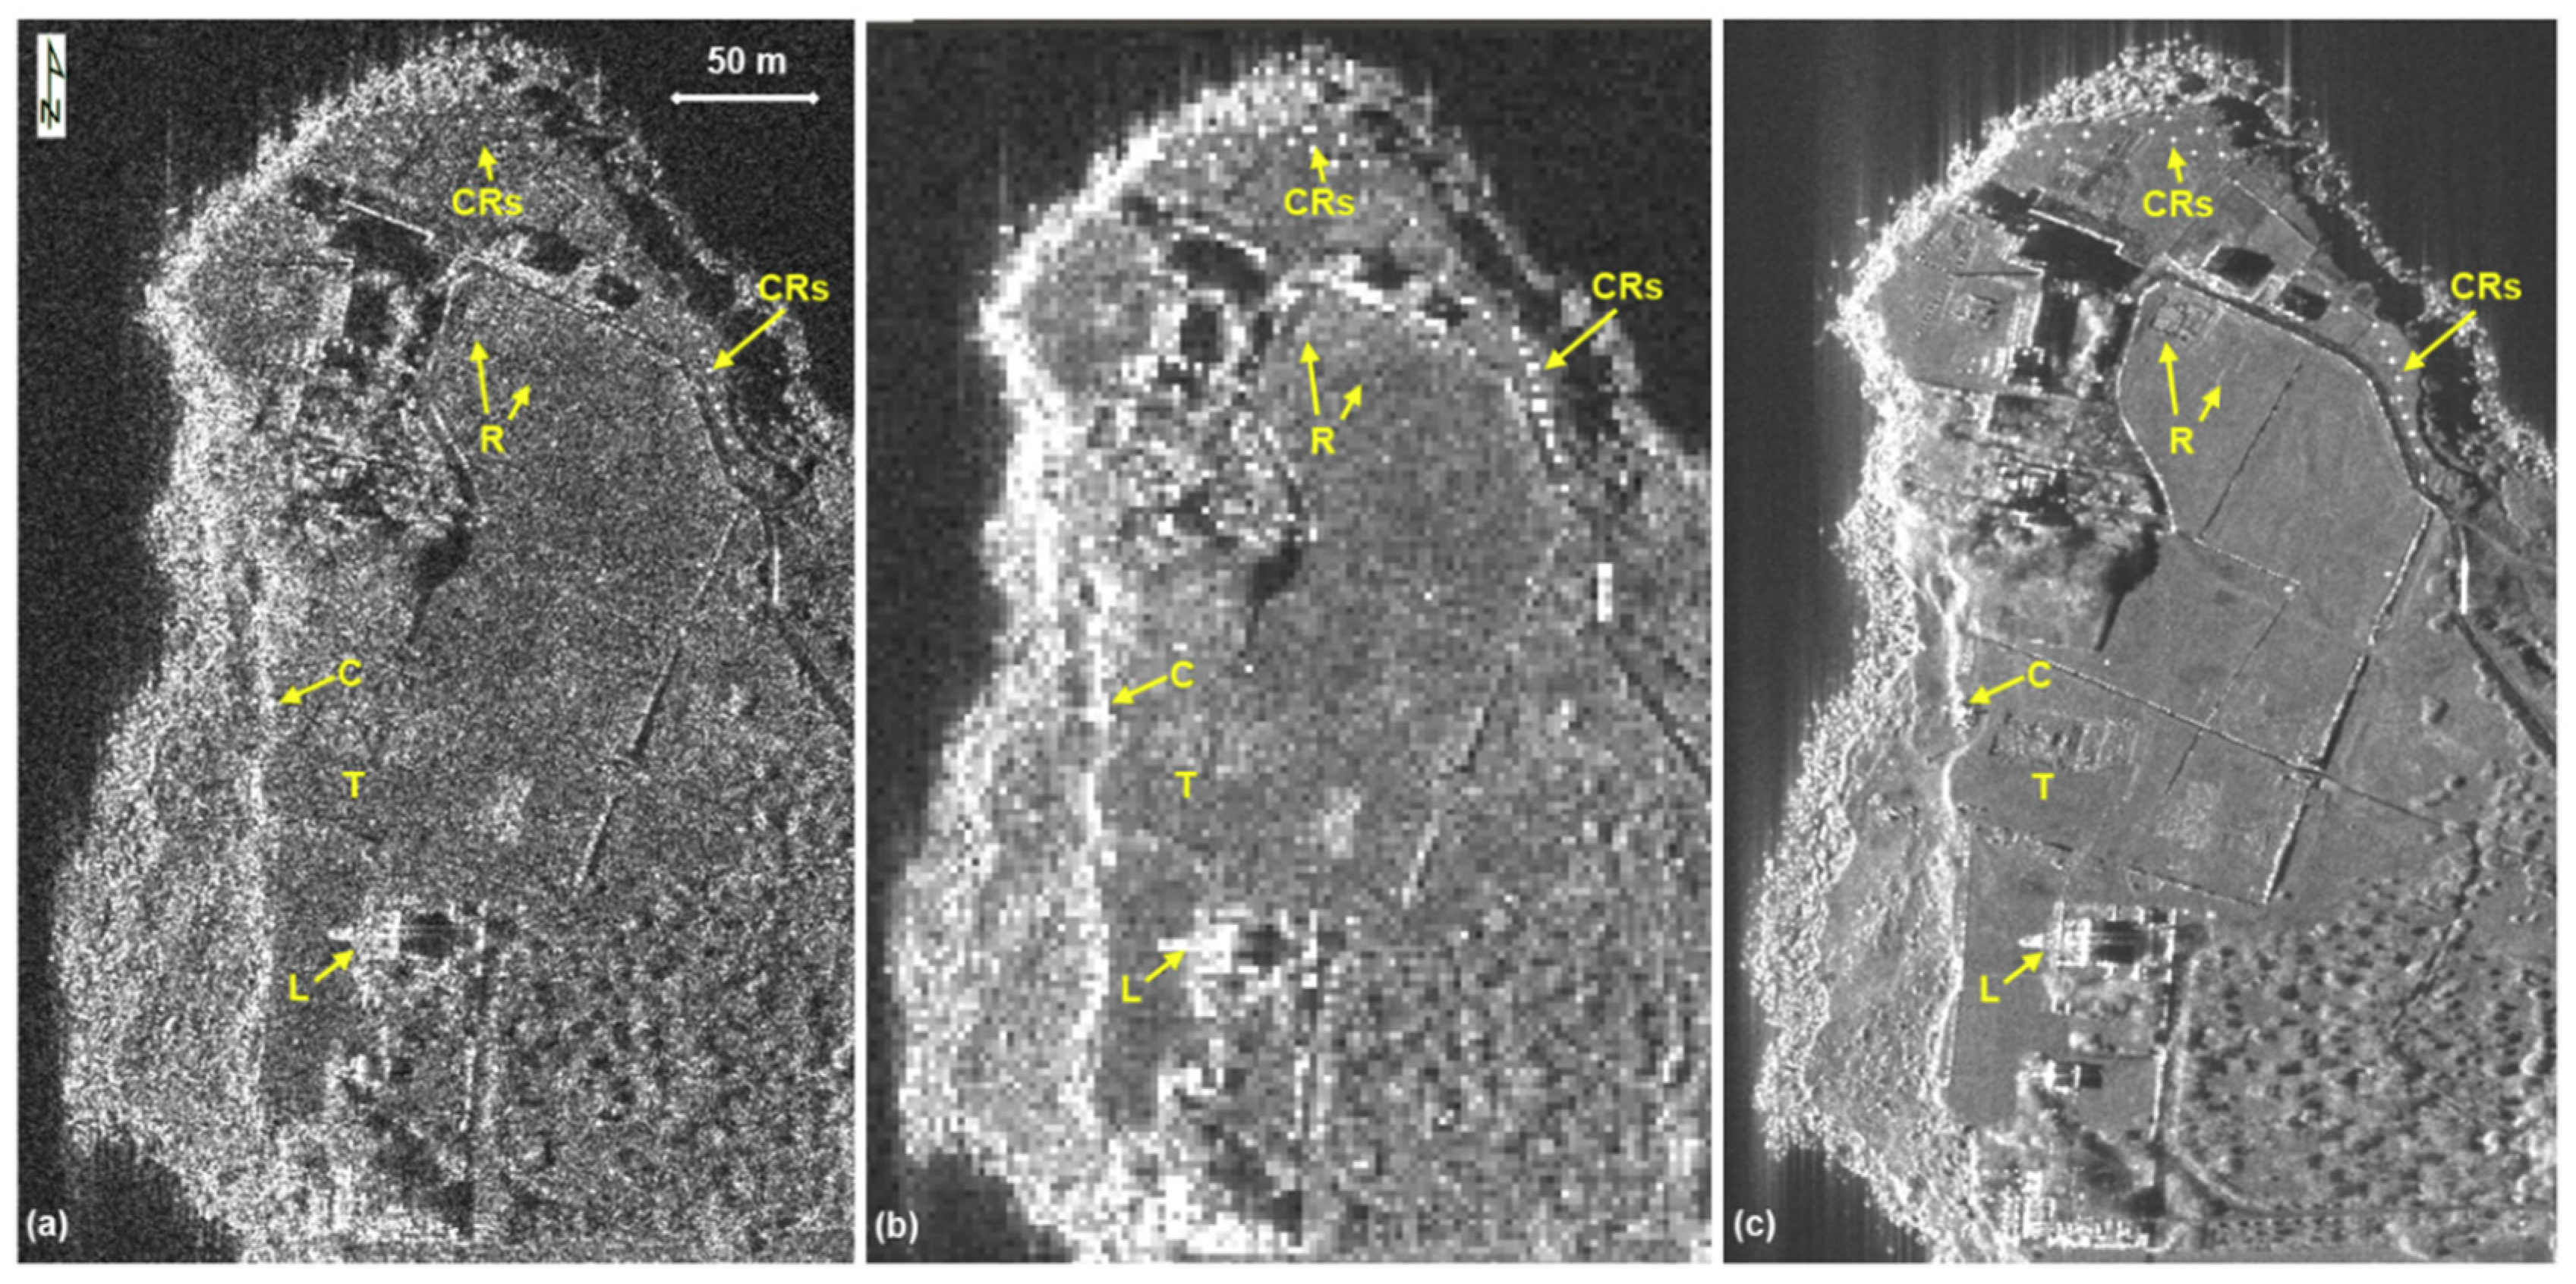
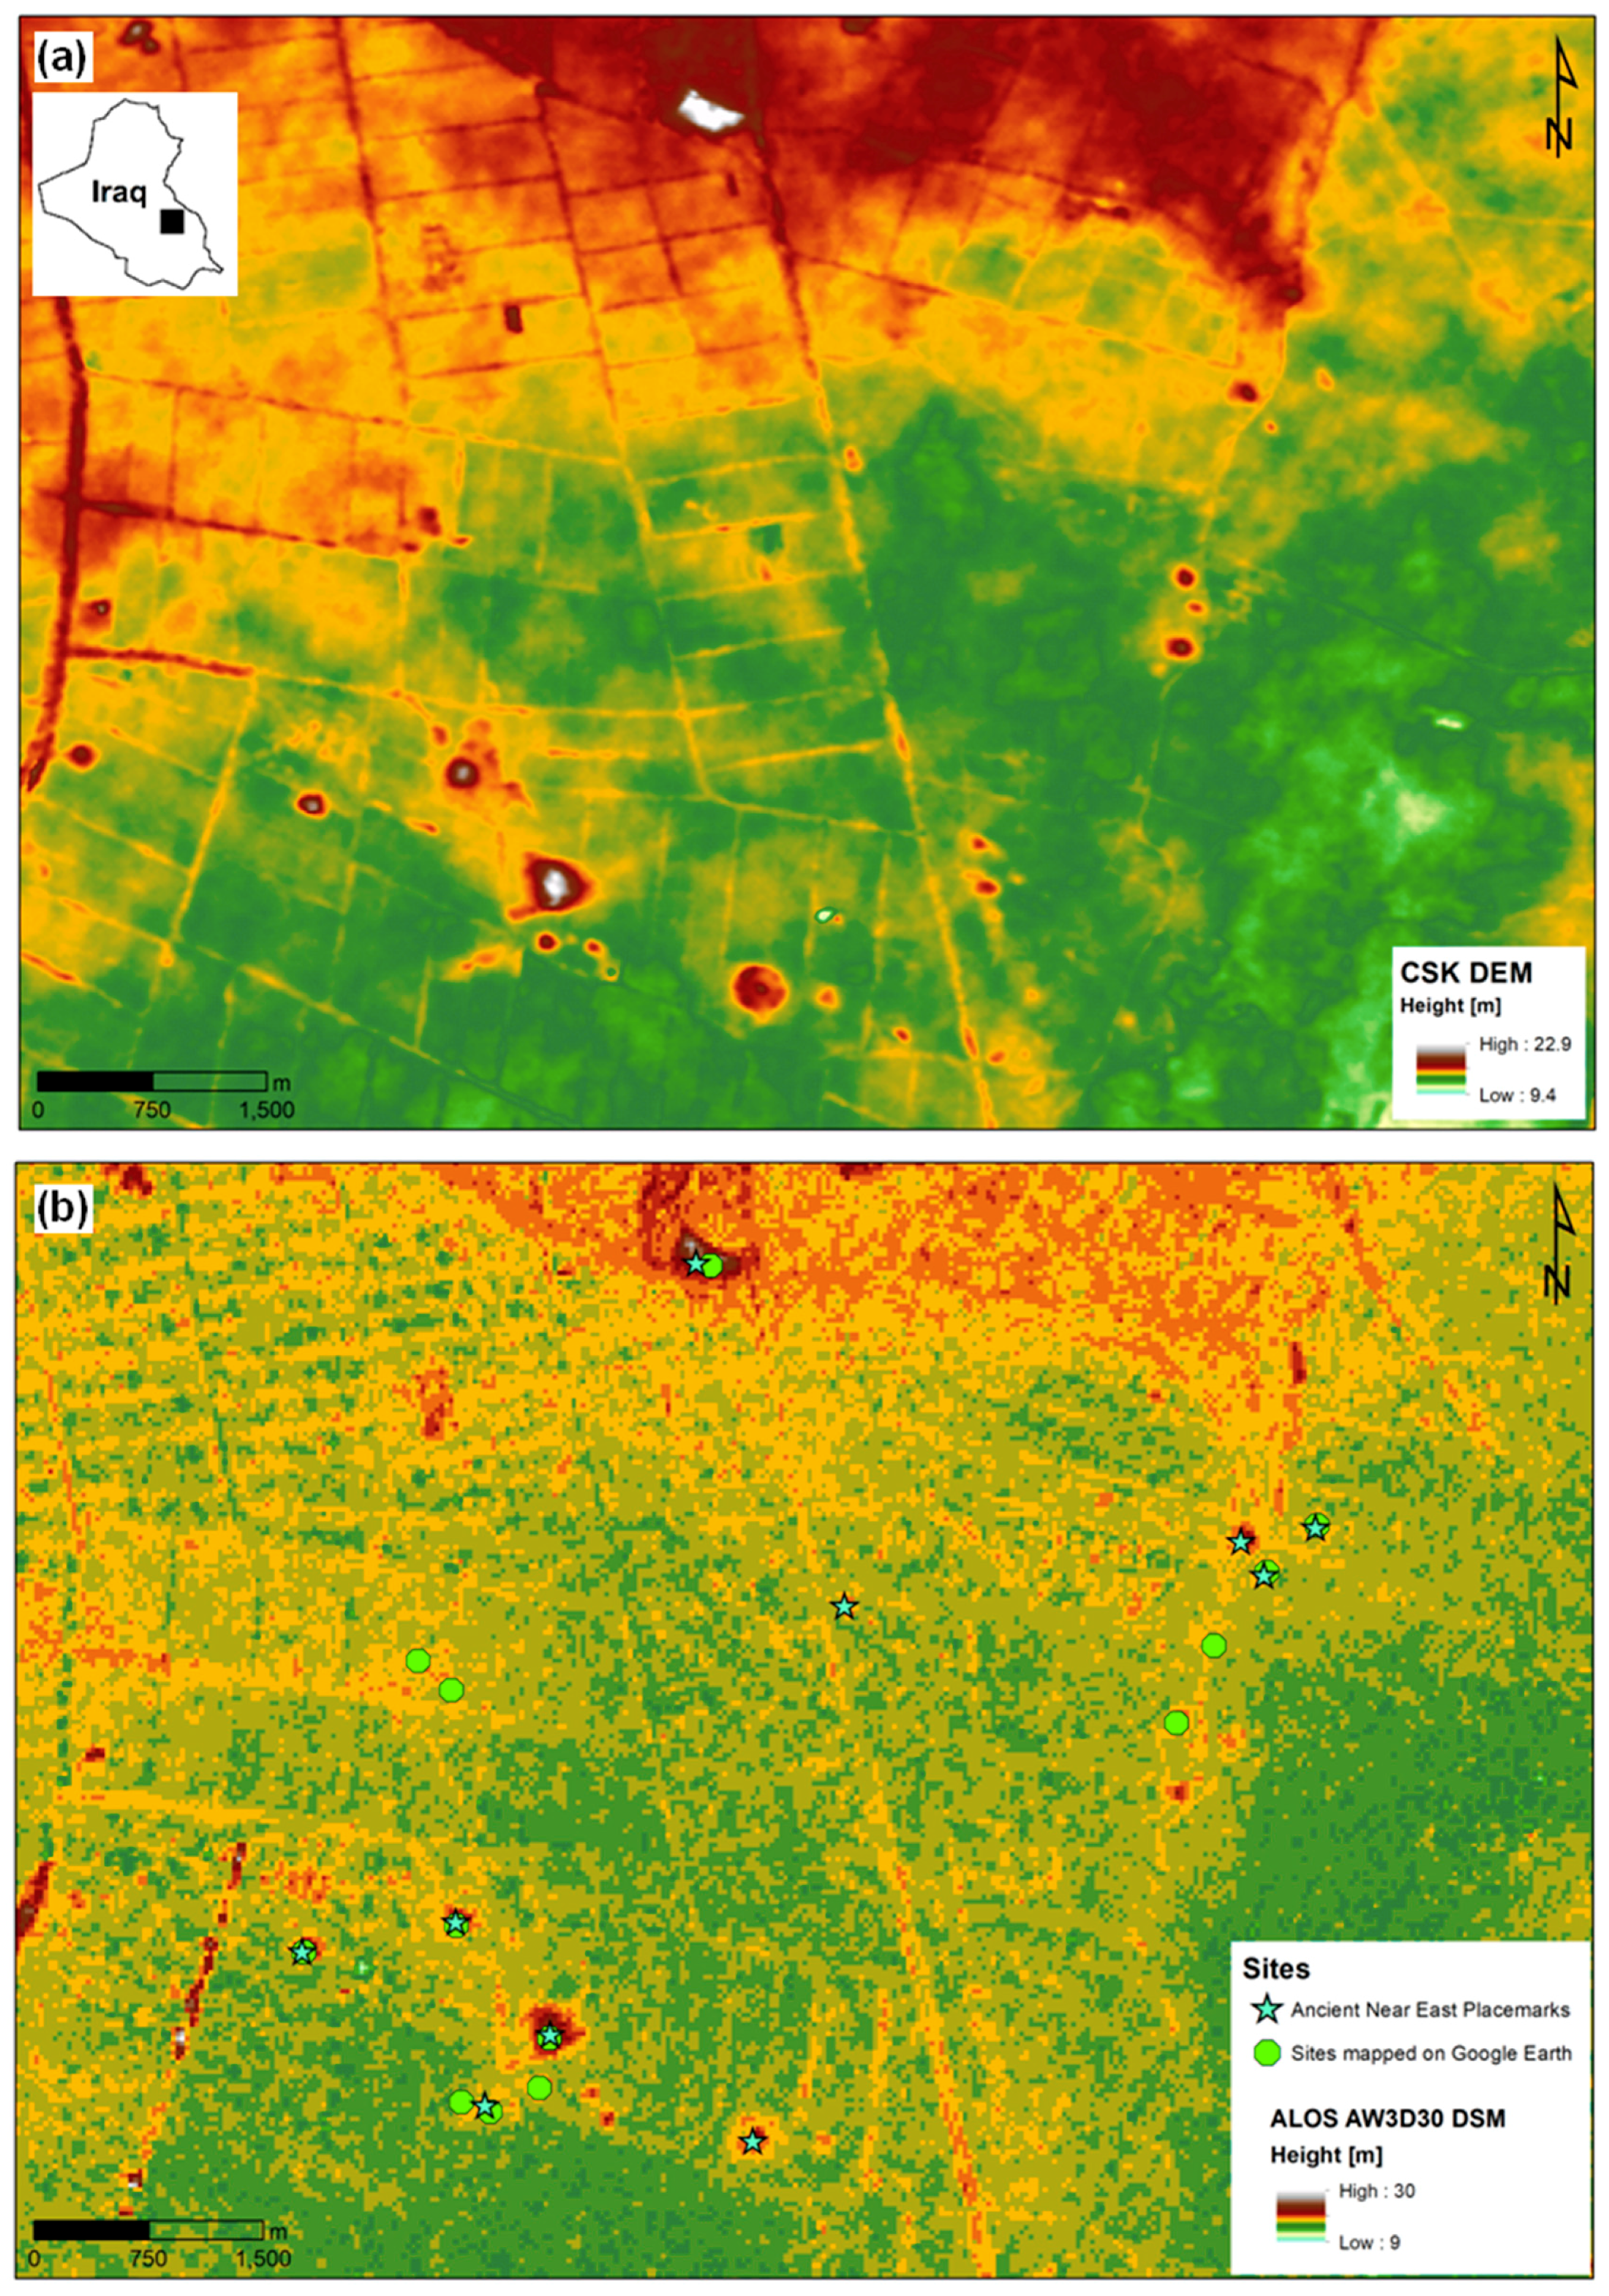
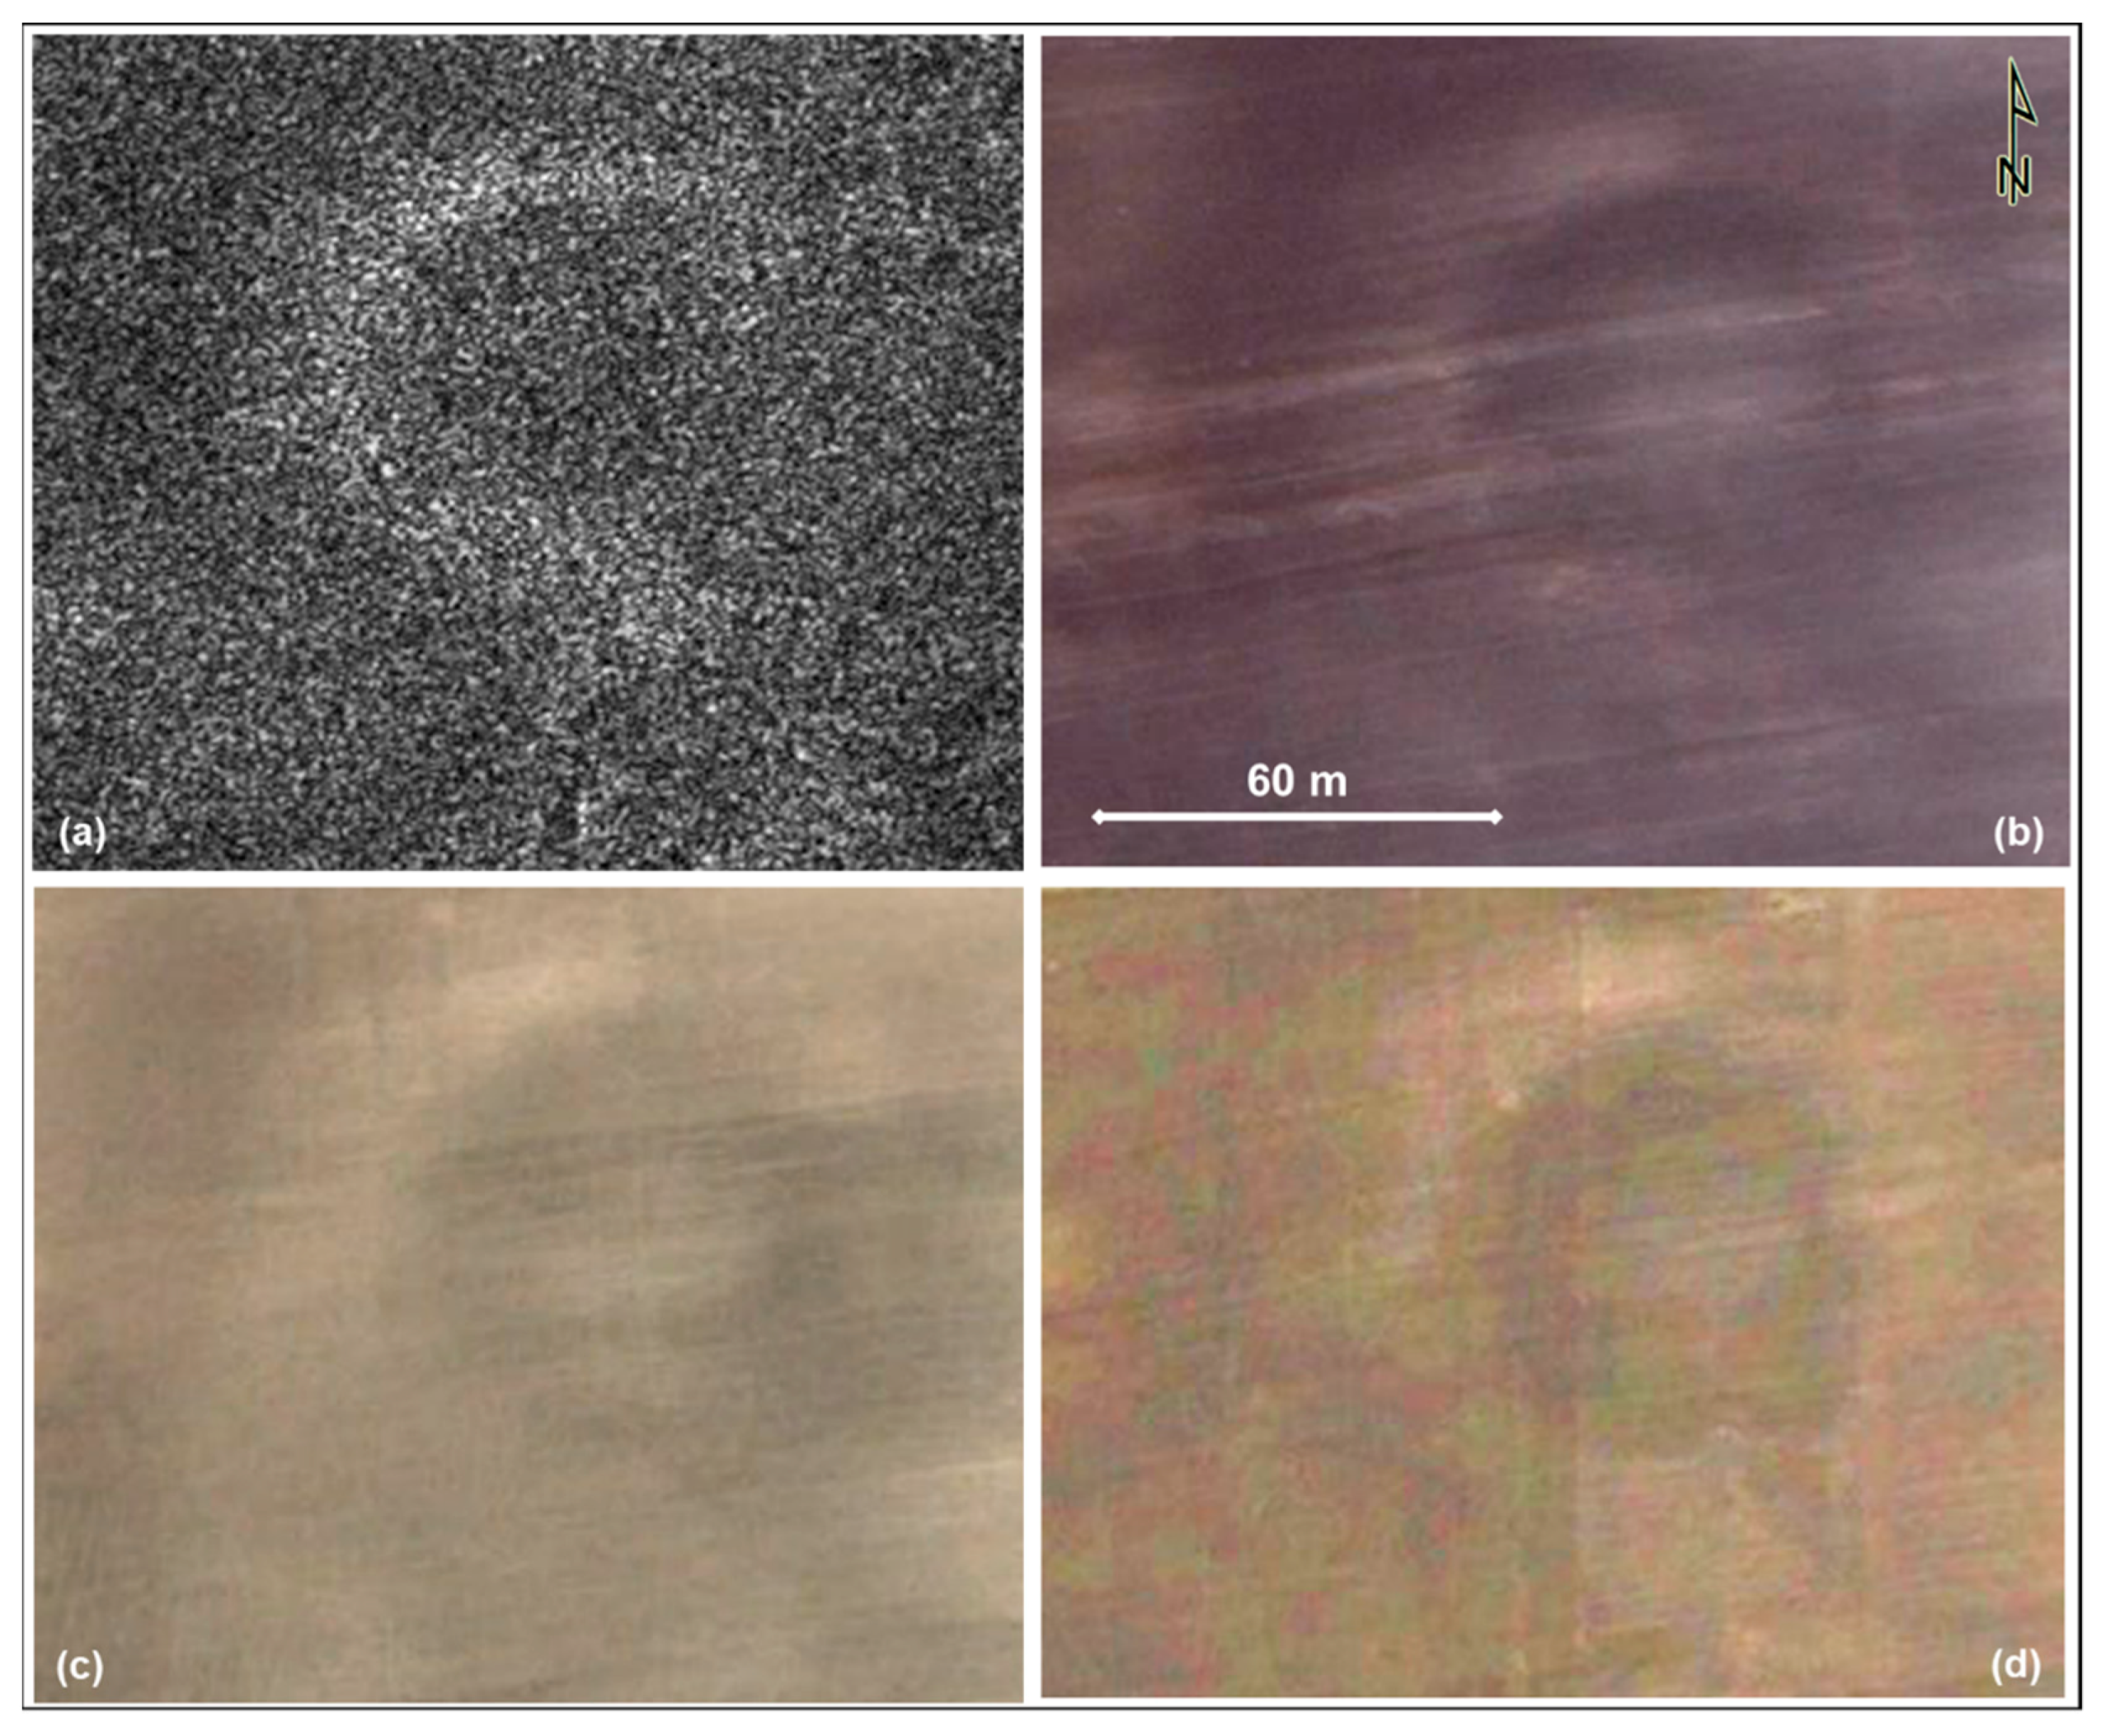
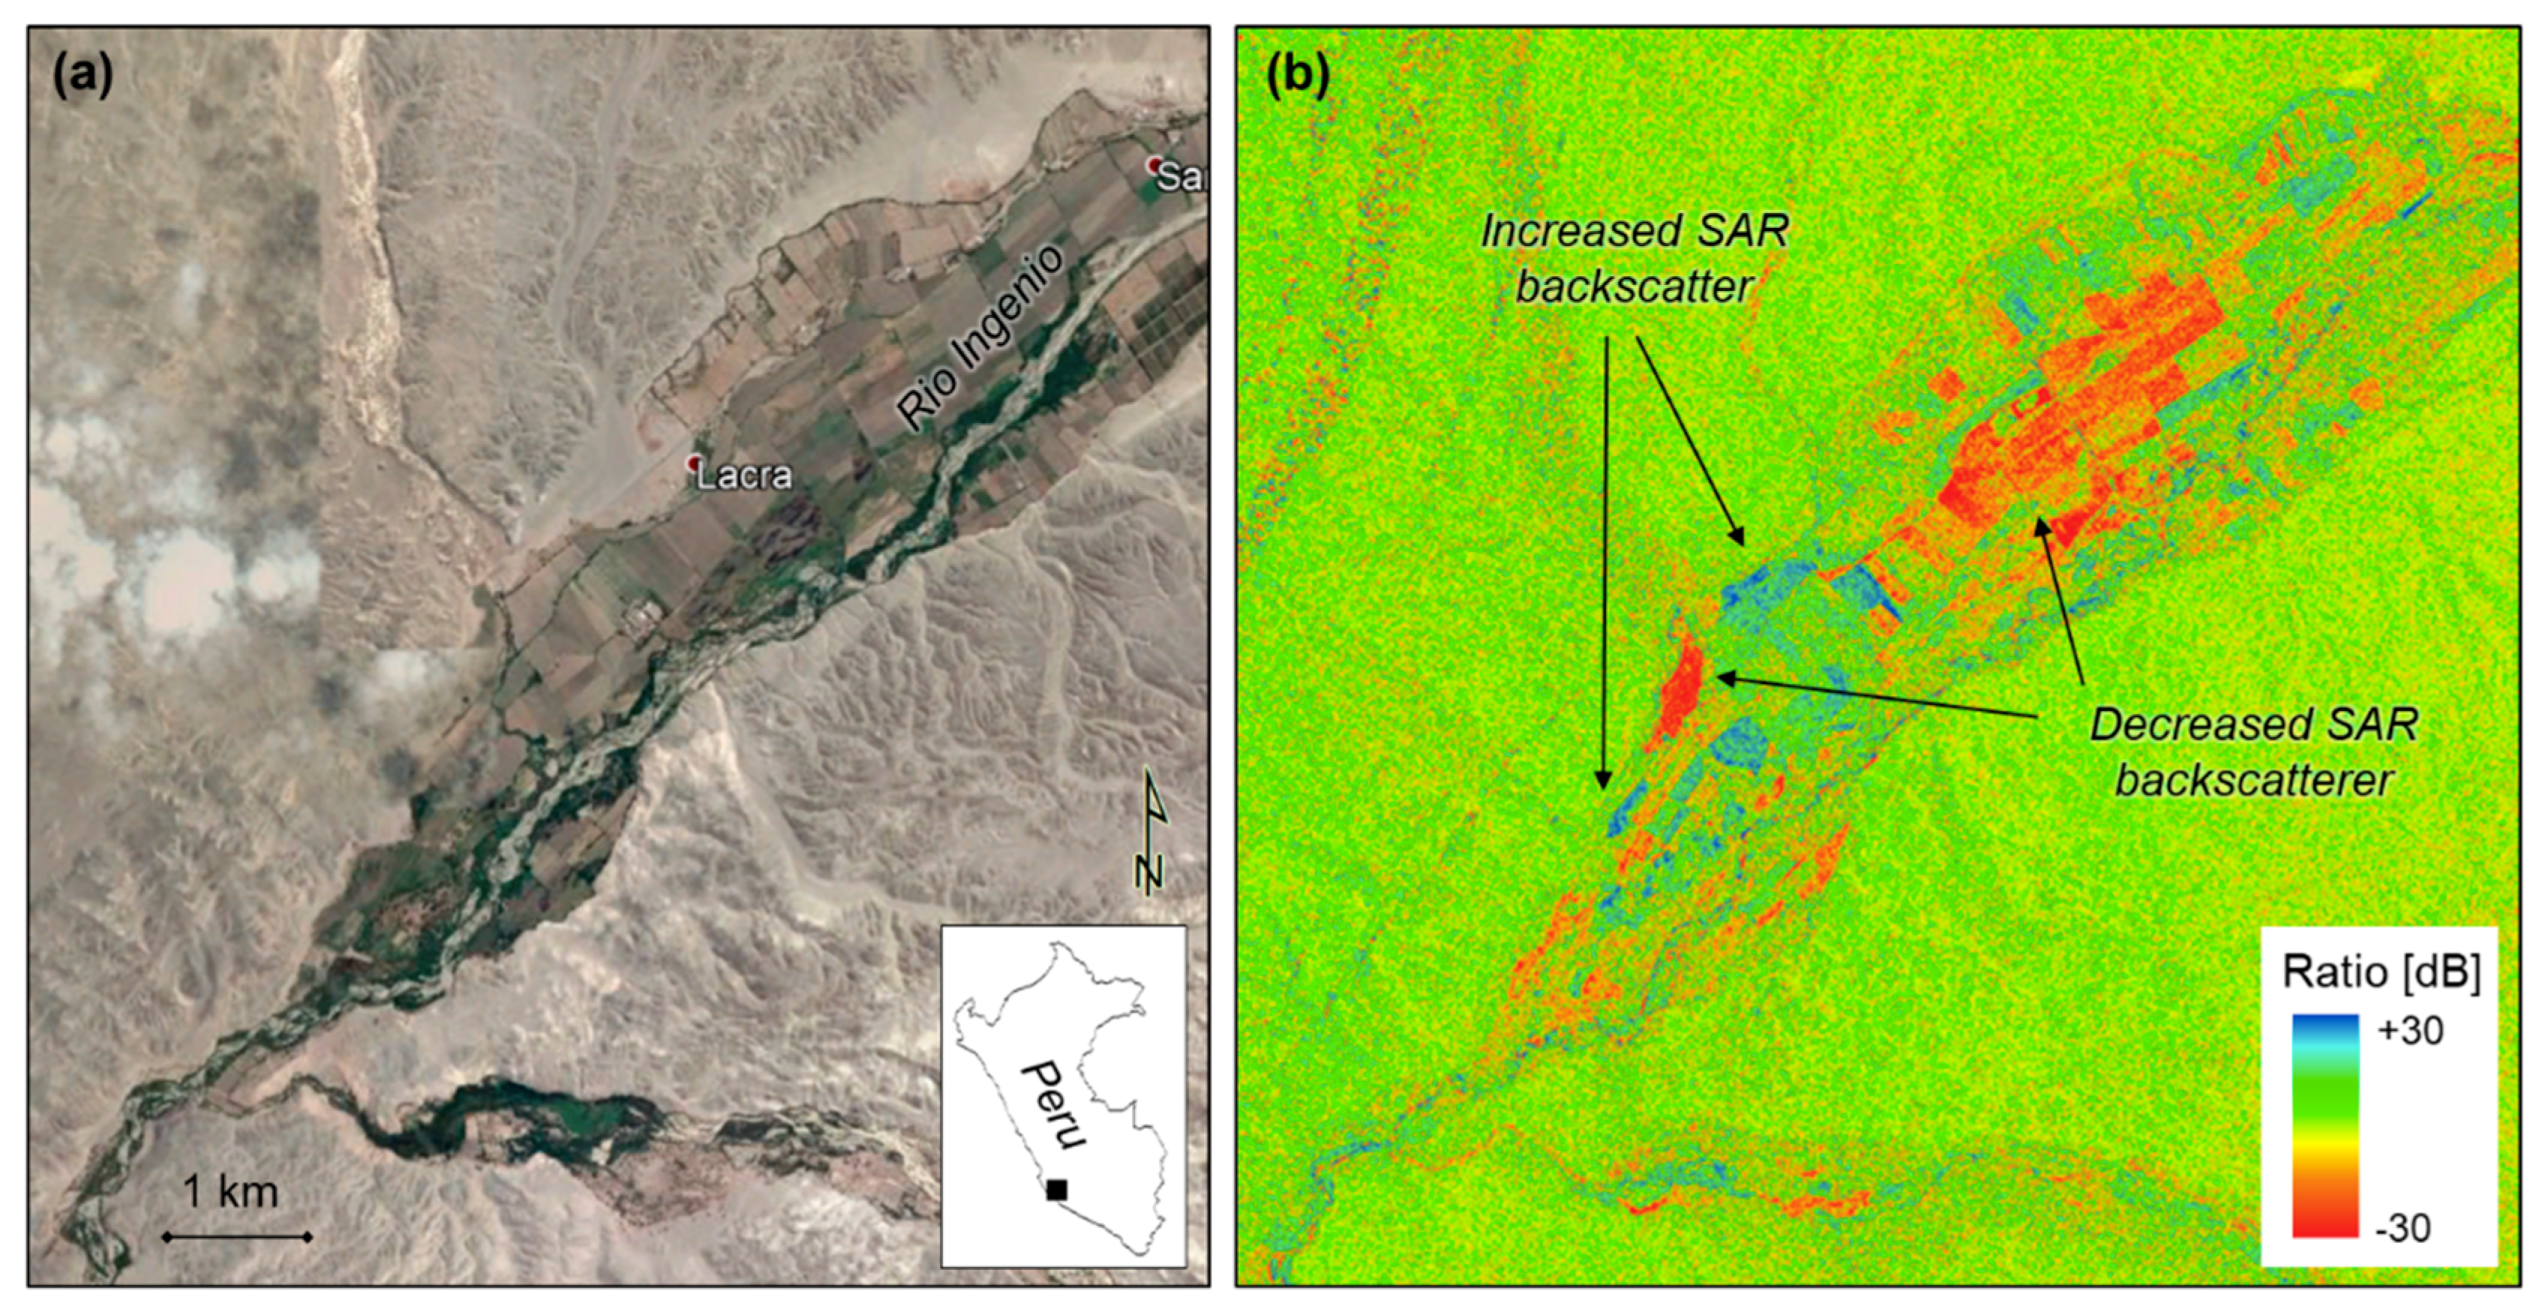
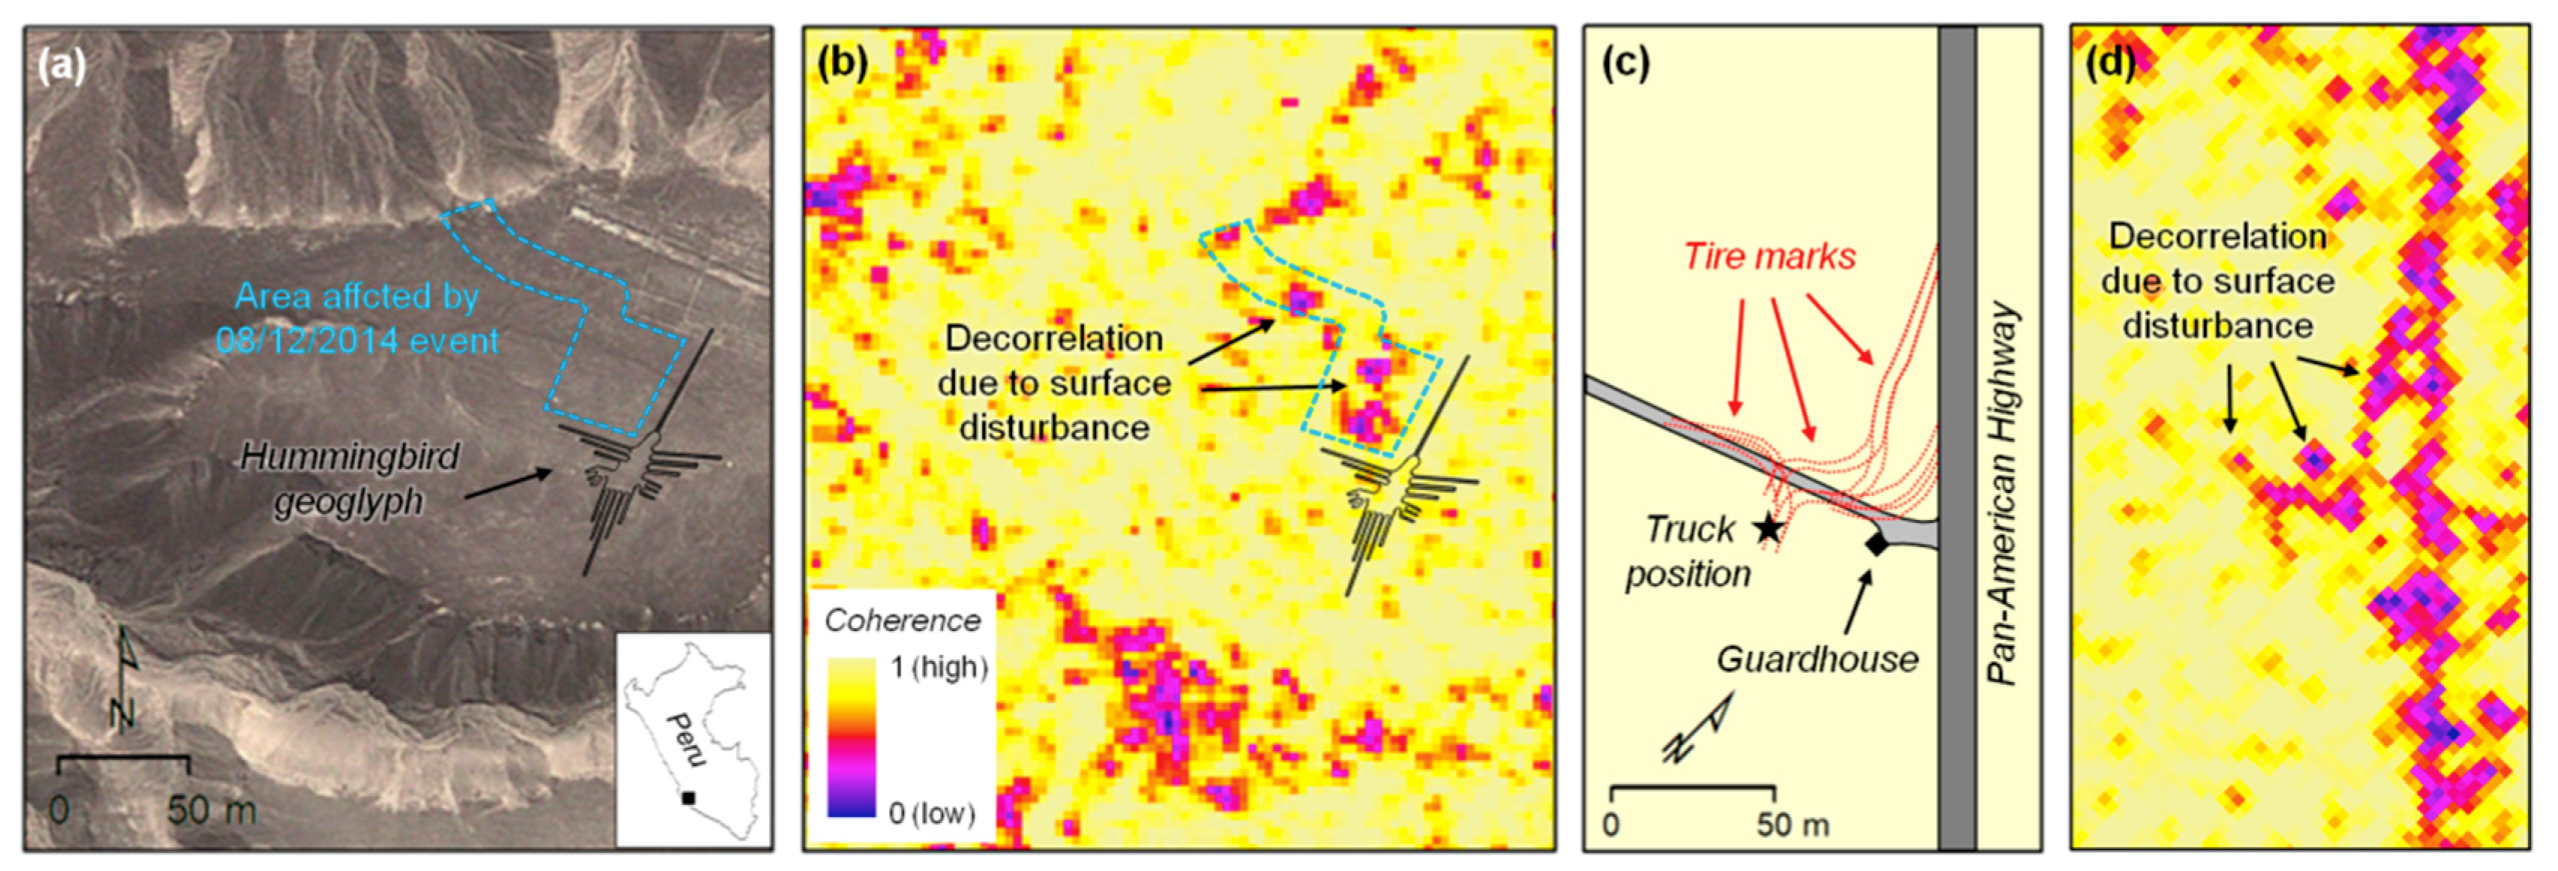
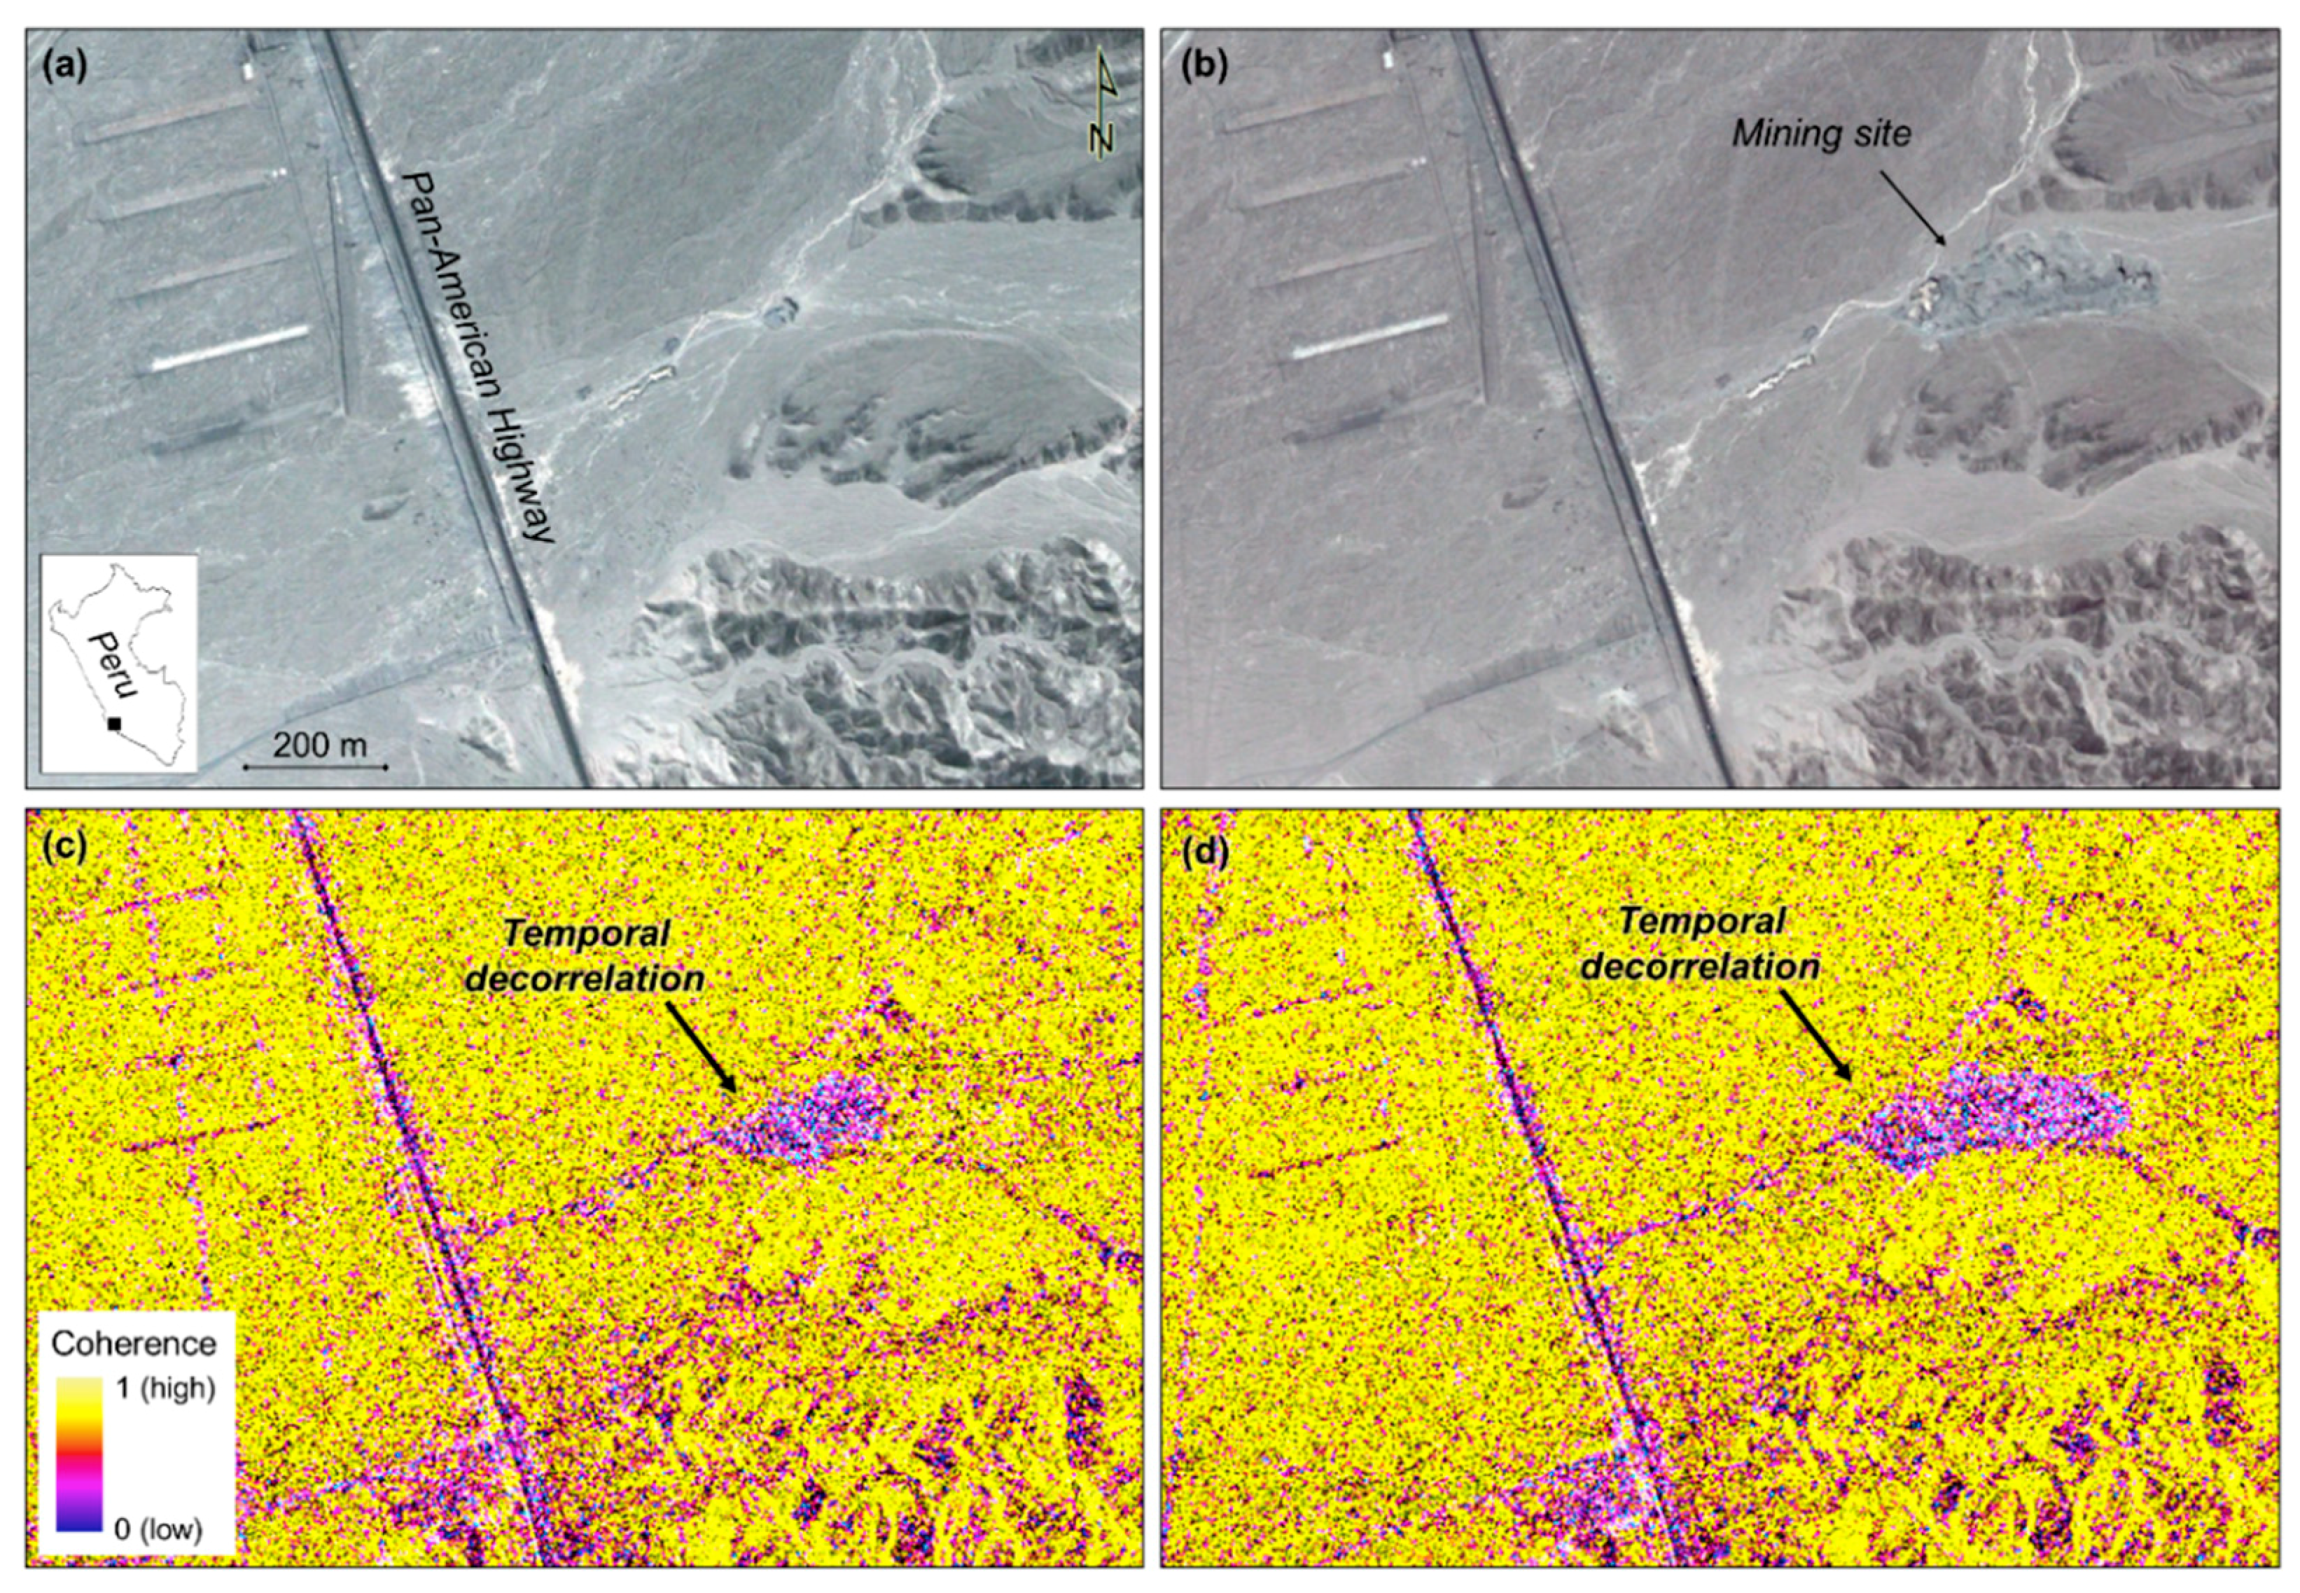
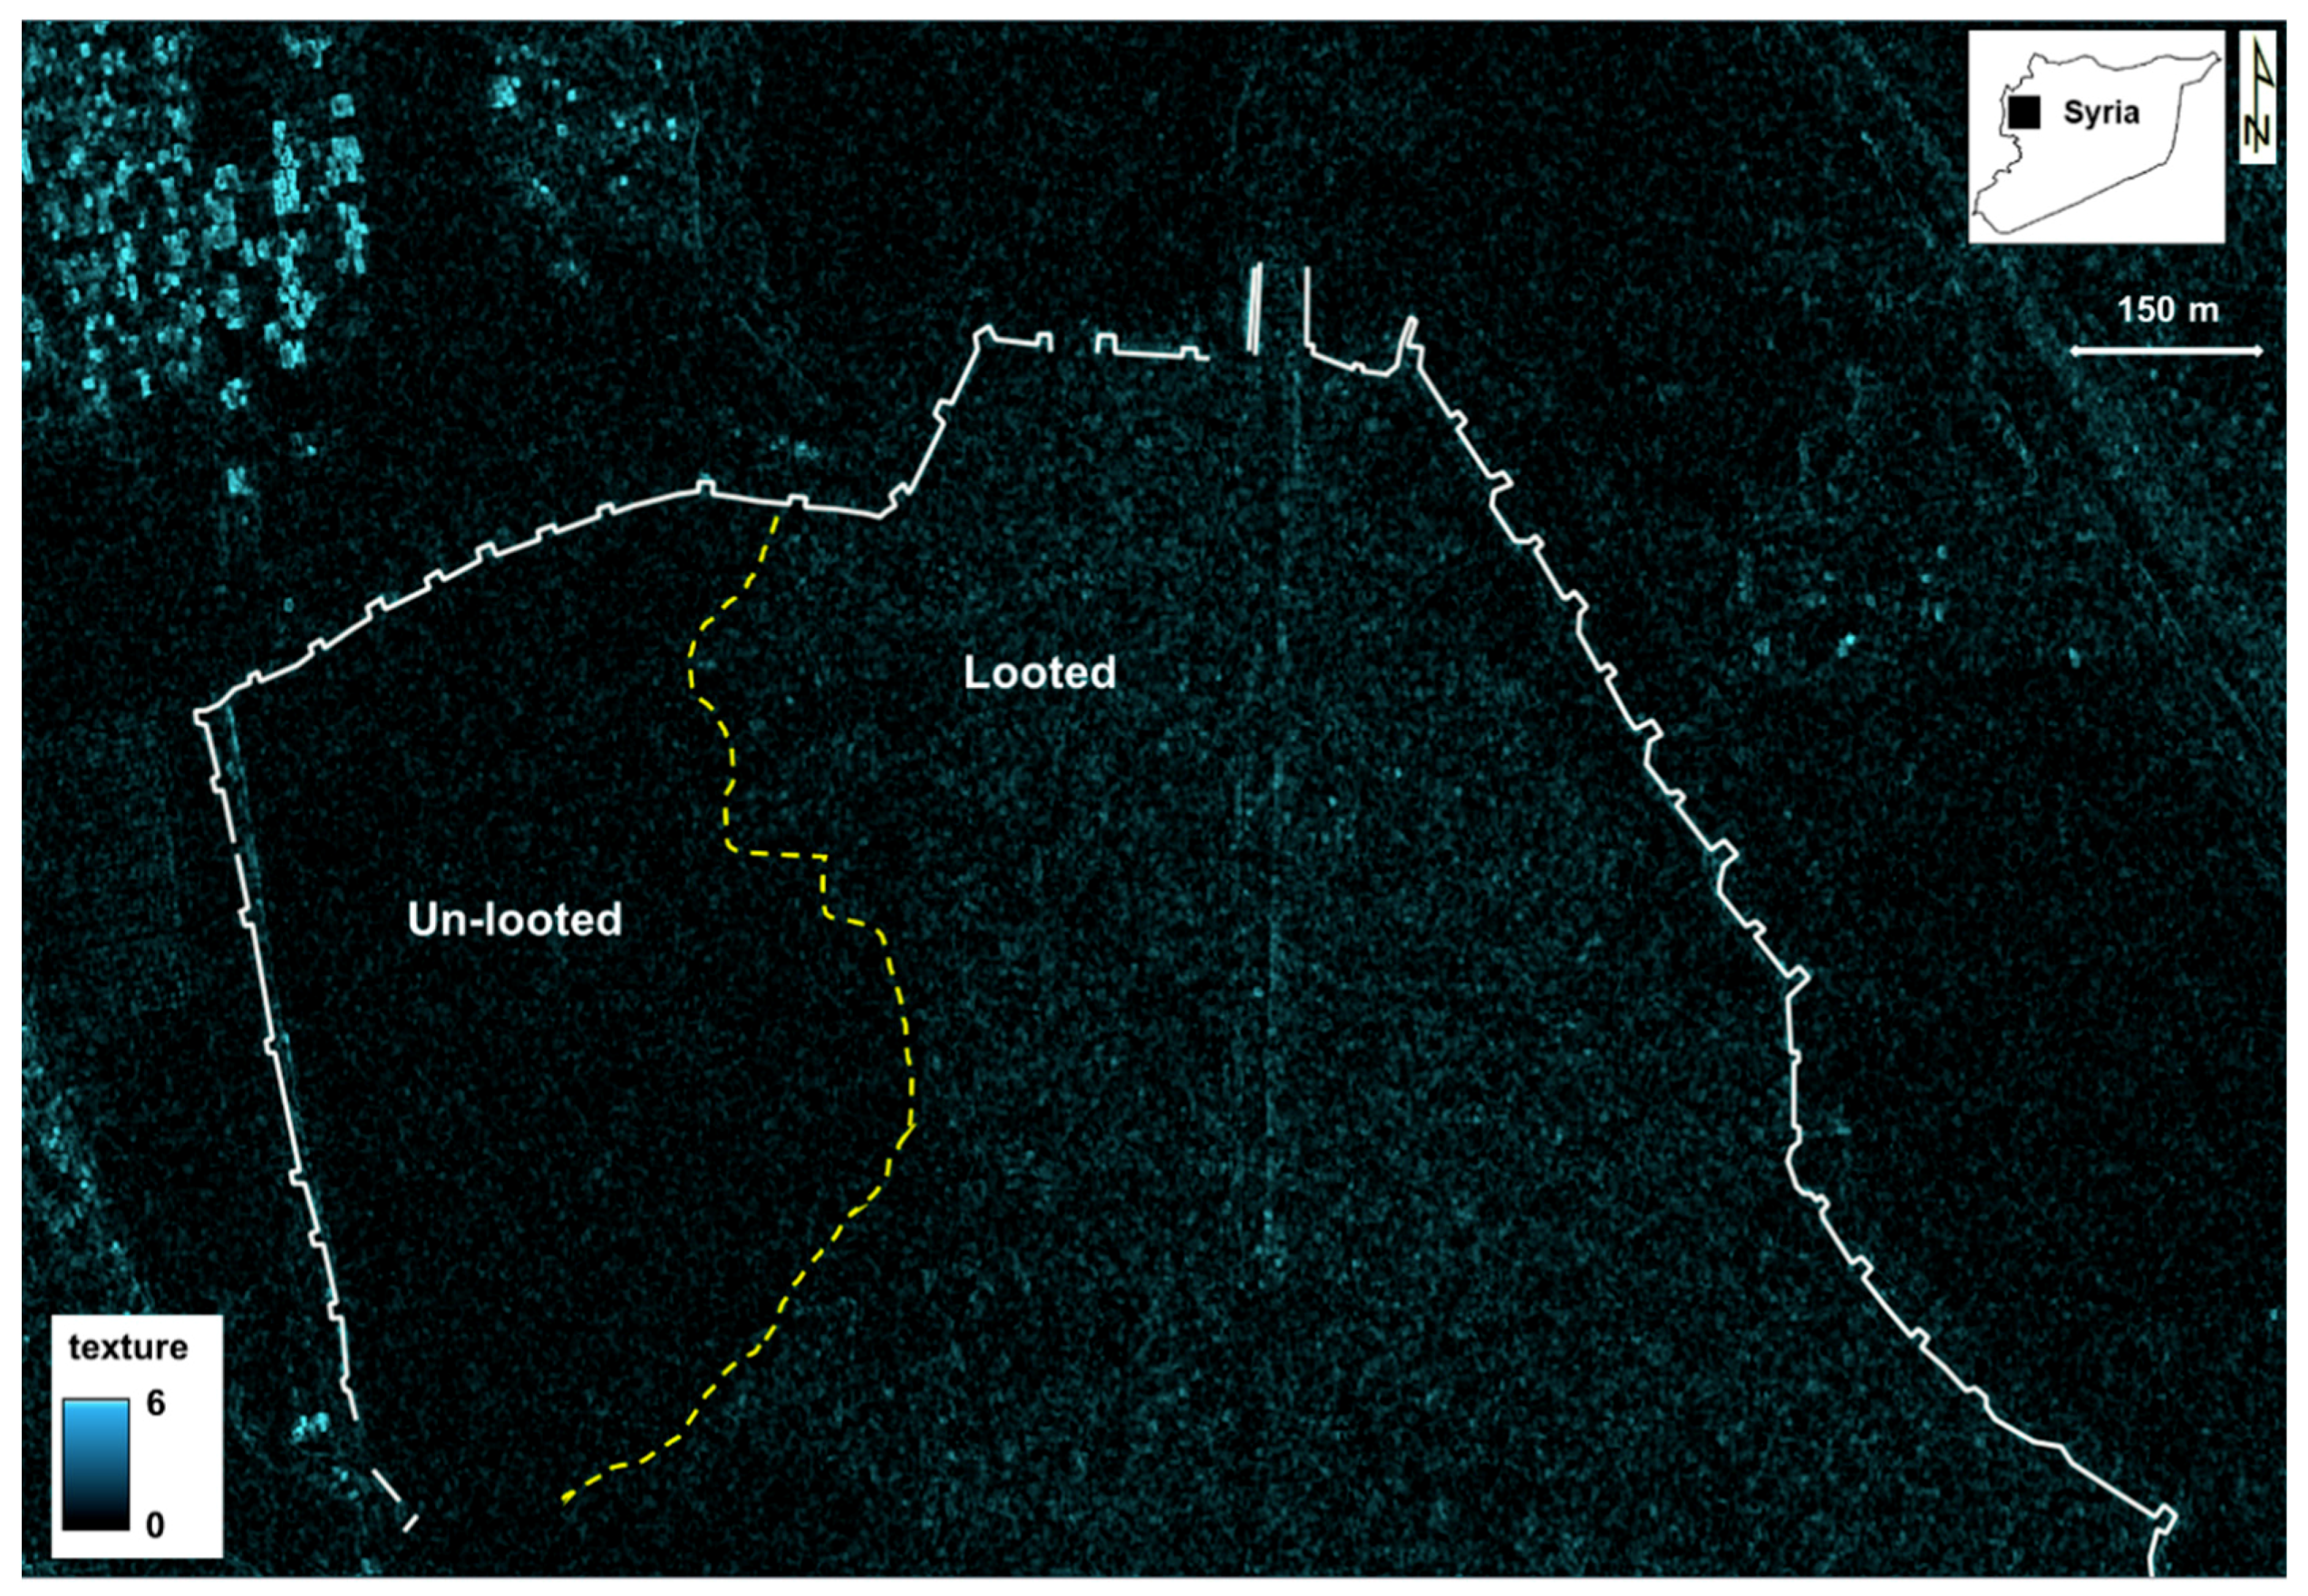
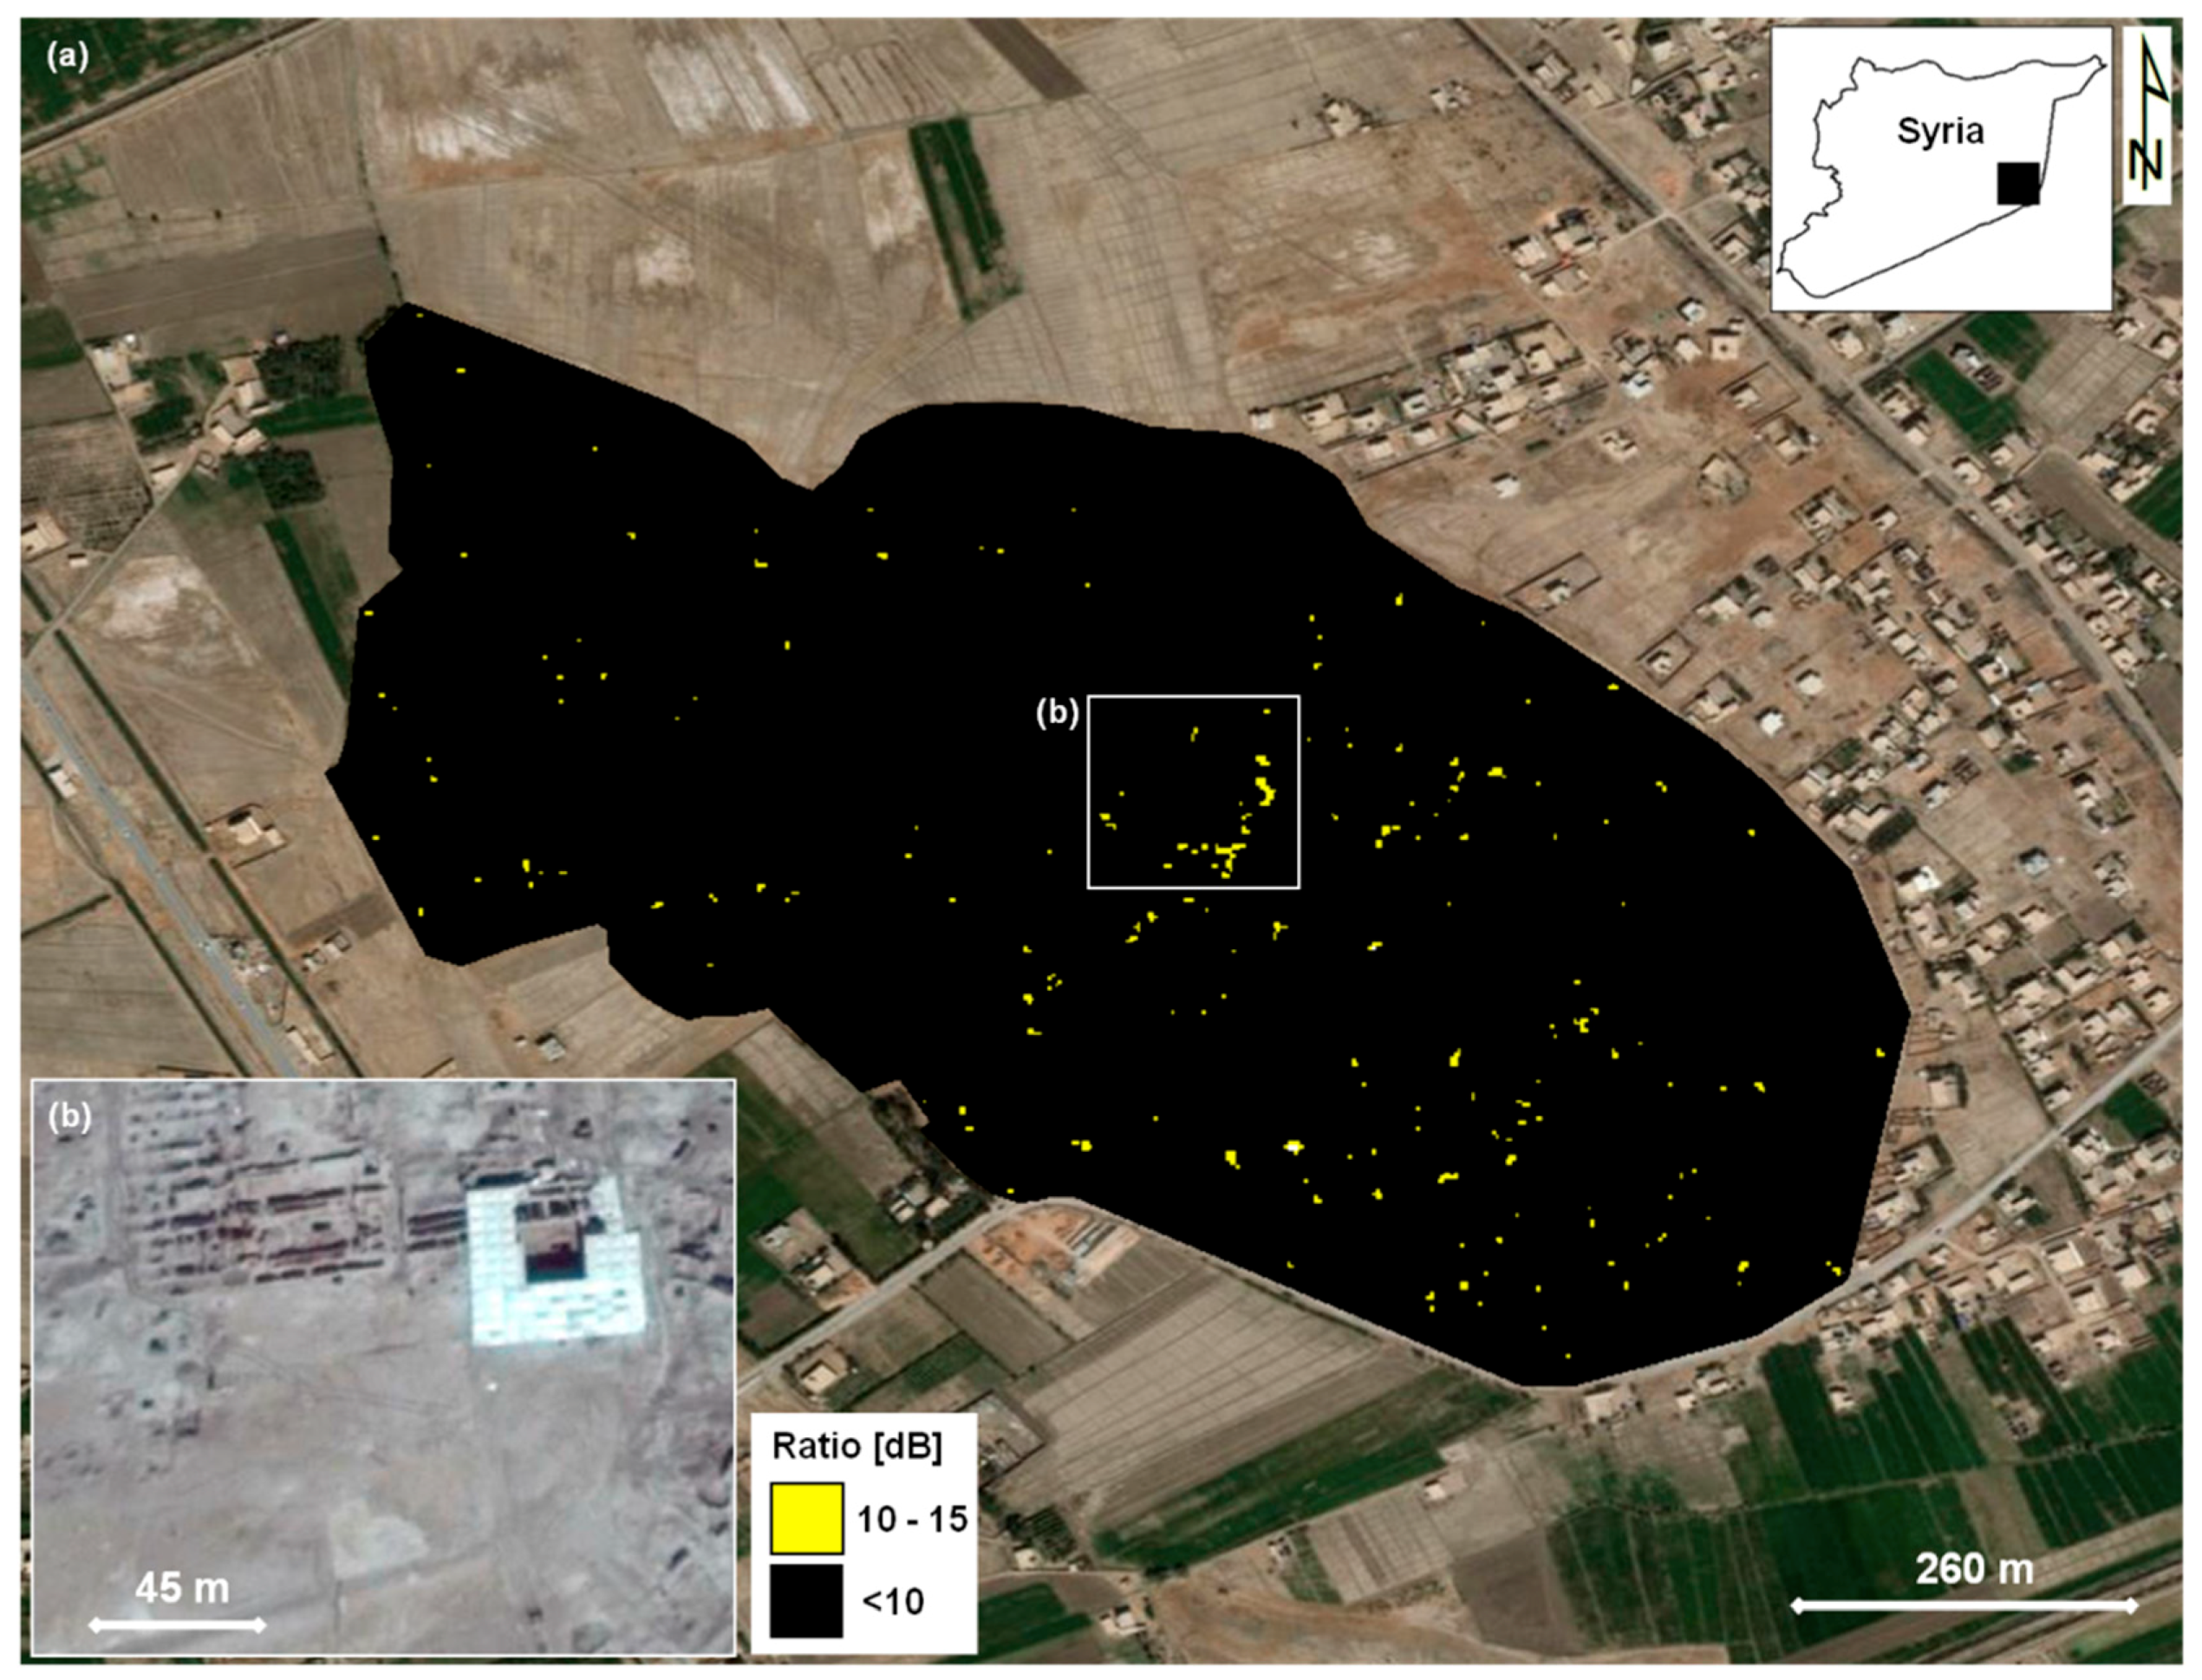
Table 1.
Summary of COSMO-SkyMed imaging modes available for the civilian and defence use domain (excluding mode Spotlight-1, which is reserved for defence use only). Notation: rg—range; az—azimuth.
Table 1.
Summary of COSMO-SkyMed imaging modes available for the civilian and defence use domain (excluding mode Spotlight-1, which is reserved for defence use only). Notation: rg—range; az—azimuth.
| Imaging Mode | Resolution rg × az [m × m] | Swath [km × km] | Polarization | |
|---|---|---|---|---|
| Narrow field imaging | Spotlight-2 or Enhanced Spotlight * | 1 × 1 | 10 × 10 | Single (HH or VV) |
| Wide field imaging | StripMap Himage * | 3 × 3 † | 40 × 40 | Single (HH or VV or VH or HV) |
| StripMap PingPong * | 15 × 15 ‡ | 30 × 30 | Alternating (HH/VV or HH/HV or VV/VH) | |
| ScanSAR Wide Region | 30 × 30 | 100 × 100 | Single (HH or HV or VH or VV) | |
| ScanSAR Huge Region | 100 × 100 | 200 × 200 | Single (HH or HV or VH or VV) | |
* These modes are the most suited for archaeological applications and monitoring of cultural heritage sites; † 5 m × 5 m if multi-looked; ‡ 20 m × 20 m if multi-looked.
Table 2.
Summary of COSMO-SkyMed data used to develop the use-cases discussed in this paper. Notation: SP—Enhanced Spotlight; SM—StripMap Himage; H—horizontal polarization; V—vertical polarization; θ—incidence angle at scene centre; ASC—ascending geometry; DESC—descending geometry.
Table 2.
Summary of COSMO-SkyMed data used to develop the use-cases discussed in this paper. Notation: SP—Enhanced Spotlight; SM—StripMap Himage; H—horizontal polarization; V—vertical polarization; θ—incidence angle at scene centre; ASC—ascending geometry; DESC—descending geometry.
| Heritage Site | No. of Images | Imaging Mode | Polarization | θ | Geometry | Acquisition Date(s) | Figure(s) |
|---|---|---|---|---|---|---|---|
| Nazca Lines (Peru) | 1 | SM | HH | 27° | ASC | 05/07/2018 | Figure 2 |
| 1 | SP | VV | 39° | ASC | 16/07/2018 | ||
| 4 | SM | HH | 27° | ASC | 10/07/2014, 12/04/2015; 13/12/2017, 30/01/2018; | Figure 8 | |
| 4 | SM | HH | 27° | ASC | 31/07/2013, 16/06/2014; 10/07/2014, 05/07/2015 | Figure 9 | |
| Rio Ingenio (Peru) | 2 | SM | HH | 27° | ASC | 18/07/2017, 03/06/2018 | Figure 7 |
| Apamea (Syria) | 1 | SP | HH | 41° | ASC | 16/07/2018 | Figures 3,10 |
| Mari (Syria) | 2 | SM | HH | 40° | DESC | 10/03/2010, 10/08/2018 | Figure 11 |
| Capo Colonna (Italy) | 54 | SP | HH | 42° | DESC | 28/09/2017–14/08/2018 | Figure 4 |
| Wasit (Iraq) | 2 | SM | HH | 29° | ASC | 16/05/2018–17/05/2018 | Figure 5 |
| Site X 1 | 1 | SP | HH | 39° | - | - | Figure 6 |
1 Location, geometry and date of acquisition undisclosed given the possible sensitivity and need for cultural heritage protection.
© 2019 by the authors. Licensee MDPI, Basel, Switzerland. This article is an open access article distributed under the terms and conditions of the Creative Commons Attribution (CC BY) license (http://creativecommons.org/licenses/by/4.0/).
Share and Cite
MDPI and ACS Style
Tapete, D.; Cigna, F. COSMO-SkyMed SAR for Detection and Monitoring of Archaeological and Cultural Heritage Sites. Remote Sens. 2019, 11, 1326. https://0-doi-org.brum.beds.ac.uk/10.3390/rs11111326
AMA Style
Tapete D, Cigna F. COSMO-SkyMed SAR for Detection and Monitoring of Archaeological and Cultural Heritage Sites. Remote Sensing. 2019; 11(11):1326. https://0-doi-org.brum.beds.ac.uk/10.3390/rs11111326
Chicago/Turabian StyleTapete, Deodato, and Francesca Cigna. 2019. "COSMO-SkyMed SAR for Detection and Monitoring of Archaeological and Cultural Heritage Sites" Remote Sensing 11, no. 11: 1326. https://0-doi-org.brum.beds.ac.uk/10.3390/rs11111326
Note that from the first issue of 2016, this journal uses article numbers instead of page numbers. See further details here.