UAV-Based Remote Sensing Technique to Detect Citrus Canker Disease Utilizing Hyperspectral Imaging and Machine Learning


Abstract
:1. Introduction
2. Materials and Methods
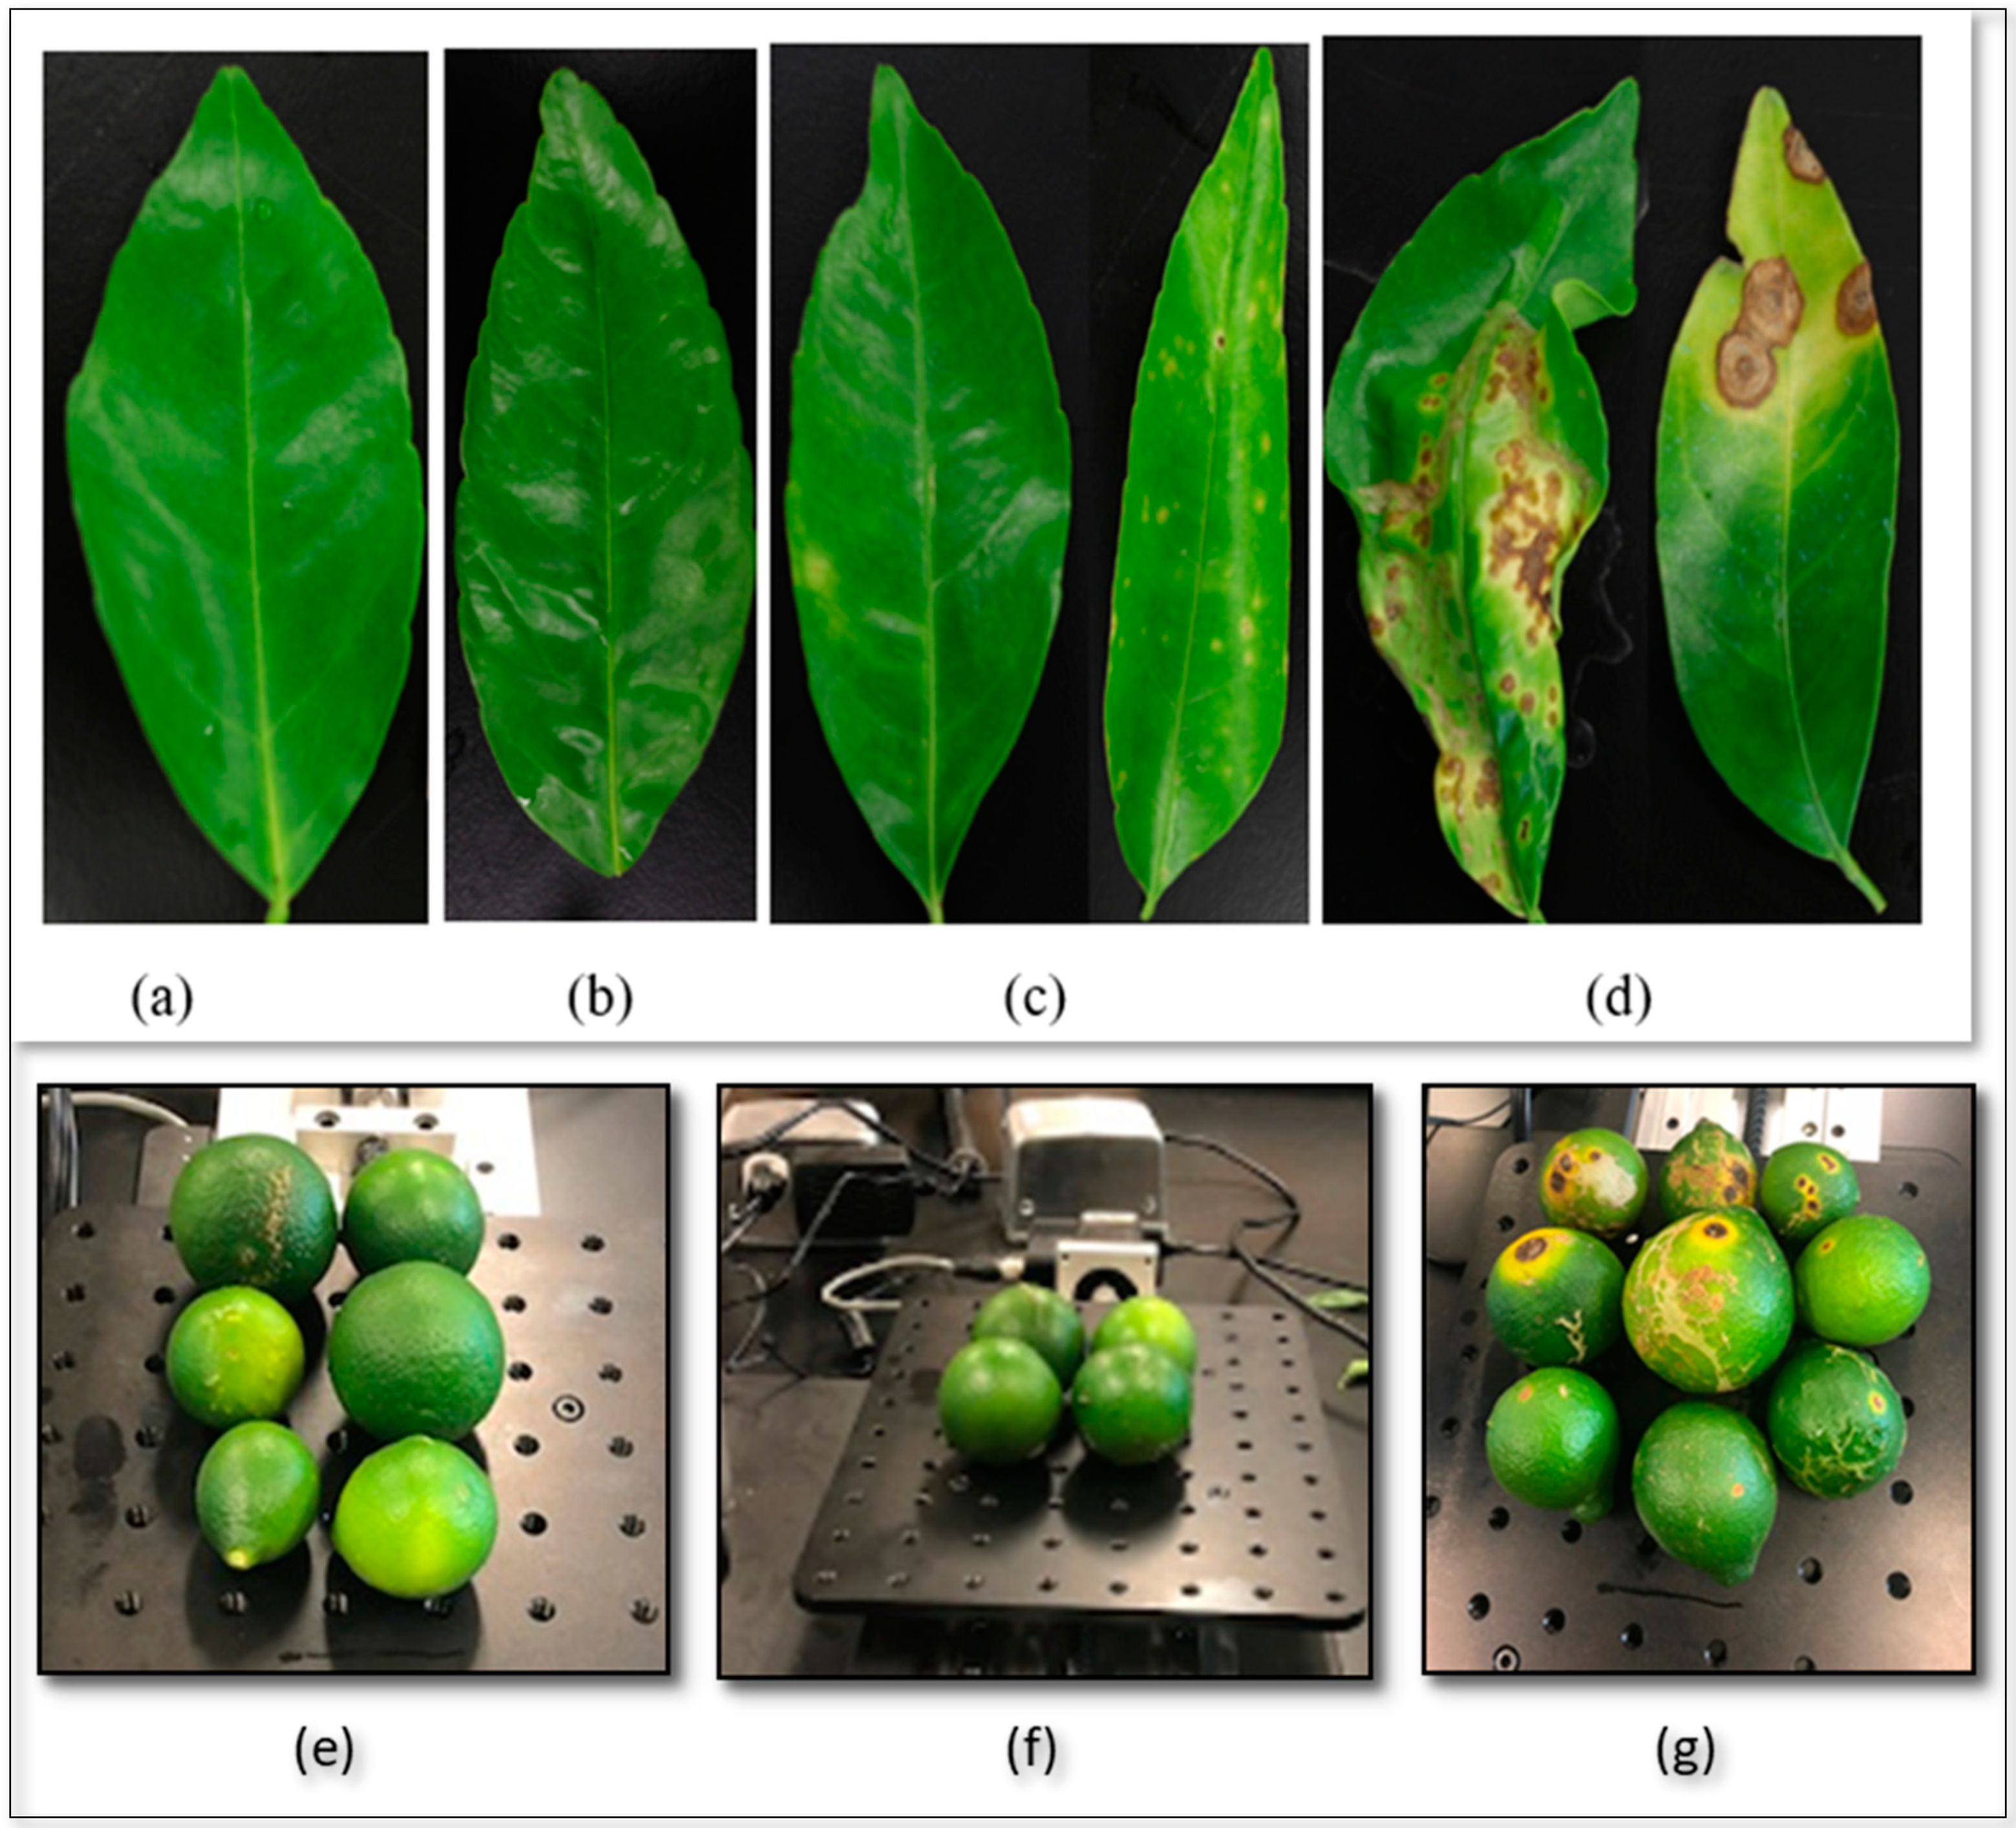
2.1. Experimental Site and Sample Collection
2.2. Bacterium Isolation
2.3. Polymerase Chain Reaction (PCR) Analysis
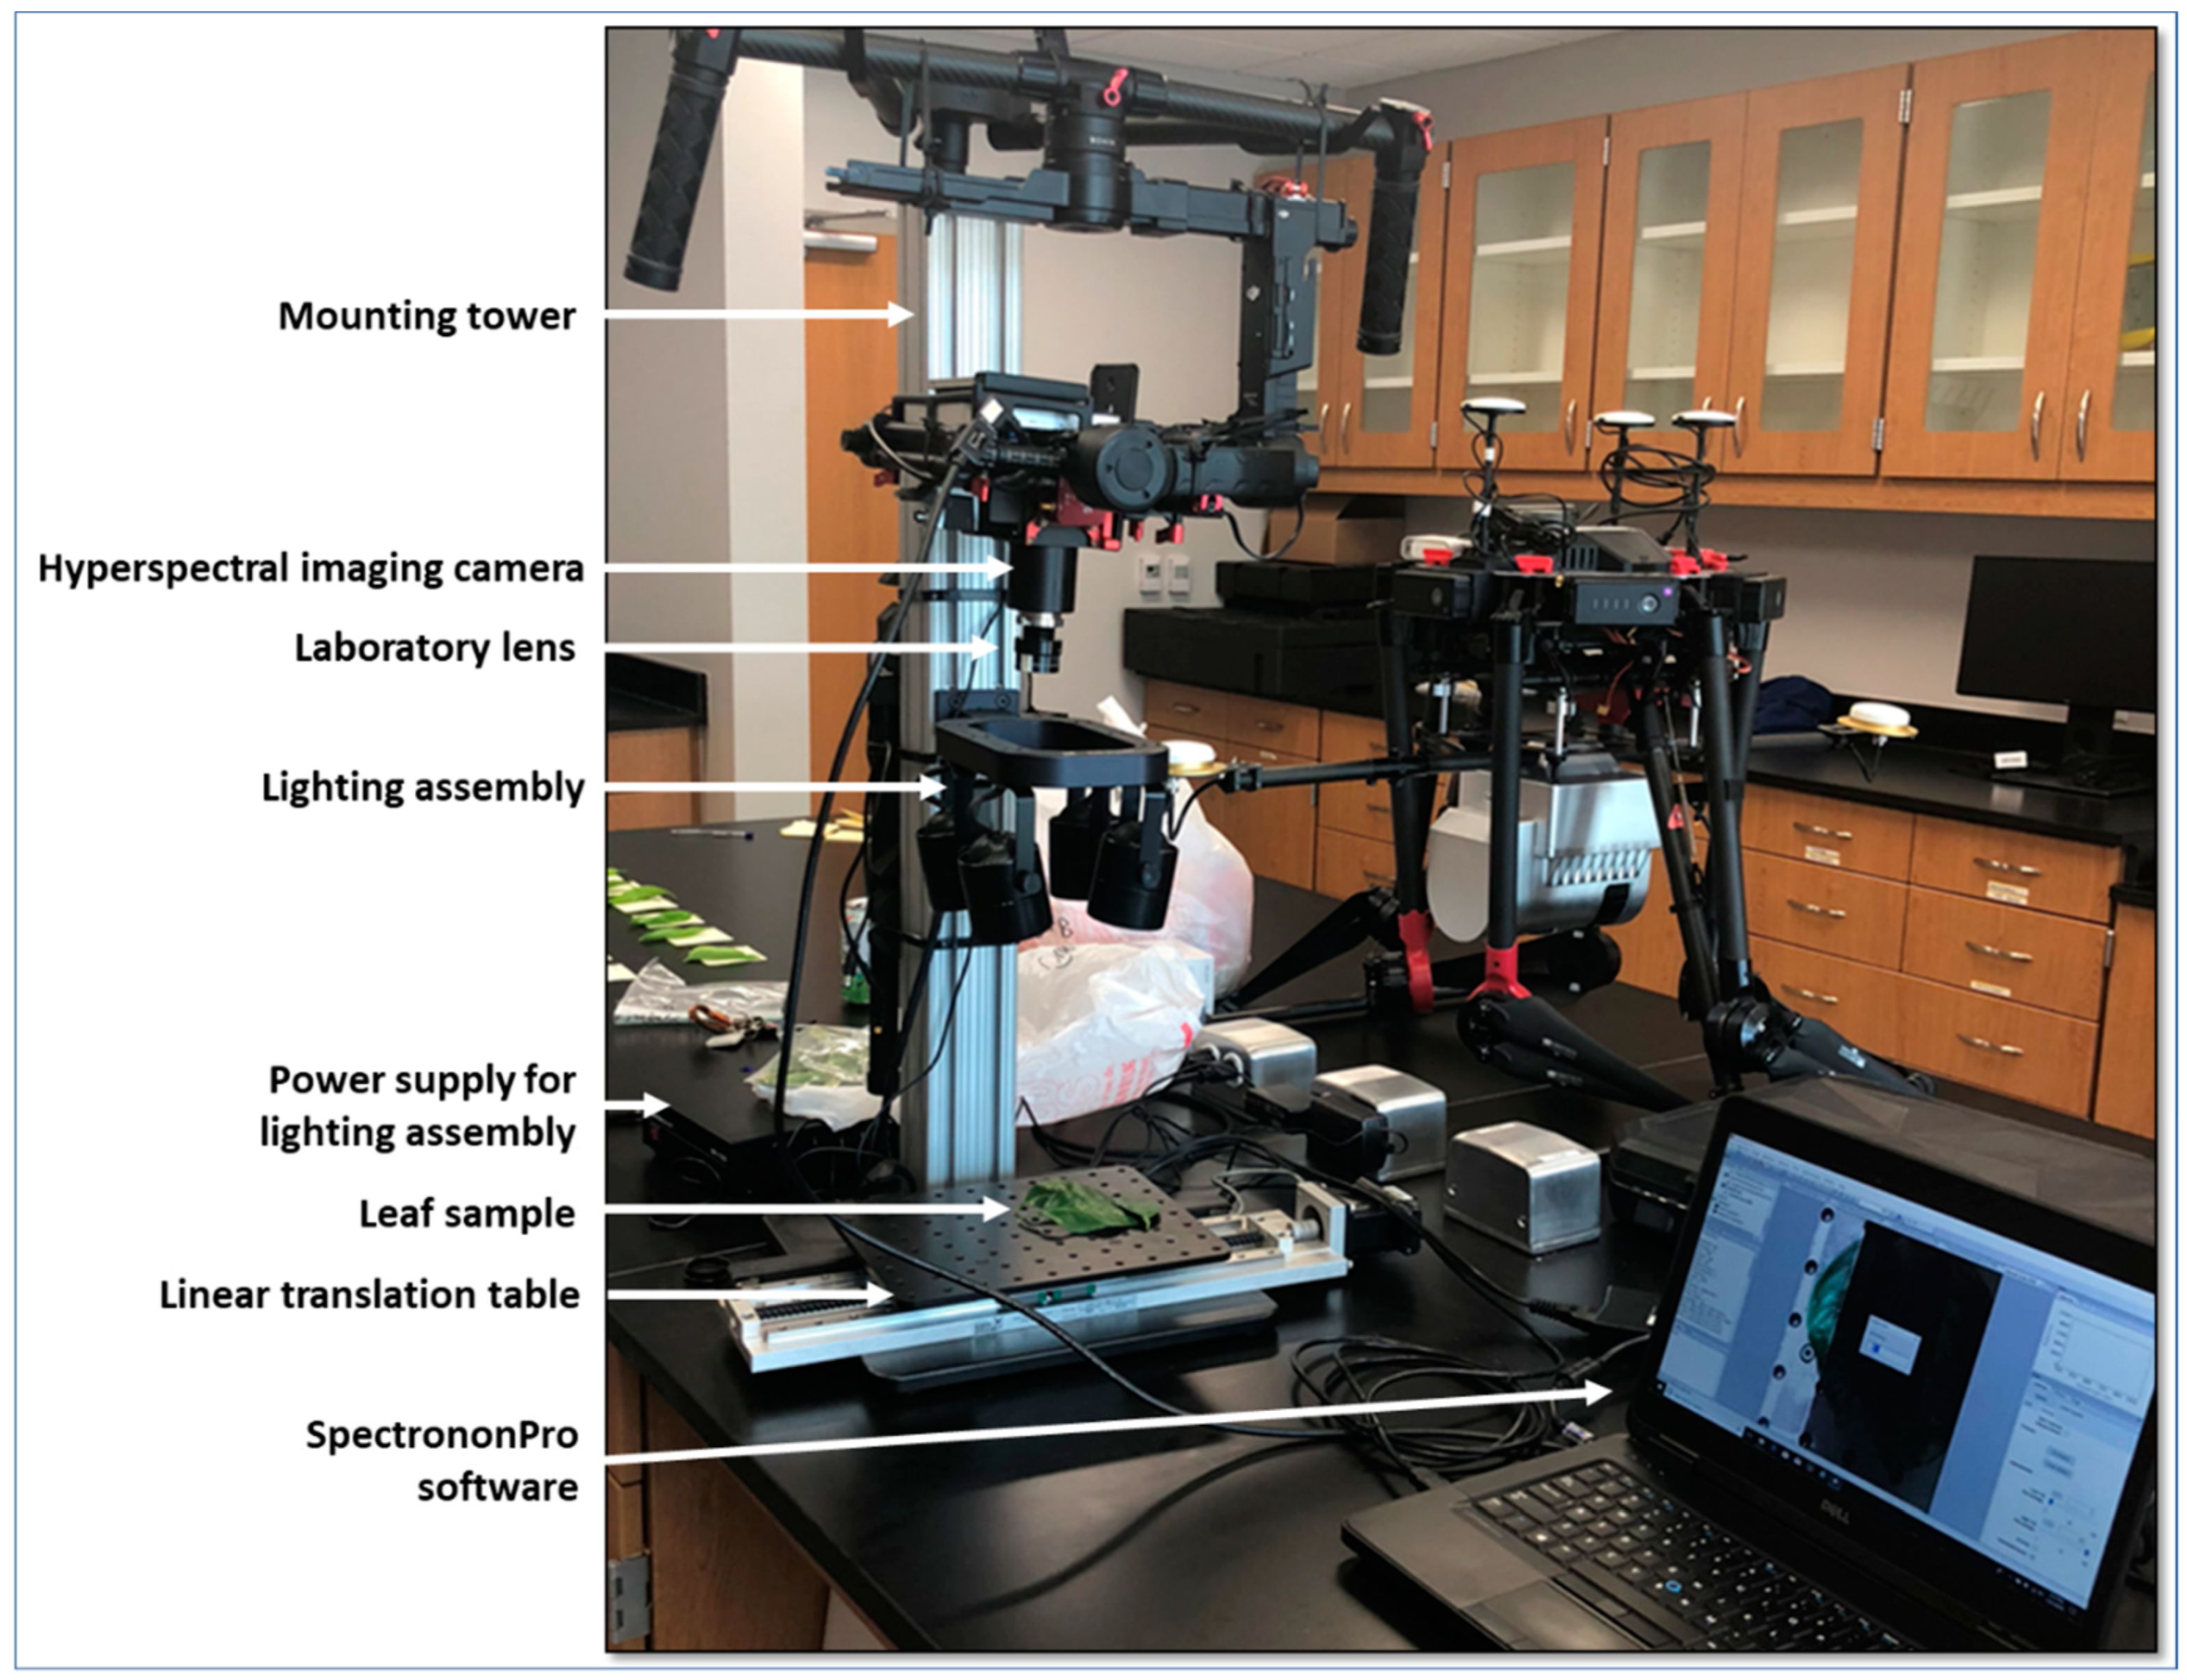
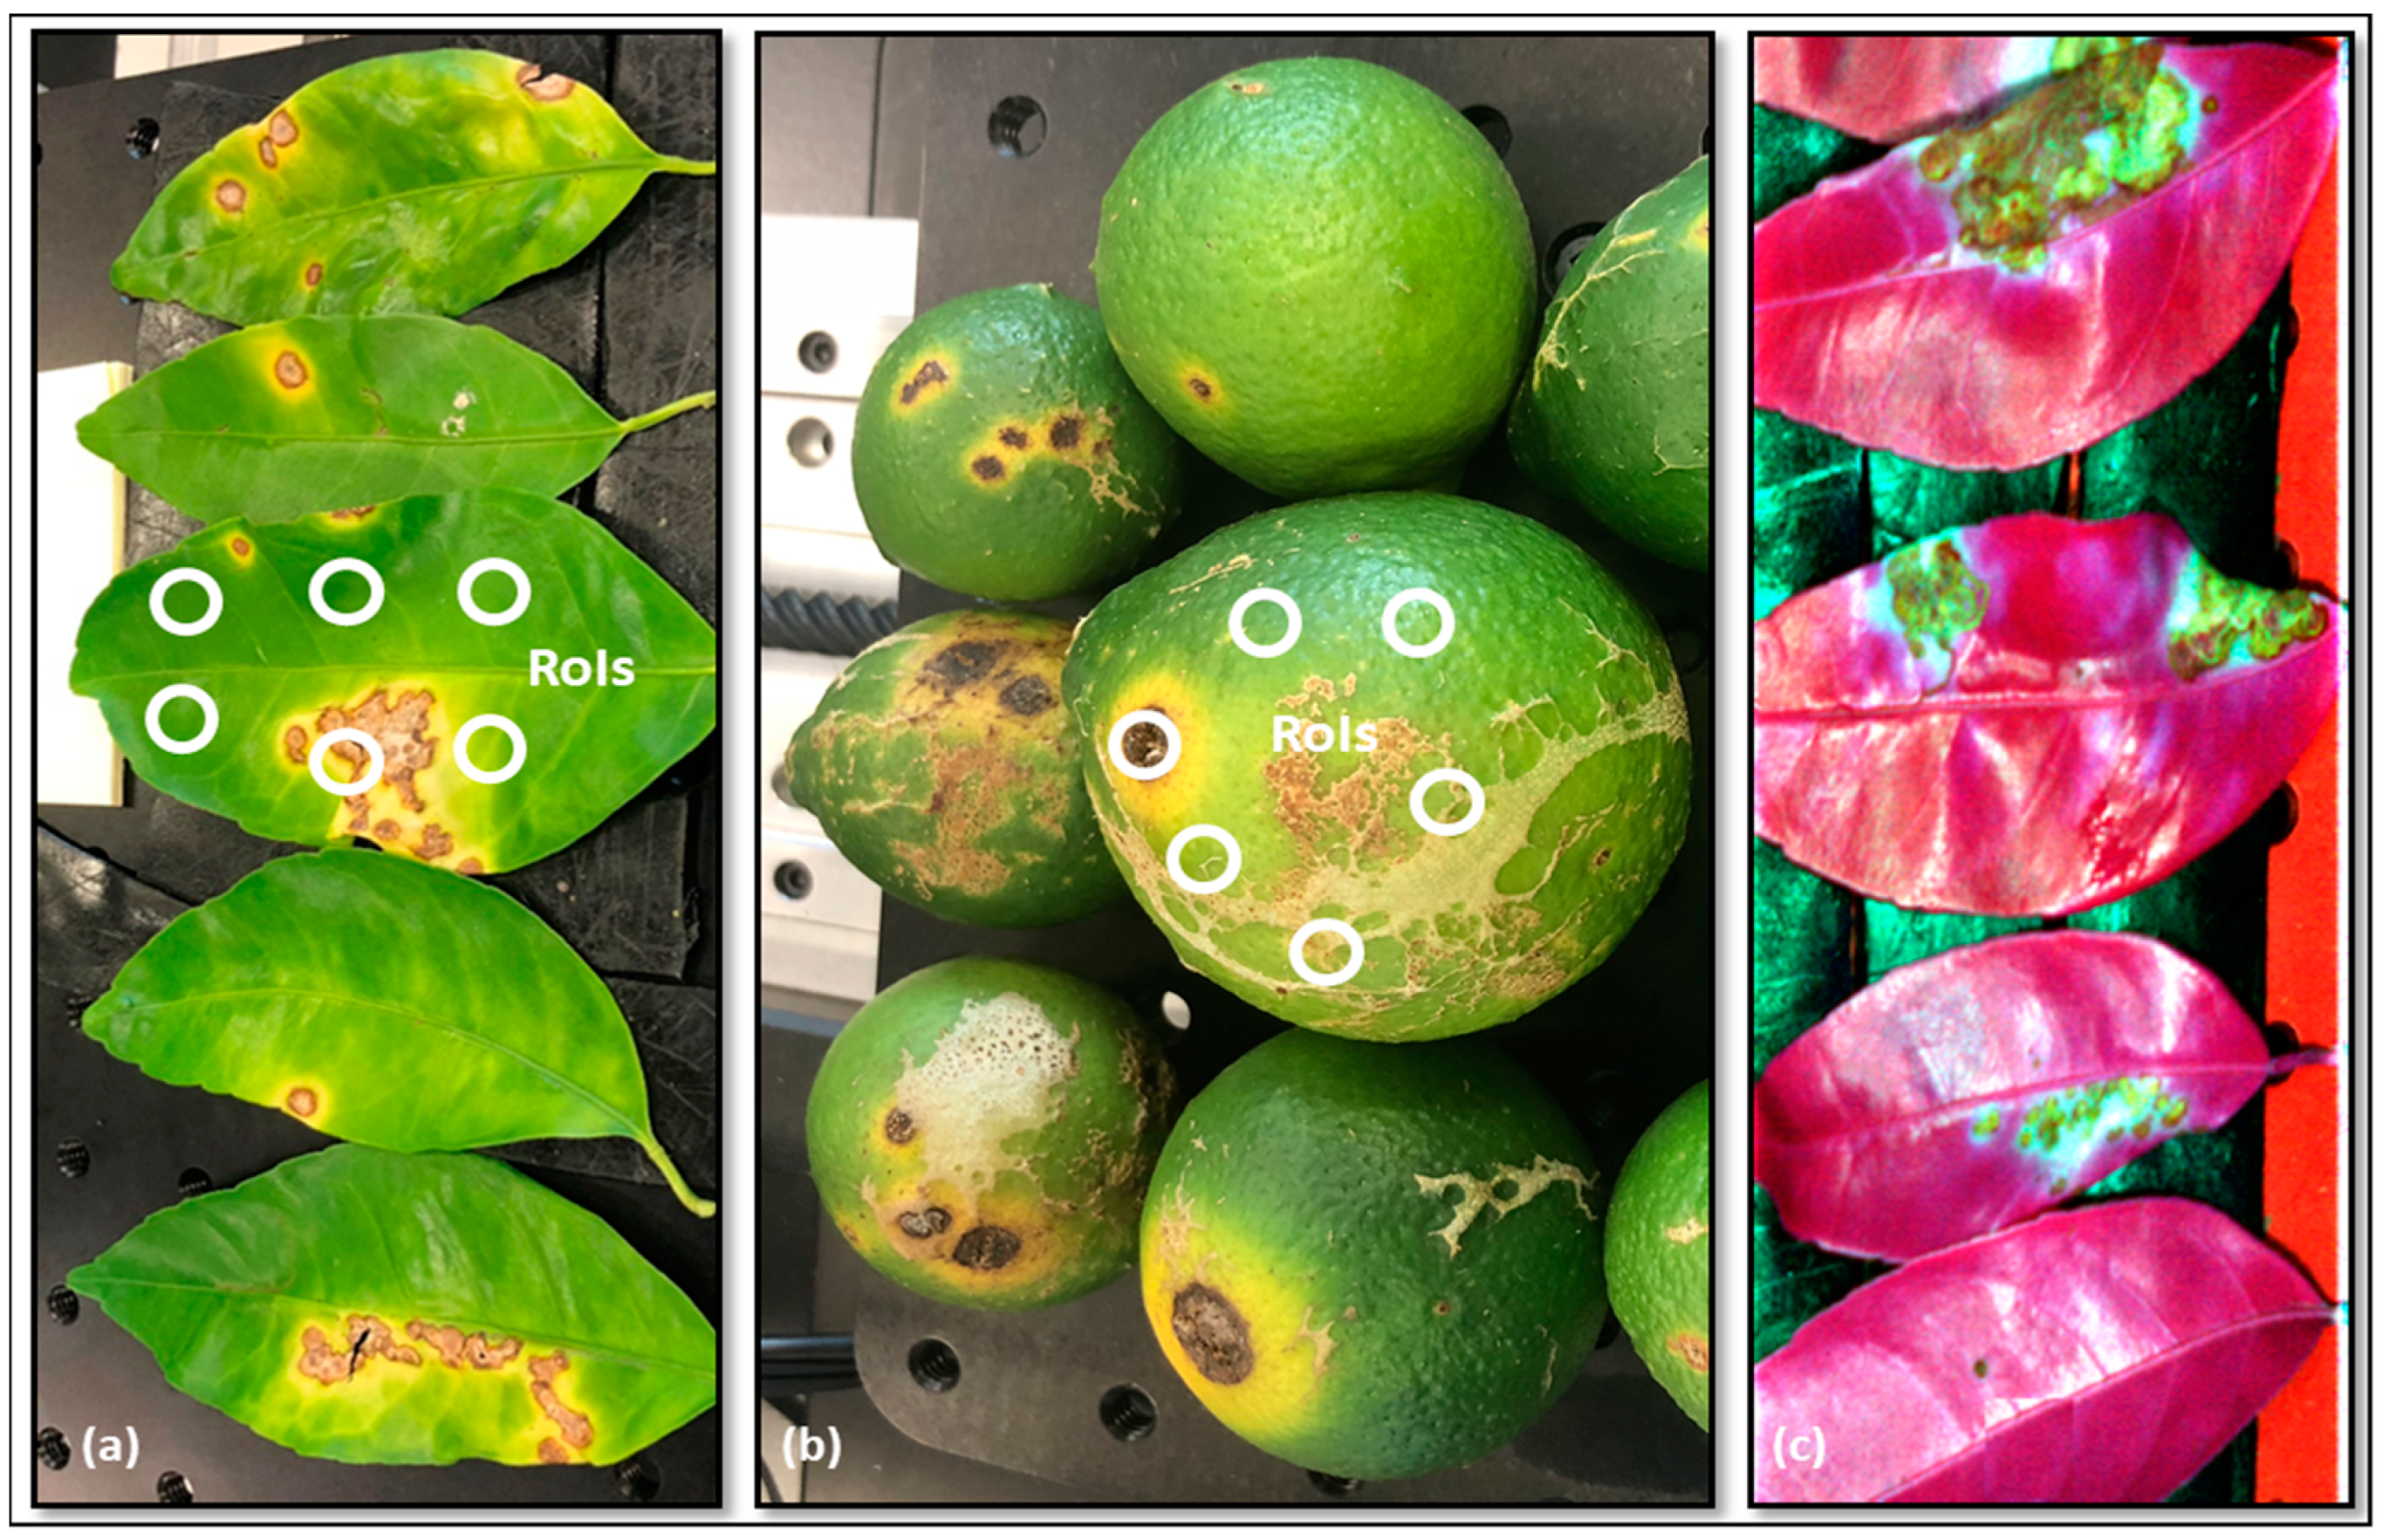
2.4. Indoor Hyperspectral Data Collection
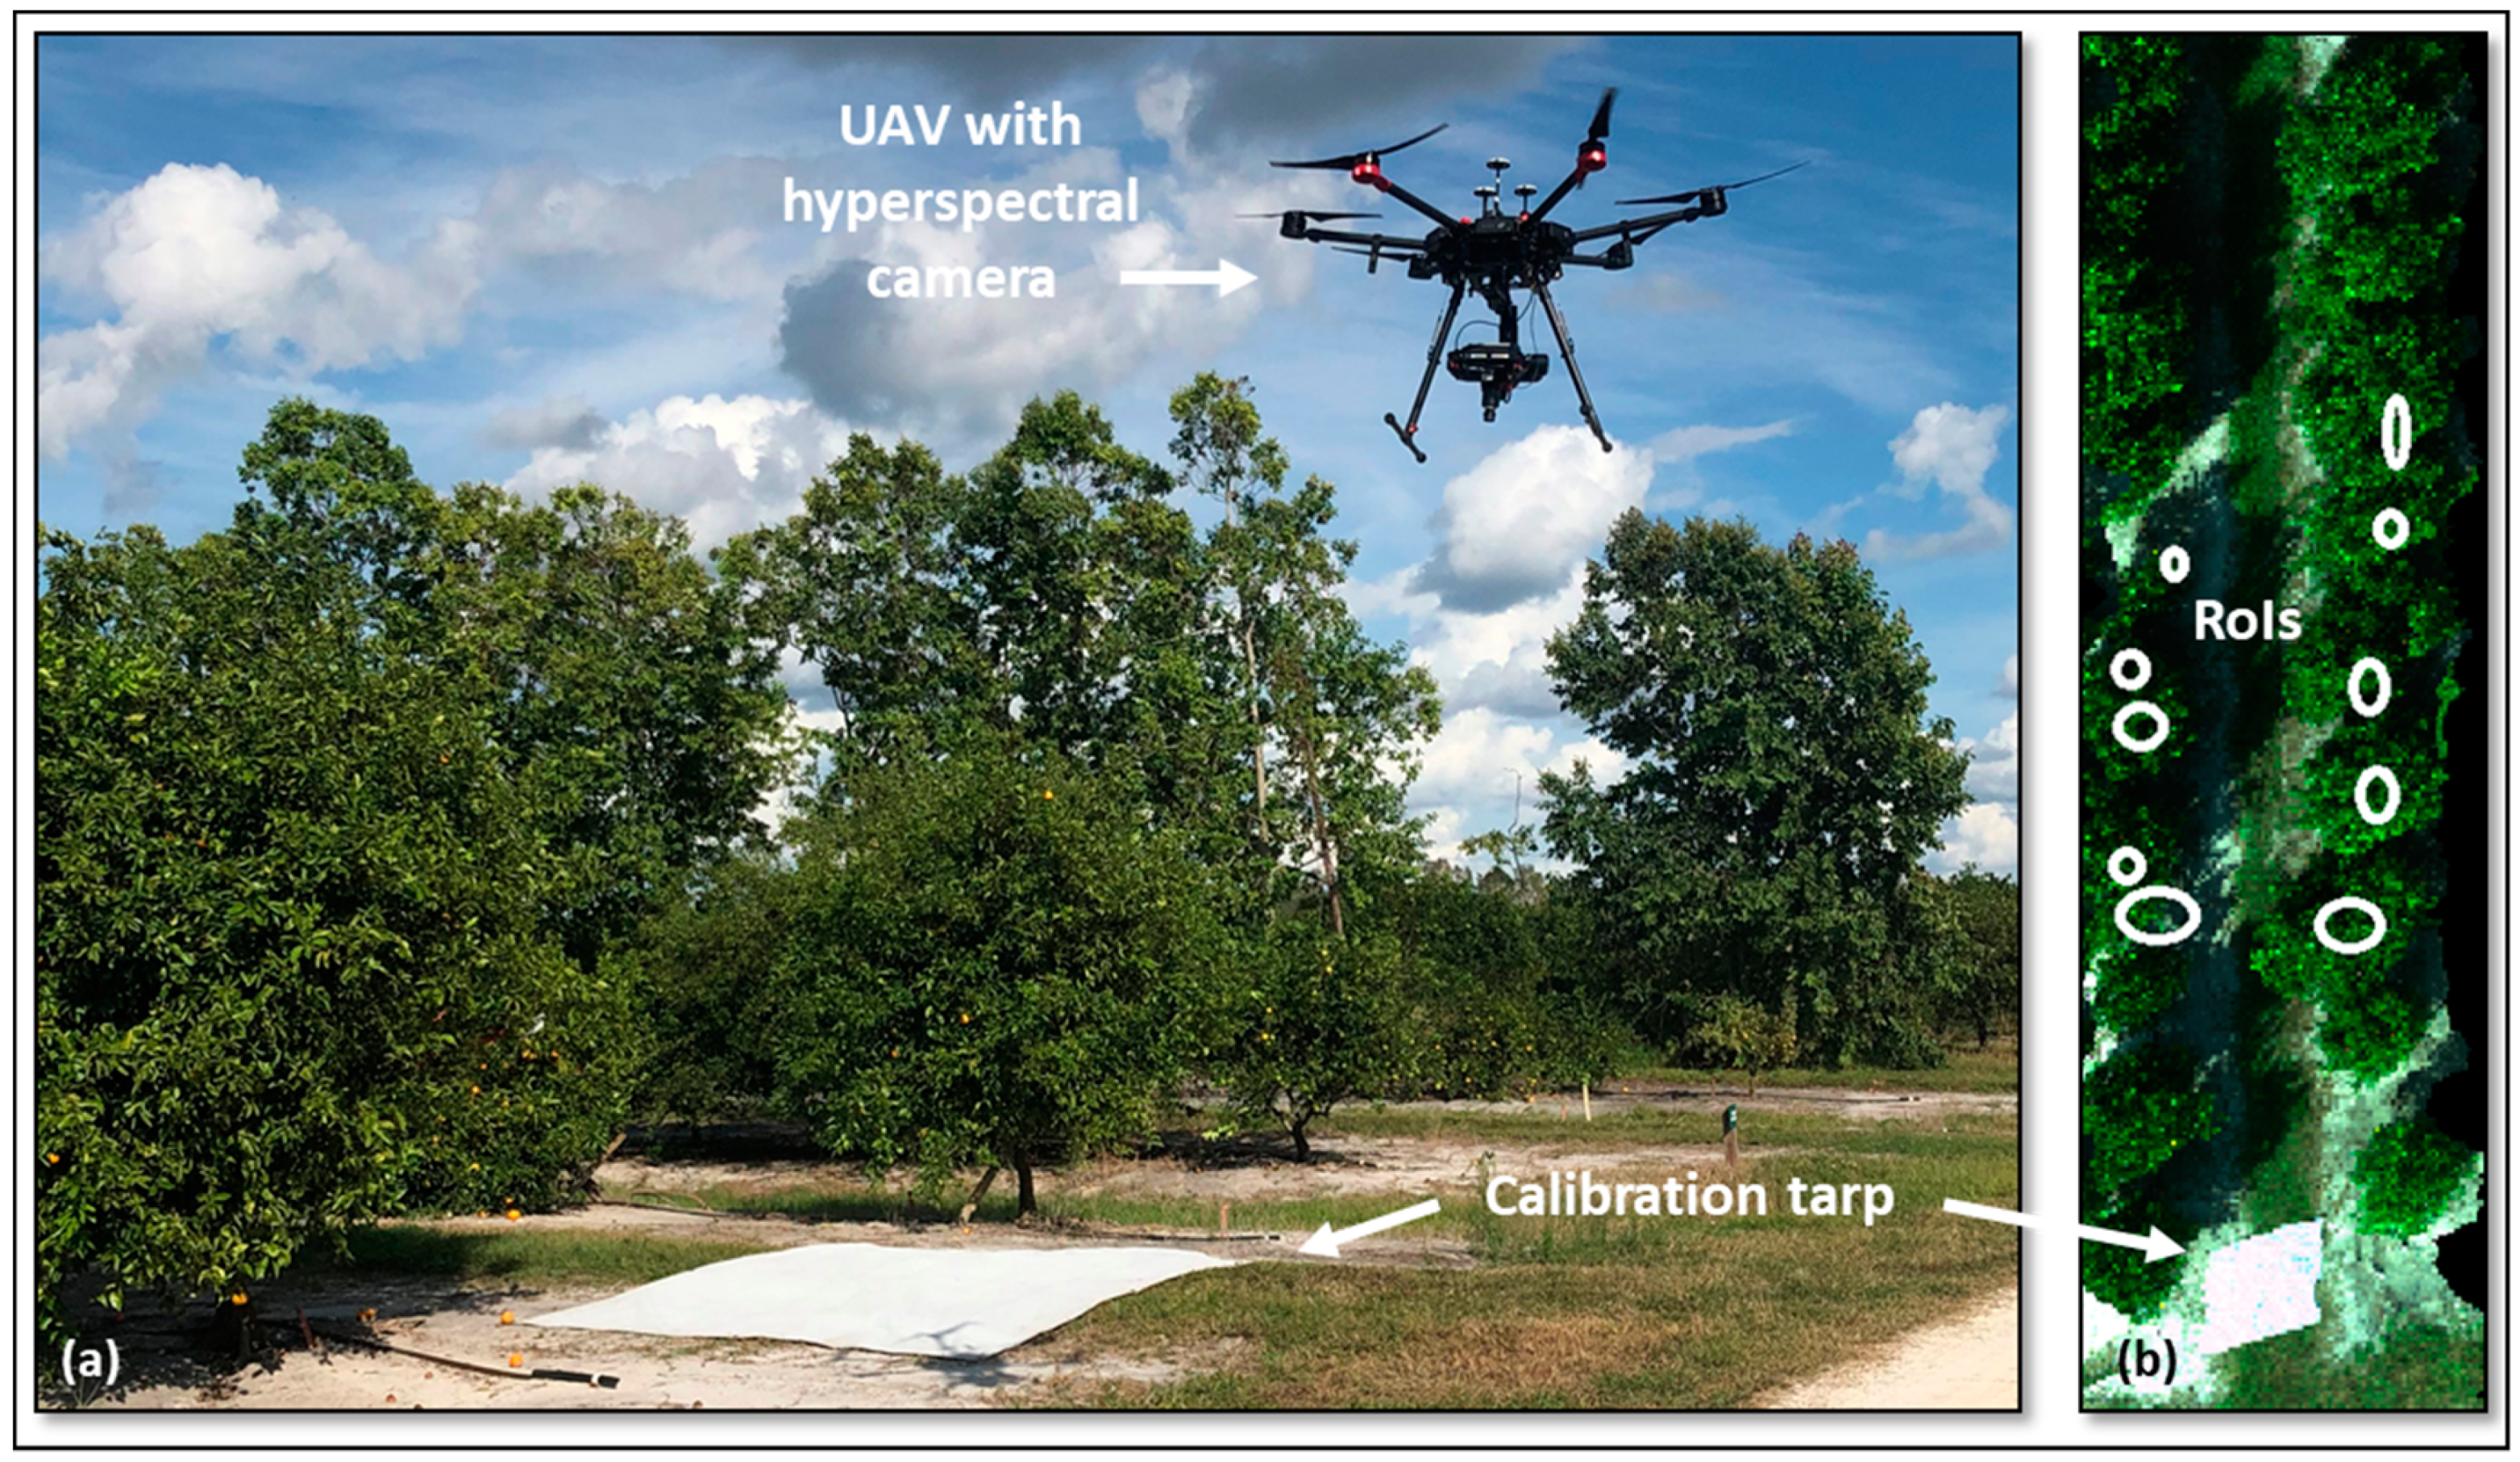
2.5. Outdoor Hyperspectral Data Collection
2.6. Data Analysis
2.6.1. Raw data
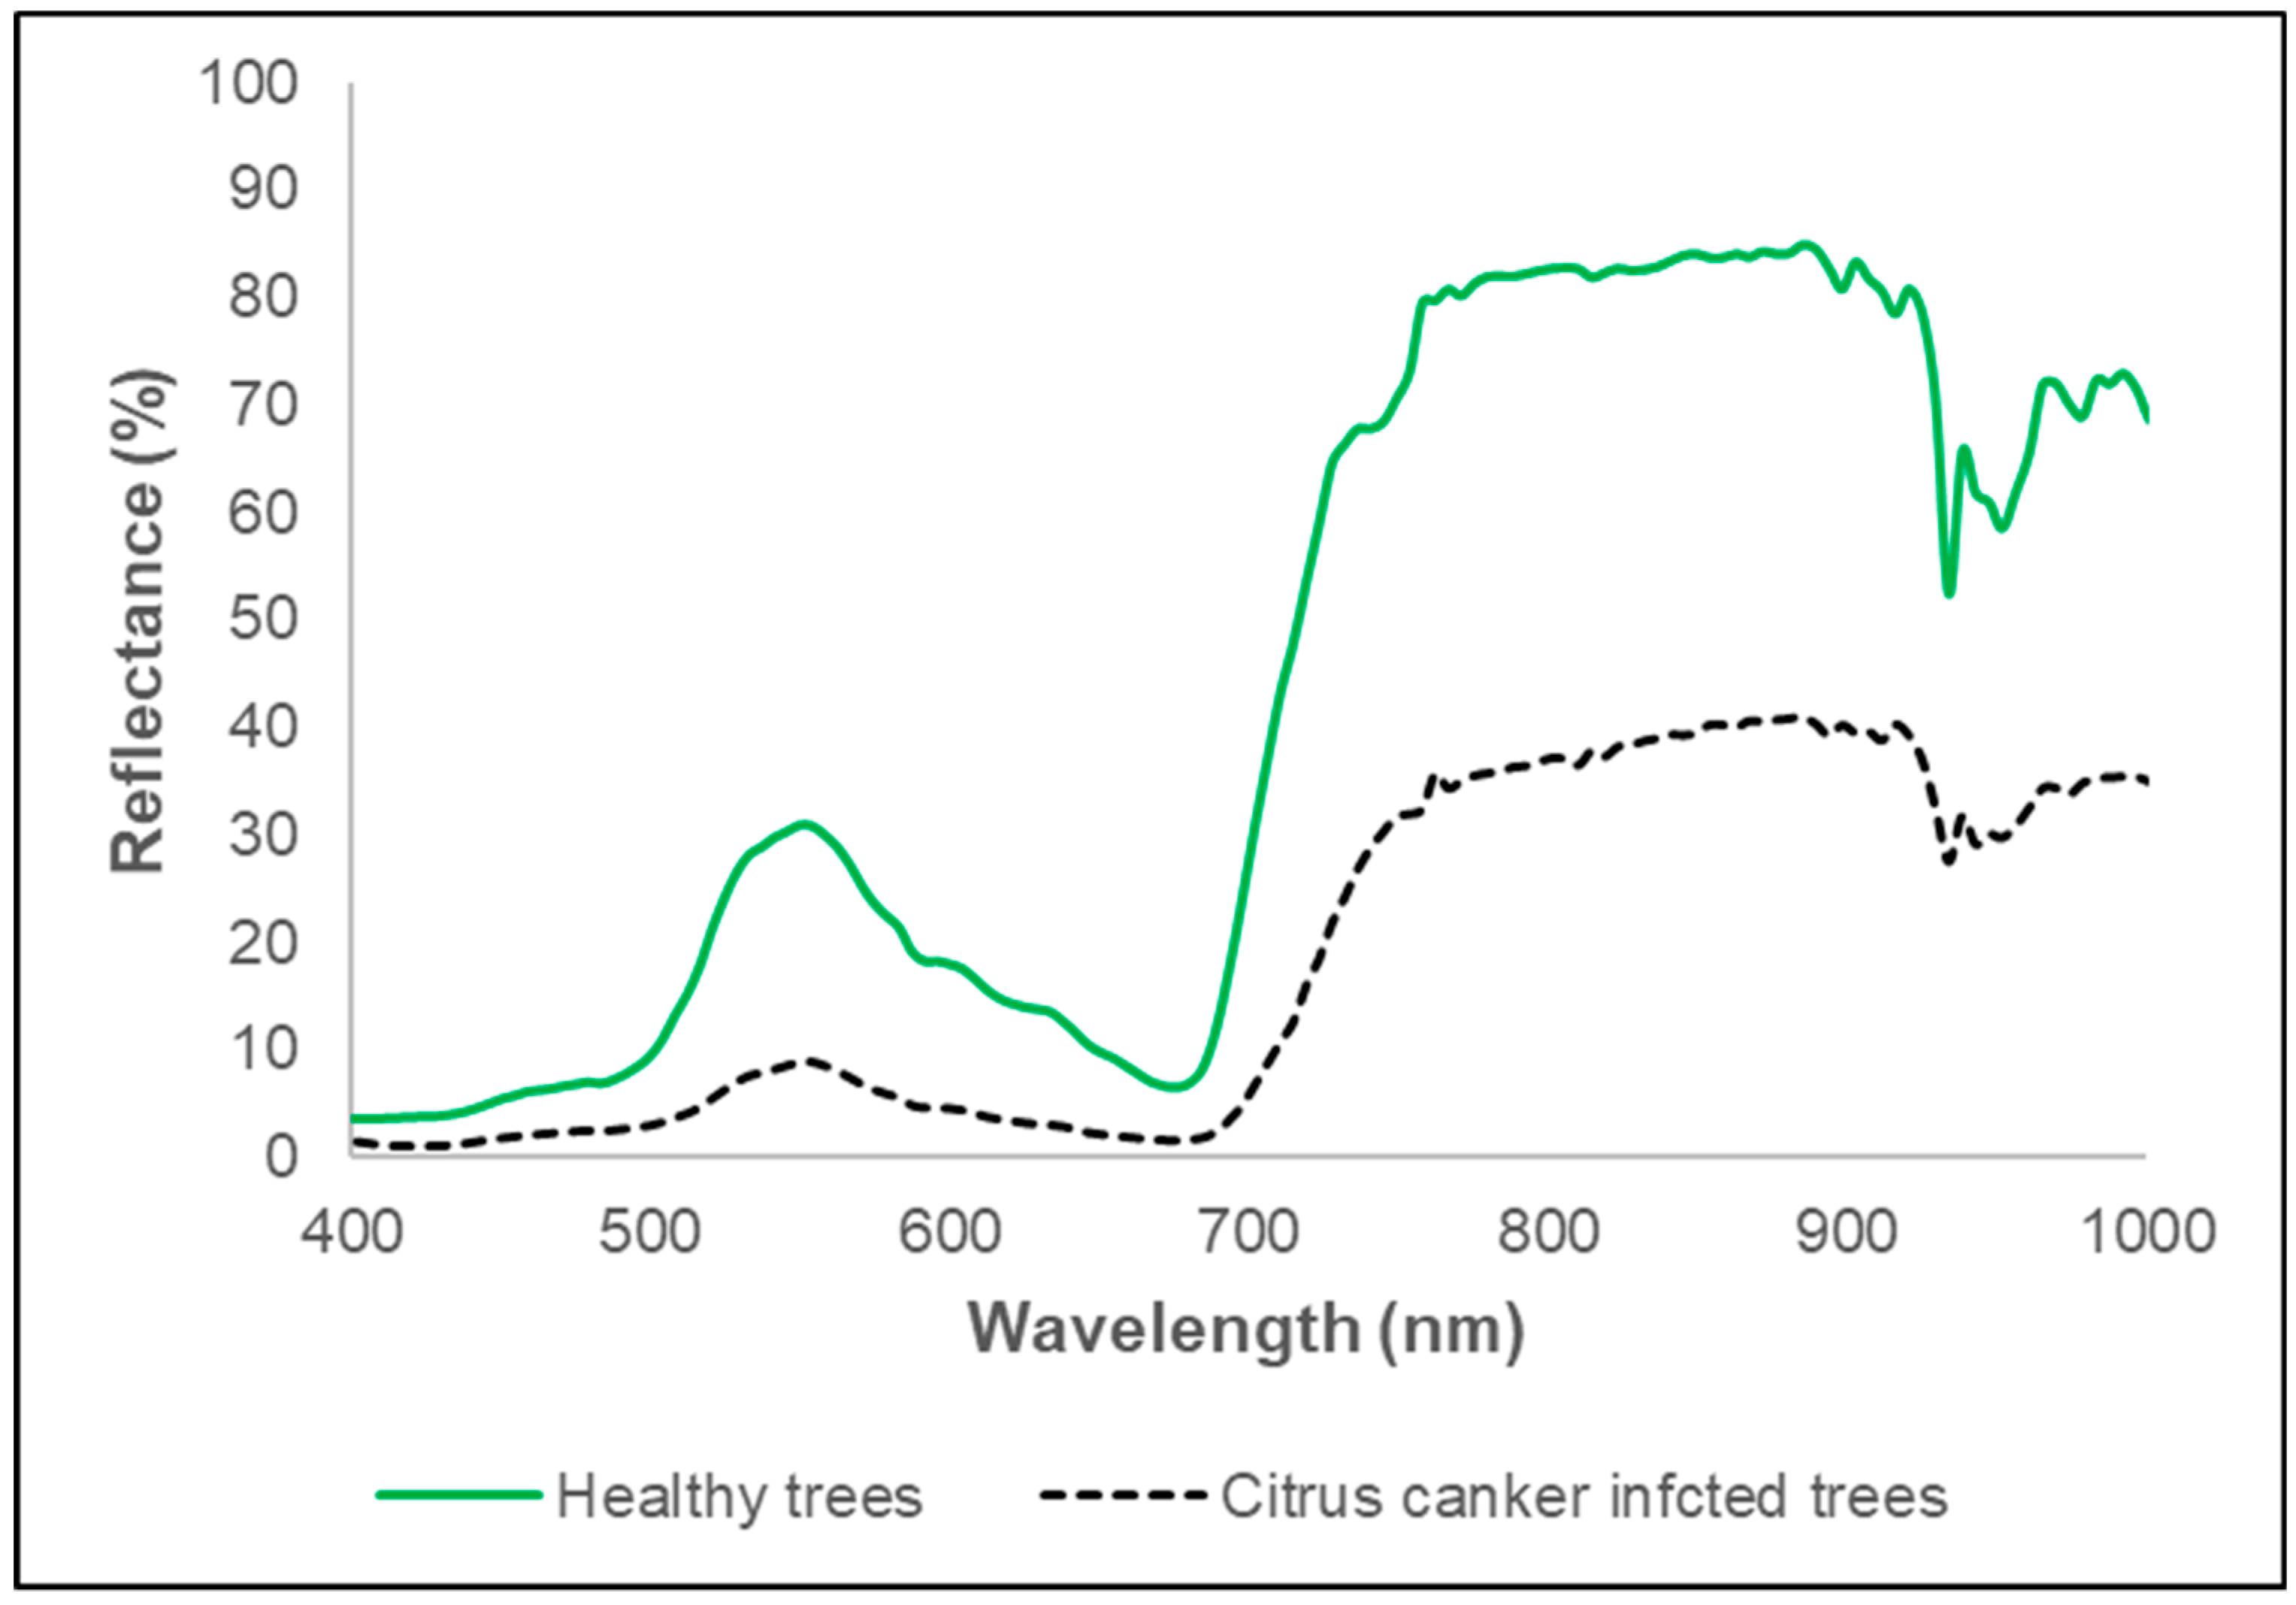
2.6.2. Reflectance
2.6.3. Data analysis procedure
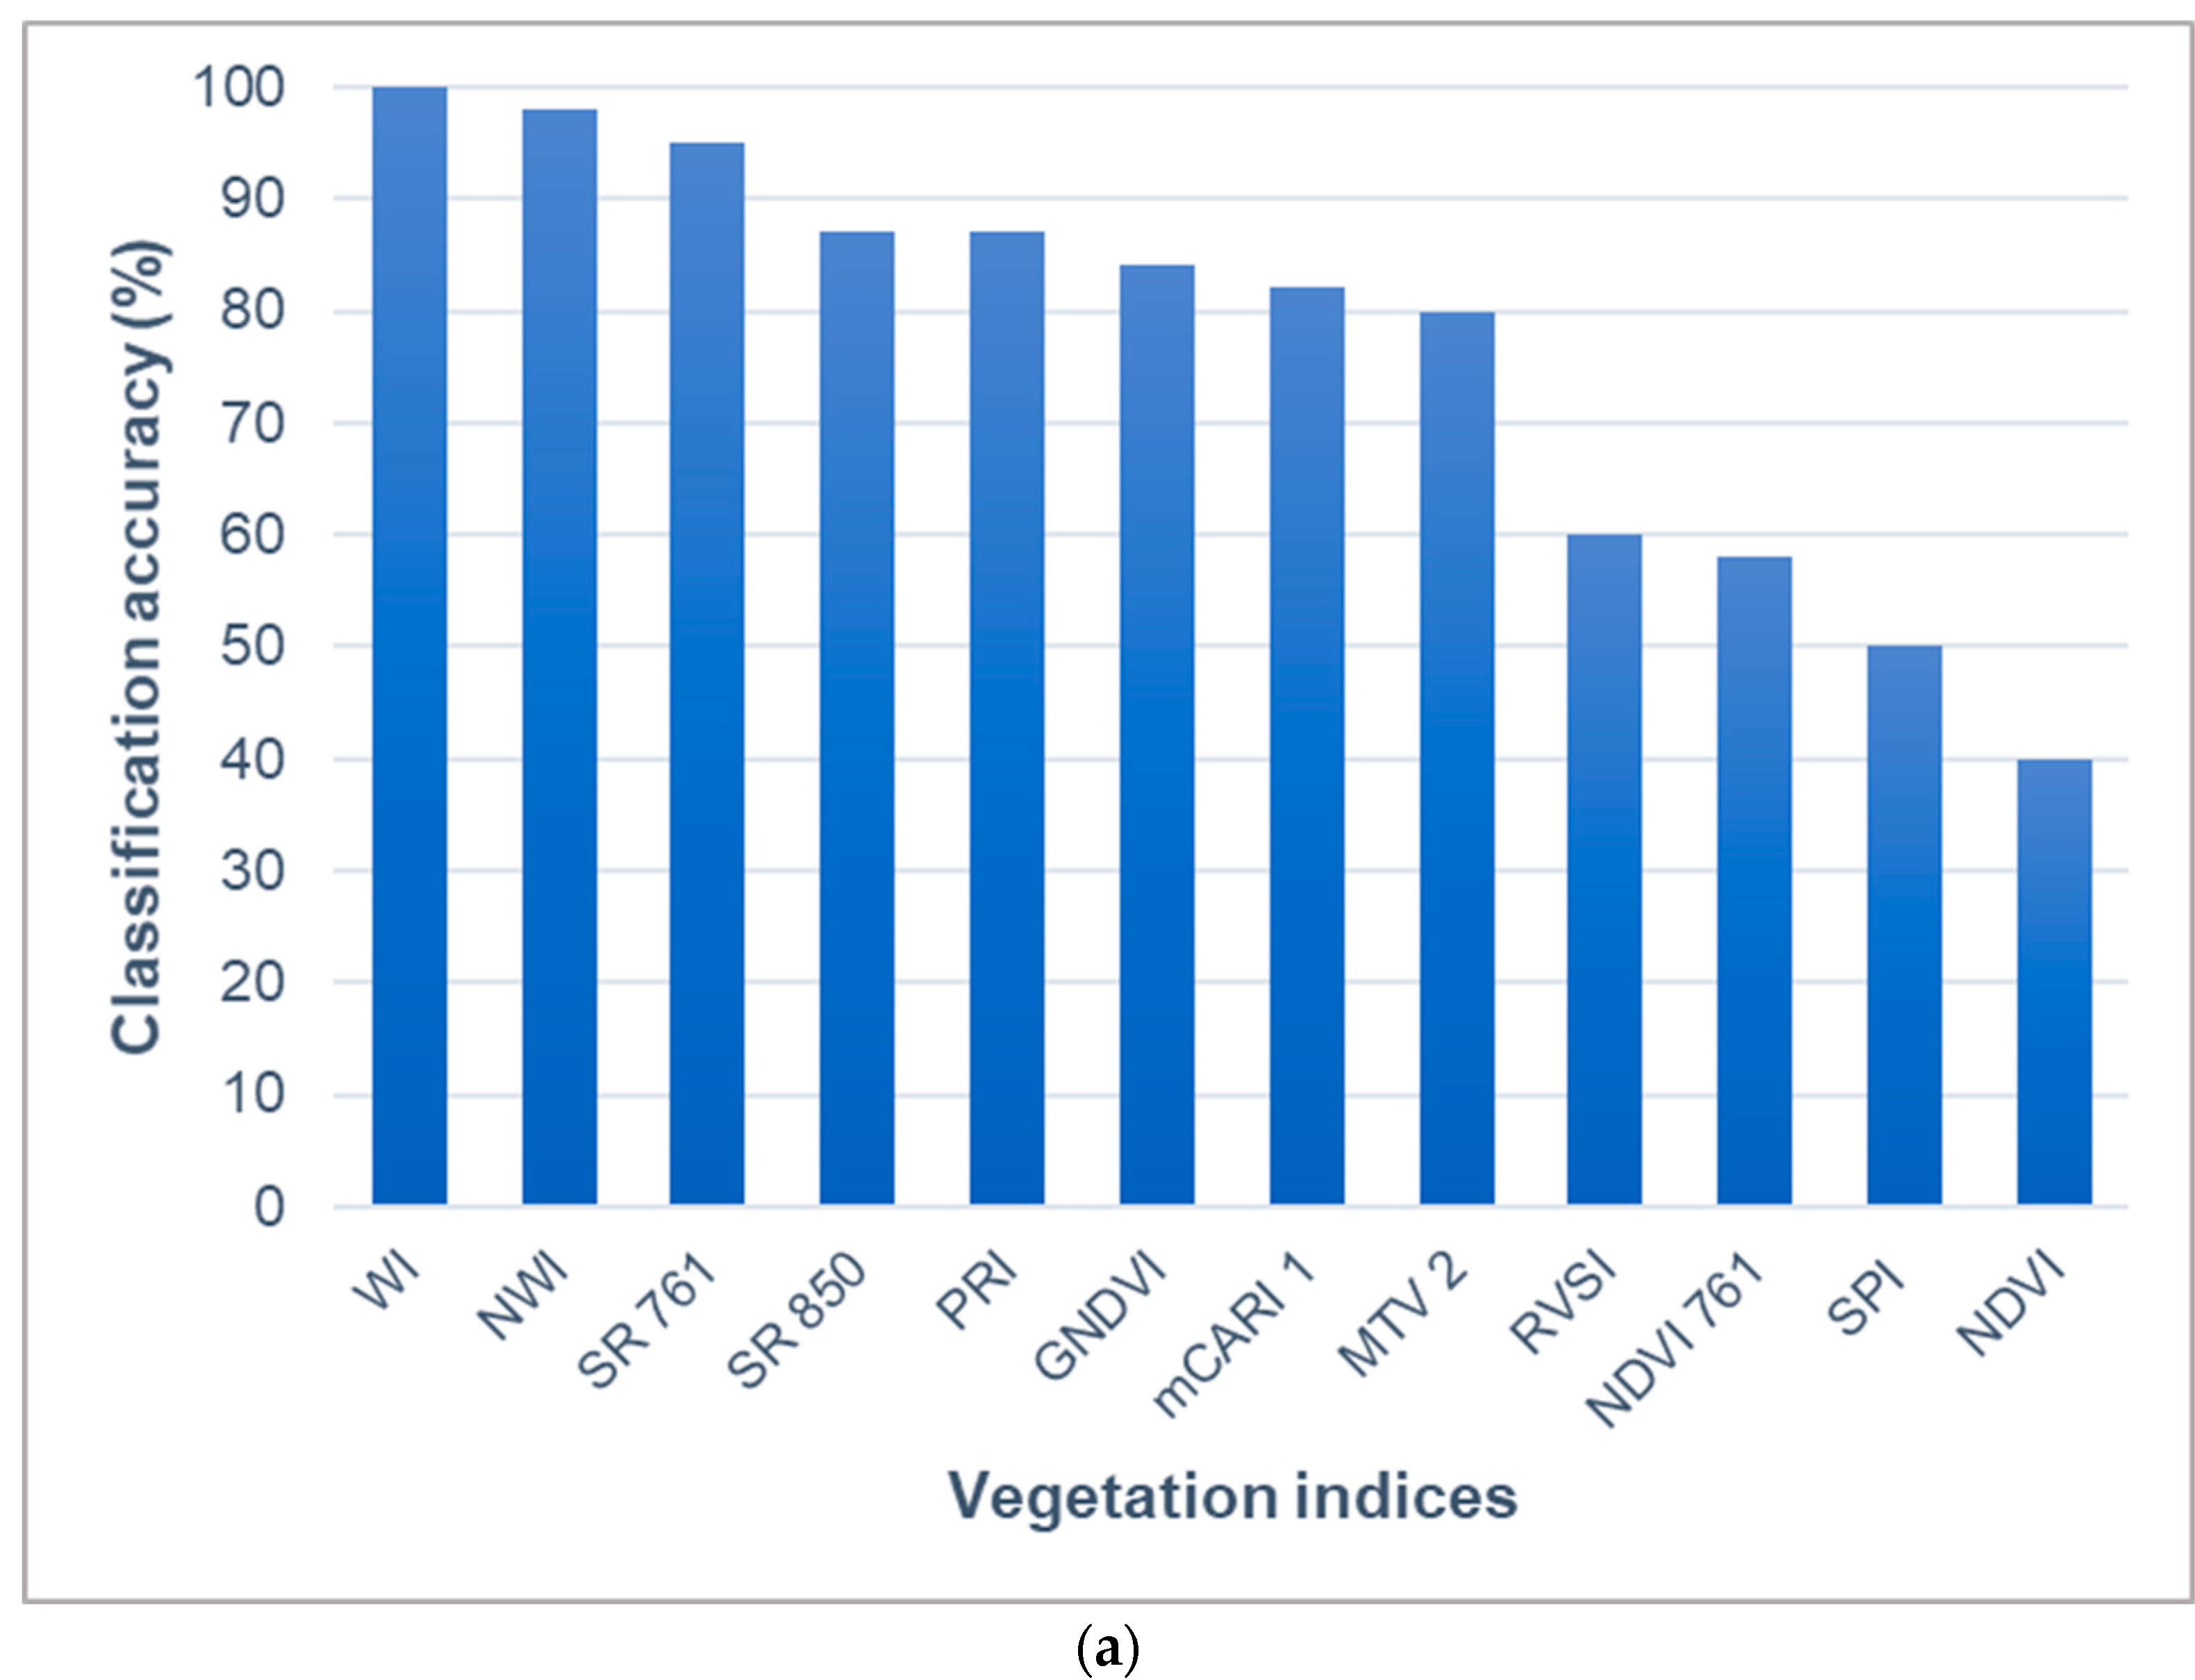
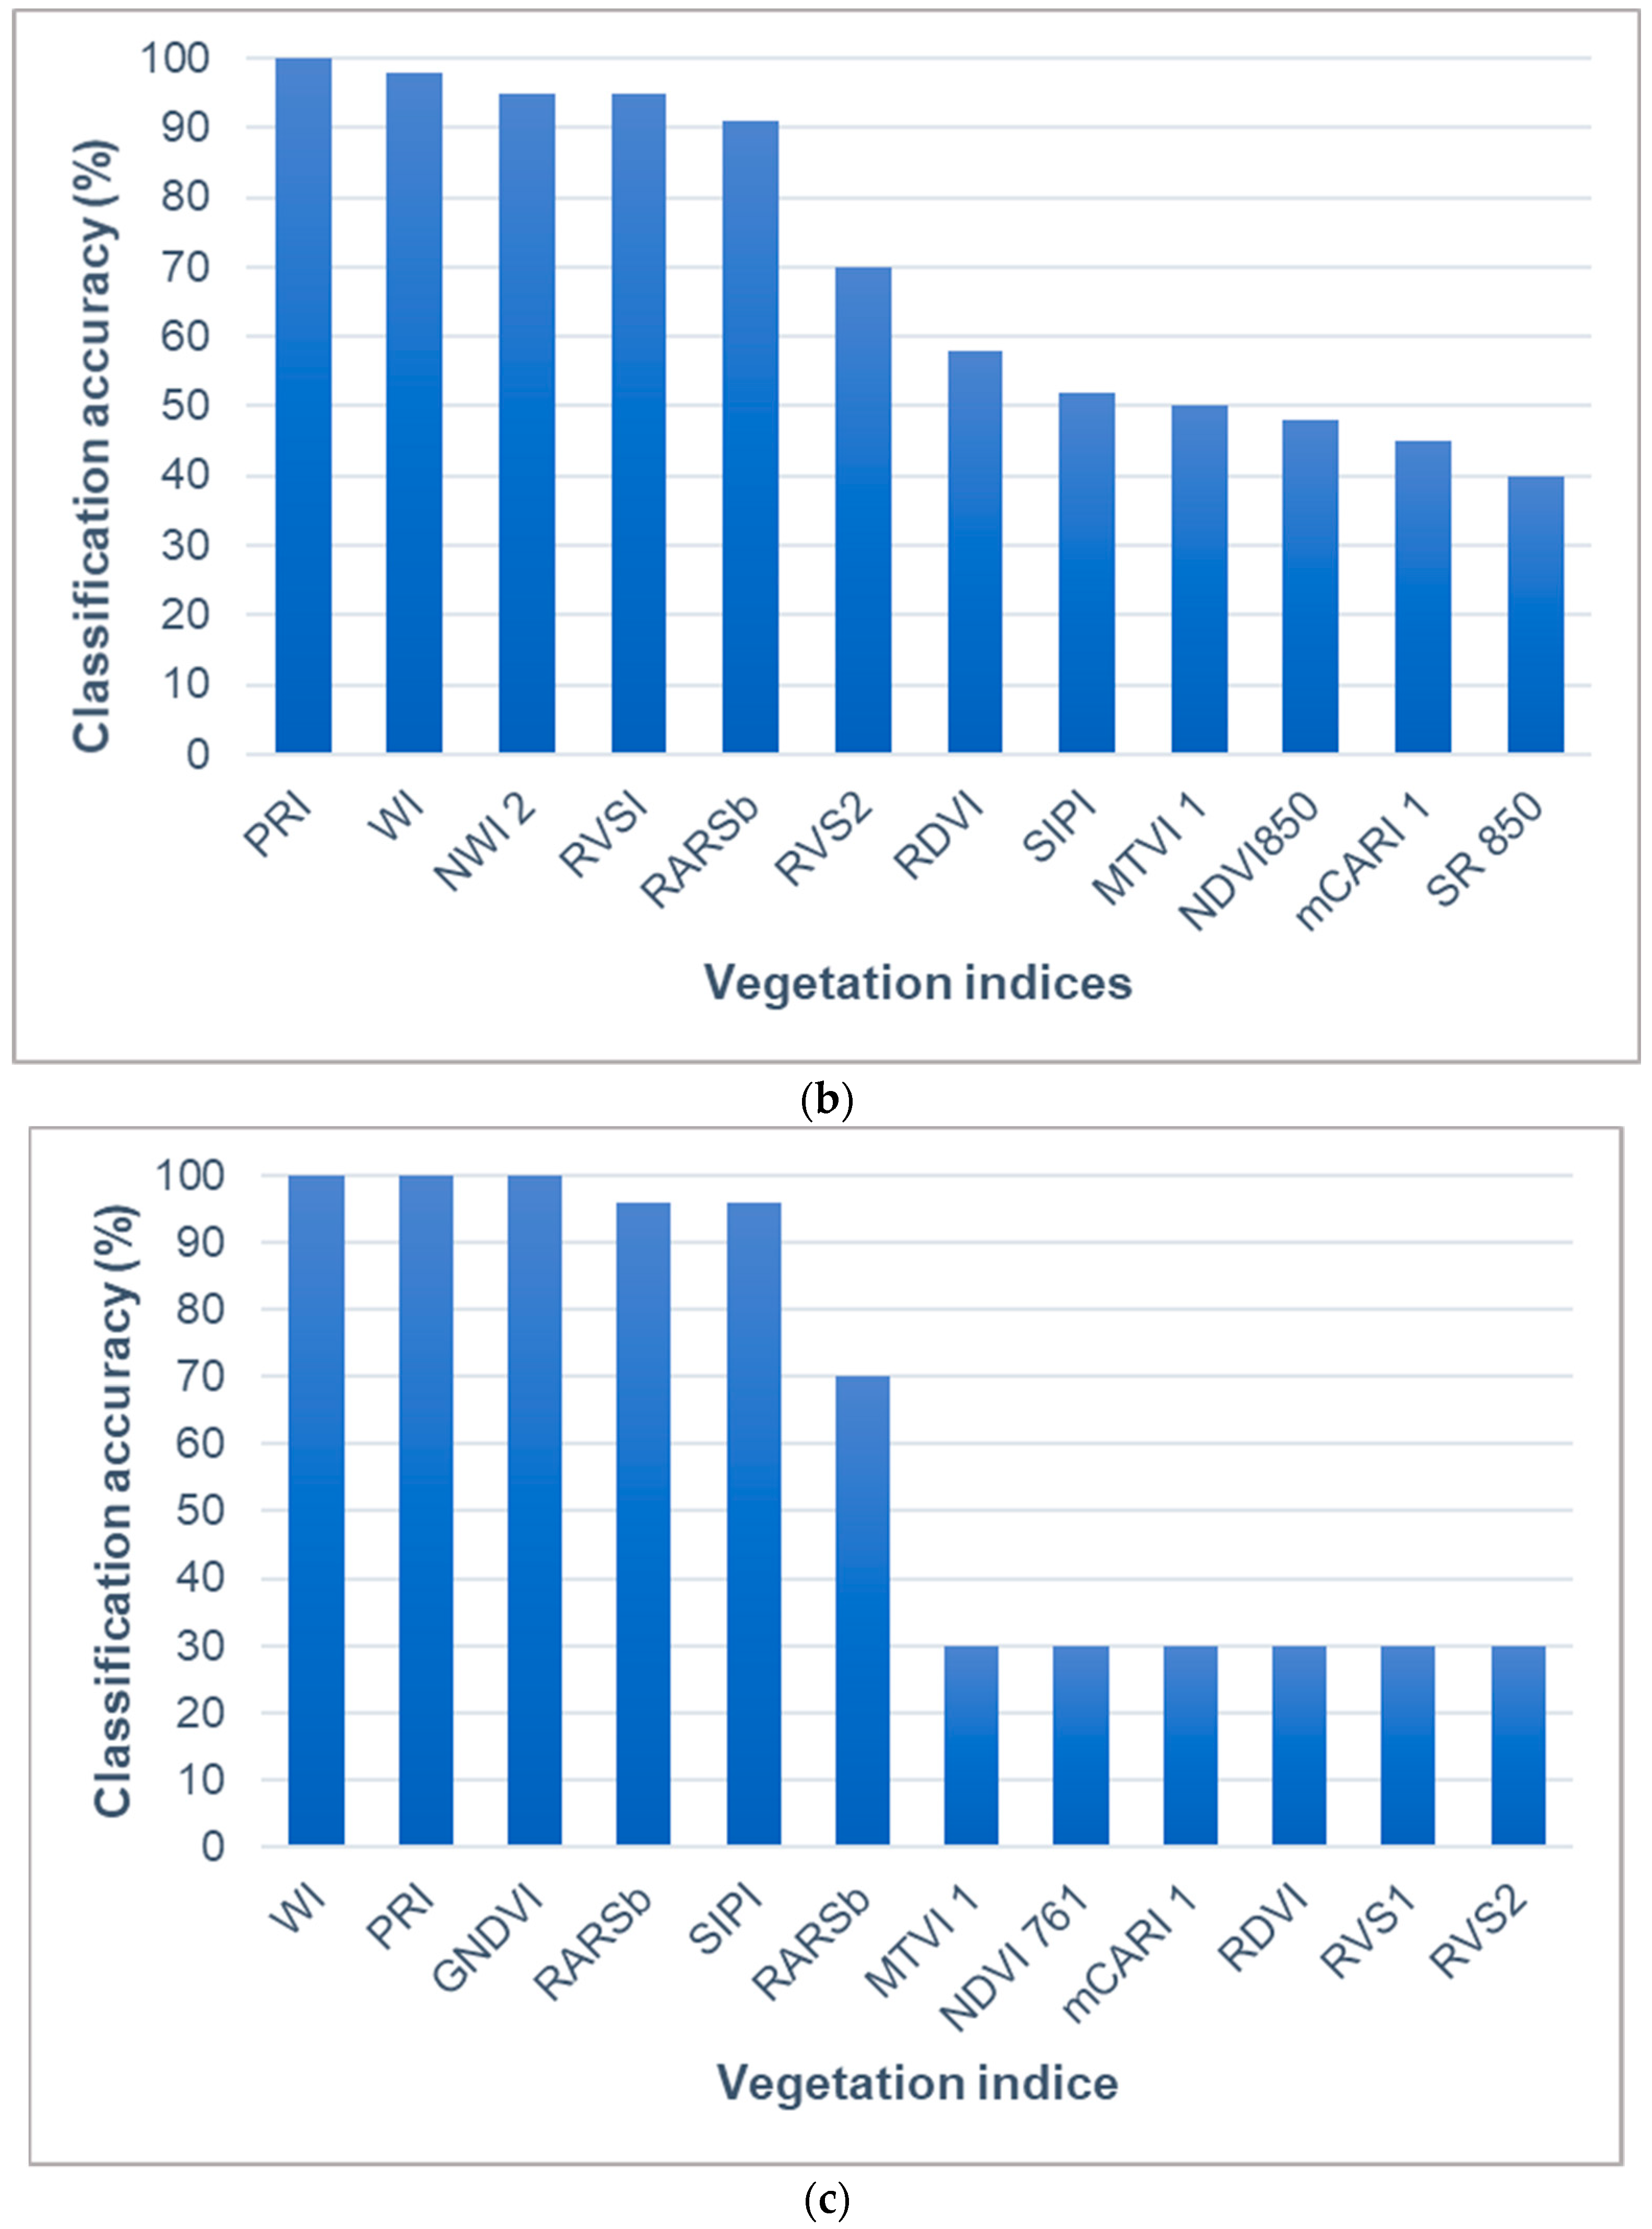
2.7. Vegetation Indices
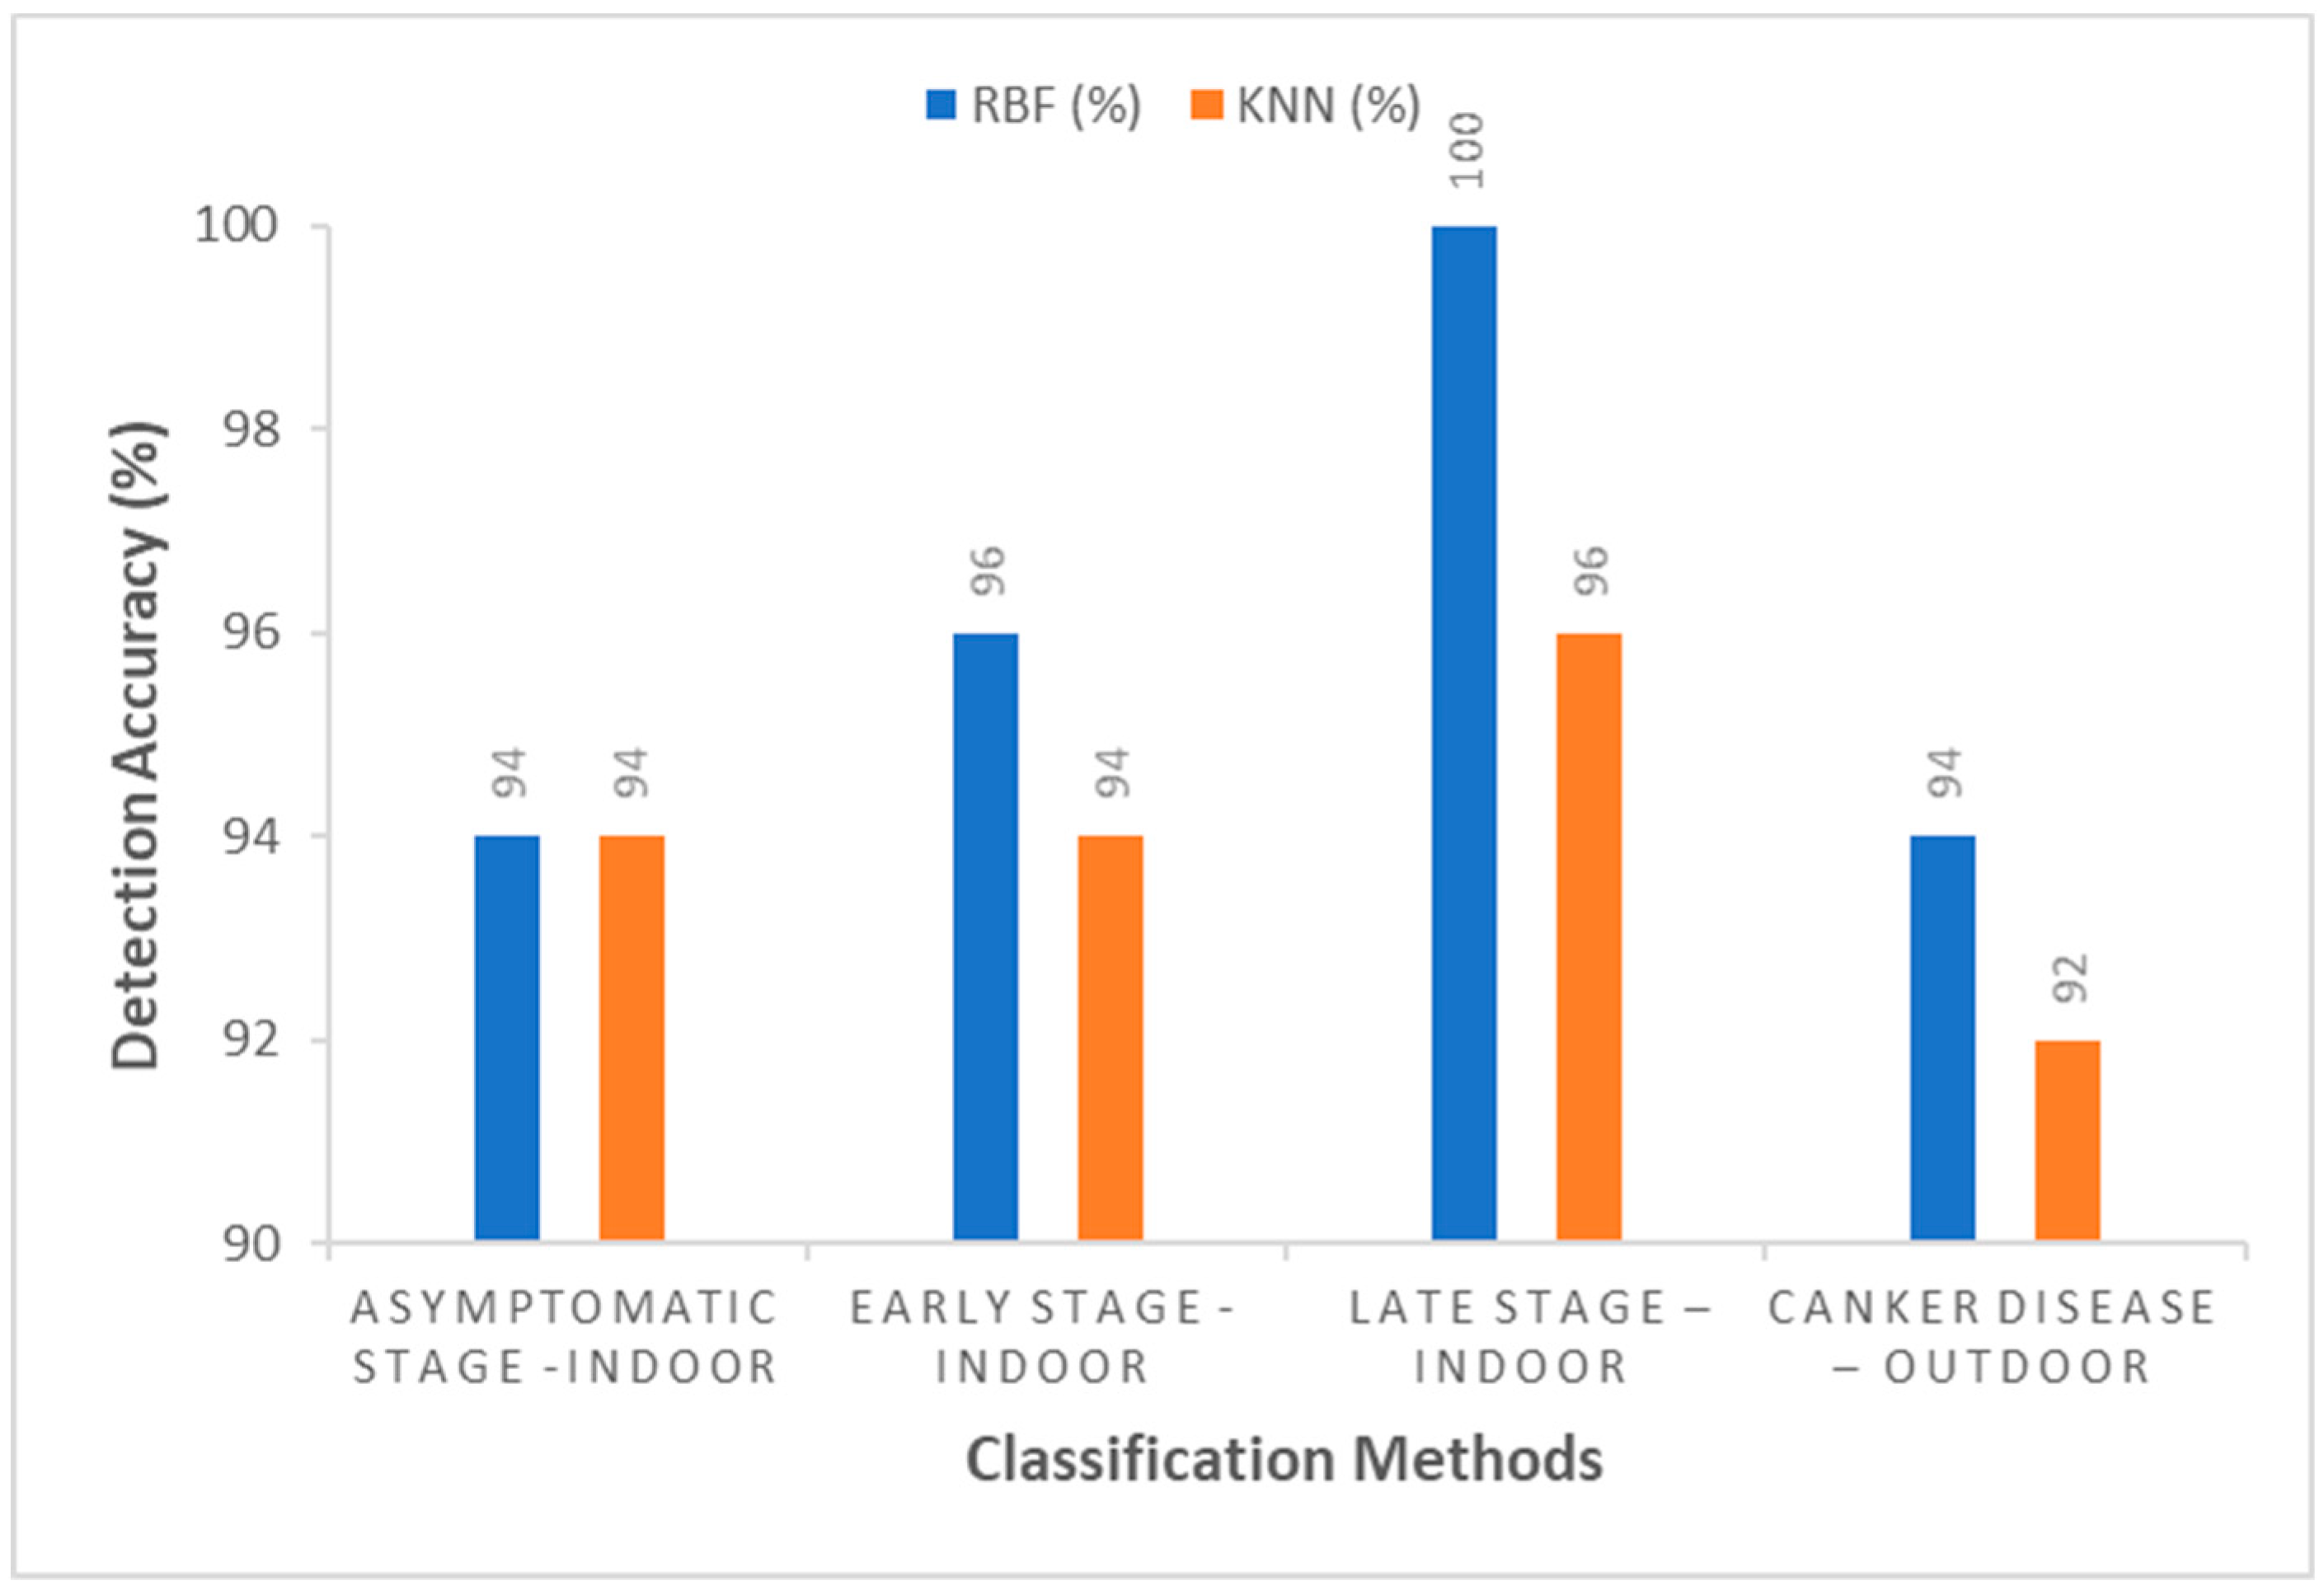
2.8. Spectral Data Classification Methods
2.8.1. Neural Network Radial Basis Function (RBF)
2.8.2. K-Nearest Neighbor (KNN)
3. Results
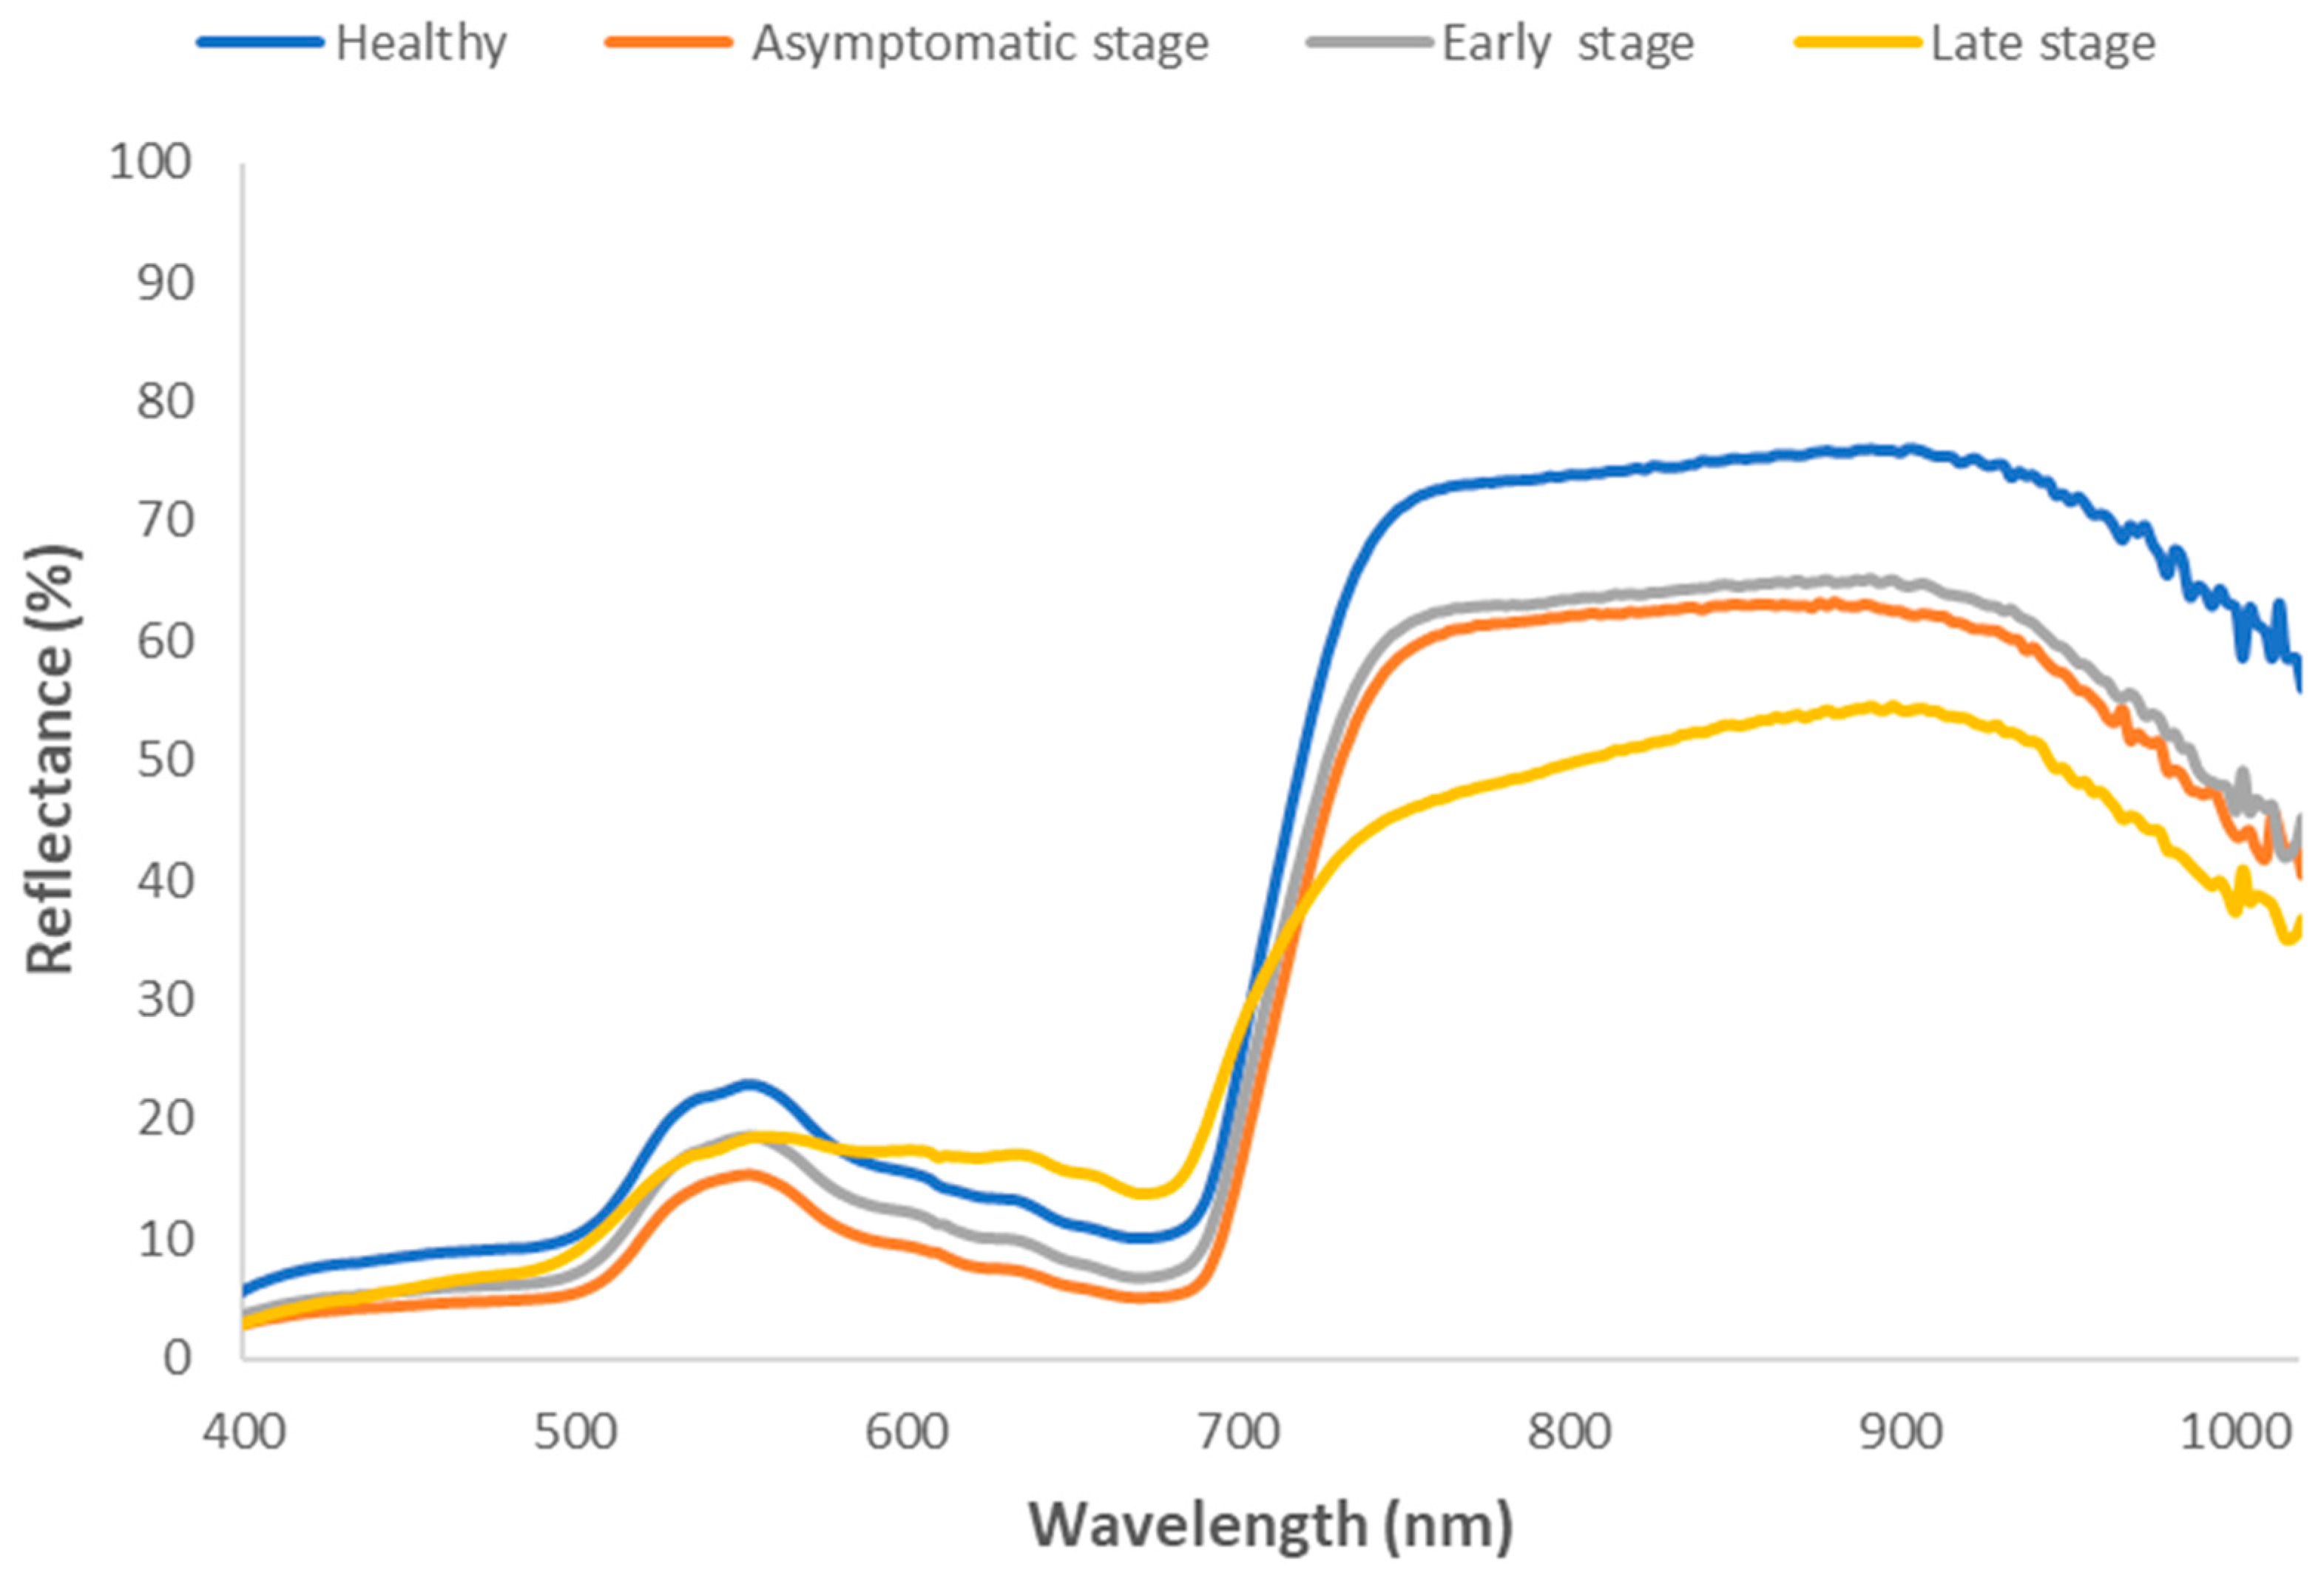
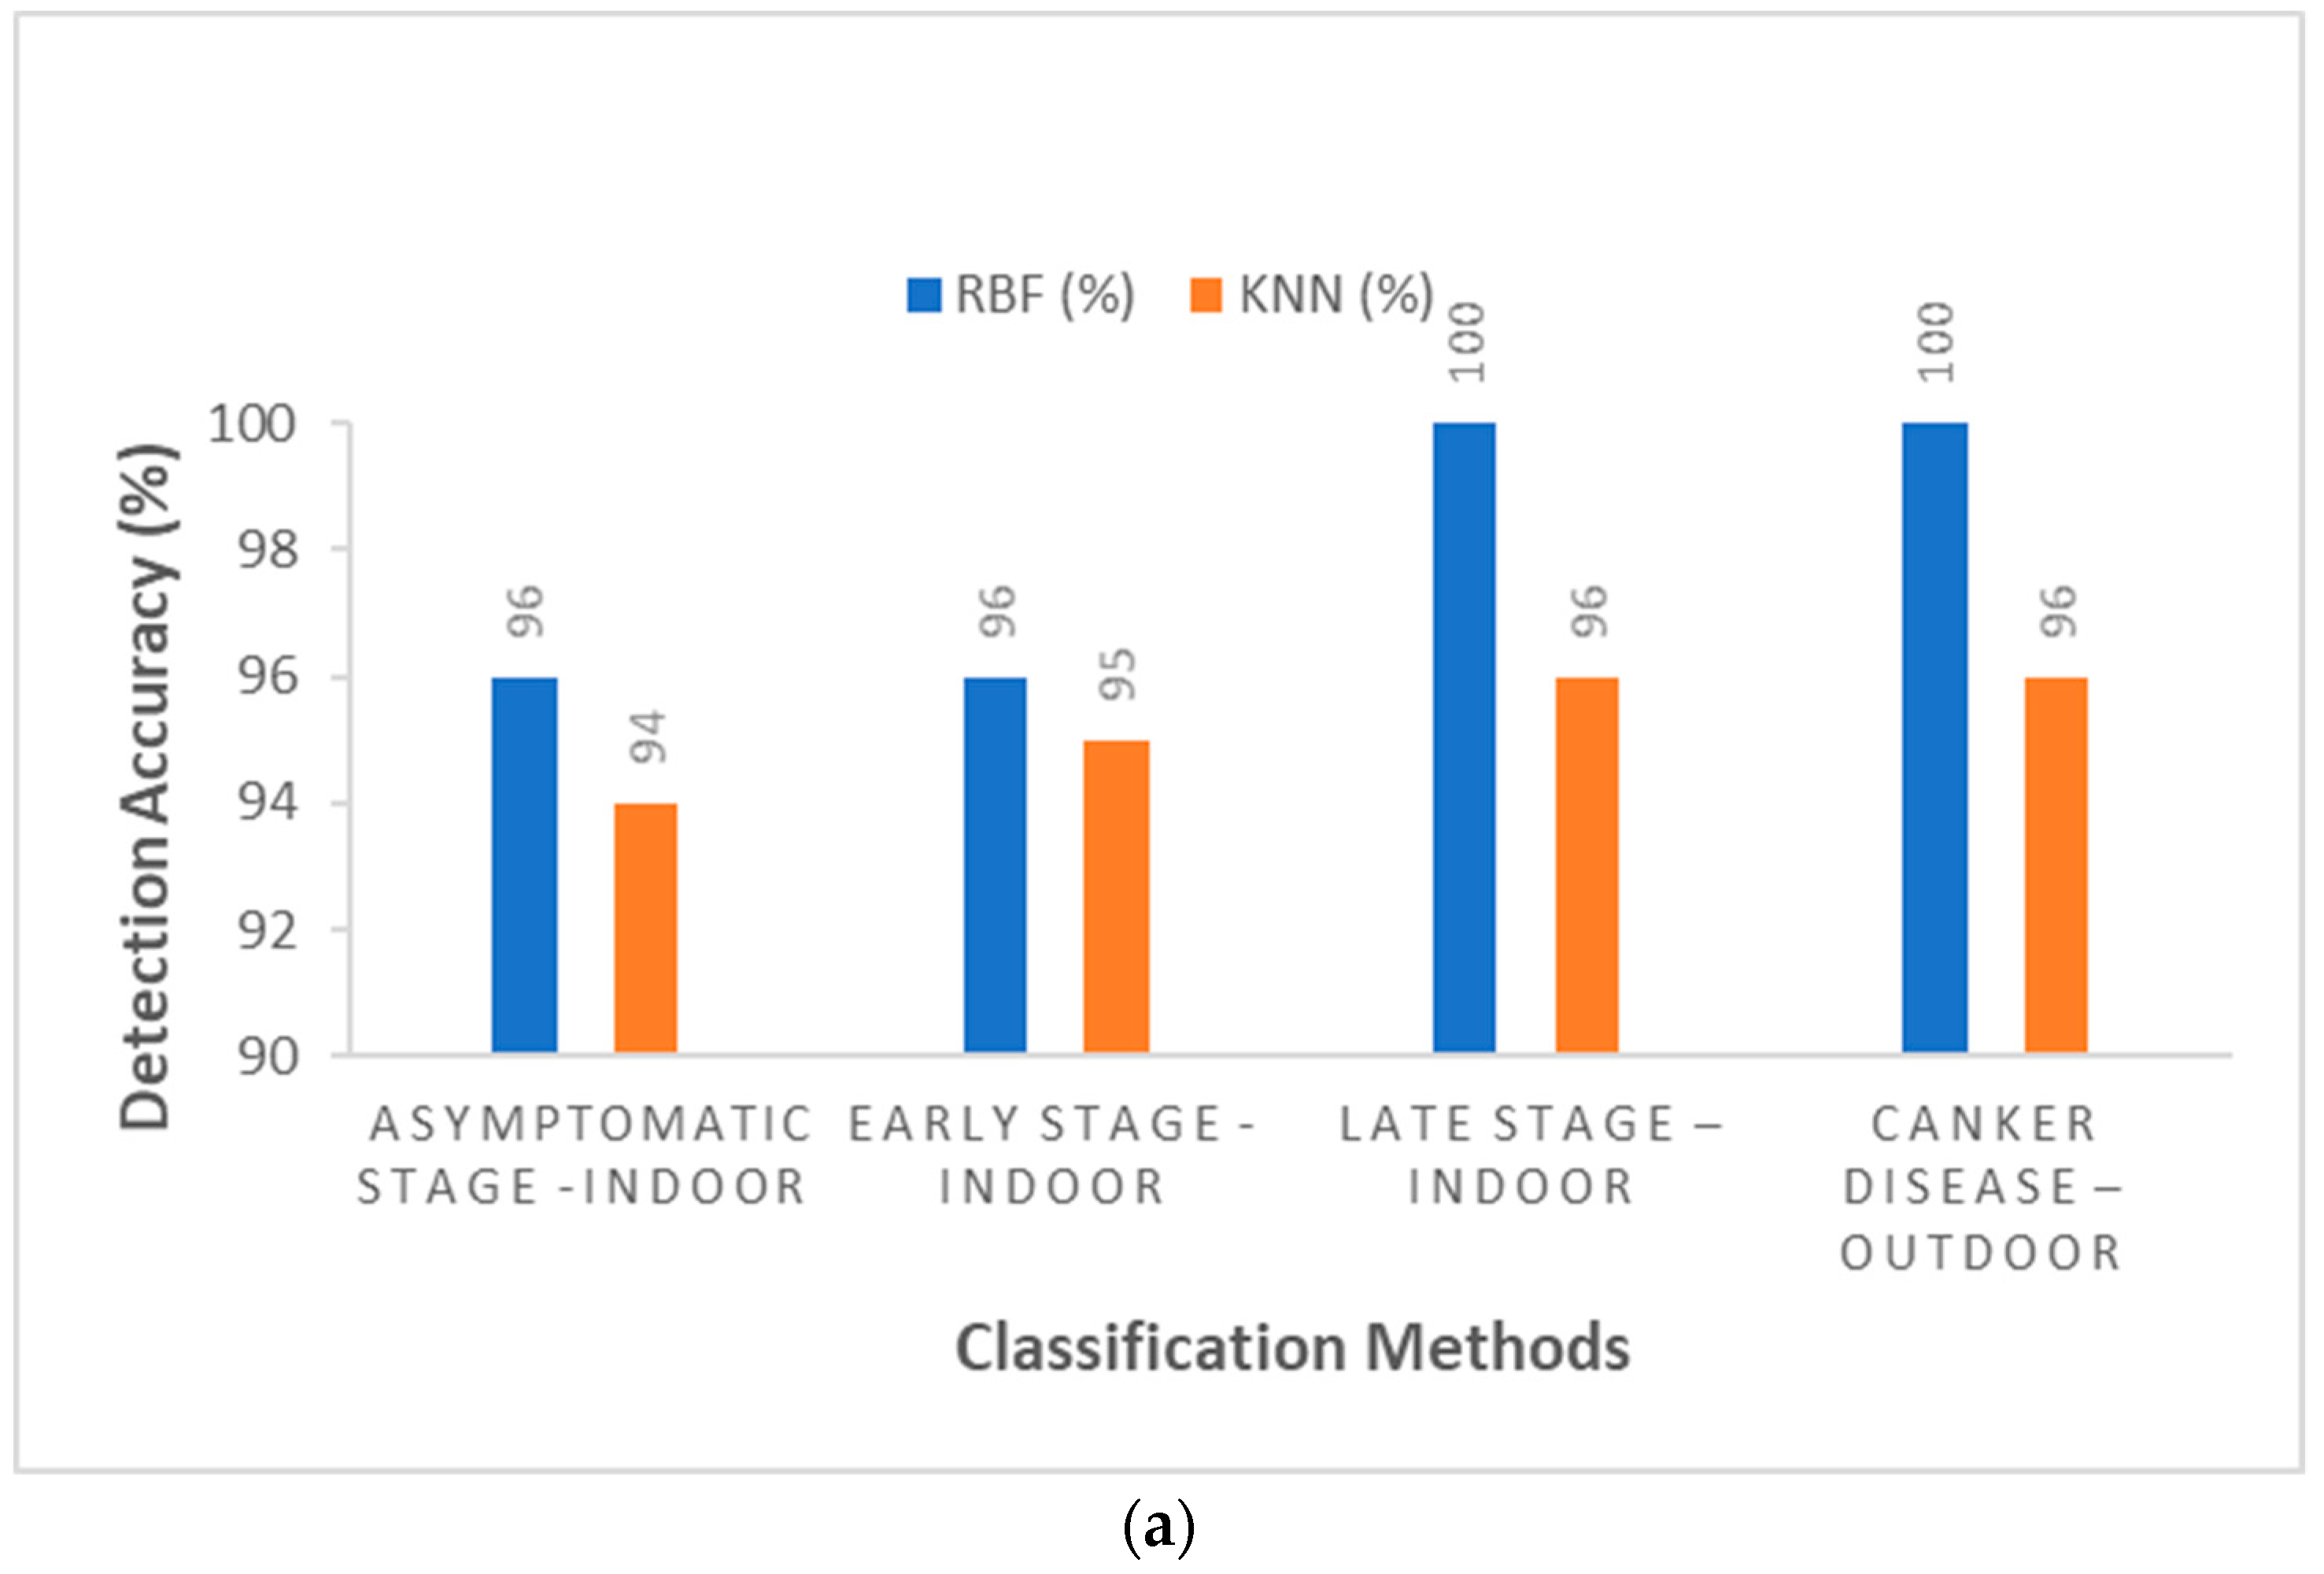
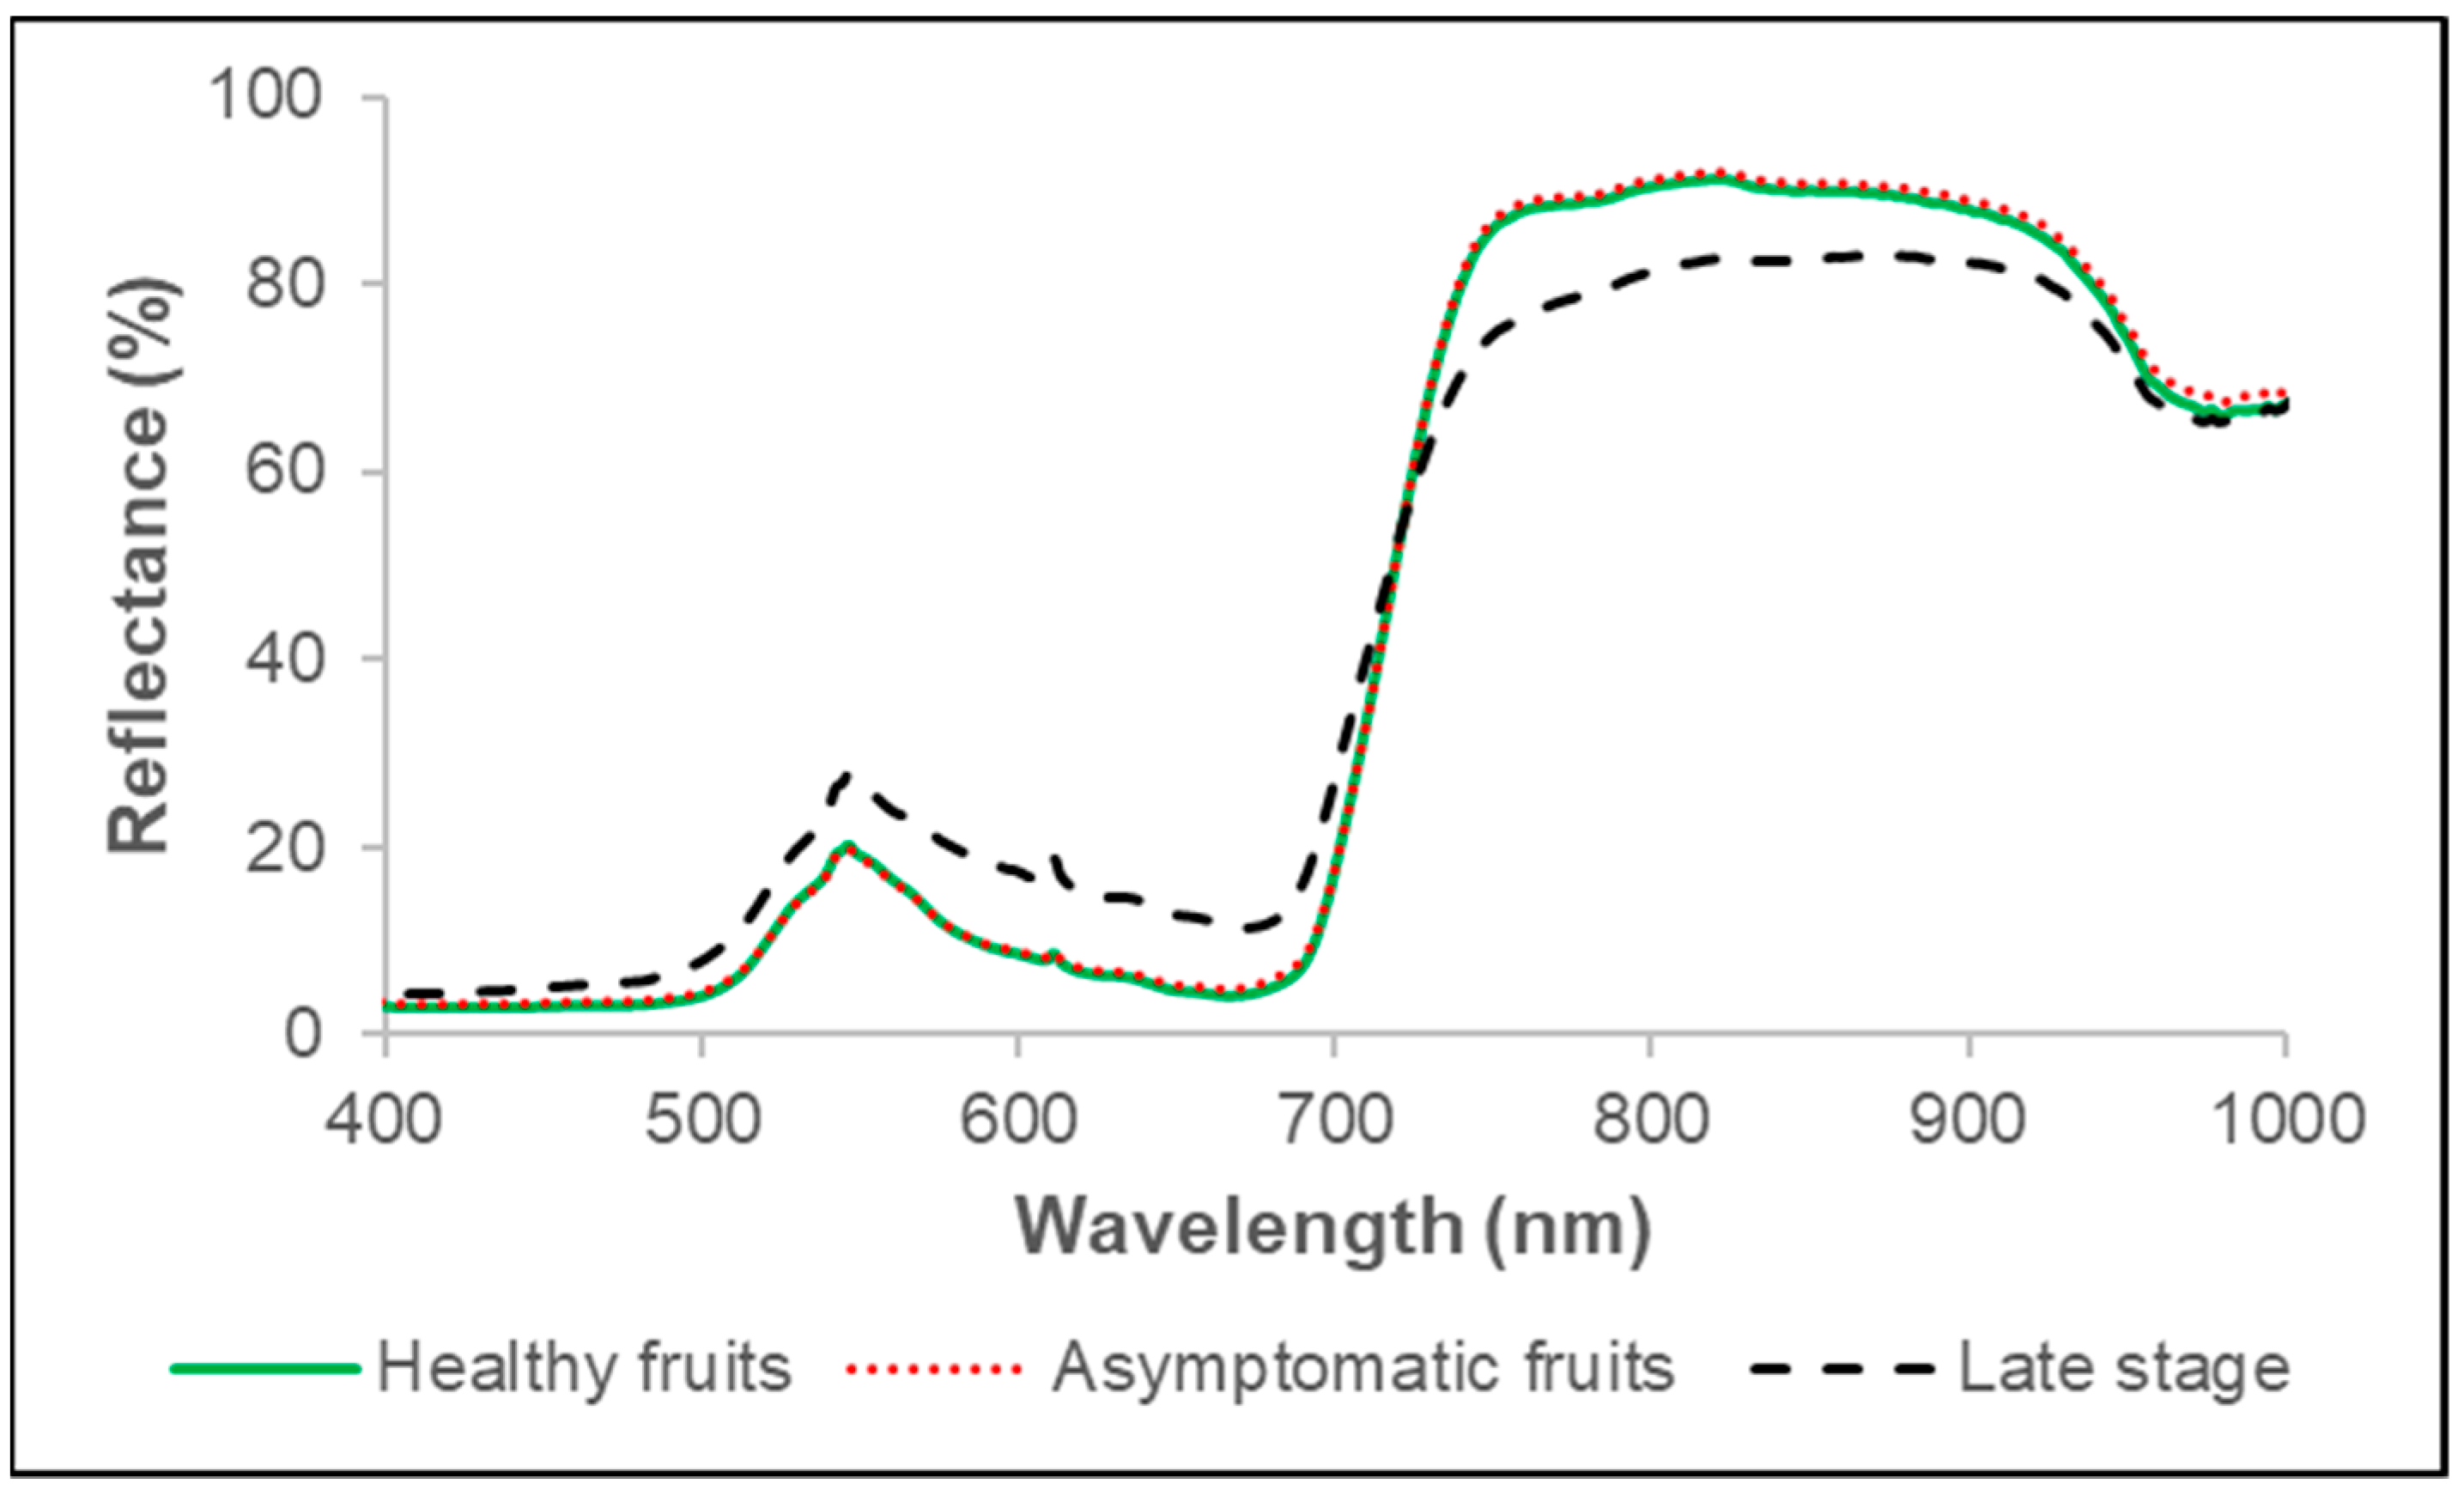
3.1. Indoor Imaging Technique
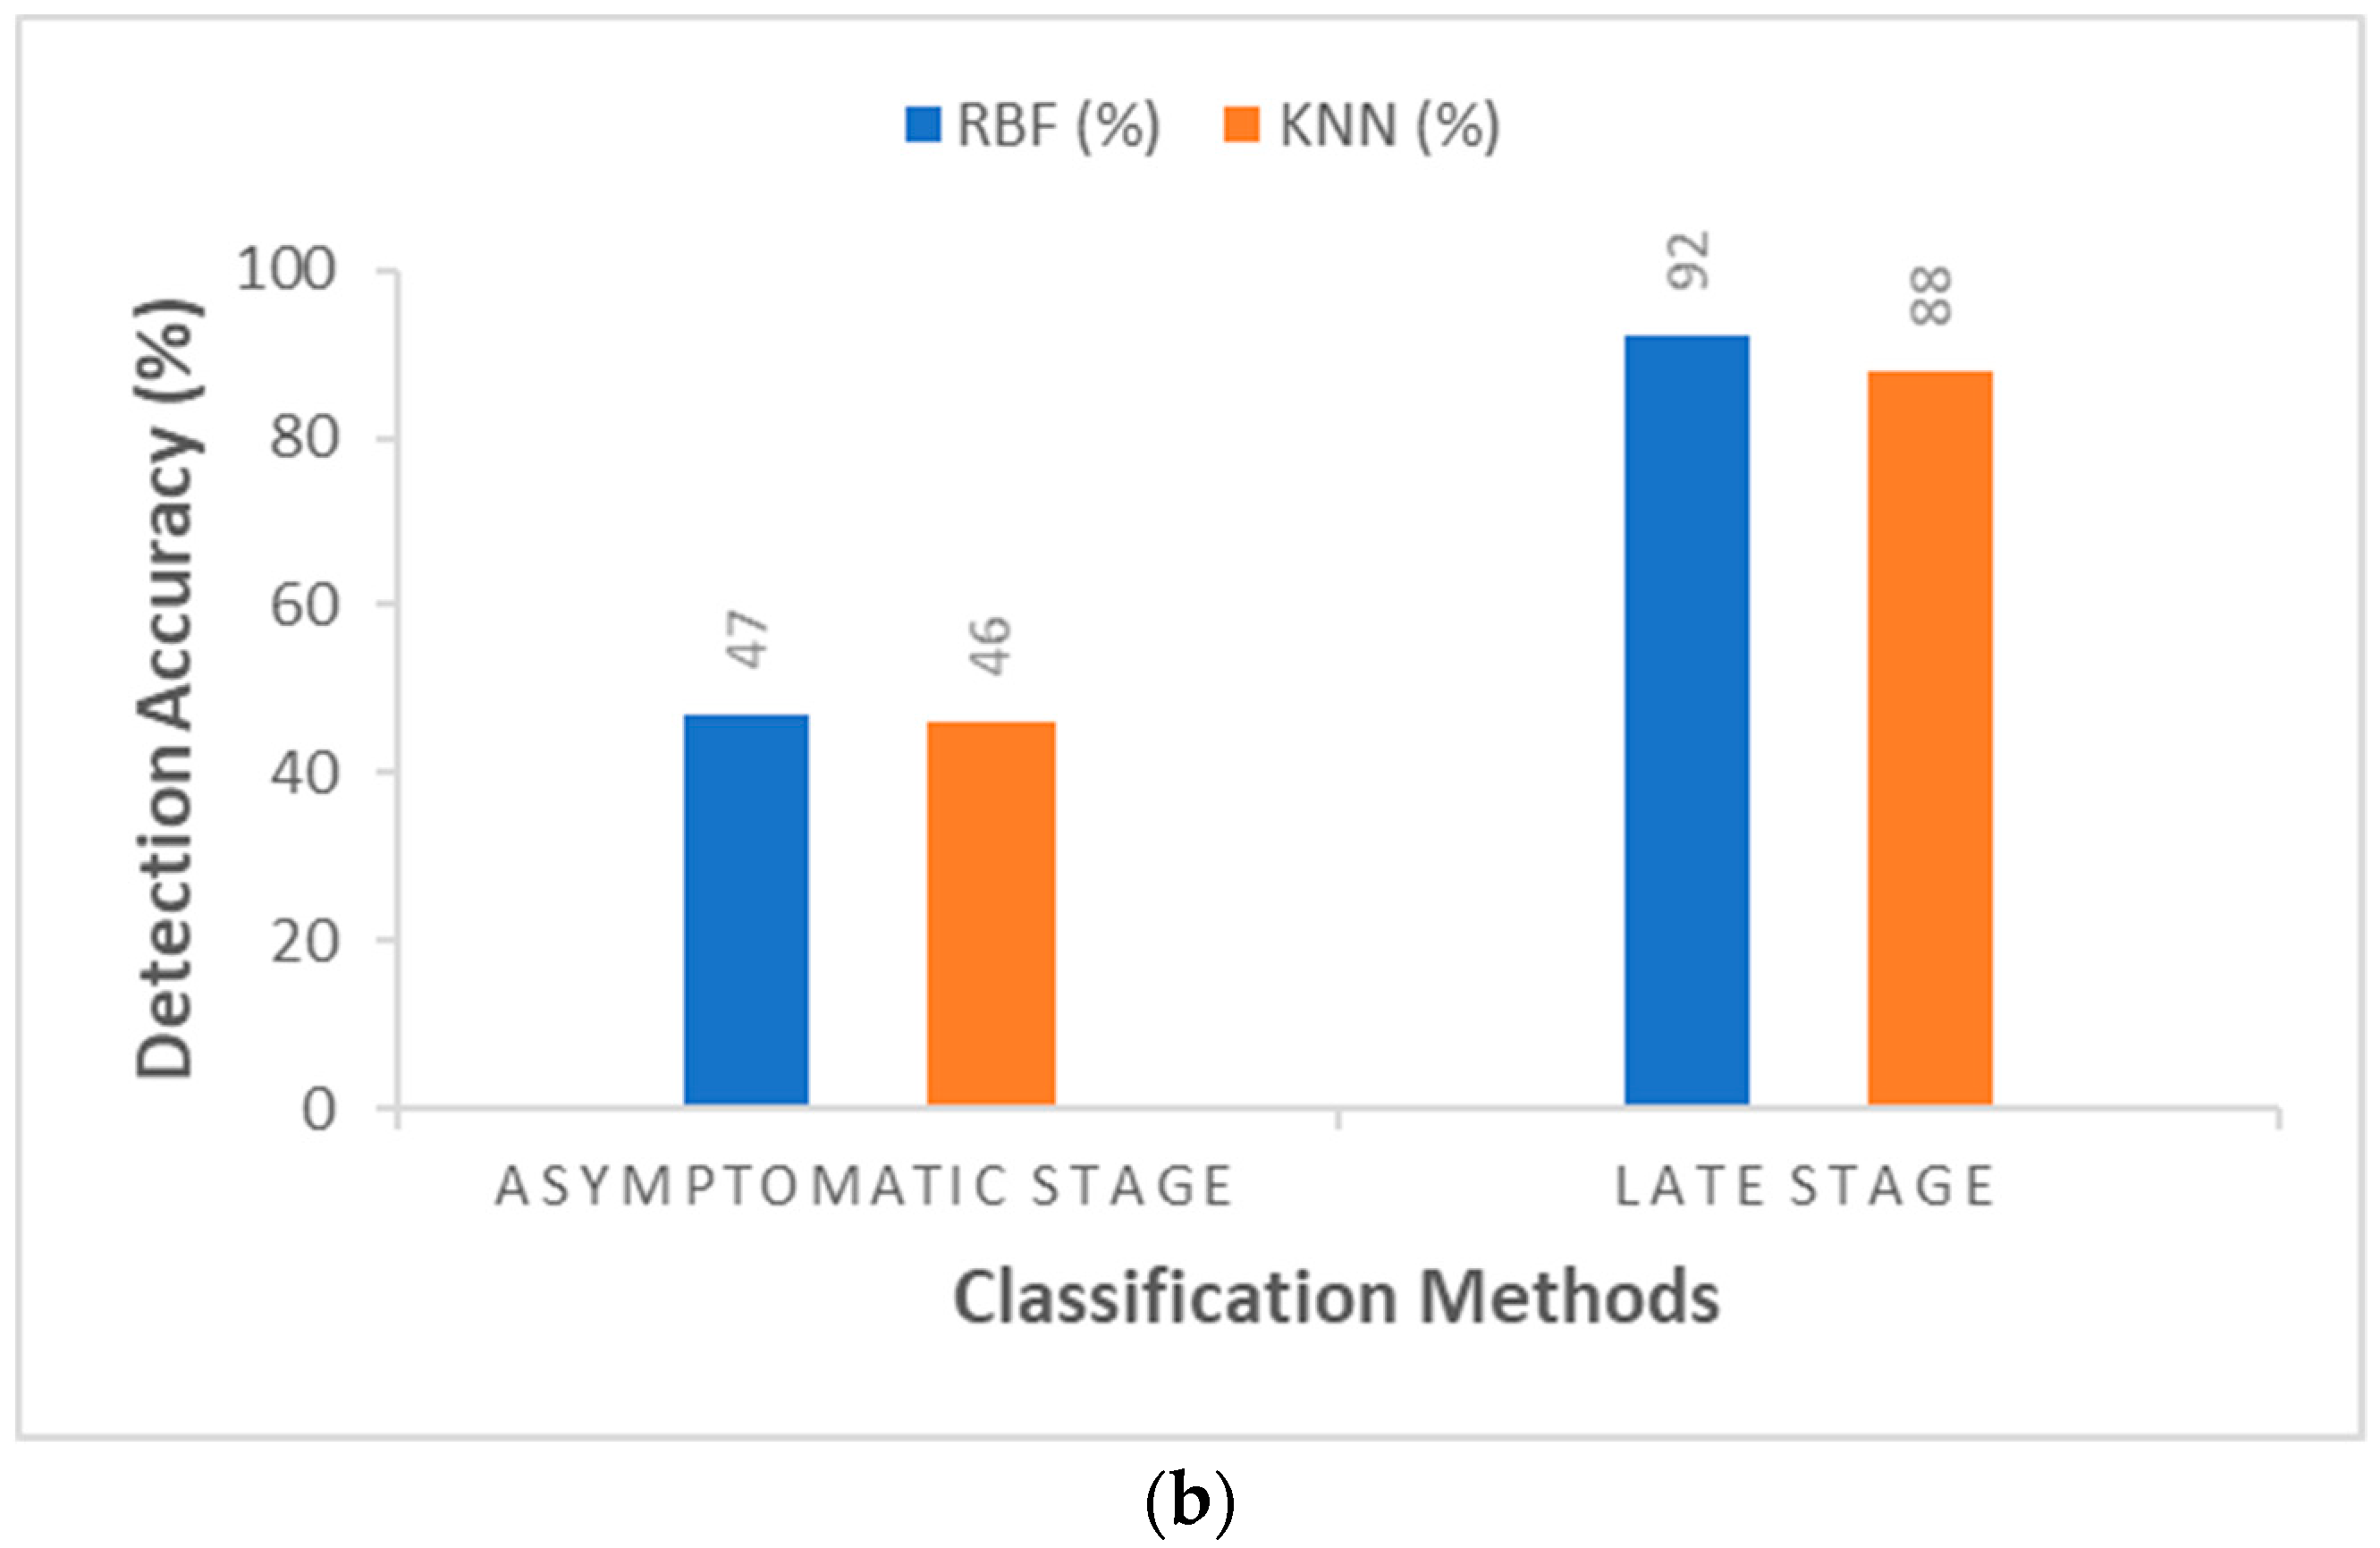
3.2. UAV-Based Imaging Technique (Outdoor)
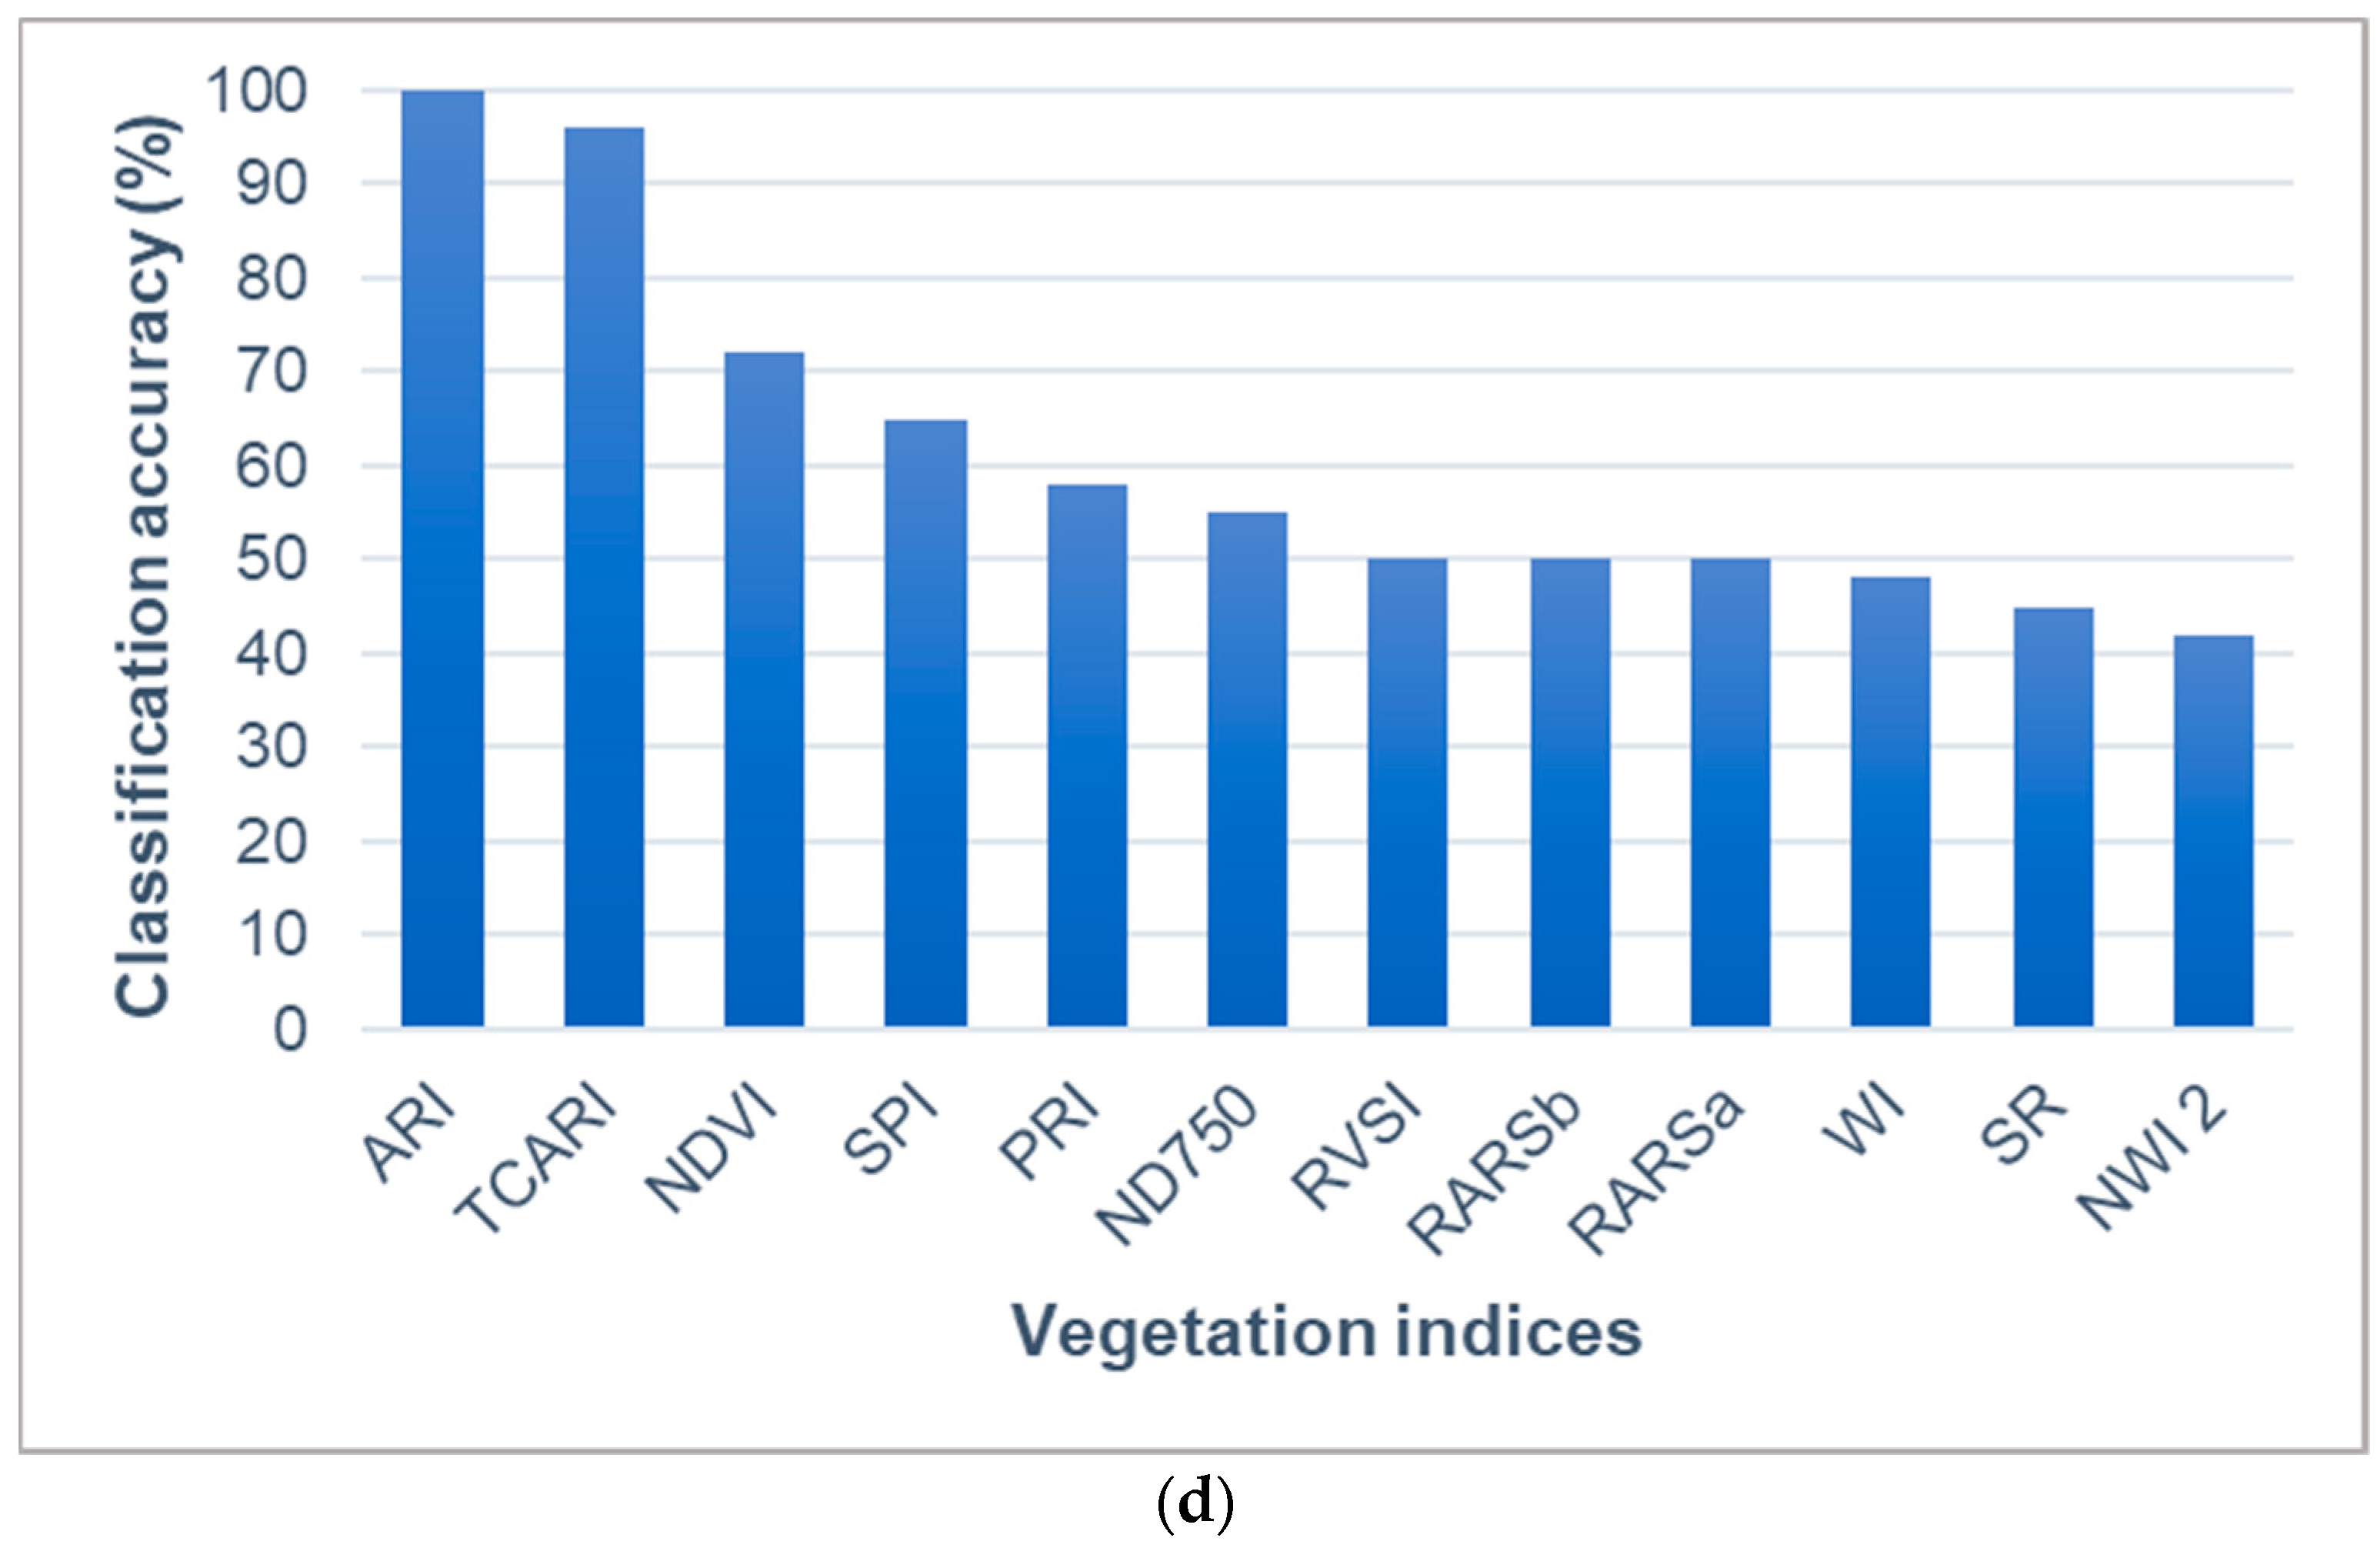
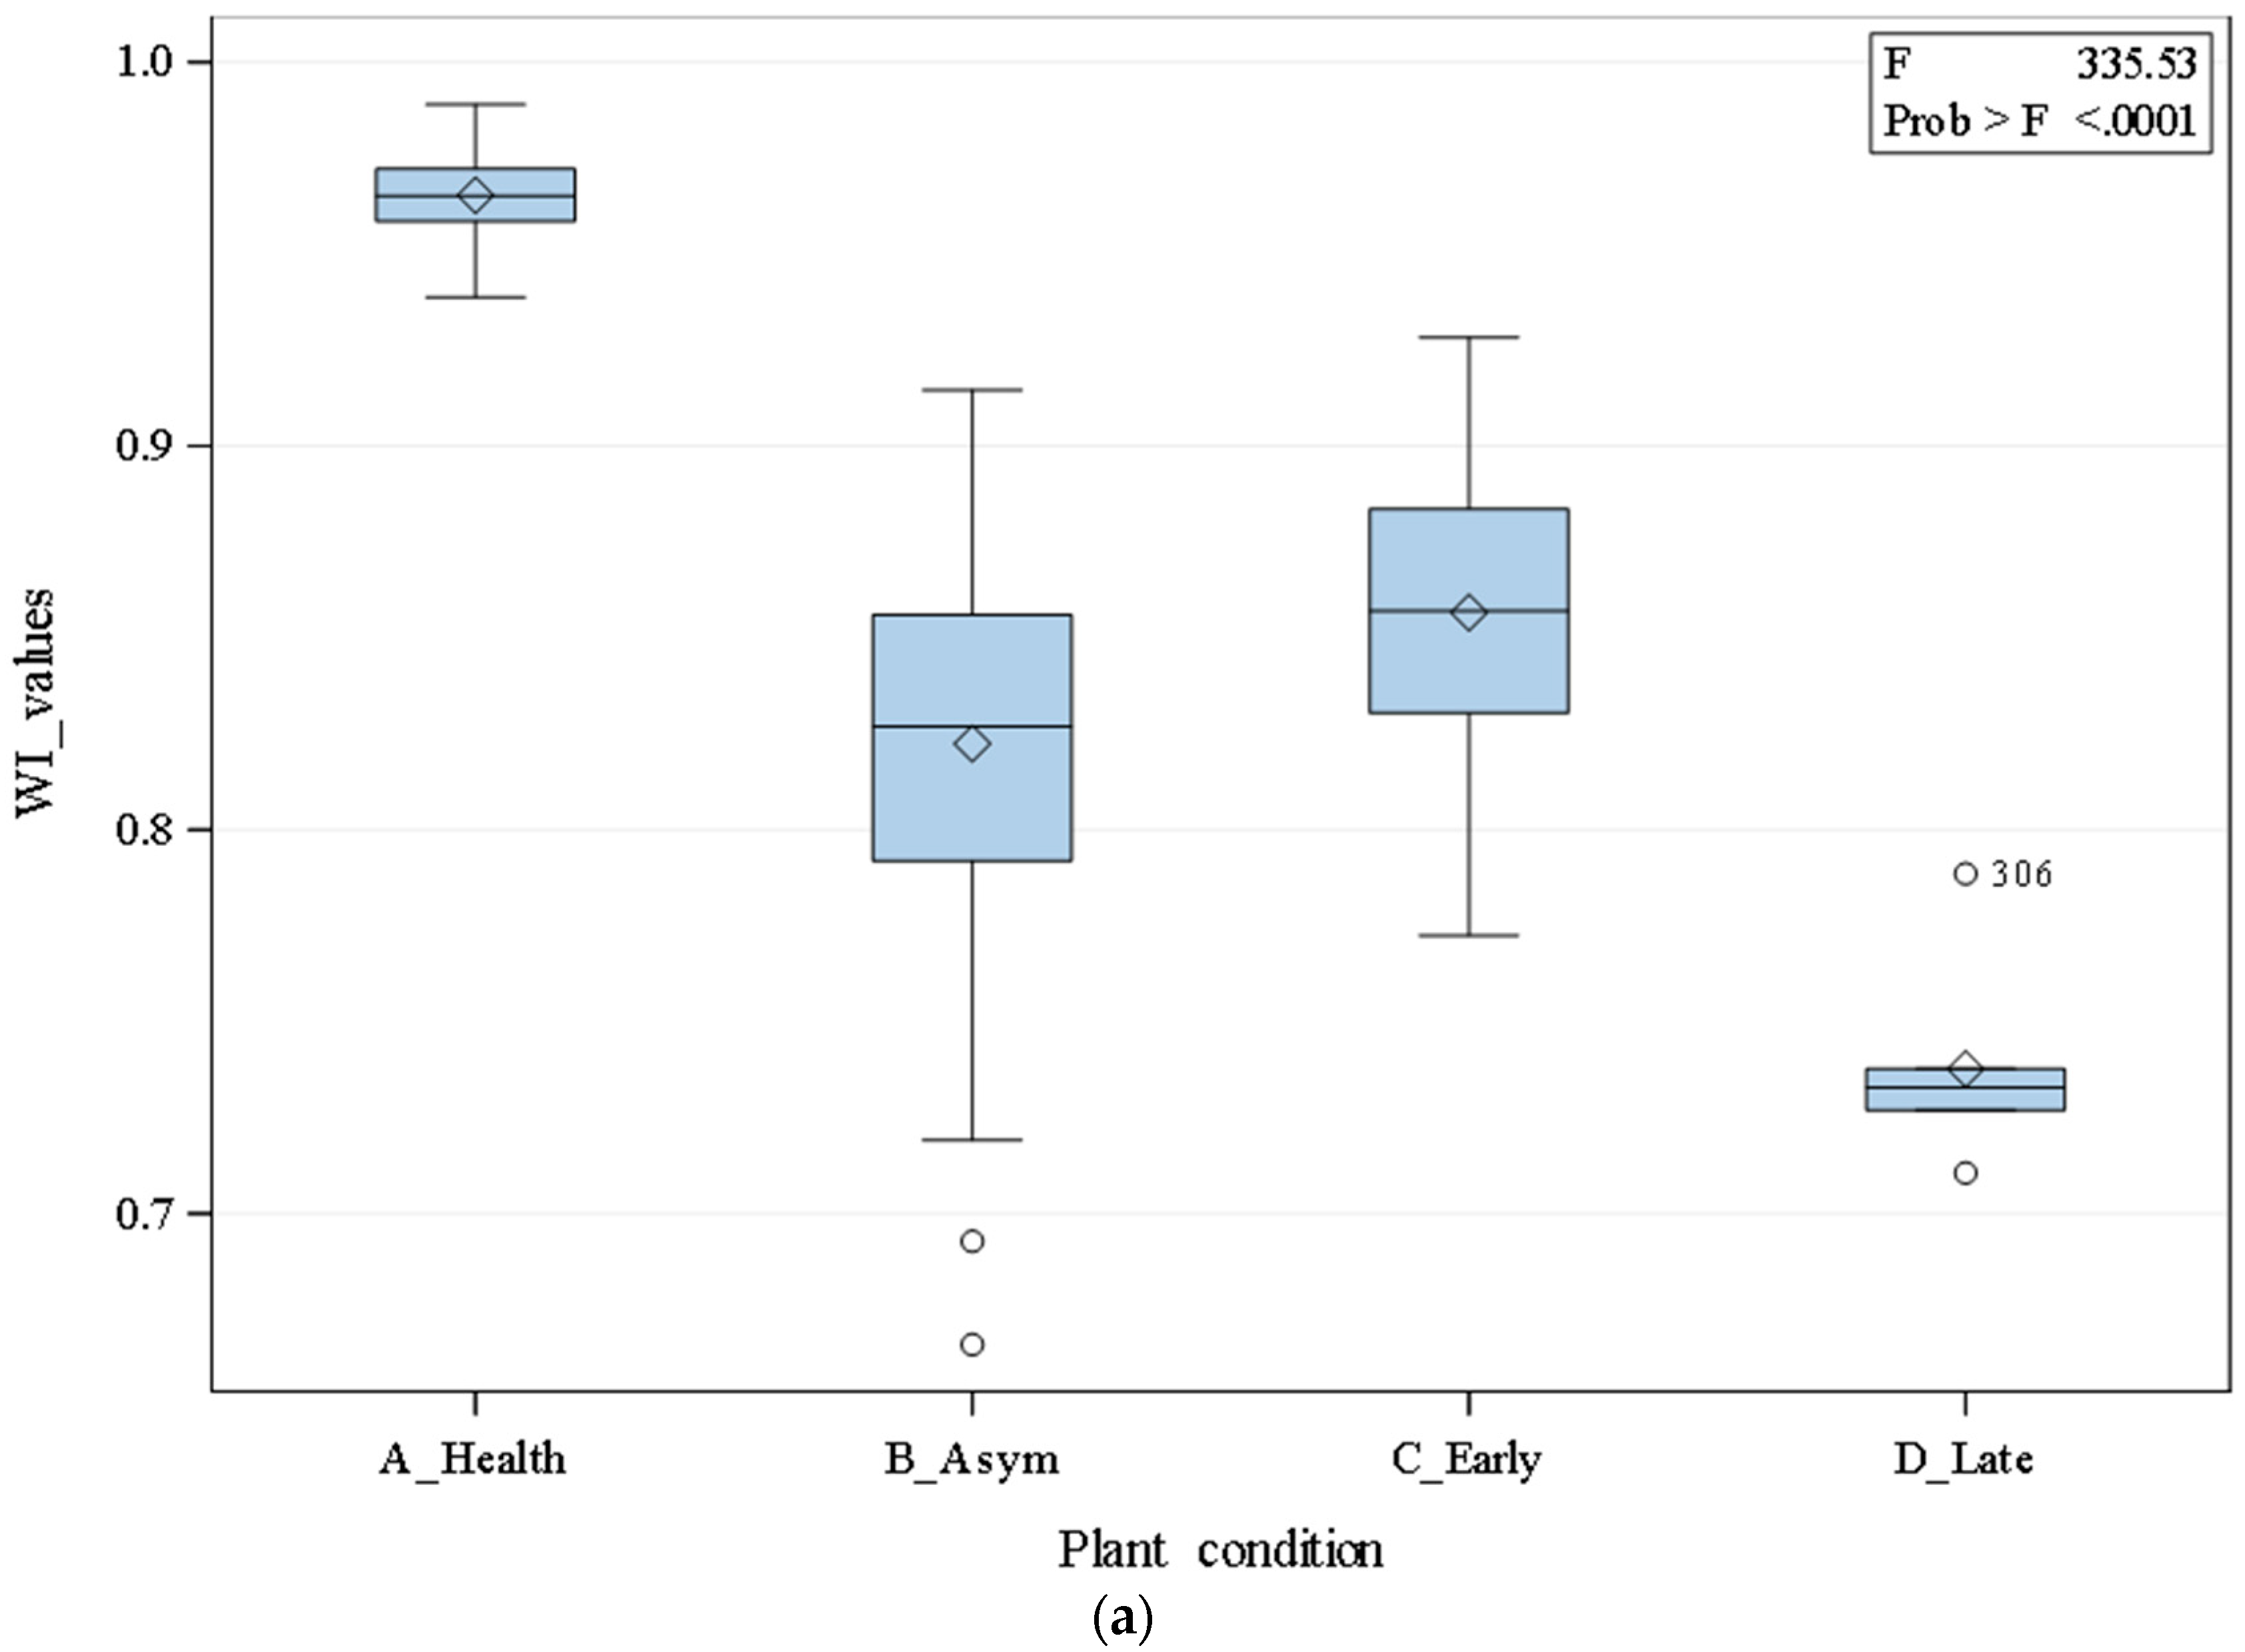
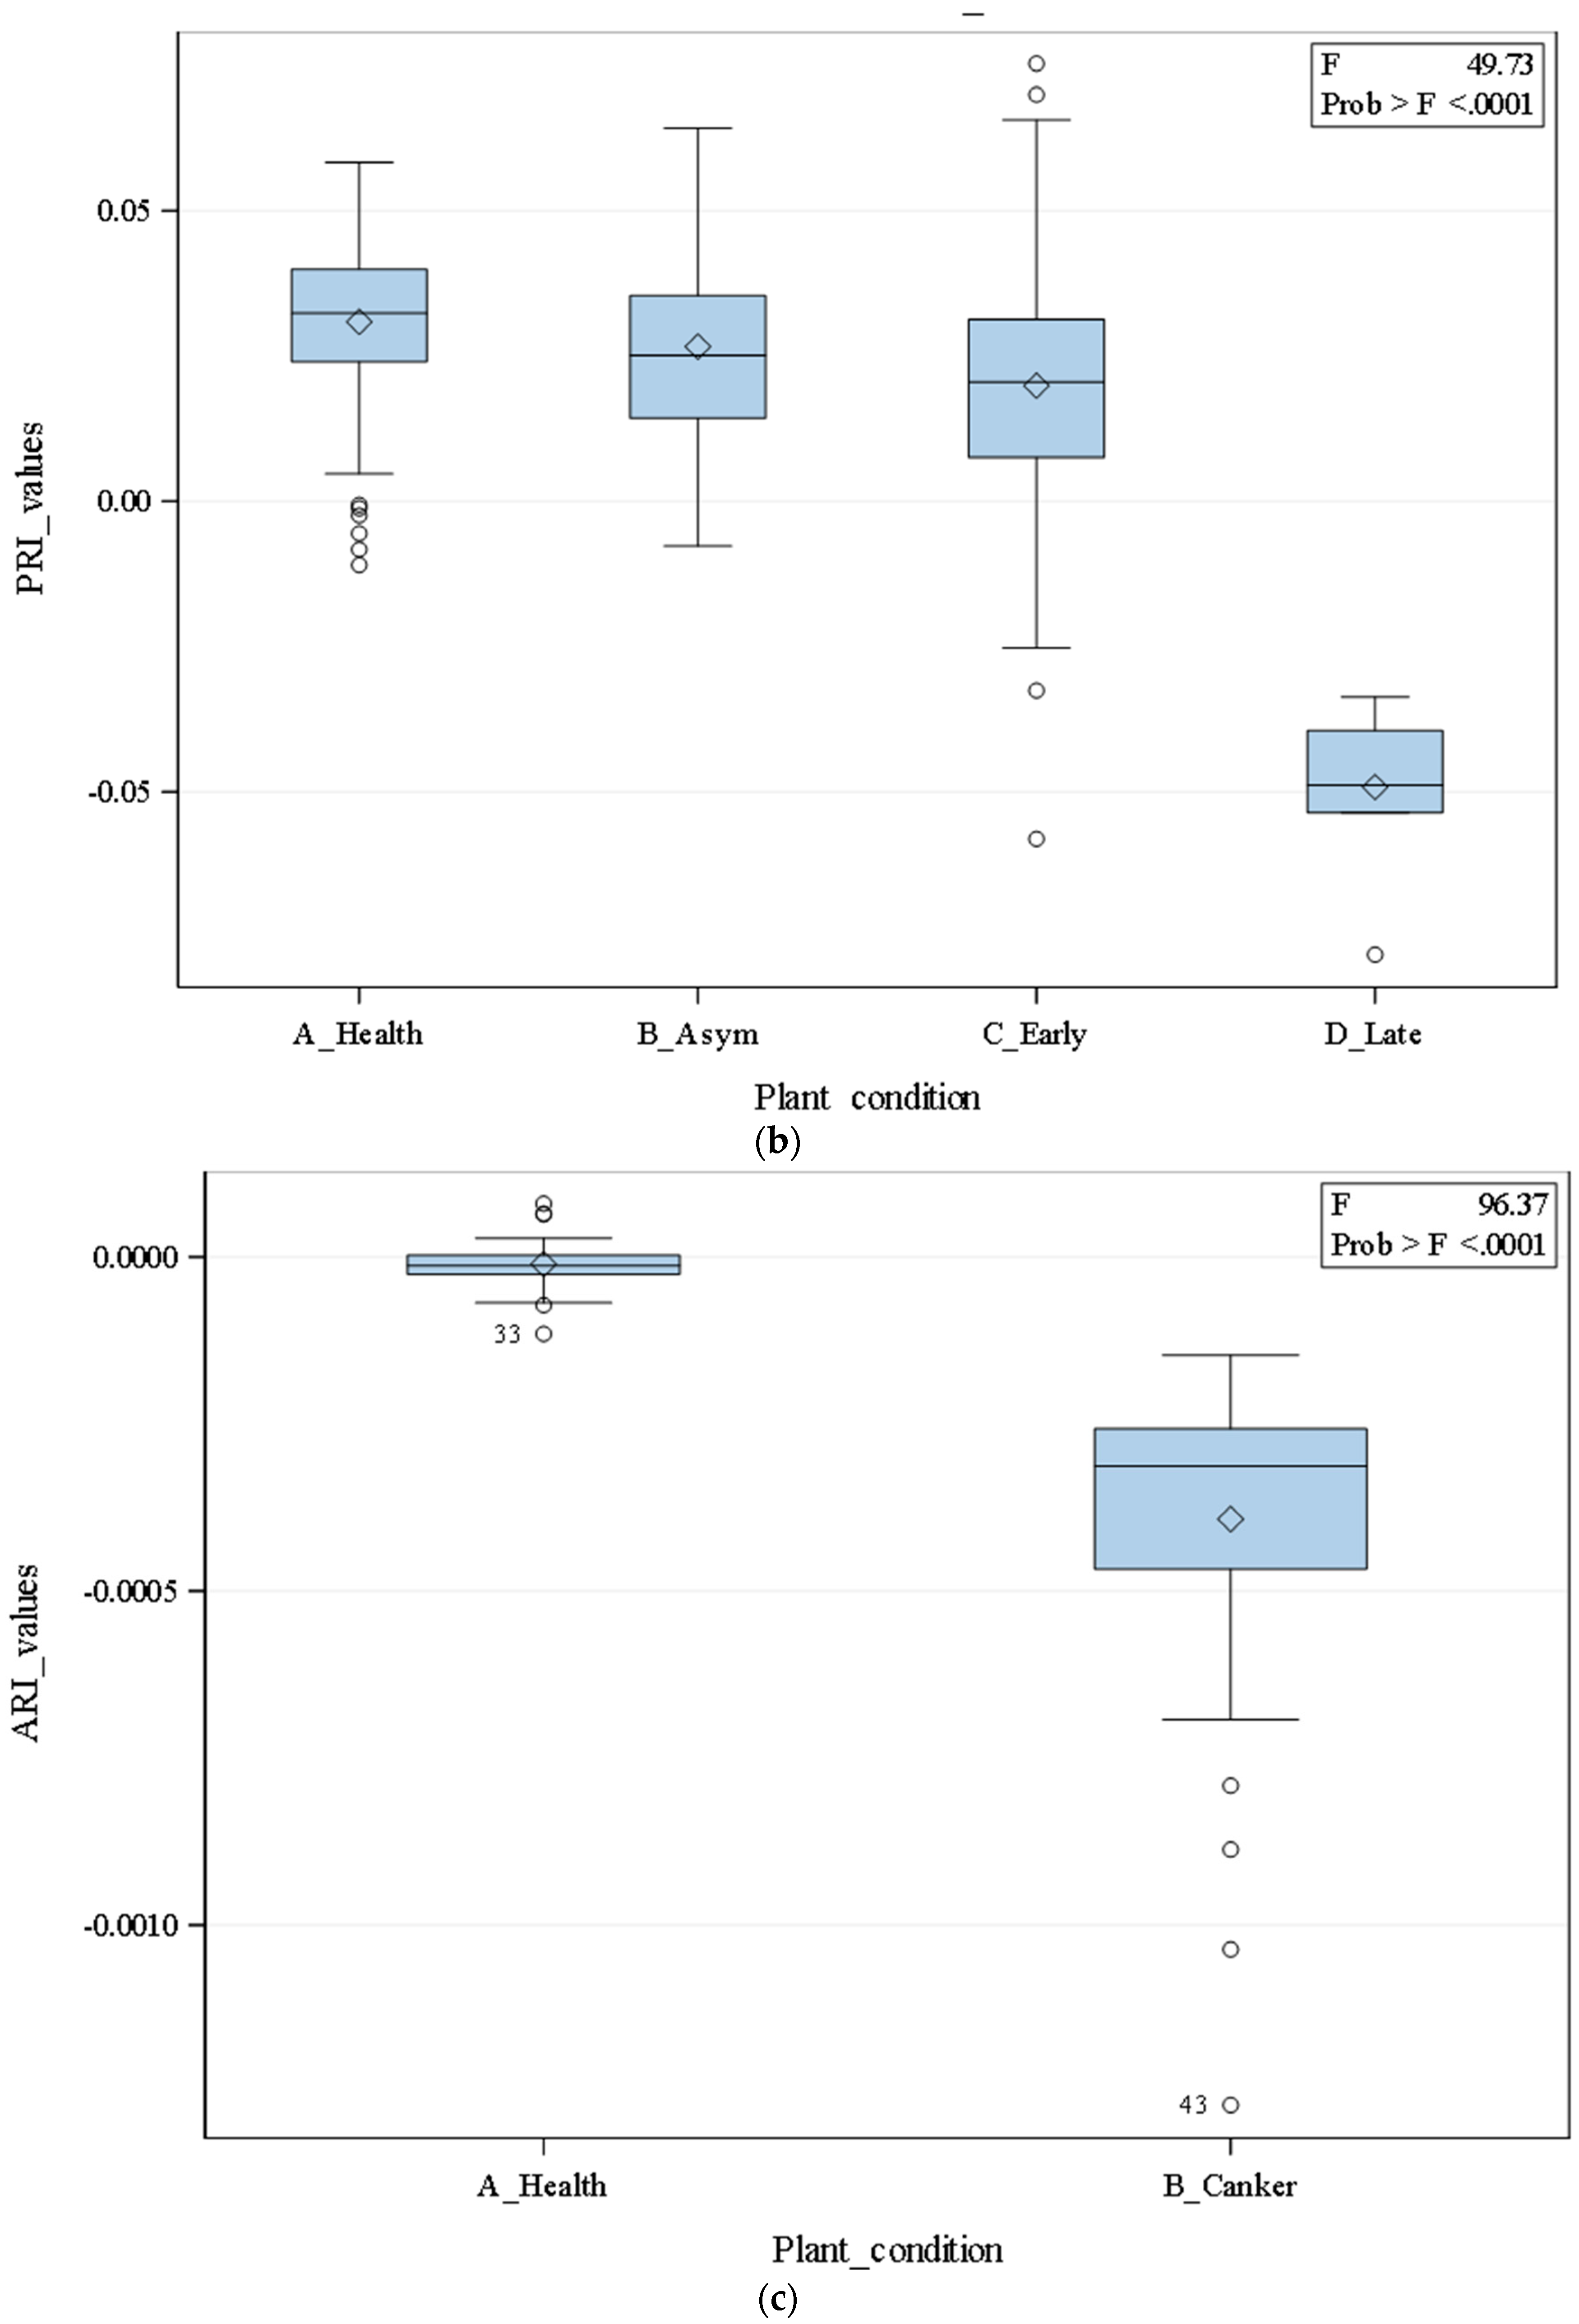
3.3. Vegetation Indices
4. Discussion
5. Conclusions
Author Contributions
Funding
Acknowledgments
Conflicts of Interest
References
- Bock, C.H.; Parker, P.E.; Gottwald, T.R. Effect of stimulated wind-driven rain on duration and distance of dispersal of Xanthomonas axonompodis pv. citri from canker-infected citrus trees. Plant Dis. 2005, 89, 71–80. [Google Scholar] [CrossRef] [PubMed]
- Hartung, J.S.; Daniel, J.F.; Pruvost, O.P. Detection of anthomonas-campestris pv. citri by the polymerase chain-reaction method. Appl. Environ. Microbiol. 1993, 59, 1143–1148. [Google Scholar] [PubMed]
- Duan, S.; Jia, H.G.; Pang, Z.Q.; Teper, D.; White, F.; Jones, J.; Zhou, C.Y.; Wang, N. Functional characterization of the citrus canker susceptibility gene CsLOB1. Mol. Plant Pathol. 2018, 19, 1908–1916. [Google Scholar] [CrossRef] [PubMed]
- Bock, C.H.; Graham, J.H.; Gottwald, T.R.; Cook, A.Z.; Parker, P.E. Wind speed and wind-associated leaf injury affect severity of citrus canker on Swingle citrumelo. Eur. J. Plant Pathol. 2010, 128, 21–38. [Google Scholar] [CrossRef]
- Gottwald, R.T.; Graham, H.J.; Schubert, T.S. Citrus canker: the pathogen and its impact. Online. Plant Health Progress. 2002. [Google Scholar] [CrossRef]
- Graham, H.J.; Gottwald, R.T.; Cubero, J.; Achor, D. Xanthomonas axonopodis pv. citri: Factors affecting successful eradication of citrus canker. Mol. Plant Pathol. 2004, 5, 1–5. [Google Scholar] [CrossRef]
- Park, D.S.; Hyun, J.W.; Park, Y.J.; Kim, J.S.; Kang, H.W.; Hahn, J.H.; Go, S.J. Sensitive and specific detection of Xanthomonas axonopodis pv. citri by PCR using pathovar specific primers based on hrpW gene sequences. Microbiol. Res. 2006, 161, 145–149. [Google Scholar] [CrossRef]
- Graham, J.H.; Leite, R.P. Lack of control of citrus canker by induced systemic resistance compounds. Plant Dis. 2004, 88, 745–750. [Google Scholar] [CrossRef]
- Partel, V.; Kakarla, C.; Ampatzidis, Y. Development and evaluation of a low-cost and smart technology for precision weed management utilizing artificial intelligence. Comput. Electron. Agric. 2019, 157, 339–350. [Google Scholar] [CrossRef]
- Partel, V.; Nunes, L.; Stansley, P.; Ampatzidis, Y. Automated vision-based system for monitoring Asian citrus psyllid in orchards utilizing artificial intelligence. Comput. Electron. Agric. 2019, 162, 328–336. [Google Scholar] [CrossRef]
- Ashourloo, D.; Aghighi, H.; Matkan, A.A.; Mobasheri, M.R.; Rad, A.M. An investigation into machine learning regression techniques for the leaf rust disease detection using hyperspectral measurement. IEEE J. Sel. Top. Appl. Earth Obs. Remote Sens. 2016, 9, 4344–4351. [Google Scholar] [CrossRef]
- Zhang, Y.; Lee, W.S.; Li, M.Z.; Zheng, L.H.; Ritenour, M.A. Non-destructive recognition and classification of citrus fruit blemishes based on ant colony optimized spectral information. Postharvest Biol. Technol. 2018, 143, 119–128. [Google Scholar] [CrossRef]
- Behmann, J.; Acebron, K.; Emin, D.; Bennertz, S.; Matsubara, S.; Thomas, S.; Bohnenkamp, D.; Kuska, M.T.; Jussila, J.; Salo, H.; et al. Specim IQ: Evaluation of a new, miniaturized handheld hyperspectral camera and its application for plant phenotyping and disease detection. Sensors 2018, 18, 441. [Google Scholar] [CrossRef]
- Abdulridha, J.; Ampatzidis, Y.; Ehsani, R.; de Castro, A.I. Evaluating the performance of spectral features and multivariate analysis tools to detect laurel wilt disease and nutritional deficiency in avocado. Comput. Electron. Agric. 2018, 155, 203–211. [Google Scholar] [CrossRef]
- Lu, J.Z.; Ehsani, R.; Shi, Y.Y.; Abdulridha, J.; de Castro, A.I.; Xu, Y.J. Field detection of anthracnose crown rot in strawberry using spectroscopy technology. Comput. Electron. Agric. 2017, 135, 289–299. [Google Scholar] [CrossRef]
- Maes, W.H.; Steppe, K. Perspectives for remote sensing with unmanned aerial vehicles in precision agriculture. Trends Plant Sci. 2019, 24, 152–164. [Google Scholar] [CrossRef]
- Ampatzidis, Y.; Partel, V. UAV-based high throughput phenotyping in citrus utilizing multispectral imaging and artificial intelligence. Remote Sens. 2019, 11, 410. [Google Scholar] [CrossRef]
- Zhang, J.; Virk, S.; Porter, W.; Kenworthy, K.; Sullivan, D.; Schwartz, B. Applications of unmanned aerial vehicle based imagery in turfgrass field trials. Front. Plant Sci. 2019, 10, 279. [Google Scholar] [CrossRef]
- Albetis, J.; Jacquin, A.; Goulard, M.; Poilve, H.; Rousseau, J.; Clenet, H.; Dedieu, G.; Duthoit, S. On the potentiality of UAV multispectral imagery to detect flavescence doree and grapevine trunk diseases. Remote Sens. 2019, 11, 23. [Google Scholar] [CrossRef]
- Albetis, J.; Duthoit, S.; Guttler, F.; Jacquin, A.; Goulard, M.; Poilve, H.; Feret, J.B.; Dedieu, G. Detection of flavescence doree grapevine disease using unmanned aerial vehicle (UAV) multispectral imagery. Remote Sens. 2017, 9, 308. [Google Scholar] [CrossRef]
- Kerkech, M.; Hafiane, A.; Canals, R. Deep leaning approach with colorimetric spaces and vegetation indices for vine diseases detection in UAV images. Comput. Electron. Agric. 2018, 155, 237–243. [Google Scholar] [CrossRef]
- Dash, J.P.; Pearse, G.D.; Watt, M.S. UAV multispectral imagery can complement satellite data for monitoring forest health. Remote Sens. 2018, 10, 1216. [Google Scholar] [CrossRef]
- Liu, Q.; Song, H.; Liu, G.; Huang, C.; Li, H. Evaluating the potential of multi-seasonal CBERS-04 imagery for mapping the quasi-circular vegetation patches in the Yellow River delta using random forest. Remote Sens. 2019, 11, 1216. [Google Scholar] [CrossRef]
- Qin, J.; Burks, T.F.; Ritenour, M.A.; Bonn, W.G. Detection of citrus canker using hyperspectral reflectance imaging with spectral information divergence. J. Food Eng. 2009, 93, 183–191. [Google Scholar] [CrossRef]
- Weng, H.Y.; Lv, J.W.; Cen, H.Y.; He, M.B.; Zeng, Y.B.; Hua, S.J.; Li, H.Y.; Meng, Y.Q.; Fang, H.; He, Y. Hyperspectral reflectance imaging combined with carbohydrate metabolism analysis for diagnosis of citrus Huanglongbing in different seasons and cultivars. Sens. Actuators B Chem. 2018, 275, 50–60. [Google Scholar] [CrossRef]
- Sharif, M.; Khan, M.A.; Iqbal, Z.; Azam, M.F.; Lali, M.I.U.; Javed, M.Y. Detection and classification of citrus diseases in agriculture based on optimized weighted segmentation and feature selection. Comput. Electron. Agric. 2018, 150, 220–234. [Google Scholar] [CrossRef]
- Zhang, B.H.; Liu, L.S.; Gu, B.X.; Zhou, J.; Huang, J.C.; Tian, G.Z. From hyperspectral imaging to multispectral imaging: Portability and stability of HIS-MIS algorithms for common defect detection. Postharvest Biol. Technol. 2018, 137, 95–105. [Google Scholar] [CrossRef]
- Sankaran, S.; Mishra, A.; Maja, J.M.; Ehsani, R. Visible-near infrared spectroscopy for detection of Huanglongbing in citrus orchards. Comput. Electron. Agric. 2011, 77, 127–134. [Google Scholar] [CrossRef]
- Mishra, A.R.; Karimi, D.; Ehsani, R.; Lee, W.S. Identification of citrus greening (HLB) using a VIS-NIR spectroscopy technique. Trans. ASABE 2012, 55, 711–720. [Google Scholar] [CrossRef]
- Sankaran, S.; Ehsani, R. Comparison of visible near infrared and mid-infrared spectroscopy for classification of Huanglongbing and citrus canker infected leaves. Agric. Eng. Int. CIGR J. 2013, 15, 75. [Google Scholar]
- Pourreza, A.; Lee, W.S.; Ritenour, M.A.; Roberts, P. Spectral characteristics of citrus black spot disease. Horttechnology 2016, 26, 254–260. [Google Scholar]
- Tanner, M.A.; Everett, C.L.; Youvan, D.C. Molecular phylogenetic evidence for noninvasive zoonotic transmission of Staphylococcus intermedius from a canine pet to a human. J. Clin. Microbiol. 2000, 38, 1628–1631. [Google Scholar] [PubMed]
- Penuelas, J.; Pinol, J.; Ogaya, R.; Filella, I. Estimation of plant water concentration by the reflectance water index WI (R900/R970). Int. J. Remote Sens. 1997, 18, 2869–2875. [Google Scholar] [CrossRef]
- Haboudane, D.; Miller, J.R.; Pattey, E.; Zarco-Tejada, P.J.; Strachan, I.B. Hyperspectral vegetation indices and novel algorithms for predicting green LAI of crop canopies: Modeling and validation in the context of precision agriculture. Remote Sens. Environ. 2004, 90, 337–352. [Google Scholar] [CrossRef]
- Jordan, C.F. Derivation of leaf area index from quality of light on the forest floor. Ecology 1969, 50, 663–666. [Google Scholar] [CrossRef]
- Gitelson, A.A.; Merzlyak, M.N. Signature analysis of leaf reflectance spectra: Algorithm development for remote sensing of chlorophyll. J. Plant Physiol. 1996, 148, 494–500. [Google Scholar] [CrossRef]
- Gamon, J.A.; Penuelas, J.; Field, C.B. A narrow-waveband spectral index that tracks diurnal changes in photosynthetic efficiency. Remote Sens. Environ. 1992, 41, 35–44. [Google Scholar] [CrossRef]
- Chappelle, E.W.; Kim, M.S.; McMurtrey, J.E. Ration analysis of reflectance spectra (RARS)—An algorithm for the remote estimation concentration of chlorophyll-a, chlorophyll-b, and carotenoid soybean leaves. Remote Sens. Environ. 1992, 39, 239–247. [Google Scholar] [CrossRef]
- Blackburn, G.A. Spectral indices for estimating photosynthetic pigment concentrations: A test using senescent tree leaves. Int. J. Remote Sens. 1998, 19, 657–675. [Google Scholar] [CrossRef]
- Raun, W.R.; Solie, J.B.; Johnson, G.V.; Stone, M.L.; Lukina, E.V.; Thomason, W.E.; Schepers, J.S. In-season prediction of potential grain yield in winter wheat using canopy reflectance. Agron. J. 2001, 93, 131–138. [Google Scholar] [CrossRef]
- Penuelas, J.; Baret, F.; Filella, I. Semiempirical indexes to assess carotenoids chlorophyll-a ratio from leaf spectral reflectance. Photosynthetica 1995, 31, 221–230. [Google Scholar]
- Penuelas, J.; Filella, I.; Biel, C.; Serrano, L.; Save, R. The reflectance at the 950–970 nm region as an indicator of plant water status. Int. J. Remote Sens. 1993, 14, 1887–1905. [Google Scholar] [CrossRef]
- Barnes, J.D.; Balaguer, L.; Manrique, E.; Elvira, S.; Davison, A.W. A reappraisal of the use of DMSO for the extraction and determination of chlorophylls-A and chlorophylls-B in lichens and higher-plants. Environ. Exp. Bot. 1992, 32, 85–100. [Google Scholar] [CrossRef]
- Penuelas, J.; Gamon, J.A.; Fredeen, A.L.; Merino, J.; Field, C.B. Reflectance indexes associated with physiological-changes in nitrogen-limited and water-limited sunflower leaves. Remote Sens. Environ. 1994, 48, 135–146. [Google Scholar] [CrossRef]
- Hunt, E.R., Jr.; Rock, B.N. Detection of changes in leaf water content using near- and middle-infrared reflectances. Remote Sens. Environ. 1989, 30, 43–54. [Google Scholar]
- Haboudane, D.; Miller, J.R.; Tremblay, N.; Zarco-Tejada, P.J.; Dextraze, L. Integrated narrow-band vegetation indices for prediction of crop chlorophyll content for application to precision agriculture. Remote Sens. Environ. 2002, 81, 416–426. [Google Scholar] [CrossRef]
- Gitelson, A.A.; Kaufman, Y.J.; Stark, R.; Rundquist, D. Novel algorithms for remote estimation of vegetation fraction. Remote Sens. Environ. 2002, 80, 76–87. [Google Scholar] [CrossRef] [Green Version]
- Merton, R. Monitoring Community Hysteresis Using Spectral Shift Analysis and the Red-Edge Vegetation Stress Index. In JPL Airborne Earth Science Workshop; NASA, Jet Propulsion Laboratory: Pasadena, CA, USA, 1998. [Google Scholar]
- Broge, N.H.; Leblanc, E. Comparing prediction power and stability of broadband and hyperspectral vegetation indices for estimation of green leaf area index and canopy chlorophyll density. Remote Sens. Environ. 2001, 76, 156–172. [Google Scholar] [CrossRef]
- Roujean, J.L.; Breon, F.M. Estimating par absorbed by vegetation from bidirectional reflectance measurements. Remote Sens. Environ. 1995, 51, 375–384. [Google Scholar] [CrossRef]
- Metternicht, G. Vegetation indices derived from high-resolution airborne videography for precision crop management. Int. J. Remote Sens. 2003, 24, 2855–2877. [Google Scholar] [CrossRef]
- Babar, M.A.; Reynolds, M.P.; Van Ginkel, M.; Klatt, A.R.; Raun, W.R.; Stone, M.L. Spectral reflectance to estimate genetic variation for in-season biomass, leaf chlorophyll, and canopy temperature in wheat. Crop Sci. 2006, 46, 1046–1057. [Google Scholar] [CrossRef]
- Bausch, W.C.; Duke, H.R. Remote sensing of plant nitrogen status in corn. Trans. ASAE 1996, 39, 1869–1875. [Google Scholar] [CrossRef]
- Gitelson, A.A.; Merzlyak, M.N.; Chivkunova, O.B. Optical properties and nondestructive estimation of anthocyanin content in plant leaves. Photochem. Photobiol. 2001, 74, 38–45. [Google Scholar] [CrossRef]
- Omrani, E.; Khoshnevisan, B.; Shamshirband, S.; Saboohi, H.; Anuar, N.B.; Nasir, M. Potential of radial basis function-based support vector regression for apple disease detection. Measurement 2014, 55, 512–519. [Google Scholar] [CrossRef]
- Singh, V.; Rao, S.M. Application of image processing and radial basis neural network techniques for ore sorting and ore classification. Miner. Eng. 2005, 18, 1412–1420. [Google Scholar] [CrossRef]
- Palmer, S.E. Parallel distributed-processing—Explorations in the microstructure of cognition. Contemp. Psychol. 1987, 32, 925–928. [Google Scholar] [CrossRef]
- Barros, A.C.A.; Cavalcanti, G.D.C. Combining global optimization algorithms with a simple adaptive distance for feature selection and weighting. In Proceedings of the IEEE International Joint Conference on Neural Networks (IJCNN 2008), Hong Kong, China, 1–8 June 2008. [Google Scholar]
- Abdullah, M.Z.; Guan, L.C.; Azemi, B. Stepwise discriminant analysis for colour grading of oil palm using machine vision system. Food Bioprod. Process. 2001, 79, 223–231. [Google Scholar] [CrossRef]
- Swartzla, E.E.; Fukunaga, K. Introduction to statistical pattern recognition. IEEE Trans. Syst. Man Cybern. 1974, MC 4, 238. [Google Scholar]
- Weinberger, K.Q.; Saul, L.K. Distance metric learning for large margin nearest neighbor classification. J. Mach. Learn. Res. 2009, 10, 207–244. [Google Scholar]
- Abdulridha, J.; Ehsani, R.; de Castro, A. Detection and differentiation between laurel wilt disease, phytophthora disease, and salinity damage using a hyperspectral sensing technique. Agriculture 2016, 6, 56. [Google Scholar] [CrossRef]
- Ampatzidis, Y.; De Bellis, L.; Luvisi, A. iPathology: Robotic applications and management of plants and plant diseases. Sustainability 2017, 9, 1010. [Google Scholar] [CrossRef]
- Luvisi, A.; Ampatzidis, Y.G.; De Bellis, L. Plant pathology and information technology: Opportunity for management of disease outbreak and applications in regulation frameworks. Sustainability 2016, 8, 831. [Google Scholar] [CrossRef]
- Sims, D.A.; Gamon, J.A. Relationships between leaf pigment content and spectral reflectance across a wide range of species, leaf structures and developmental stages. Remote Sens. Environ. 2002, 81, 337–354. [Google Scholar] [CrossRef]
- Daughtry, C.S.T.; Walthall, C.L.; Kim, M.S.; de Colstoun, E.B.; McMurtrey, J.E. Estimating corn leaf chlorophyll concentration from leaf and canopy reflectance. Remote Sens. Environ. 2000, 74, 229–239. [Google Scholar] [CrossRef]
- Lowe, A.; Harrison, N.; French, A.P. Hyperspectral image analysis techniques for the detection and classification of the early onset of plant disease and stress. Plant Methods 2017, 13, 80. [Google Scholar] [CrossRef]
- Sonobe, R.; Sano, T.; Horie, H. Using spectral reflectance to estimate leaf chlorophyll content of tea with shading treatments. Biosyst. Eng. 2018, 175, 168–182. [Google Scholar] [CrossRef]
- Frels, K.; Guttieri, M.; Joyce, B.; Leavitt, B.; Baenziger, P.S. Evaluating canopy spectral reflectance vegetation indices to estimate nitrogen use traits in hard winter wheat. Field Crop. Res. 2018, 217, 82–92. [Google Scholar] [CrossRef]
- Patil, J.K.; Kumer, R. Advances in image processing for detection of plant diseases. Adv. Bioinf. Appl. Res. 2011, 12, 135–141. [Google Scholar]
- Garcia-Ruiz, F.; Sankaran, S.; Maja, J.M.; Lee, W.S.; Rasmussen, J.; Ehsani, R. Comparison of two aerial imaging platforms for identification of Huanglongbing-infected citrus trees. Comput. Electron. Agric. 2013, 91, 106–115. [Google Scholar] [CrossRef]
- Abdulridha, J.; Ehsani, R.; Abd-Elrahma, A.; Ampatzidis, Y. A remote sensing technique for detecting laurel wilt disease in avocado in presence of other biotic and abiotic stresses. Comput. Electron. Agric. 2019, 156, 549–557. [Google Scholar] [CrossRef]
- Hansen, P.M.; Schjoerring, J.K. Reflectance measurement of canopy biomass and nitrogen status in wheat crops using normalized difference vegetation indices and partial least squares regression. Remote Sens. Environ. 2003, 86, 542–553. [Google Scholar] [CrossRef]
- Rodriguez-Caballero, E.; Knerr, T.; Weber, B. Importance of biocrusts in dryland monitoring using spectral indices. Remote Sens. Environ. 2015, 170, 32–39. [Google Scholar] [CrossRef]
- Asaari, M.S.M.; Mishra, P.; Mertens, S.; Dhondt, S.; Inze, D.; Wuyts, N.; Scheunders, P. Close-range hyperspectral image analysis for the early detection of stress responses in individual plants in a high-throughput phenotyping platform. ISPRS J. Photogramm. Remote Sens. 2018, 138, 121–138. [Google Scholar] [CrossRef]
- Sandmann, M.; Grosch, R.; Graefe, J. The use of features from fluorescence, thermography, and NDVI imaging to detect biotic stress in lettuce. Plant. Dis. 2018, 102, 1101–1107. [Google Scholar] [CrossRef]


| Category | Number of Leaves | The Symptoms of Leaves |
|---|---|---|
| Healthy leaves (from the greenhouse) | 40 | No symptoms |
| Asymptomatic stage of canker disease | 40 | No symptoms with a yellow halo. |
| Early stage of canker disease | 40 | Tiny lesion |
| Late stage of canker disease | 40 | Large dark and brown lesion |
| Vegetation Indexes | Equation | References |
|---|---|---|
| Water Index (WI) | Penuelas et al. [33] | |
| Modified Chlorophyll Absorption in Reflectance Index (mCARI 1) | mCARI 1 = 1.2[(2.5*R − R) − 1.3(R − R)] | Haboudane et al. [34] |
| Modified Triangular Vegetation Index1 (MTVI 1) | MTVI 1 = 1.2[1.2(1.2(R761 − R581) − 2.5(R651 − R581)] | Haboudane et al. [34] |
| Modified Triangular Vegetation Index2 ) | Haboudane et al. [34] | |
| Simple Ratio Index (SR 900) | Jordan [35] | |
| Simple Ratio Index (SR 850) | Jordan [35] | |
| Green NDVI (GNDVI) | Gitelson and Merzlyak [36] | |
| Photochemical Reflectance Index (PRI) | Gamon et al. [37] | |
| Ratio Analysis of reflectance Spectral Chlorophyll a (RARSa) | Chappelle et al. [38] | |
| Ratio Analysis of reflectance Spectral Chlorophyll b (RARSb) | Chappelle et al. [38] | |
| Ratio analysis of reflectance spectra (RARSc) | Chappelle et al. [38] | |
| Pigment specific simple ratio (PSSRa) | Blackburn [39] | |
| Normalized difference vegetation index 780 (NDVI 780) | Raun et al. [40] | |
| Structure Insensitive Pigment Index (SIPI) | Penuelas et al. [41] | |
| Normalized chlorophyll pigment ratio index (NCPI) | Penuelas et al. [42] | |
| Normalized phaeophytinization index (NPQI) | Barnes et al. [43] | |
| Plant Senescence Reflectance Index (PSRI) | Penuelas et al. [44] | |
| The ratio of WI and ND (WI/ND) | Hunt et al. [45] | |
| Transform chlorophyll absorption in reflectance index (TCARI) | TCARI = 3[(R740 − R651) − 0.2(R740 − R581)(R740/R651)] | Haboudane et al. [46] |
| Green Vegetation (VIGreen) | Gitelson et al. [47] | |
| Red-Edge Vegetation Stress Index 1 (RVS 1) | Merton [48] | |
| Red-Edge Vegetation Stress Index 2 (RVS 2) | Merton [48] | |
| Triangle Vegetation Index (TVI) | TVI = 0.5[120*(R761 − R581) − 200(R651 − R581)] | Broge [49] |
| Renormalized Difference Vegetation Index (RDVI) | Roujean et al. [50] | |
| Normalized difference vegetation index 850 (NDVI 850) | Raun et al. [40] | |
| Simple Ratio Index (SR 761) | Jordan [35] | |
| Normalized difference vegetation index 761 (NDV 761) | Raun [40] | |
| Plant Pigment ratio (PPR) | Metternicht [51] | |
| Water Stress and Canopy Temperature (NWI 2) | Babar et al. [52] | |
| Nitrogen Reflectance Index (NRI) | Bausch and Duke [53] | |
| Anthocyanin Reflectance Index (ARI) | Gitelson [54] |
© 2019 by the authors. Licensee MDPI, Basel, Switzerland. This article is an open access article distributed under the terms and conditions of the Creative Commons Attribution (CC BY) license (http://creativecommons.org/licenses/by/4.0/).
Share and Cite
Abdulridha, J.; Batuman, O.; Ampatzidis, Y. UAV-Based Remote Sensing Technique to Detect Citrus Canker Disease Utilizing Hyperspectral Imaging and Machine Learning. Remote Sens. 2019, 11, 1373. https://0-doi-org.brum.beds.ac.uk/10.3390/rs11111373
Abdulridha J, Batuman O, Ampatzidis Y. UAV-Based Remote Sensing Technique to Detect Citrus Canker Disease Utilizing Hyperspectral Imaging and Machine Learning. Remote Sensing. 2019; 11(11):1373. https://0-doi-org.brum.beds.ac.uk/10.3390/rs11111373
Chicago/Turabian StyleAbdulridha, Jaafar, Ozgur Batuman, and Yiannis Ampatzidis. 2019. "UAV-Based Remote Sensing Technique to Detect Citrus Canker Disease Utilizing Hyperspectral Imaging and Machine Learning" Remote Sensing 11, no. 11: 1373. https://0-doi-org.brum.beds.ac.uk/10.3390/rs11111373