Unmanned Aerial Vehicle for Remote Sensing Applications—A Review


1
School of Educational Information Technology, Central China Normal University, Wuhan 430079, China
2
Department of Civil, Environmental and Geodetic Engineering, The Ohio State University (OSU), Columbus, OH 43210, USA
3
Department of Electrical and Computer Engineering, The Ohio State University (OSU), Columbus, OH 43210, USA
*
Author to whom correspondence should be addressed.
Remote Sens. 2019, 11(12), 1443; https://0-doi-org.brum.beds.ac.uk/10.3390/rs11121443
Submission received: 5 May 2019
/
Revised: 9 June 2019
/
Accepted: 16 June 2019
/
Published: 18 June 2019
(This article belongs to the Special Issue Trends in UAV Remote Sensing Applications)
Abstract
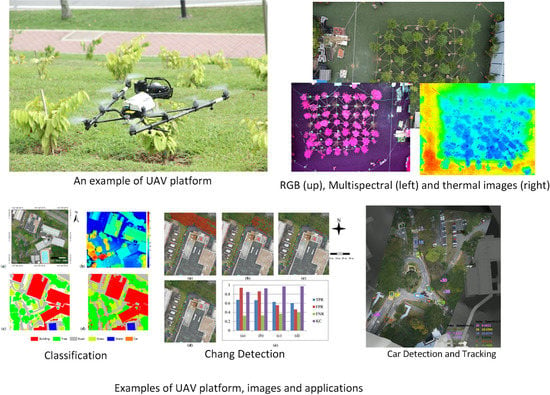
:The unmanned aerial vehicle (UAV) sensors and platforms nowadays are being used in almost every application (e.g., agriculture, forestry, and mining) that needs observed information from the top or oblique views. While they intend to be a general remote sensing (RS) tool, the relevant RS data processing and analysis methods are still largely ad-hoc to applications. Although the obvious advantages of UAV data are their high spatial resolution and flexibility in acquisition and sensor integration, there is in general a lack of systematic analysis on how these characteristics alter solutions for typical RS tasks such as land-cover classification, change detection, and thematic mapping. For instance, the ultra-high-resolution data (less than 10 cm of Ground Sampling Distance (GSD)) bring more unwanted classes of objects (e.g., pedestrian and cars) in land-cover classification; the often available 3D data generated from photogrammetric images call for more advanced techniques for geometric and spectral analysis. In this paper, we perform a critical review on RS tasks that involve UAV data and their derived products as their main sources including raw perspective images, digital surface models, and orthophotos. In particular, we focus on solutions that address the “new” aspects of the UAV data including (1) ultra-high resolution; (2) availability of coherent geometric and spectral data; and (3) capability of simultaneously using multi-sensor data for fusion. Based on these solutions, we provide a brief summary of existing examples of UAV-based RS in agricultural, environmental, urban, and hazards assessment applications, etc., and by discussing their practical potentials, we share our views in their future research directions and draw conclusive remarks.
1. Introduction
Unmanned aerial vehicle (UAV) applications have become an ever-expanding area in remote sensing (RS) in recent years, driven by their both academic and commercial successes [1]. However, these practices are highly disparate even for the same or similar application, primarily due to the fact that data acquisition and sensors to be used are featured to be more flexible than traditional ways. These practices are often developed through a learn-by-doing process, and there exist a few papers that review current works of domain-specific urban and environmental applications [2,3,4], as well as methodologies (e.g., feature extraction and classification for specific objects) [4,5,6]. Although these can be valuable in their respective fields, there is in general a lack of systematic analysis on how these characteristics alter solutions for typical RS tasks such as land-cover classification, change detection, and thematic mapping etc. Thus, this raises challenges in identifying common practices and feasibilities of UAV to be used for specific tasks, as well as ways of benchmarking these for researchers in community. We found that in many cases, end-users simply adopt the same methods used for traditional RS sources with lower resolution, while not considering the unique characteristics of UAV-based images. For instance, most of the existing methods for RS image classification normally focus on extracting 2D (2 dimensional) image features, while when classifying UAV-based image products, the often available digital surface model (DSM) can be integrated and consistently improve the classification accuracy [7]. Furthermore, the development of UAV platforms and various sensors has motivated RS applications such as object detection and real-time tracking at finer scales [8,9], where advanced data analysis techniques developed in computer vision and machine learning elevate the ability of automated UAV data analysis. In this review, we present a comprehensive discussion on UAV data analysis methods for UAVs RS applications based on the challenges and potentials brought by the “new” aspects of the UAVs data, being (1) ultra-high resolution (UHR); (2) high availability of geometric and spectral data; and (3) integrated multi-sensor data fusion. Specially, the RS aspect of this review focuses on the use of UAV-derived product, including the raw imageries, photogrammetrically derived DSMs, and orthophotos for object interpretation, scene analysis, and change detection. For reviews of the photogrammetric processing and hardware development, the readers may refer to Reference [10].
UAVs are generally categorized based on several related key attributes, including weight, flying altitude, payload, endurance, and range [11,12]. A typical classification instance provides 5 different groups of UAVs according to their maximum gross takeoff weight (MGTW) and normal operating altitude and airspeed [13]. Since we would like to present an overview of the new methods and civil RS applications brought by several distinct characteristics (e.g., low cost, flexibility, and customization) of UAVs, this paper will primarily focus on small UAVs (0–20 lbs, <1200 ft, <100 knots).
Due to the low flying altitude, UAVs can easily acquire very detailed information of observed objects with a spatial resolution under one decimeter (UHR), which allows for accurate geometrical and semantic analysis for a reasonably broader area than a single site, while the increased resolution may not always bring the same level of improvement in terms of data interpretation: details of the objects may increase the within-class texture complexities that often lead to classification errors [14]. Moreover, when the sizes of objects in the scene vary significantly, multi-scale approaches [15] should be used in order to reduce unnecessary computation, especially for UHR imageries, and selecting a set of appropriate scales can be particularly challenging [7].
UAV aided by Global Positioning System/inertial measurement unit (GPS/IMU) and autopilot systems are able to very easily capture photogrammetric image blocks, and a UAV data acquisition mission very often refers to taking either full motion videos or high-resolution photogrammetric images. With advanced photogrammetric processing pipelines [16,17], 3D (3 dimensional) geometric information such as triangular meshes and DSMs are nowadays becoming standard products for UAV-based RS missions. Given that these ready-to-fly UAV platforms are much more flexible than traditional platforms, the access to orthophoto and DSM products from UAV flight missions can be seamless [18]. In addition, associated light-weight/low-cost sensors such as multispectral and hyperspectral cameras are becoming more available, which has brought new opportunities for UAVs to attempt multi-source data fusion solutions with much higher spatial resolution. While such data fusion is traditionally cost-prohibitive in other platforms [18,19], these benefits also demand more advanced co-registration algorithms dealing with sensor integration and calibration, as well as the efforts for implementing new/specific camera models for low-cost sensor data (i.e., linear-array hyperspectral cameras and rolling shutters), which may not be readily accessible.
As a means of RS data collection, UAV data and its derived products feature sounding promises to serve typical RS data analysis practices, of which two techniques/applications are mostly commonly used in the RS community: (1) land cover/image classification or object detection; and (2) change detection. At a first glance, these applications can be intuitively inherited by applying existing techniques, while we argue that if the UAV data would be under-utilized, because the ultra-high spatial/temporal resolution, as well as the accessible geometric data associated with it (multi-modal data), creates much more opportunities and solutions, algorithms and techniques that are particularly suitable for such data are worth reconsideration. This review tends to provide a specific summary on the algorithmic and application aspects of RS data processing particularly related to UAV data by analyzing past literature and extrapolating potential trends and issues to be considered under general frameworks. Our contribution is providing a stage update to colleagues in the community to indicate where potential resources are, as well as the branched issues and essences when processing UAV data as an RS resource, rather than explicit scientific discoveries. In general, we hypothesize the geometric aspects of the standard photogrammetric processing for the UAV-based RS products are well handled, such as bundle adjustment, DSMs and orthophotos, and co-registration (an excellent review describing how standardized such procedures are can be found in Reference [18]). Therefore, the review might cover the geometric aspects only when necessary. The rest of the review is organized as follows: Section 2 generally introduces the recent development of sensors that fuels the diverse data sources. In Section 3, we present the state-of-the-art UAVs remotely sensed data analysis techniques and practices related to (1) land use/land cover (LULC) classification and (2) change detection, as well as discussing potential improvements and algorithmic aspects to be considered for the high-spatial/temporal-resolution and multi-modal UAV data. Note here we consider object detection taking a similar framework (often learning-based) as image classification, and thus we take image classification as the primary category for review. In Section 4, we turn our discussion to the current status of UAVs RS applications by demonstrating the potential efforts in utilizing UAV-based RS data for tasks traditionally refraining aerial/satellite RS data. Section 5 summarizes this review and provides recommendations to inform future research works.
2. Overview of UAV Sensors
UAV datasets are mostly understood as drones with RGB cameras, it is worth noting that there exists a wide range of sensor options when considering professional applications. Many existing (and expensive) RS instruments for aerial and satellite platforms are now embracing their miniature and low-cost versions for UAV platforms, such as multispectral, hyperspectral, short/mid-wave range cameras (e.g., thermal) and light-weight LiDAR (light detection and ranging). Knowing the characteristics of these sensors and their specifications will better inform engineers and scientists when performing specific RS tasks. General descriptions of available sensors suitable for low-payload aircraft platforms can be found in Colomina and Molina’s review paper [19], and other in-depth discussions of these sensors can be found in Reference [1]. However, amongst these relevant works, a close tie between the characteristics of the sensor data and the potential applications is largely missing: UAV data should be better processed and analyzed given their resolution advantages for either the traditional or novel RS applications. Our introduction to these sensors and their data will lean towards the goal of better informing researchers who design processing algorithms for typical RS analysis tasks including image classification and change detection. The discussed sensors and specifications as well as relevant applications and their advantages and disadvantages are summarized in Table 1, and details of these sensors are introduced in the following subsections.
2.1. RGB Cameras
Modern UAV-based RS starts with remotely controlled plane models mounting normal RGB cameras [20]. Basically, a consumer-grade camera mounted on a drone, integrated with/without navigation sensors such as GPS/IMU constitutes necessary components of a UAV-surveying system. Such a system, being highly engineered in terms of (low-cost) sensor integration is becoming accessible and has nowadays emerged to be applied in other popular uses such as entertainment and television (e.g., DJI drones). As compared to other types of sensors (introduced in Section 2.2, Section 2.3, Section 2.4 and Section 2.5), there exist a wide range of RGB cameras on the market, and for different applications, selecting appropriate RGB cameras mounted on a UAV can be a key to success. Common parameters for selecting RGB cameras include camera lens (better lens come with less geometric distortions), and resolution and quality of the charge coupled device (CCD)/complementary metal oxide semiconductor (CMOS) chips (pixel size and noise level). High-quality cameras ensure good photogrammetric products and low-signal/noise-ratio data for RS data analysis (such as image segmentation and classification). Normally, highly integrated UAV-systems are easy to transport and operate, while the mountable RGB cameras are often confined to a few models allowing for seamless control. Sometimes, professional photogrammetric users favor customized/less integrated systems in order to be able to access a larger collection of RGB cameras for different applications. In general, many of the existing RS applications still largely rely on RGB camera-based products (e.g., orthophotos and DSMs), such as analyses for tree crowns detection, vegetation growth monitoring and change analysis in a local scale. There exists a large body of works on UAV-based photogrammetric surveying, where the selection of camera models/parameters is well discussed [2,10], and many of these can be applied as well when determining parameters (e.g., lens distortion, focal length, and pixel size) for other types of camera systems (e.g., multispectral, hyperspectral cameras).
2.2. Light-Weight Multispectral Cameras
Multispectral cameras are one of the most commonly used sensors in addition to RGB cameras in the UAV sensors family, because of their benefits of obtaining spectral information in the red-edge and near-infrared band for vegetation applications in an extremely high resolution (comparing to available products from other platforms). Although the RGB cameras are able to provide information related to the vegetation, e.g., the normalized greenness indices [21,22] for vegetation analysis. Their spectral sensitivity to the chlorophyll level of the vegetation is, however, limited for more sophistically analysis such as plant health quantification and disease detection. Near-infrared cameras (e.g., Canon PowerShot SX260) can be used to derive vegetation indices (VIs) such as Normalized Difference Vegetation Index (NDVI) and others such as Green Normalized Difference Vegetation Index (GNDVI) and Enhanced Normalized Difference Vegetation Index (ENDVI) [23].
The multispectral cameras mounted on a UAV may contain up to a few tenth of bands in addition to normal RGB bands. Likewise, such multispectral cameras are still metric cameras by design and thus can be easily processed using photogrammetric methods to output standard orthophotos and DSMs. A great benefit for UAV-based multispectral sensors is the yielded data with much higher resolution (better than 30 cm Ground Sampling Distance (GSD)) that are normally not attainable in traditional multispectral RS. This may drive the novel applications seeing through more details in farming and water quality assessments, such as leaf level disease assessment [24] and pads level Harmful algae bloom studies [25].
Different from RGB cameras, multispectral cameras usually come with a higher cost due to the additional hardware needed for wiring additional bands to the RGB bands, and since the multispectral cameras are mainly for professionals on vegetation and agriculture, the number of available products are far fewer than RGB cameras. Additional barriers for such cameras are the data format compatibilities with capable software packages. Since the market is still relatively small and various manufacturers are producing multispectral cameras with images in different formats, seamless processing software packages, particularly handling data preprocessing (e.g., photogrammetrically), are relatively limited to certain multispectral camera models at this point, while there is, in general, a good trend that these data are becoming standardized and easier to deal with.
2.3. Light-Weight Hyperspectral Sensors
Hyperspectral cameras in RS are often very capable while they are comparably less accessible due to their high cost and constraints in sensor compatibility to drones. In order to capture images with hundreds of narrow bands (5–10 nm bandwidth), most of the current light-weight hyperspectral sensors are linear-array cameras [26,27]. Undoubtedly, the hyperspectral sensors capturing such high volumes of information are extremely useful for many applications [23,28,29,30,31], while the hyperspectral sensors by design have certain limitations: (1) the high spectral resolution is at the expense of spatial resolution, which is normally lower than that of RGB cameras with equivalent specifications (payload level); (2) the linear-array sensory model, although it has been mathematically well-interpreted, is practically complicated given limited meta-information that sensor manufacturers offer; and (3) light-weight hyperspectral cameras normally come with half spectral ranges (400–1100 nm or 1100–2500 nm) as compared with airborne hyperspectral cameras due to the payload limit, meaning if wider spectral ranges are needed, two or more light-weight hyperspectral cameras might be needed, either simultaneously or sequentially (with different flights) [32]. Limitation (1) is not a critical issue for a UAV-based hyperspectral camera, as with a certain effort in flight design (i.e., with a very low flying altitude and a long focal length) and at the expense of limited ground coverage, the resolution of the acquired images can reach up to 2–5 cm levels or lower [33]. Limitation (2) is particularly problematic in a UAV-based hyperspectral camera, since different manufacturers follow their own standards and very often they only expect the users to use an undistorted image coarsely geo-referenced using the onboard GPS/IMU information. This becomes technically complicated when an expert uses the camera for accurate geo-referencing, such as bundle adjusting the observations to have per scan-line orientations in order to project them to a currently available high-accuracy product (e.g., DSM). The accurate registration among scans becomes necessary when there are multiple flights acquiring information of different spectral bands. The hyperspectral information, combined with other modality data, such as data obtained with the DSM, can be used for more accurate classification and plant phenology in agricultural applications with a much higher spatial/temporal resolution [34].
2.4. Light-Weight Thermal Infrared Sensors
As one of the mid-infrared-range passive sensors (wavelength between 3 and 35 µm) [35,36], the thermal infrared sensors are broadly used in various surface temperature and thermal emission measurements. The classical issue on kinetic temperature and emissivity determination through the intensity and its distribution over the wavelength region [36] of UAV-borne sensors can be slightly different from the airborne or spaceborne thermal sensors. As for UAV-borne sensors, the atmospheric effects are ignorable, lab-level calibration are more accessible [37], and the temperature measurements are theoretically more accurate. However, in consideration of the limited payload, light-weight thermal infrared sensors generally do not come with cooled detectors, thus resulting in lower capture rates, lower spatial resolution and lower sensitivity as a compensation to a reduced signal-to-noise ratio. The resolution benefit of the UAV-borne sensor data brought by a low flying altitude still increases the capability of thermal cameras for accurate quantification of small objects such as human [38], fire centers [39], and pipe-leaking detection [40]. Since temperature is highly dynamic, the thermal sensors are frequently used for real-time detection with a prior decision of the qualified capture rate. This, on the other hand, could be useful in RS and mapping when being integrated with sensors acquiring information from other spectrum ranges (i.e., visible bands and hyperspectral bands), and thermal infrared data are also employed for various agricultural [41,42] and environmental applications [43,44]. Examples include crop biophysical parameter estimation for precision farming [41] and the use of UAV-based thermal camera to estimate water evaporation in a much finer spatial scale for irritation and water resource management [45].
Theoretically, the geometric model of a thermal camera is exactly the same as that of a normal perspective camera. On the other hand, the thermal pictures normally come with much fewer textures than the RGB images [46], and a modern photogrammetry/structure from motion process will likely fail due to the lack of interest points. Therefore, when the geometric aspects of the camera are involved, it is recommended to have an RGB camera calibrated and fixed relative to the thermal camera and take images simultaneously for the use of recovering the poses of the thermal camera.
2.5. UAV LiDAR
LiDAR sensors have been known as one of the most accurate ways for geometric data acquisition. Widely used in forestry, cultural heritage, and building information modeling (BIM), the airborne, mobile, and terrestrial LiDAR nowadays have been well established in both the academia and industry. Their advantages over photogrammetry are their high reliability and the ability to penetrate thin forests through multiple returns [47]. However, as a sensor depending strongly on the direct positioning accuracy of the host platform, UAV-borne LiDAR is rather rudimentary as compared to UAV photogrammetry. The GPS/IMU sensors in a UAV platform are very often inaccurate with respect to the sensor resolution, and the platform is also more instable when flying. Thus, even with well-calibrated light-weight LiDAR sensors, the obtained point clouds accuracy is comparatively low. Reported highly accurate UAV-borne LiDAR systems are normally those coming with differential GPS stations [48], where high-accuracy GPS measurements are obtainable [49] in addition to highly accurate IMU measurements. On the other hand, an advantage of UAV-based RS and mapping is their relative low cost. LiDAR sensors, even those with relatively low cost, are still order-of-magnitude higher than RGB cameras and require higher payloads (up to a few kilograms). Therefore, in terms of the cost and needed sensors for integration, the UAV LiDAR system is not yet as accessible as UAV-based photogrammetric mapping systems. Despite the needed consideration of payload and cost, potentials for the use of both RGB and LiDAR sensors are still very promising, since it has been shown already that well-registered RGB + LiDAR sensory data can readily improve both measurement and interpretation accuracy [50,51].
3. UAVs Remote Sensing Data Analysis
RS data acquired through UAV platforms with their sensors are intended to be no different from those traditionally used in airborne and spaceborne RS sensors. While as per argued in our first section in this manuscript, this UAV sensor data world embraces higher likelihood of distinct characteristics: (1) UHR; (2) high availability of geometric and spectral data; and (3) integrated sensor data for multi-dimensional and multi-modal data analysis. These lead to completely different application scenarios, data quality, and availability of different dataset that call for more targeted analysis techniques. Many existing approaches to UAV-based RS data processing either simply adopt or lightly refine traditional analysis techniques. We do agree that many of the existing methods that are used for RS analysis are reusable and can be fine-tuned to deal with UAV-based RS data, while this has not yet been systematically discussed particularly for UAV data. In this section, we aim to close this gap by discussing expected issues and existing works on two topical applications typically used in traditional RS: A) ULC mapping and B) change detection, with sensor data acquired from UAV platforms. A summary of the discussed topics and their characteristics are listed in Table 2.
3.1. Land-Use/Land-Cover (LULC) Mapping
LULC mapping, even after many years of research, is still not fully achieved via a standard approach with various types of satellite images (spectral/spatial resolution). LULC mapping using UAV images is non-trivial as per observed by the resolution crisis: since the 1970s, the spatial resolution of remotely sensed multispectral, panchromatic images has increased dramatically [52], and the relevant processing methods are ever challenged as the resolution moves to new eras [53]. It is a stretch for researchers to turn pixel-based methods to object-based methods as the resolution (i.e., GSD) goes from tenths of meters to half a meter, and nowadays problems associated with it are still in active research [54,55,56]. The UHR RS data with centimeter-level GSD from UAV-borne sensors presents an equivalent level of resolution increase [10,57,58,59]. Small objects and events that are normally unobservable on conventional platforms are now becoming objects of interest, such as pedestrians on the street, cars, infected plants [60], weed patches [61], and dustbins [62].
It has been reported that for UAV-based RS data, a lower spatial resolution may provide the best results using a traditional pixel-based classification method and the classification accuracy will decrease as the resolution increases [61,63]. The increased spatial resolution provides information with a great level of detail, but does not necessarily offer the same level of improvement in terms of classification accuracy for traditional methods, as this leads to much higher within class variation and inter-class similarities [64,65]. As compared to traditional pixel-based LULC classification, researchers working with UAVs imagery are more inclined to use Object-Based Image Analysis (OBIA) [66] methods. The idea of OBIA is to aggregate information through coherent and spatially connected pixels into diverse image segments, where analyses are performed through these segments, which additionally bring the benefit of the shape information. With tunable parameters (usually called scale, varying with the segmentation algorithms) determining the granularities of the segments [14,67,68,69,70,71]. Although choosing the optimal scale for pixels aggregation still remains a challenging problem [72,73,74], OBIA has achieved a great success in dealing with high resolution (HR, 2–30 m GSD) and Very High Resolution (VHR, 0.3–2 m GSD) imageries for filtering out the trivial and noisy information which can jeopardize the interpretation results and model the human’s hierarchical visual cognitions process facilitating high-level reasoning [75]. By aggregating appearance coherent and spatial connected pixels, an image object (patch) can provide much more robust features than the original ones [67].
In HR and VHR image processing, texture features have been widely used to improve LULC classification accuracy [76,77], such as grey-level concurrent matrixes (GLCMs) [78] and local binary patterns (LBPs) [79,80,81]. Most of the existing texture descriptors used for VHR imagery could be directly applied to UHR images [82,83]. The geometric information from data such as digital elevation models (DEMs) from multi-view/stereo-view images [84,85], LiDAR data [86,87], or vector data [88] has also been proven to be of great value for land-cover classification and object recognition [89]. Guo et al. [90] revealed in their classification experiments that the relative height plays a significant role in classification accuracy and the best set of features should be a combination of both geometric and spectral information. Nowadays, getting a DSM out of UAV photogrammetry data can be as easy as a simple button click with a capable software [91,92], and this is achieved through advanced photogrammetry, structure from motion [93], and highly efficient stereo-matching algorithm. In addition, pixel-wise co-registered DSMs and orthophotos provide another dimensional information and are proven to be particularly effective in boosting the land-cover classification accuracy [94]. The best overall accuracy improvement reported may reach up to 30% [95]. Given that DSMs are raster representations, many existing feature extraction algorithms can be directly applied to extract useful information. Often, such extracted features come with geometric interpretation; for example, the morphological top-hat operators [7] extracting closed blobs [96] can be seen as an effective way to represent off-terrain objects such as buildings, trees, and cars. Such information can largely solve the spectral ambiguities.
As the resolution of the UAV-based RS data has increased to an unprecedented level, an OBIA often shows difficulties in getting the appropriate segmentation due to the fact that the scale differences among different/same objects are significant and simple shape or texture features are no longer sufficiently powerful to distinguish them. A strategy to handle such UHR data is to adopt multi-scale approaches, either on the feature level [95] or the image level [97]. The feature-level approaches often take the feature profiles extracted with different scale parameters and a classifier takes such profiles for classification [95]. The image-level approaches build a pyramid of images and then progressively classify images through the pyramid; the very prominent deep convolutional neural networks implicitly use similar concepts by spatially correlating pixels through multi-resolution feature maps. Another branch of the idea that might aim to close such gaps is to use a hierarchical way for segmenting the images prior to classification. A representative example is to use superpixels [98] to firstly over-segment the image into small-granular segments and strategically merge them through spectrum and/or texture analysis [99].
As the scene contents get complex, simple classifiers, such as a single-pass support vector machine (SVM) [100], random forest [101], or maximum likelihood [102] classifiers, may not be sufficient. More advanced classifiers, including an ensemble of simpler classifiers [103,104] or deep learning-based methods [105,106], still present a huge potential to be explored for this ultra-high-resolution, multi-modal data (height, thermal, and hyperspectral information). The fully convolutional network (FCN) is inherently applicable to pixel-wise remotely sensed image classification. However, the down-sampling layers tend to produce round corners and smoothed edges while increasing the receptive fields to integrate contextual information. By taking into account the features from multiple layers, methods such as U-Net [107] can achieve good localization and utilize contextual information at the same time. Adopting architectures with dilated convolutions can increase the field of view without the need of down-sampling [108]. The spatial information loss during the convolution process is another reason for the lack of details in labeled imageries. Bergado et al. introduced skip connections into their FuseNet and achieved increased accuracy by recovering high spatial details [105]. Liu et al. progressively refined fine-structured objects using low-level features maps learned by shallow layers [109]. Using post-classification spatial regulation is another way to achieve higher classification accuracy: Mboga et al. refined an FCN-classified map by majority voting in geographic image objects [106] and Marmanis et al. proposed an ensemble of semantic segmentation with semantically informed edges detected by a modified holistically nested edge detection (HED) [110]. Another new worth-noting architecture is Pyramid Scene Parsing Network (PsPNet): based on residual networks, it takes local and global contextual information to perform a more reliable prediction of pixel’s label [111]. For multi-modal data integration, deep convolution neural networks also show their capacity in both feature level fusion [112] and decision level fusion [113] for increased classification accuracy.
In addition, transfer learning techniques [114] are becoming more needed as the traditional sample-per-dataset learning in large-format satellite images are no longer suitable for local scale, as datasets might be diverse and small in terms of geographical regions [115]. Penatti et al. have shown experimentally that deep features obtained by training on everyday objects can be used for the classification of aerial images [116]. Minimizing domain shift in the pixel space also presents as a promising way to deal with the varying imaging conditions of UAVs-based RS [117].
3.2. Change Detection
Change detection, as a very important topical application in RS, may see many opportunities and unexplored applications looking at much finer spatial scales, such as the detection of illegal waste dumping, street facility misplacement, and crowd anomaly detection [118,119,120,121,122,123]. The obvious advantages of having higher spatial resolution and availability of geometric information (i.e., DSM) are the ability to detect changes of objects in a finer scale with higher accuracy. Its flexibility of mounting different sensors as well as the minimal ready-to-fly logistics can facilitate a much higher temporal data acquisition, such as daily, hourly, even real-time monitoring using video streams [124] as well as the higher accessibility to non-convention photos such as multispectral and hyperspectral data for civilian use.
Temporal data registration is probably one of the biggest issues for close-range UAV images due to the relatively large perspective effects, while this seeming disadvantage is readily solvable to a large extent as long as the images are taken in a photogrammetric fashion, and thereby DSMs and orthophotos generations are seamless. Ground control points (GCPs) or general bundle adjustment techniques [125] (incorporating known exterior parameters from different temporal data into bundle adjustment to set datum, or from a high-accuracy real-time kinematic (RTK) system with known uncertainty) can be used to address the registration issue and yield sub-pixel-aligned temporal orthophotos and DSMs for change detection.
The DSMs play a more important role in determining the changes than the orthophotos as the illumination changes are expected to be rather significant due to the more complex scene contents. Similar to the general land-cover classification problem, the UHR data bring up more unwanted changes that are usually ignorable in typical aerial and satellite RS data, such as standing pedestrians and cars. Given that the interests in change detection are the temporally changed objects, the resolution crisis is minor as compared to land-cover classification problems. However, if semantic meanings of the changed objects are needed, the classification still needs to be performed either on the difference maps or independently on each temporal dataset [126]. From a data point of view, the most applicable scenario would be the 3D change detection. As per introduced in the review paper [127], the 3D change detection in general consists of three processing steps: (1) data selection/acquisition; (2) data co-registration; and (3) change analysis. Items (1) and (2) are addressable for UAV data and item (3) for UAVs is primarily for geometric or image-aided geometric analysis, where object-based methods are needed to analyze changes when dealing with “salt-and-pepper” noises [128,129,130,131].
The enabling applications for change detection using UAV data are with the obvious advantages of spatial-temporal resolution and cloudlessness as compared to the satellite RS images, while presenting as well the limitation for mapping a large region. When in applications the spectral information of the UAV dataset is needed for analyzing the changes, it should be noted that there might exist a much higher spectral in-class variance, due to either the complexity of the scenes and the diverse imaging conditions like illumination and shadows (different times of a day). Therefore, it is still with a certain constraint that the acquired images are better under similar external conditions.
Most of the methods developed so far are not particularly for UAV datasets, but in general the object-based change detection methods [53] can be strategically applied by carefully dealing with the DSMs uncertainty and image spectrum heterogeneities. To perform the change detection using UAV data, typically the changes should be analyzed through certain units using segmentation techniques. With well-overlaid multi-temporal images, criteria in determining changes through layer arithmetic, post-classification, direction classification, or change vector analysis (CVA) are found in Reference [132]. More detailed reviews in change detection techniques can be found in References [127,133].
4. UAVs Remote Sensing Applications
The European Commission listed a set of civil and commercial applications of UAVs and categorized them as (a) Government (civil security, border security, and coastguard); (b) Fire Fighting (forest fire spotting and coordination, major incident response co-ordination, and emergency rescue); (c) Energy Sector (oil and gas industry distribution infrastructure, electricity grids, and distribution networks); (d) Agriculture Forestry and Fisheries (environmental monitoring, crop dusting, and optimizing use of resources); (e) Earth Observation and RS (climate monitoring, aerial photography, mapping and surveying, seismic events, major incident, and pollution monitoring); (f) Communications and Broadcasting (Very High Altitude, Long-Endurance (VHALE) platforms as proxy satellites, Medium-Altitude Long-Endurance (MALE) UAVs for communication coverage, and camera platforms) [134]. In this section, to show a comprehensive utilization of the “new” aspects of UAV-based RS, we give examples of UAV-based RS applications under the following umbrellas: (1) precision agriculture and vegetation (part of “d”); (2) urban environment and management (part of “e”); (3) disaster, hazard, and rescue (part of “a”). Selected applications of these categories can be found in Table 3.
4.1. Precision Agriculture and Vegetation
Precision agriculture requires mapping the spatial variability of as many variables as can be measured (e.g., crop yields, terrain features/topography, organic matter contents, and moisture levels) as the input of decision support system for farm management [135,151]. For this reason, RS techniques are widely used in agriculture and agronomy [152]. Due to the fact that the variables affecting productivity are highly variable in space and time, recent papers show a trend of adopting UAVs by researchers and farmers to monitor their fields because of their high operability, which gives an unprecedented perspective of ultra-high spatial and temporal resolution and free of cloud occlusion as well. Moreover, given its economic efficiency with flight, time-series animation which reveals the change of the crop can be easily obtained with a minimum interval of several hours [136]. Opportunities are also found in new vegetation analysis applications at finer scales such as mapping, detection, and change monitoring on a tree level.
Generating crop or vegetation maps with high accuracy is critical to many tasks such as biomass estimation, yield prediction, and crop infestation monitoring. To inspect the crop status, Sugiura et al. developed a system mounting an imaging sensor on an unmanned helicopter for precisely mapping the crop information with spatial resolutions of 1.8 cm and 4.1 cm, taken from altitudes of 30 m and 70 m respectively. Image orientation distortions caused by a variation of the helicopter posture is removed under the assistance of a real-time kinematic global positioning system (RTK-GPS) and an inertial sensor (INS), which helps gain a reduced spatial error of 38 cm [137]. A successful vegetation analysis application of classification in the riparian field indicating standing dead wood and canopy mortality was reported by Dunford et al. using object-oriented approaches at 6.8–21.8 cm GSD; this work also showed that major constraints of vegetation mapping with UAVs come from the variations in spatial resolution and radiometry [153].
A number of RS vegetation indices (VIs) were developed in the past for retrieving biophysical status (e.g., water content, pigments, sugar and carbohydrate contents, protein content, and abiotic/biotic stress levels) of crops or trees. Among them, the most popular ones are NDVI, Atmospherically Resistant Vegetation Index (ARVI), Optimized Soil-Adjusted Vegetation Index (OSAVI), Soil Brightness Index (SBI), Green Vegetation Index (GVI), and Yellow Vegetation Index (YVI). A great number of researches have revealed the correlation between NDVI and Leaf Area Index (LAI) with different imaging conditions, sites and seasons, etc. [154,155,156,157]. Most of these indices are based on the mixture of visible bands and the near-infrared (NIR) band, except for rare cases in which only visible spectrums are considered [22,158]. Due to the minimal impact of atmospheric factors during the data acquisition, a number of VIs considering atmospheric effects are not necessary for UAVs. Although light-weight high-definition cameras containing the NIR band are available, most of the off-the-shelf UAVs still mount only cameras working on visible bands for the derived indices [159].
The feasibility of acquiring high-resolution 3D structure of crops and trees with LiDAR or optical cameras on UAVs has been investigated in recent years. For instance, Wallace et al. investigated the potentials of UAV to measure the structural properties of forests by comparing two different methods (airborne laser scanning (ALS) and structure from motion (SFM)) to obtain absolute terrain height and the canopy information. The results indicate that both techniques are suitable for relatively low canopy, while ALS performs better than SFM/photogrammetry in capturing denser canopy covers [138]. 3D information is useful in monitoring crops or trees because they demonstrate a temporal 3D structural variance accompanying growth, and the UHR data and capability of flexible revisiting of UAV allow for precisely recording the temporal changes in a short-time interval. For example, Bendig et al. produced multi-temporal crop surface models during its growing season, and then the derivate height difference was used to indicate the growth of cultivars [160]. Dong et al. proposed a 4D (4 dimensional) crop monitoring technique based on spatio-temporal reconstruction by adopting a robust data association algorithm which introduces single-row reconstruction results as a starting point for data association across rows and times [161].
4.2. Urban Environment and Management
It has been reported that the urban population will take 66 percent of the total population on the planet by 2050 [162]. Observed at fine scales, the urban environment is highly dynamic due to the human activities, which produces the desire for various challenging UAVs urban applications including real-time traffic control [139], management of urban infrastructures [140], and building observation [141]. For example, the status of paved roads like depression and crack is critical to driving safety and fuel consumption, which requires frequent inspections at high spatial resolution since the defects’ sizes are usually as small as dozens of centimeters. However, a traditional in situ check or the use of terrestrial vehicles for detecting the damage of roads may incur high cost, or even enduring safety risks. In this regard, UAV-based RS might be a good substitute for this issue due to the high flexibility and availability of geometric and spectral data at UHR.
Branco and Segantine proposed a methodology to automatically capture asphalt road pavement conditions with UAVs imageries at a spatial resolution of 4 cm, where radiometric preprocessing followed by machine learning algorithms is adopted to detect defects [163], and in such an application, the 3D structure itself can be particularly useful in determining the geometric distortions of the road [164]. Similar practices were performed by Phung et al. [165] to detect cracks of buildings. In their work, to ensure the information on the building was fully captured, they first created a coarse model for flight path planning, and then a simple threshold-based method was used to identify potential cracks with their positions.
A natural advantage of UAV in use for dynamic scene analysis is its high spatial-temporal resolution, and thus the enabled applications can be readily extended to smaller objects with high levels of details. Efforts in such dynamic scene analysis include accurate mapping urban vegetation and impervious surfaces using combined high-resolution DSMs and orthophotos [78,142], with improved land-cover classification [7]. The possibility of acquiring data in a much higher frequency leads to work focusing on small objects with faster dynamics; for example, Qin [62] detected the geometric changes of buildings and small public facilities, as well as significant changes of tree canopies in urban scenarios using UAVs imageries. Although these existing works primarily use normal RGB cameras, we expect work using multispectral or hyperspectral cameras as a means of assessing temporal dynamics, such as monitoring of crop diseases and urban heat islands, is becoming more viable [37,166,167,168].
4.3. Disaster, Hazard, and Rescue
RS is seen as an important tool for risk assessment and rescue operations [169,170]. Low-cost UAVs are now indispensable for onsite rapid data collection in aid of disaster management [143,145,171], such as mapping, monitoring, and autonomous deployment of flying robots [146].
An often-reported use-case scenario in UAV-based disaster management is a post-seismic building damage assessment, where with the capability of UAV in acquiring site data processed as information such as the area, amount, rate, and type of the damage, the rescue teams will be better informed of safe paths and potential corruptions due to secondary shocks. 3D building models of the sites can be reconstructed through either UAV-based mapping or LiDAR point clouds [144,172], which can be used by experts to identify total collapses, partial collapses, and high-risk structures. Such identifications can be further automated through unsupervised classification or 3D change detection techniques (when before and after images are available) [173]. The high accuracy nature of the UAV-derived topographic data (DSM) can be now readily used at a significantly lower cost in disaster monitoring and analysis. Examples include its use in landslide dynamic monitoring [147,148] and change detection on coastal facilities in aid of vulnerability assessment due to nature disasters such as tornados [149,150]. The DSM or DEM acquired using UAV platforms can reach up to centimeter levels and can be well geo-referenced or co-registered. A good advantage of using these high-resolution high-accuracy data is that the displacement can be performed in simultaneously in horizontal and vertical directions, as compared to image-based (in horizontal direction) [174] and Interferometry Synthetic Aperture Radar (InSAR)-based displacement analysis (in a vertical direction) [175].
5. Conclusions and Future Trends
In this work, we provided an overview of the UAVs RS data processing and their specific applications. The “new” aspects brought by UAV-based RS lie in their: (1) UHR; (2) high availability of geometric data (i.e., DSM); and (3) flexibility in multi-sensor integration. We have presented how these new aspects should be taken into consideration when processing UAV-based RS on two typical RS applications: land-cover classification and change detection. Novel and a diverse set of specific applications associated with UAV sensor data were introduced. When it comes to processing UAV-based images, there in general exist high in-class appearance variances and uncertainties of the DSM information. More advanced data-processing methods include hierarchical image segmentation and deep learning-based classification. In addition, as the UAV data tends to characterize local-scale scenarios that may dramatically vary, available training data to fuel successful machine learning applications can be a challenge, and thus the transfer learning techniques being able to utilize information from labeled datasets can be critical.
The characteristics of UAV with low flying altitude, low cost and high flexibility provide new opportunities to RS applications in various areas with high-spatial-resolution, high-frequency, and multi-source data. To take full advantage of these characteristics of UAVs data, new methods have been proposed in past few years, where techniques using geometric structures of scenes in the form of 3D information may serve as a starting point in UAVs imageries processing, as such 3D data in most of the time are naturally available. In addition, a review of a few and non-inclusive relevant applications on precision agriculture and vegetation, urban environment and management, and disaster, hazard, and rescue as the new and developing areas of applications that can greatly benefit from improved UAV-based data processing techniques were provided. As the users have higher flexibilities to design and practice with different flying parameters, platforms, and resolutions, benchmarking the achievable geometric and classification may require standardized datasets. In addition, given the low flying altitude and nature of UHR applications (high level of detail desired), the acquired data likely introduces more information on the facades of objects, and thus accuracy assessments in a true 3D/volumetric scenario might be considered as more appropriate.
Despite the fact that UAVs platforms and onboard sensors are easily accessible and have been widely and successfully used in various areas, more work on its data processing is still much in need, such as multi-modal data analysis (combined geometric and textures) and object tracking in clutters, as with the available UAV data we are moving our observations from the static object level to dynamic object level (e.g., cars and individual pedestrians), where traditional techniques need to be upgraded to more advanced methods such as deep convolutional or graphic neural networks to deal with multi-modality data for accurate object interpretation. On the other hand, performing an RS analysis using UAV consists of joint efforts in both data acquisition and processing, while work analyzing the uncertainties associated with this two-step processes as well as work standardizing achievable interpretation results (classification and change detection) in a controlled way is still missing, which may greatly inform researchers in the community when adopting UAV-based RS methods for relevant applications.
Author Contributions
All authors contributed to this paper. Huang Yao performed the literature survey and participated in the writing. Rongjun Qin performed the major writing of the manuscript and the final editorial adjustments. Xiaoyu Chen provided suggestions and participated in discussions that improved the quality of the paper.
Funding
This research received no external funding.
Acknowledgments
This work was established at the Geospatial Data Analytics (GDA) group in the Department of Civil, Environmental and Geodetic Engineering (CEGE) at the Ohio State University (OSU). Huang Yao was a visiting scholar of the CEGE department at OSU while performing this work.
Disclaimer
Mention of brand names in this paper does not constitute an endorsement by the authors.
Conflicts of Interest
The authors declare no conflicts of interest.
References
- Pajares, G. Overview and current status of remote sensing applications based on unmanned aerial vehicles (UAVs). Photogramm. Eng. Remote Sens. 2015, 81, 281–329. [Google Scholar] [CrossRef]
- Nex, F.; Remondino, F. UAV for 3D mapping applications: A review. Appl. Geomat. 2014, 6, 1–15. [Google Scholar] [CrossRef]
- Bhardwaj, A.; Sam, L.; Martín-Torres, F.J.; Kumar, R. UAVs as remote sensing platform in glaciology: Present applications and future prospects. Remote Sens. Environ. 2016, 175, 196–204. [Google Scholar] [CrossRef]
- Torresan, C.; Berton, A.; Carotenuto, F.; Di Gennaro, S.F.; Gioli, B.; Matese, A.; Miglietta, F.; Vagnoli, C.; Zaldei, A.; Wallace, L. Forestry applications of UAVs in Europe: A review. Int. J. Remote Sens. 2017, 38, 2427–2447. [Google Scholar] [CrossRef]
- Crommelinck, S.; Bennett, R.; Gerke, M.; Nex, F.; Yang, M.Y.; Vosselman, G. Review of automatic feature extraction from high-resolution optical sensor data for UAV-based cadastral mapping. Remote Sens. 2016, 8, 689. [Google Scholar] [CrossRef]
- Yan, W.Y.; Shaker, A.; El-Ashmawy, N. Urban land cover classification using airborne LiDAR data: A review. Remote Sens. Environ. 2015, 158, 295–310. [Google Scholar] [CrossRef]
- Zhang, Q.; Qin, R.; Huang, X.; Fang, Y.; Liu, L. Classification of ultra-high resolution orthophotos combined with DSM using a dual morphological top hat profile. Remote Sens. 2015, 7, 16422–16440. [Google Scholar] [CrossRef]
- Moranduzzo, T.; Melgani, F. Detecting cars in UAV images with a catalog-based approach. IEEE Trans. Geosci. Remote Sens. 2014, 52, 6356–6367. [Google Scholar] [CrossRef]
- Rodríguez-Canosa, G.R.; Thomas, S.; Del Cerro, J.; Barrientos, A.; MacDonald, B. A real-time method to detect and track moving objects (DATMO) from unmanned aerial vehicles (UAVs) using a single camera. Remote Sens. 2012, 4, 1090–1111. [Google Scholar] [CrossRef]
- Colomina, I.; Molina, P. Unmanned aerial systems for photogrammetry and remote sensing: A review. ISPRS J. Photogramm. Remote Sens. 2014, 92, 79–97. [Google Scholar] [CrossRef] [Green Version]
- Korchenko, A.G.; Illyash, O.S. The generalized classification of Unmanned Air Vehicles. In Proceedings of the 2013 IEEE 2nd International Conference Actual Problems of Unmanned Air Vehicles Developments Proceedings (APUAVD), Kiev, Ukraine, 15–17 October 2013; pp. 28–34. [Google Scholar]
- Dalamagkidis, K. Classification of UAVs. In Handbook of Unmanned Aerial Vehicles; Valavanis, K.P., Vachtsevanos, G.J., Eds.; Springer: Dordrecht, The Netherlands, 2015; pp. 83–91. [Google Scholar] [CrossRef]
- Department of Defense of USA; Office of the Secretary of Defense. Army Roadmap for Unmanned Aircraft Systems, 2010–2035; U.S. Army UAS Center of Excellence and Fort Rucker: Dale County, AL, USA, 2010. [Google Scholar]
- Zhang, L.; Huang, X.; Huang, B.; Li, P. A pixel shape index coupled with spectral information for classification of high spatial resolution remotely sensed imagery. IEEE Trans. Geosci. Remote Sens. 2006, 44, 2950–2961. [Google Scholar] [CrossRef]
- Woodcock, C.E.; Strahler, A.H. The factor of scale in remote sensing. Remote Sens. Environ. 1987, 21, 311–332. [Google Scholar] [CrossRef]
- Westoby, M.; Brasington, J.; Glasser, N.; Hambrey, M.; Reynolds, J. ‘Structure-from-Motion’photogrammetry: A low-cost, effective tool for geoscience applications. Geomorphology 2012, 179, 300–314. [Google Scholar] [CrossRef]
- Turner, D.; Lucieer, A.; Wallace, L. Direct georeferencing of ultrahigh-resolution UAV imagery. IEEE Trans. Geosci. Remote Sens. 2014, 52, 2738–2745. [Google Scholar] [CrossRef]
- Yang, B.; Chen, C. Automatic registration of UAV-borne sequent images and LiDAR data. ISPRS J. Photogramm. Remote Sens. 2015, 101, 262–274. [Google Scholar] [CrossRef]
- Segl, K.; Roessner, S.; Heiden, U.; Kaufmann, H. Fusion of spectral and shape features for identification of urban surface cover types using reflective and thermal hyperspectral data. ISPRS J. Photogramm. Remote Sens. 2003, 58, 99–112. [Google Scholar] [CrossRef]
- Eisenbeiß, H. UAV Photogrammetry; ETH Zurich: Zürich, Switzerland, 2009. [Google Scholar]
- Du, S.; Zhang, Y.; Qin, R.; Yang, Z.; Zou, Z.; Tang, Y.; Fan, C. Building change detection using old aerial images and new LiDAR data. Remote Sens. 2016, 8, 1030. [Google Scholar] [CrossRef]
- Gitelson, A.A.; Kaufman, Y.J.; Stark, R.; Rundquist, D. Novel algorithms for remote estimation of vegetation fraction. Remote Sens. Environ. 2002, 80, 76–87. [Google Scholar] [CrossRef] [Green Version]
- Adam, E.; Mutanga, O.; Rugege, D. Multispectral and hyperspectral remote sensing for identification and mapping of wetland vegetation: A review. Wetl. Ecol. Manag. 2010, 18, 281–296. [Google Scholar] [CrossRef]
- Calderón, R.; Montes-Borrego, M.; Landa, B.B.; Navas-Cortés, J.A.; Zarco-Tejada, P.J. Detection of downy mildew of opium poppy using high-resolution multi-spectral and thermal imagery acquired with an unmanned aerial vehicle. Precis. Agric. 2014, 15, 639–661. [Google Scholar] [CrossRef]
- Kislik, C.; Dronova, I.; Kelly, M. UAVs in Support of Algal Bloom Research: A Review of Current Applications and Future Opportunities. Drones 2018, 2, 35. [Google Scholar] [CrossRef]
- Suomalainen, J.; Anders, N.; Iqbal, S.; Roerink, G.; Franke, J.; Wenting, P.; Hünniger, D.; Bartholomeus, H.; Becker, R.; Kooistra, L. A lightweight hyperspectral mapping system and photogrammetric processing chain for unmanned aerial vehicles. Remote Sens. 2014, 6, 11013–11030. [Google Scholar] [CrossRef]
- Burkart, A.; Cogliati, S.; Schickling, A.; Rascher, U. A novel UAV-based ultra-light weight spectrometer for field spectroscopy. IEEE Sens. J. 2014, 14, 62–67. [Google Scholar] [CrossRef]
- Haboudane, D.; Miller, J.R.; Pattey, E.; Zarco-Tejada, P.J.; Strachan, I.B. Hyperspectral vegetation indices and novel algorithms for predicting green LAI of crop canopies: Modeling and validation in the context of precision agriculture. Remote Sens. Environ. 2004, 90, 337–352. [Google Scholar] [CrossRef]
- Psomas, A.; Kneubühler, M.; Huber, S.; Itten, K.; Zimmermann, N. Hyperspectral remote sensing for estimating aboveground biomass and for exploring species richness patterns of grassland habitats. Int. J. Remote Sens. 2011, 32, 9007–9031. [Google Scholar] [CrossRef]
- Van der Meer, F.D.; Van der Werff, H.M.; Van Ruitenbeek, F.J.; Hecker, C.A.; Bakker, W.H.; Noomen, M.F.; Van Der Meijde, M.; Carranza, E.J.M.; De Smeth, J.B.; Woldai, T. Multi-and hyperspectral geologic remote sensing: A review. Int. J. Appl. Earth Obs. Geoinf. 2012, 14, 112–128. [Google Scholar] [CrossRef]
- Benediktsson, J.A.; Palmason, J.A.; Sveinsson, J.R. Classification of hyperspectral data from urban areas based on extended morphological profiles. IEEE Trans. Geosci. Remote Sens. 2005, 43, 480–491. [Google Scholar] [CrossRef]
- Rufino, G.; Moccia, A. Integrated VIS-NIR hyperspectral/thermal-IR electro-optical payload system for a mini-UAV. In Infotech@ Aerospace; AIAA: Reston, VA, USA, 2005; p. 7009. [Google Scholar]
- Lucieer, A.; Malenovský, Z.; Veness, T.; Wallace, L. HyperUAS—Imaging spectroscopy from a multirotor unmanned aircraft system. J. Field Robot. 2014, 31, 571–590. [Google Scholar] [CrossRef]
- Aasen, H.; Burkart, A.; Bolten, A.; Bareth, G. Generating 3D hyperspectral information with lightweight UAV snapshot cameras for vegetation monitoring: From camera calibration to quality assurance. ISPRS J. Photogramm. Remote Sens. 2015, 108, 245–259. [Google Scholar] [CrossRef]
- Robles-Kelly, A.; Huynh, C.P. Imaging Spectroscopy for Scene Analysis; Springer Science & Business Media: Berlin, Germany, 2012. [Google Scholar]
- Prakash, A. Thermal remote sensing: Concepts, issues and applications. Int. Arch. Photogramm. Remote Sens. 2000, 33, 239–243. [Google Scholar]
- Sheng, H.; Chao, H.; Coopmans, C.; Han, J.; McKee, M.; Chen, Y. Low-cost UAV-based thermal infrared remote sensing: Platform, calibration and applications. In Proceedings of the 2010 IEEE/ASME International Conference on Mechatronics and Embedded Systems and Applications (MESA), Qingdao, China, 15–17 July 2010; pp. 38–43. [Google Scholar]
- Rudol, P.; Doherty, P. Human body detection and geolocalization for UAV search and rescue missions using color and thermal imagery. In Proceedings of the IEEE Aerospace Conference, Big Sky, MT, USA, 1–8 March 2008; pp. 1–8. [Google Scholar]
- Ambrosia, V.G.; Wegener, S.S.; Sullivan, D.V.; Buechel, S.W.; Dunagan, S.E.; Brass, J.A.; Stoneburner, J.; Schoenung, S.M. Demonstrating UAV-acquired real-time thermal data over fires. Photogramm. Eng. Remote Sens. 2003, 69, 391–402. [Google Scholar] [CrossRef]
- Ibarguren, A.; Molina, J.; Susperregi, L.; Maurtua, I. Thermal tracking in mobile robots for leak inspection activities. Sensors 2013, 13, 13560–13574. [Google Scholar] [CrossRef] [PubMed]
- Berni, J.A.; Zarco-Tejada, P.J.; Suárez, L.; Fereres, E. Thermal and narrowband multispectral remote sensing for vegetation monitoring from an unmanned aerial vehicle. IEEE Trans. Geosci. Remote Sens. 2009, 47, 722–738. [Google Scholar] [CrossRef]
- Laliberte, A.S.; Winters, C.; Rango, A. UAS remote sensing missions for rangeland applications. Geocarto Int. 2011, 26, 141–156. [Google Scholar] [CrossRef]
- Jensen, A.M.; Neilson, B.T.; McKee, M.; Chen, Y. Thermal remote sensing with an autonomous unmanned aerial remote sensing platform for surface stream temperatures. In Proceedings of the 2012 IEEE International Geoscience and Remote Sensing Symposium (IGARSS), Munich, Germany, 22–27 July 2012; pp. 5049–5052. [Google Scholar]
- Zarco-Tejada, P.J.; González-Dugo, V.; Berni, J.A. Fluorescence, temperature and narrow-band indices acquired from a UAV platform for water stress detection using a micro-hyperspectral imager and a thermal camera. Remote Sens. Environ. 2012, 117, 322–337. [Google Scholar] [CrossRef]
- Hoffmann, H.; Nieto, H.; Jensen, R.; Guzinski, R.; Zarco-Tejada, P.; Friborg, T. Estimating evaporation with thermal UAV data and two-source energy balance models. Hydrol. Earth Syst. Sci. 2016, 20, 697–713. [Google Scholar] [CrossRef] [Green Version]
- Bendig, J.; Bolten, A.; Bareth, G. Introducing a low-cost mini-UAV for thermal-and multispectral-imaging. Int. Arch. Photogramm. Remote Sens. Spat. Inf. Sci 2012, 39, 345–349. [Google Scholar] [CrossRef]
- Dalponte, M.; Coops, N.C.; Bruzzone, L.; Gianelle, D. Analysis on the use of multiple returns LiDAR data for the estimation of tree stems volume. IEEE J. Sel. Top. Appl. Earth Obs. Remote Sens. 2009, 2, 310–318. [Google Scholar] [CrossRef]
- Wallace, L.; Lucieer, A.; Watson, C.; Turner, D. Development of a UAV-LiDAR system with application to forest inventory. Remote Sens. 2012, 4, 1519–1543. [Google Scholar] [CrossRef]
- Rieke, M.; Foerster, T.; Geipel, J.; Prinz, T. High-Precision Positioning and Real-Time Data Processing of UAV Systems. Int. Arch. Photogramm. Remote Sens. Spat. Inf. Sci. 2011, 38, 119–124. [Google Scholar] [CrossRef]
- Campos-Taberner, M.; Romero-Soriano, A.; Gatta, C.; Camps-Valls, G.; Lagrange, A.; Saux, B.L.; Beaupère, A.; Boulch, A.; Chan-Hon-Tong, A.; Herbin, S.; et al. Processing of Extremely High-Resolution LiDAR and RGB Data: Outcome of the 2015 IEEE GRSS Data Fusion Contest–Part A: 2-D Contest. IEEE J. Sel. Top. Appl. Earth Obs. Remote Sens. 2016, 9, 5547–5559. [Google Scholar] [CrossRef]
- Vo, A.; Truong-Hong, L.; Laefer, D.F.; Tiede, D.; d’Oleire-Oltmanns, S.; Baraldi, A.; Shimoni, M.; Moser, G.; Tuia, D. Processing of Extremely High Resolution LiDAR and RGB Data: Outcome of the 2015 IEEE GRSS Data Fusion Contest—Part B: 3-D Contest. IEEE J. Sel. Top. Appl. Earth Obs. Remote Sens. 2016, 9, 5560–5575. [Google Scholar] [CrossRef]
- Belward, A.S.; Skøien, J.O. Who launched what, when and why; trends in global land-cover observation capacity from civilian earth observation satellites. ISPRS J. Photogramm. Remote Sens. 2015, 103, 115–128. [Google Scholar] [CrossRef]
- Hussain, M.; Chen, D.; Cheng, A.; Wei, H.; Stanley, D. Change detection from remotely sensed images: From pixel-based to object-based approaches. ISPRS J. Photogramm. Remote Sens. 2013, 80, 91–106. [Google Scholar] [CrossRef]
- Ma, L.; Li, M.; Ma, X.; Cheng, L.; Du, P.; Liu, Y. A review of supervised object-based land-cover image classification. ISPRS J. Photogramm. Remote Sens. 2017, 130, 277–293. [Google Scholar] [CrossRef]
- Cheng, G.; Han, J.; Guo, L.; Liu, Z.; Bu, S.; Ren, J. Effective and efficient midlevel visual elements-oriented land-use classification using VHR remote sensing images. IEEE Trans. Geosci. Remote Sens. 2015, 53, 4238–4249. [Google Scholar] [CrossRef]
- Carleer, A.; Wolff, E. Urban land cover multi-level region-based classification of VHR data by selecting relevant features. Int. J. Remote Sens. 2006, 27, 1035–1051. [Google Scholar] [CrossRef]
- Fry, J.; Coan, M.; Homer, C.; Meyer, D.; Wickham, J. Completion of the National Land Cover Database (NLCD) 1992–2001 Land cover Change Retrofit Product; US Geological Survey: Reston, VA, USA, 2009; pp. 1258–2331. [Google Scholar]
- Gong, P.; Wang, J.; Yu, L.; Zhao, Y.; Zhao, Y.; Liang, L.; Niu, Z.; Huang, X.; Fu, H.; Liu, S. Finer resolution observation and monitoring of global land cover: First mapping results with Landsat TM and ETM+ data. Int. J. Remote Sens. 2013, 34, 2607–2654. [Google Scholar] [CrossRef]
- Salazar, A.; Baldi, G.; Hirota, M.; Syktus, J.; McAlpine, C. Land use and land cover change impacts on the regional climate of non-Amazonian South America: A review. Glob. Planet. Chang. 2015, 128, 103–119. [Google Scholar] [CrossRef]
- Dash, J.P.; Watt, M.S.; Pearse, G.D.; Heaphy, M.; Dungey, H.S. Assessing very high resolution UAV imagery for monitoring forest health during a simulated disease outbreak. ISPRS J. Photogramm. Remote Sens. 2017, 131, 1–14. [Google Scholar] [CrossRef]
- Tamouridou, A.; Alexandridis, T.; Pantazi, X.; Lagopodi, A.; Kashefi, J.; Moshou, D. Evaluation of UAV imagery for mapping Silybum marianum weed patches. Int. J. Remote Sens. 2017, 38, 2246–2259. [Google Scholar] [CrossRef]
- Qin, R. An object-based hierarchical method for change detection using unmanned aerial vehicle images. Remote Sens. 2014, 6, 7911–7932. [Google Scholar] [CrossRef]
- Torres-Sánchez, J.; López-Granados, F.; Peña, J.M. An automatic object-based method for optimal thresholding in UAV images: Application for vegetation detection in herbaceous crops. Comput. Electron. Agric. 2015, 114, 43–52. [Google Scholar] [CrossRef]
- Timm, B.C.; McGarigal, K. Fine-scale remotely-sensed cover mapping of coastal dune and salt marsh ecosystems at Cape Cod National Seashore using Random Forests. Remote Sens. Environ. 2012, 127, 106–117. [Google Scholar] [CrossRef]
- Hayes, M.M.; Miller, S.N.; Murphy, M.A. High-resolution landcover classification using Random Forest. Remote Sens. Lett. 2014, 5, 112–121. [Google Scholar] [CrossRef]
- Blaschke, T. Object based image analysis for remote sensing. ISPRS J. Photogramm. Remote Sens. 2010, 65, 2–16. [Google Scholar] [CrossRef] [Green Version]
- Baatz, M.; Benz, U.; Dehghani, S.; Heynen, M.; Höltje, A.; Hofmann, P.; Lingenfelder, I.; Mimler, M.; Sohlbach, M.; Weber, M. ECognition Professional User Manual 4; Definiens Imaging: München, Germany, 2004. [Google Scholar]
- Gaetano, R.; Scarpa, G.; Poggi, G. Hierarchical texture-based segmentation of multiresolution remote-sensing images. IEEE Trans. Geosci. Remote Sens. 2009, 47, 2129–2141. [Google Scholar] [CrossRef]
- Trias-Sanz, R.; Stamon, G.; Louchet, J. Using colour, texture, and hierarchial segmentation for high-resolution remote sensing. ISPRS J. Photogramm. Remote Sens. 2008, 63, 156–168. [Google Scholar] [CrossRef]
- Shackelford, A.K.; Davis, C.H. A hierarchical fuzzy classification approach for high-resolution multispectral data over urban areas. IEEE Trans. Geosci. Remote Sens. 2003, 41, 1920–1932. [Google Scholar] [CrossRef] [Green Version]
- Zhang, P.; Lv, Z.; Shi, W. Object-based spatial feature for classification of very high resolution remote sensing images. IEEE Geosci. Remote Sens. Lett. 2013, 10, 1572–1576. [Google Scholar] [CrossRef]
- Ming, D.; Li, J.; Wang, J.; Zhang, M. Scale parameter selection by spatial statistics for GeOBIA: Using mean-shift based multi-scale segmentation as an example. ISPRS J. Photogramm. Remote Sens. 2015, 106, 28–41. [Google Scholar] [CrossRef]
- Drǎguţ, L.; Tiede, D.; Levick, S.R. ESP: A tool to estimate scale parameter for multiresolution image segmentation of remotely sensed data. Int. J. Geogr. Inf. Sci. 2010, 24, 859–871. [Google Scholar] [CrossRef]
- Kim, M.; Madden, M.; Warner, T. Estimation of optimal image object size for the segmentation of forest stands with multispectral IKONOS imagery. In Object-Based Image Analysis; Springer: Berlin/Heidelberg, Germany, 2008; pp. 291–307. [Google Scholar]
- Blaschke, T.; Hay, G.J.; Kelly, M.; Lang, S.; Hofmann, P.; Addink, E.; Feitosa, R.Q.; van der Meer, F.; van der Werff, H.; van Coillie, F. Geographic object-based image analysis–towards a new paradigm. ISPRS J. Photogramm. Remote Sens. 2014, 87, 180–191. [Google Scholar] [CrossRef]
- Agüera, F.; Aguilar, F.J.; Aguilar, M.A. Using texture analysis to improve per-pixel classification of very high resolution images for mapping plastic greenhouses. ISPRS J. Photogramm. Remote Sens. 2008, 63, 635–646. [Google Scholar] [CrossRef]
- Kim, M.; Madden, M.; Warner, T.A. Forest type mapping using object-specific texture measures from multispectral Ikonos imagery. Photogramm. Eng. Remote Sens. 2009, 75, 819–829. [Google Scholar] [CrossRef]
- Feng, Q.; Liu, J.; Gong, J. UAV remote sensing for urban vegetation mapping using random forest and texture analysis. Remote Sens. 2015, 7, 1074–1094. [Google Scholar] [CrossRef]
- Moranduzzo, T.; Mekhalfi, M.L.; Melgani, F. LBP-based multiclass classification method for UAV imagery. In Proceedings of the 2015 IEEE International Geoscience and Remote Sensing Symposium (IGARSS), Milan, Italy, 26–31 July 2015; pp. 2362–2365. [Google Scholar]
- Smits, P.C.; Annoni, A. Updating land-cover maps by using texture information from very high-resolution space-borne imagery. IEEE Trans. Geosci. Remote Sens. 1999, 37, 1244–1254. [Google Scholar] [CrossRef]
- Kurtz, C.; Passat, N.; Gancarski, P.; Puissant, A. Extraction of complex patterns from multiresolution remote sensing images: A hierarchical top-down methodology. Pattern Recognit. 2012, 45, 685–706. [Google Scholar] [CrossRef] [Green Version]
- Laliberte, A.S.; Rango, A. Texture and scale in object-based analysis of subdecimeter resolution unmanned aerial vehicle (UAV) imagery. IEEE Trans. Geosci. Remote Sens. 2009, 47, 761–770. [Google Scholar] [CrossRef]
- Gevaert, C.; Persello, C.; Sliuzas, R.; Vosselman, G. Informal settlement classification using point-cloud and image-based features from UAV data. ISPRS J. Photogramm. Remote Sens. 2017, 125, 225–236. [Google Scholar] [CrossRef]
- Immitzer, M.; Stepper, C.; Böck, S.; Straub, C.; Atzberger, C. Use of WorldView-2 stereo imagery and National Forest Inventory data for wall-to-wall mapping of growing stock. For. Ecol. Manag. 2016, 359, 232–246. [Google Scholar] [CrossRef]
- Salehi, B.; Zhang, Y.; Zhong, M. Object-based land cover classification of urban areas using VHR imagery and photogrammetrically-derived DSM. In Proceedings of the ASPRS 2011 Annual Conference, Milwaukee, WI, USA, 1–5 May 2011. [Google Scholar]
- Sohn, G.; Dowman, I. Data fusion of high-resolution satellite imagery and LiDAR data for automatic building extraction. ISPRS J. Photogramm. Remote Sens. 2007, 62, 43–63. [Google Scholar] [CrossRef]
- Khan, S.; Aragão, L.; Iriarte, J. A UAV–lidar system to map Amazonian rainforest and its ancient landscape transformations. Int. J. Remote Sens. 2017, 38, 2313–2330. [Google Scholar] [CrossRef]
- Gao, Y.; Zhang, W. LULC classification and topographic correction of Landsat-7 ETM+ imagery in the Yangjia River Watershed: The influence of DEM resolution. Sensors 2009, 9, 1980–1995. [Google Scholar] [CrossRef] [PubMed]
- Watanachaturaporn, P.; Arora, M.K.; Varshney, P.K. Multisource Classification Using Support Vector Machines. Photogramm. Eng. Remote Sens. 2008, 74, 239–246. [Google Scholar] [CrossRef] [Green Version]
- Guo, L.; Chehata, N.; Mallet, C.; Boukir, S. Relevance of airborne lidar and multispectral image data for urban scene classification using Random Forests. ISPRS J. Photogramm. Remote Sens. 2011, 66, 56–66. [Google Scholar] [CrossRef]
- Pix4D, SA. Pix4Dmapper: Professional Drone Mapping and Photogrammetry Software | Pix4D. Available online: https://www.pix4d.com/ (accessed on 30 December 2018).
- Agisoft LLC. Agisoft Metashape. Available online: https://www.agisoft.com/ (accessed on 30 December 2018).
- Fonstad, M.A.; Dietrich, J.T.; Courville, B.C.; Jensen, J.L.; Carbonneau, P.E. Topographic structure from motion: A new development in photogrammetric measurement. Earth Surf. Process. Landf. 2013, 38, 421–430. [Google Scholar] [CrossRef]
- Huang, X.; Zhang, L.; Gong, W. Information fusion of aerial images and LIDAR data in urban areas: Vector-stacking, re-classification and post-processing approaches. Int. J. Remote Sens. 2011, 32, 69–84. [Google Scholar] [CrossRef]
- Qin, R. A mean shift vector-based shape feature for classification of high spatial resolution remotely sensed imagery. IEEE J. Sel. Top. Appl. Earth Obs. Remote Sens. 2015, 8, 1974–1985. [Google Scholar] [CrossRef]
- Vincent, L. Morphological grayscale reconstruction in image analysis: Applications and efficient algorithms. IEEE Trans. Image Process. 1993, 2, 176–201. [Google Scholar] [CrossRef]
- Zhang, X.; Xiao, P.; Feng, X. Toward combining thematic information with hierarchical multiscale segmentations using tree Markov random field model. ISPRS J. Photogramm. Remote Sens. 2017, 131, 134–146. [Google Scholar] [CrossRef]
- Crommelinck, S.; Bennett, R.; Gerke, M.; Koeva, M.; Yang, M.; Vosselman, G. SLIC superpixels for object delineation from UAV data. ISPRS Ann. Photogramm. Remote Sens. Spat. Inf. Sci. 2017, 4, 9. [Google Scholar] [CrossRef]
- Corcoran, P.; Winstanley, A. Using texture to tackle the problem of scale in land-cover classification. In Object-Based Image Analysis; Springer: Berlin/Heidelberg, Germany, 2008; pp. 113–132. [Google Scholar] [Green Version]
- Pal, M.; Mather, P. Support vector machines for classification in remote sensing. Int. J. Remote Sens. 2005, 26, 1007–1011. [Google Scholar] [CrossRef]
- Pal, M. Random forest classifier for remote sensing classification. Int. J. Remote Sens. 2005, 26, 217–222. [Google Scholar] [CrossRef]
- Paola, J.D.; Schowengerdt, R.A. A detailed comparison of backpropagation neural network and maximum-likelihood classifiers for urban land use classification. IEEE Trans. Geosci. Remote Sens. 1995, 33, 981–996. [Google Scholar] [CrossRef]
- Huang, X.; Zhang, L. An SVM Ensemble Approach Combining Spectral, Structural, and Semantic Features for the Classification of High-Resolution Remotely Sensed Imagery. IEEE Trans. Geosci. Remote Sens. 2013, 51, 257–272. [Google Scholar] [CrossRef]
- Merentitis, A.; Debes, C.; Heremans, R. Ensemble Learning in Hyperspectral Image Classification: Toward Selecting a Favorable Bias-Variance Tradeoff. IEEE J. Sel. Top. Appl. Earth Obs. Remote Sens. 2014, 7, 1089–1102. [Google Scholar] [CrossRef]
- Bergado, J.R.; Persello, C.; Stein, A. Recurrent Multiresolution Convolutional Networks for VHR Image Classification. IEEE Trans. Geosci. Remote Sens. 2018, 56, 6361–6374. [Google Scholar] [CrossRef] [Green Version]
- Mboga, N.; Georganos, S.; Grippa, T.; Lennert, M.; Vanhuysse, S.; Wolff, E. Fully Convolutional Networks and Geographic Object-Based Image Analysis for the Classification of VHR Imagery. Remote Sens. 2019, 11, 597. [Google Scholar] [CrossRef]
- Ronneberger, O.; Fischer, P.; Brox, T. U-Net: Convolutional Networks for Biomedical Image Segmentation. In International Conference on Medical Image Computing and Computer-Assisted Intervention; Springer: Cham, Switzerland, 2015. [Google Scholar]
- Yu, F.; Koltun, V. Multi-Scale Context Aggregation by Dilated Convolutions. arXiv 2015, arXiv:1511.07122. [Google Scholar]
- Liu, Y.; Fan, B.; Wang, L.; Bai, J.; Xiang, S.; Pan, C. Semantic labeling in very high resolution images via a self-cascaded convolutional neural network. ISPRS J. Photogramm. Remote Sens. 2018, 145, 78–95. [Google Scholar] [CrossRef] [Green Version]
- Marmanis, D.; Schindler, K.; Wegner, J.D.; Galliani, S.; Datcu, M.; Stilla, U. Classification with an edge: Improving semantic image segmentation with boundary detection. ISPRS J. Photogramm. Remote Sens. 2018, 135, 158–172. [Google Scholar] [CrossRef] [Green Version]
- Zhao, H.; Shi, J.; Qi, X.; Wang, X.; Jia, J. Pyramid Scene Parsing Network. In Proceedings of the 2017 IEEE Conference on Computer Vision and Pattern Recognition (CVPR), Honolulu, HI, USA, 21–26 July 2017; pp. 6230–6239. [Google Scholar]
- Audebert, N.; Le Saux, B.; Lefèvre, S. Beyond RGB: Very high resolution urban remote sensing with multimodal deep networks. ISPRS J. Photogramm. Remote Sens. 2018, 140, 20–32. [Google Scholar] [CrossRef] [Green Version]
- Liu, Y.; Piramanayagam, S.; Monteiro, S.T.; Saber, E. Dense Semantic Labeling of Very-High-Resolution Aerial Imagery and LiDAR with Fully-Convolutional Neural Networks and Higher-Order CRFs. In Proceedings of the 2017 IEEE Conference on Computer Vision and Pattern Recognition Workshops (CVPRW), Honolulu, HI, USA, 21–26 July 2017; pp. 1561–1570. [Google Scholar]
- Hu, F.; Xia, G.-S.; Hu, J.; Zhang, L. Transferring deep convolutional neural networks for the scene classification of high-resolution remote sensing imagery. Remote Sens. 2015, 7, 14680–14707. [Google Scholar] [CrossRef]
- Cheng, G.; Han, J.; Lu, X. Remote sensing image scene classification: Benchmark and state of the art. Proc. IEEE 2017, 105, 1865–1883. [Google Scholar] [CrossRef]
- Penatti, O.A.B.; Nogueira, K.; Santos, J.A.d. Do deep features generalize from everyday objects to remote sensing and aerial scenes domains? In Proceedings of the 2015 IEEE Conference on Computer Vision and Pattern Recognition Workshops (CVPRW), Boston, MA, USA, 7–12 June 2015; pp. 44–51. [Google Scholar]
- Wu, Z.; Han, X.; Lin, Y.-L.; Uzunbas, M.G.; Goldstein, T.; Lim, S.N.; Davis, L.S. DCAN: Dual Channel-Wise Alignment Networks for Unsupervised Scene Adaptation. In Proceedings of the Computer Vision—ECCV 2018, Munich, Germany, 8–14 September 2018; pp. 535–552. [Google Scholar]
- LTA. Maintaining Our Roads and Facilities. Available online: http://www.lta.gov.sg/content/ltaweb/en/roads-and-motoring/road-safety-and-regulations/maintaining-our-roads-and-facilities.html (accessed on 29 May 2019).
- Qin, R.; Gruen, A. 3D change detection at street level using mobile laser scanning point clouds and terrestrial images. ISPRS J. Photogramm. Remote Sens. 2014, 90, 23–35. [Google Scholar] [CrossRef]
- Saur, G.; Krüger, W. Change Detection in Uav Video Mosaics Combining a Feature Based Approach and Extended Image Differencing. In Proceedings of the 2016 International Archives of the Photogrammetry, Remote Sensing & Spatial Information Sciences, Prague, Czech Republic, 12–19 July 2016; pp. 557–562. [Google Scholar]
- Ma, Y.; Wu, X.; Yu, G.; Xu, Y.; Wang, Y. Pedestrian detection and tracking from low-resolution unmanned aerial vehicle thermal imagery. Sensors 2016, 16, 446. [Google Scholar] [CrossRef]
- Gaszczak, A.; Breckon, T.P.; Han, J. Real-time people and vehicle detection from UAV imagery. In Proceedings of the IS&T/SPIE Electronic Imaging. International Society for Optics and Photonics, San Fransico, CA, USA, 23 January 2011; p. 78780B. [Google Scholar]
- Butenuth, M.; Burkert, F.; Schmidt, F.; Hinz, S.; Hartmann, D.; Kneidl, A.; Borrmann, A.; Sirmacek, B. Integrating pedestrian simulation, tracking and event detection for crowd analysis. In Proceedings of the 2011 IEEE International Conference on Computer Vision Workshops (ICCV Workshops), Barcelona, Spain, 6–13 November 2011; pp. 150–157. [Google Scholar]
- De Smedt, F.; Hulens, D.; Goedemé, T. On-board real-time tracking of pedestrians on a UAV. In Proceedings of the 2015 IEEE Conference on Computer Vision and Pattern Recognition (CVPR) Workshops, Boston, MA, USA, 7–12 July 2015; pp. 1–8. [Google Scholar]
- Triggs, B.; McLauchlan, P.F.; Hartley, R.I.; Fitzgibbon, A.W. Bundle adjustment—A modern synthesis. In International Workshop on Vision Algorithms; Springer: Berlin/Heidelberg, Germany, 2000; pp. 298–372. [Google Scholar]
- Walter, V. Object-based classification of remote sensing data for change detection. ISPRS J. Photogramm. Remote Sens. 2004, 58, 225–238. [Google Scholar] [CrossRef]
- Qin, R.; Tian, J.; Reinartz, P. 3D change detection–approaches and applications. ISPRS J. Photogramm. Remote Sens. 2016, 122, 41–56. [Google Scholar] [CrossRef]
- Lefebvre, A.; Corpetti, T.; Hubert-Moy, L. Object-oriented approach and texture analysis for change detection in very high resolution images. In Proceedings of the IEEE International Geoscience and Remote Sensing Symposium, Boston, MA, USA, 7–11 July 2008; pp. IV-663–IV-666. [Google Scholar]
- Gamanya, R.; De Maeyer, P.; De Dapper, M. Object-oriented change detection for the city of Harare, Zimbabwe. Expert Syst. Appl. 2009, 36, 571–588. [Google Scholar] [CrossRef]
- Xian, G.; Homer, C. Updating the 2001 National Land Cover Database impervious surface products to 2006 using Landsat imagery change detection methods. Remote Sens. Environ. 2010, 114, 1676–1686. [Google Scholar] [CrossRef]
- Bontemps, S.; Bogaert, P.; Titeux, N.; Defourny, P. An object-based change detection method accounting for temporal dependences in time series with medium to coarse spatial resolution. Remote Sens. Environ. 2008, 112, 3181–3191. [Google Scholar] [CrossRef]
- Wu, C.; Du, B.; Cui, X.; Zhang, L. A post-classification change detection method based on iterative slow feature analysis and Bayesian soft fusion. Remote Sens. Environ. 2017, 199, 241–255. [Google Scholar] [CrossRef]
- Tewkesbury, A.P.; Comber, A.J.; Tate, N.J.; Lamb, A.; Fisher, P.F. A critical synthesis of remotely sensed optical image change detection techniques. Remote Sens. Environ. 2015, 160, 1–14. [Google Scholar] [CrossRef] [Green Version]
- Frost, S. Study Analysing the Current Activities in the Field of UAV. ENTR/2007/065. 2007. Available online: https://ec.europa.eu/home-affairs/sites/homeaffairs/files/e-library/documents/policies/security/pdf/uav_study_element_2_en.pdf (accessed on 17 June 2019).
- Ivushkin, K.; Bartholomeus, H.; Bregt, A.K.; Pulatov, A.; Franceschini, M.H.D.; Kramer, H.; van Loo, E.N.; Jaramillo Roman, V.; Finkers, R. UAV based soil salinity assessment of cropland. Geoderma 2019, 338, 502–512. [Google Scholar] [CrossRef]
- Anderson, C. Agricultural Drones: Relatively cheap drones with advanced sensors and imaging capabilities are giving farmers new ways to increase yields and reduce crop damage. MIT Technol. Rev 2014, 17, 3–58. [Google Scholar]
- Sugiura, R.; Noguchi, N.; Ishii, K. Remote-sensing technology for vegetation monitoring using an unmanned helicopter. Biosyst. Eng. 2005, 90, 369–379. [Google Scholar] [CrossRef]
- Wallace, L.; Lucieer, A.; Malenovský, Z.; Turner, D.; Vopěnka, P. Assessment of forest structure using two UAV techniques: A comparison of airborne laser scanning and structure from motion (SfM) point clouds. Forests 2016, 7, 62. [Google Scholar] [CrossRef]
- Zhu, J.S.; Sun, K.; Jia, S.; Li, Q.Q.; Hou, X.X.; Lin, W.D.; Liu, B.Z.; Qiu, G.P. Urban Traffic Density Estimation Based on Ultrahigh-Resolution UAV Video and Deep Neural Network. IEEE J. Sel. Top. Appl. Earth Obs. Remote Sens. 2018, 11, 4968–4981. [Google Scholar] [CrossRef]
- Congress, S.S.C.; Puppala, A.J.; Lundberg, C.L. Total system error analysis of UAV-CRP technology for monitoring transportation infrastructure assets. Eng. Geol. 2018, 247, 104–116. [Google Scholar] [CrossRef]
- Malihi, S.; Zoej, M.J.V.; Hahn, M. Large-Scale Accurate Reconstruction of Buildings Employing Point Clouds Generated from UAV Imagery. Remote Sens. 2018, 10, 1148. [Google Scholar] [CrossRef]
- Tokarczyk, P.; Leitao, J.P.; Rieckermann, J.; Schindler, K.; Blumensaat, F. High-quality observation of surface imperviousness for urban runoff modelling using UAV imagery. Hydrol. Earth Syst. Sci. 2015, 19, 4215. [Google Scholar] [CrossRef]
- Bendea, H.; Boccardo, P.; Dequal, S.; Giulio Tonolo, F.; Marenchino, D.; Piras, M. Low cost UAV for post-disaster assessment. Int. Arch. Photogramm. Remote Sens. Spat. Inf. Sci. 2008, 37, 1373–1379. [Google Scholar]
- Fernandez Galarreta, J.; Kerle, N.; Gerke, M. UAV-based urban structural damage assessment using object-based image analysis and semantic reasoning. Nat. Hazards Earth Syst. Sci. 2015, 15, 1087–1101. [Google Scholar] [CrossRef] [Green Version]
- Boccardo, P.; Chiabrando, F.; Dutto, F.; Tonolo, F.G.; Lingua, A. UAV deployment exercise for mapping purposes: Evaluation of emergency response applications. Sensors 2015, 15, 15717–15737. [Google Scholar] [CrossRef] [PubMed]
- Schultjan, M. Towards the Deployment of UAVs for Fire Surveillance; Hamburg University of Technology: Hamburg, Germany, 2012. [Google Scholar]
- Lucieer, A.; Jong, S.M.d.; Turner, D. Mapping landslide displacements using Structure from Motion (SfM) and image correlation of multi-temporal UAV photography. Prog. Phys. Geogr. Earth Environ. 2014, 38, 97–116. [Google Scholar] [CrossRef]
- Turner, D.; Lucieer, A.; De Jong, S.M. Time Series Analysis of Landslide Dynamics Using an Unmanned Aerial Vehicle (UAV). Remote Sens. 2015, 7, 1736–1757. [Google Scholar] [CrossRef] [Green Version]
- Barlow, J.; Gilham, J.; Ibarra Cofrã, I. Kinematic analysis of sea cliff stability using UAV photogrammetry. Int. J. Remote Sens. 2017, 38, 2464–2479. [Google Scholar] [CrossRef]
- Sturdivant, E.J.; Lentz, E.E.; Thieler, E.R.; Farris, A.S.; Weber, K.M.; Remsen, D.P.; Miner, S.; Henderson, R.E. UAS-SfM for Coastal Research: Geomorphic Feature Extraction and Land Cover Classification from High-Resolution Elevation and Optical Imagery. Remote Sens. 2017, 9, 1020. [Google Scholar] [CrossRef]
- McBratney, A.; Pringle, M. Estimating average and proportional variograms of soil properties and their potential use in precision agriculture. Precis. Agric. 1999, 1, 125–152. [Google Scholar] [CrossRef]
- Atzberger, C. Advances in remote sensing of agriculture: Context description, existing operational monitoring systems and major information needs. Remote Sens. 2013, 5, 949–981. [Google Scholar] [CrossRef]
- Dunford, R.; Michel, K.; Gagnage, M.; Piégay, H.; Trémelo, M.-L. Potential and constraints of Unmanned Aerial Vehicle technology for the characterization of Mediterranean riparian forest. Int. J. Remote Sens. 2009, 30, 4915–4935. [Google Scholar] [CrossRef]
- Johnson, L.F. Temporal stability of an NDVI-LAI relationship in a Napa Valley vineyard. Aust. J. Grape Wine Res. 2003, 9, 96–101. [Google Scholar] [CrossRef]
- Steltzer, H.; Welker, J.M. Modeling the effect of photosynthetic vegetation properties on the NDVI–LAI relationship. Ecology 2006, 87, 2765–2772. [Google Scholar] [CrossRef]
- Wang, Q.; Adiku, S.; Tenhunen, J.; Granier, A. On the relationship of NDVI with leaf area index in a deciduous forest site. Remote Sens. Environ. 2005, 94, 244–255. [Google Scholar] [CrossRef]
- Fensholt, R.; Sandholt, I.; Rasmussen, M.S. Evaluation of MODIS LAI, fAPAR and the relation between fAPAR and NDVI in a semi-arid environment using in situ measurements. Remote Sens. Environ. 2004, 91, 490–507. [Google Scholar] [CrossRef]
- Wang, X.; Wang, M.; Wang, S.; Wu, Y. Extraction of vegetation information from visible unmanned aerial vehicle images. Trans. Chin. Soc. Agric. Eng. 2015, 31, 152–159. [Google Scholar]
- Xue, J.; Su, B. Significant remote sensing vegetation indices: A review of developments and applications. J. Sens. 2017, 2017, 1353691. [Google Scholar] [CrossRef]
- Bendig, J.; Bolten, A.; Bareth, G. UAV-based imaging for multi-temporal, very high Resolution Crop Surface Models to monitor Crop Growth VariabilityMonitoring des Pflanzenwachstums mit Hilfe multitemporaler und hoch auflösender Oberflächenmodelle von Getreidebeständen auf Basis von Bildern aus UAV-Befliegungen. Photogramm. Fernerkund. Geoinf. 2013, 2013, 551–562. [Google Scholar]
- Dong, J.; Burnham, J.G.; Boots, B.; Rains, G.; Dellaert, F. 4d crop monitoring: Spatio-temporal reconstruction for agriculture. In Proceedings of the 2017 IEEE International Conference on Robotics and Automation (ICRA), Singapore, Singapore, 29 May–3 June 2017; pp. 3878–3885. [Google Scholar]
- UN DESA. World Urbanization Prospects: The 2014 Revision. 2015. Available online: https://esa.un.org/unpd/wup/Publications/Files/WUP2014-Report.pdf (accessed on 17 June 2019).
- Branco, L.H.C.; Segantine, P.C.L. MaNIAC-UAV-a methodology for automatic pavement defects detection using images obtained by Unmanned Aerial Vehicles. In Journal of Physics: Conference Series; IOP Publishing: Bristol, UK, 2015; p. 012122. [Google Scholar]
- Knyaz, V.; Chibunichev, A. Photogrammetric techniques for road surface analysis. ISPRS-Int. Arch. Photogramm. Remote Sens. Spat. Inf. Sci. 2016, 41, 515–520. [Google Scholar] [CrossRef]
- Phung, M.; Dinh, T.; Hoang, V.; Ha, Q. Automatic Crack Detection in Built Infrastructure Using Unmanned Aerial Vehicles. In Proceedings of the 2017 International Symposium on Automation and Robotics in Construction (ISARC), Taipei, Taiwan, 28 June–1 July 2017; pp. 823–829. [Google Scholar]
- Nishar, A.; Richards, S.; Breen, D.; Robertson, J.; Breen, B. Thermal infrared imaging of geothermal environments and by an unmanned aerial vehicle (UAV): A case study of the Wairakei–Tauhara geothermal field, Taupo, New Zealand. Renew. Energy 2016, 86, 1256–1264. [Google Scholar] [CrossRef]
- Saari, H.; Aallos, V.-V.; Akujärvi, A.; Antila, T.; Holmlund, C.; Kantojärvi, U.; Mäkynen, J.; Ollila, J. Novel miniaturized hyperspectral sensor for UAV and space applications. In Sensors, Systems, and Next-Generation Satellites XIII; SPIE: Bellingham, WA, USA, 2018; p. 74741M. [Google Scholar]
- Herold, M.; Roberts, D.; Smadi, O.; Noronha, V. Road condition mapping with hyperspectral remote sensing. In Proceedings of the 2004 AVIRIS Workshop, Pasadena, CA, USA, 31 March–2 April 2004. [Google Scholar]
- Joyce, K.E.; Belliss, S.E.; Samsonov, S.V.; McNeill, S.J.; Glassey, P.J. A review of the status of satellite remote sensing and image processing techniques for mapping natural hazards and disasters. Prog. Phys. Geogr. 2009, 33, 183–207. [Google Scholar] [CrossRef] [Green Version]
- Dong, L.; Shan, J. A comprehensive review of earthquake-induced building damage detection with remote sensing techniques. ISPRS J. Photogramm. Remote Sens. 2013, 84, 85–99. [Google Scholar] [CrossRef]
- Xu, Z.; Yang, J.; Peng, C.; Wu, Y.; Jiang, X.; Li, R.; Zheng, Y.; Gao, Y.; Liu, S.; Tian, B. Development of an UAS for post-earthquake disaster surveying and its application in Ms7. 0 Lushan Earthquake, Sichuan, China. Comput. Geosci. 2014, 68, 22–30. [Google Scholar] [CrossRef]
- Vetrivel, A.; Gerke, M.; Kerle, N.; Nex, F.; Vosselman, G. Disaster damage detection through synergistic use of deep learning and 3D point cloud features derived from very high resolution oblique aerial images, and multiple-kernel-learning. ISPRS J. Photogramm. Remote Sens. 2018, 140, 45–59. [Google Scholar] [CrossRef]
- Li, S.; Tang, H.; He, S.; Shu, Y.; Mao, T.; Li, J.; Xu, Z. Unsupervised detection of earthquake-triggered roof-holes from UAV images using joint color and shape features. IEEE Geosci. Remote Sens. Lett. 2015, 12, 1823–1827. [Google Scholar]
- Leprince, S.; Ayoub, F.; Klinger, Y.; Avouac, J. Co-Registration of Optically Sensed Images and Correlation (COSI-Corr): An operational methodology for ground deformation measurements. In Proceedings of the 2007 IEEE International Geoscience and Remote Sensing Symposium, Barcelona, Spain, 23–28 July 2007; pp. 1943–1946. [Google Scholar]
- Kotsis, I.; Kontoes, C.; Paradissis, D.; Karamitsos, S.; Elias, P.; Papoutsis, I. A Methodology to Validate the InSAR Derived Displacement Field of the September 7(th), 1999 Athens Earthquake Using Terrestrial Surveying. Improvement of the Assessed Deformation Field by Interferometric Stacking. Sensors (Basel) 2008, 8, 4119–4134. [Google Scholar] [CrossRef]

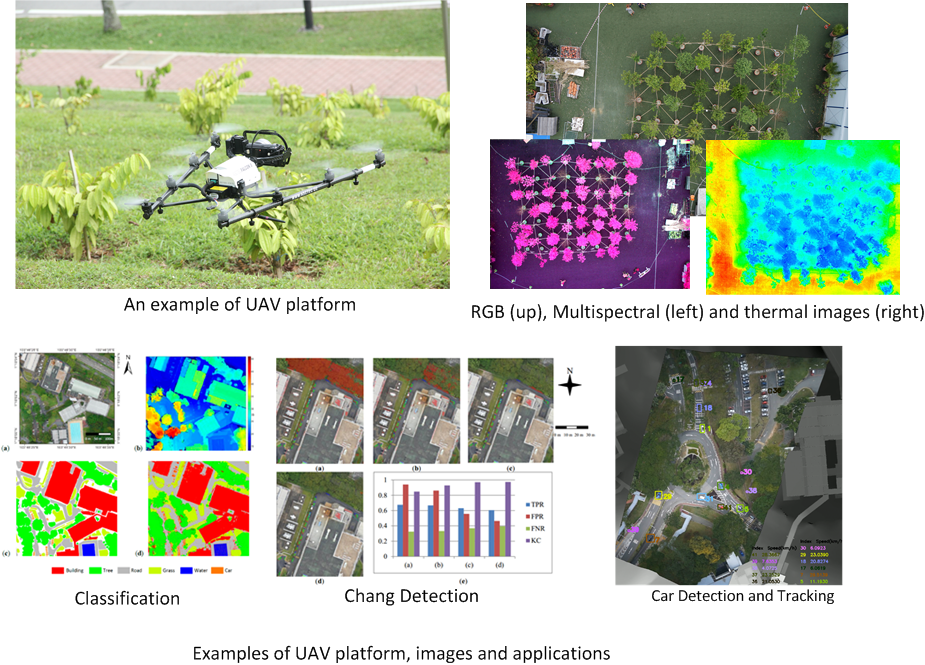
Table 1.
Overview of unmanned aerial vehicle (UAV) sensors and examples of these sensors.
| Common and/or Example Camera and Its Spectral Range, Resolution, and Payload | Applications | Benefits and Obstacles in Practical Applications | |||||
|---|---|---|---|---|---|---|---|
| RGB cameras | Sony A9 | ~400–700 nm | 24.2 MP | 588 g | Visual analysis, mapping, land cover/land use, classification, pedestrians and vehicles detection and tracking, etc. | Advantages: (1) high availability in products ranging across different levels of cost, resolution, and weight; (2) easy to be integrated in different platforms (3) well-modeled camera geometry with a large number of software solutions; and (4) videos. Disadvantages: (1) Often come without radiometric/geometric calibration; and (2) lack of spectral information for many tasks. | |
| Canon EOS 5D mark IV | ~400–700 nm | 30.4 MP | ~800 g | ||||
| Nikon D850 | ~400–700 nm | 45.7 MP | 915 g | ||||
| Light-weight multispectral cameras | Sentera Quad Multispectral Sensor | ~400–700 nm | 1.2 MP | 170 g | Visual analysis, vegetation detection and analysis, crop monitoring, mining, soil moisture estimation, fires detection, water level measurement, land cover/land use mapping, etc. | Advantages: (1) wider spectrum range and narrower bandwidth; (2) often come with means of radiometric calibration; (3) most of the sensors still follow a perspective model that can be well-processed for geometric reconstruction; and (4) allow for sub-decimeter multispectral mapping. Disadvantages: (1) data format compatibility (sometimes 12 or 16-bit) for software packages; (2) as a component of a UAV system, its cost remains to be relatively high; (3) sensor compatibility to drones may be limited; and (4) videos may not be available. | |
| ~655 nm | |||||||
| ~725 nm | |||||||
| ~800 nm | |||||||
| Quest Condor5-UAV | 400–1000 nm | 2048 × 1088 (2.2 MP) | ~1450–1950 g | ||||
| Phaseone iXU/iXU-RS 1000 Aerial Cameras | ~400–700 nm | 100 MP | 1430–1700 g | ||||
| Hyperspectral sensors | Rikola Hyperspectral Camera | 500–900 nm | 1.05 MP | <600 g | Land cover/land use mapping, vegetation indices estimation, biophysical, physiological, or biochemical parameters estimation, agriculture and vegetation disease detection, disaster damage assessment, etc. | Advantages: abundant spectral information, 10 nm-level bandwidth for more advanced applications in material identification and so on. Disadvantages: (1) high cost; (2) most of them are linear-array and require specialized software, and the users may take care of the data format and geometric corrections; (3) dimension reduction is needed for typical classification tasks; (4) sensor compatibility to drones may be limited; and (5) videos may not be available. | |
| Resonon Pika NIR-640 | 900–1700 nm | 640 pixels | 2700 g | ||||
| High-Efficiency Hyperspec SWIR | 1000–2500 nm | 384 pixels | 4400 g | ||||
| Light-weight thermal infrared sensors | FLIR Vue Pro | 7.5–13.5 µm | 640 × 512 pixels | 72 g | Tracking creatures, volcanos detection, forest fire detection, hydrothermal studies, urban heat island measurement, etc. | Advantages: (1) well-targeted sensor for surface temperature measurement that drives a lot of new applications; (2) the camera model is normally perspective, and relatively easy to be processed than linear-array cameras. Disadvantages: (1) lack of texture information of its imageries brings difficulties in 3D reconstruction tasks; (2) for direct temperature measurement, it needs careful calibration; (3) cost is relatively high comparing to that of RGB cameras; (4) comparatively lower resolution than that of RGB cameras due to sensor design; (5) sensor compatibility to drones may be limited. | |
| Workswell WIRIS 640 | 7.5–13.5 μm | 640 × 512 pixels | <390 g | ||||
| YUNEEC CGOET thermal imaging camera and low-light camera | 8–14 μm | 2.1 MP | 278 g | ||||
| UAV LiDAR | RIEGL VUX-240 | Near -infrared | Up to 1,500,000 per second | ≤3800 g | Vegetation canopy analysis, estimation of forest carbon absorption, mapping cultural heritage, building information modeling, etc. | Advantages: (1) direct geometric measurement; (2) multiple returns of the signals are useful for terrain modeling under thin canopies. Disadvantages: (1) high equipment cost; (2) highly dependent on expensive onboard GPS/IMU measurement (potentially with external reference stations); (3) increased payload for surveying quality LiDAR; (4) may not work in GPS-denied regions. | |
| Velodyne Puck LITE | 903 nm | Up to ~600,000 per second | ~590 g | ||||
| Livox Mid-40 | 905 nm | 100,000 per second | 760 g | ||||
Table 2.
Algorithmic considerations for data acquired using different remote sensing platforms.
| LULC Mapping | Change Detection | ||
| Low-to-moderate-resolution satellite RS data |
|
| |
| High-to-very high-resolution satellite or airborne data |
|
| |
| Ultra-high-resolution UAV-borne data |
|
| |
Table 3.
An Overview of the selected UAVs remote sensing applications.
| Selected Applications | Highlights | |
|---|---|---|
| Precision agriculture and vegetation | Soil property estimation [135]; crop/vegetation management [136,137]; forest structure assessment [138]. |
|
| Urban environment and management | Traffic control [139]; urban infrastructure management [140]; building observation [141]; urban environment mapping [142]. |
|
| Disaster hazard and rescue | Post-disaster assessment [143,144]; emergency responses [145]; fire surveillance [146]; landslide dynamic monitoring [147,148]; coastal vulnerability assessment [149,150] |
|
© 2019 by the authors. Licensee MDPI, Basel, Switzerland. This article is an open access article distributed under the terms and conditions of the Creative Commons Attribution (CC BY) license (http://creativecommons.org/licenses/by/4.0/).
Share and Cite
MDPI and ACS Style
Yao, H.; Qin, R.; Chen, X. Unmanned Aerial Vehicle for Remote Sensing Applications—A Review. Remote Sens. 2019, 11, 1443. https://0-doi-org.brum.beds.ac.uk/10.3390/rs11121443
AMA Style
Yao H, Qin R, Chen X. Unmanned Aerial Vehicle for Remote Sensing Applications—A Review. Remote Sensing. 2019; 11(12):1443. https://0-doi-org.brum.beds.ac.uk/10.3390/rs11121443
Chicago/Turabian StyleYao, Huang, Rongjun Qin, and Xiaoyu Chen. 2019. "Unmanned Aerial Vehicle for Remote Sensing Applications—A Review" Remote Sensing 11, no. 12: 1443. https://0-doi-org.brum.beds.ac.uk/10.3390/rs11121443
Note that from the first issue of 2016, this journal uses article numbers instead of page numbers. See further details here.